USA Truck — Conference Presentation (November 2010)
17 slides from USA Truck's conference presentation, Nov 16, 2010

Slide 1: USA Truck
USA TRUCK

Slide 2: Forward-Looking Statements
Every Load, Every Time…. Forward-Looking Statements Forward-Looking Statements This information and the statements made at this conference presentation may contain forward-looking statements within the meaning of Section 27A of the Securities Act of 1933, as amended and Section 21E of the Securities

Slide 3: Operating Leverage
Operating Leverage Operating Leverage Revenue per Mile $0.01 Operating Margin 70 bps Annualized EPS $0.15 = = We have a plan to improve our Revenue per Mile by $0.20
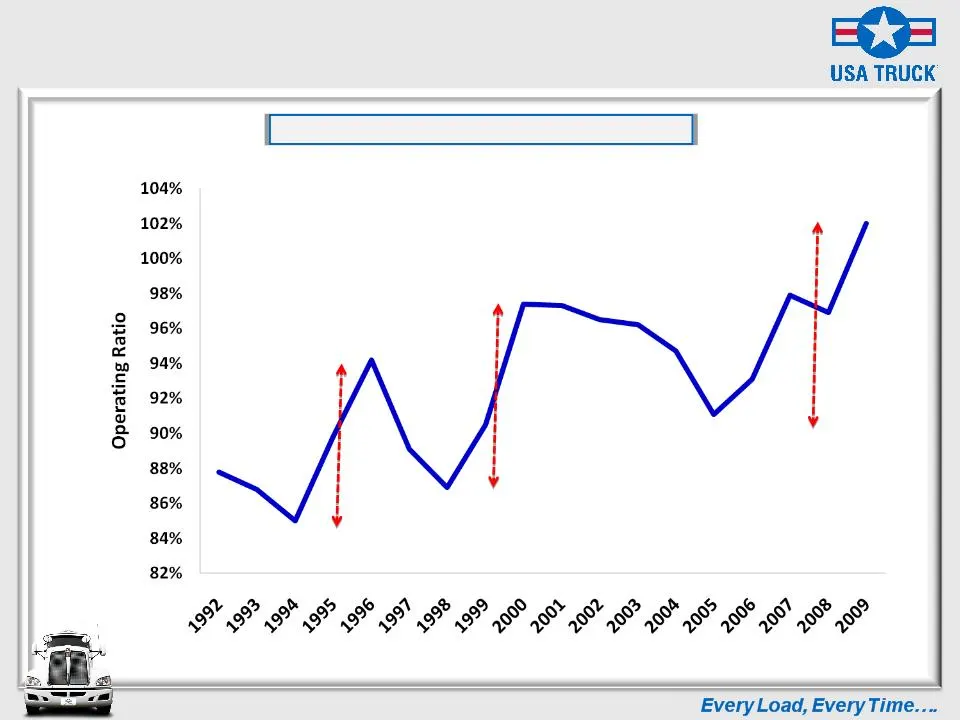
Slide 4: Deteriorating Performance
Deteriorating Performance Deteriorating Performance 920 bps 1,050 bps 1,090 bps Shallower Peaks and Deeper Troughs
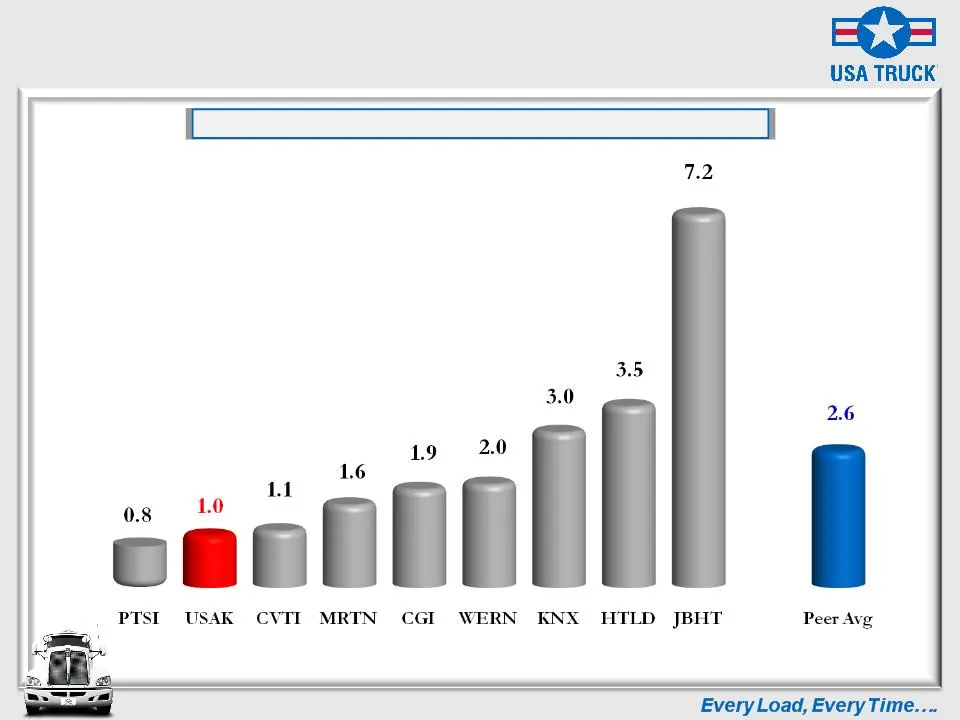
Slide 5: Discounted Valuation
Discounted Valuation Discounted Valuation Truckload Peer Price-to-Book Ratios As of August 30, 2010
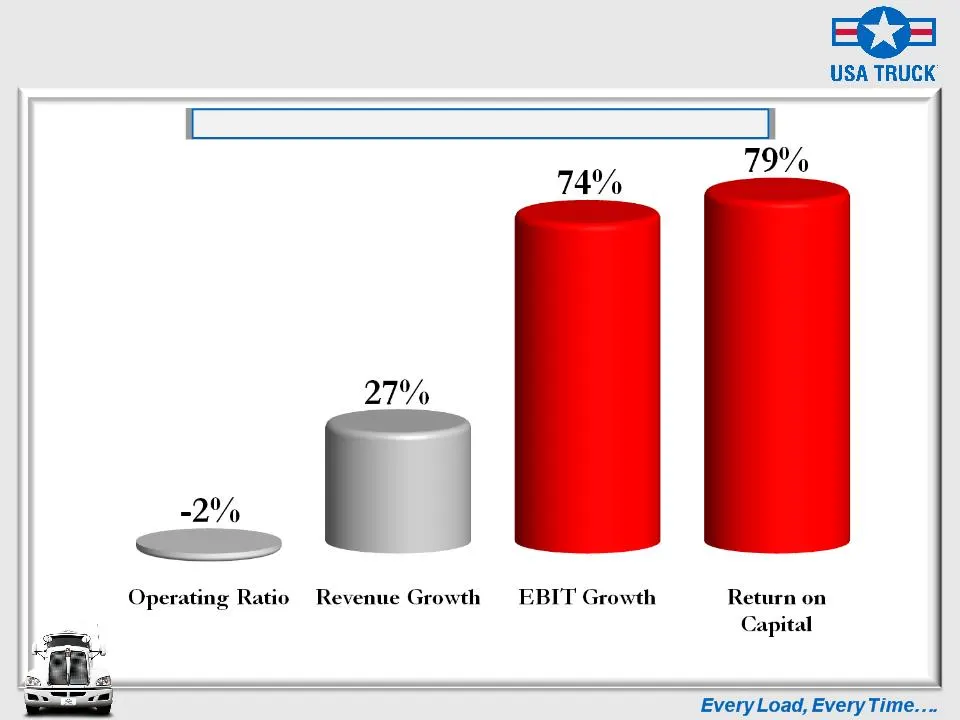
Slide 6: Value-Creation Research
Value-Creation Research Value-Creation Research Financial Performance Correlations to Stock Price Source: Stephens, Inc., USA Truck, Inc. and SEC documents
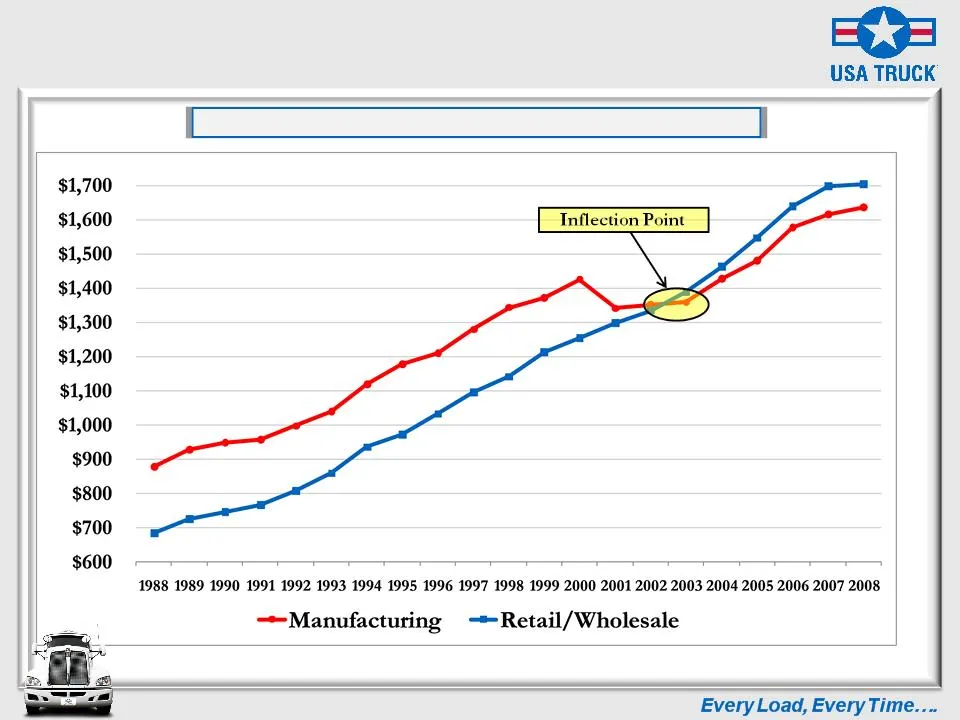
Slide 7: Industry and Market Research
Industry and Market Research Industry and Market Research Structural Shift Underway in U.S. Supply Chain
Slide 8: Objectives: VEVA Strategic Plan
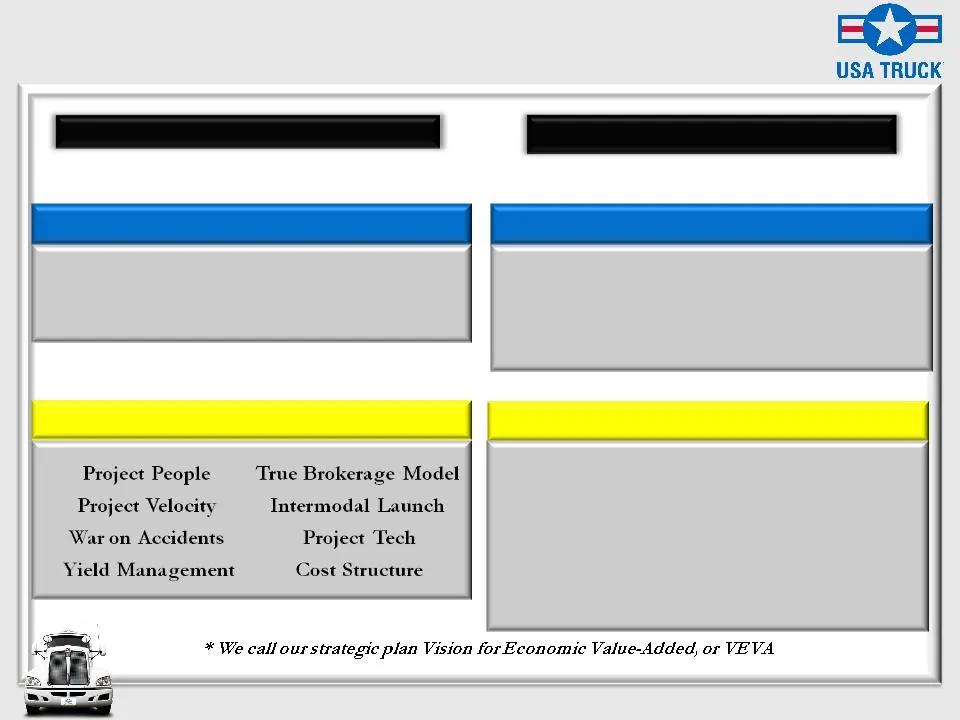
OBJECTIVES OBJECTIVES PHASE I - Earn Cost of Capital PHASE II - Earnings Growth Earn Cost of Capital Greater Earnings Consistency Position Model for Future Growth EBIT Growth CAGR >= 10% Maintain Economic Value Added OR Return Excess Capital to Shareholders HOW WE’LL DO IT HOW WE’LL DO IT Grow Inter
Slide 9: Opportunity in Pricing
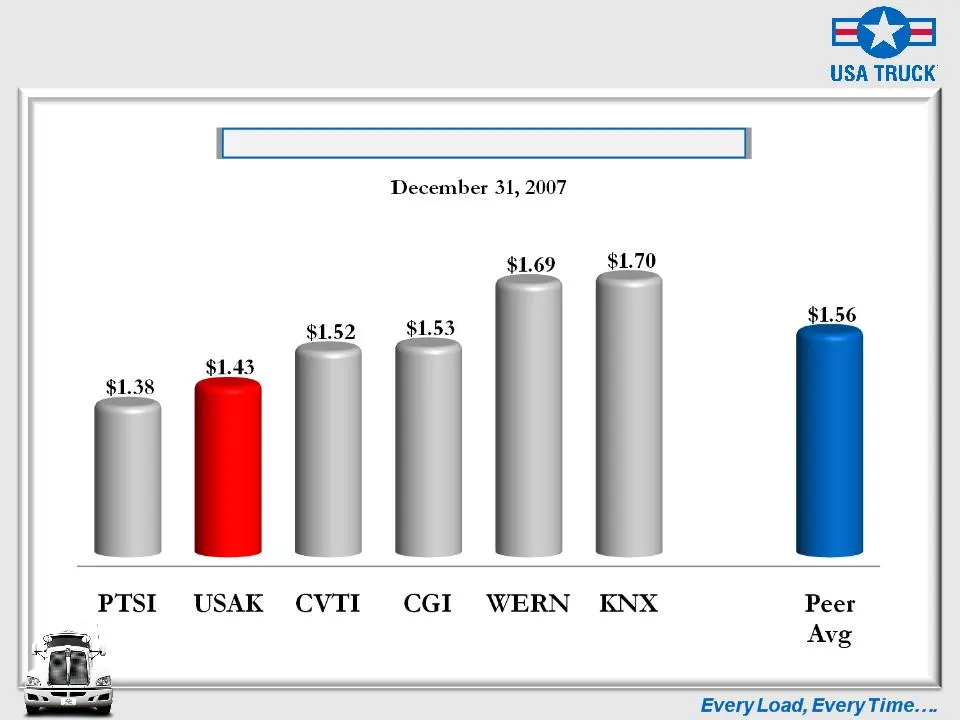
Opportunity in Pricing Opportunity in Pricing Revenue per Loaded Mile Comparison
Slide 10: Engineering a Freight Network
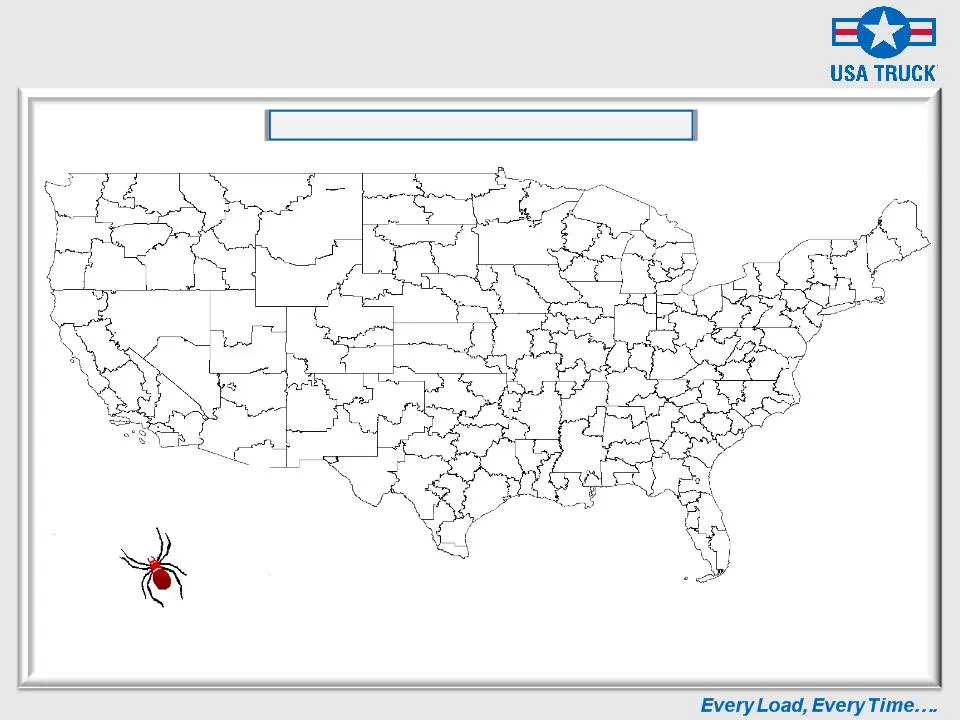
Engineering a Freight Network Engineering a Freight Network The Spider Web is Born
Slide 11: Measurable Progress: A Giant Leap Forward
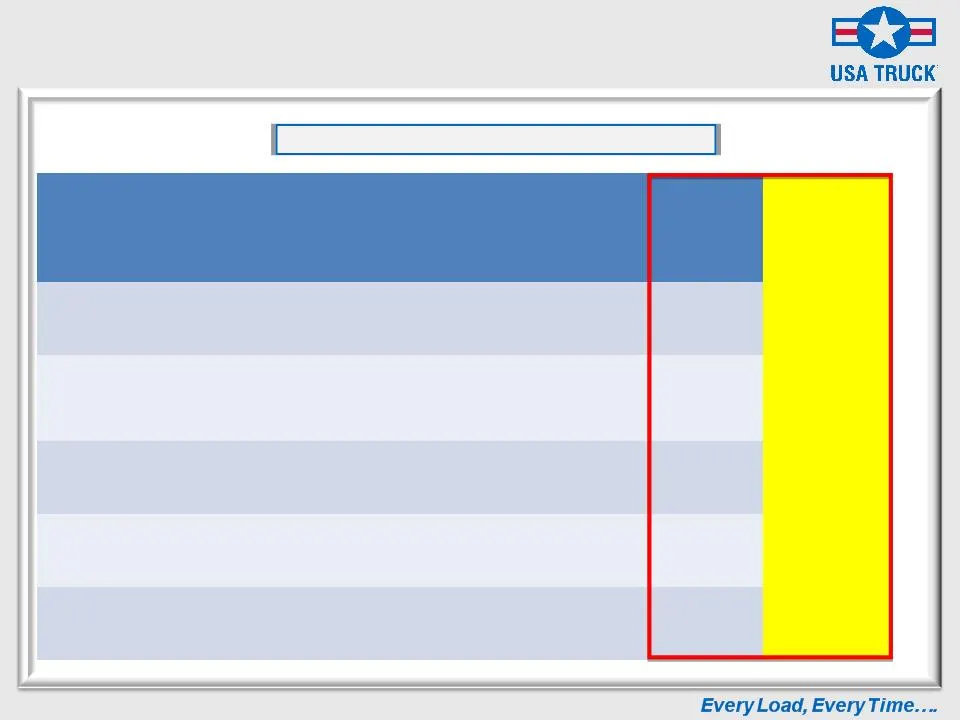
Metric SW Design FYE 2007 3q 2009 3q 2010 Loaded Revenue per Mile $1.70 $1.43 $1.46 $1.58 Portion of Lanes with < 5 Weekly Loads 17% 90% 85% 83% Compliance > 80% < 30% 39% 48% Length of Haul < 500 784 577 546 Velocity > 4.0 2.5 3.0 3.3 Measurable Progress Measurable Progress A Giant Leap Forward
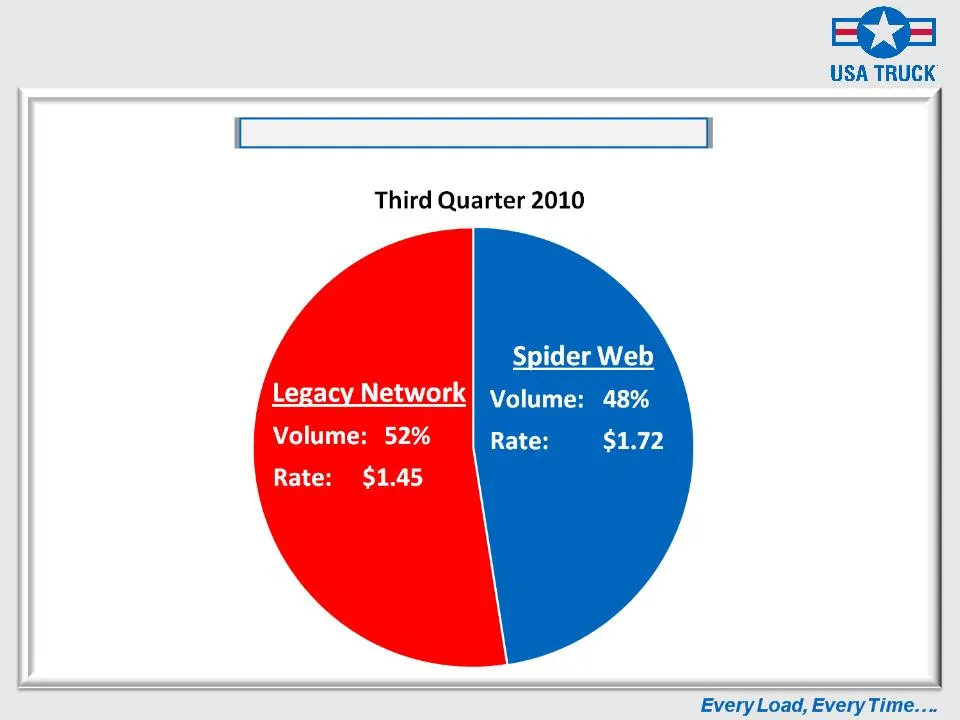
Slide 12: Inside the Numbers
Inside the Numbers Inside the Numbers Spider Web Lanes Really Do Pay More!
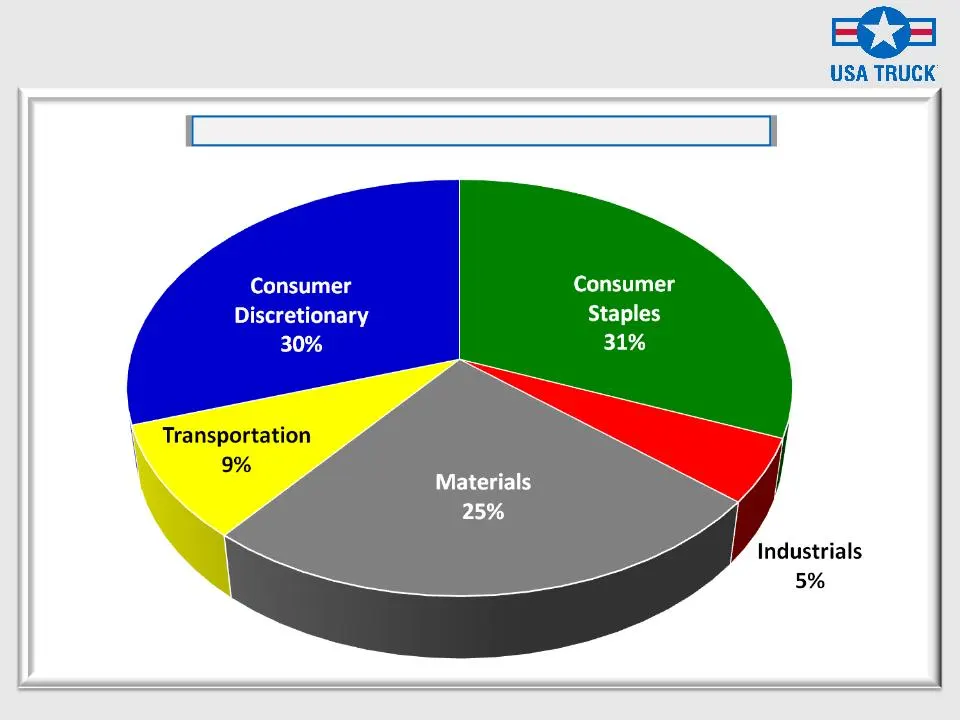
Slide 13: High Exposure to Cyclical Sectors: The Next Step
High Exposure to Cyclical Sectors The Next Step The Next Step Every Load, Every Time….
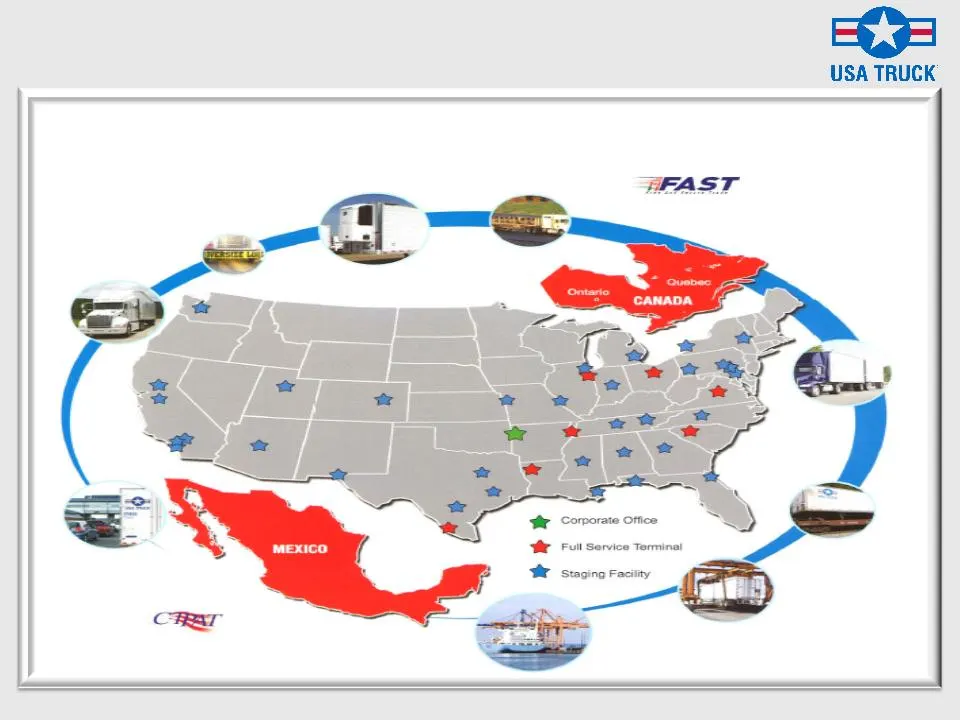
Slide 14: A Growing "Big Boy" Model
A Growing “Big Boy” Model A Growing “Big Boy” Model Every Load, Every Time….
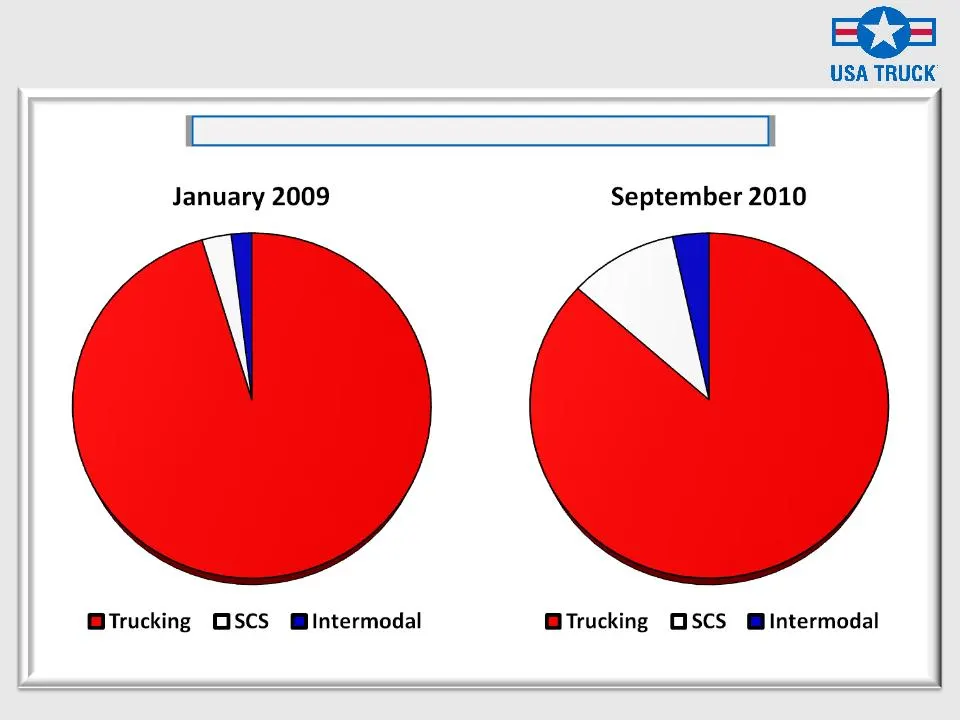
Slide 15: Service Offerings as a % of Total Revenue
Service Offerings as a % of Total Revenue Flexible Capacity Growing Flexible Capacity Growing Every Load, Every Time….
Slide 16: Why Invest In USA Truck?
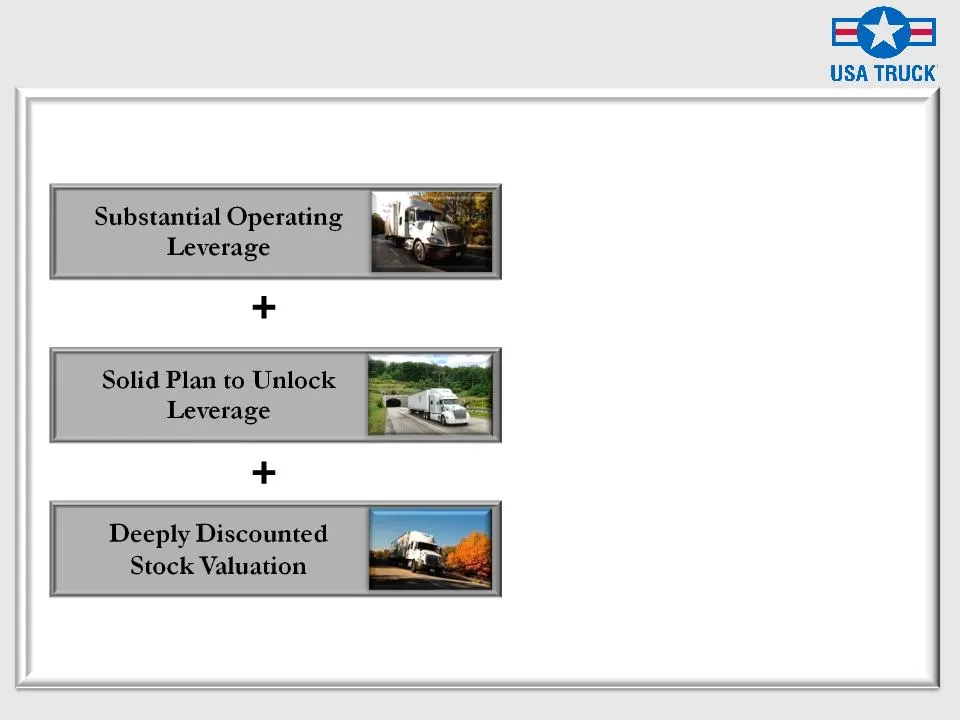
Why Invest In USA Truck? Every Load, Every Time…. Revenue per Mile $0.01 Operating Margin 70 bps Annualized EPS $0.15 = =

Slide 17: USA Truck
USA TRUCK
Source: SEC EDGAR · 8-K filed Nov 16, 2010
More decks from USA Truck Inc
 Investor Presentation (June 2014)26 slides · Jun 9, 2014
 Q4 2013 Earnings Presentation16 slides · Feb 11, 2014
 Investor Presentation (October 2013)34 slides · Oct 17, 2013
 Q3 2013 Earnings Presentation12 slides · Oct 17, 2013
 Conference Presentation (August 2011)17 slides · Aug 24, 2011
 Conference Presentation (June 2011)17 slides · Jun 14, 2011