AltaGas Ltd. · TSX:ALA
AltaGas — Q1 2022 Earnings Presentation
16 slides from AltaGas's earnings presentation, Apr 28, 2022
Slide 1: Q1/22 Earnings Summary
Q1/22 Earnings Summary April 28, 2022
Slide 2: Forward-Looking Information
Forward-Looking Information FORWARD-LOOKING INFORMATION This presentation contains forward-looking information (forward-looking statements). Words such as "may", "can", "would", "could", "should", "will", "intend", "plan", "anticipate", "believe", "aim", "seek", "propose", "contemplate", "estimate",
Slide 3: Key Highlights
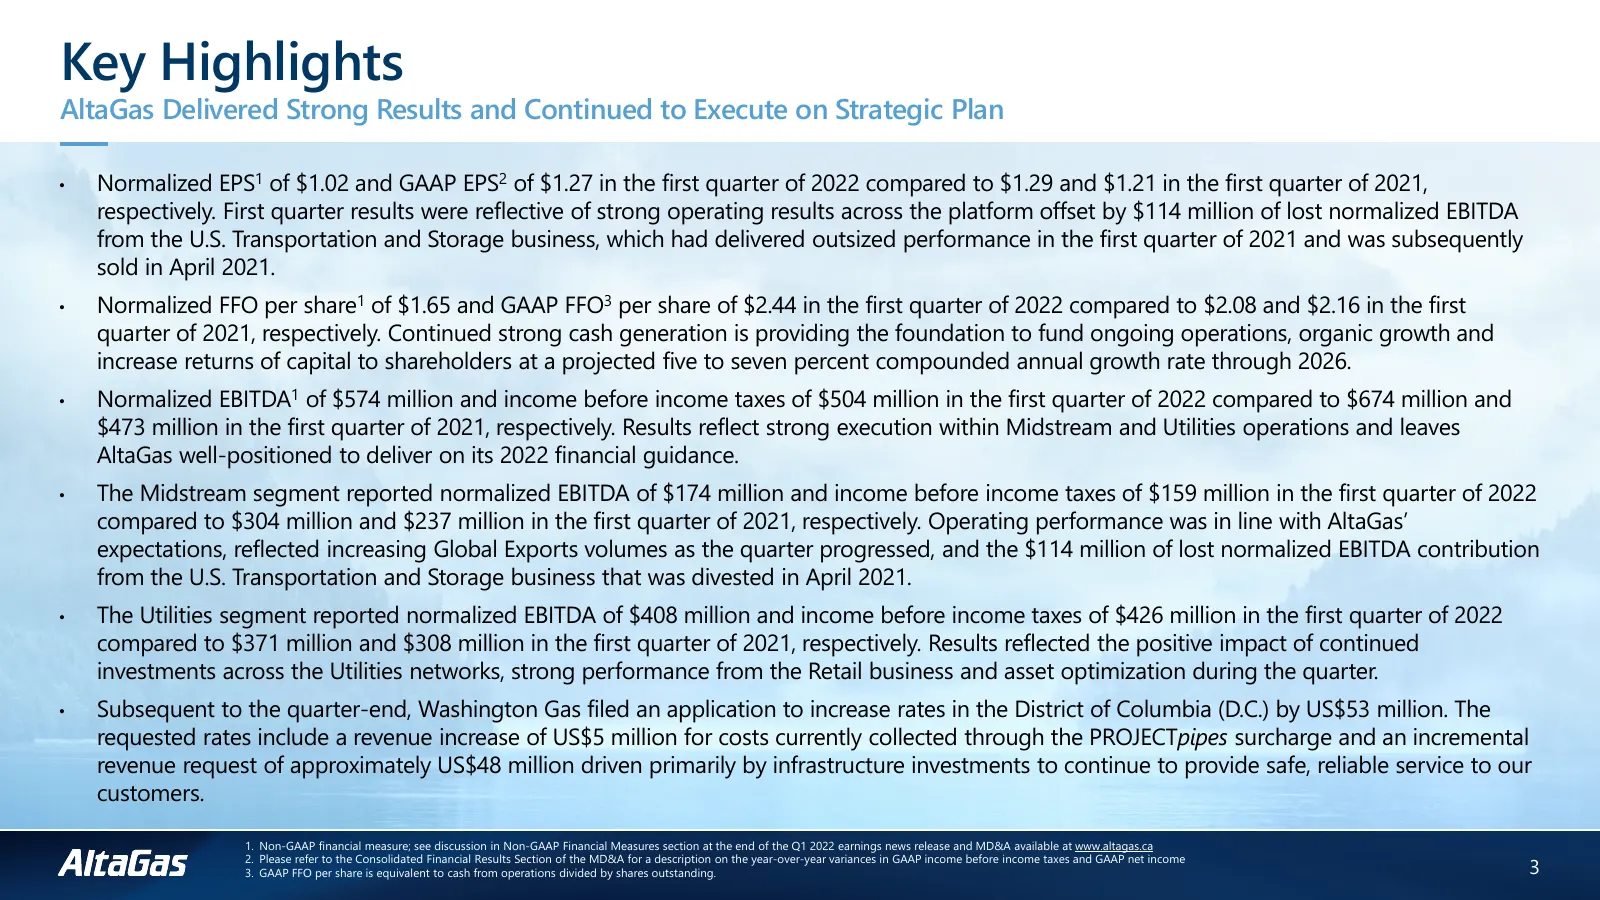
Key Highlights AltaGas Delivered Strong Results and Continued to Execute on Strategic Plan • Normalized EPS1 of $1.02 and GAAP EPS2 of $1.27 in the first quarter of 2022 compared to $1.29 and $1.21 in the first quarter of 2021, respectively. First quarter results were reflective of strong operating
Slide 4: Q1 2022 Financial Results Summary
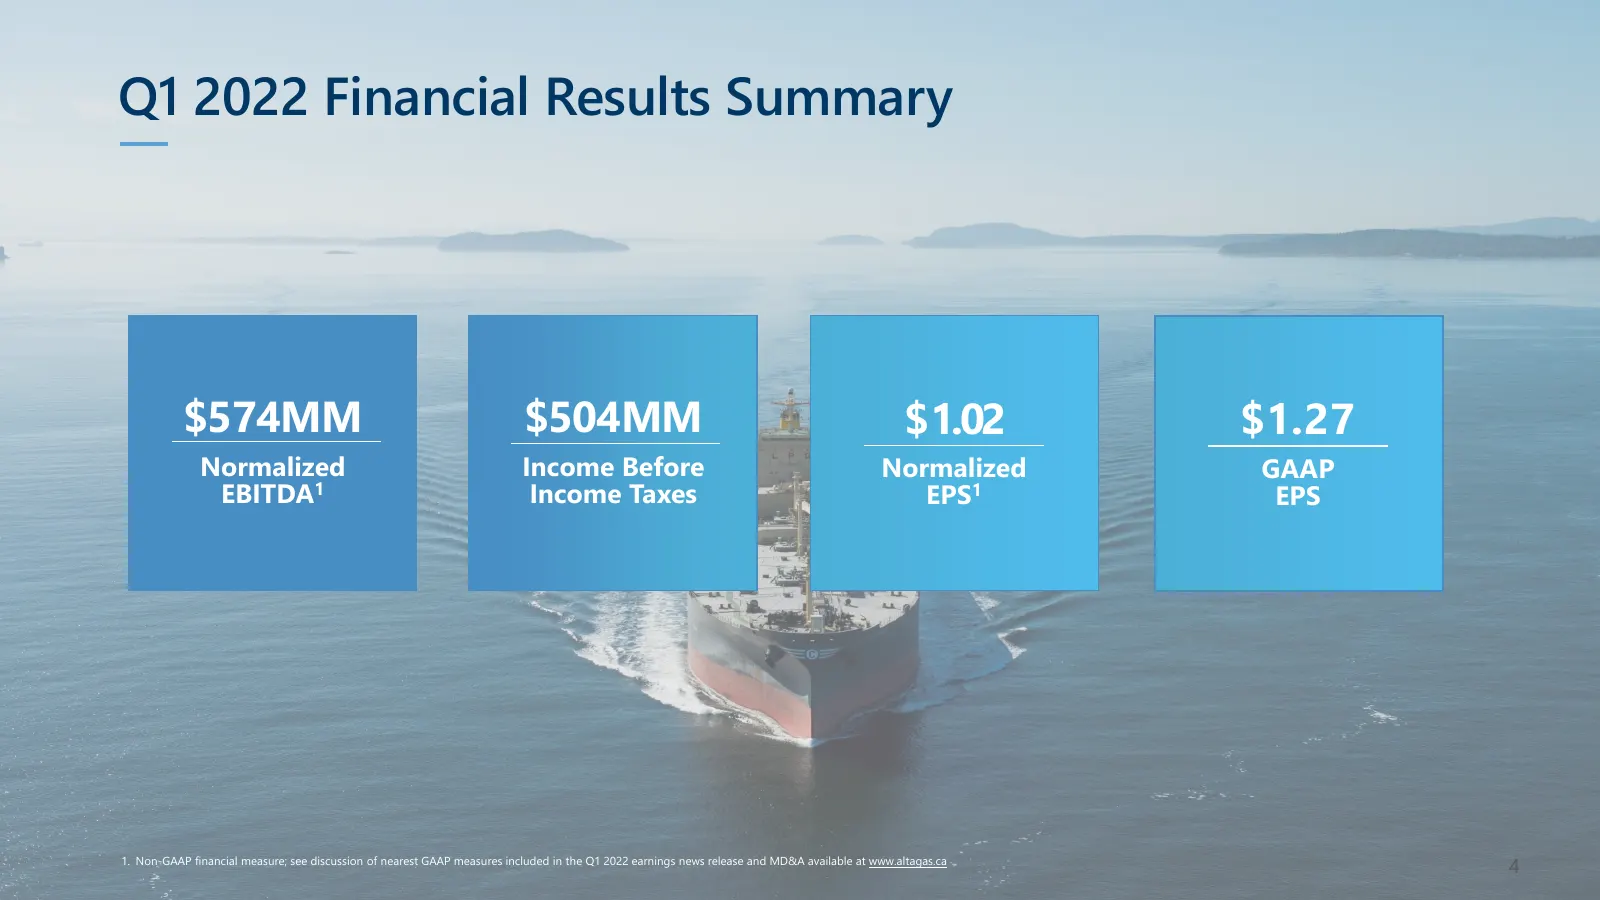
Q1 2022 Financial Results Summary $574MM $504MM $1.02 $1.27 Normalized Income Before Normalized GAAP EBITDA1 Income Taxes EPS1 EPS 1. Non-GAAP financial measure; see discussion of nearest GAAP measures included in the Q1 2022 earnings news release and MD&A available at www.altagas.ca 4
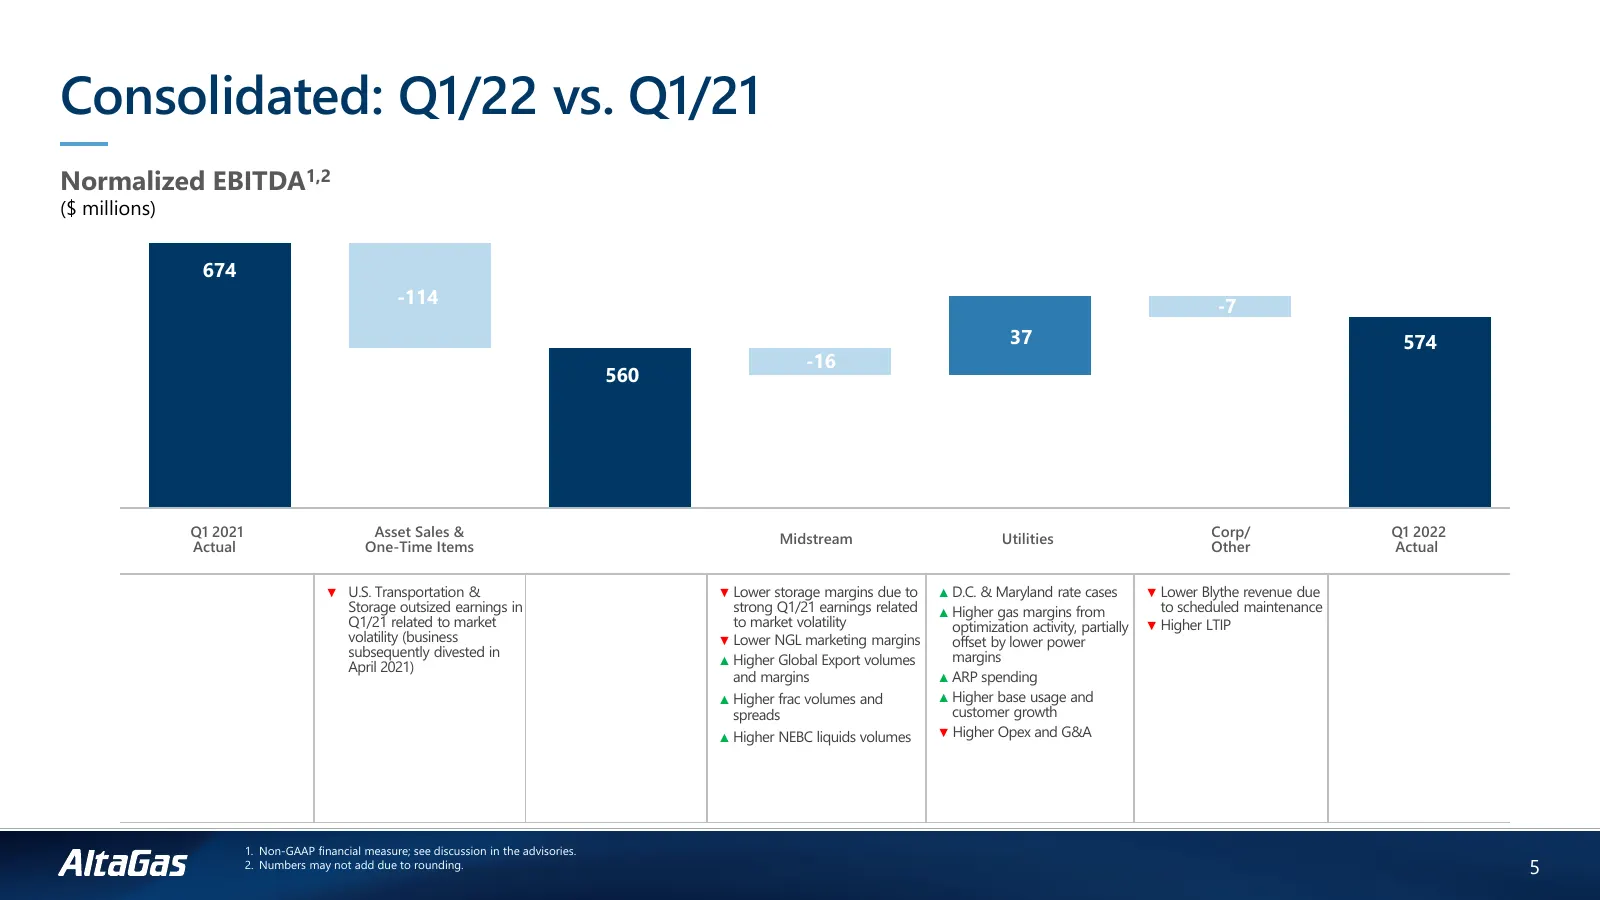
Slide 5: Consolidated: Q1/22 vs. Q1/21 Normalized EBITDA
Consolidated: Q1/22 vs. Q1/21 Normalized EBITDA1,2 ($ millions) 674 -114 -7 37 574 -16 564 560 Q1 2021 Asset Sales & Corp/ Q1 2022 Midstream Utilities Actual One-Time Items Other Actual ▼ U.S. Transportation & ▼ Lower storage margins due to ▲ D.C. & Maryland rate cases ▼ Lower Blythe revenue due Sto
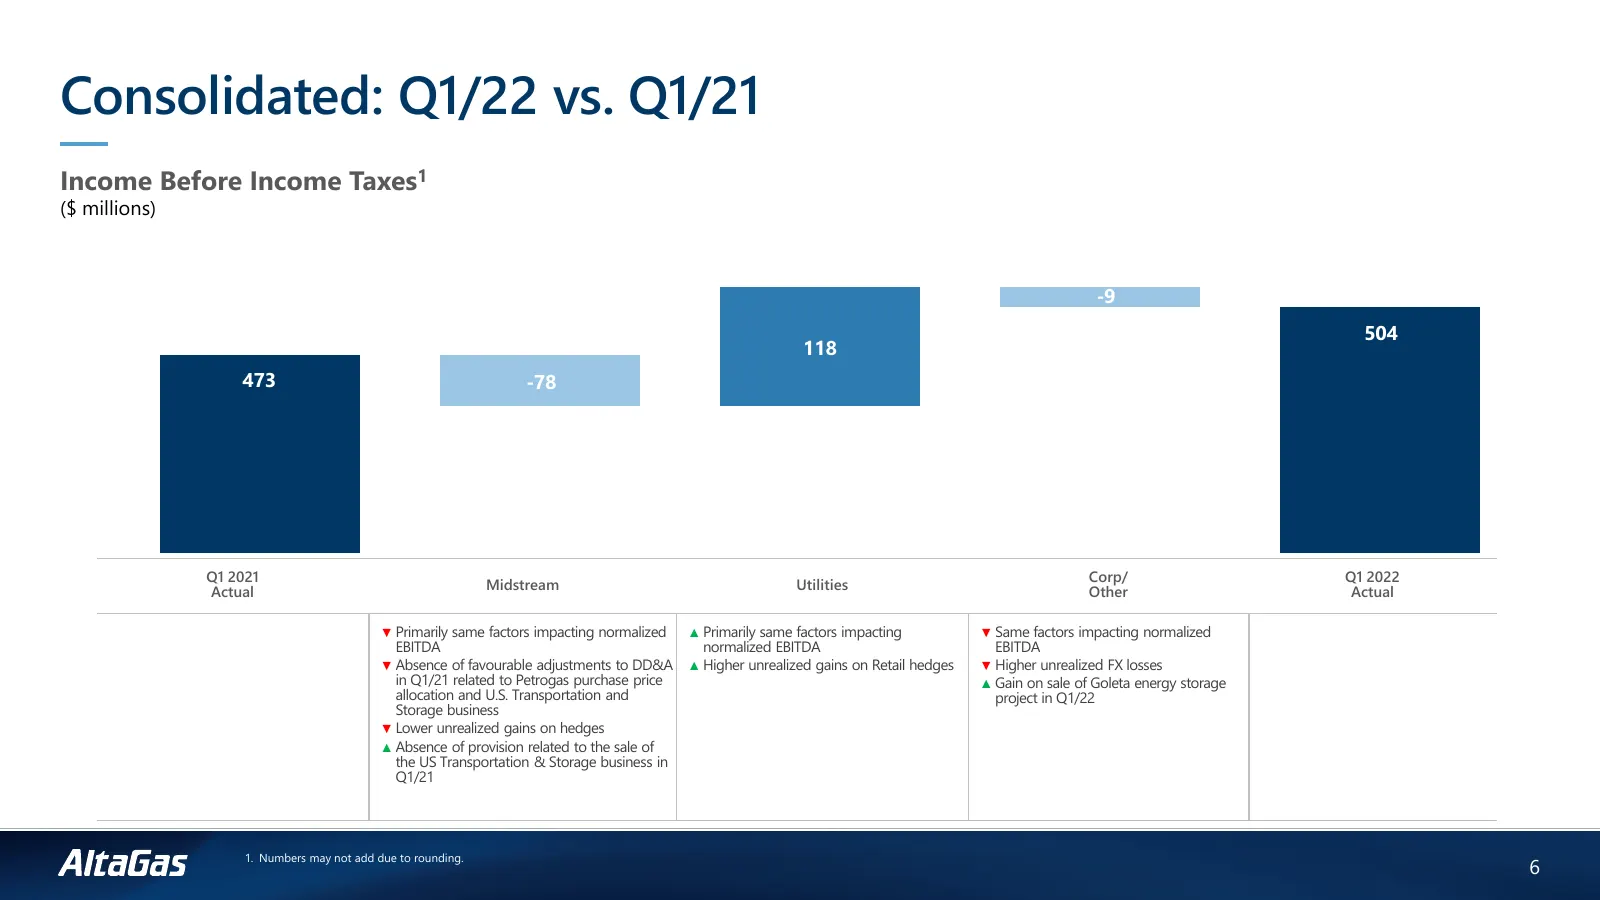
Slide 6: Consolidated: Q1/22 vs. Q1/21 Income Before Income Taxes
Consolidated: Q1/22 vs. Q1/21 Income Before Income Taxes1 ($ millions) -9 504 118 473 -78 Q1 2021 Corp/ Q1 2022 Midstream Utilities Actual Other Actual ▼ Primarily same factors impacting normalized ▲ Primarily same factors impacting ▼ Same factors impacting normalized EBITDA normalized EBITDA EBITDA
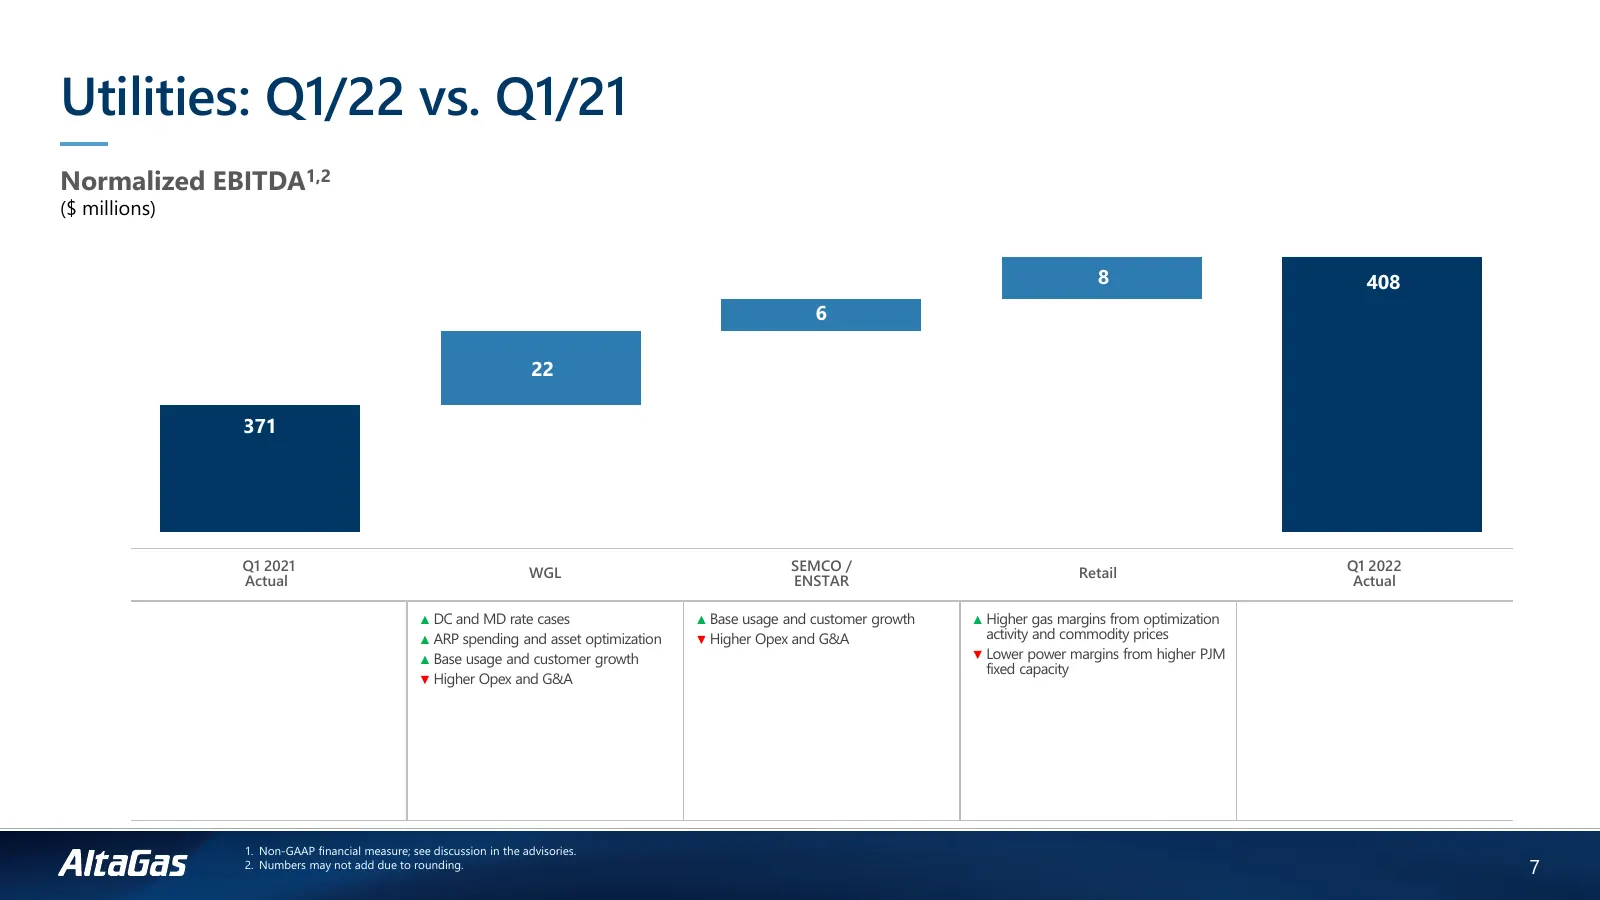
Slide 7: Utilities: Q1/22 vs. Q1/21 Normalized EBITDA
Utilities: Q1/22 vs. Q1/21 Normalized EBITDA1,2 ($ millions) 22 8 408 6 6 22 371 Q1 2021 SEMCO / Q1 2022 WGL Retail Actual ENSTAR Actual ▲ DC and MD rate cases ▲ Base usage and customer growth ▲ Higher gas margins from optimization ▲ ARP spending and asset optimization ▼ Higher Opex and G&A activity
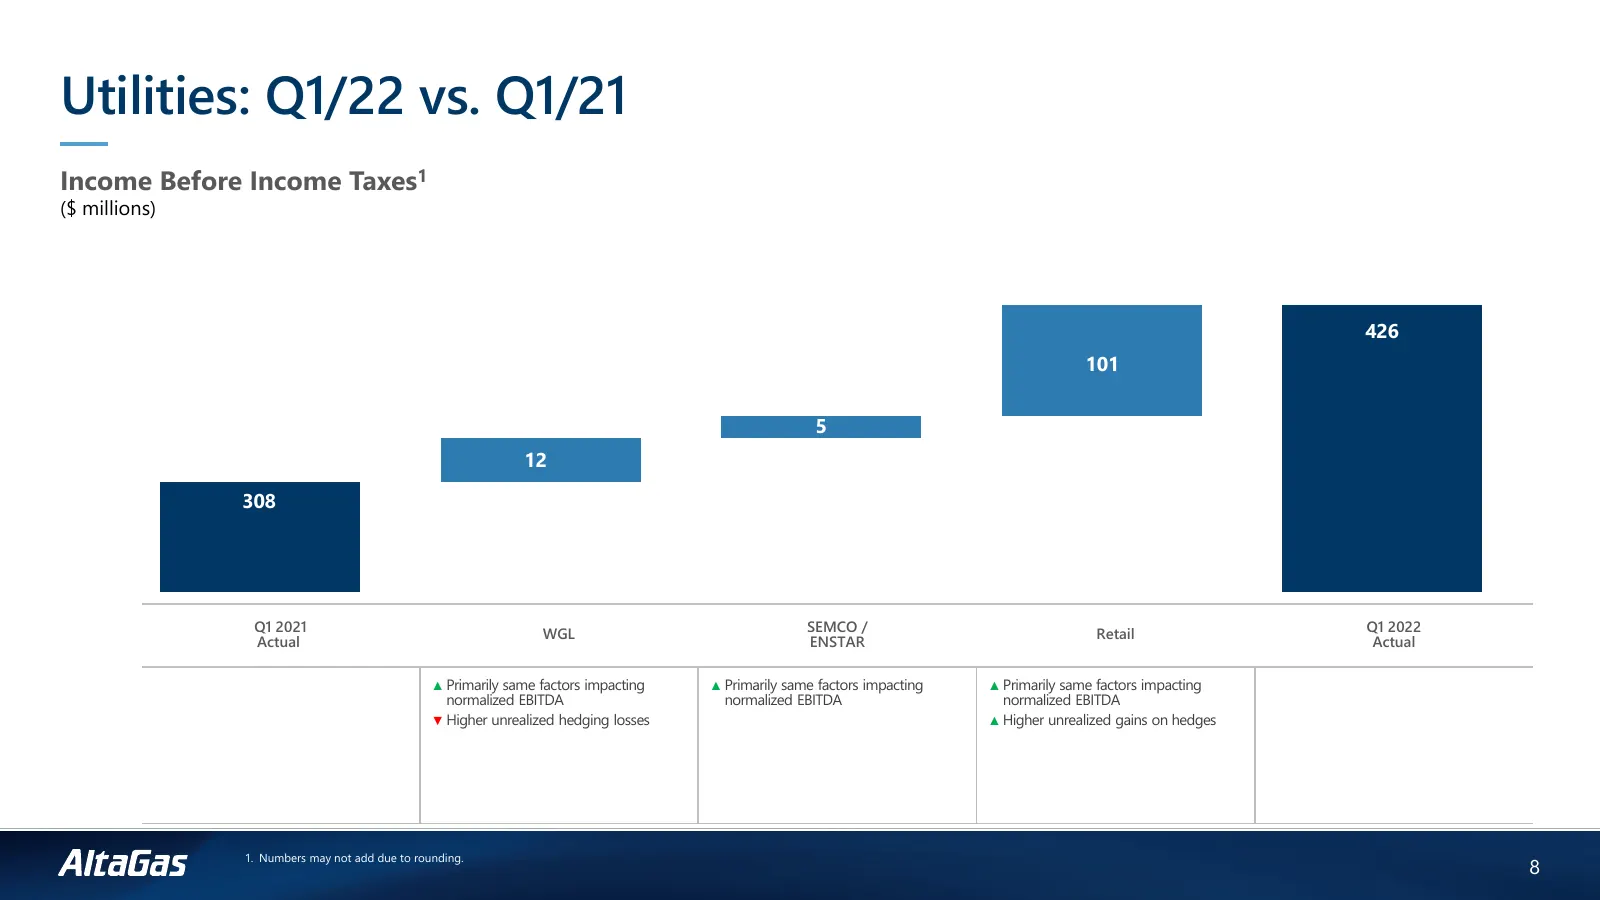
Slide 8: Utilities: Q1/22 vs. Q1/21 Income Before Income Taxes
Utilities: Q1/22 vs. Q1/21 Income Before Income Taxes1 ($ millions) 426 101 5 12 308 Q1 2021 SEMCO / Q1 2022 WGL Retail Actual ENSTAR Actual ▲ Primarily same factors impacting ▲ Primarily same factors impacting ▲ Primarily same factors impacting normalized EBITDA normalized EBITDA normalized EBITDA
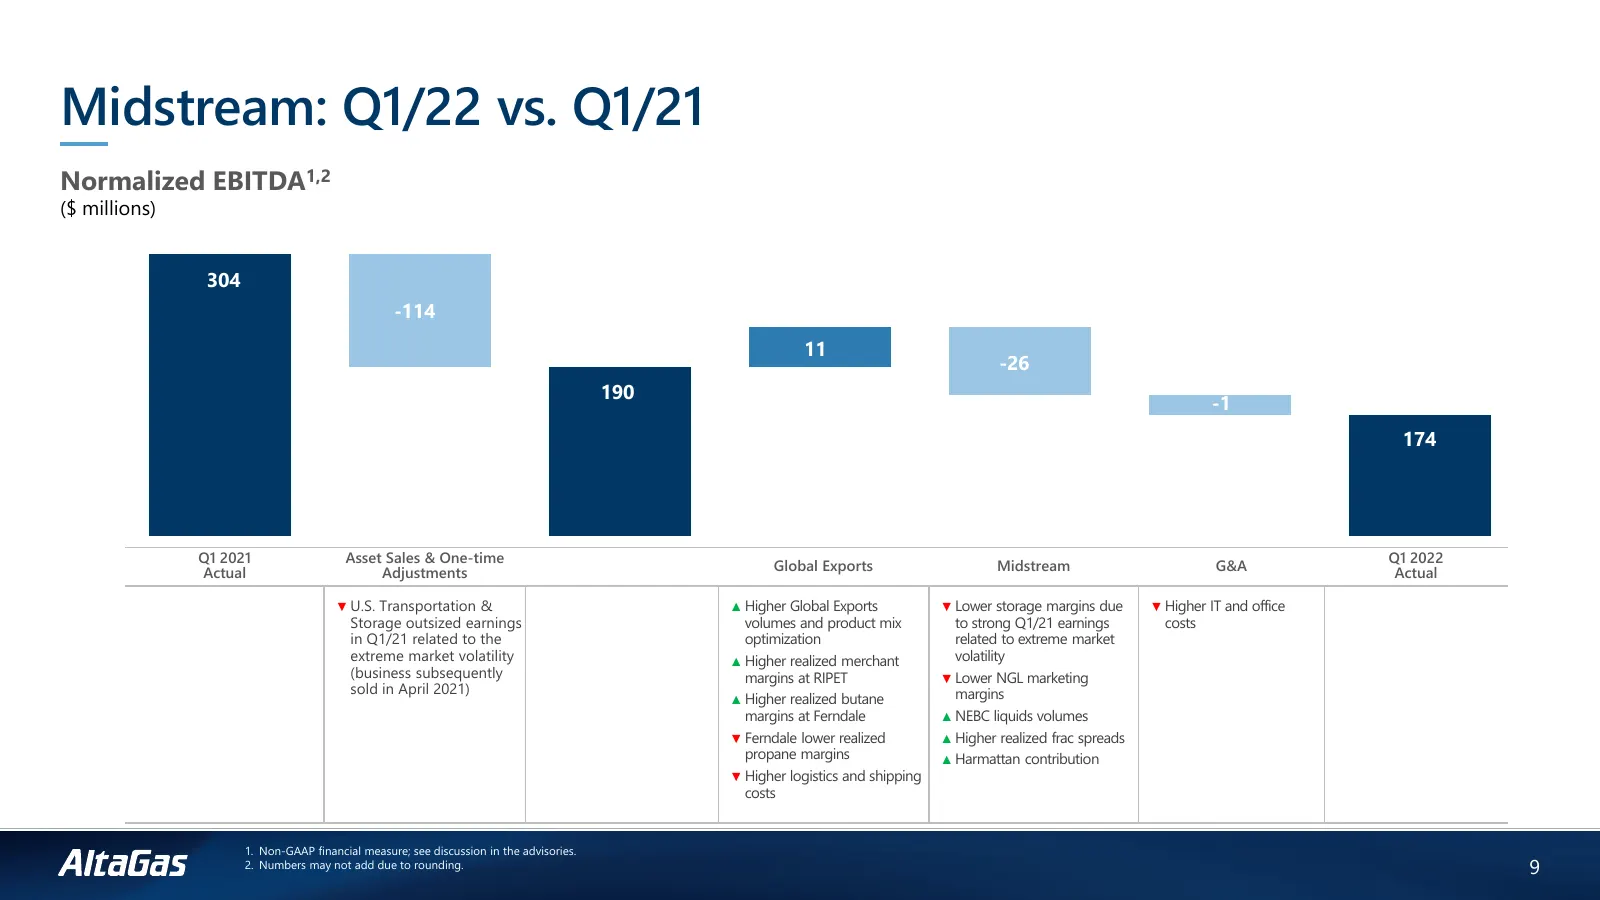
Slide 9: Midstream: Q1/22 vs. Q1/21 Normalized EBITDA
Midstream: Q1/22 vs. Q1/21 Normalized EBITDA1,2 ($ millions) 304 -114 11 -26 190 -1 174 Q1 2021 Asset Sales & One-time Q1 2022 Global Exports Midstream G&A Actual Adjustments Actual ▼ U.S. Transportation & ▲ Higher Global Exports ▼ Lower storage margins due ▼ Higher IT and office Storage outsized ea
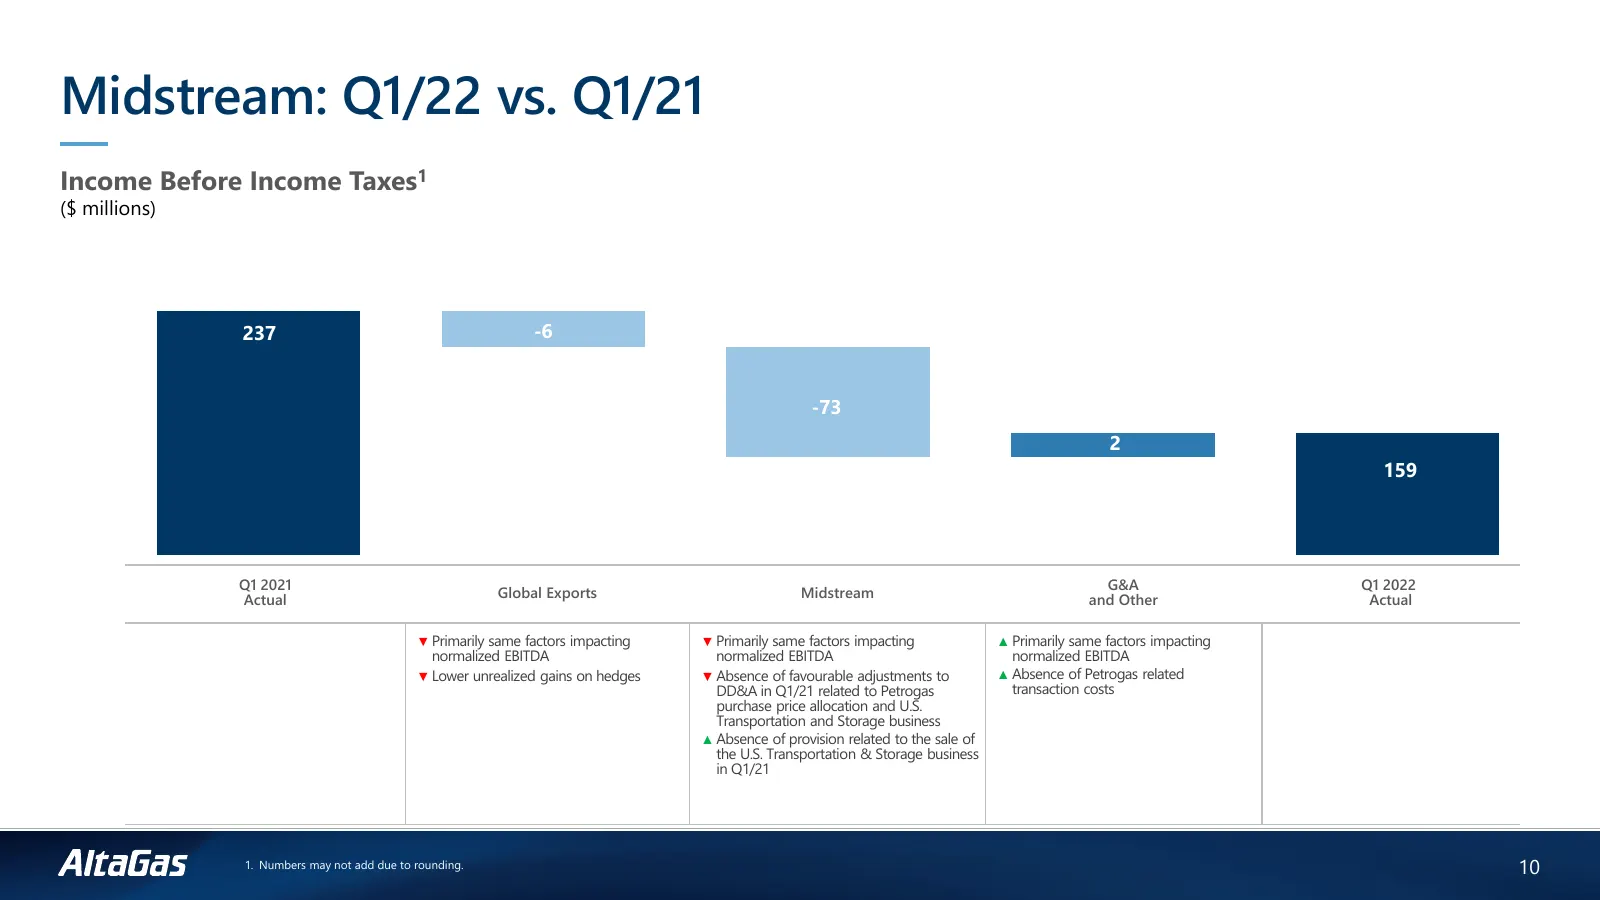
Slide 10: Midstream: Q1/22 vs. Q1/21 Income Before Income Taxes
Midstream: Q1/22 vs. Q1/21 Income Before Income Taxes1 ($ millions) 237 -6 -73 2 159 Q1 2021 G&A Q1 2022 Global Exports Midstream Actual and Other Actual ▼ Primarily same factors impacting ▼ Primarily same factors impacting ▲ Primarily same factors impacting normalized EBITDA normalized EBITDA norma
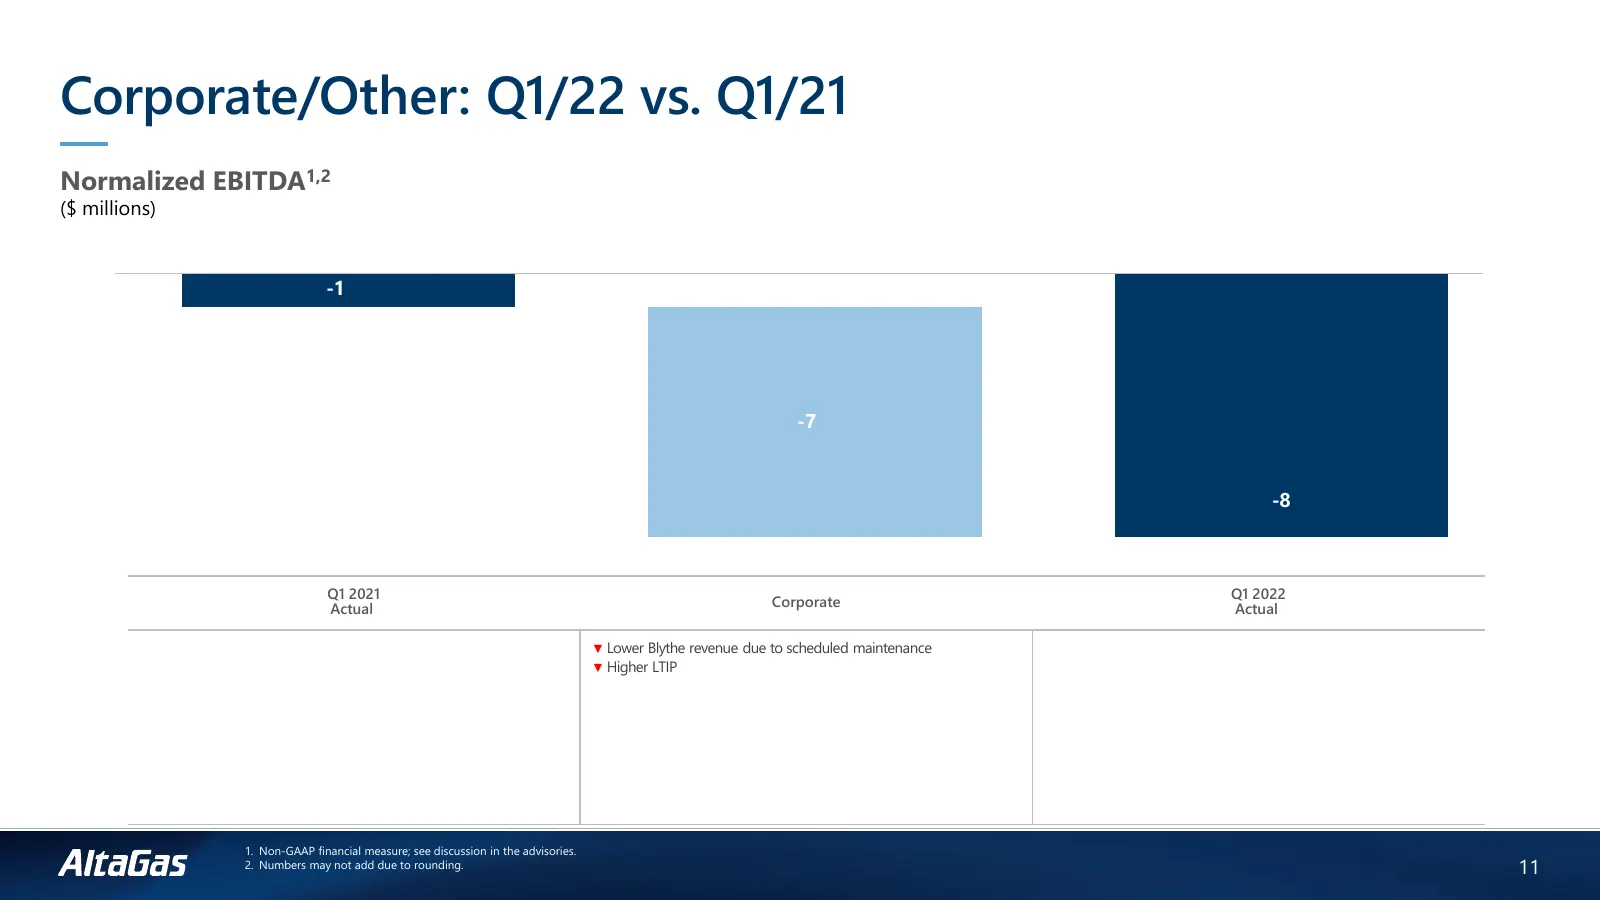
Slide 11: Corporate/Other: Q1/22 vs. Q1/21 Normalized EBITDA
Corporate/Other: Q1/22 vs. Q1/21 Normalized EBITDA1,2 ($ millions) -1 -7 2 -8 Q1 2021 Q1 2022 Corporate Actual Actual ▼ Lower Blythe revenue due to scheduled maintenance ▼ Higher LTIP 1. Non-GAAP financial measure; see discussion in the advisories. 2. Numbers may not add due to rounding. 11
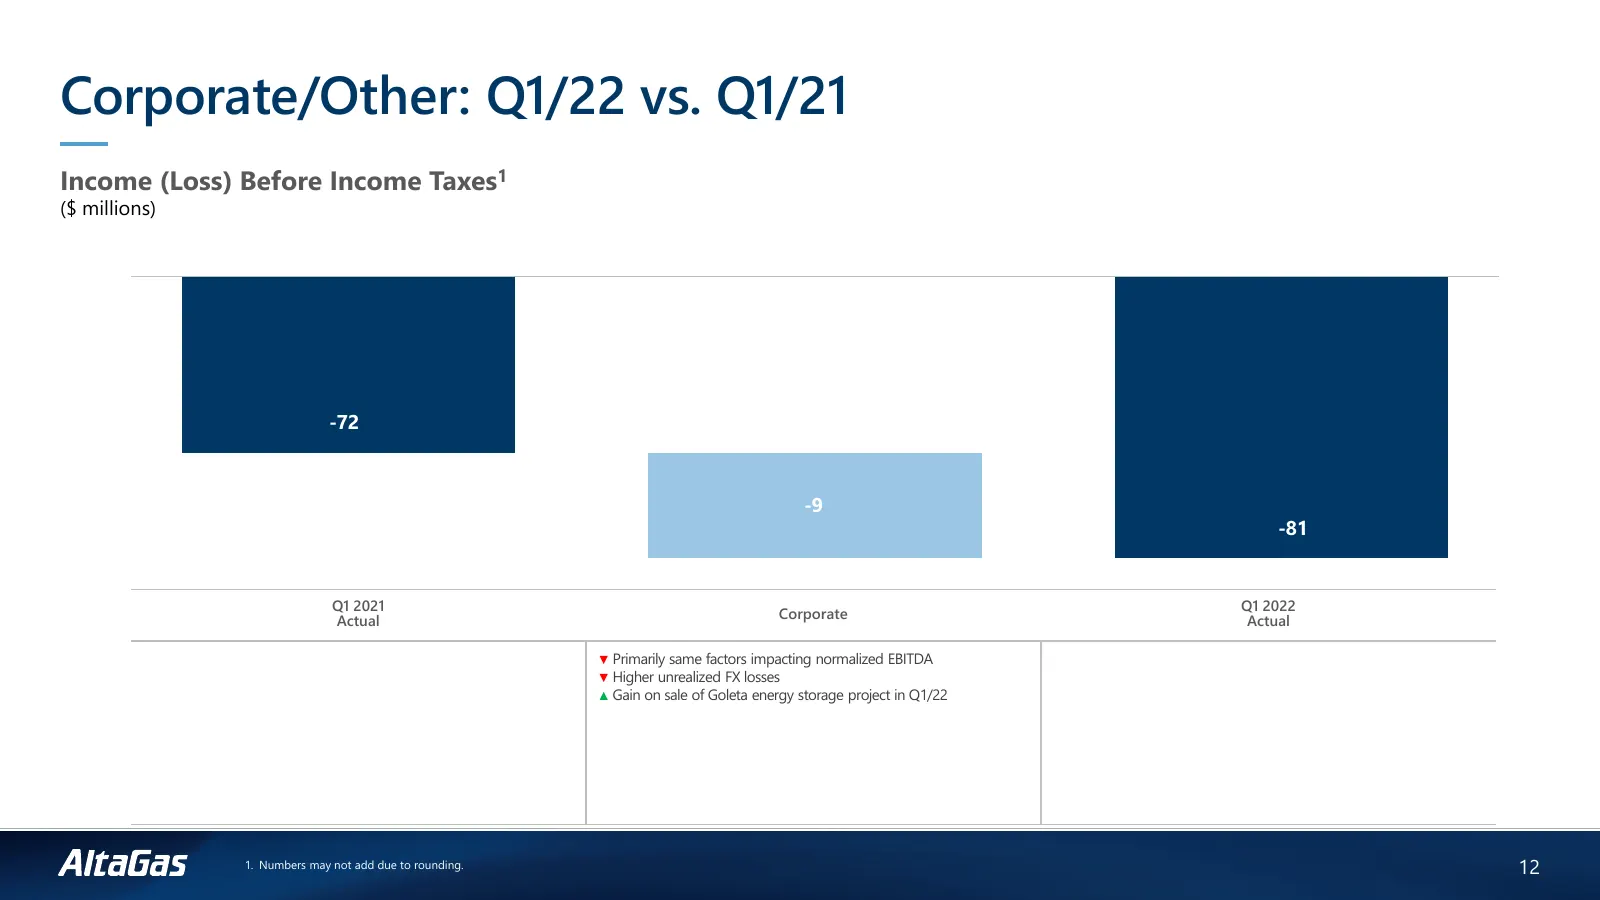
Slide 12: Corporate/Other: Q1/22 vs. Q1/21 Income Before Income Taxes
Corporate/Other: Q1/22 vs. Q1/21 Income (Loss) Before Income Taxes1 ($ millions) -72 -9 -81 Q1 2021 Q1 2022 Corporate Actual Actual ▼ Primarily same factors impacting normalized EBITDA ▼ Higher unrealized FX losses ▲ Gain on sale of Goleta energy storage project in Q1/22 1. Numbers may not add due t
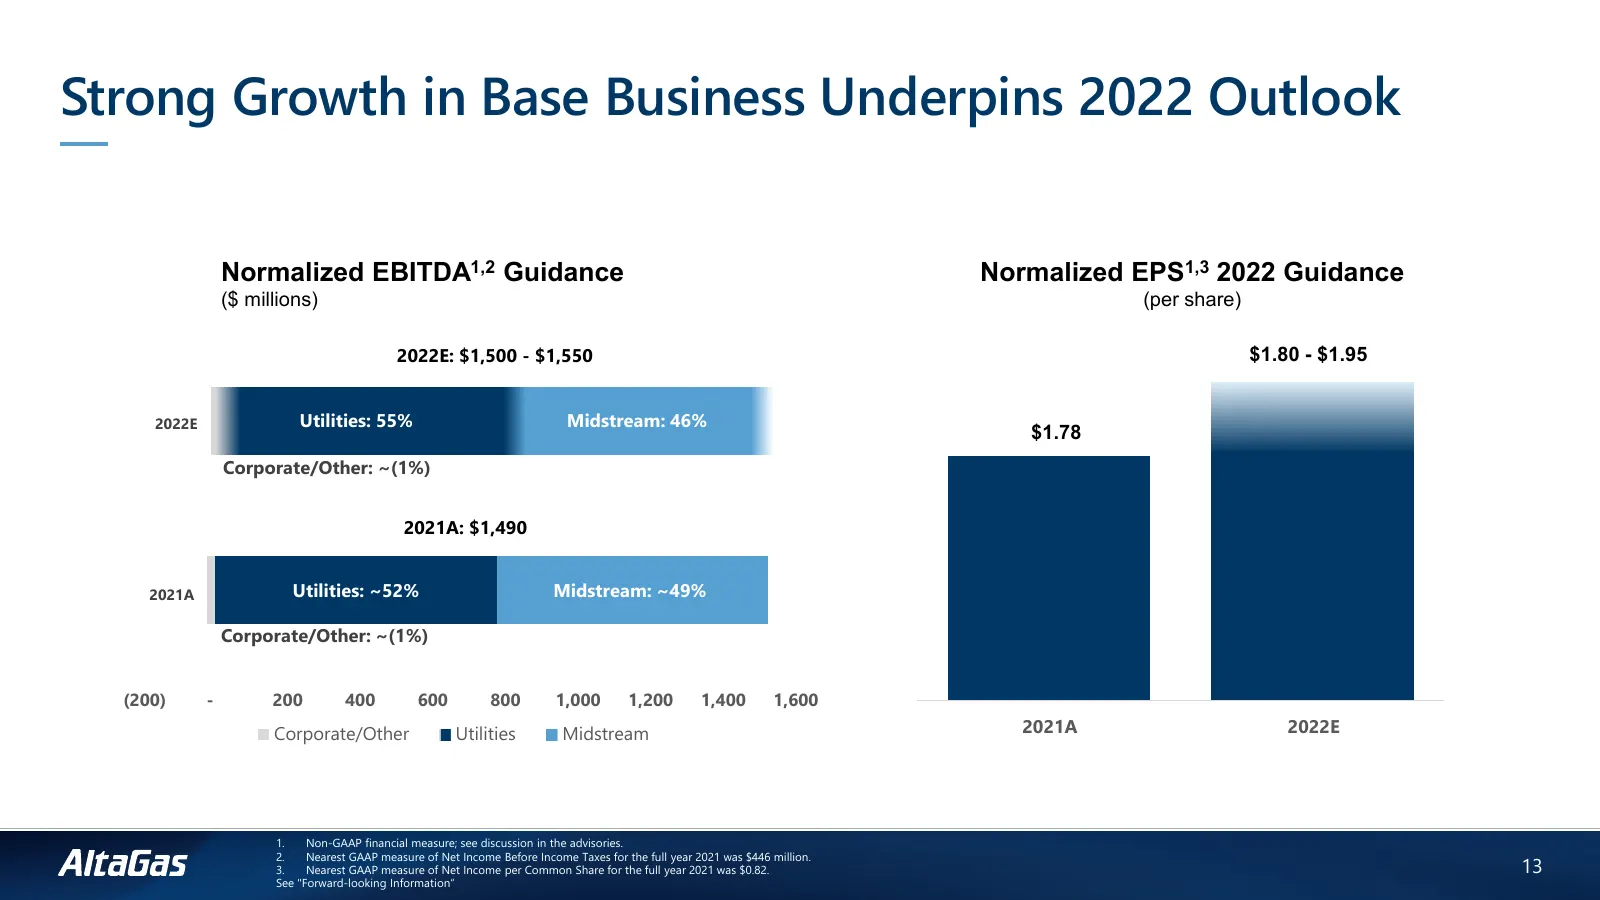
Slide 13: Strong Growth in Base Business Underpins 2022 Outlook
Strong Growth in Base Business Underpins 2022 Outlook Normalized EBITDA1,2 Guidance Normalized EPS1,3 2022 Guidance ($ millions) (per share) 2022E: $1,500 - $1,550 $1.80 - $1.95 2022E Utilities: 55% Midstream: 46% $1.78 Corporate/Other: ~(1%) 2021A: $1,490 2021A Utilities: ~52% Midstream: ~49% Corpo
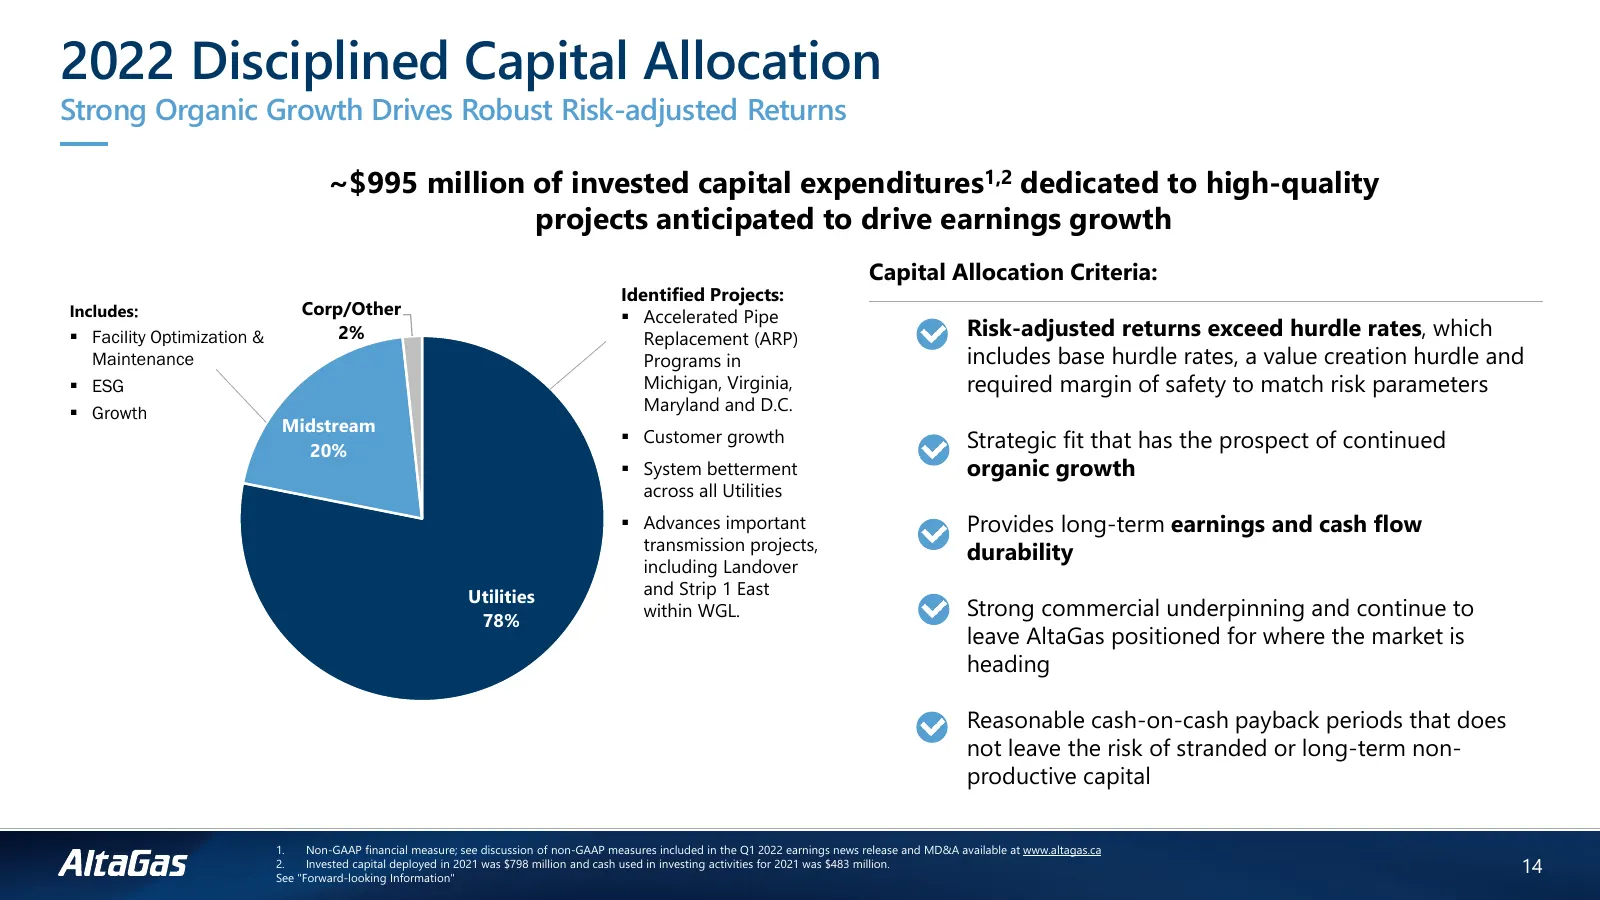
Slide 14: 2022 Disciplined Capital Allocation
2022 Disciplined Capital Allocation Strong Organic Growth Drives Robust Risk-adjusted Returns ~$995 million of invested capital expenditures1,2 dedicated to high-quality projects anticipated to drive earnings growth Capital Allocation Criteria: Identified Projects: Includes: Corp/Other Accelerated
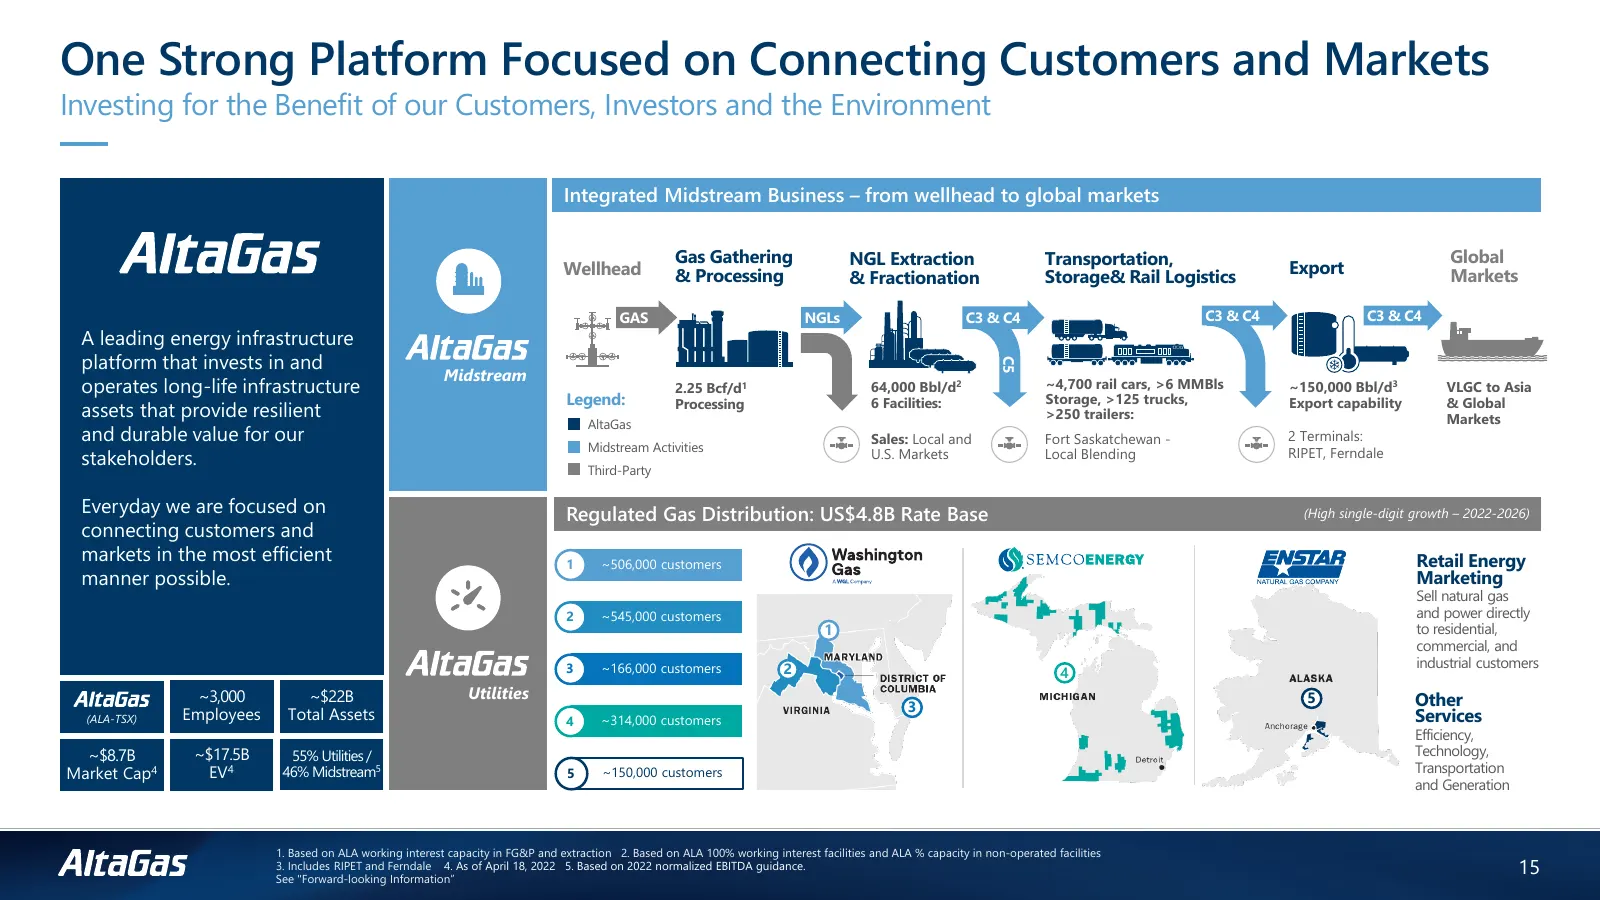
Slide 15: One Strong Platform Focused on Connecting Customers and Markets
One Strong Platform Focused on Connecting Customers and Markets Investing for the Benefit of our Customers, Investors and the Environment Integrated Midstream Business – from wellhead to global markets Gas Gathering NGL Extraction Transportation, Global Wellhead & Processing Export Markets & Fractio
Slide 16: Contact Information
Contact Information For more information visit www.altagas.ca or reach out to one of the following: Jon Morrison Adam McKnight Daine Biluk Senior Vice President, Investor Relations Director, Investor Relations Senior Manager, Investor Relations and Corporate Development Adam.McKnight@altagas.ca dain
Source: Internet Archive copy of altagas.ca
More decks from AltaGas Ltd.
 Q3 2026 Earnings Presentation23 slides · Oct 29, 2026
 Q2 2026 Earnings Presentation24 slides · Jul 30, 2026
 Investor Presentation (June 2026)58 slides · June 2026
 Investor Presentation (May 2026)61 slides · May 2026
 Q1 2026 Earnings Presentation24 slides · Apr 30, 2026
 Q4 2025 Earnings Presentation30 slides · Mar 6, 2026