Foschini Group Limited · JSE:TFG
Foschini — The Foschini Group — H1 FY2027 Earnings Presentation
67 slides from Foschini's earnings presentation, Nov 5, 2026

Slide 1: TFG Results Presentation 2026
TFG RESULTS PRESENTATION 2026 THE FOSCHINI GROUP LIMITED for the half year ended 30 September 2026 1

Slide 2: Agenda
01 02 03 04 Overview Financial Outlook Q&A Review Agenda 2

Slide 3: Overview
01 Anthony Thunström Group CEO Overview TFG Results Presentation | for the half-year ended 30 September 2026 3
Slide 4: A tough half, with clear execution against our priorities
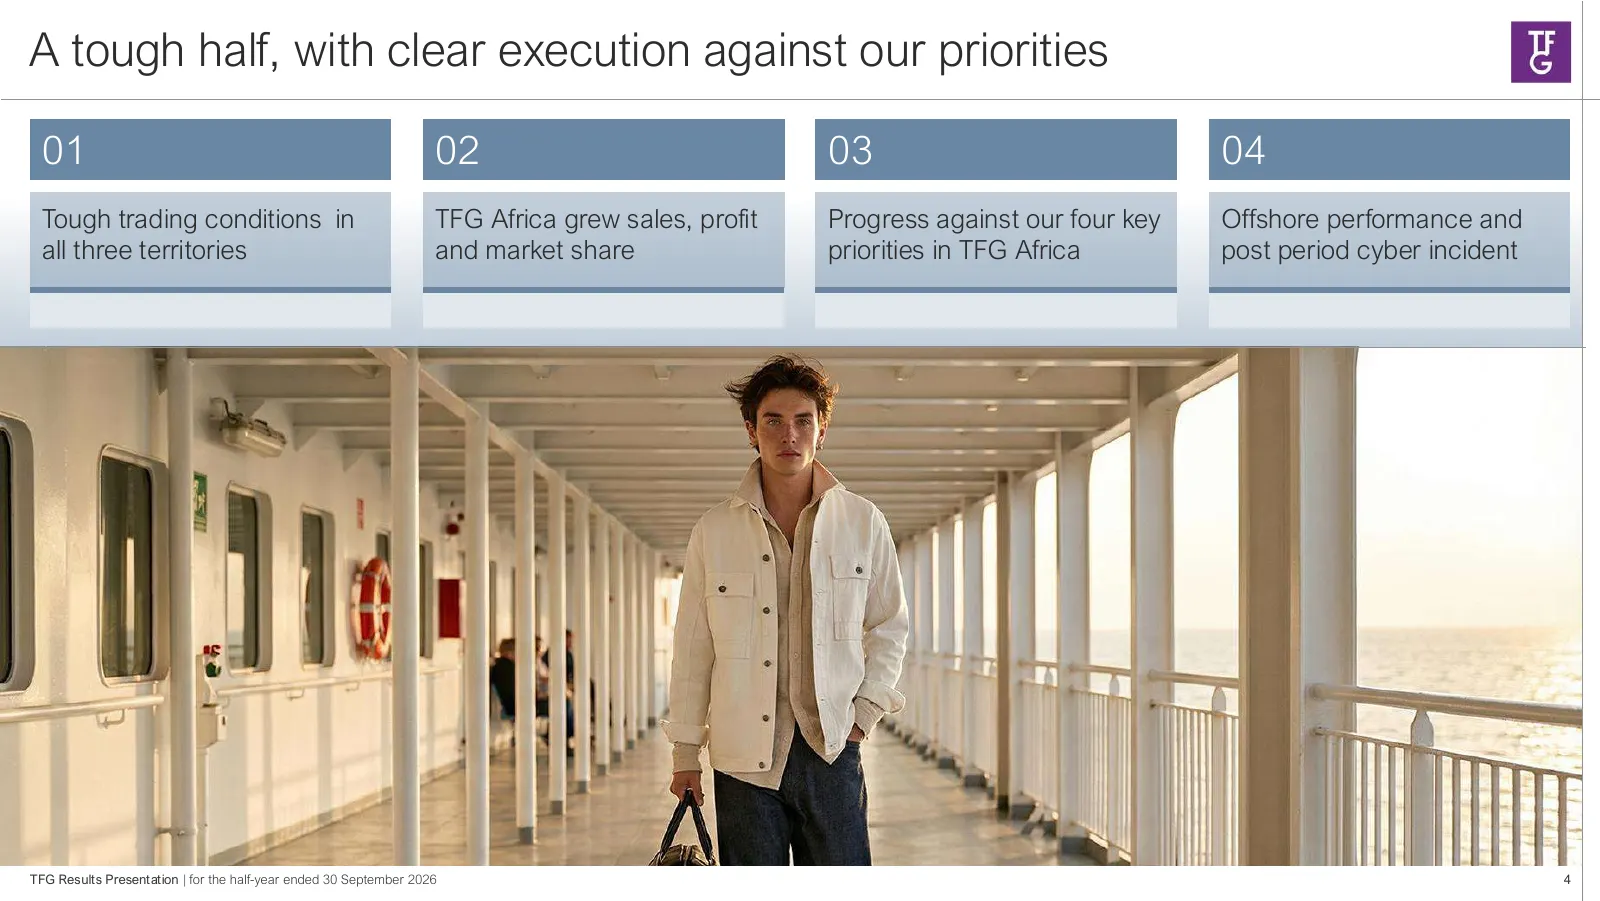
A tough half, with clear execution against our priorities 01 02 03 04 Tough trading conditions in TFG Africa grew sales, profit Progress against our four key Offshore performance and all three territories and market share priorities in TFG Africa post period cyber incident TFG Results Presentation |
Slide 5: Group performance: held sales in a tough market, net debt cut by R1bn
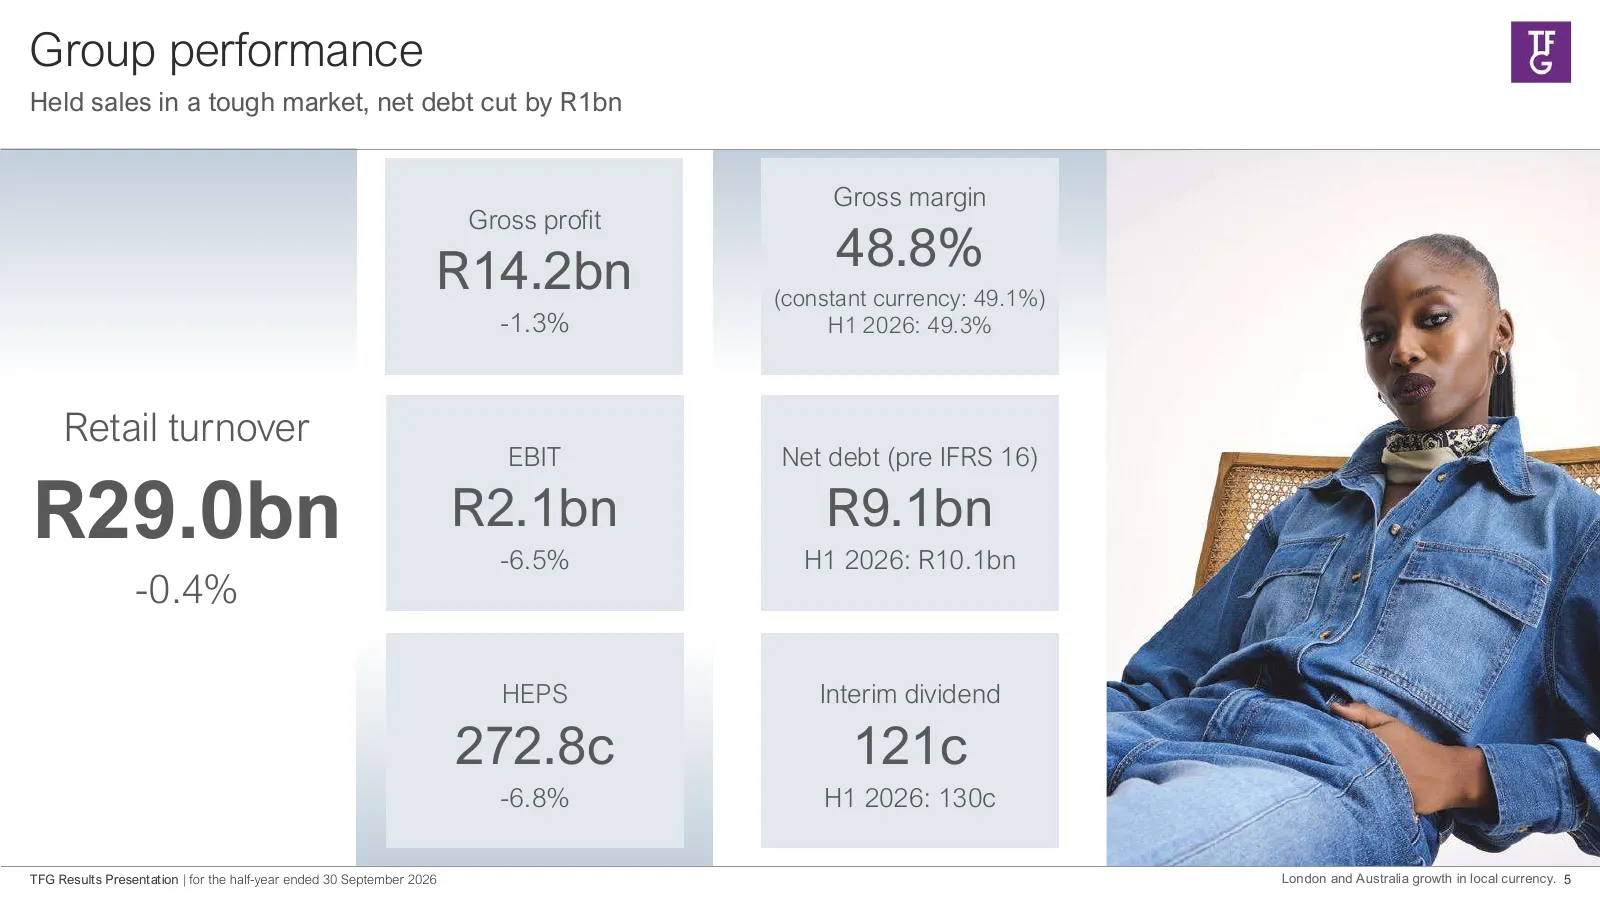
Group performance Held sales in a tough market, net debt cut by R1bn Gross margin Gross profit R14.2bn 48.8% (constant currency: 49.1%) -1.3% H1 2026: 49.3% Retail turnover EBIT Net debt (pre IFRS 16) R29.0bn R2.1bn -6.5% R9.1bn H1 2026: R10.1bn -0.4% HEPS Interim dividend 272.8c 121c -6.8% H1 2026:
Slide 6: TFG Africa | Sales tracked the fuel shock
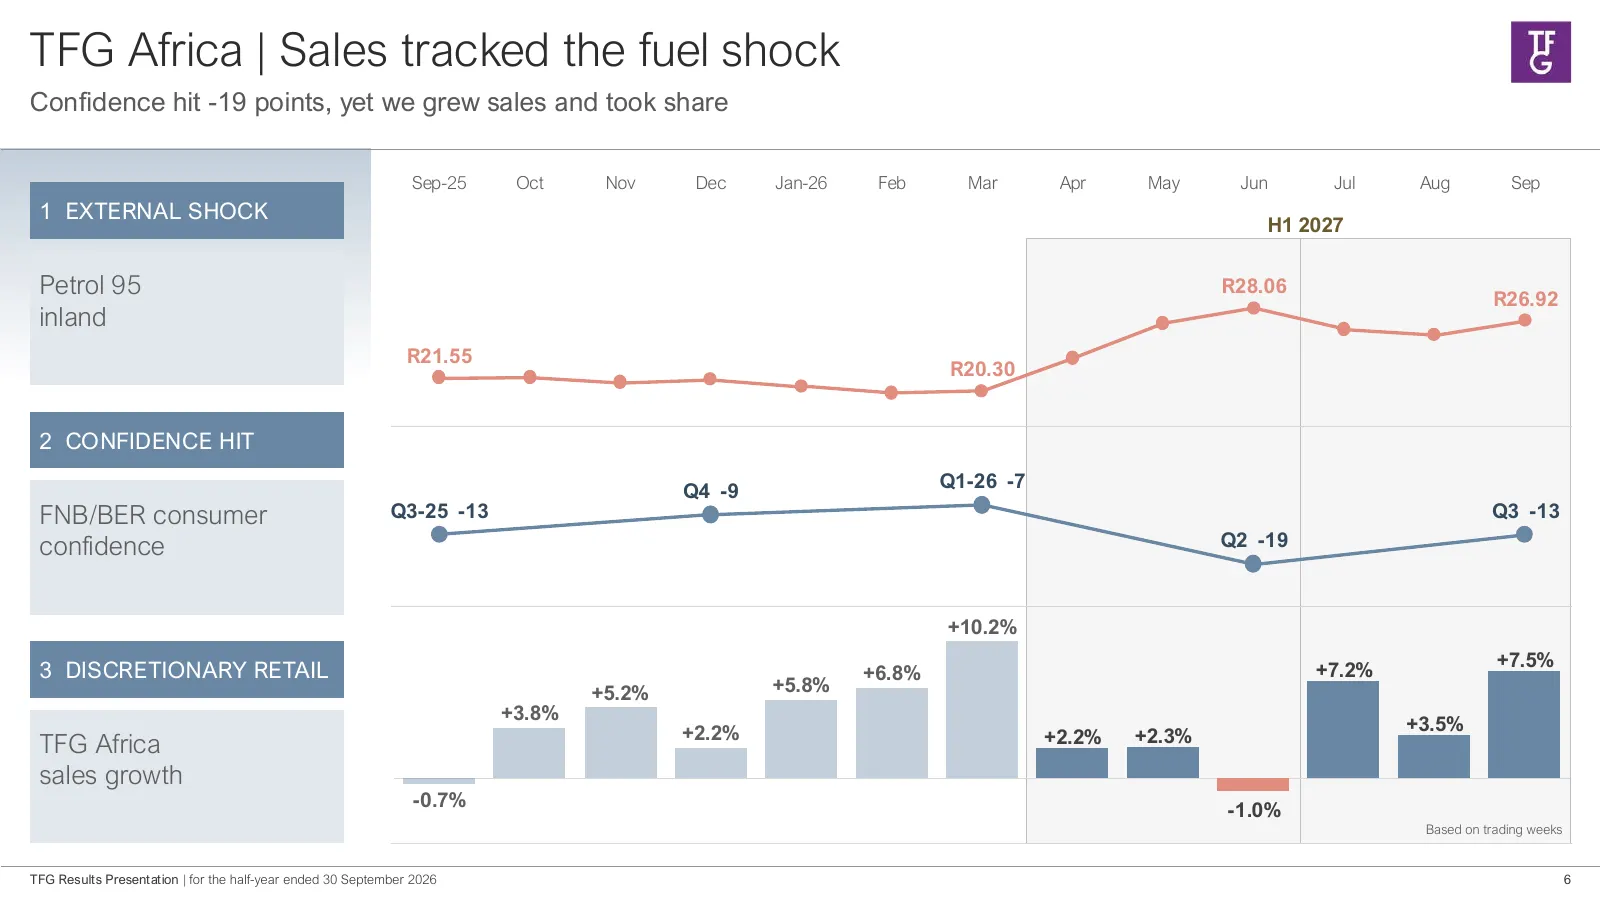
TFG Africa | Sales tracked the fuel shock Confidence hit -19 points, yet we grew sales and took share Sep-25 Oct Nov Dec Jan-26 Feb Mar Apr May Jun Jul Aug Sep 1 EXTERNAL SHOCK H1 2027 Petrol 95 R28.06 R26.92 inland R21.55 R20.30 2 CONFIDENCE HIT Q4 -9 Q1-26 -7 FNB/BER consumer Q3-25 -13 Q3 -13 conf
Slide 7: International | Two markets under pressure
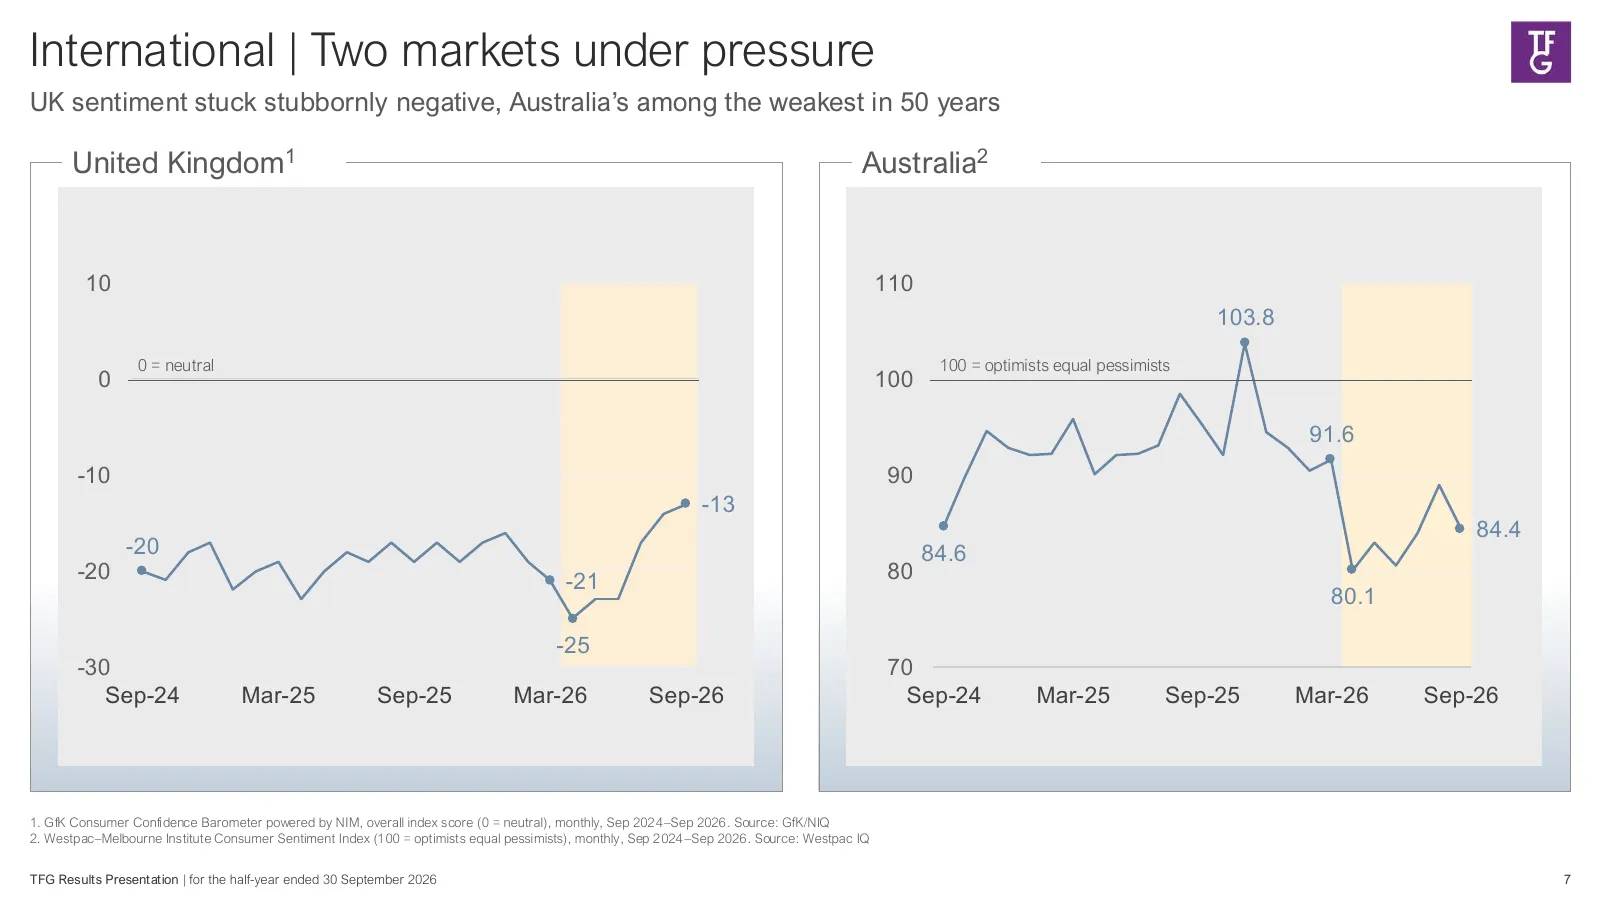
International | Two markets under pressure UK sentiment stuck stubbornly negative, Australia’s among the weakest in 50 years United Kingdom1 Australia2 10 110 103.8 0 = neutral 100 = optimists equal pessimists 0 100 91.6 -10 90 -13 84.4 -20 84.6 -20 -21 80 80.1 -25 -30 70 Sep-24 Mar-25 Sep-25 Mar-26
Slide 8: Performance by territory
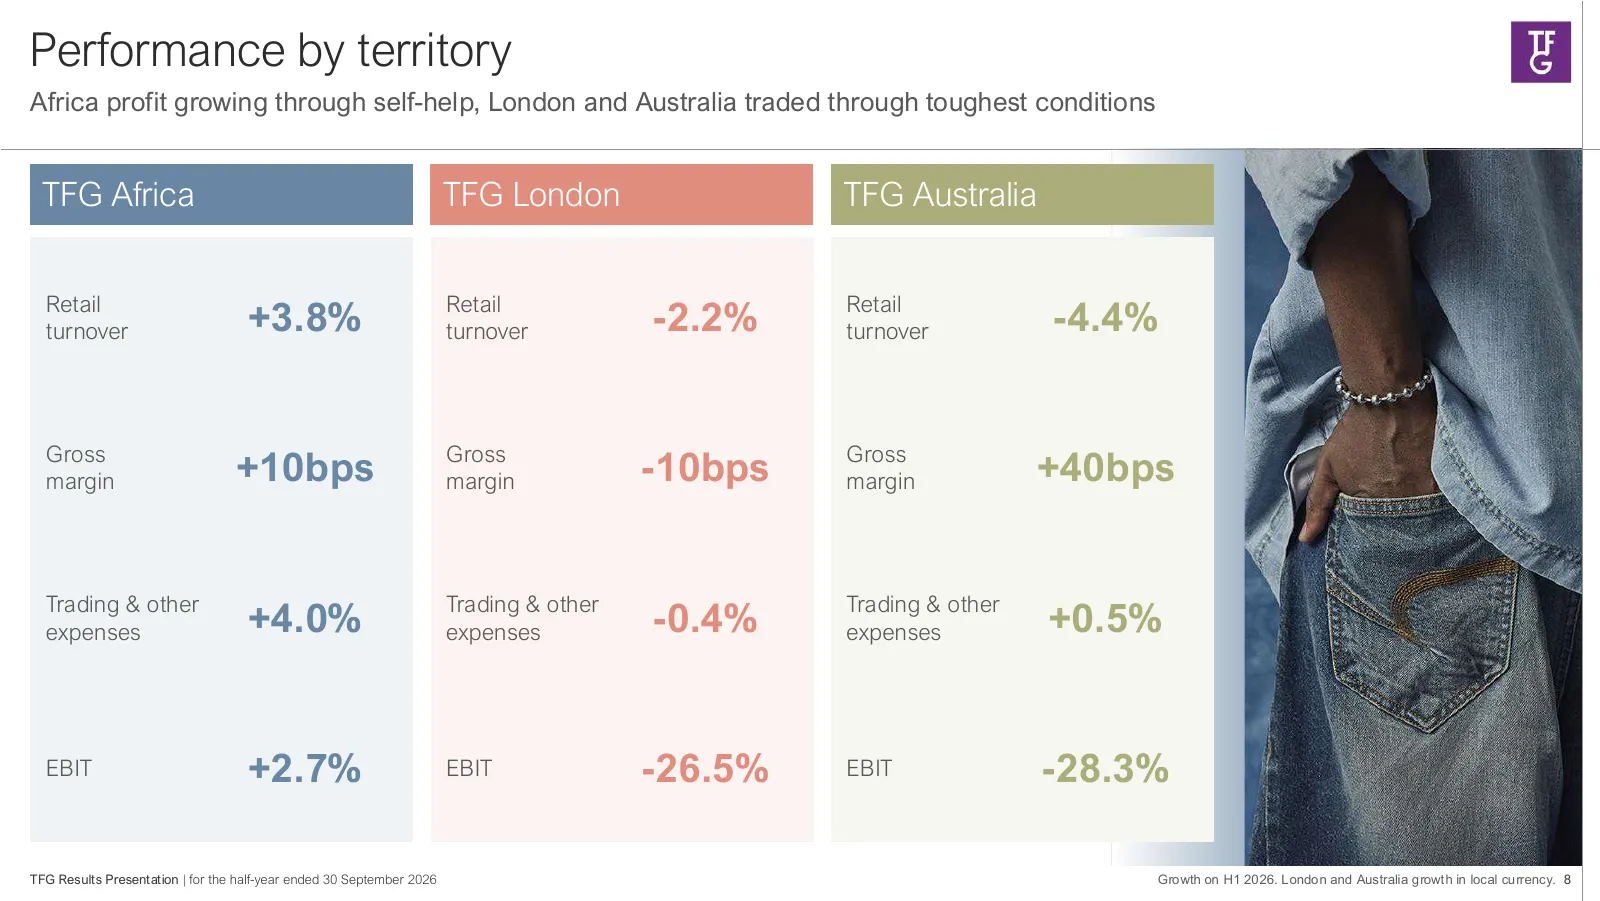
Performance by territory Africa profit growing through self-help, London and Australia traded through toughest conditions TFG Africa TFG London TFG Australia Retail Retail Retail turnover +3.8% turnover -2.2% turnover -4.4% Gross Gross Gross margin +10bps margin -10bps margin +40bps Trading & other
Slide 9: TFG Africa | Winning share in a tough market
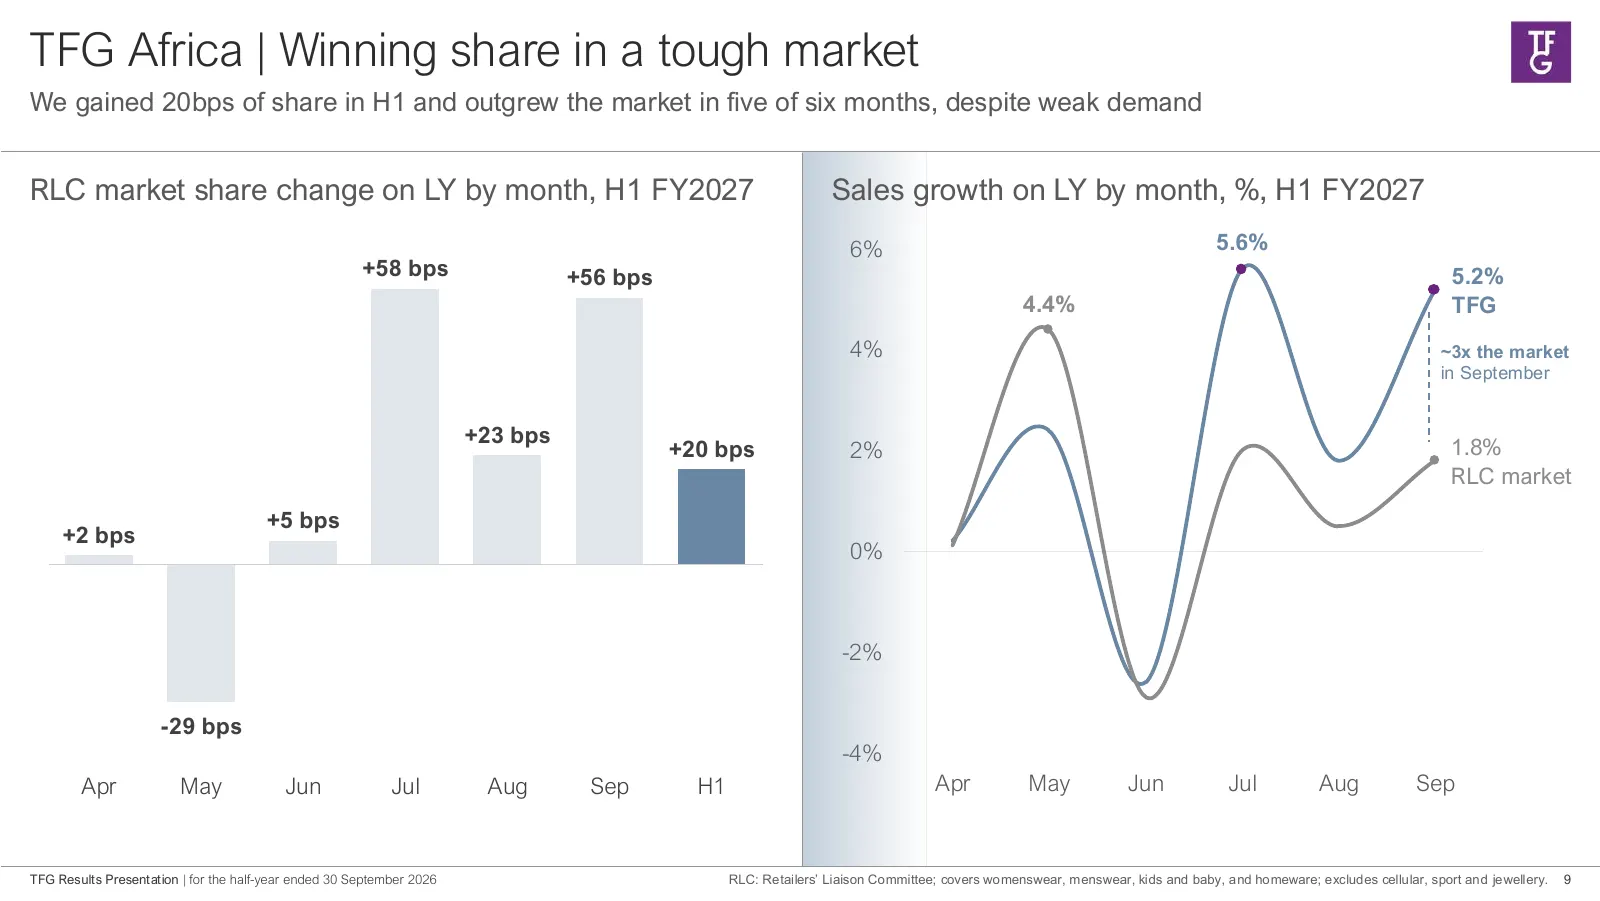
TFG Africa | Winning share in a tough market We gained 20bps of share in H1 and outgrew the market in five of six months, despite weak demand RLC market share change on LY by month, H1 FY2027 Sales growth on LY by month, %, H1 FY2027 6% 5.6% +58 bps +56 bps 5.2% 4.4% TFG 4% ~3x the market in Septemb
Slide 10: TFG Africa divisional performance review
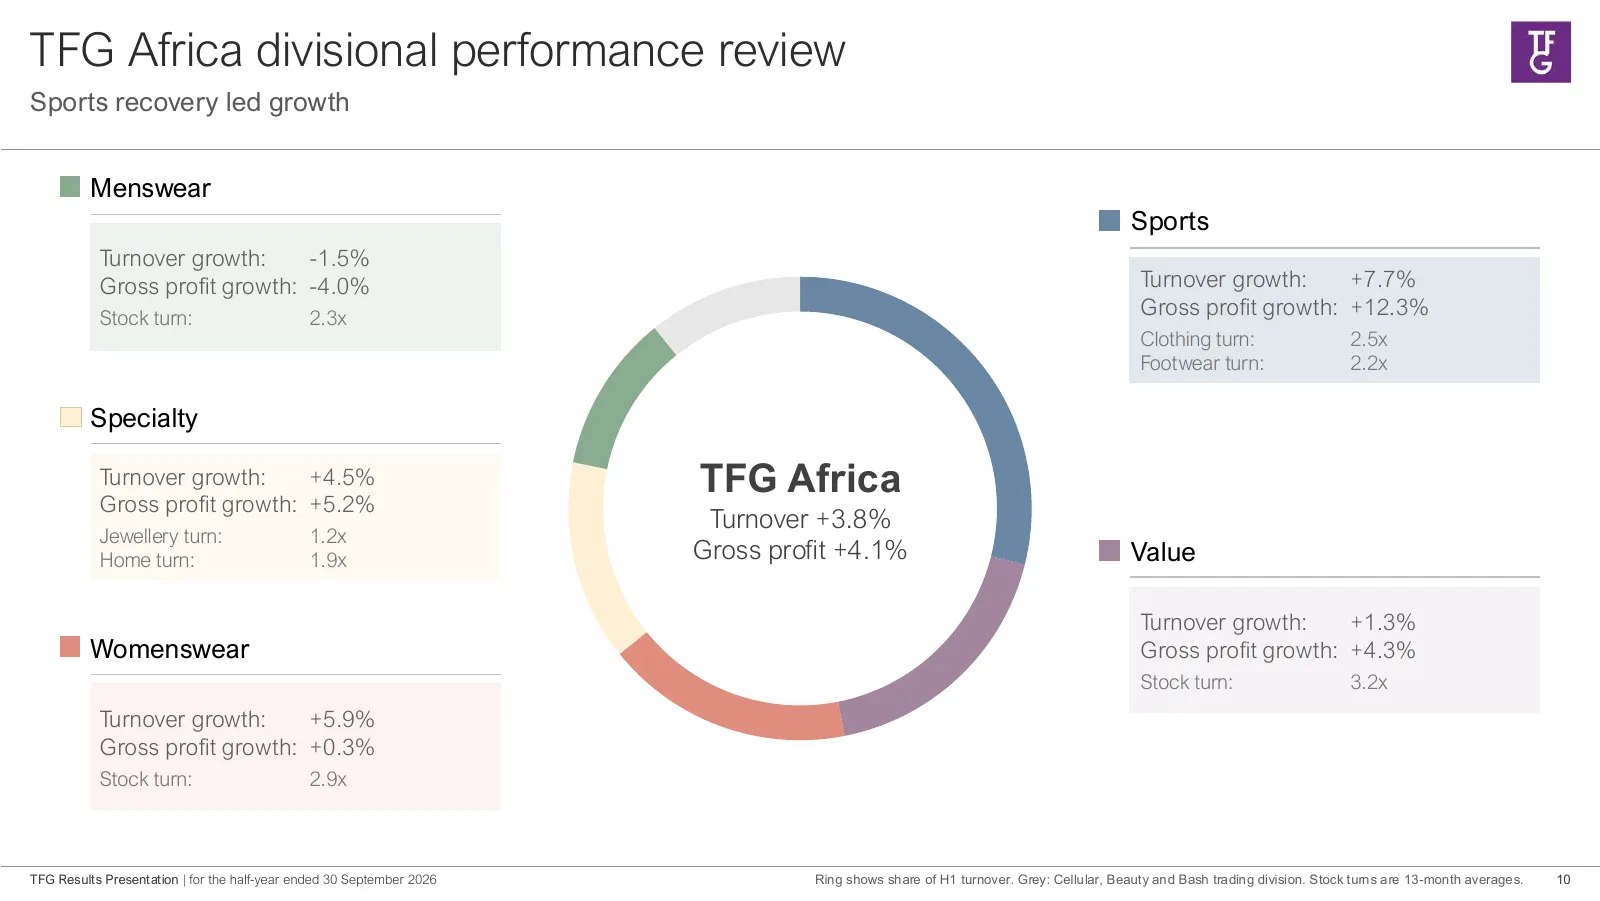
TFG Africa divisional performance review Sports recovery led growth Menswear Sports Turnover growth: -1.5% Gross profit growth: -4.0% Turnover growth: +7.7% Stock turn: 2.3x Gross profit growth: +12.3% Clothing turn: 2.5x Footwear turn: 2.2x Specialty Turnover growth: +4.5% TFG Africa Gross profit g
Slide 11: Progress against our four key priorities in Africa
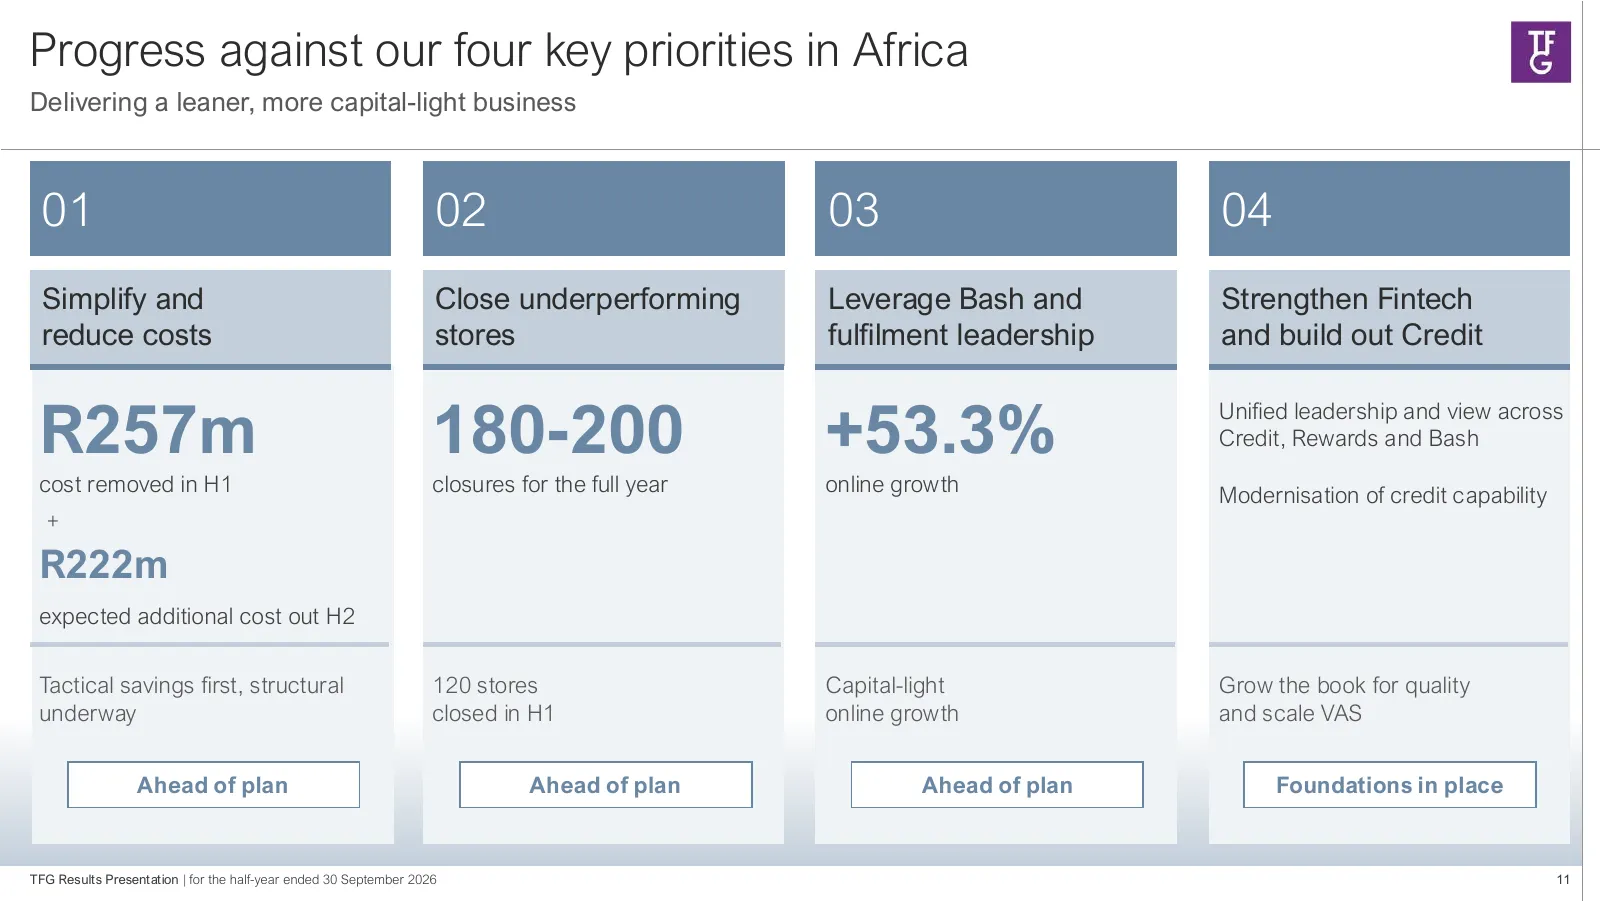
Progress against our four key priorities in Africa Delivering a leaner, more capital-light business 01 02 03 04 Simplify and Close underperforming Leverage Bash and Strengthen Fintech reduce costs stores fulfilment leadership and build out Credit R257m 180-200 +53.3% Unified leadership and view acro
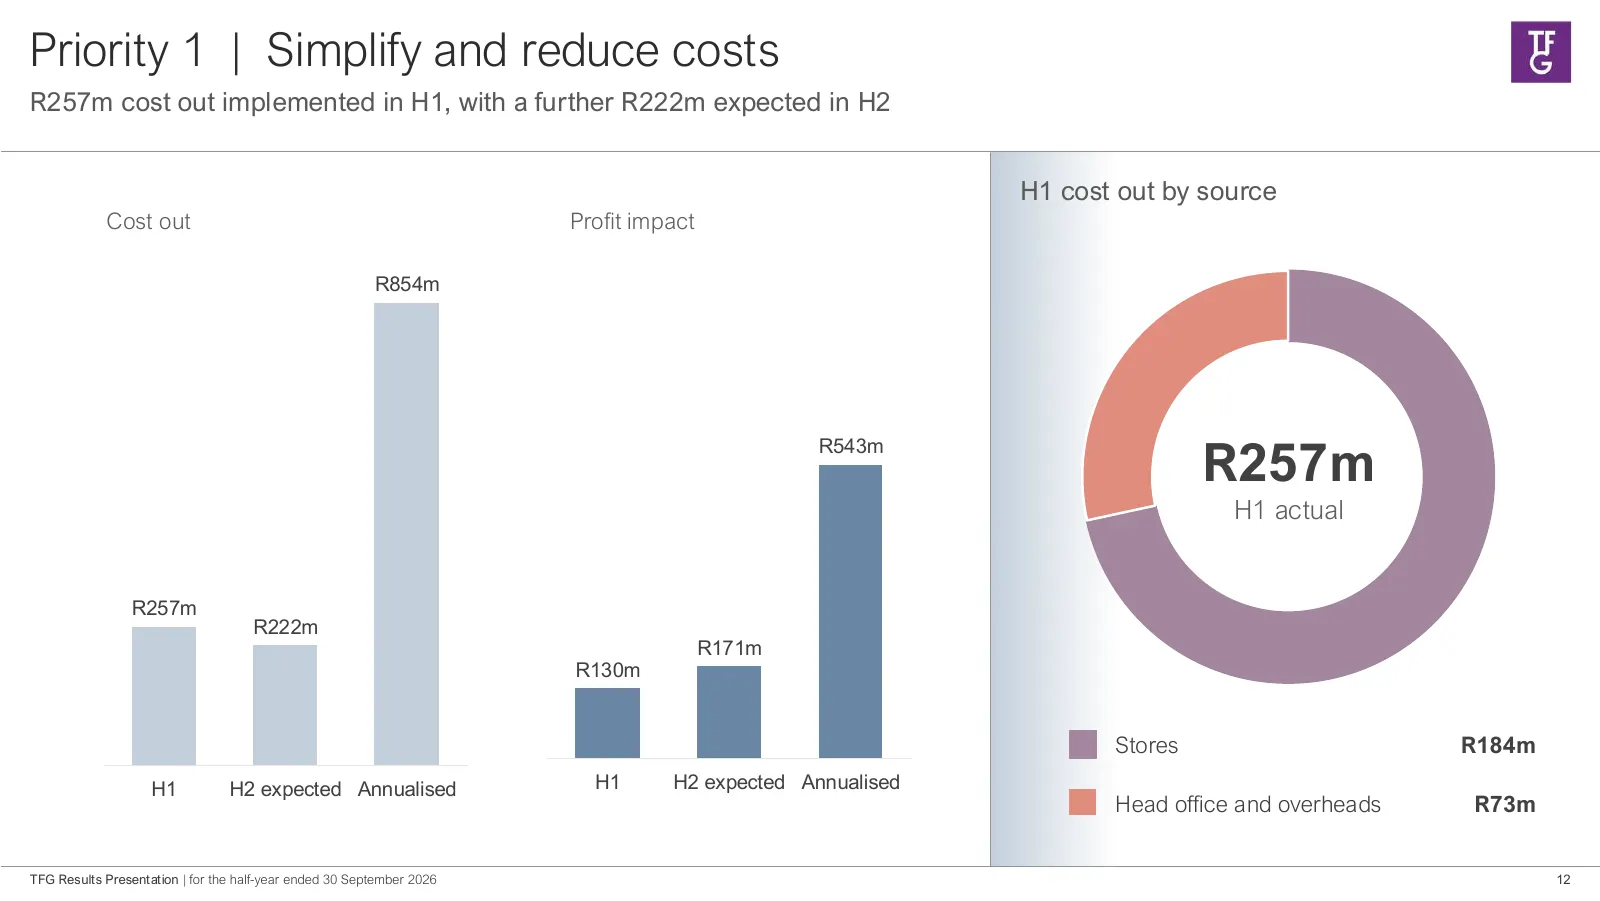
Slide 12: Priority 1 | Simplify and reduce costs
Priority 1 | Simplify and reduce costs R257m cost out implemented in H1, with a further R222m expected in H2 H1 cost out by source Cost out Profit impact R854m R257m R543m H1 actual R257m R222m R171m R130m Stores R184m H1 H2 expected Annualised H1 H2 expected Annualised Head office and overheads R73
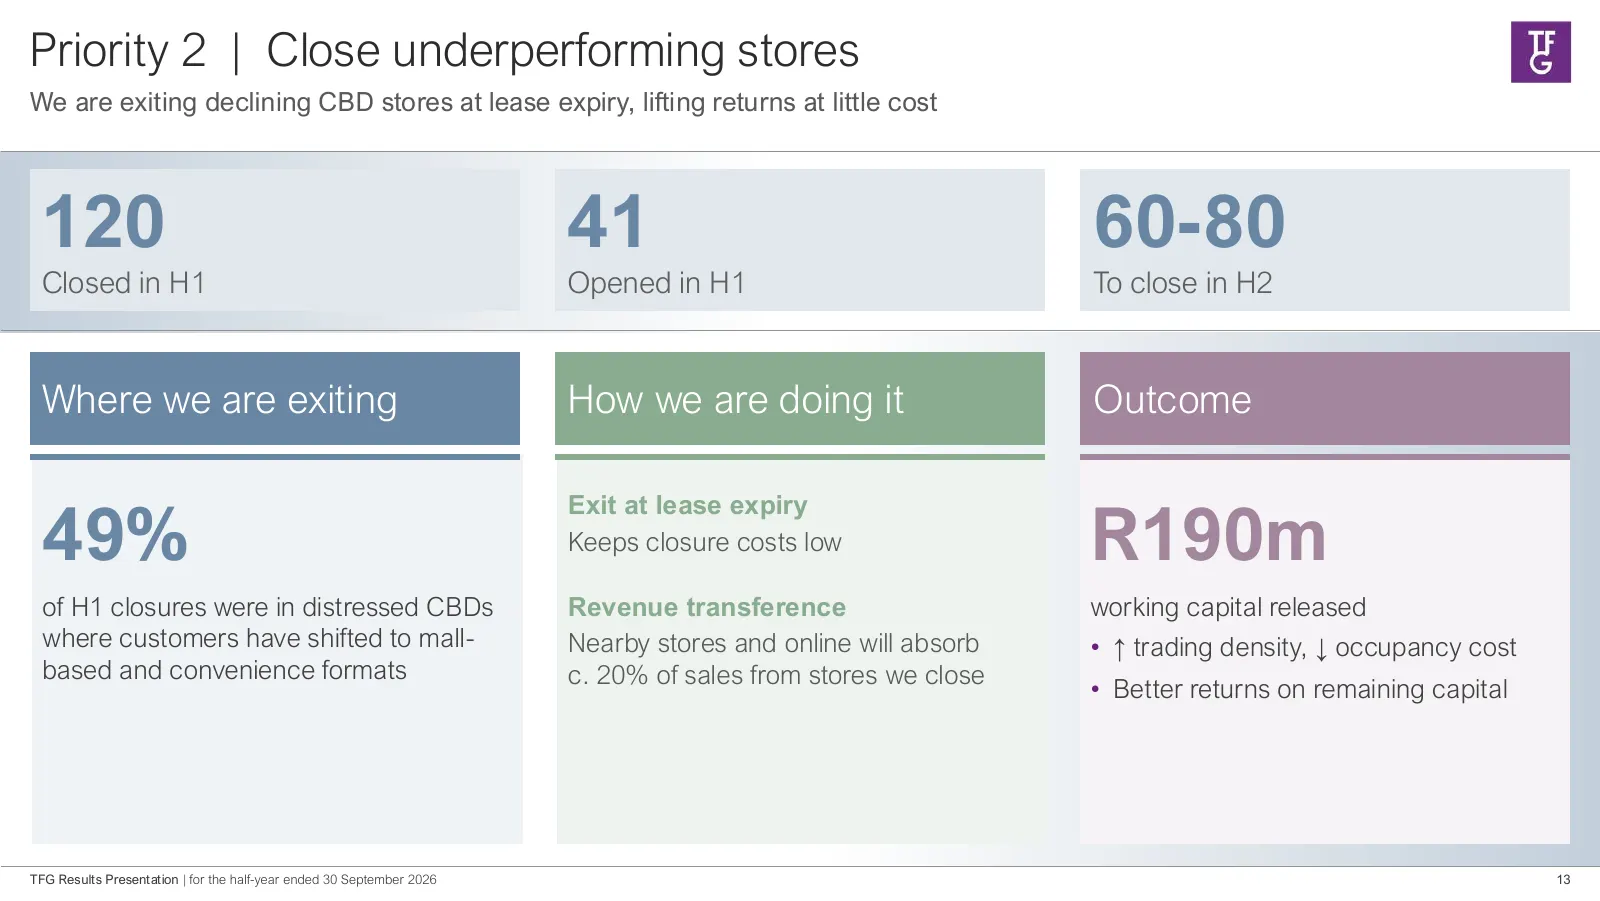
Slide 13: Priority 2 | Close underperforming stores
Priority 2 | Close underperforming stores We are exiting declining CBD stores at lease expiry, lifting returns at little cost 120 41 60-80 Closed in H1 Opened in H1 To close in H2 Where we are exiting How we are doing it Outcome 49% R190m Exit at lease expiry Keeps closure costs low of H1 closures w
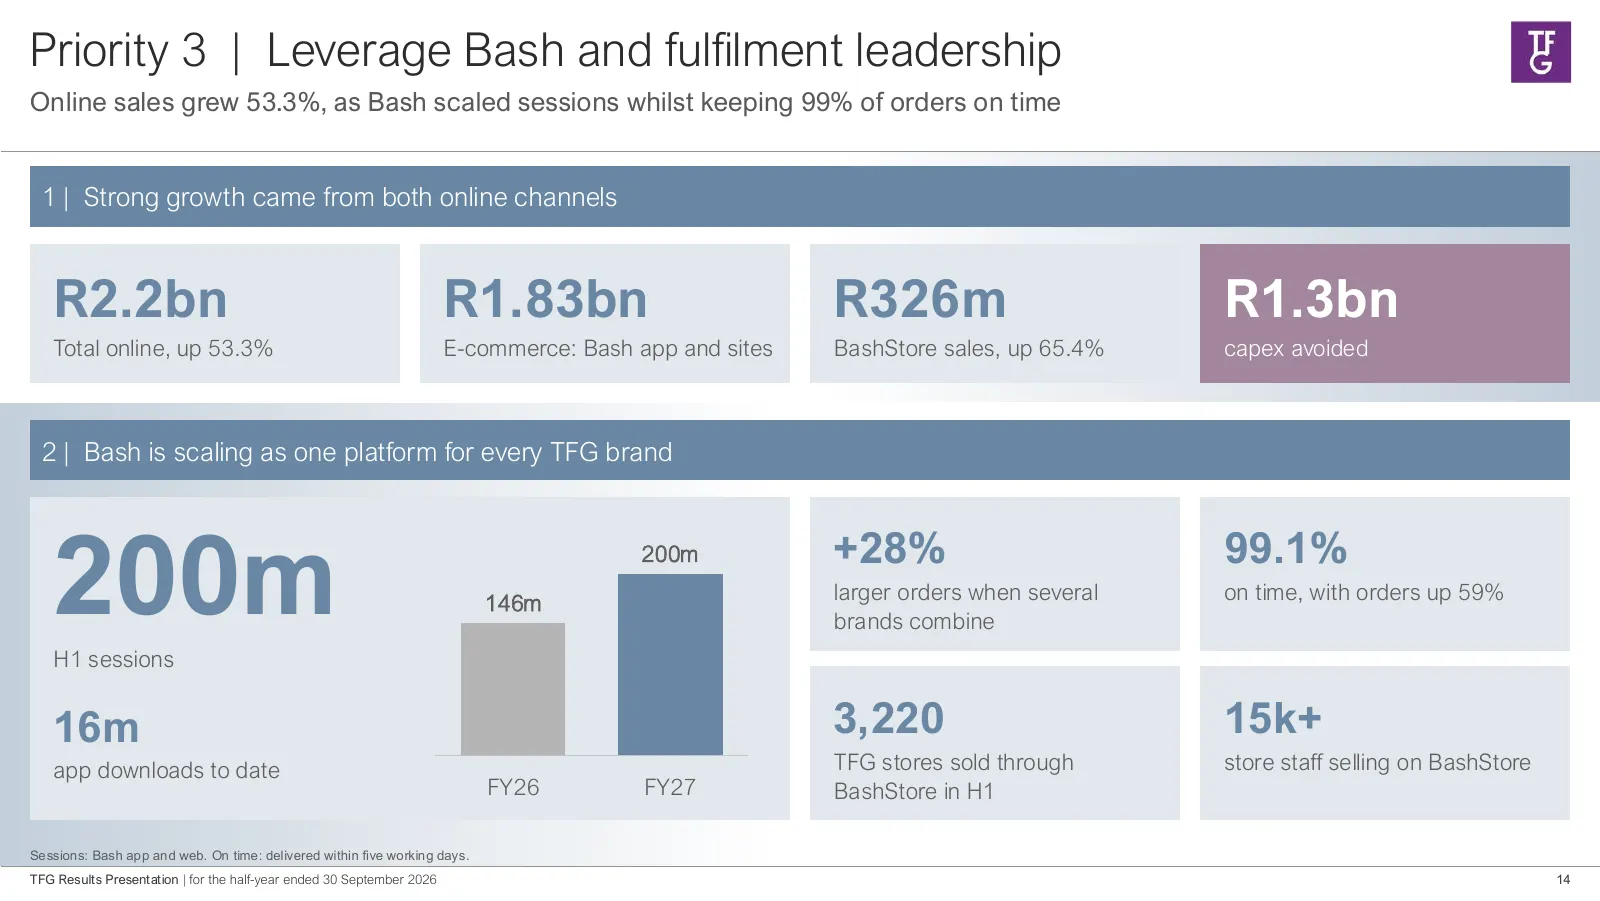
Slide 14: Priority | Leverage Bash and fulfilment leadership
Priority 3 | Leverage Bash and fulfilment leadership Online sales grew 53.3%, as Bash scaled sessions whilst keeping 99% of orders on time 1 | Strong growth came from both online channels R2.2bn R1.83bn R326m R1.3bn Total online, up 53.3% E-commerce: Bash app and sites BashStore sales, up 65.4% cape
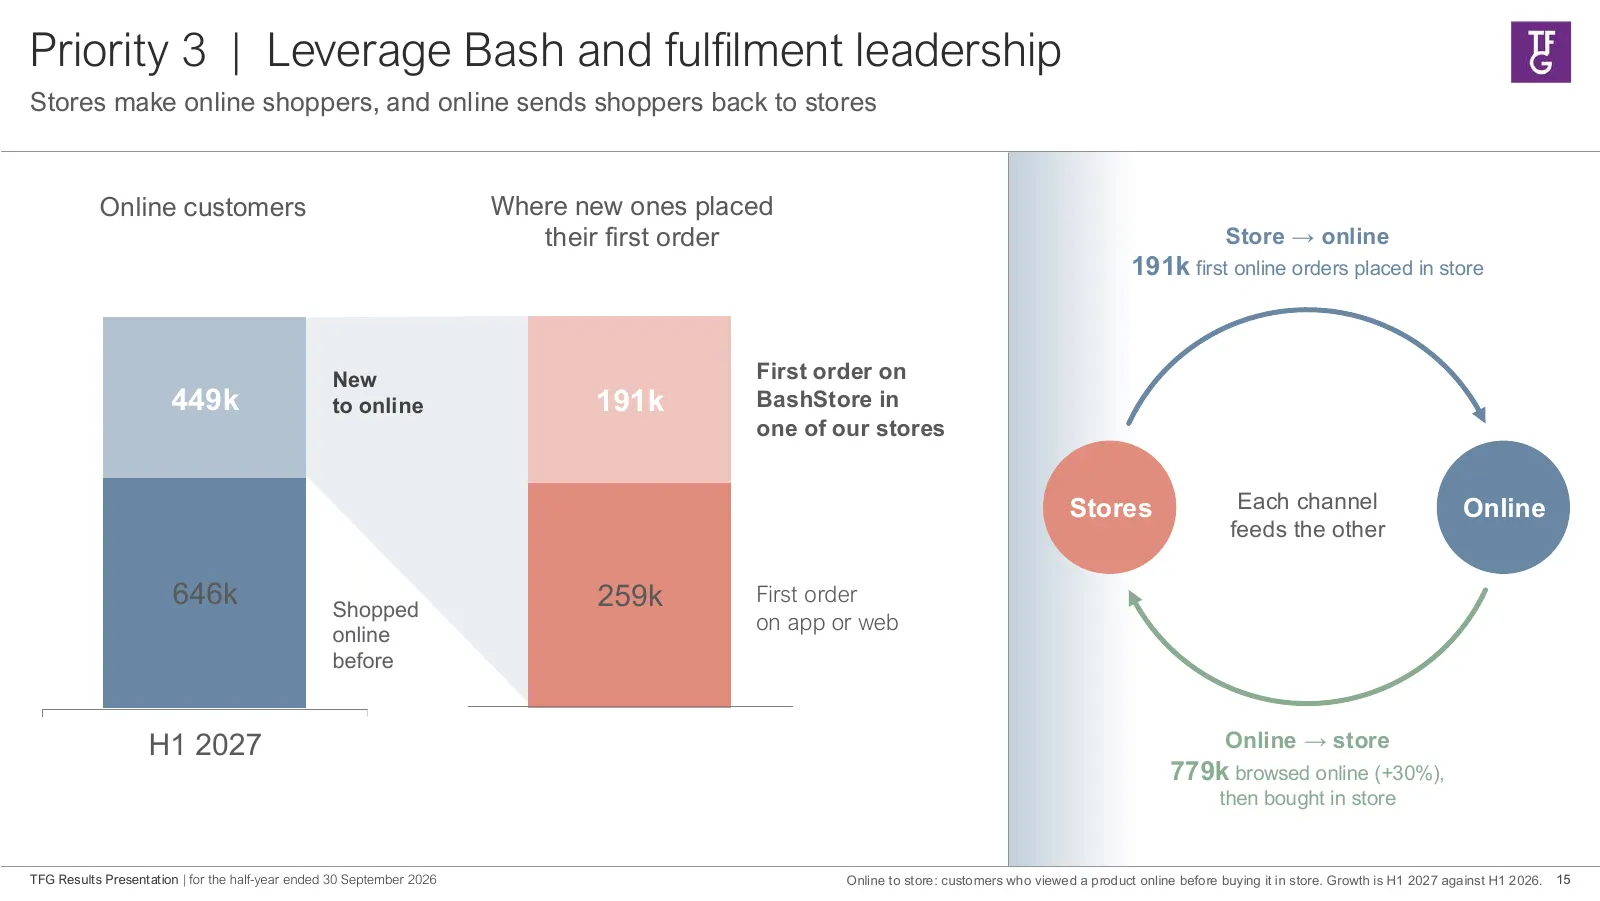
Slide 15: Stores make online shoppers, and online sends shoppers back to stores
Priority 3 | Leverage Bash and fulfilment leadership Stores make online shoppers, and online sends shoppers back to stores Online customers Where new ones placed their first order Store → online 191k first online orders placed in store New First order on 449k to online 191k BashStore in one of our s
Slide 16: International | Half-year performance
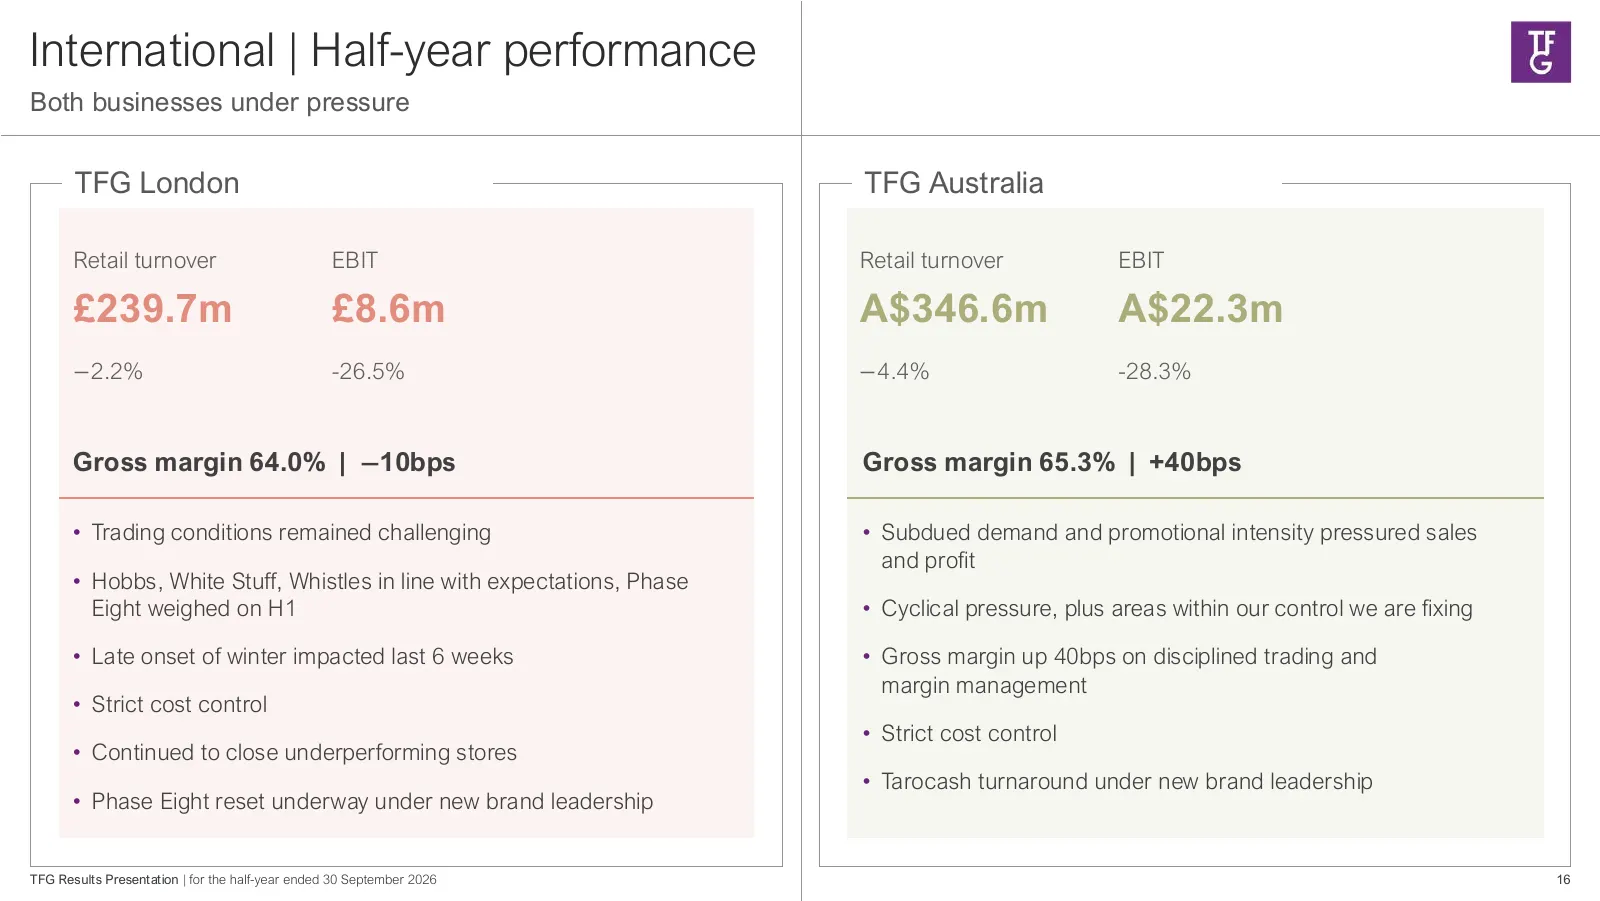
International | Half-year performance Both businesses under pressure TFG London TFG Australia Retail turnover EBIT Retail turnover EBIT £239.7m £8.6m A$346.6m A$22.3m −2.2% -26.5% −4.4% -28.3% Gross margin 64.0% | −10bps Gross margin 65.3% | +40bps • Trading conditions remained challenging • Subdued
Slide 17: International | Fixing what can be fixed whilst retaining optionality
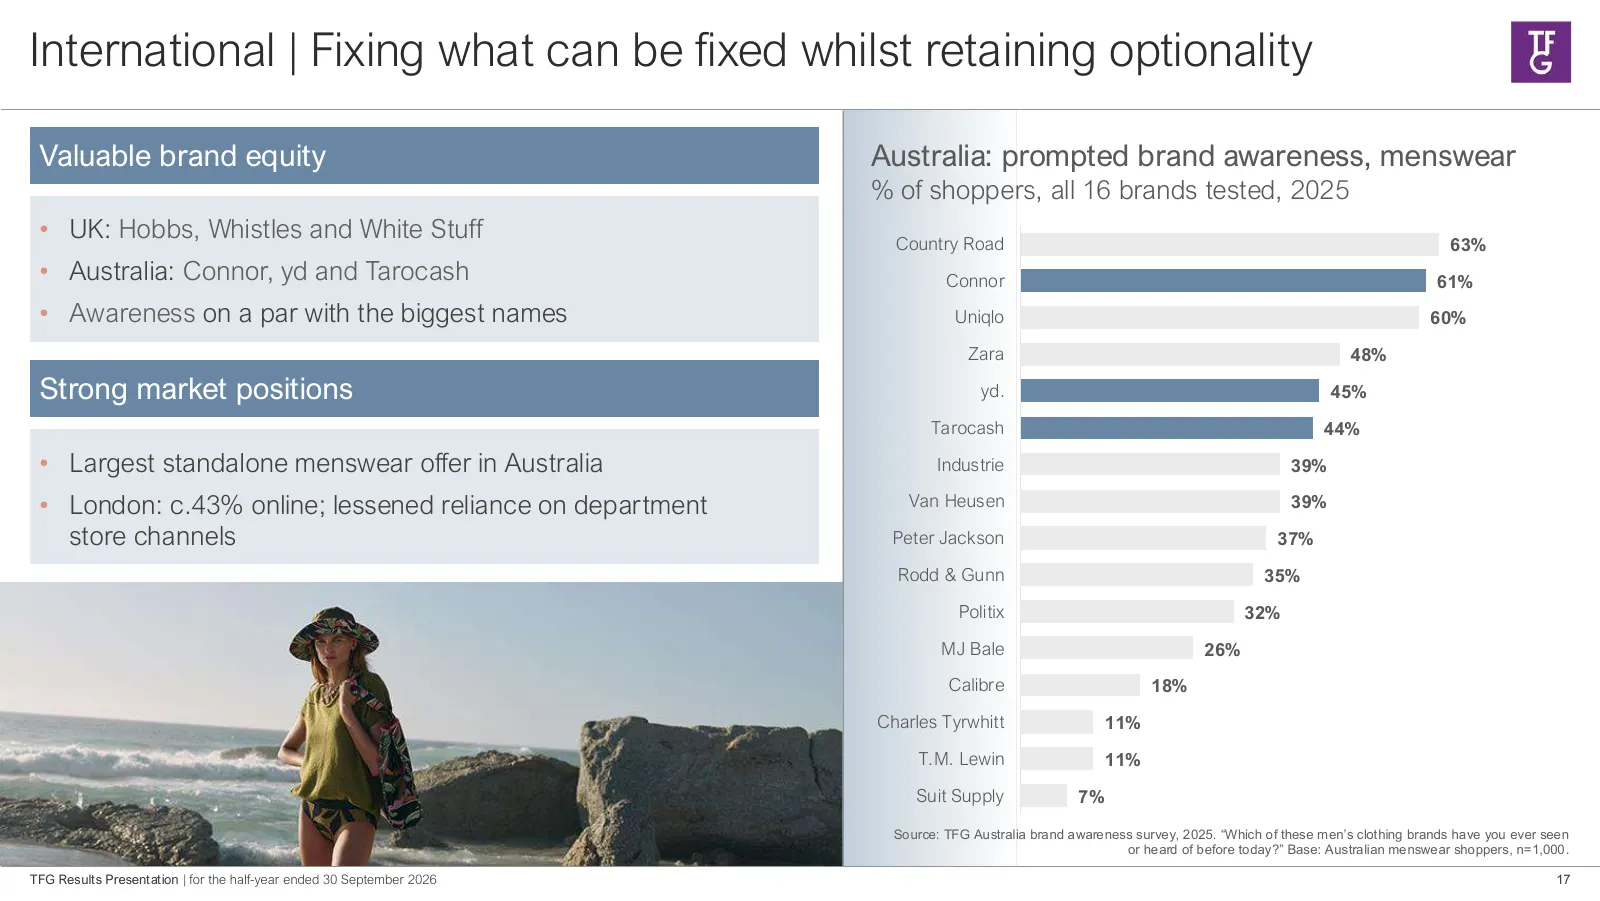
International | Fixing what can be fixed whilst retaining optionality Valuable brand equity Australia: prompted brand awareness, menswear % of shoppers, all 16 brands tested, 2025 • UK: Hobbs, Whistles and White Stuff Country Road 63% • Australia: Connor, yd and Tarocash Connor 61% • Awareness on a
Slide 18: TFG London | Post period-end cyber incident
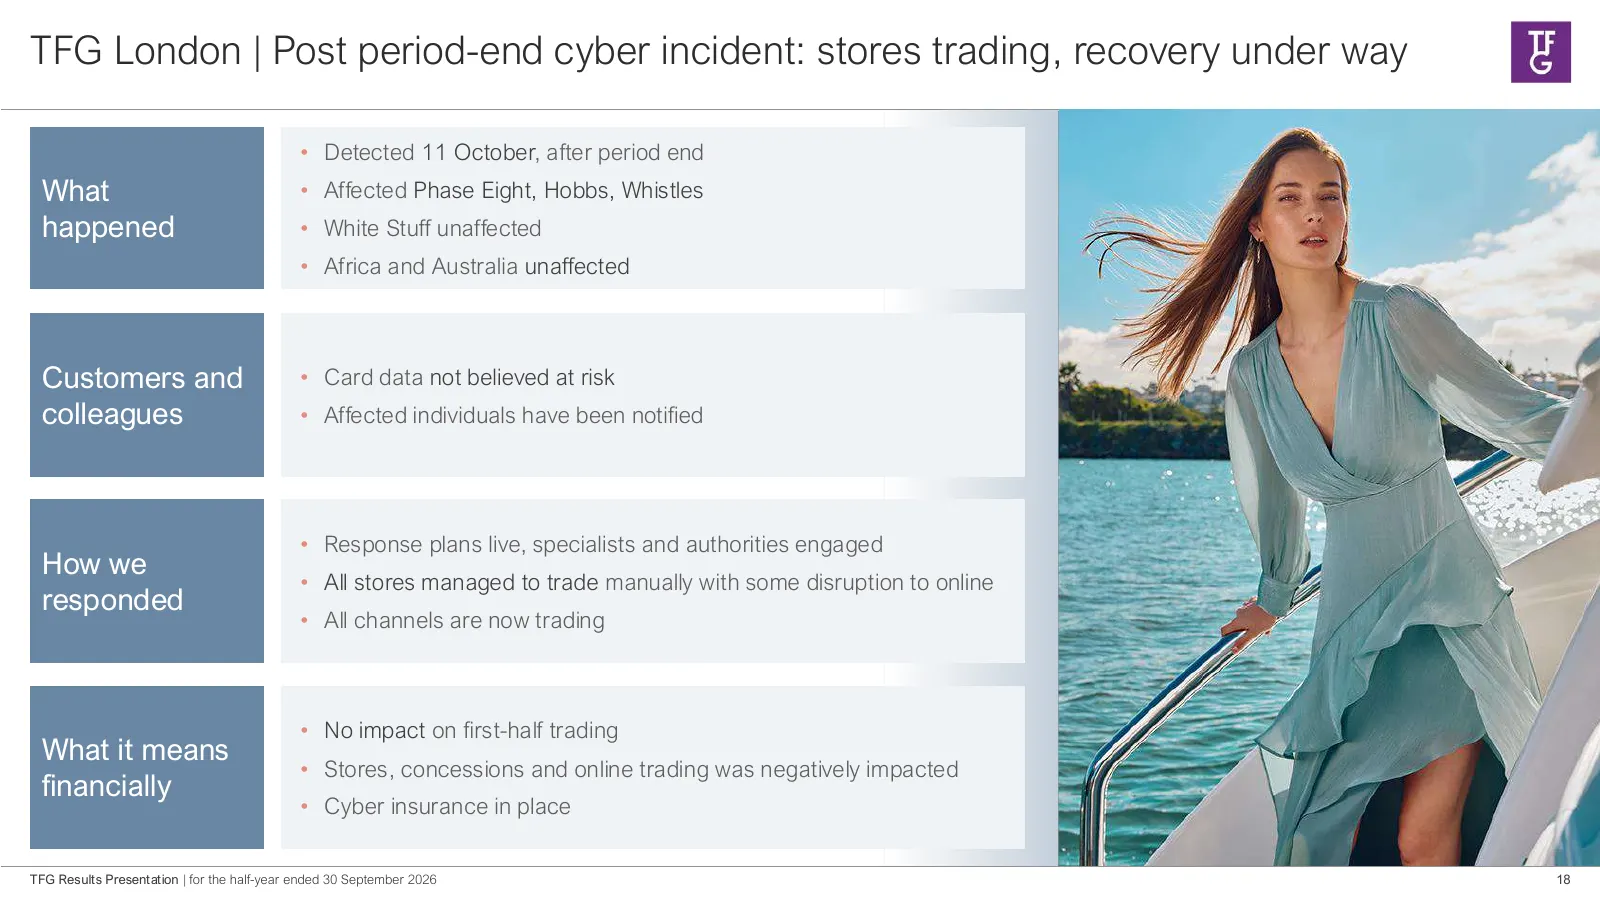
TFG London | Post period-end cyber incident: stores trading, recovery under way • Detected 11 October, after period end What • Affected Phase Eight, Hobbs, Whistles happened • White Stuff unaffected • Africa and Australia unaffected Customers and • Card data not believed at risk colleagues • Affecte
Slide 19: TFG Group Balance sheet | Stronger and more efficient
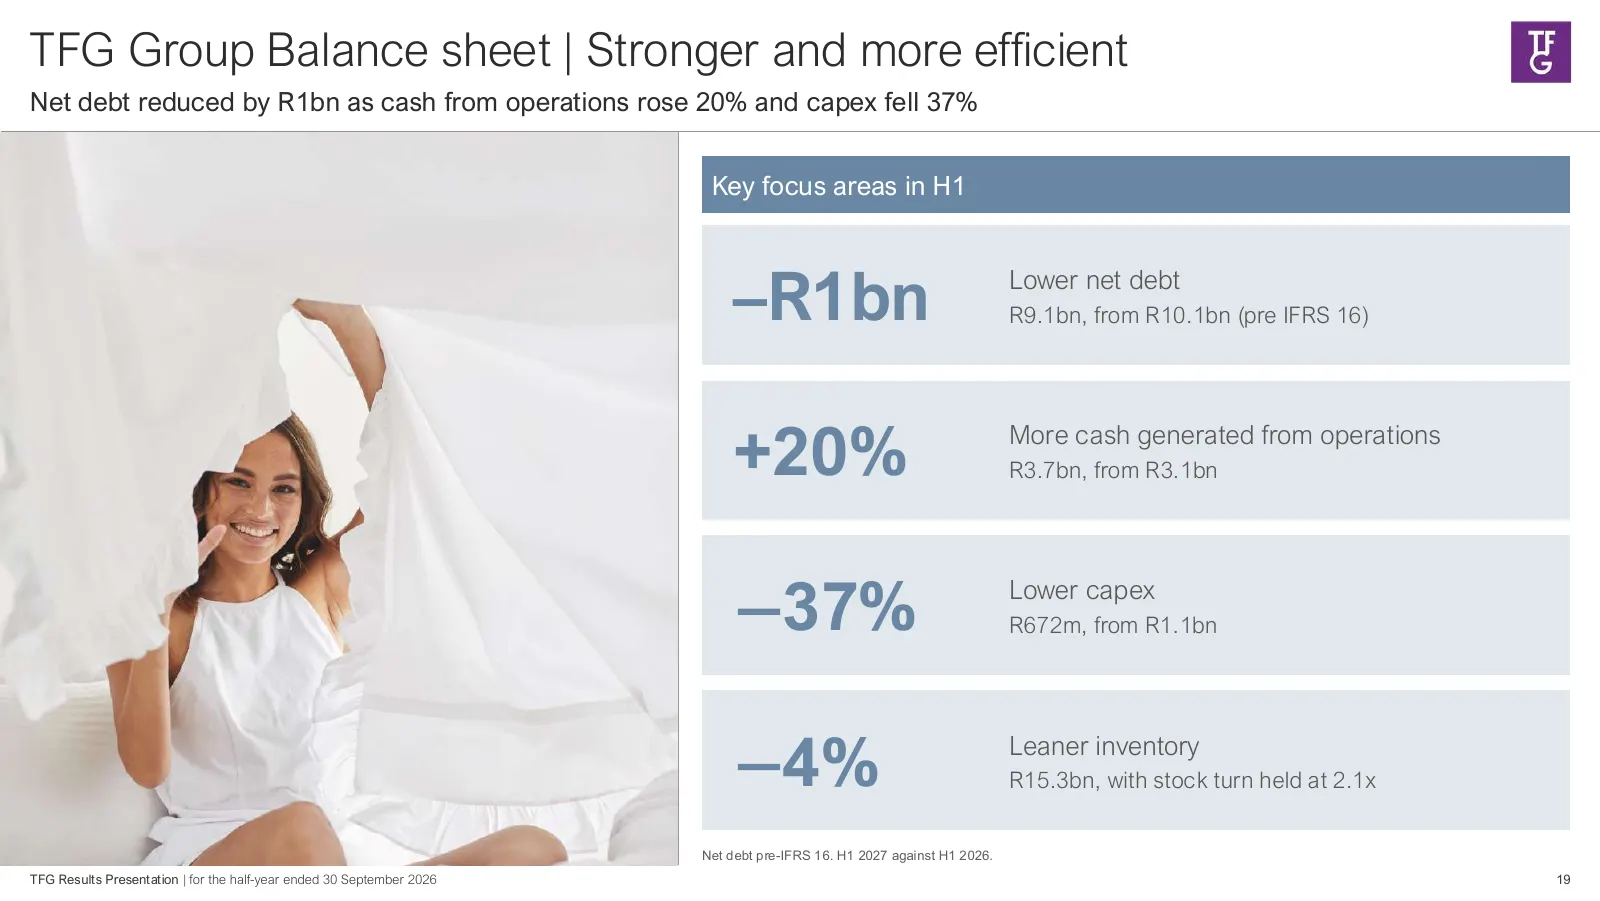
TFG Group Balance sheet | Stronger and more efficient Net debt reduced by R1bn as cash from operations rose 20% and capex fell 37% Key focus areas in H1 –R1bn Lower net debt R9.1bn, from R10.1bn (pre IFRS 16) +20% More cash generated from operations R3.7bn, from R3.1bn Lower capex −37% R672m, from R

Slide 20: Group Financial Review
02 Group Ralph Buddle Group CFO Financial Review 20
Slide 21: Group | Context
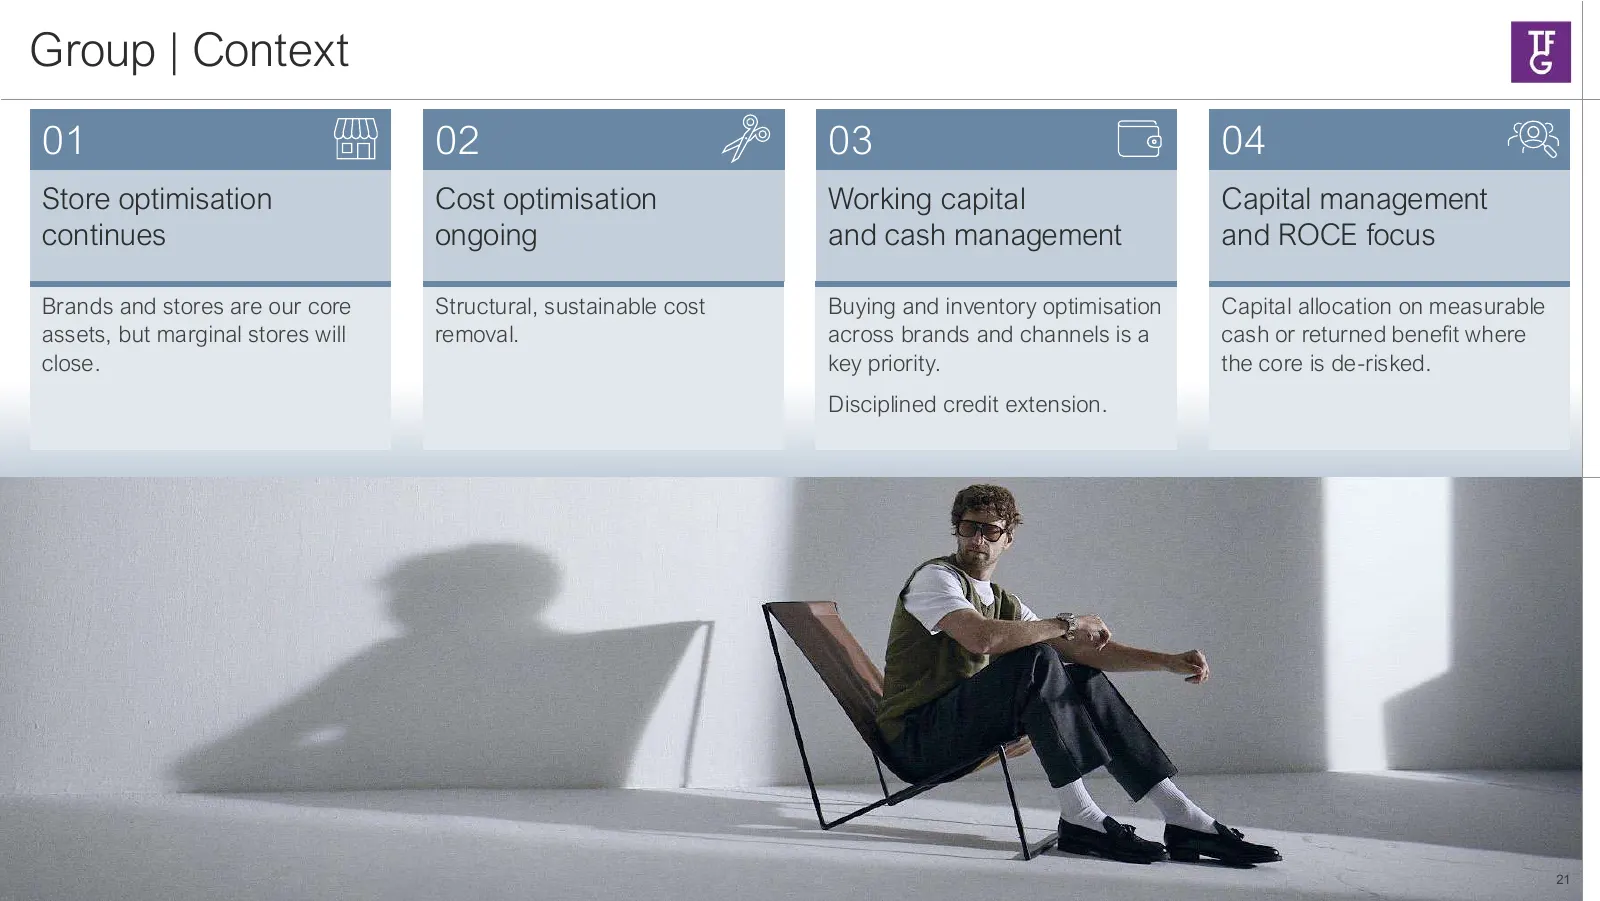
Group | Context 01 02 03 04 Store optimisation Cost optimisation Working capital Capital management continues ongoing and cash management and ROCE focus Brands and stores are our core Structural, sustainable cost Buying and inventory optimisation Capital allocation on measurable assets, but marginal
Slide 22: Group | Key metrics
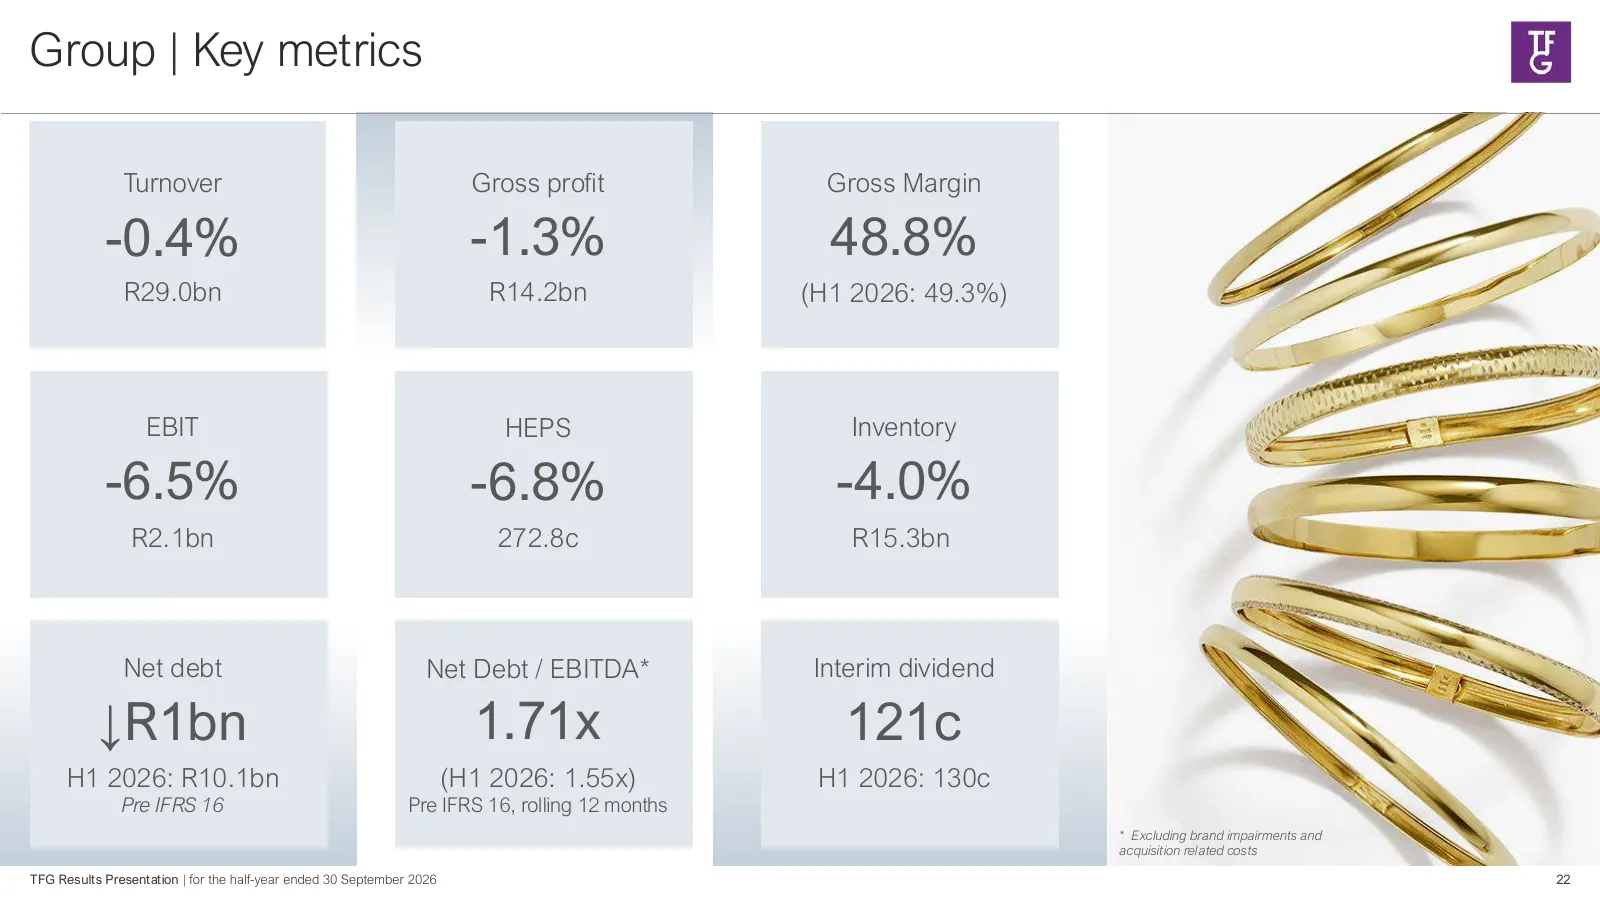
Group | Key metrics Turnover Gross profit Gross Margin -0.4% -1.3% 48.8% R29.0bn R14.2bn (H1 2026: 49.3%) EBIT HEPS Inventory -6.5% -6.8% -4.0% R2.1bn 272.8c R15.3bn Net debt Net Debt / EBITDA* Interim dividend ↓R1bn 1.71x 121c H1 2026: R10.1bn (H1 2026: 1.55x) H1 2026: 130c Pre IFRS 16 Pre IFRS 16,
Slide 23: TFG Group | Performance
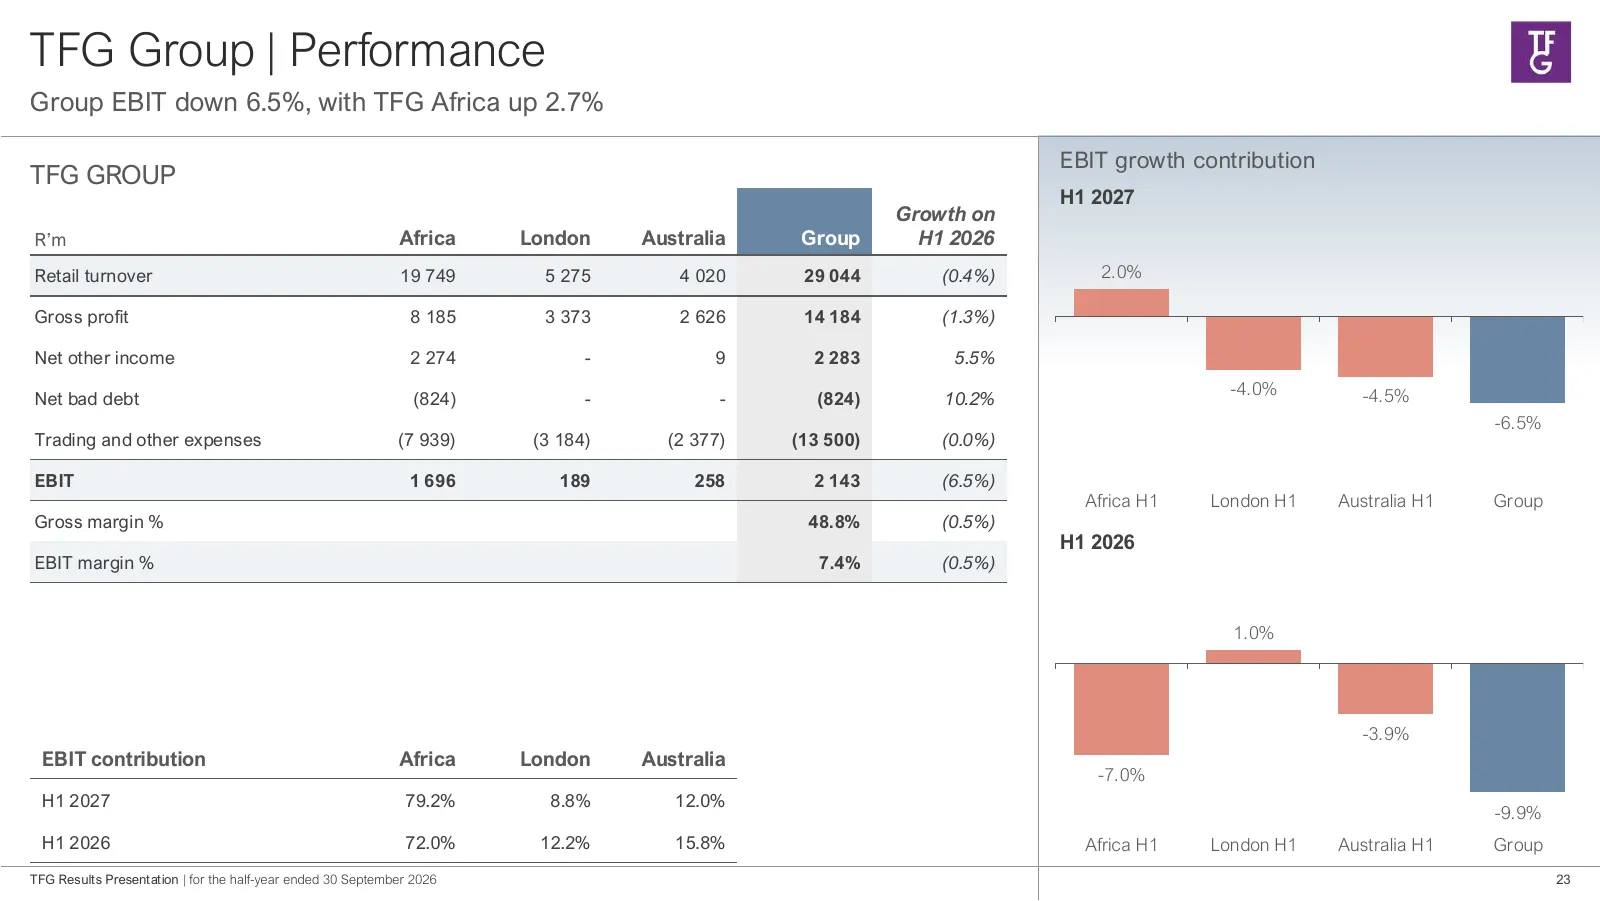
TFG Group | Performance Group EBIT down 6.5%, with TFG Africa up 2.7% EBIT growth contribution TFG GROUP H1 2027 Growth on R’m Africa London Australia Group H1 2026 Retail turnover 19 749 5 275 4 020 29 044 (0.4%) 2.0% Gross profit 8 185 3 373 2 626 14 184 (1.3%) Net other income 2 274 - 9 2 283 5.5
Slide 24: Group | Segment performance
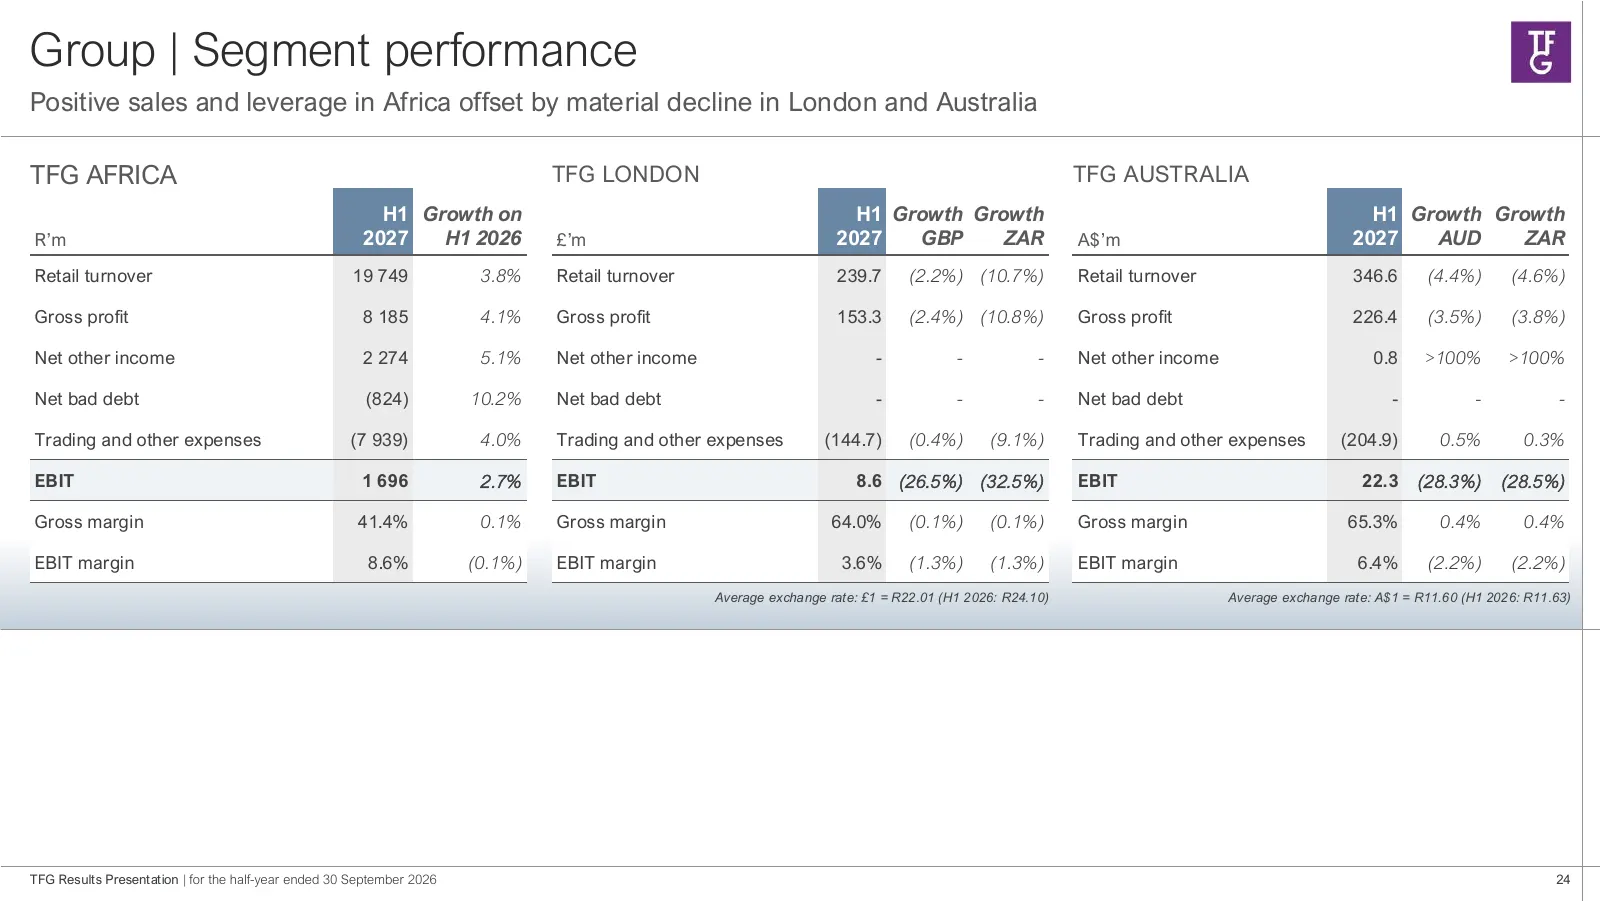
Group | Segment performance Positive sales and leverage in Africa offset by material decline in London and Australia TFG AFRICA TFG LONDON TFG AUSTRALIA H1 Growth on H1 Growth Growth H1 Growth Growth R’m 2027 H1 2026 £’m 2027 GBP ZAR A$’m 2027 AUD ZAR Retail turnover 19 749 3.8% Retail turnover 239.
Slide 25: TFG Africa | Sales growth
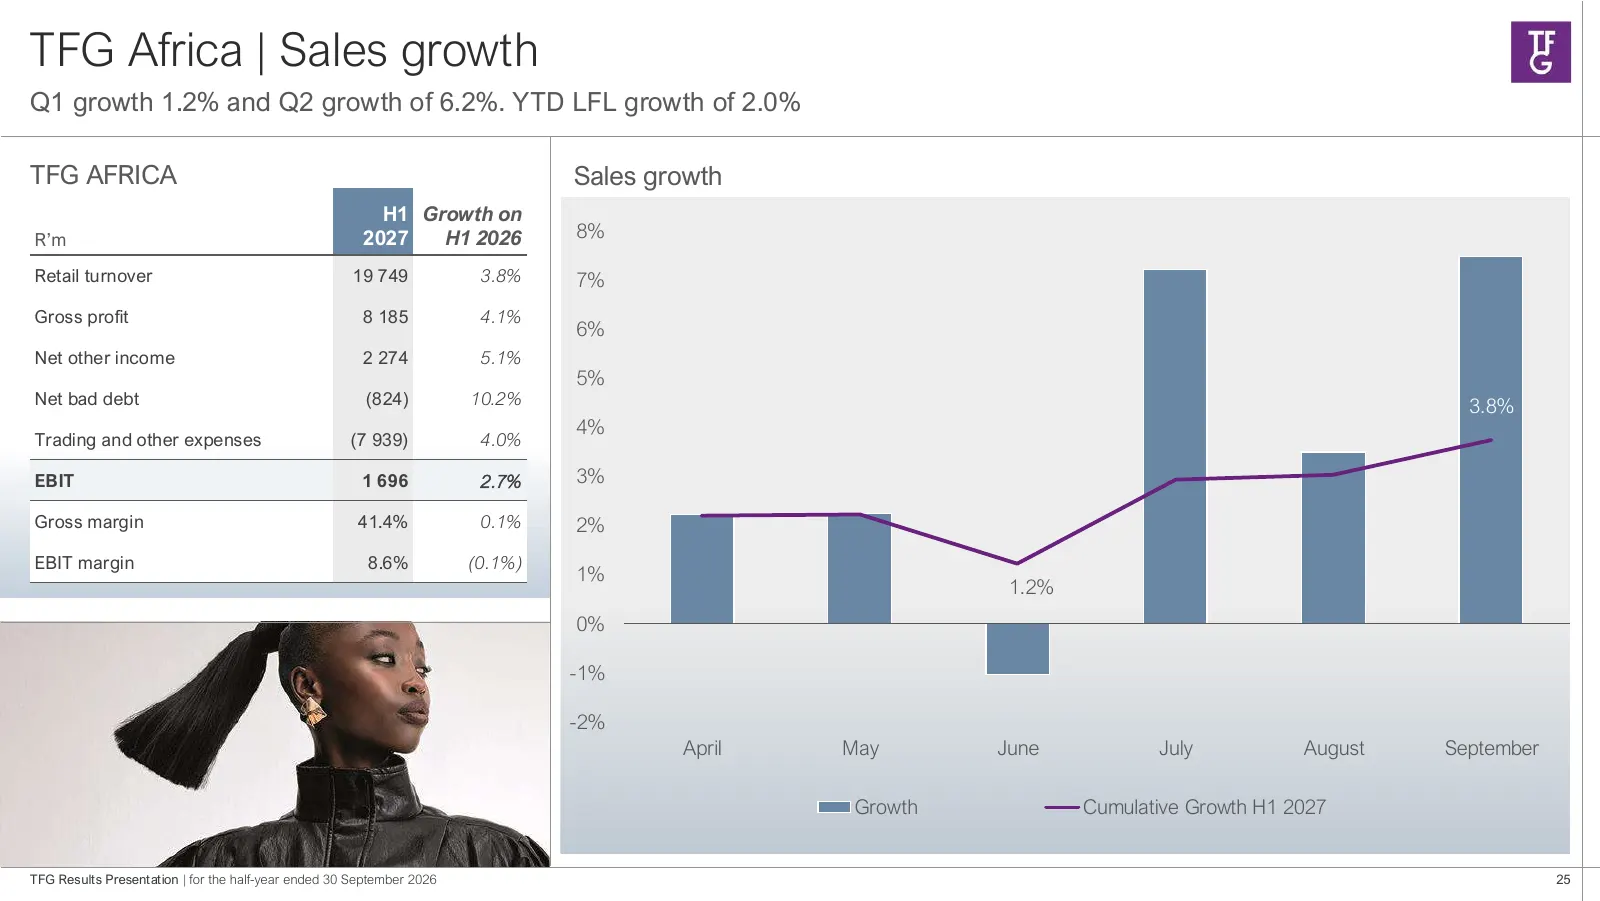
TFG Africa | Sales growth Q1 growth 1.2% and Q2 growth of 6.2%. YTD LFL growth of 2.0% TFG AFRICA Sales growth H1 Growth on R’m 2027 H1 2026 8% Retail turnover 19 749 3.8% 7% Gross profit 8 185 4.1% 6% Net other income 2 274 5.1% 5% Net bad debt (824) 10.2% 3.8% 4% Trading and other expenses (7 939)
Slide 26: TFG Africa | Performance
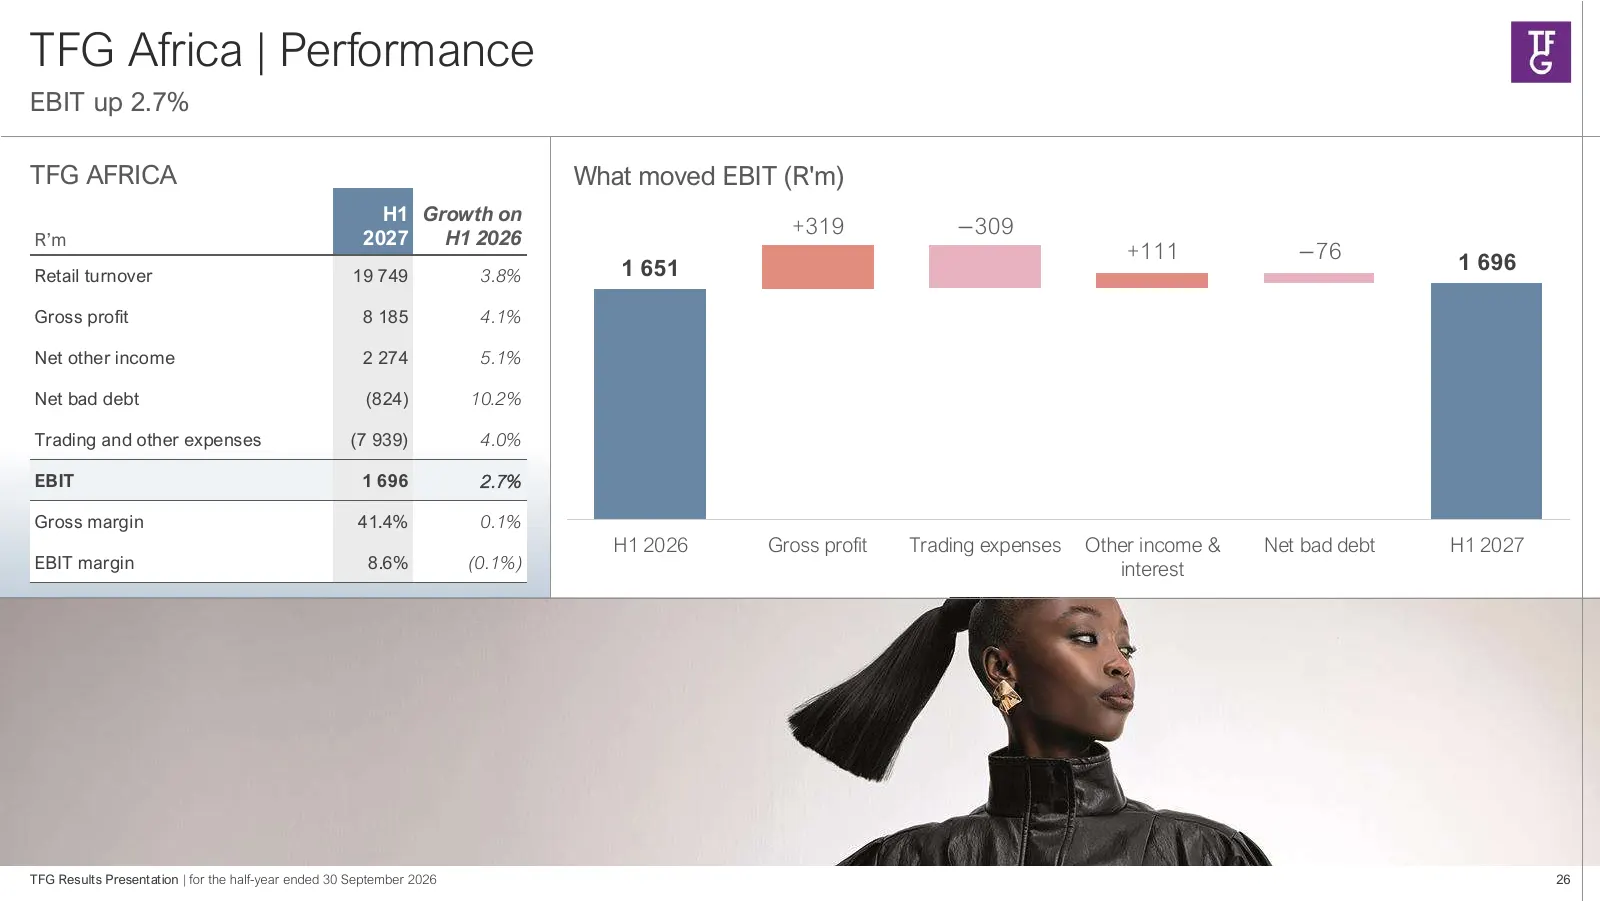
TFG Africa | Performance EBIT up 2.7% TFG AFRICA What moved EBIT (R'm) H1 Growth on +319 −309 R’m 2027 H1 2026 +111 −76 1 696 Retail turnover 19 749 3.8% 1 651 Gross profit 8 185 4.1% Net other income 2 274 5.1% Net bad debt (824) 10.2% Trading and other expenses (7 939) 4.0% EBIT 1 696 2.7% Gross m
Slide 27: TFG Africa | Performance – Total Retail
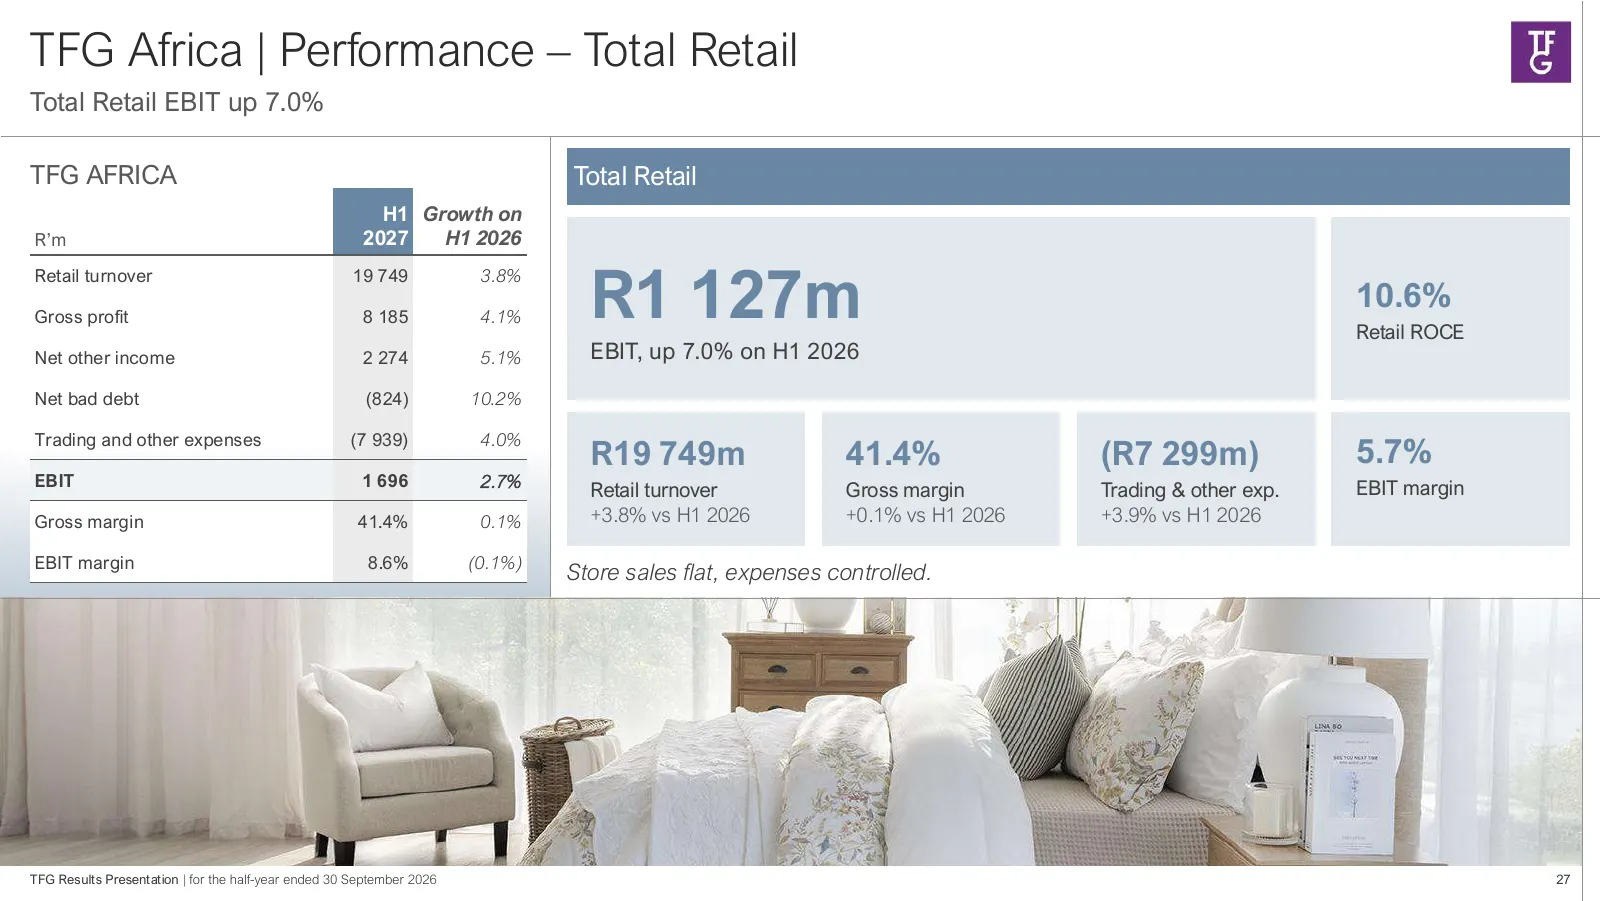
TFG Africa | Performance – Total Retail Total Retail EBIT up 7.0% TFG AFRICA Total Retail H1 Growth on R’m 2027 H1 2026 R1 127m Retail turnover 19 749 3.8% 10.6% Gross profit 8 185 4.1% Retail ROCE Net other income 2 274 5.1% EBIT, up 7.0% on H1 2026 Net bad debt (824) 10.2% Trading and other expens
Slide 28: TFG Africa | Performance - Online
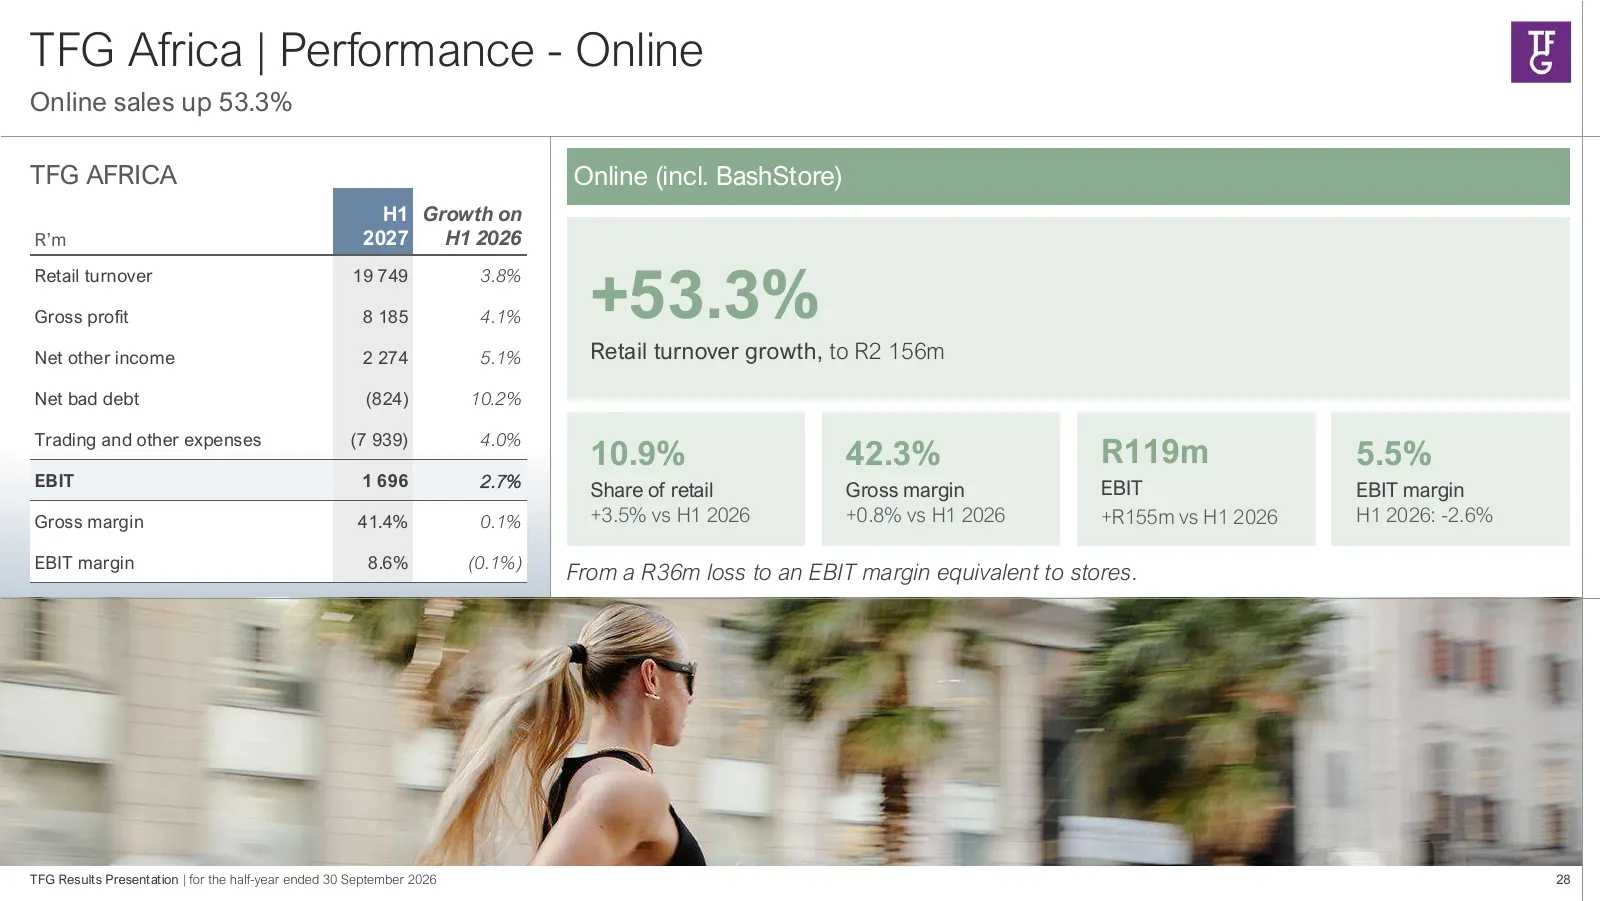
TFG Africa | Performance - Online Online sales up 53.3% TFG AFRICA Online (incl. BashStore) H1 Growth on R’m 2027 H1 2026 +53.3% Retail turnover 19 749 3.8% Gross profit 8 185 4.1% Net other income 2 274 5.1% Retail turnover growth, to R2 156m Net bad debt (824) 10.2% Trading and other expenses (7 9
Slide 29: TFG Africa | Performance - Financial Services
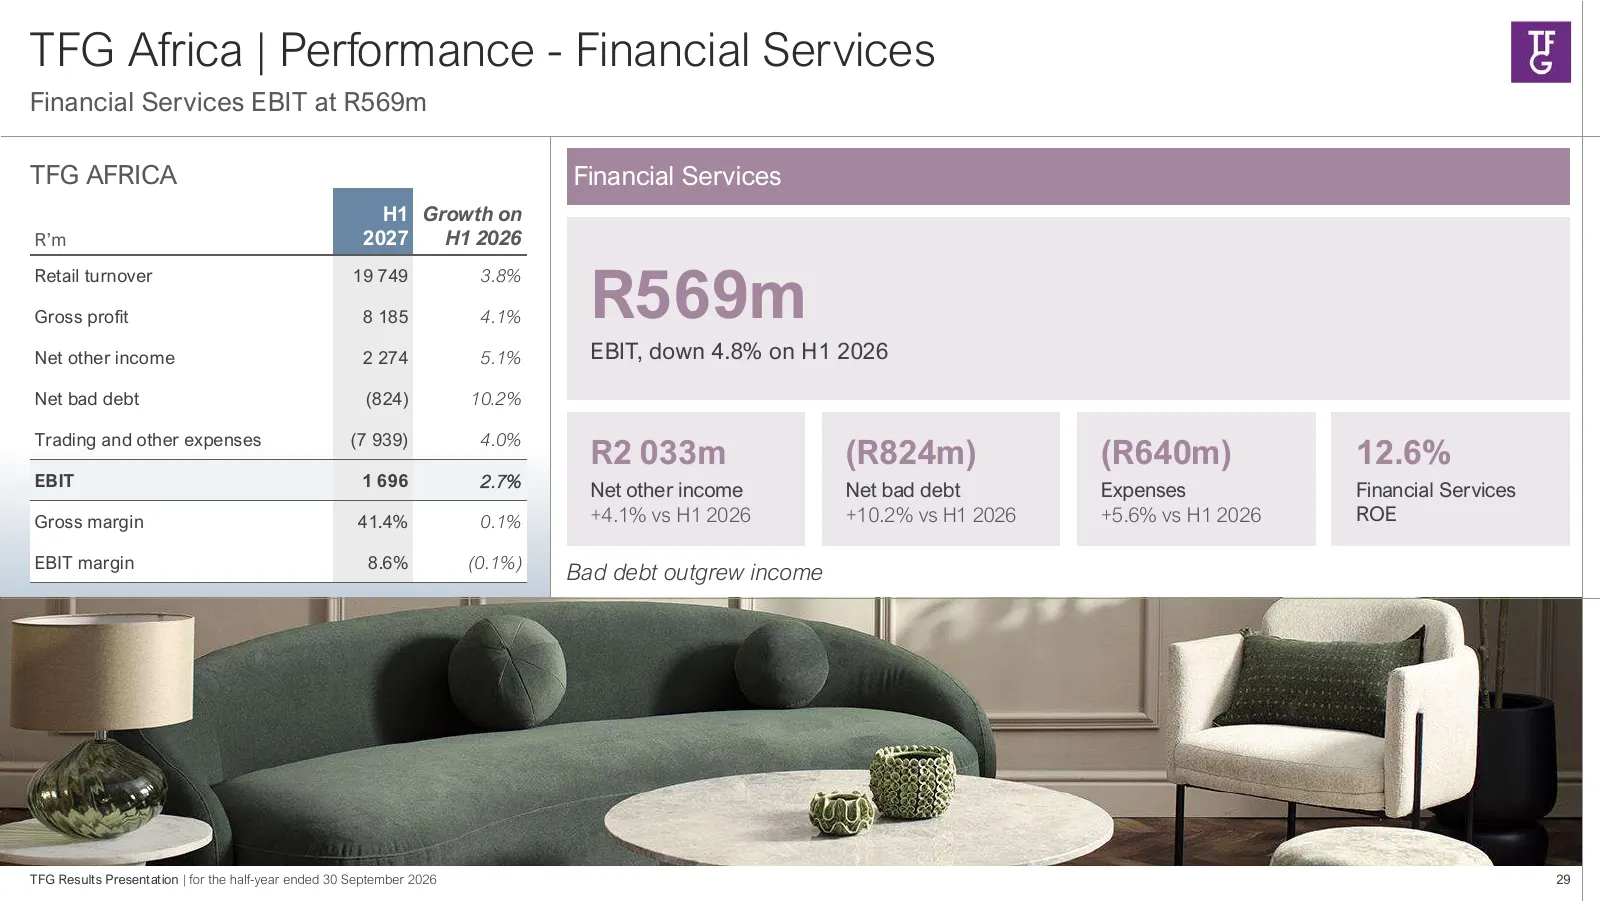
TFG Africa | Performance - Financial Services Financial Services EBIT at R569m TFG AFRICA Financial Services H1 Growth on R’m 2027 H1 2026 R569m Retail turnover 19 749 3.8% Gross profit 8 185 4.1% Net other income 2 274 5.1% EBIT, down 4.8% on H1 2026 Net bad debt (824) 10.2% Trading and other expen
Slide 30: TFG Africa | Trading and other expenses
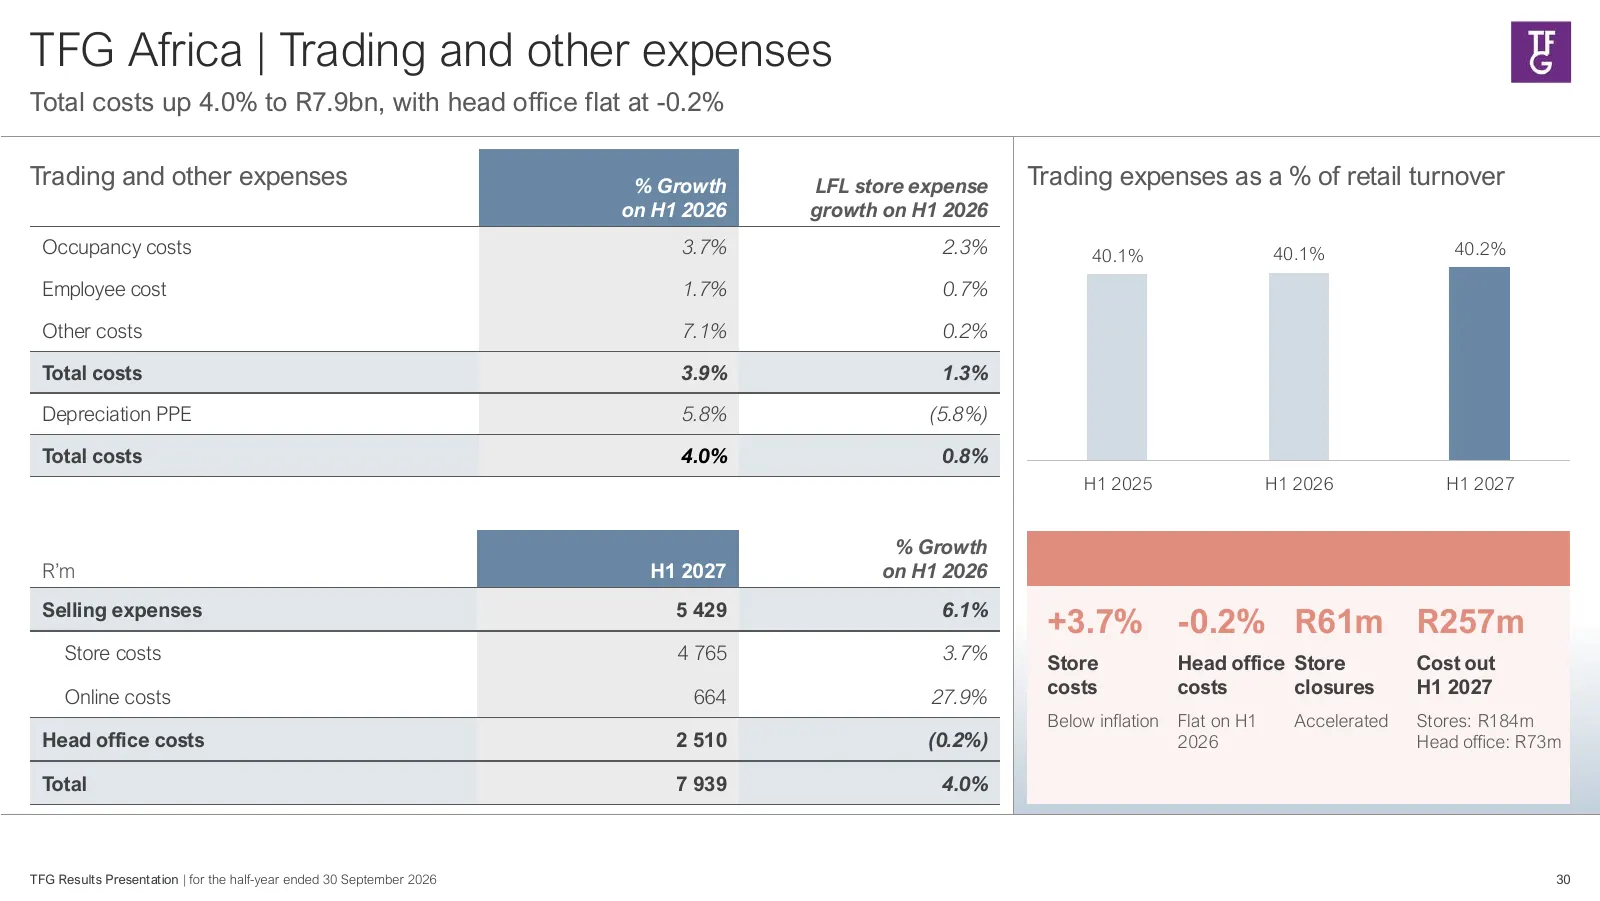
TFG Africa | Trading and other expenses Total costs up 4.0% to R7.9bn, with head office flat at -0.2% Trading and other expenses % Growth LFL store expense Trading expenses as a % of retail turnover on H1 2026 growth on H1 2026 Occupancy costs 3.7% 2.3% 40.1% 40.1% 40.2% Employee cost 1.7% 0.7% Othe
Slide 31: TFG London | Sales growth
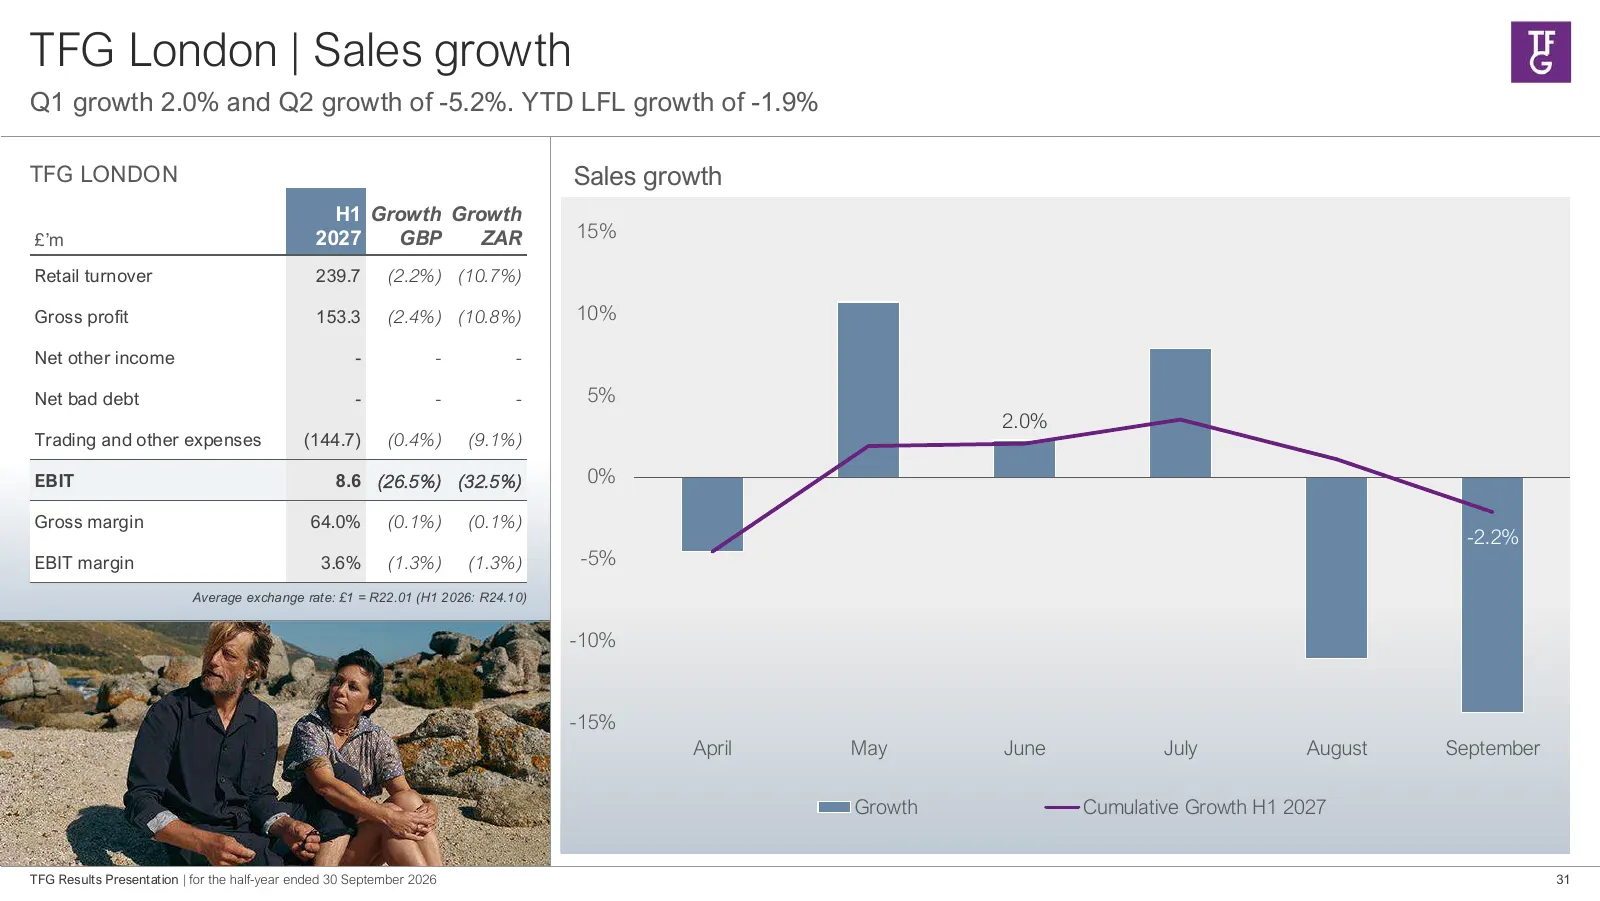
TFG London | Sales growth Q1 growth 2.0% and Q2 growth of -5.2%. YTD LFL growth of -1.9% TFG LONDON Sales growth H1 Growth Growth £’m 2027 GBP ZAR 15% Retail turnover 239.7 (2.2%) (10.7%) Gross profit 153.3 (2.4%) (10.8%) 10% Net other income - - - Net bad debt - - - 5% 2.0% Trading and other expens
Slide 32: TFG London | Performance
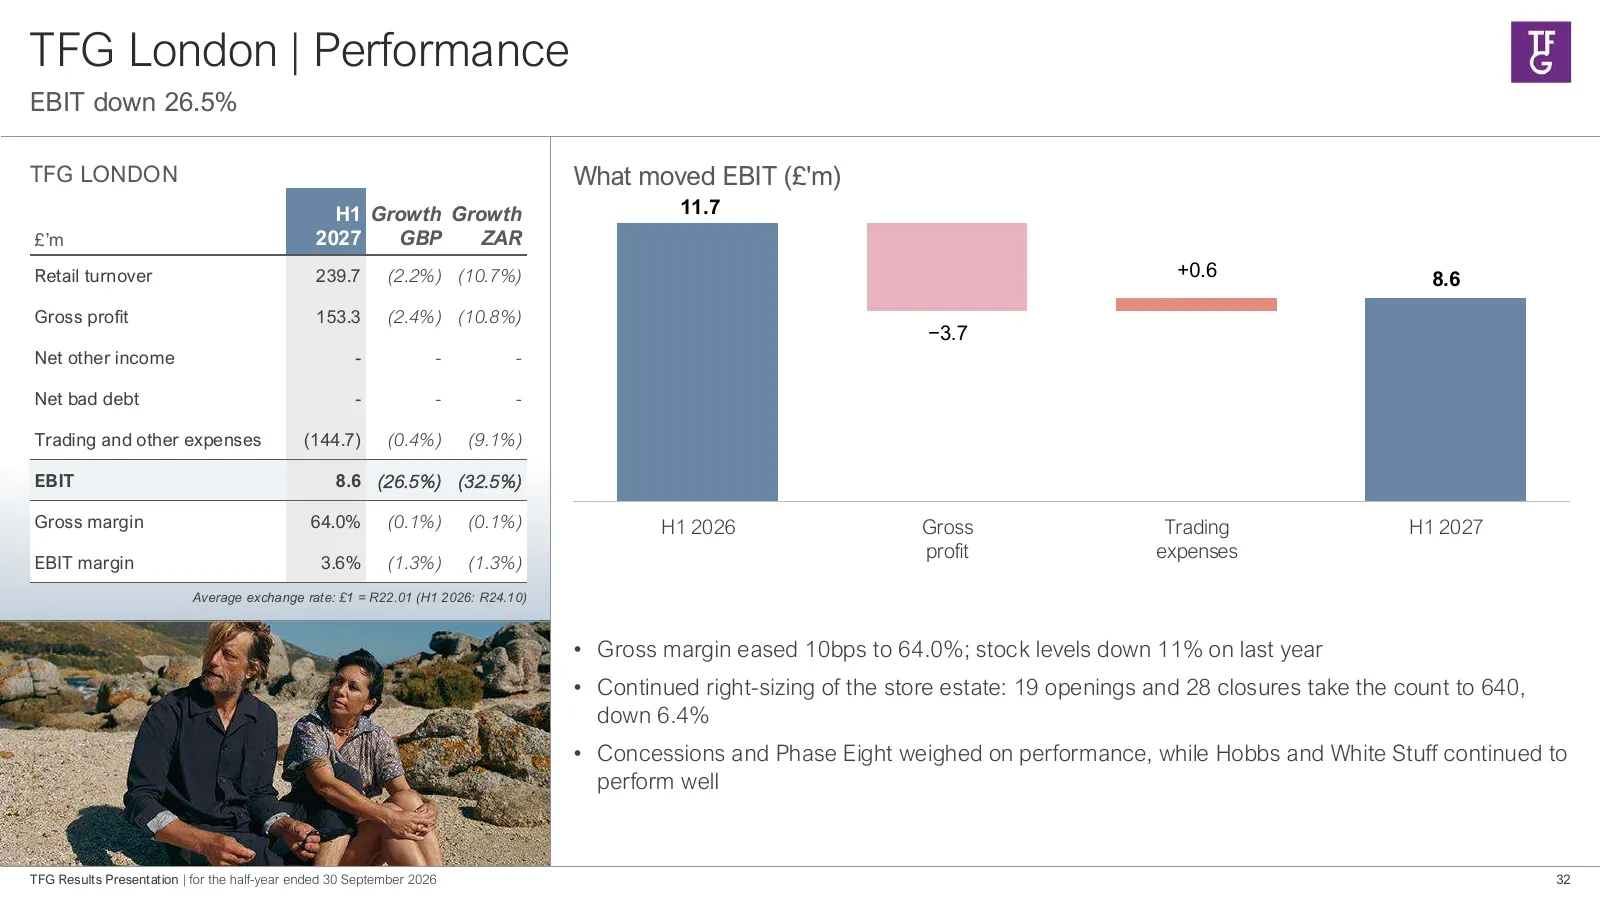
TFG London | Performance EBIT down 26.5% TFG LONDON What moved EBIT (£'m) H1 Growth Growth 11.7 £’m 2027 GBP ZAR Retail turnover 239.7 (2.2%) (10.7%) +0.6 8.6 Gross profit 153.3 (2.4%) (10.8%) −3.7 Net other income - - - Net bad debt - - - Trading and other expenses (144.7) (0.4%) (9.1%) EBIT 8.6 (2
Slide 33: TFG Australia | Sales growth
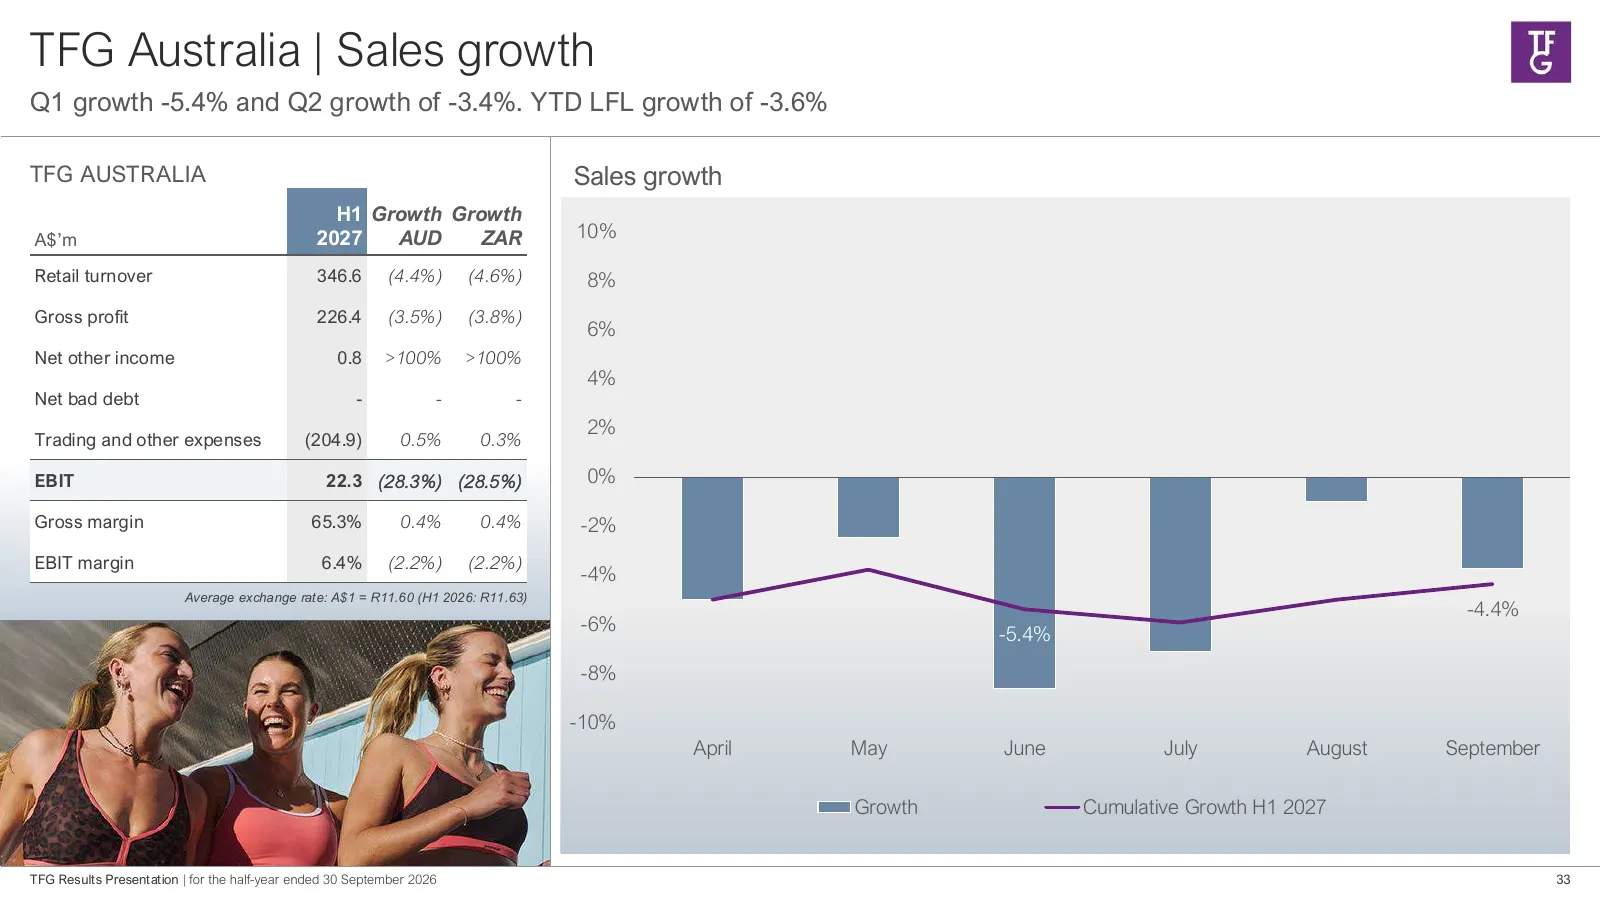
TFG Australia | Sales growth Q1 growth -5.4% and Q2 growth of -3.4%. YTD LFL growth of -3.6% TFG AUSTRALIA Sales growth H1 Growth Growth A$’m 2027 AUD ZAR 10% Retail turnover 346.6 (4.4%) (4.6%) 8% Gross profit 226.4 (3.5%) (3.8%) 6% Net other income 0.8 >100% >100% 4% Net bad debt - - - 2% Trading
Slide 34: TFG Australia | Performance
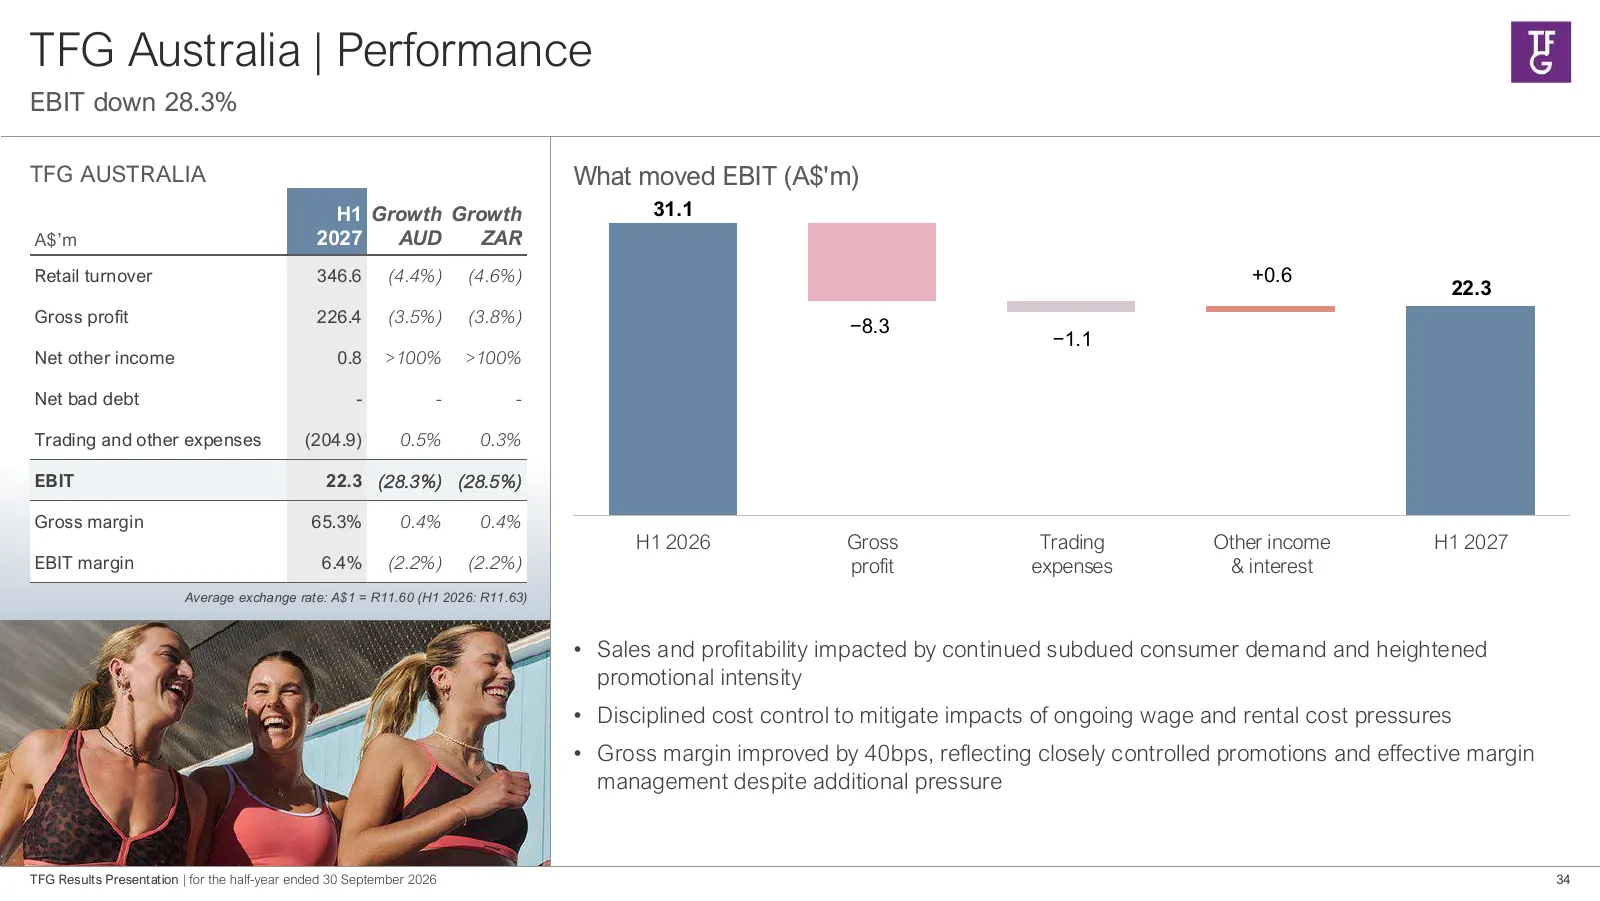
TFG Australia | Performance EBIT down 28.3% TFG AUSTRALIA What moved EBIT (A$'m) H1 Growth Growth 31.1 A$’m 2027 AUD ZAR Retail turnover 346.6 (4.4%) (4.6%) +0.6 22.3 Gross profit 226.4 (3.5%) (3.8%) −8.3 −1.1 Net other income 0.8 >100% >100% Net bad debt - - - Trading and other expenses (204.9) 0.5
Slide 35: Group | Cash Flow
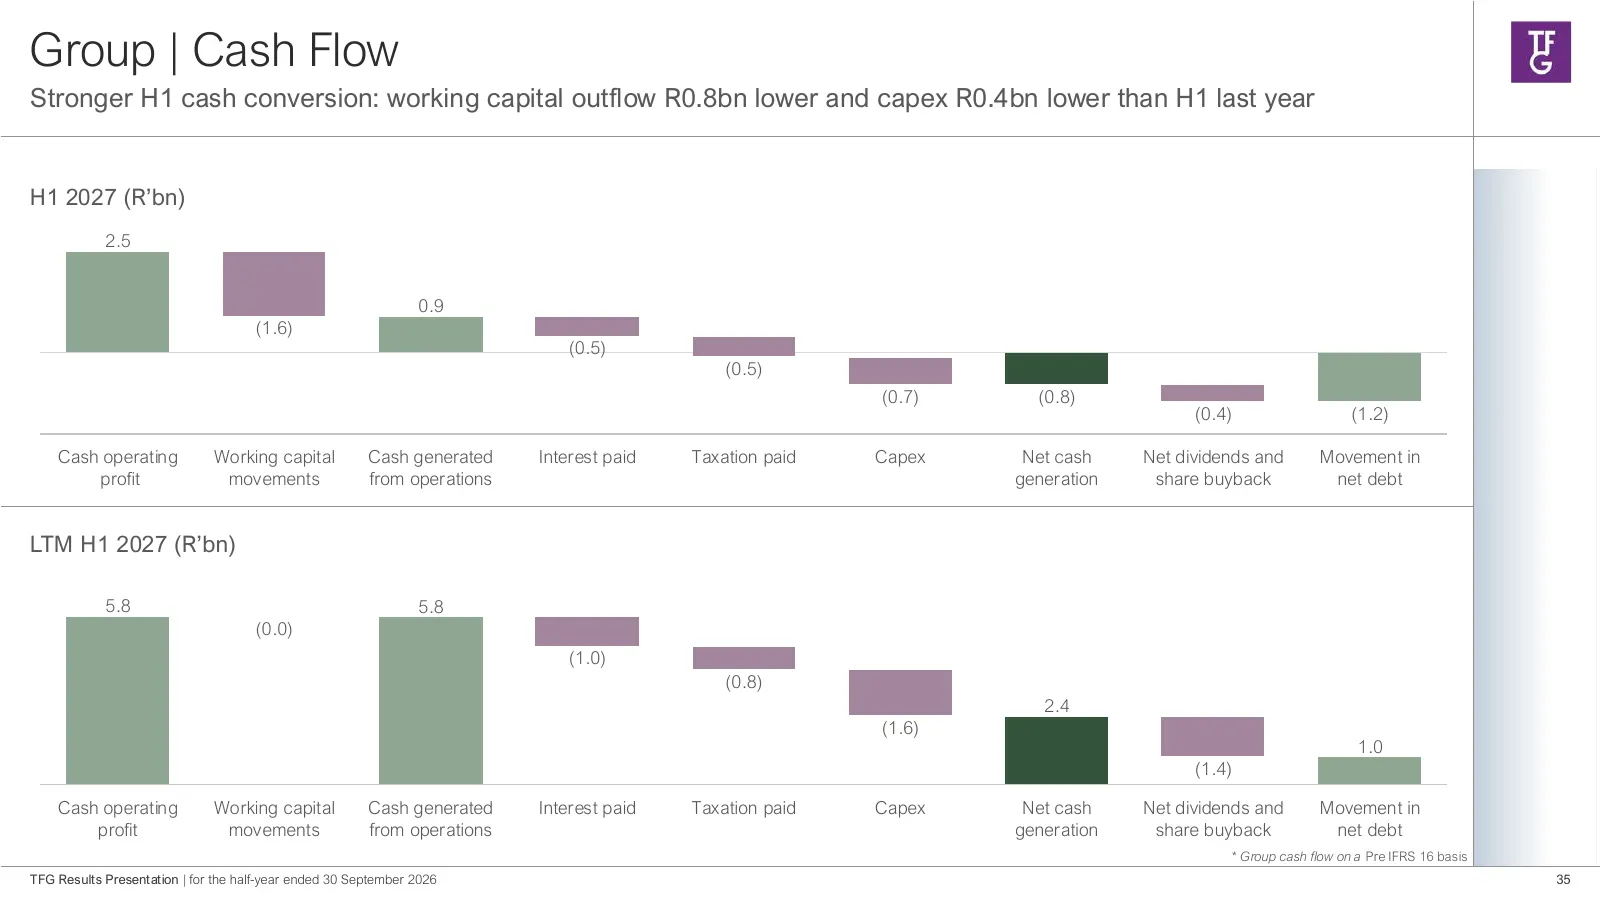
Group | Cash Flow Stronger H1 cash conversion: working capital outflow R0.8bn lower and capex R0.4bn lower than H1 last year H1 2027 (R’bn) 2.5 0.9 (1.6) (0.5) (0.5) (0.7) (0.8) (0.4) (1.2) Cash operating Working capital Cash generated Interest paid Taxation paid Capex Net cash Net dividends and Mov
Slide 36: Group | Net debt
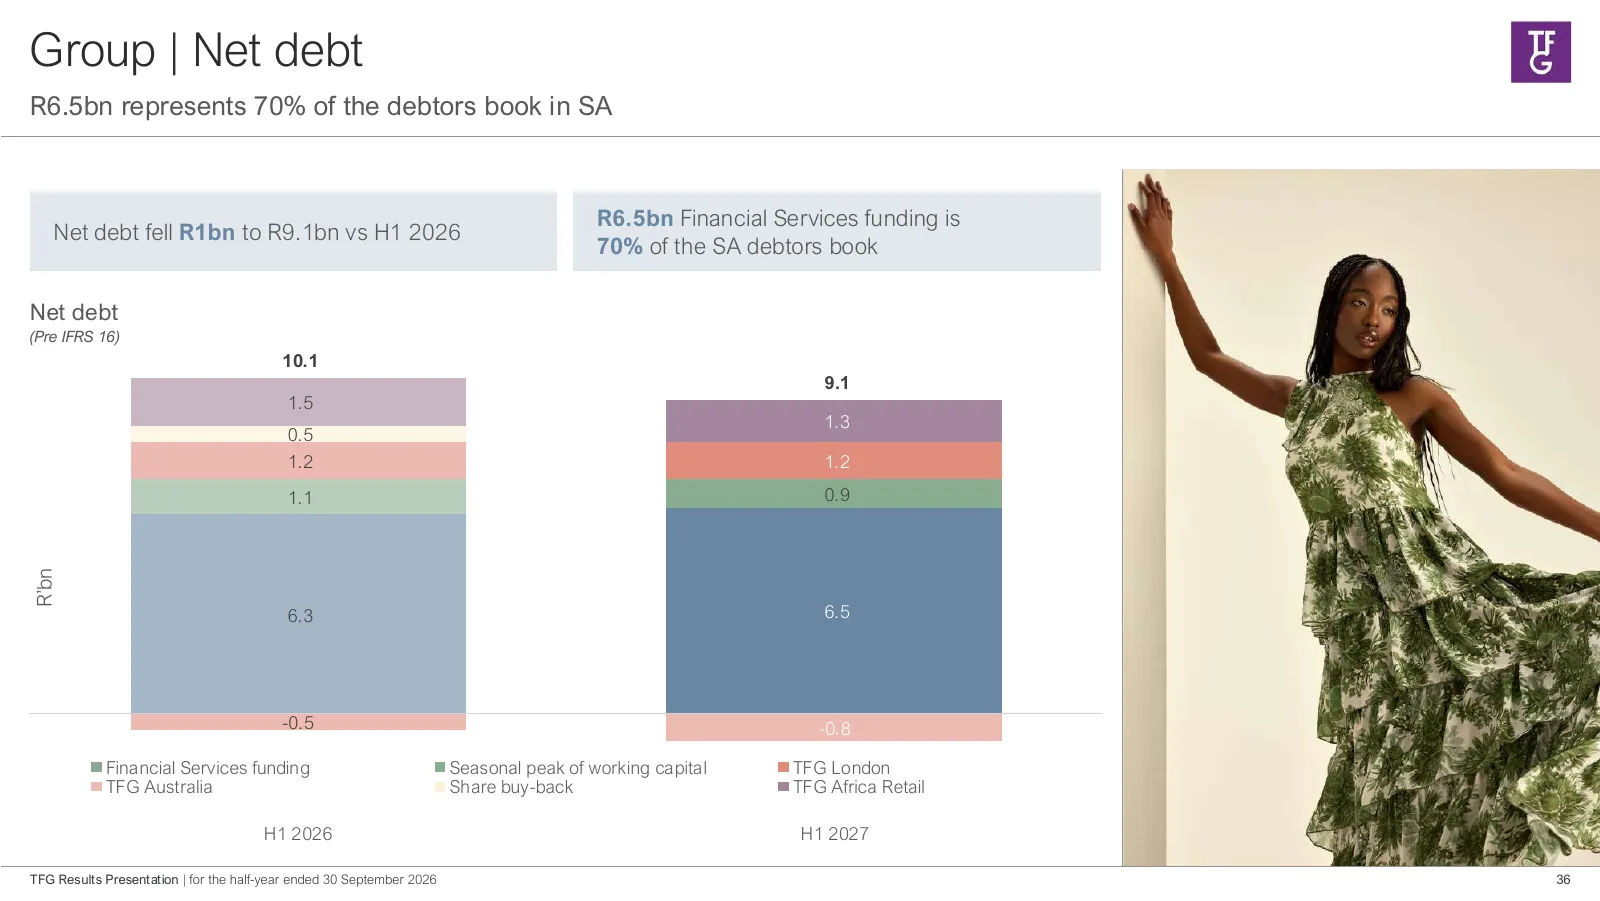
Group | Net debt R6.5bn represents 70% of the debtors book in SA R6.5bn Financial Services funding is Net debt fell R1bn to R9.1bn vs H1 2026 70% of the SA debtors book Net debt (Pre IFRS 16) 10.1 9.1 1.5 1.3 0.5 1.2 1.2 1.1 0.9 R’bn 6.3 6.5 -0.5 -0.8 Financial Services funding Seasonal peak of work
Slide 37: Group | Capex
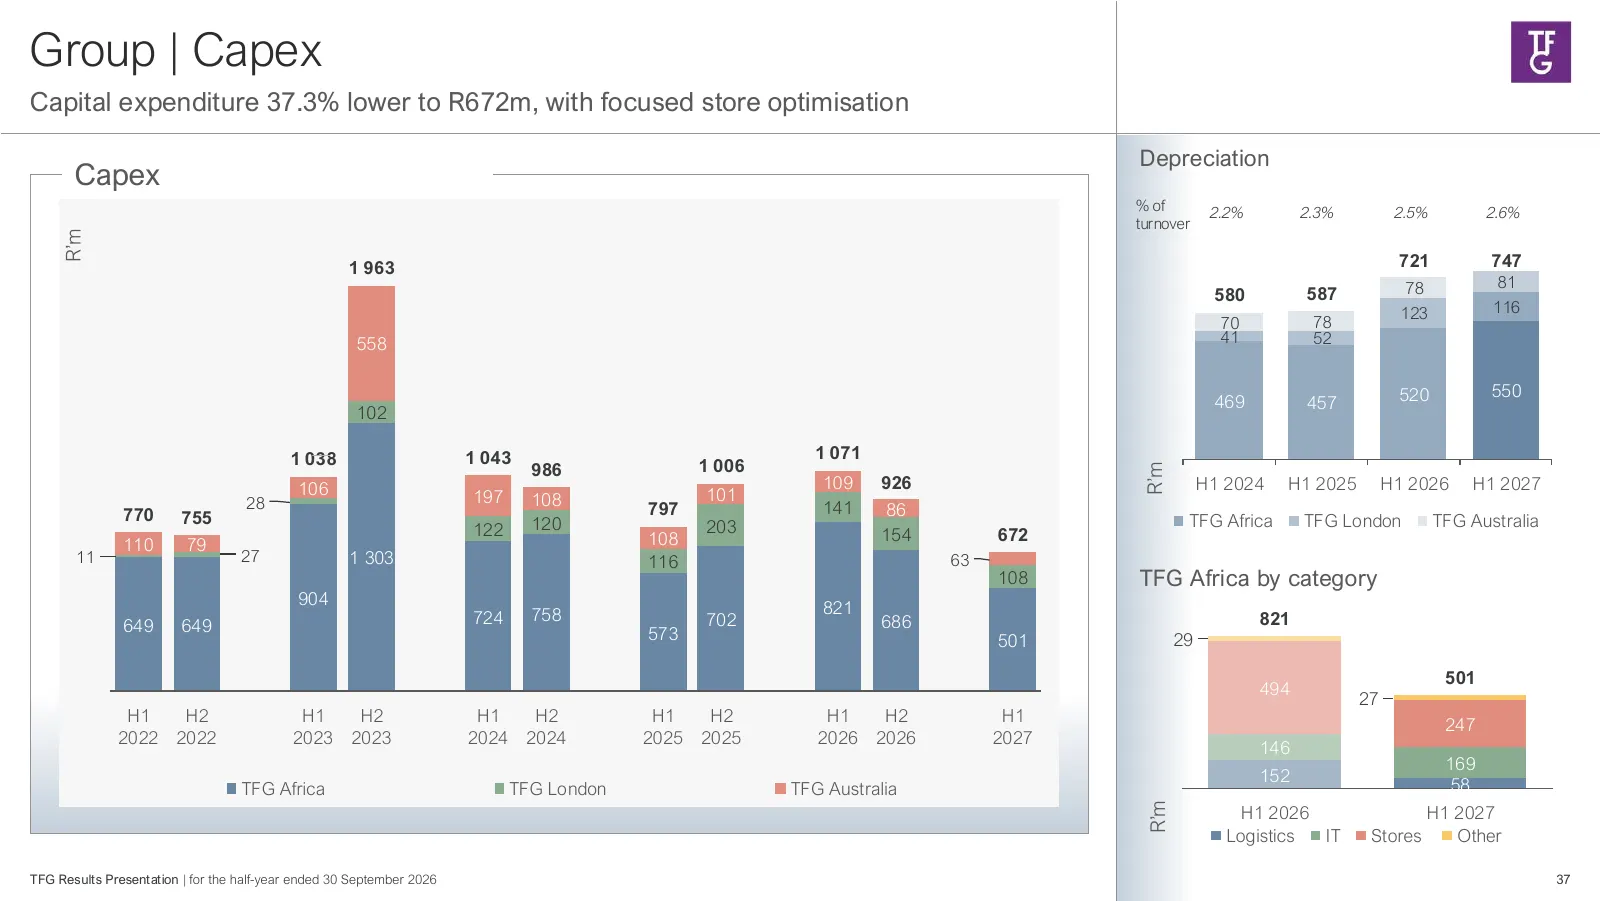
Group | Capex Capital expenditure 37.3% lower to R672m, with focused store optimisation Depreciation Capex % of 2.2% 2.3% 2.5% 2.6% turnover R’m 1 963 721 747 78 81 580 587 123 116 70 78 558 41 52 520 550 469 457 102 1 038 1 043 1 071 986 1 006 R’m 106 109 926 H1 2024 H1 2025 H1 2026 H1 2027 28 197
Slide 38: Group | Inventory
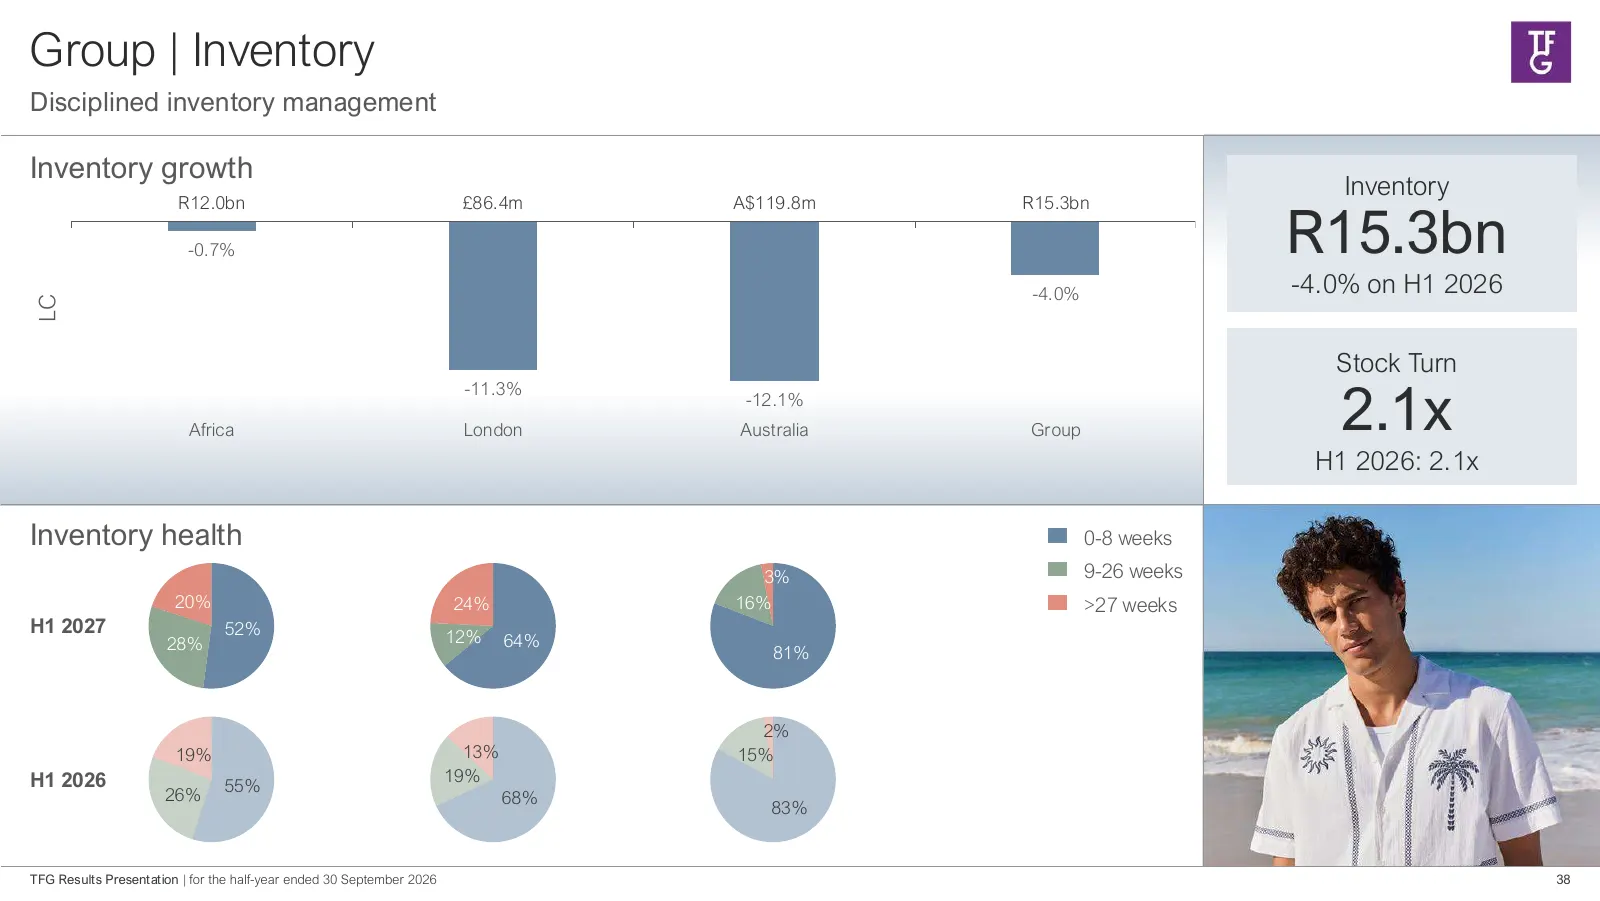
Group | Inventory Disciplined inventory management Inventory growth Inventory R12.0bn £86.4m A$119.8m R15.3bn -0.7% R15.3bn -4.0% -4.0% on H1 2026 LC Stock Turn 2.1x -11.3% -12.1% Africa London Australia Group H1 2026: 2.1x Inventory health 0-8 weeks 3% 9-26 weeks 20% 24% 16% >27 weeks H1 2027 52% 1
Slide 39: Group | Debtors
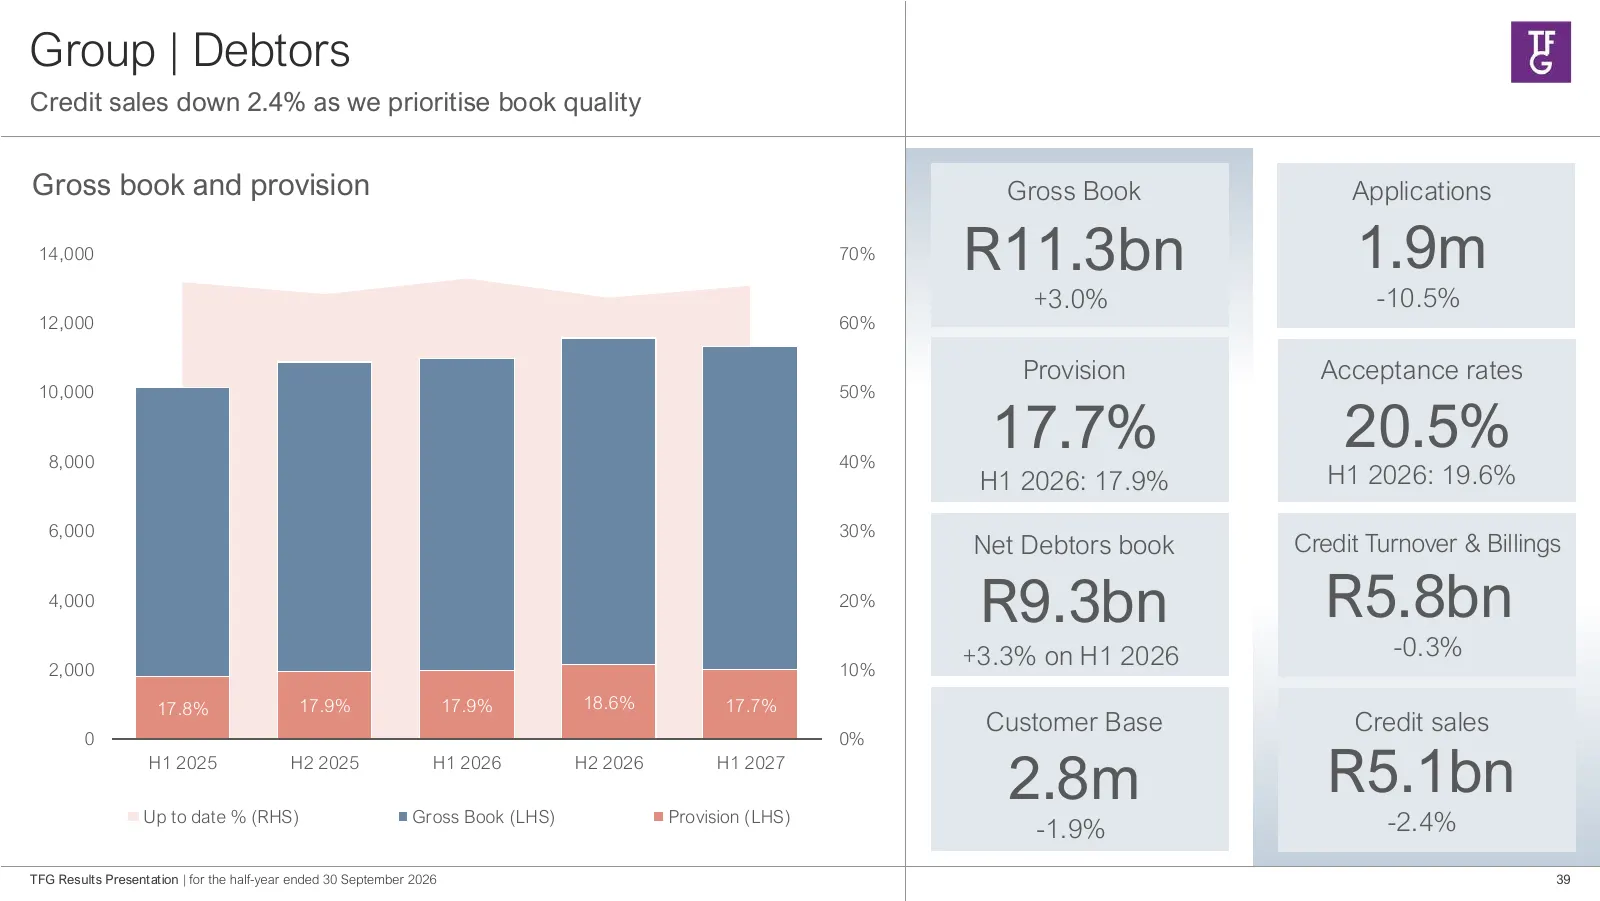
Group | Debtors Credit sales down 2.4% as we prioritise book quality Gross book and provision Gross Book Applications 14,000 70% R11.3bn 1.9m +3.0% -10.5% 12,000 60% Provision Acceptance rates 10,000 50% 8,000 40% 17.7% 20.5% H1 2026: 17.9% H1 2026: 19.6% 6,000 30% Net Debtors book Credit Turnover &
Slide 40: Group | In conclusion
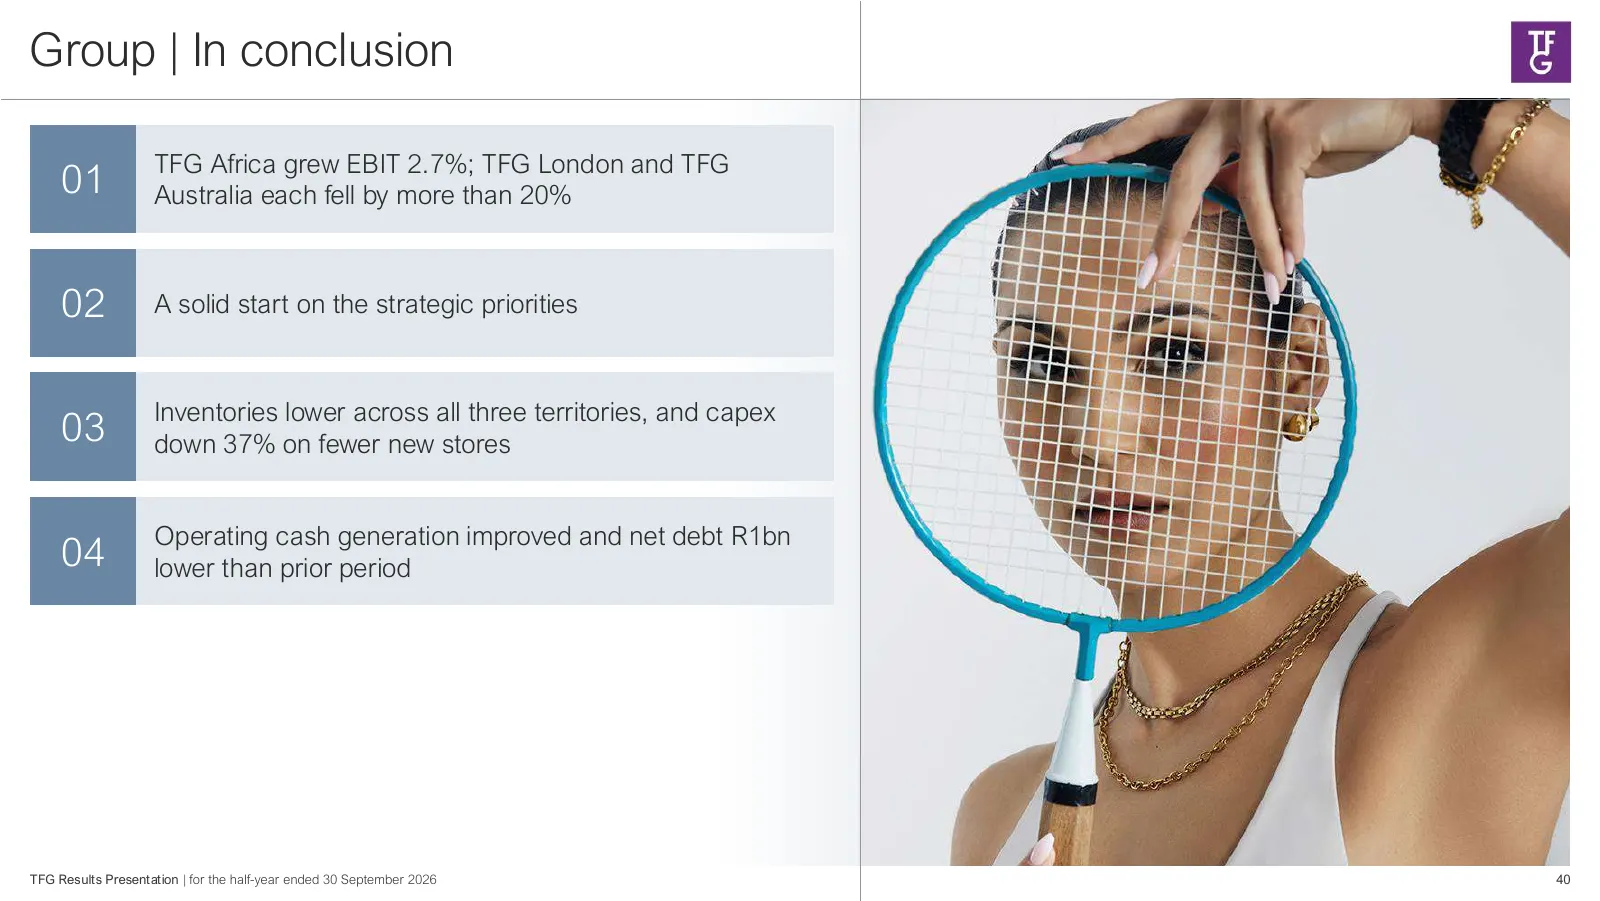
Group | In conclusion TFG Africa grew EBIT 2.7%; TFG London and TFG 01 Australia each fell by more than 20% 02 A solid start on the strategic priorities Inventories lower across all three territories, and capex 03 down 37% on fewer new stores Operating cash generation improved and net debt R1bn 04 l

Slide 41: Outlook
03 Anthony Thunström Group CEO OUTLOOK 41
Slide 42: Post-period trade update
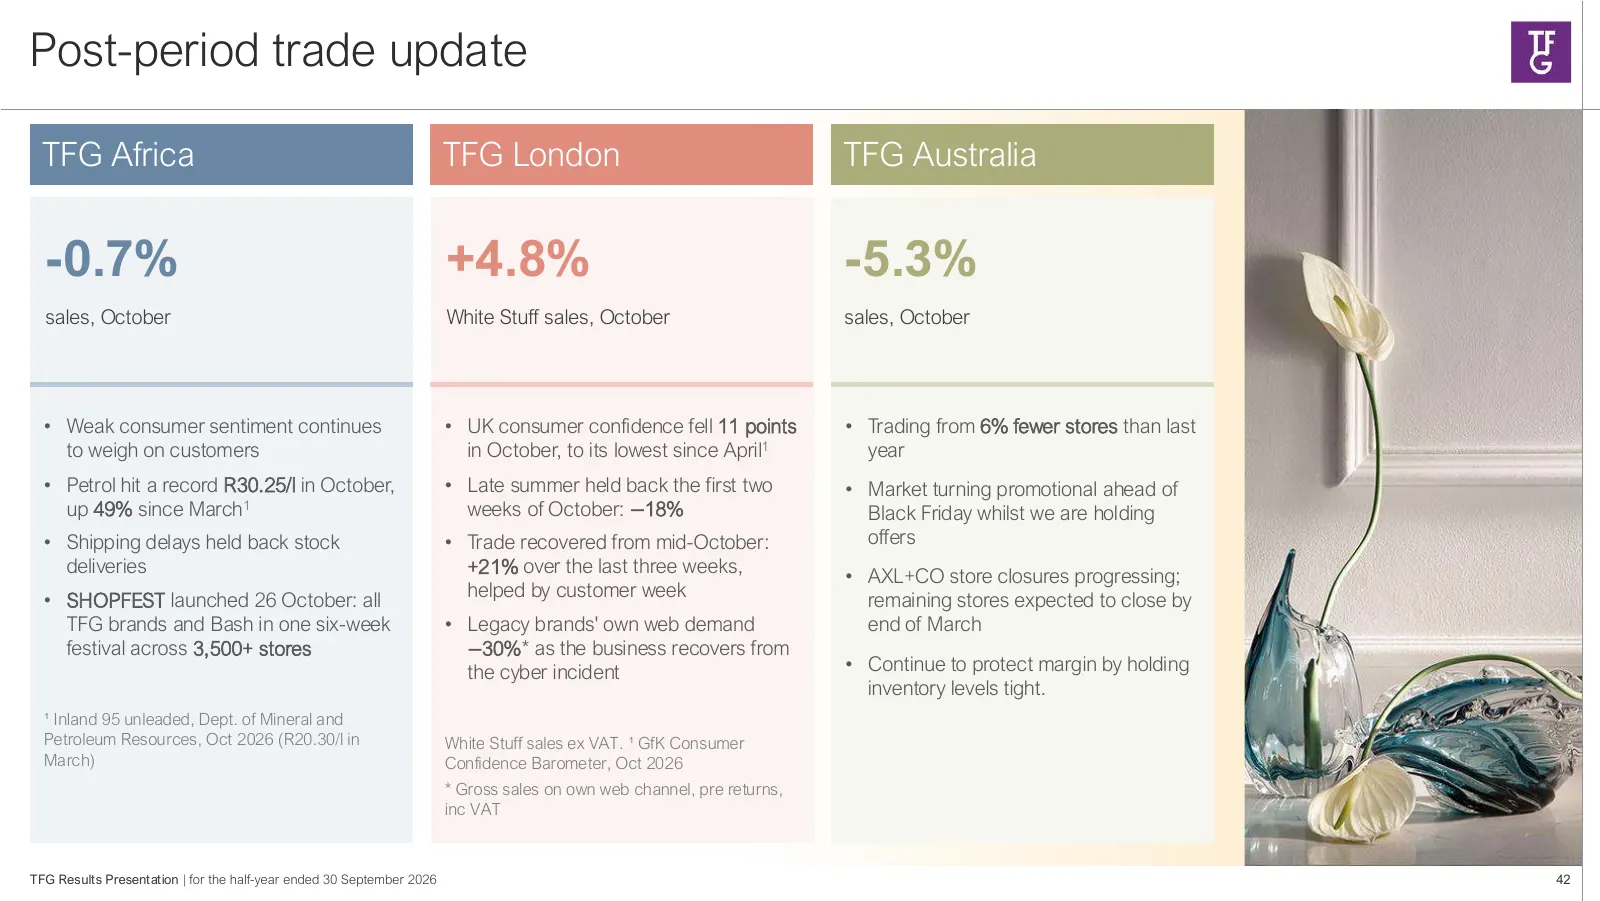
Post-period trade update TFG Africa TFG London TFG Australia -0.7% +4.8% -5.3% sales, October White Stuff sales, October sales, October • Weak consumer sentiment continues • UK consumer confidence fell 11 points • Trading from 6% fewer stores than last to weigh on customers in October, to its lowest
Slide 43: Enhancing group returns
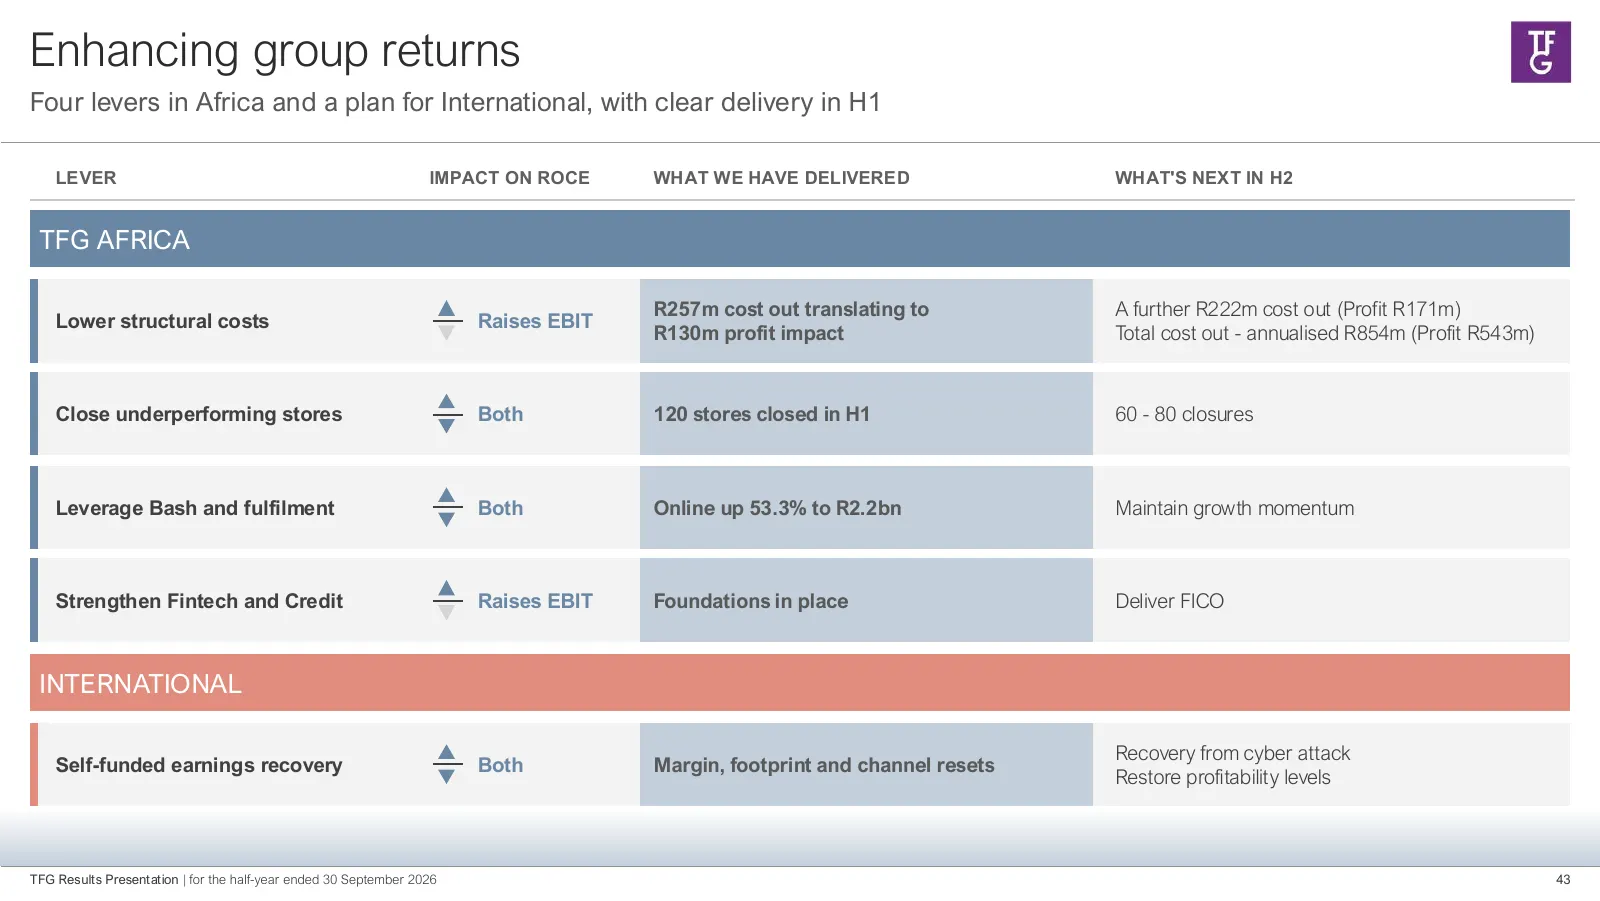
Enhancing group returns Four levers in Africa and a plan for International, with clear delivery in H1 LEVER IMPACT ON ROCE WHAT WE HAVE DELIVERED WHAT'S NEXT IN H2 TFG AFRICA R257m cost out translating to A further R222m cost out (Profit R171m) Lower structural costs Raises EBIT R130m profit impact
Slide 44: Group capital allocation
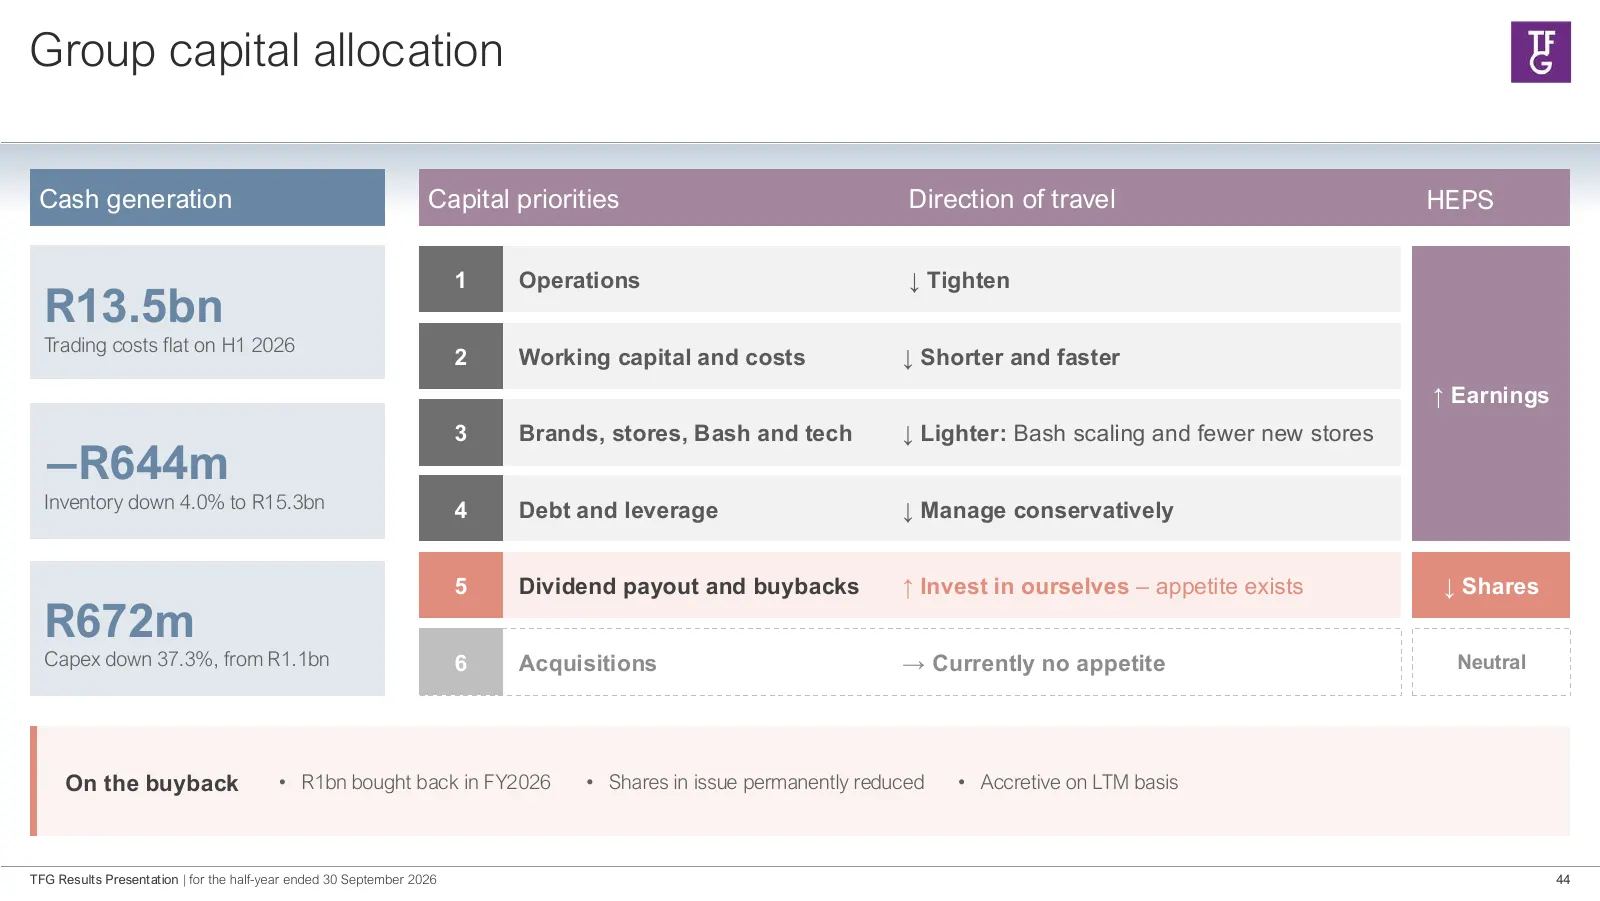
Group capital allocation Cash generation Capital priorities Direction of travel HEPS 1 Operations ↓ Tighten R13.5bn Trading costs flat on H1 2026 2 Working capital and costs ↓ Shorter and faster ↑ Earnings 3 Brands, stores, Bash and tech ↓ Lighter: Bash scaling and fewer new stores −R644m Inventory
Slide 45: Our Chairman | Michael Lewis
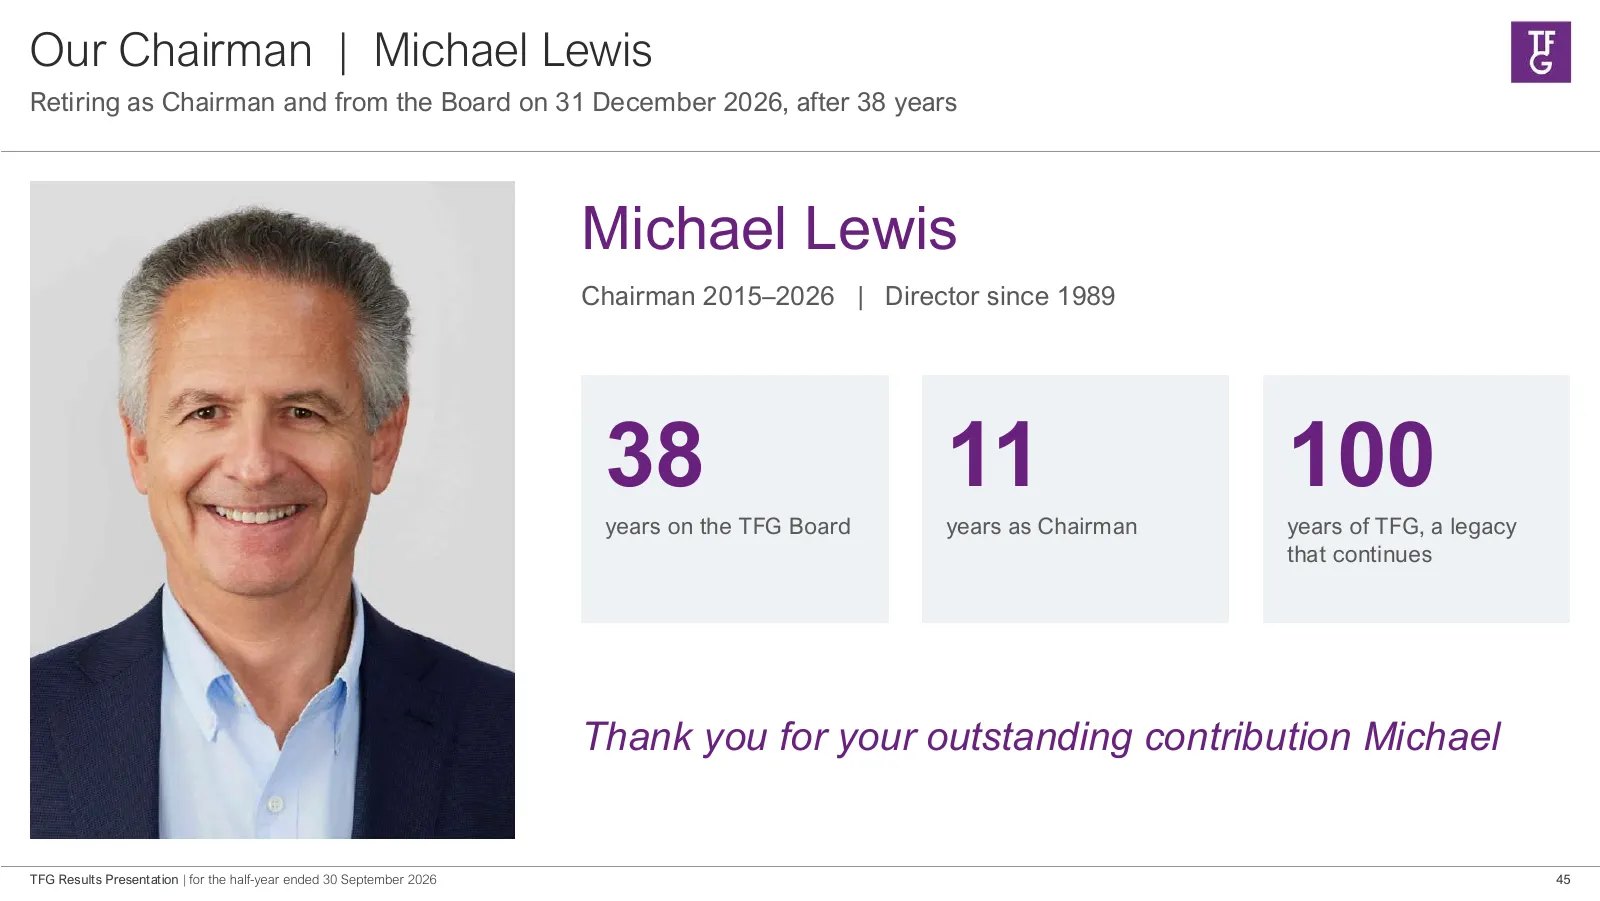
Our Chairman | Michael Lewis Retiring as Chairman and from the Board on 31 December 2026, after 38 years Michael Lewis Chairman 2015–2026 | Director since 1989 Photo of Michael Lewis 38 11 100 (replace with image) years on the TFG Board years as Chairman years of TFG, a legacy that continues Thank y
Slide 46: Our Board | Welcoming three new independent non-executive directors
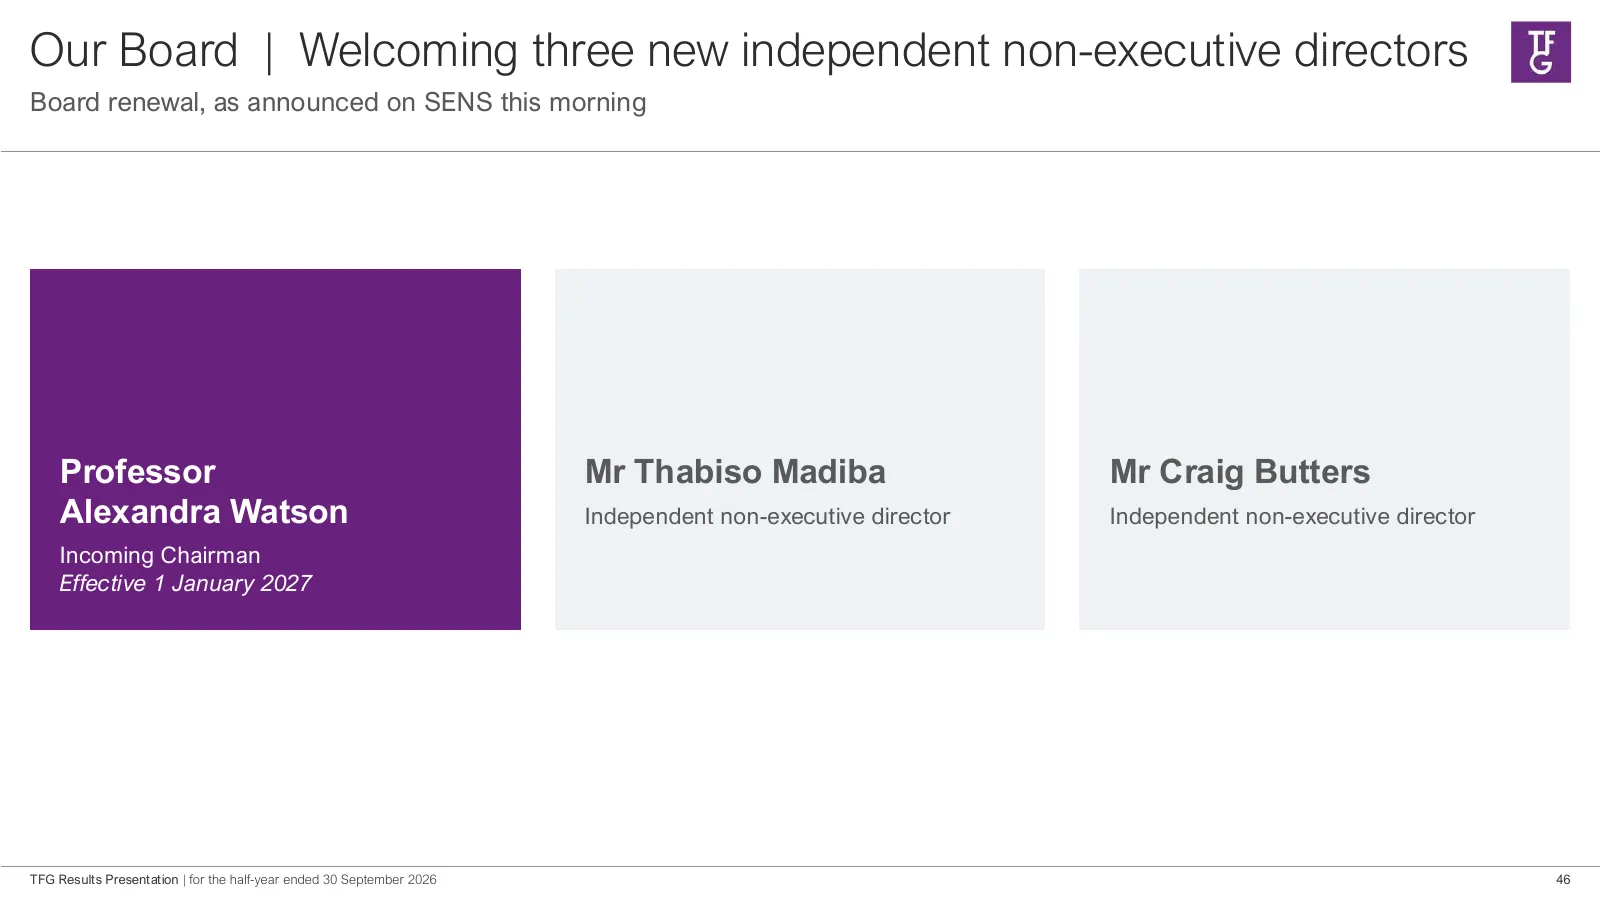
Our Board | Welcoming three new independent non-executive directors Board renewal, as announced on SENS this morning Professor Mr Thabiso Madiba Mr Craig Butters Alexandra Watson Independent non-executive director Independent non-executive director Incoming Chairman Effective 1 January 2027 TFG Resu

Slide 47: Q&A break
We will resume in 5 minutes for the Q & A session. Enjoy your coffee break… Q&A 47

Slide 48: Thank You
THANK YOU 48

Slide 49: Appendix
APPENDIX TFG Results Presentation | for the half-year ended 30 September 2026 49
Slide 50: Group | Income Statement
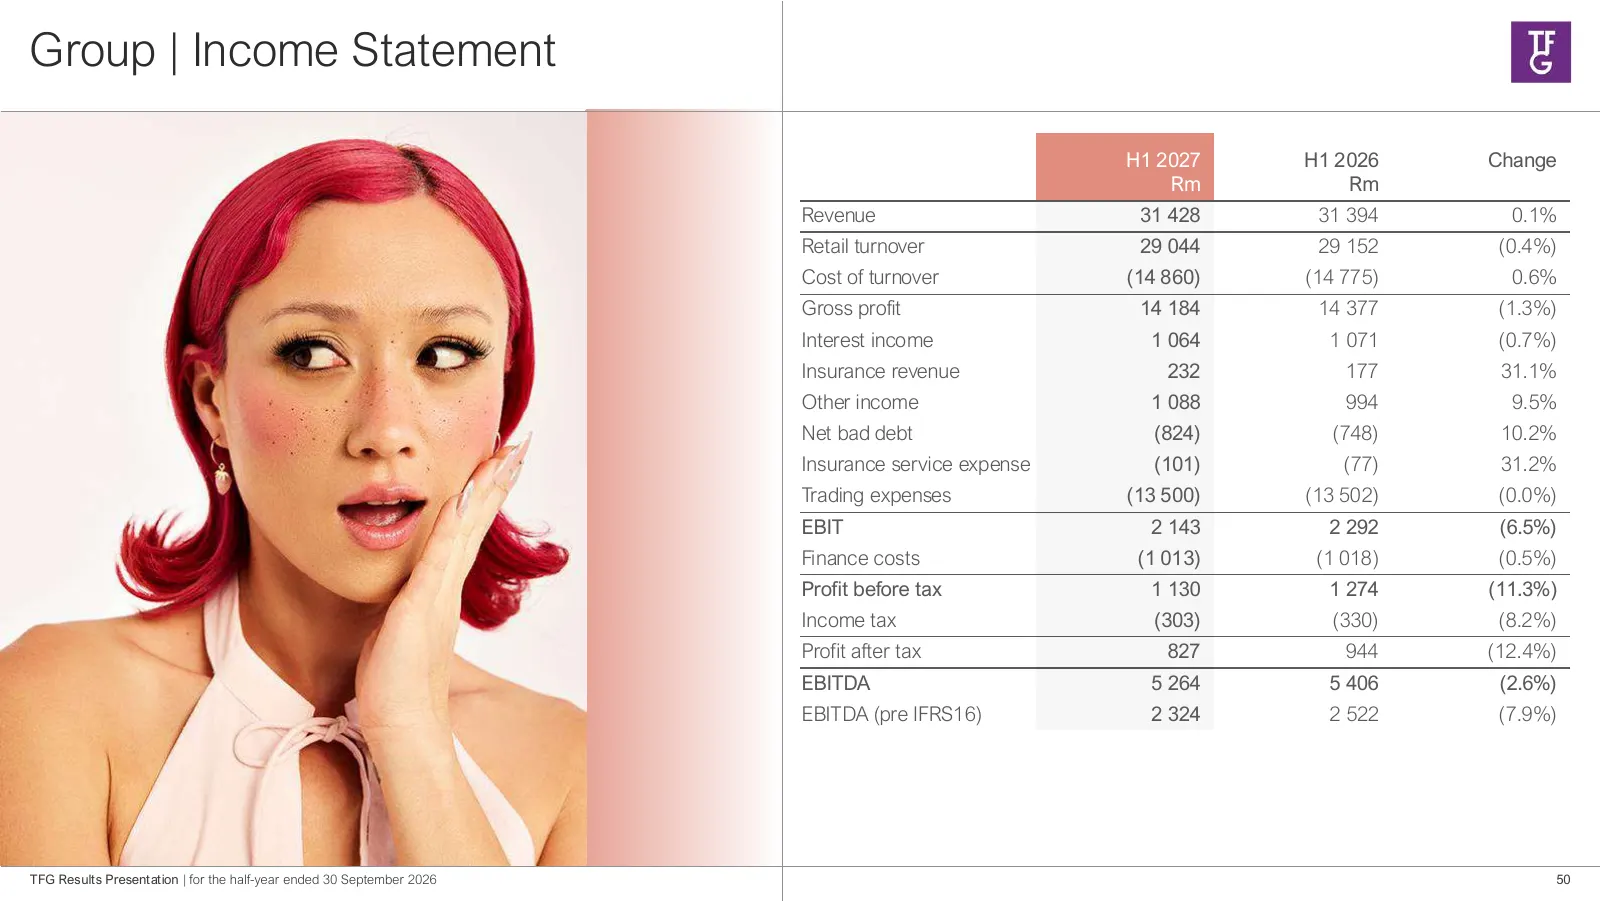
Group | Income Statement H1 2027 H1 2026 Change Rm Rm Revenue 31 428 31 394 0.1% Retail turnover 29 044 29 152 (0.4%) Cost of turnover (14 860) (14 775) 0.6% Gross profit 14 184 14 377 (1.3%) Interest income 1 064 1 071 (0.7%) Insurance revenue 232 177 31.1% Other income 1 088 994 9.5% Net bad debt
Slide 51: TFG Africa | Income Statement
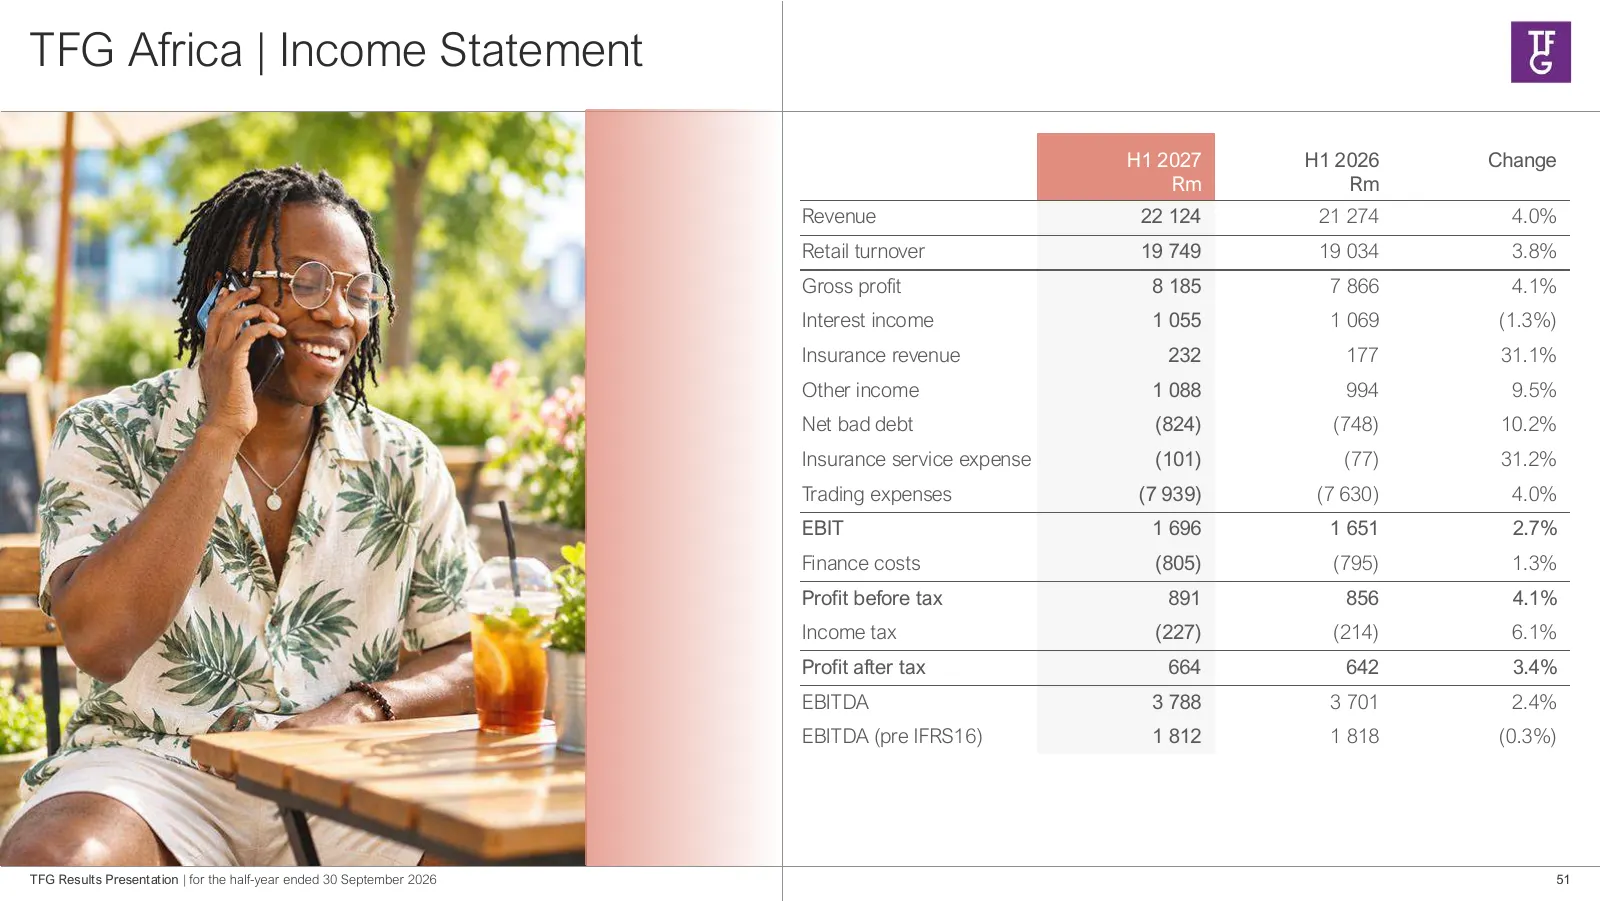
TFG Africa | Income Statement H1 2027 H1 2026 Change Rm Rm Revenue 22 124 21 274 4.0% Retail turnover 19 749 19 034 3.8% Gross profit 8 185 7 866 4.1% Interest income 1 055 1 069 (1.3%) Insurance revenue 232 177 31.1% Other income 1 088 994 9.5% Net bad debt (824) (748) 10.2% Insurance service expen
Slide 52: TFG Africa | Performance
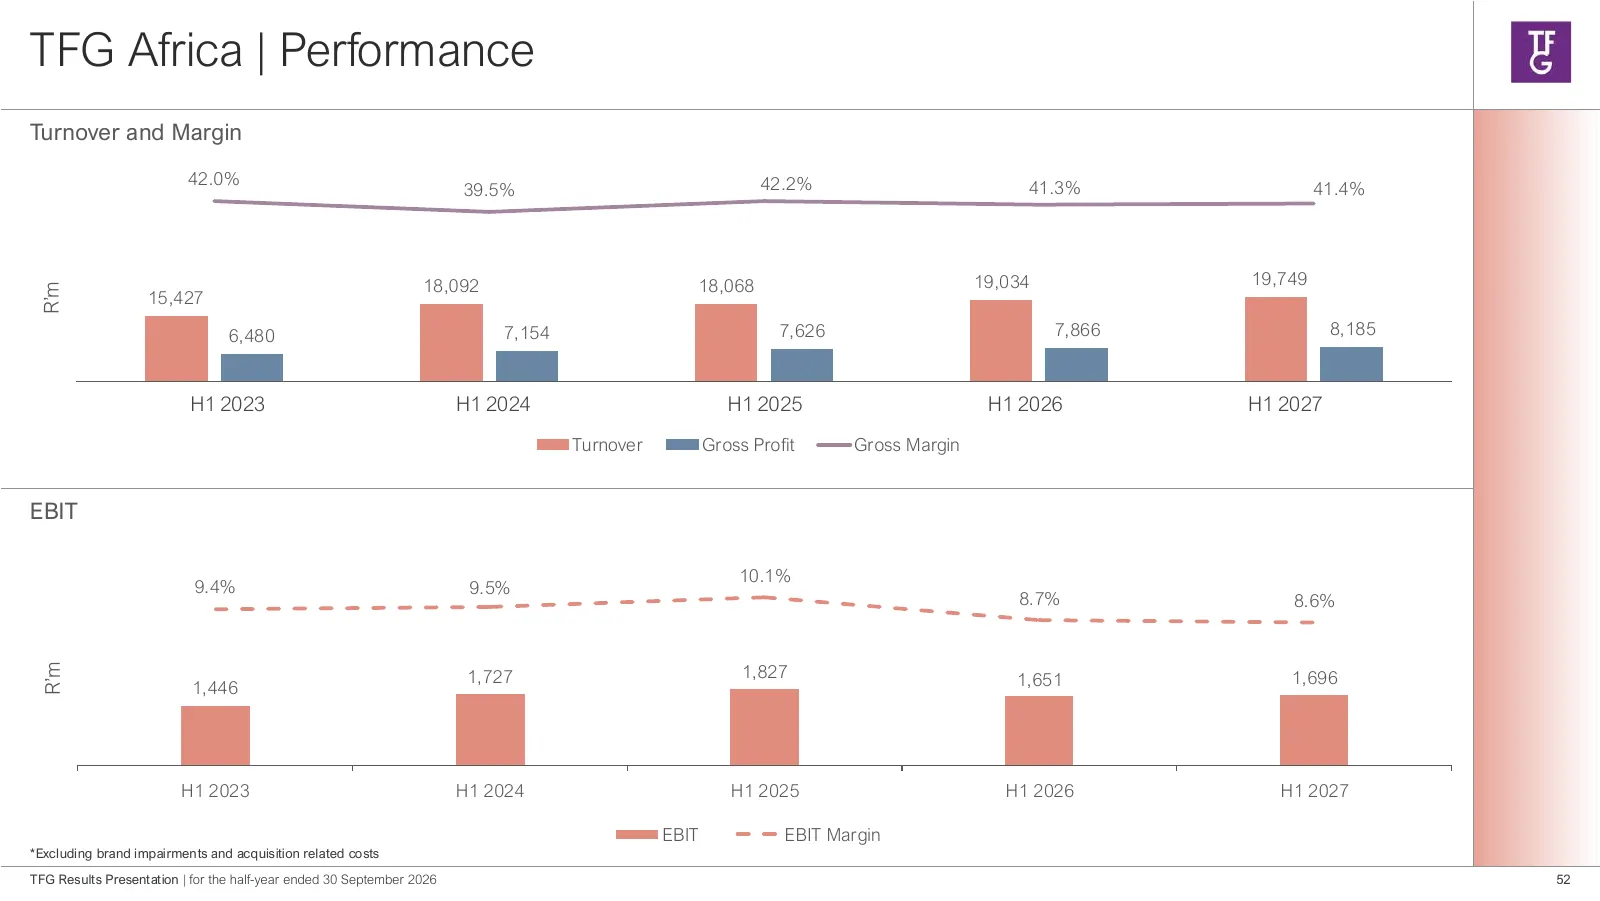
TFG Africa | Performance Turnover and Margin 50,00 50.0% 42.0% 42.2% 41.3% 45,00 39.5% 41.4% 45.0% 40,00 40.0% 35,00 35.0% 30,00 30.0% 19,034 19,749 25,00 25.0% 18,092 18,068 R’m 20,00 15,427 20.0% 15,00 15.0% 10,00 6,480 7,154 7,626 7,866 8,185 10.0% 5,000 5.0% 0 0.0% H12023 H1 2023 H1 2024 H1 2024
Slide 53: TFG London | Income Statement
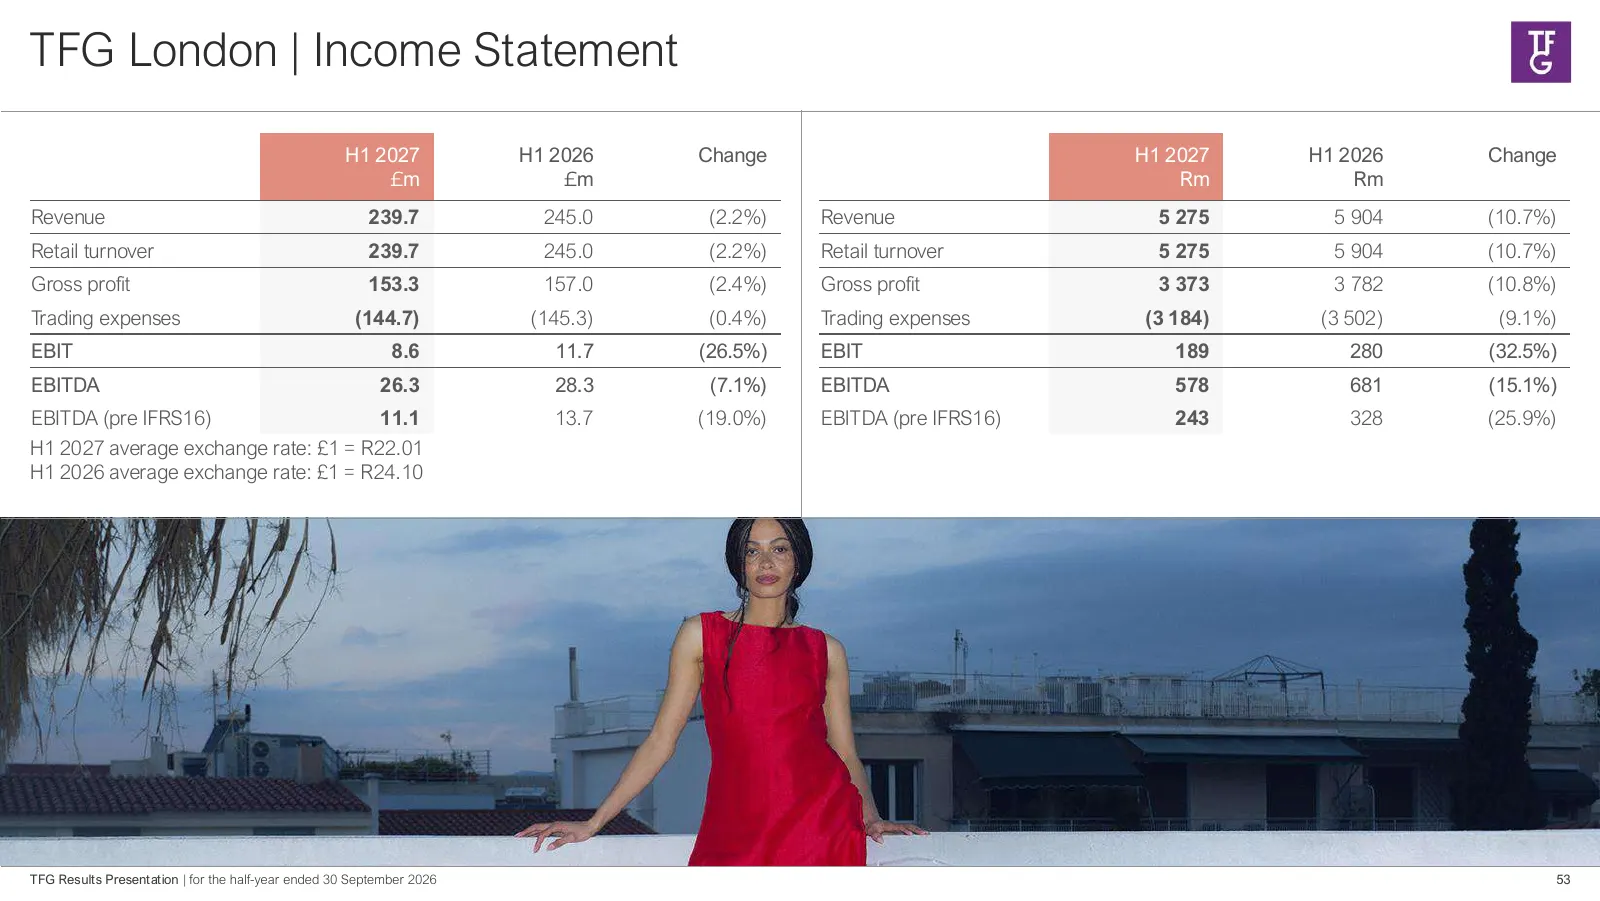
TFG London | Income Statement H1 2027 H1 2026 Change H1 2027 H1 2026 Change £m £m Rm Rm Revenue 239.7 245.0 (2.2%) Revenue 5 275 5 904 (10.7%) Retail turnover 239.7 245.0 (2.2%) Retail turnover 5 275 5 904 (10.7%) Gross profit 153.3 157.0 (2.4%) Gross profit 3 373 3 782 (10.8%) Trading expenses (144
Slide 54: TFG London | Performance
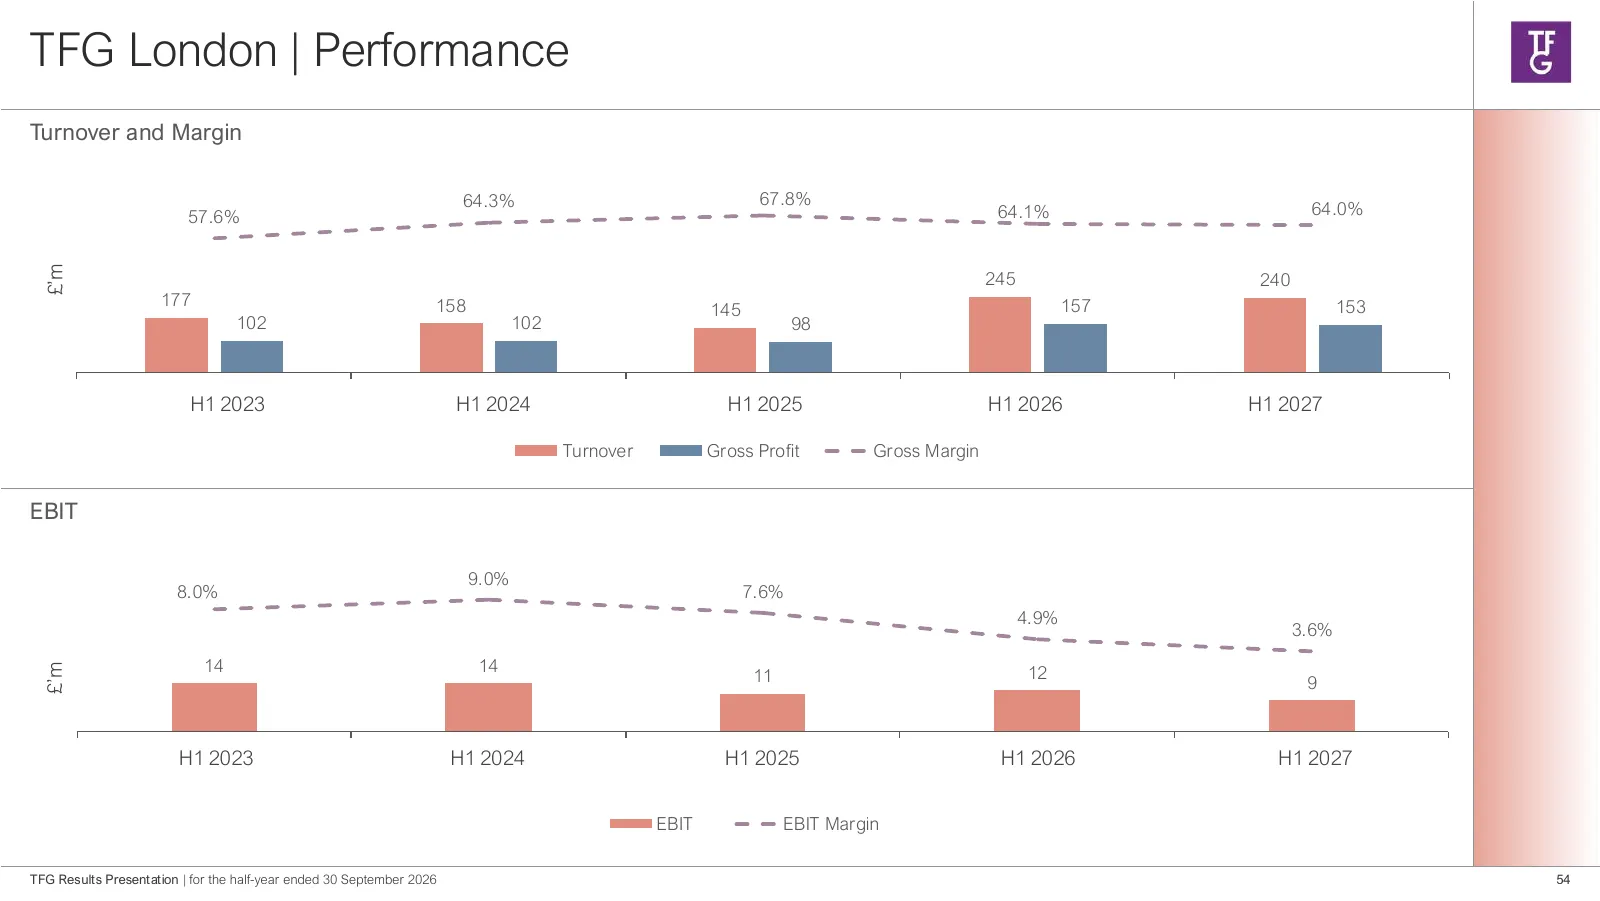
TFG London | Performance Turnover and Margin 600 80.0% 64.3% 67.8% 500 57.6% 64.1% 64.0% 70.0% 60.0% 400 50.0% £’m 300 245 240 40.0% 177 158 157 153 145 30.0% 200 102 102 98 20.0% 100 10.0% 0 0.0% H1 H12023 2023 H1 H12024 2024 H1 2025 H1 2025 H1H12026 2026 H1 2027 H1 2027 Turnover Gross Profit Gross
Slide 55: TFG Australia | Income Statement
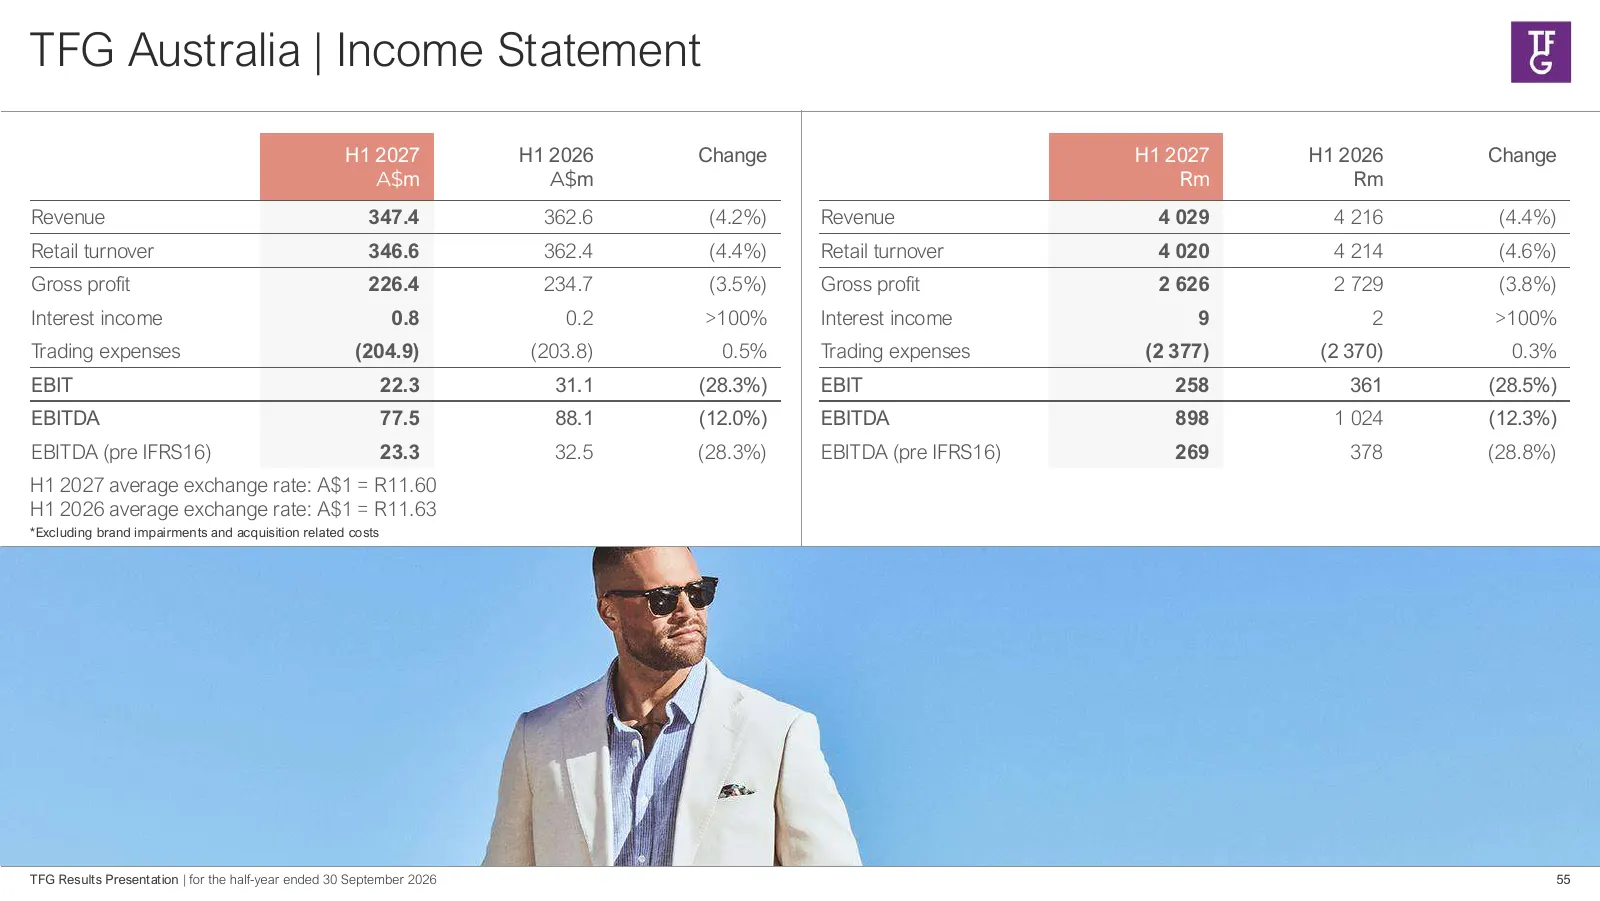
TFG Australia | Income Statement H1 2027 H1 2026 Change H1 2027 H1 2026 Change A$m A$m Rm Rm Revenue 347.4 362.6 (4.2%) Revenue 4 029 4 216 (4.4%) Retail turnover 346.6 362.4 (4.4%) Retail turnover 4 020 4 214 (4.6%) Gross profit 226.4 234.7 (3.5%) Gross profit 2 626 2 729 (3.8%) Interest income 0.8
Slide 56: TFG Australia | Performance
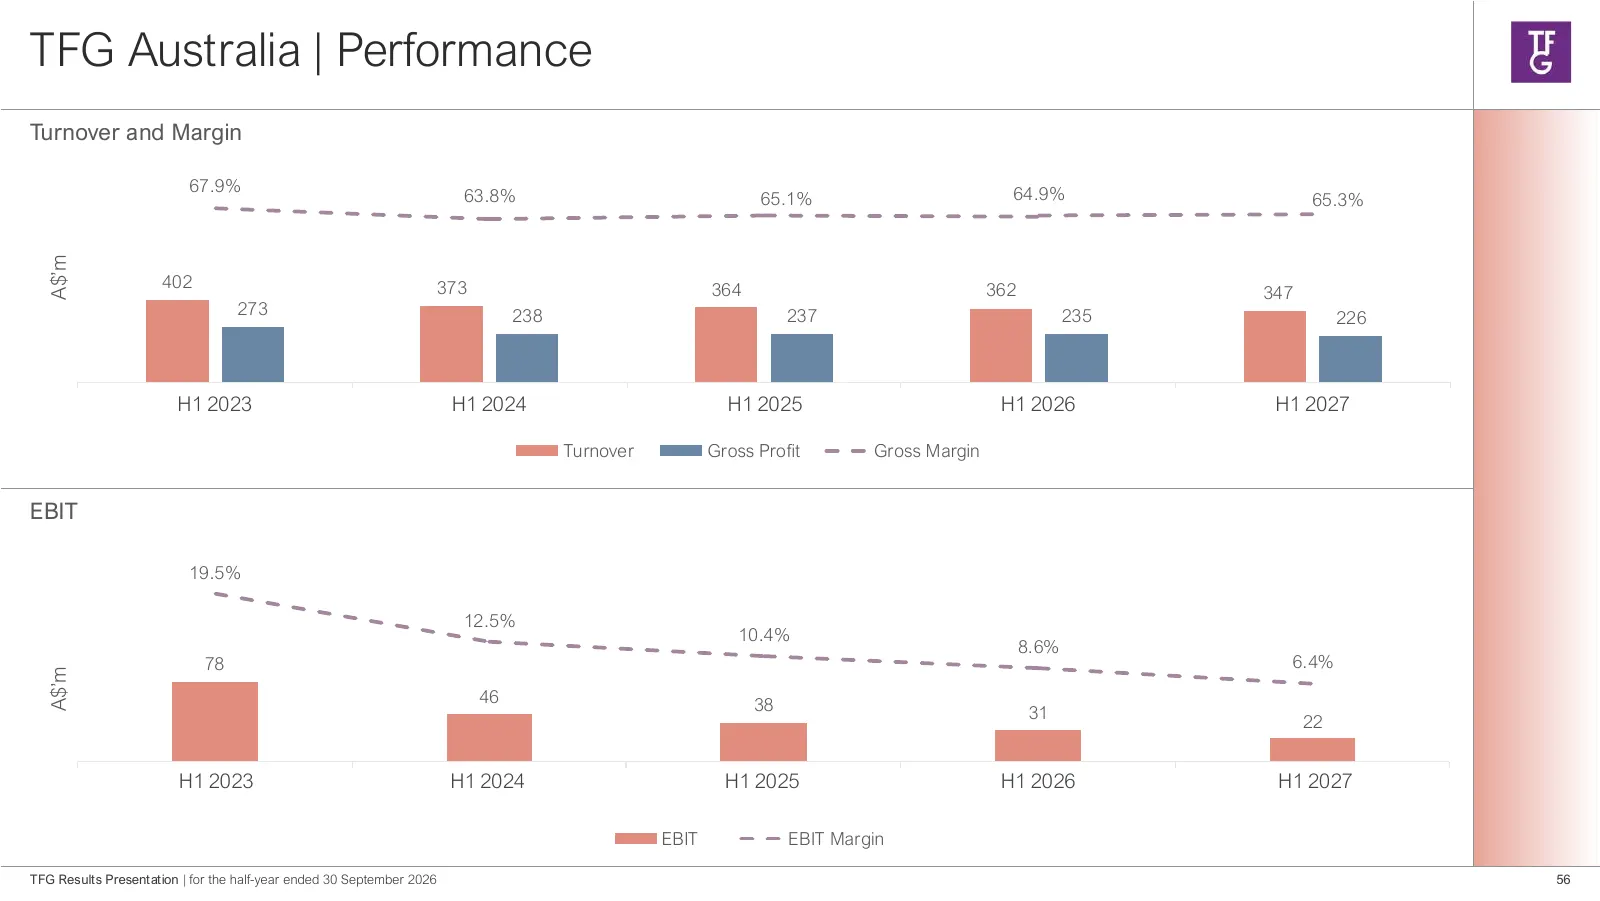
TFG Australia | Performance Turnover and Margin 67.9% 1,000 80.0% 900 63.8% 65.1% 64.9% 65.3% 70.0% 800 60.0% 700 50.0% A$’m 600 500 402 373 364 362 40.0% 347 273 400 30.0% 300 238 237 235 226 20.0% 200 10.0% 100 0 0.0% H1 H1 2023 2023 H1 H1 2024 2024 H1 H1 2025 2025 H1 H1 2026 H1 H1 2027 Turnover G
Slide 57: Group | Trading Expenses
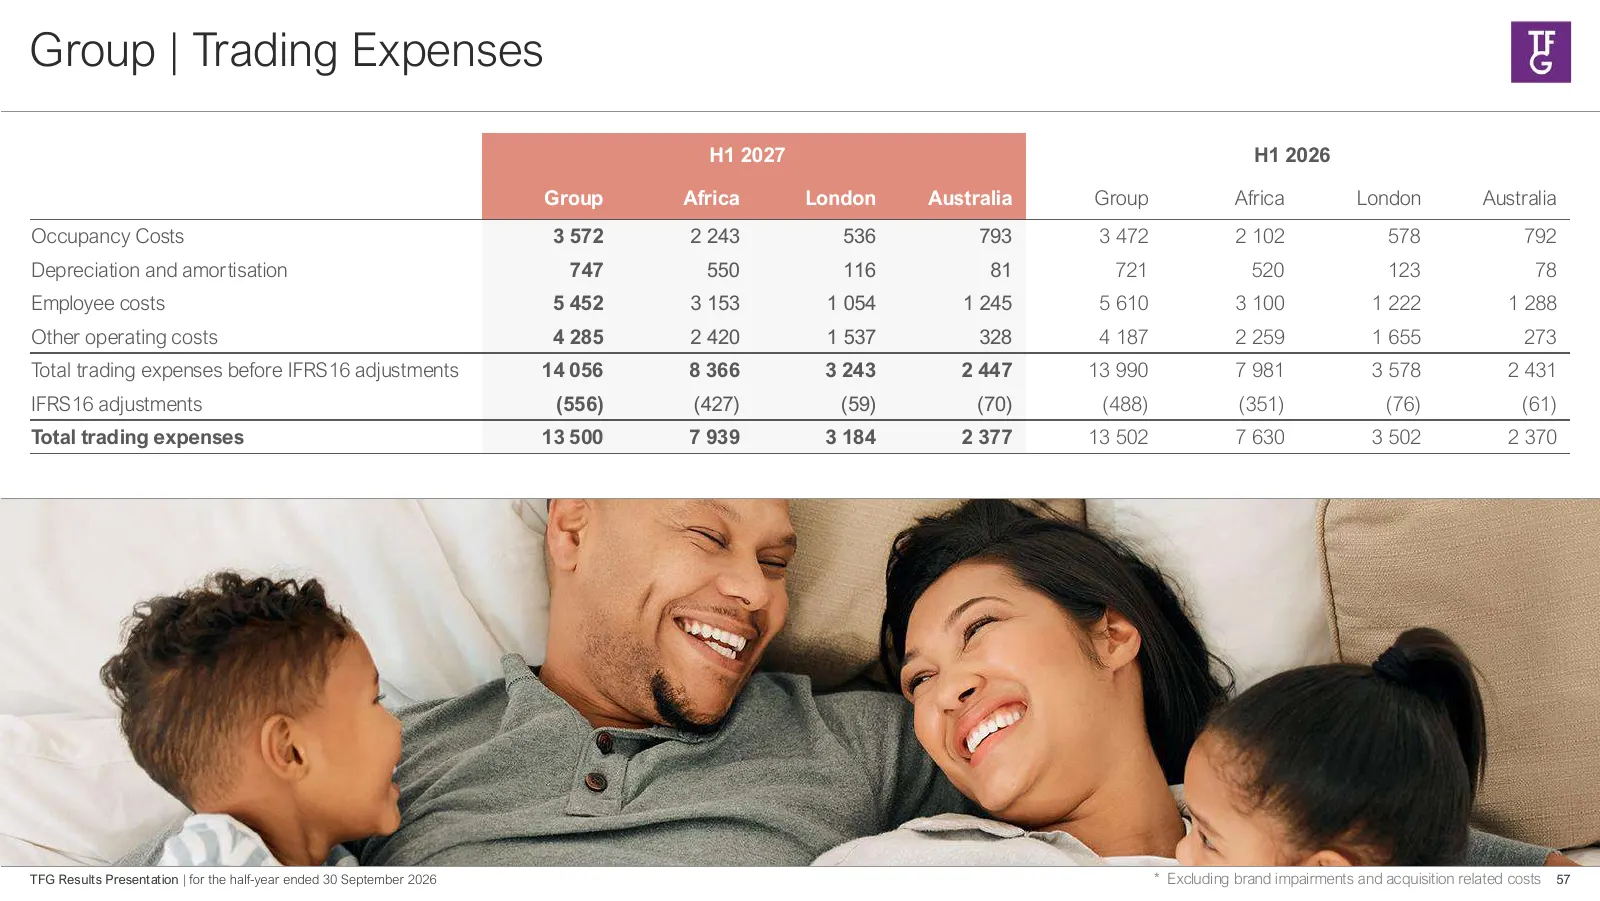
Group | Trading Expenses H1 2027 H1 2026 Group Africa London Australia Group Africa London Australia Occupancy Costs 3 572 2 243 536 793 3 472 2 102 578 792 Depreciation and amortisation 747 550 116 81 721 520 123 78 Employee costs 5 452 3 153 1 054 1 245 5 610 3 100 1 222 1 288 Other operating cost
Slide 58: Group | Statement of Financial Position
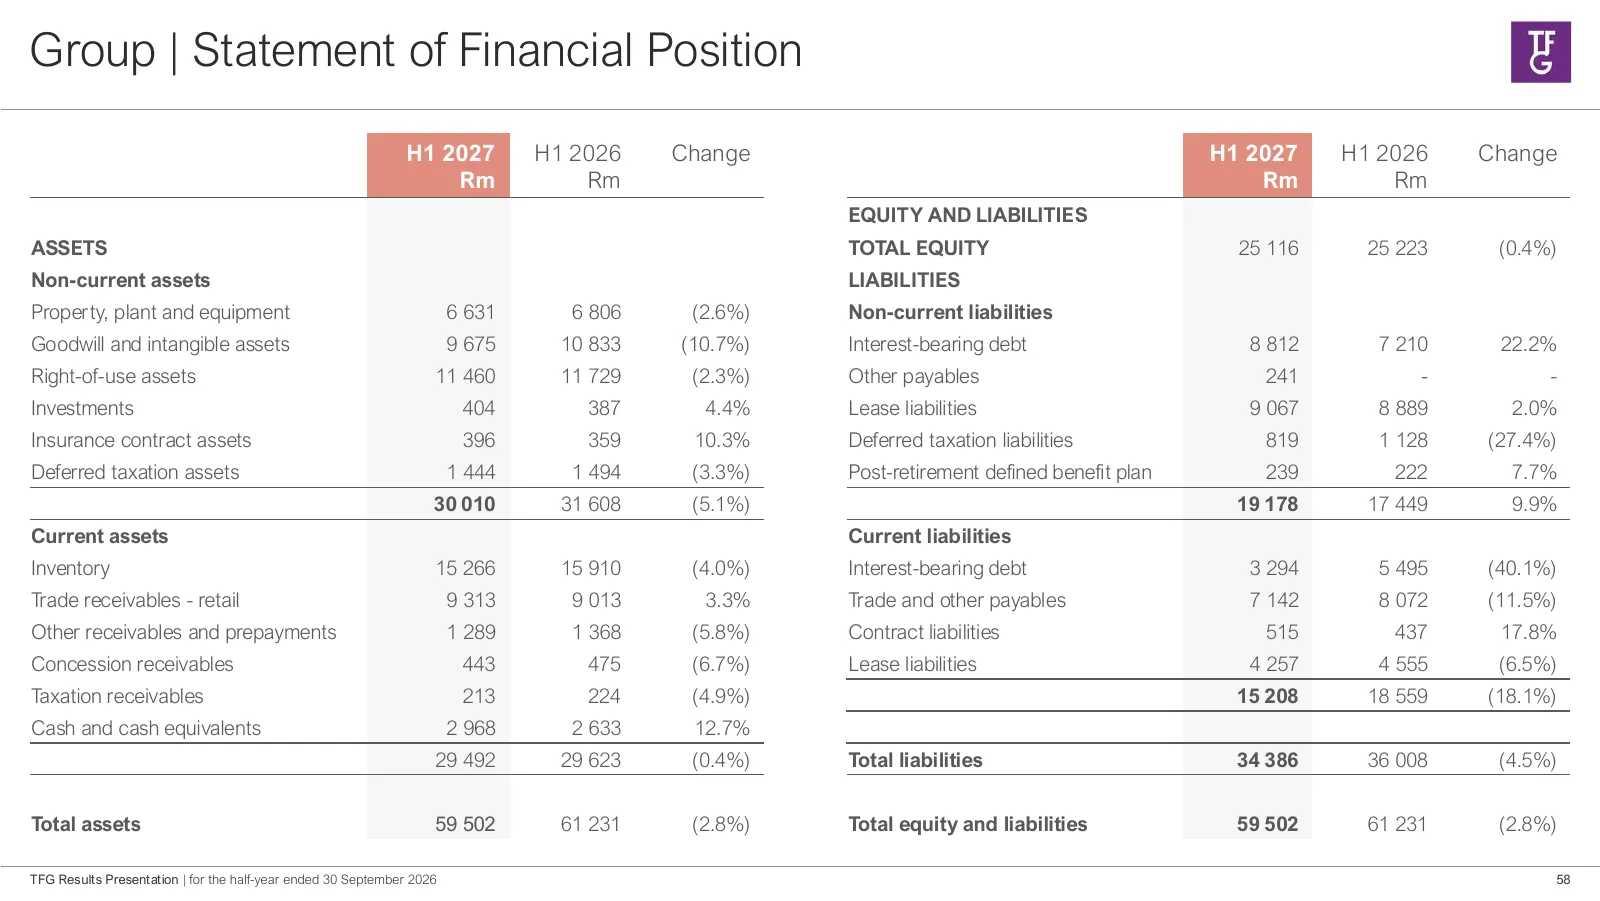
Group | Statement of Financial Position H1 2027 H1 2026 Change H1 2027 H1 2026 Change Rm Rm Rm Rm EQUITY AND LIABILITIES ASSETS TOTAL EQUITY 25 116 25 223 (0.4%) Non-current assets LIABILITIES Property, plant and equipment 6 631 6 806 (2.6%) Non-current liabilities Goodwill and intangible assets 9 6
Slide 59: Group | Cash Flow Statement
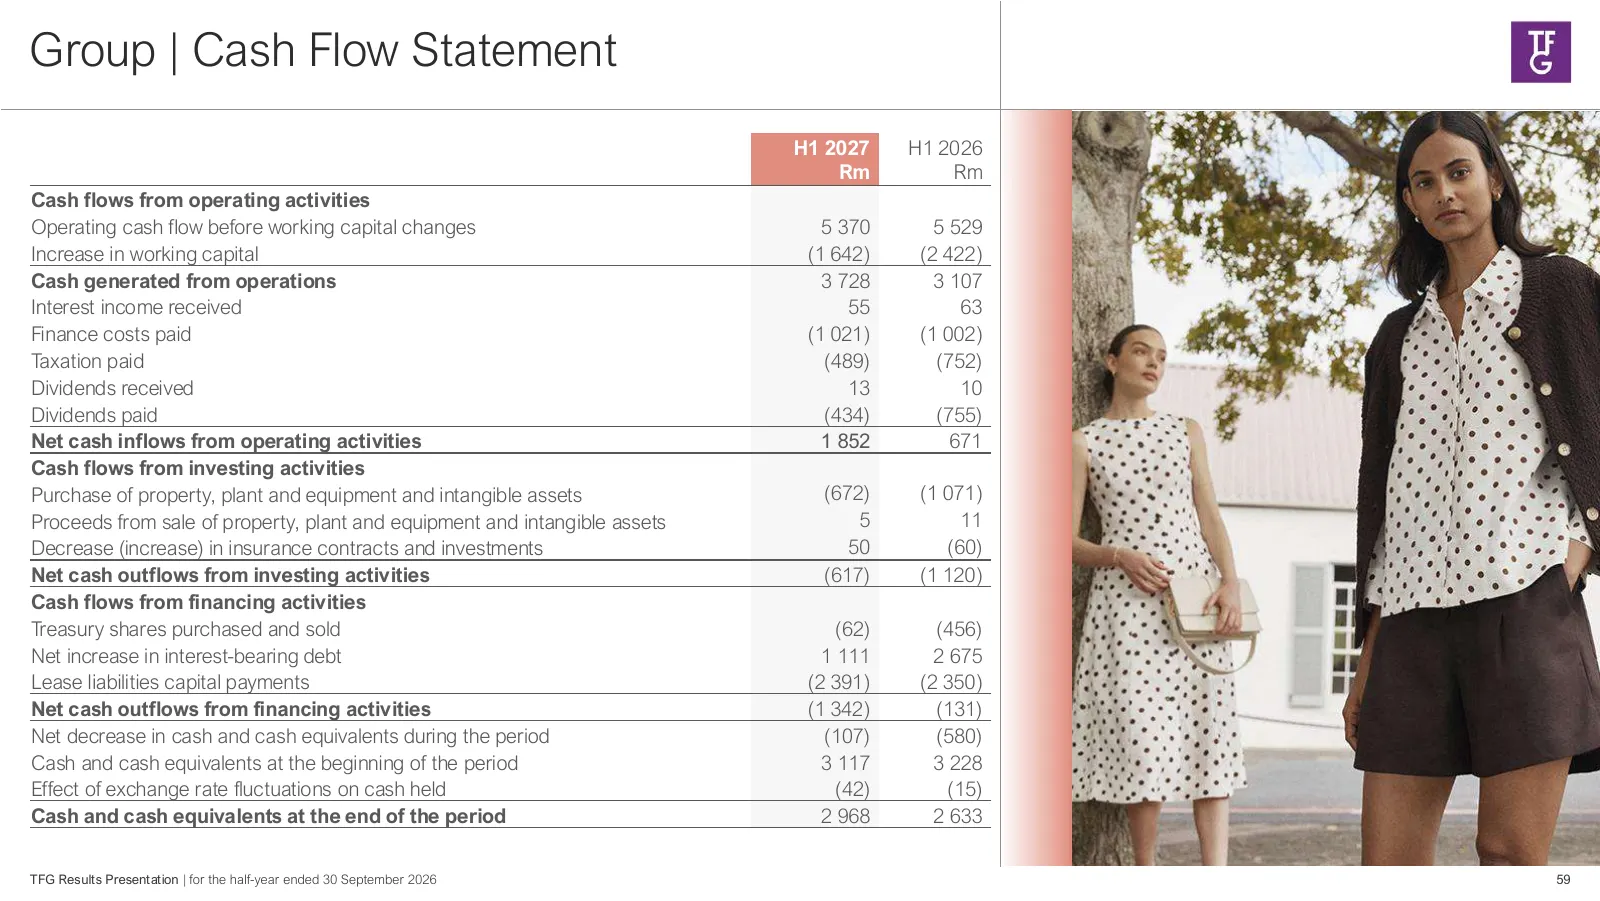
Group | Cash Flow Statement H1 2027 H1 2026 Rm Rm Cash flows from operating activities Operating cash flow before working capital changes 5 370 5 529 Increase in working capital (1 642) (2 422) Cash generated from operations 3 728 3 107 Interest income received 55 63 Finance costs paid (1 021) (1 00
Slide 60: Credit | Additional Information
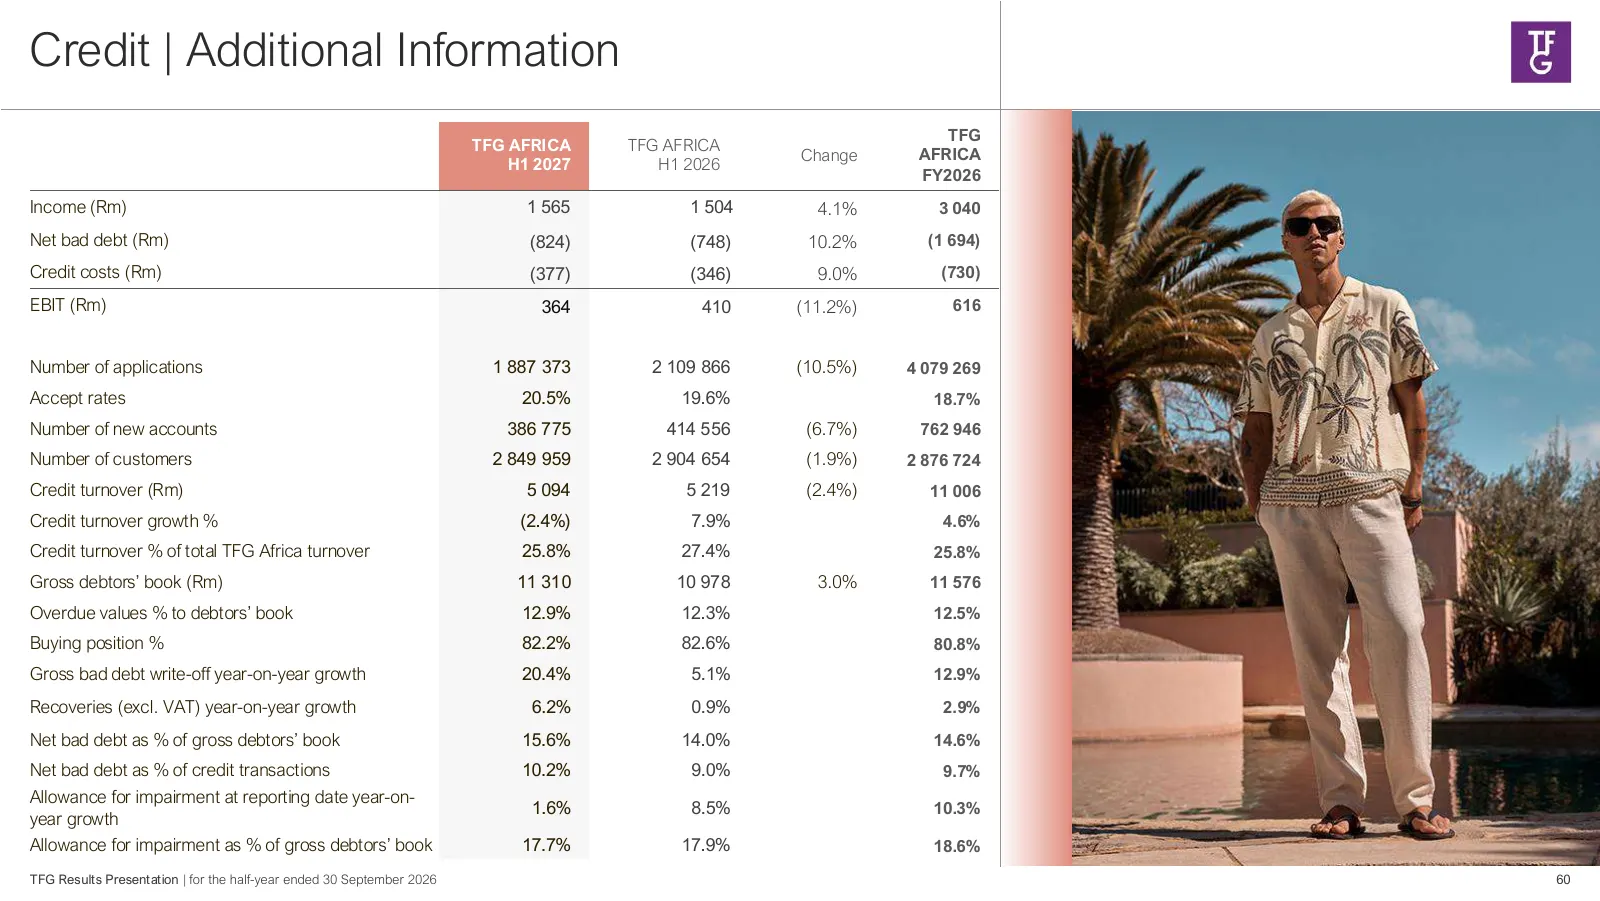
Credit | Additional Information TFG TFG AFRICA TFG AFRICA Change AFRICA H1 2027 H1 2026 FY2026 Income (Rm) 1 565 1 504 4.1% 3 040 Net bad debt (Rm) (824) (748) 10.2% (1 694) Credit costs (Rm) (377) (346) 9.0% (730) EBIT (Rm) 364 410 (11.2%) 616 Number of applications 1 887 373 2 109 866 (10.5%) 4 07
Slide 61: Credit | TransUnion Consumer Credit Index H1 2027
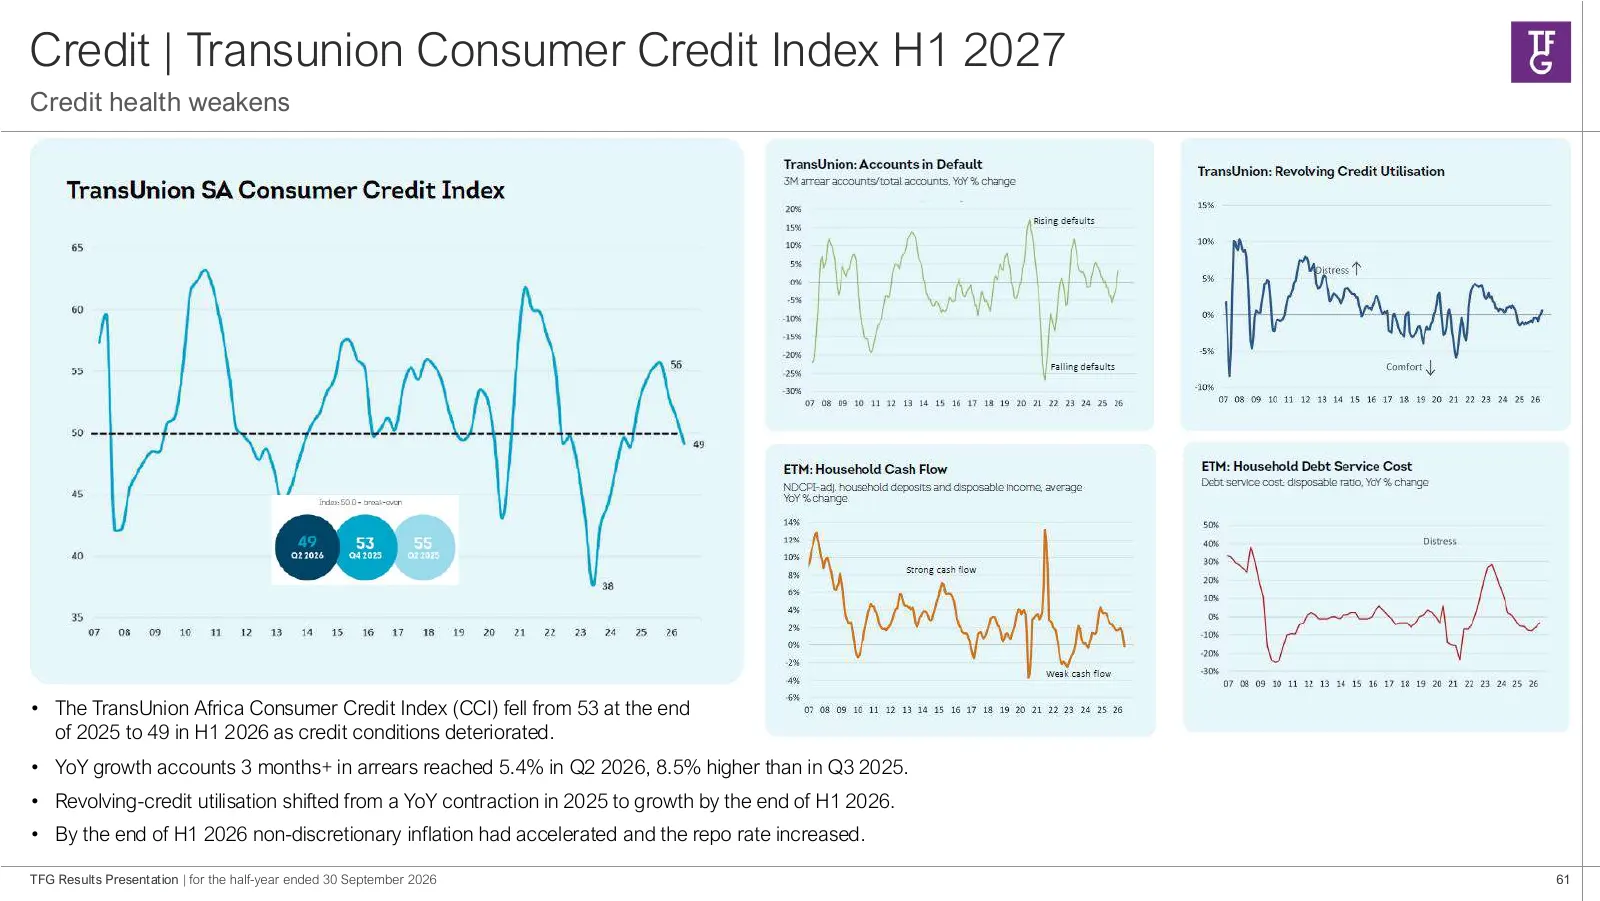
Credit | Transunion Consumer Credit Index H1 2027 Credit health weakens • The TransUnion Africa Consumer Credit Index (CCI) fell from 53 at the end of 2025 to 49 in H1 2026 as credit conditions deteriorated. • YoY growth accounts 3 months+ in arrears reached 5.4% in Q2 2026, 8.5% higher than in Q3 2
Slide 62: Global Footprint
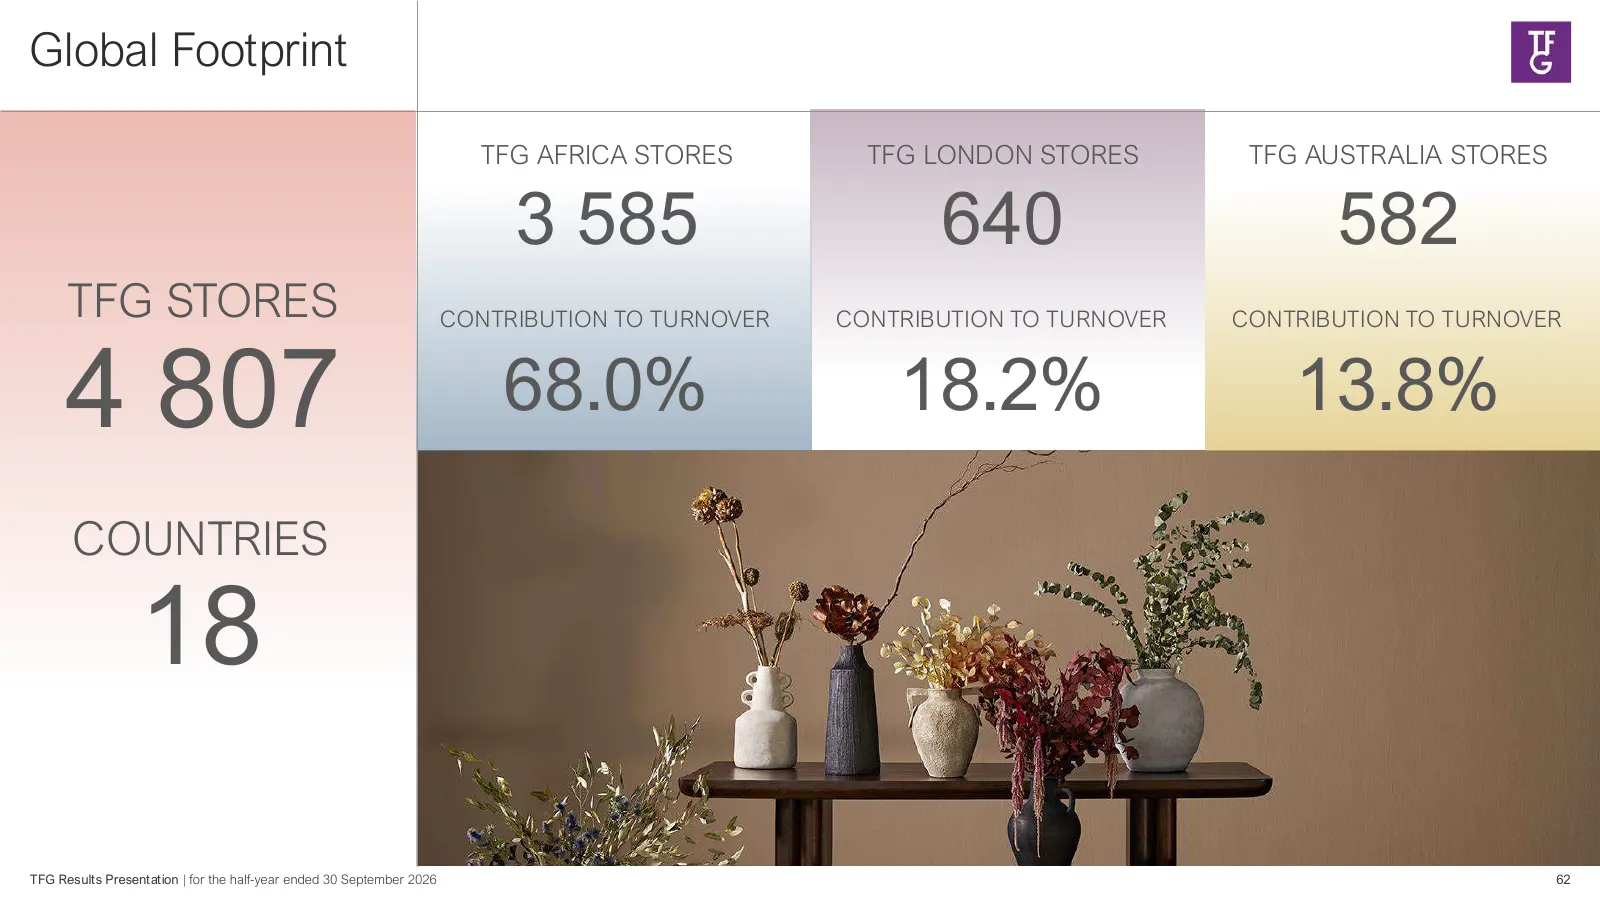
Global Footprint TFG AFRICA STORES TFG LONDON STORES TFG AUSTRALIA STORES 3 585 640 582 TFG STORES CONTRIBUTION TO TURNOVER CONTRIBUTION TO TURNOVER CONTRIBUTION TO TURNOVER 4 807 68.0% 18.2% 13.8% COUNTRIES 18 TFG Results Presentation | for the half-year ended 30 September 2026 62
Slide 63: Footprint movement since March 2026
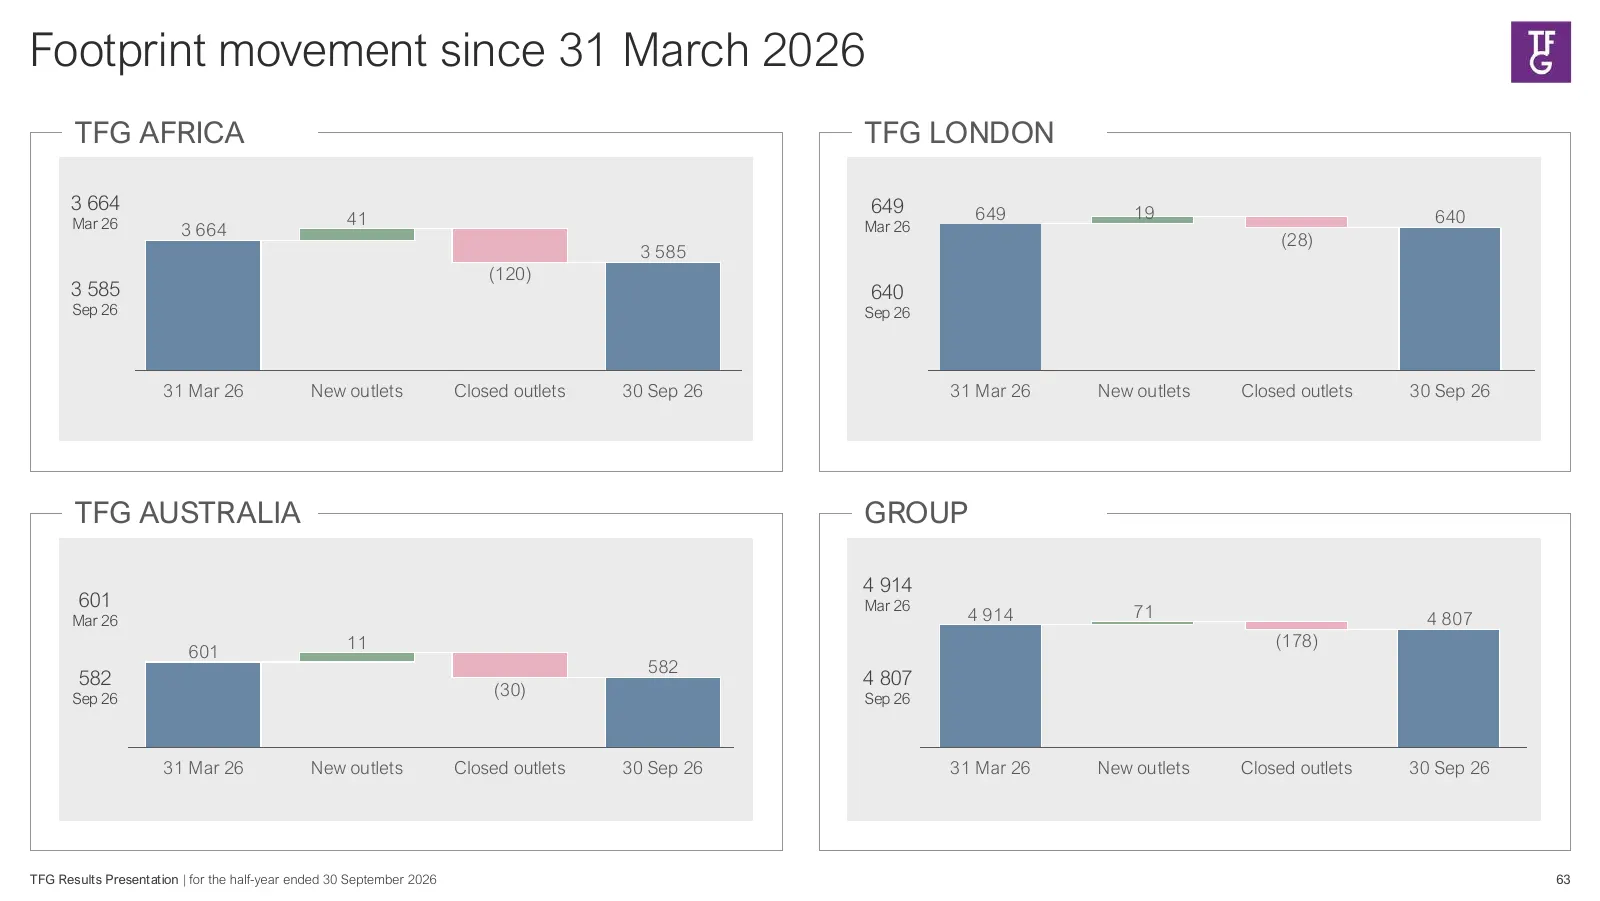
Footprint movement since 31 March 2026 TFG AFRICA TFG LONDON 3 664 649 649 19 Mar 26 41 Mar 26 640 3 664 (28) 3 585 (120) 3 585 640 Sep 26 Sep 26 31 Mar 26 New outlets Closed outlets 30 Sep 26 31 Mar 26 New outlets Closed outlets 30 Sep 26 TFG AUSTRALIA GROUP 4 914 601 Mar 26 Mar 26 4 914 71 4 807 1
Slide 64: TFG Africa Footprint
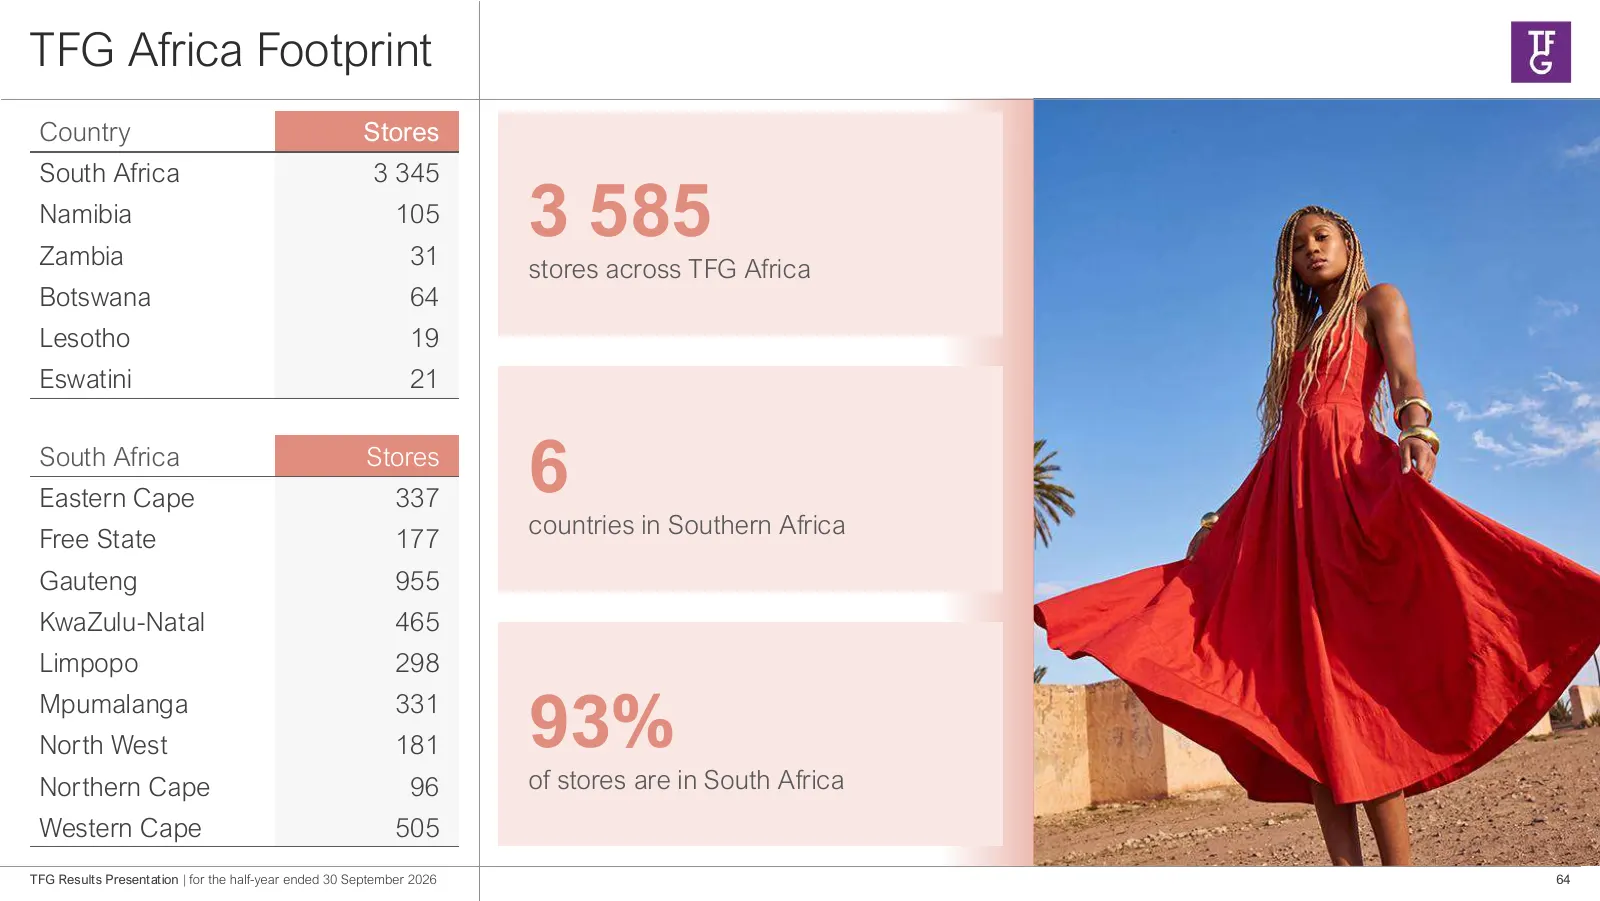
TFG Africa Footprint Country Stores South Africa 3 345 Namibia Zambia 105 31 3 585 stores across TFG Africa Botswana 64 Lesotho 19 Eswatini 21 South Africa Eastern Cape Stores 337 6 countries in Southern Africa Free State 177 Gauteng 955 KwaZulu-Natal 465 Limpopo 298 Mpumalanga North West 331 181 93
Slide 65: TFG London footprint
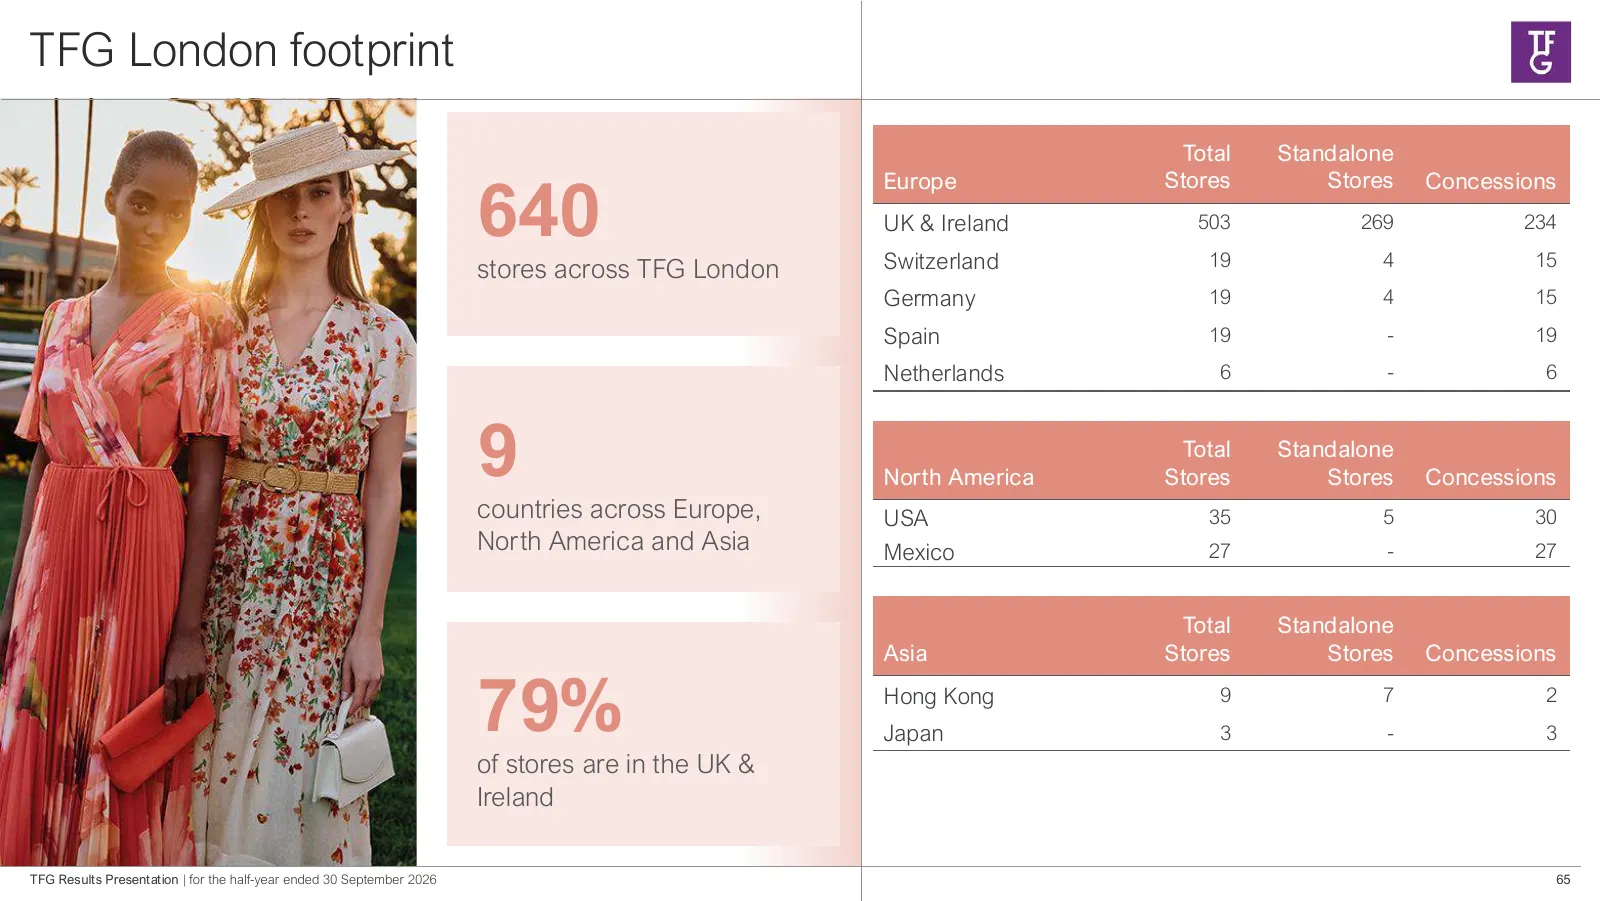
TFG London footprint Total Standalone 640 Europe Stores Stores Concessions UK & Ireland 503 269 234 stores across TFG London Switzerland 19 4 15 Germany 19 4 15 Spain 19 - 19 Netherlands 6 - 6 9 North America Total Stores Standalone Stores Concessions countries across Europe, USA 35 5 30 North Ameri
Slide 66: TFG Australia footprint
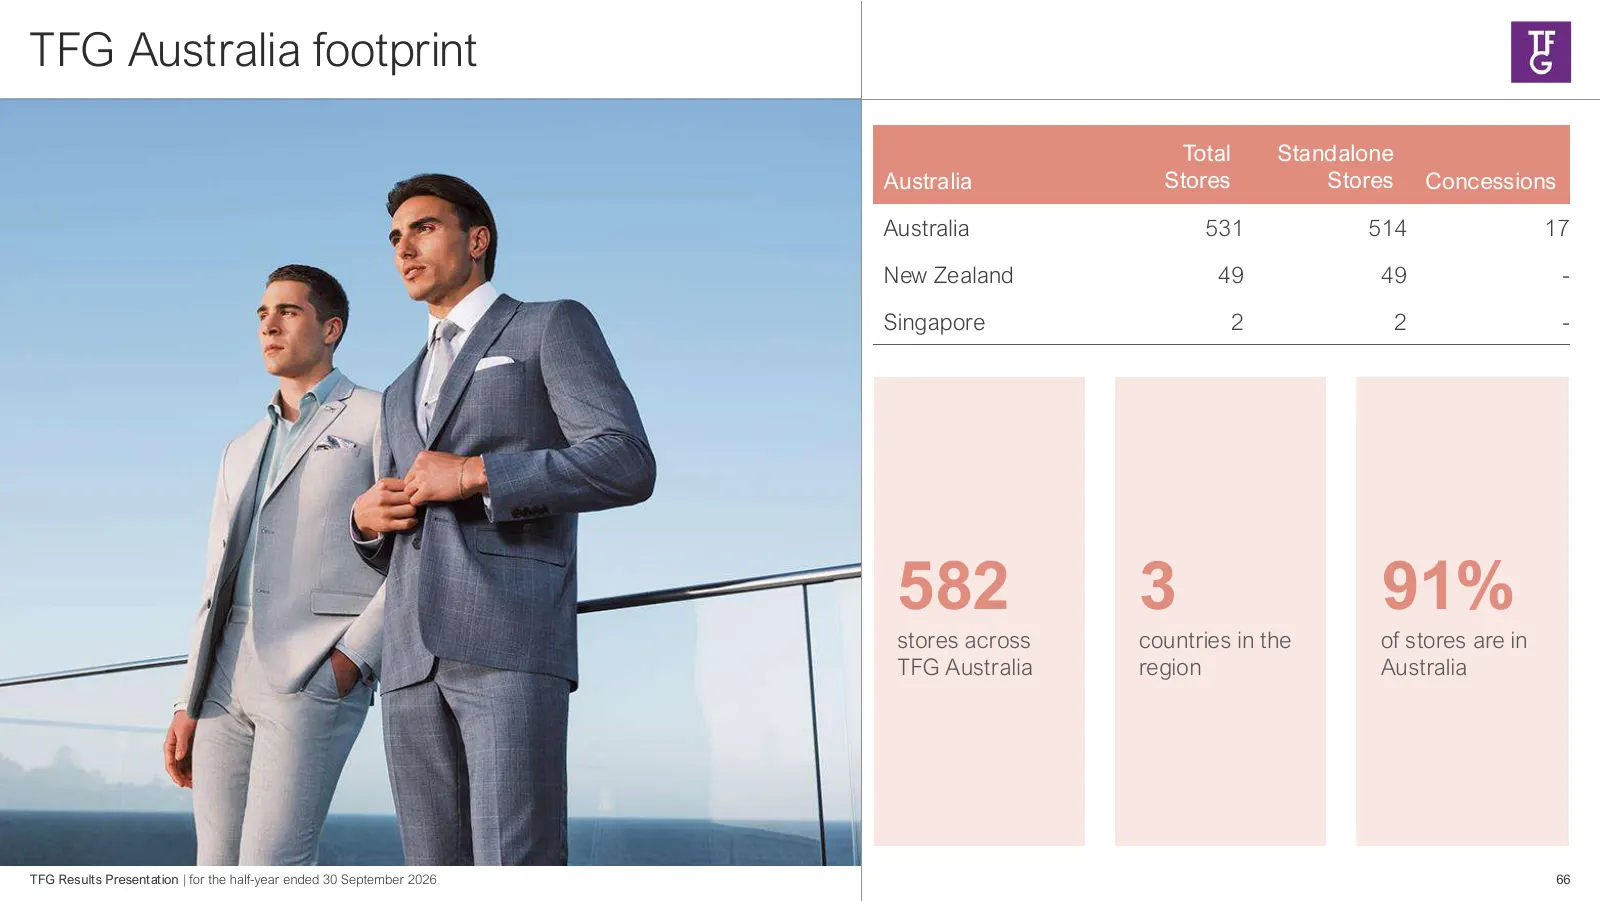
TFG Australia footprint Total Standalone Australia Stores Stores Concessions Australia 531 514 17 New Zealand 49 49 - Singapore 2 2 - 582 3 91% stores across countries in the of stores are in TFG Australia region Australia TFG Results Presentation | for the half-year ended 30 September 2026 66
Slide 67: Disclaimer
DISCLAIMER This announcement contains certain forward-looking statements with respect to the financial conditions and results of operations of the Foschini Group Limited and its subsidiaries, which by their nature involve risk and uncertainty because they relate to events and depend on circumstances
Source: company website
More decks from Foschini Group Limited
 The Foschini Group — FY2026 Earnings Presentation62 slides · Jun 1, 2026
 The Foschini Group Limited (TFG) — H1 FY2026 Earnings Presentation73 slides · Nov 6, 2025
 The Foschini Group Limited (TFG) — Investor Day (August 2025)35 slides · Aug 7, 2025
 FY2025 Earnings Presentation80 slides · June 2025
 H1 2025 Earnings Presentation75 slides · November 2024
 The Foschini Group — FY2024 Earnings Presentation72 slides · June 2024