Accel Entertainment, Inc. · NYSE:ACEL
Accel Entertainment — SPAC Merger (October 2019)
29 slides from Accel Entertainment's SPAC merger presentation, October 2019
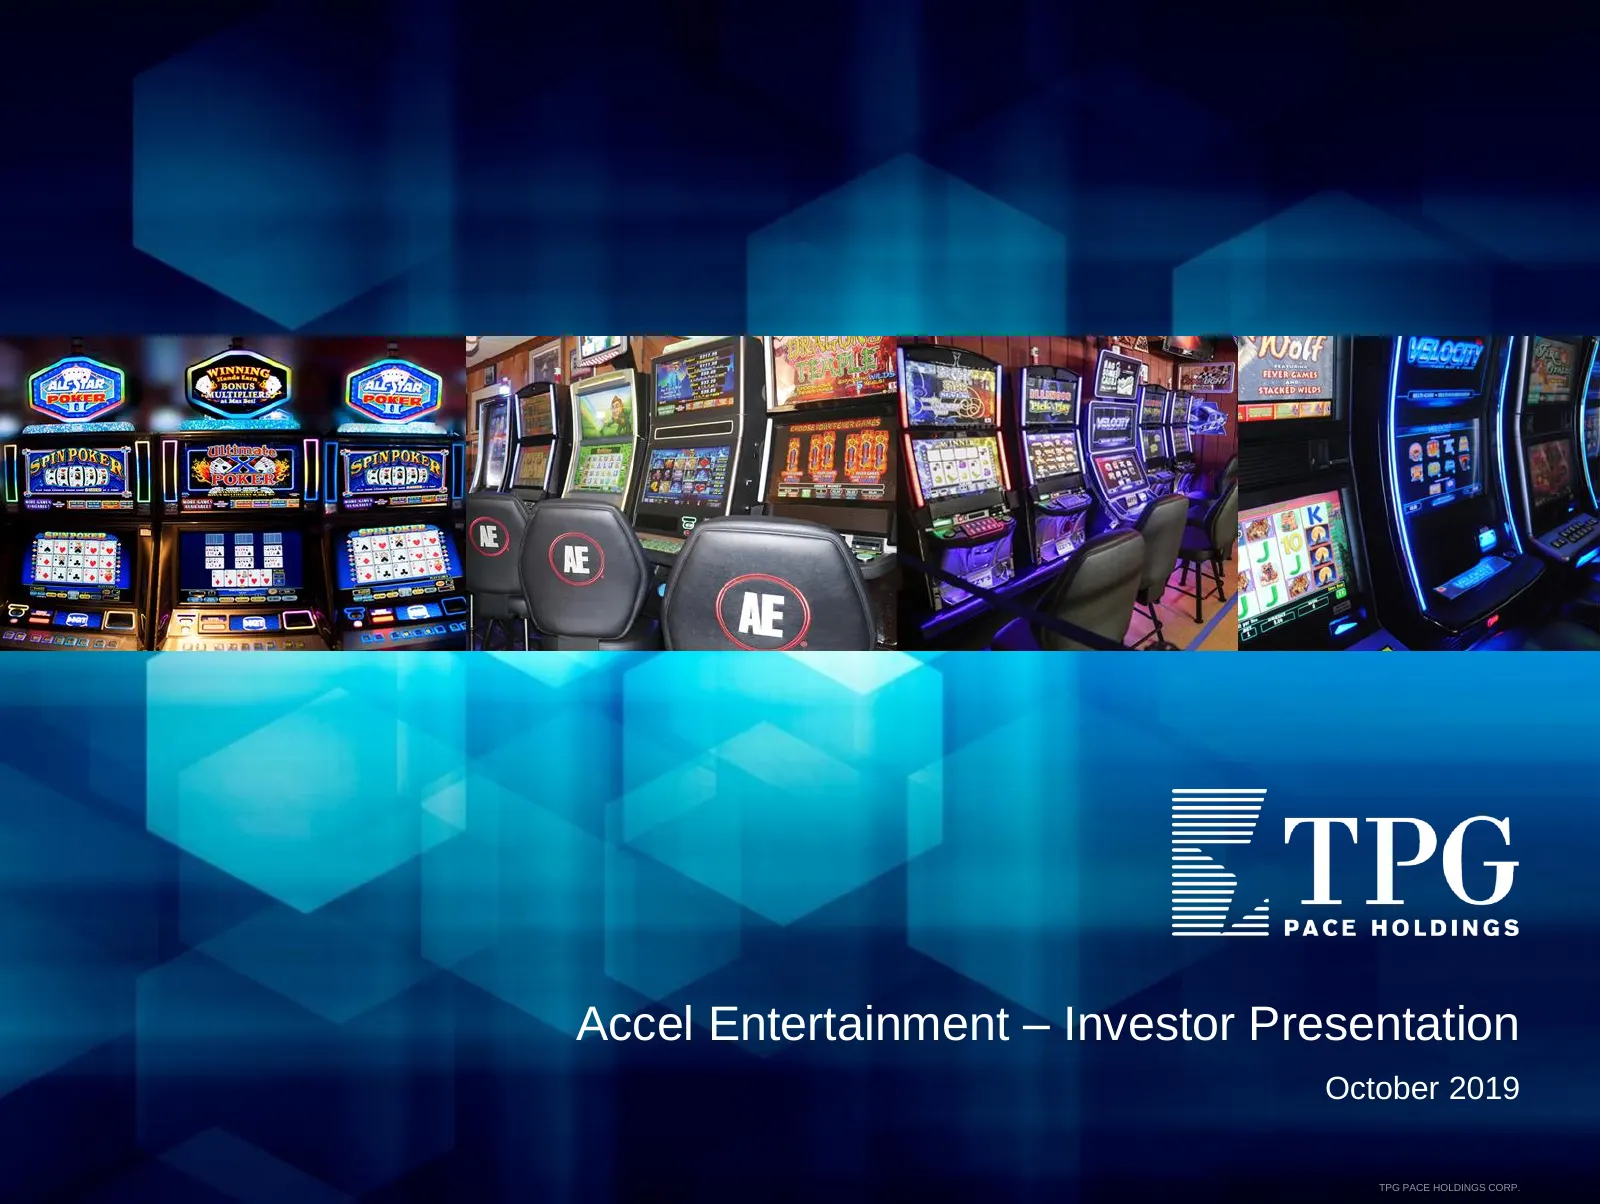
Slide 1: Accel Entertainment – Investor Presentation
Accel Entertainment – Investor Presentation October 2019 TPG PACE HOLDINGS CORP.
Slide 2: Important Information
Important Information Use of Projections This presentation contains financial forecasts prepared by TPG Pace Holdings Corp. (“Pace”) with respect to certain financial metrics of Accel Entertainment, Inc. (“Accel”), including, but not limited to, revenues (gaming, other, and gross), gross profit, adj
Slide 3: Important Information (continued)
Important Information (continued) No Representations or Warranties This presentation does not purport to contain all of the information that may be required to evaluate a possible transaction. No representation or warranty, express or implied, is or will be given by Pace or Accel or any of their res
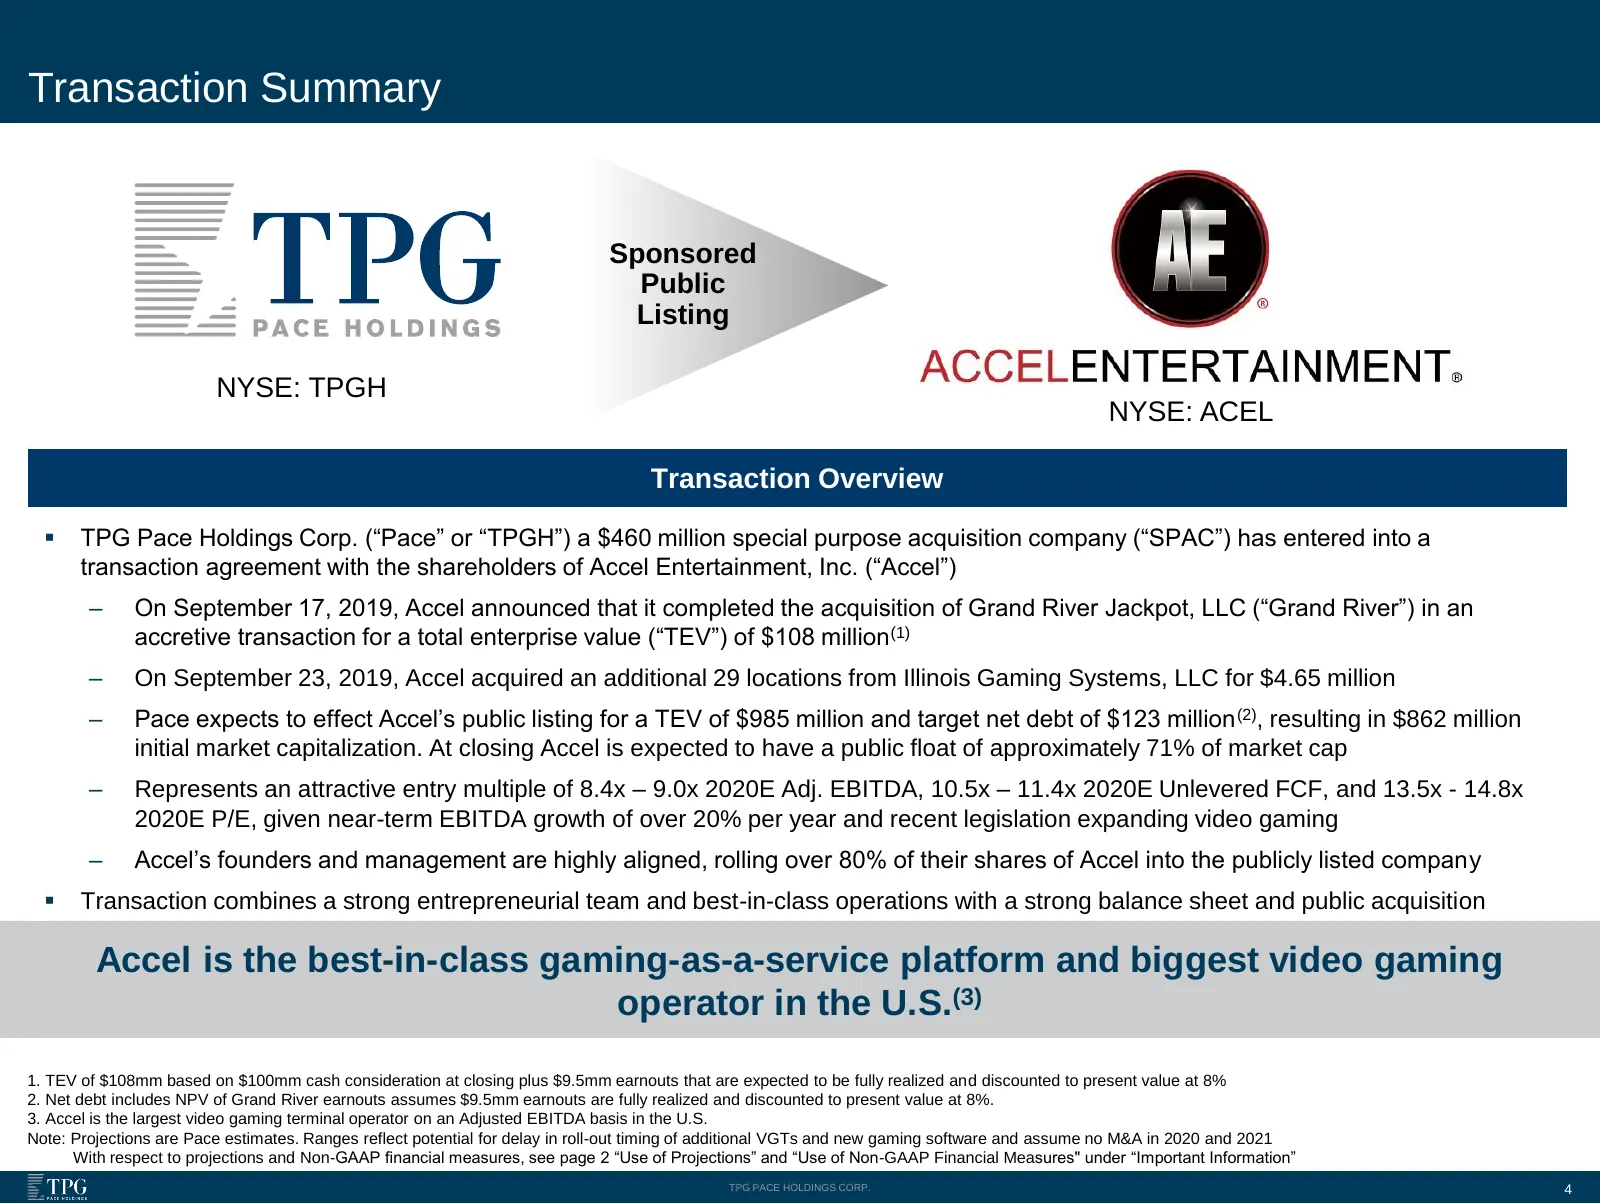
Slide 4: Transaction Summary
Transaction Summary Sponsored Public Listing NYSE: TPGH NYSE: ACEL Transaction Overview ▪ TPG Pace Holdings Corp. (“Pace” or “TPGH”) a $460 million special purpose acquisition company (“SPAC”) has entered into a transaction agreement with the shareholders of Accel Entertainment, Inc. (“Accel”) – On
Slide 5: Introduction to Accel
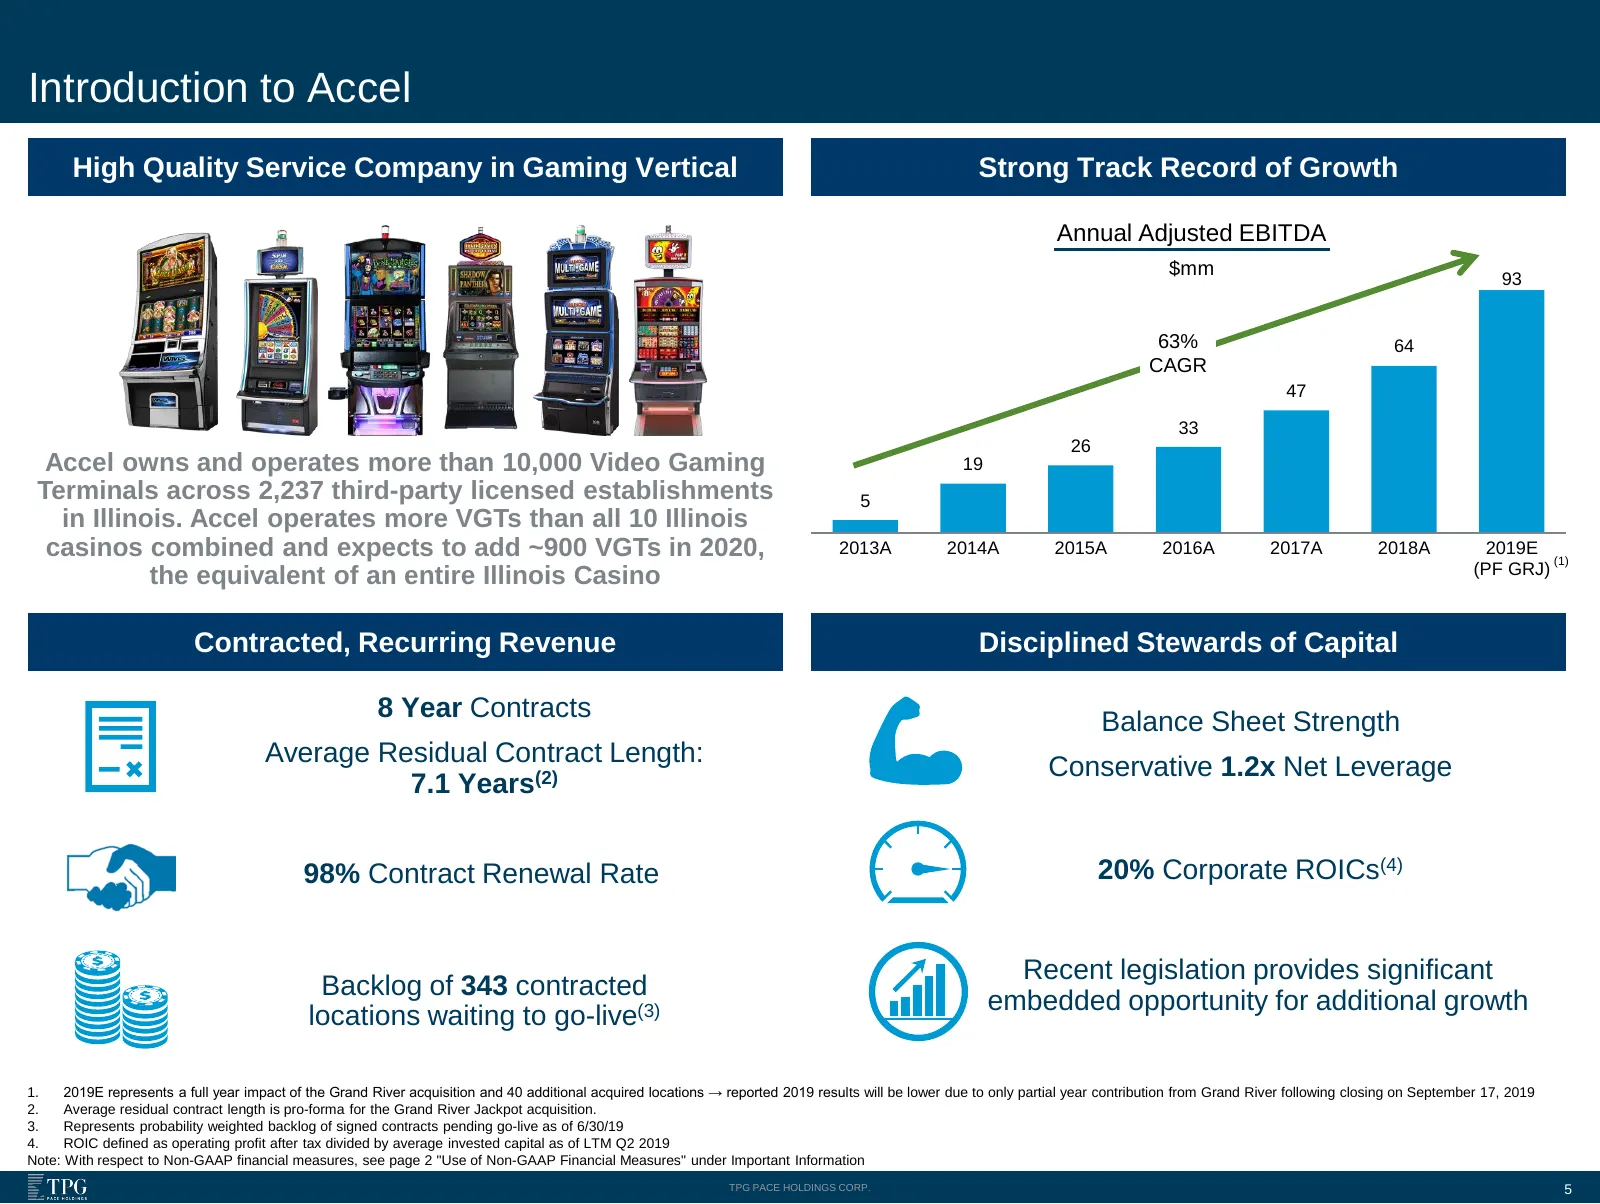
Introduction to Accel High Quality Service Company in Gaming Vertical Strong Track Record of Growth Annual Adjusted EBITDA $mm 93 63% 64 CAGR 47 33 26 Accel owns and operates more than 10,000 Video Gaming 19 Terminals across 2,237 third-party licensed establishments 5 in Illinois. Accel operates mor
Slide 6: Why Invest in Accel Entertainment?
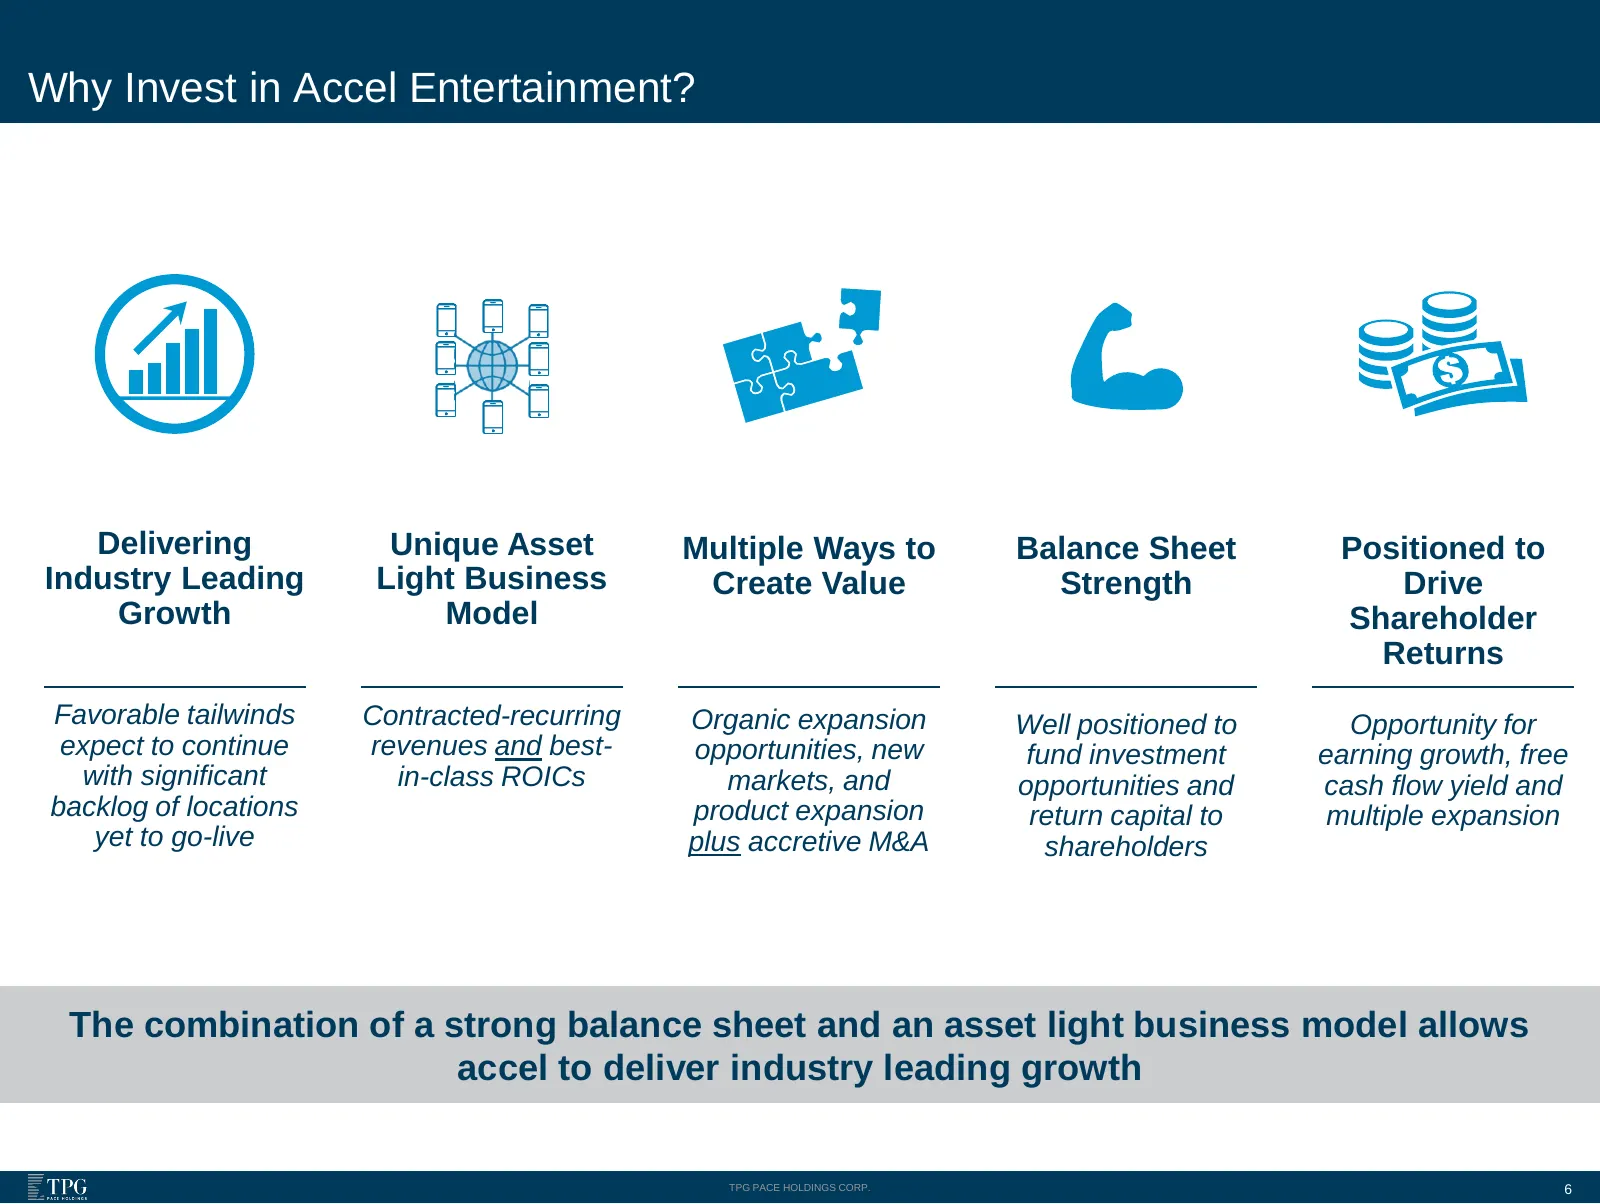
Why Invest in Accel Entertainment? Delivering Unique Asset Multiple Ways to Balance Sheet Positioned to Industry Leading Light Business Create Value Strength Drive Growth Model Shareholder Returns Favorable tailwinds Contracted-recurring Organic expansion Well positioned to Opportunity for expect to
Slide 7: Accel has a Straightforward Value Creation Plan
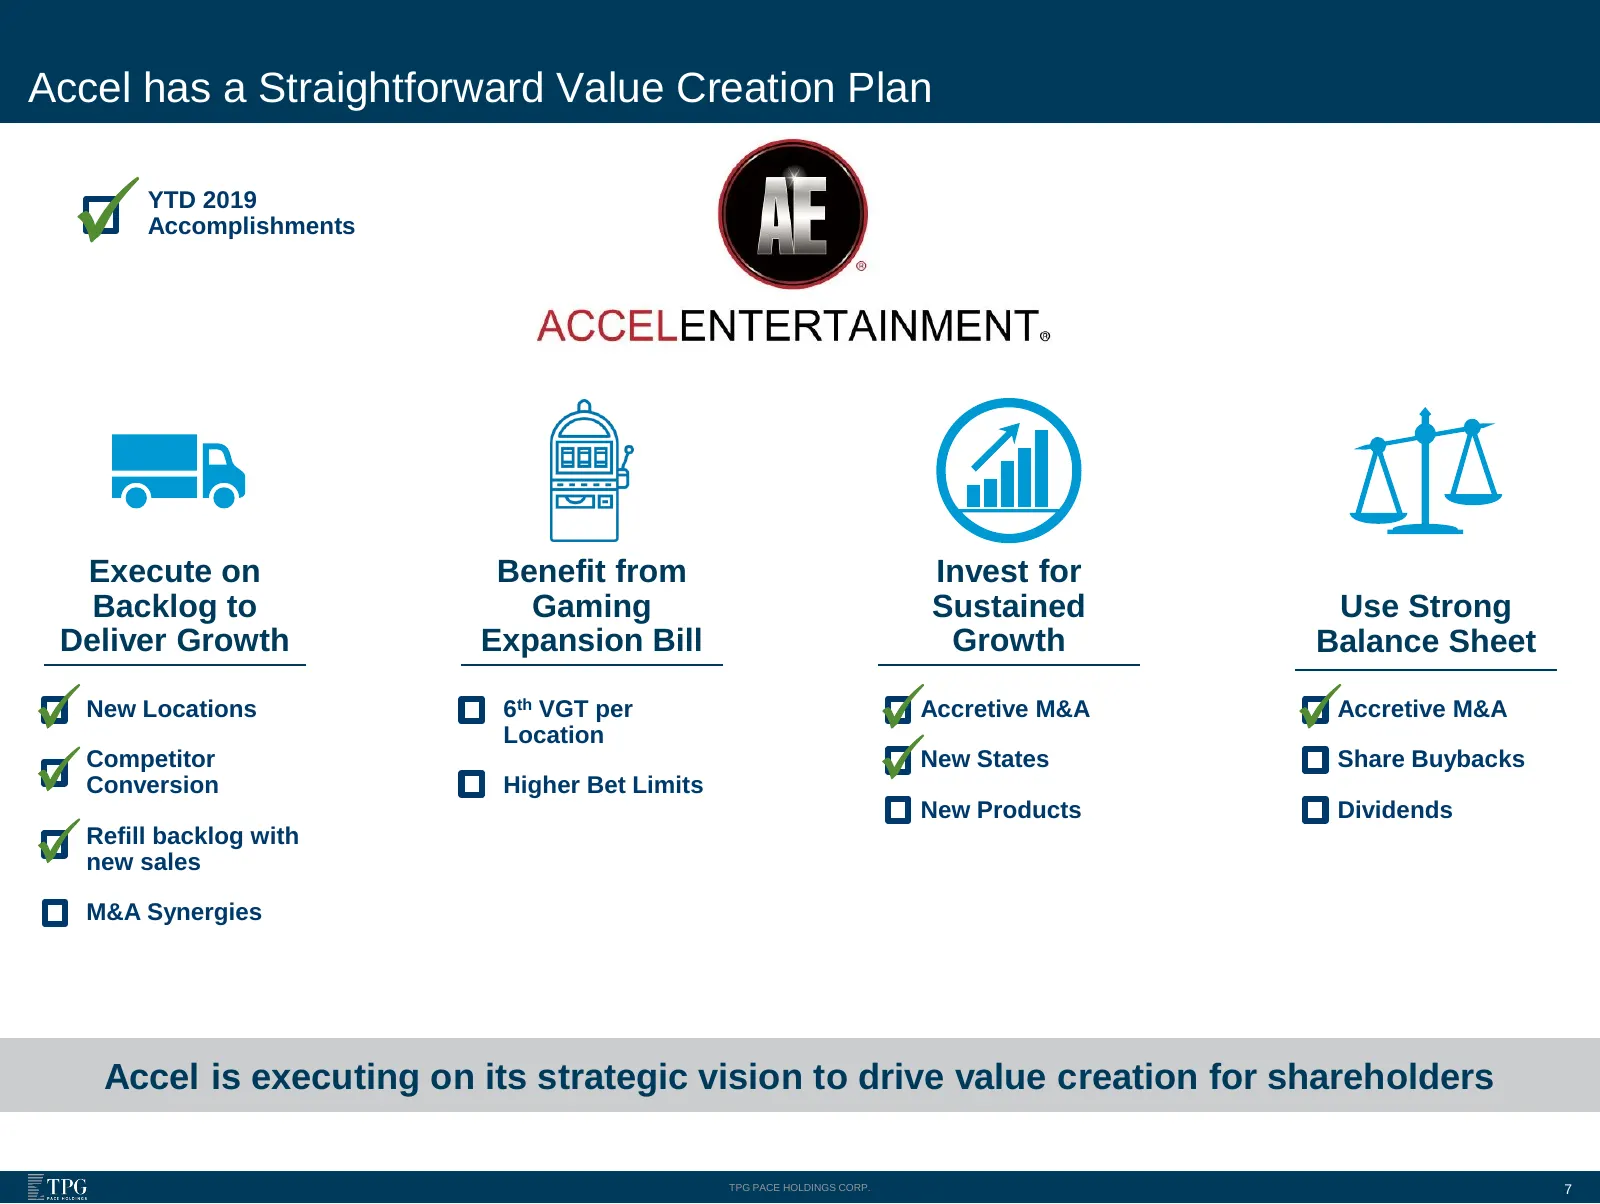
Accel has a Straightforward Value Creation Plan YTD 2019 Accomplishments Execute on Benefit from Invest for Backlog to Gaming Sustained Use Strong Deliver Growth Expansion Bill Growth Balance Sheet New Locations 6th VGT per Accretive M&A Accretive M&A Location Competitor New States Share Buybacks Co
Slide 8: Accel Revenue Growth Outstripping Industry at Large
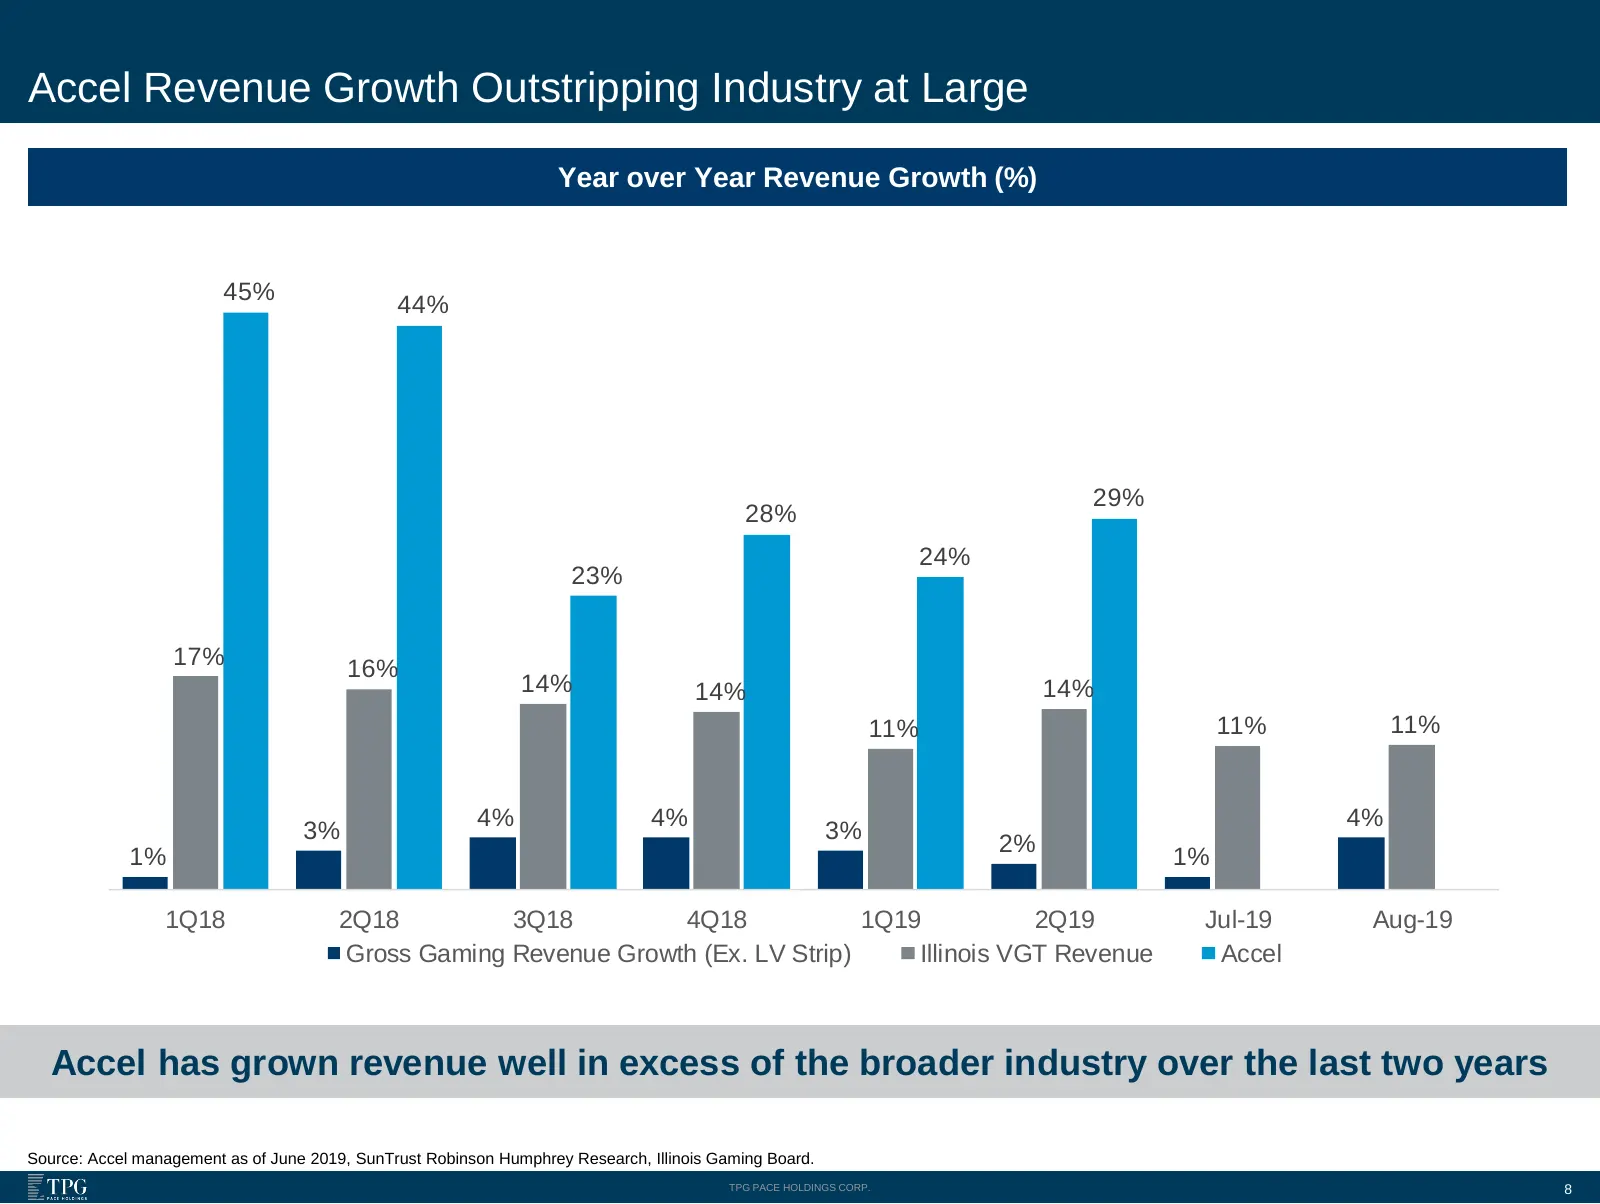
Accel Revenue Growth Outstripping Industry at Large Year over Year Revenue Growth (%) 45% 44% 29% 28% 24% 23% 17% 16% 14% 14% 14% 11% 11% 11% 4% 4% 4% 3% 3% 2% 1% 1% 1Q18 2Q18 3Q18 4Q18 1Q19 2Q19 Jul-19 Aug-19 Gross Gaming Revenue Growth (Ex. LV Strip) Illinois VGT Revenue Accel Accel has grown reve
Slide 9: Favorable Industry Tailwinds for Continued Growth
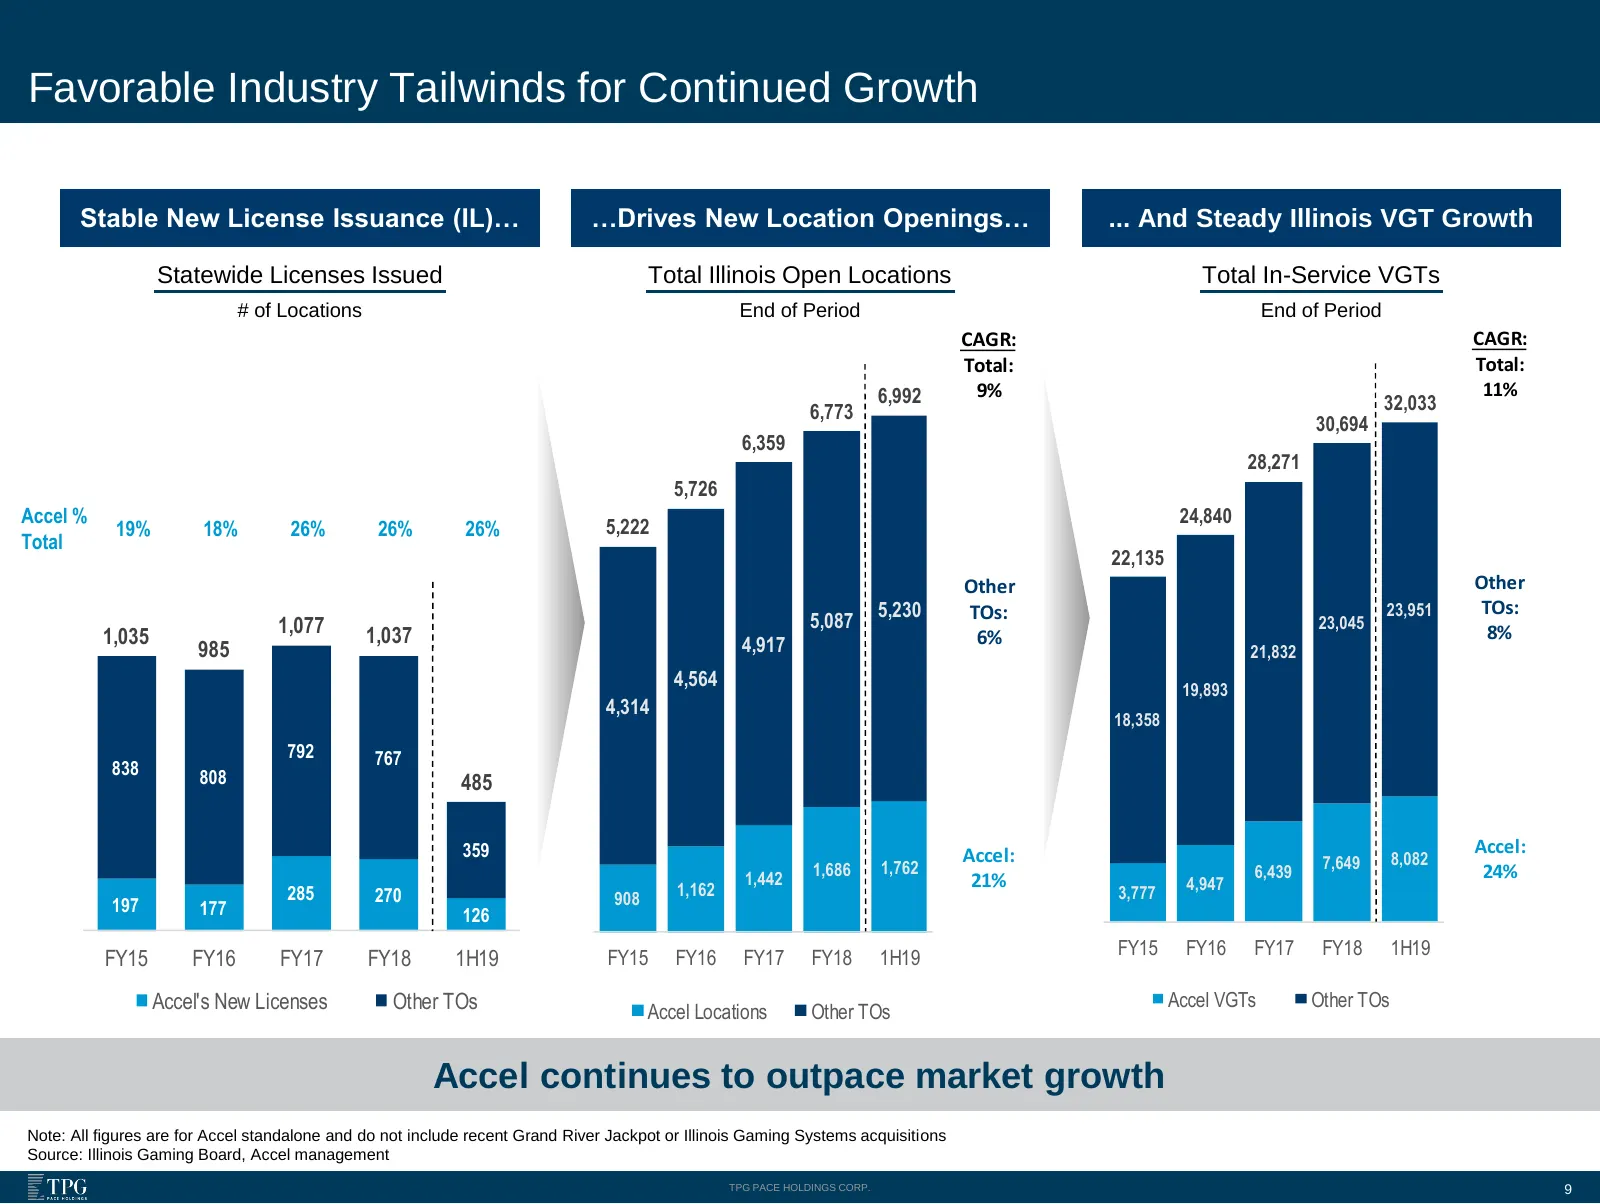
Favorable Industry Tailwinds for Continued Growth Stable New License Issuance (IL)… …Drives New Location Openings… ... And Steady Illinois VGT Growth Statewide Licenses Issued Total Illinois Open Locations Total In-Service VGTs # of Locations End of Period End of Period CAGR: CAGR: Total: Total: 6,9
Slide 10: Growth Opportunities Both In and Out of Illinois
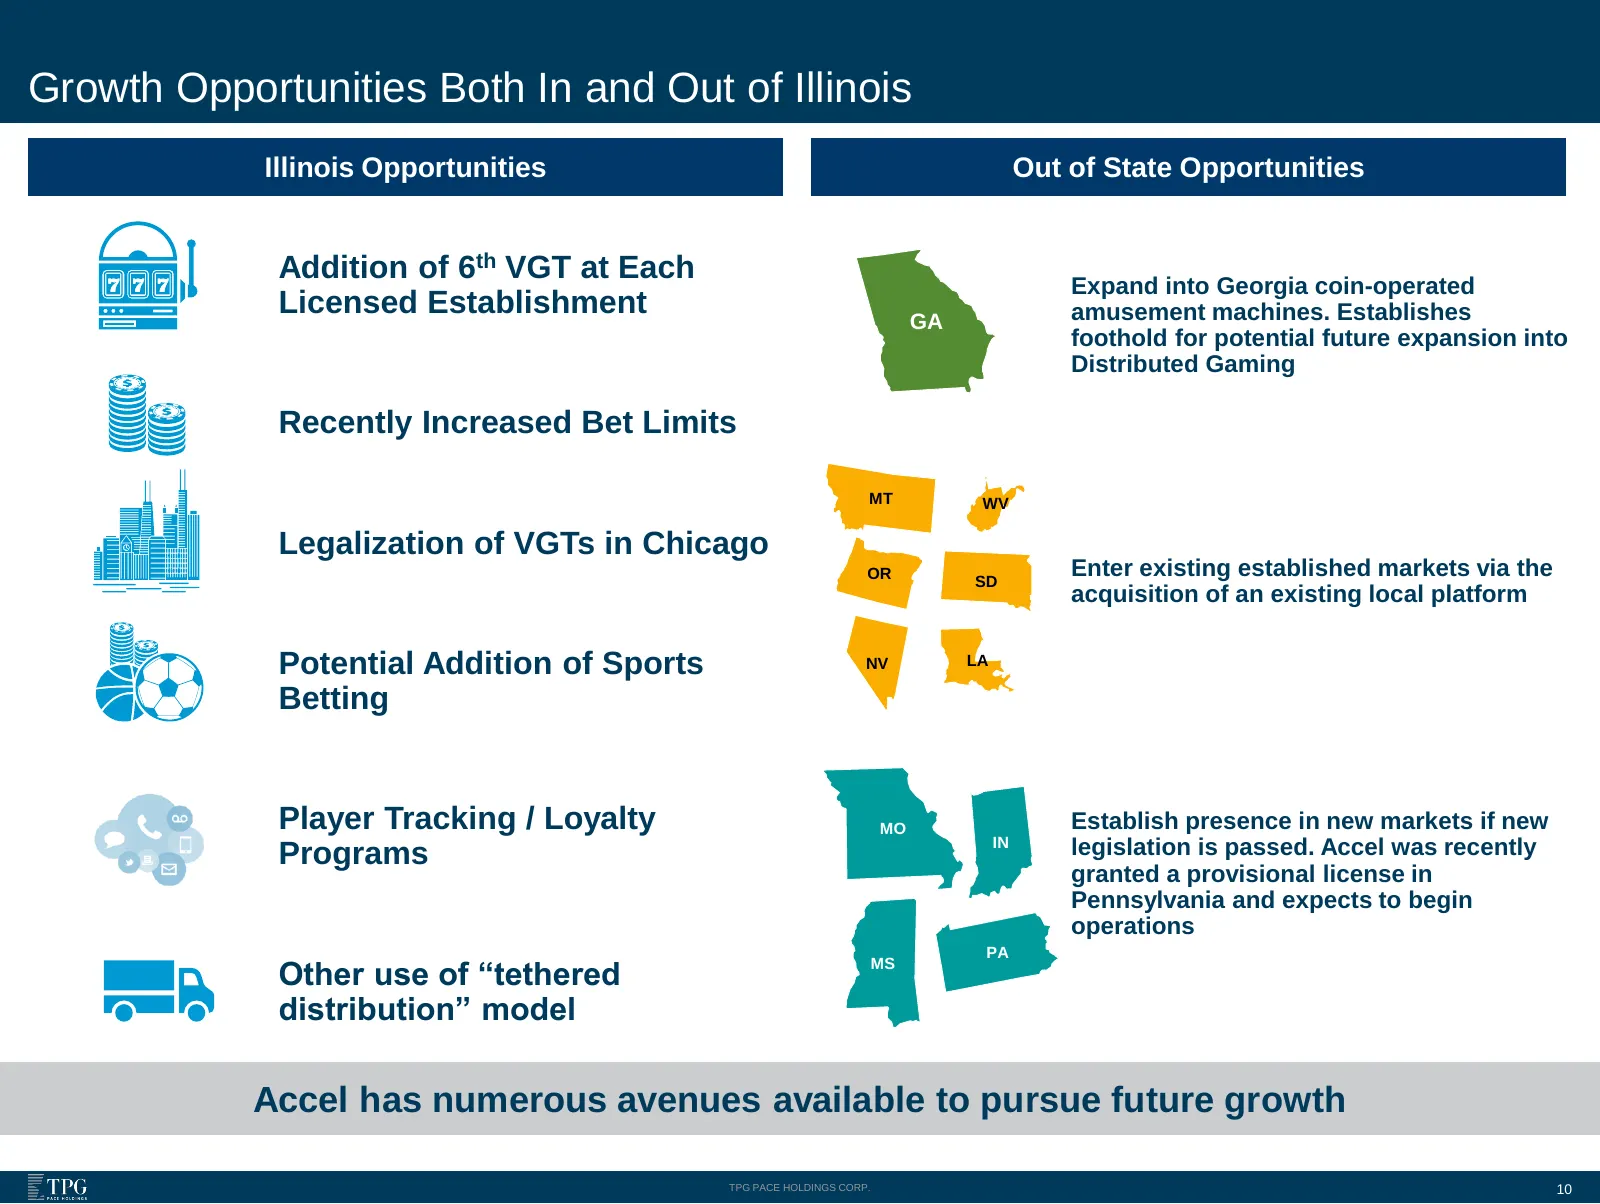
Growth Opportunities Both In and Out of Illinois Illinois Opportunities Out of State Opportunities Addition of 6th VGT at Each Expand into Georgia coin-operated Licensed Establishment amusement machines. Establishes GA foothold for potential future expansion into Distributed Gaming Recently Increase
Slide 11: Attractive Unit Economics
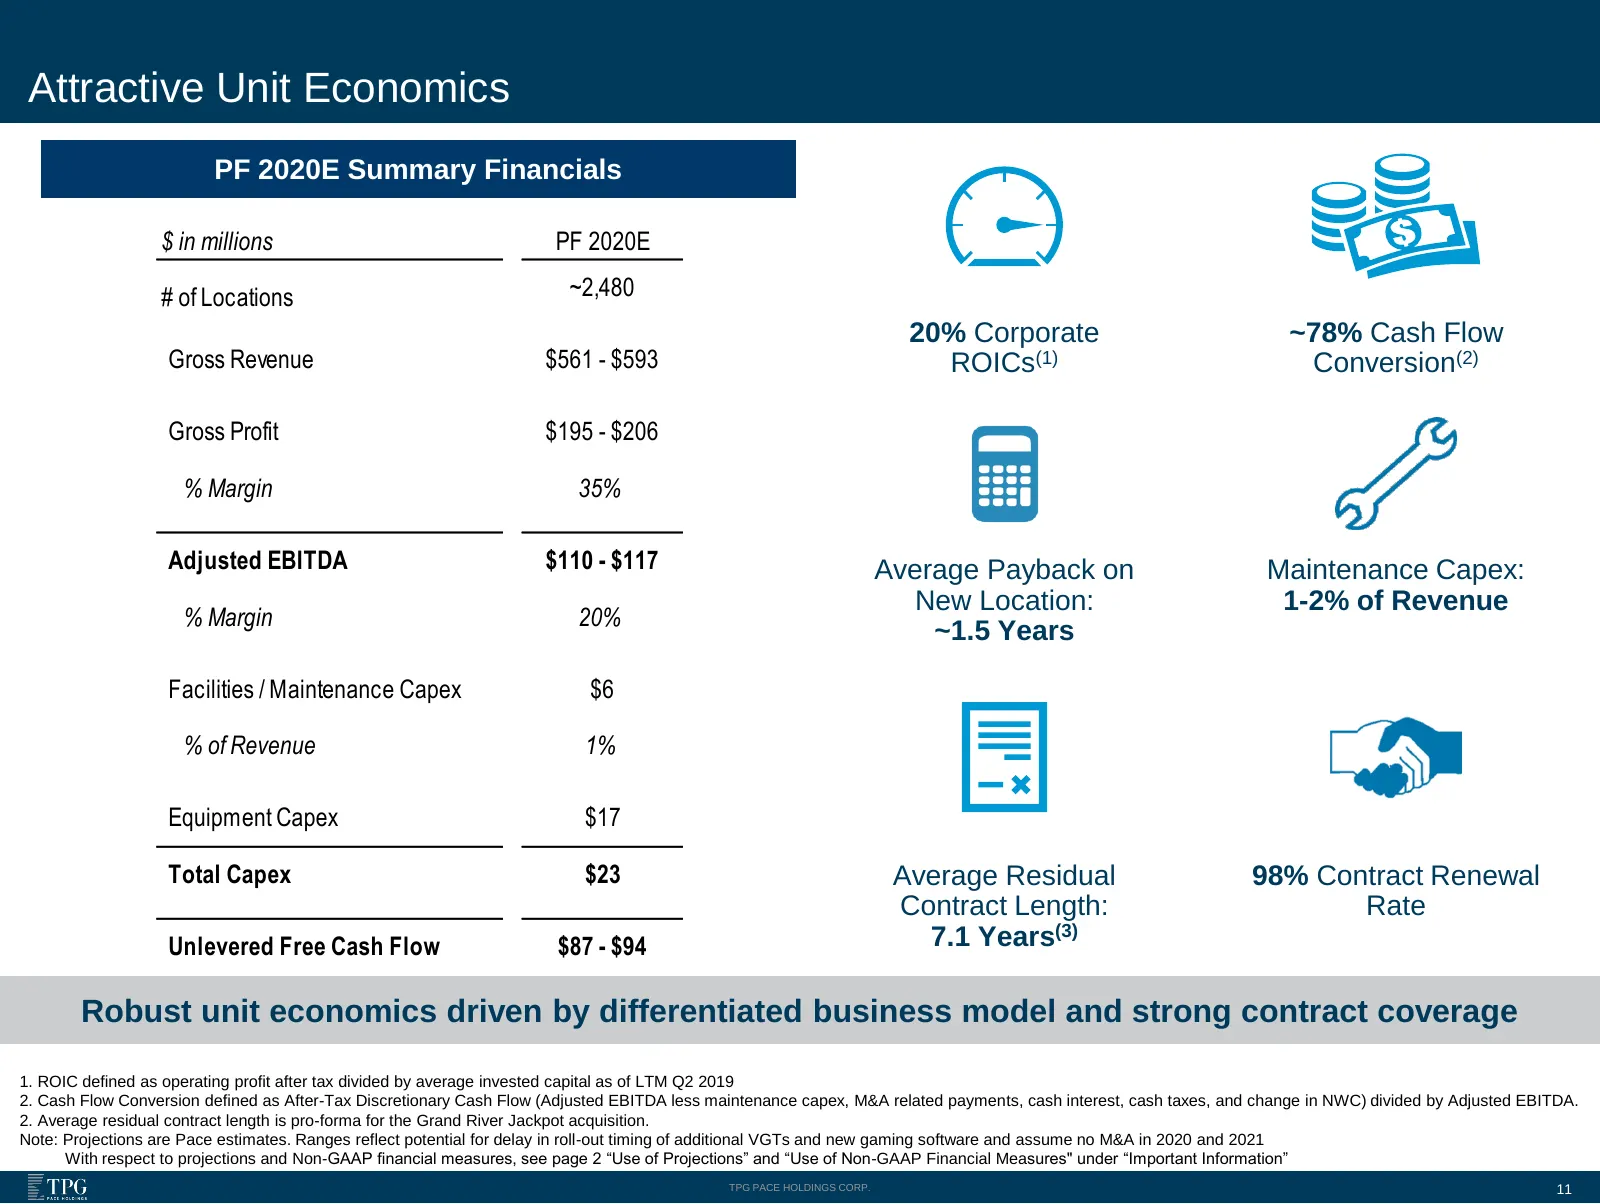
Attractive Unit Economics PF 2020E Summary Financials $ in millions PF 2020E # of Locations ~2,480 20% Corporate ~78% Cash Flow Gross Revenue $561 - $593 ROICs(1) Conversion(2) Gross Profit $195 - $206 % Margin 35% Adjusted EBITDA $110 - $117 Average Payback on Maintenance Capex: New Location: 1-2%
Slide 12: Fragmented Landscape in Illinois
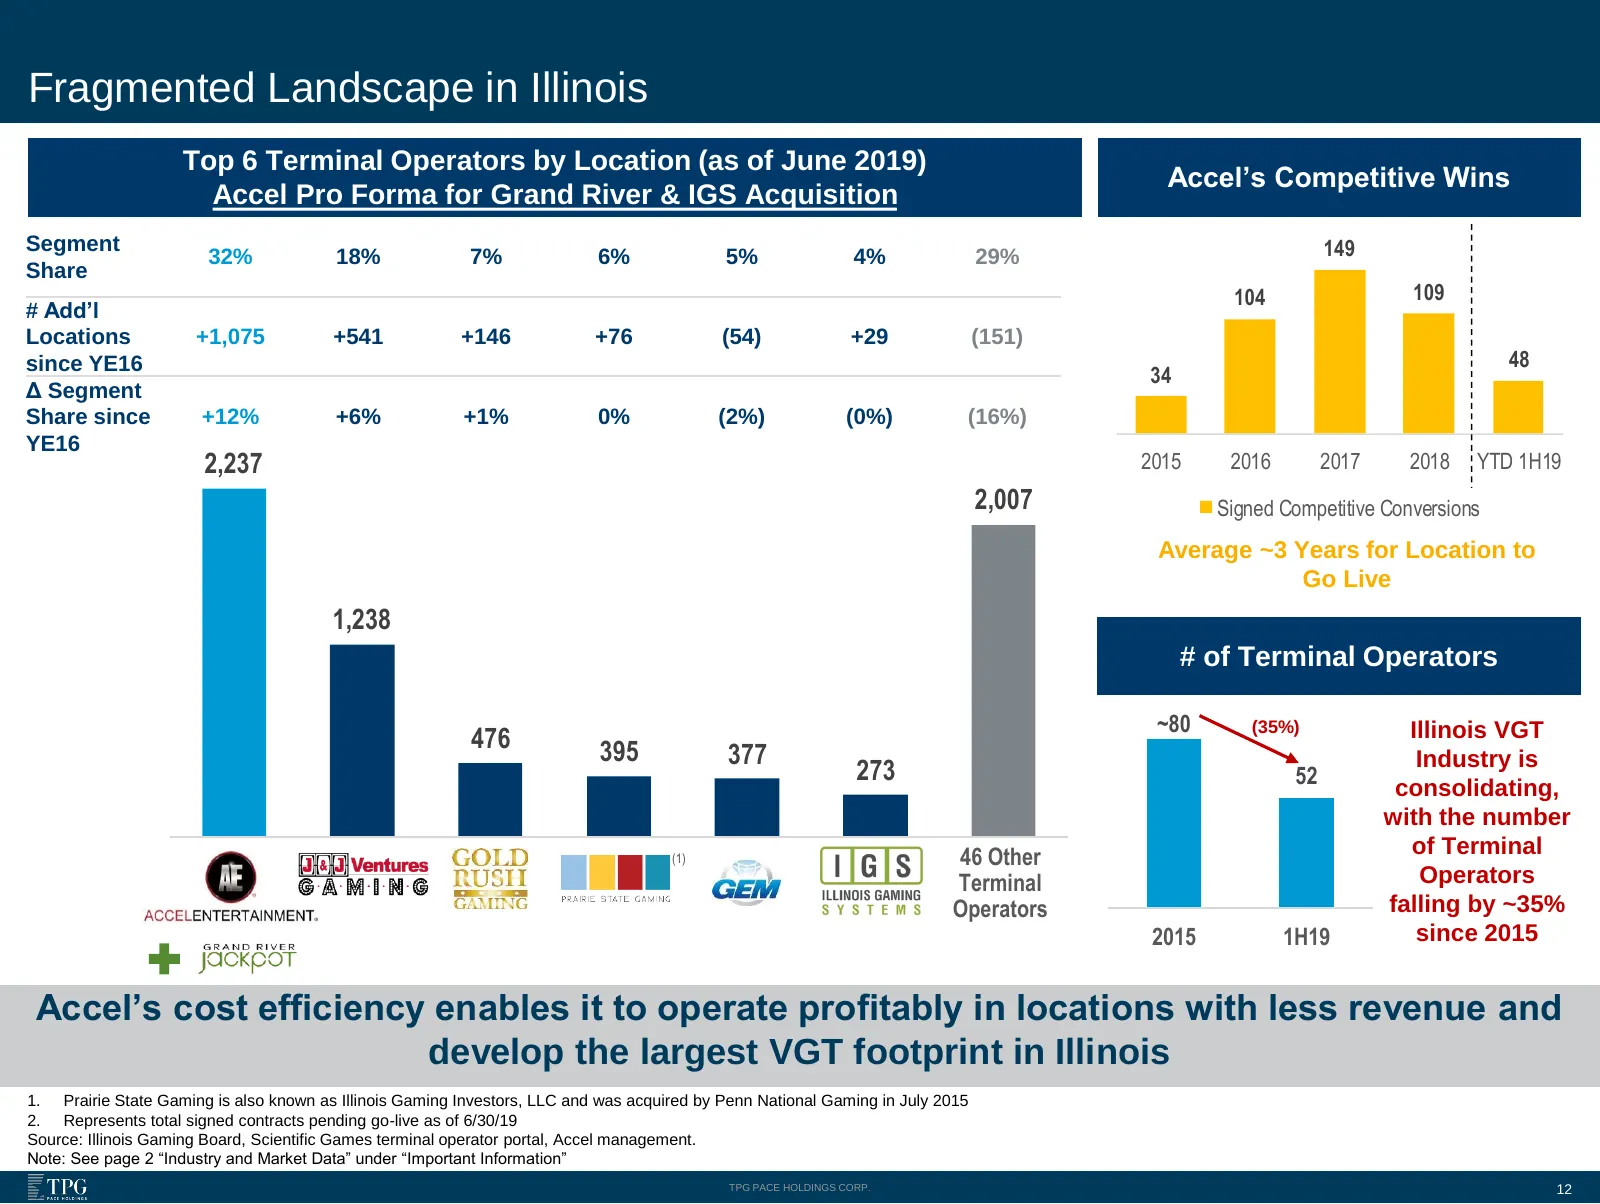
Fragmented Landscape in Illinois Top 6 Terminal Operators by Location (as of June 2019) Accel’s Competitive Wins Accel Pro Forma for Grand River & IGS Acquisition Segment 32% 18% 7% 6% 5% 4% 29% 149 Share 104 109 # Add’l Locations +1,075 +541 +146 +76 (54) +29 (151) since YE16 48 34 Δ Segment Share
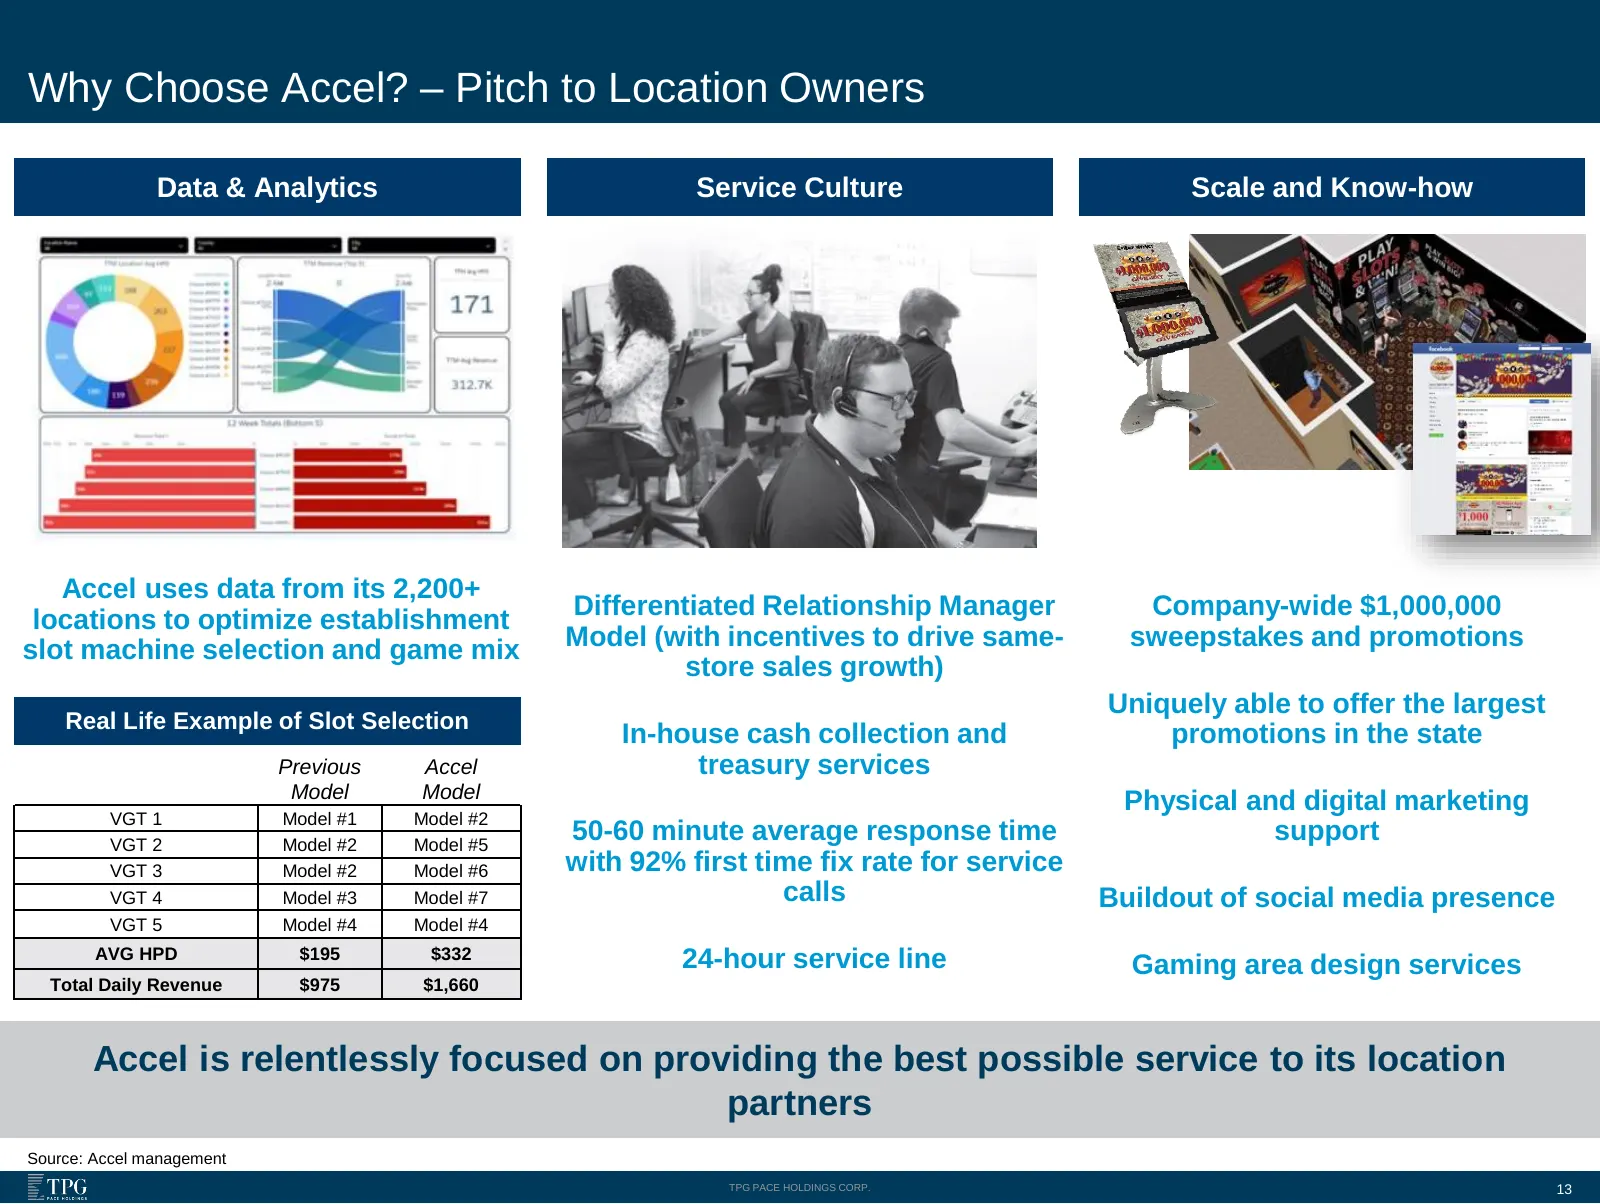
Slide 13: Why Choose Accel? – Pitch to Location Owners
Why Choose Accel? – Pitch to Location Owners Data & Analytics Service Culture Scale and Know-how Accel uses data from its 2,200+ locations to optimize establishment Differentiated Relationship Manager Company-wide $1,000,000 slot machine selection and game mix Model (with incentives to drive same- s
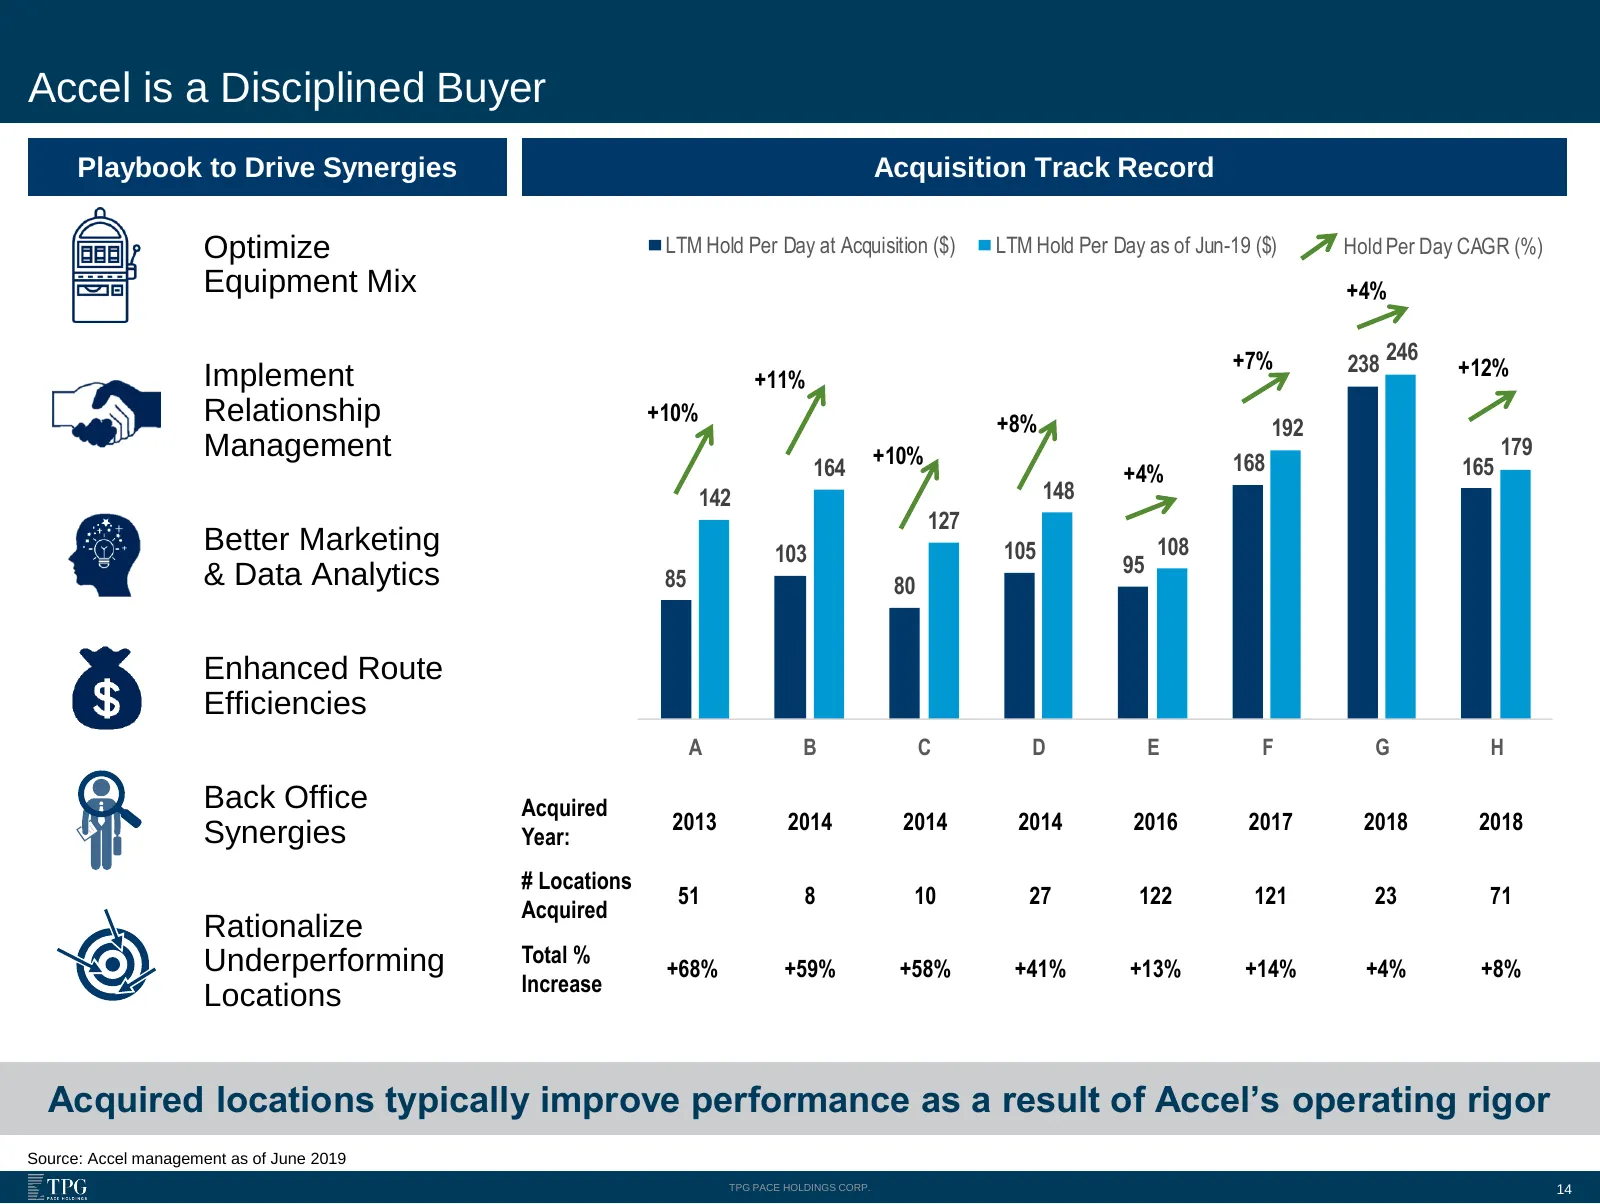
Slide 14: Accel is a Disciplined Buyer
Accel is a Disciplined Buyer Playbook to Drive Synergies Acquisition Track Record Optimize LTM Hold Per Day at Acquisition ($) LTM Hold Per Day as of Jun-19 ($) Hold Per Day CAGR (%) Equipment Mix +4% +7% 238 246 +12% Implement +11% Relationship +10% +8% 192 Management +10% 179 164 +4% 168 165 142 1
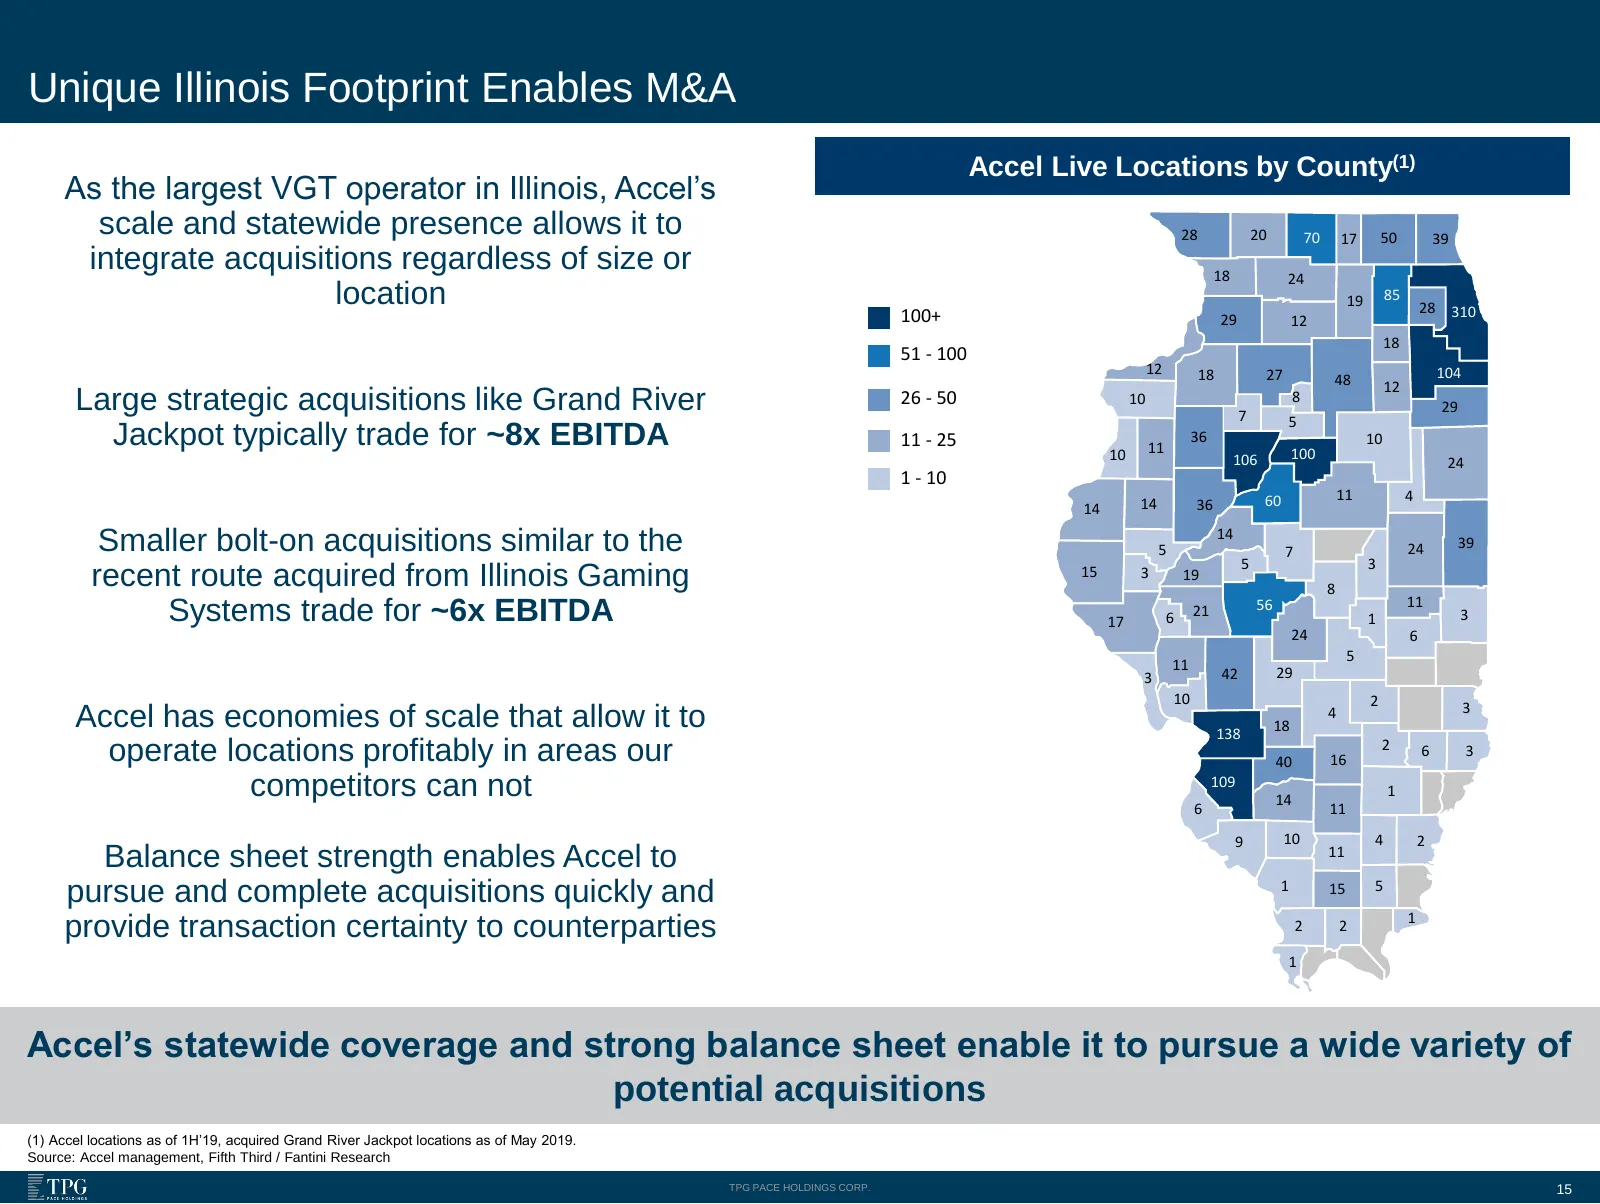
Slide 15: Unique Illinois Footprint Enables M&A
Unique Illinois Footprint Enables M&A Accel Live Locations by County(1) As the largest VGT operator in Illinois, Accel’s scale and statewide presence allows it to 28 20 70 17 50 39 integrate acquisitions regardless of size or 18 24 location 19 85 28 310 100+ 29 12 18 51 - 100 12 18 27 104 48 12 Larg
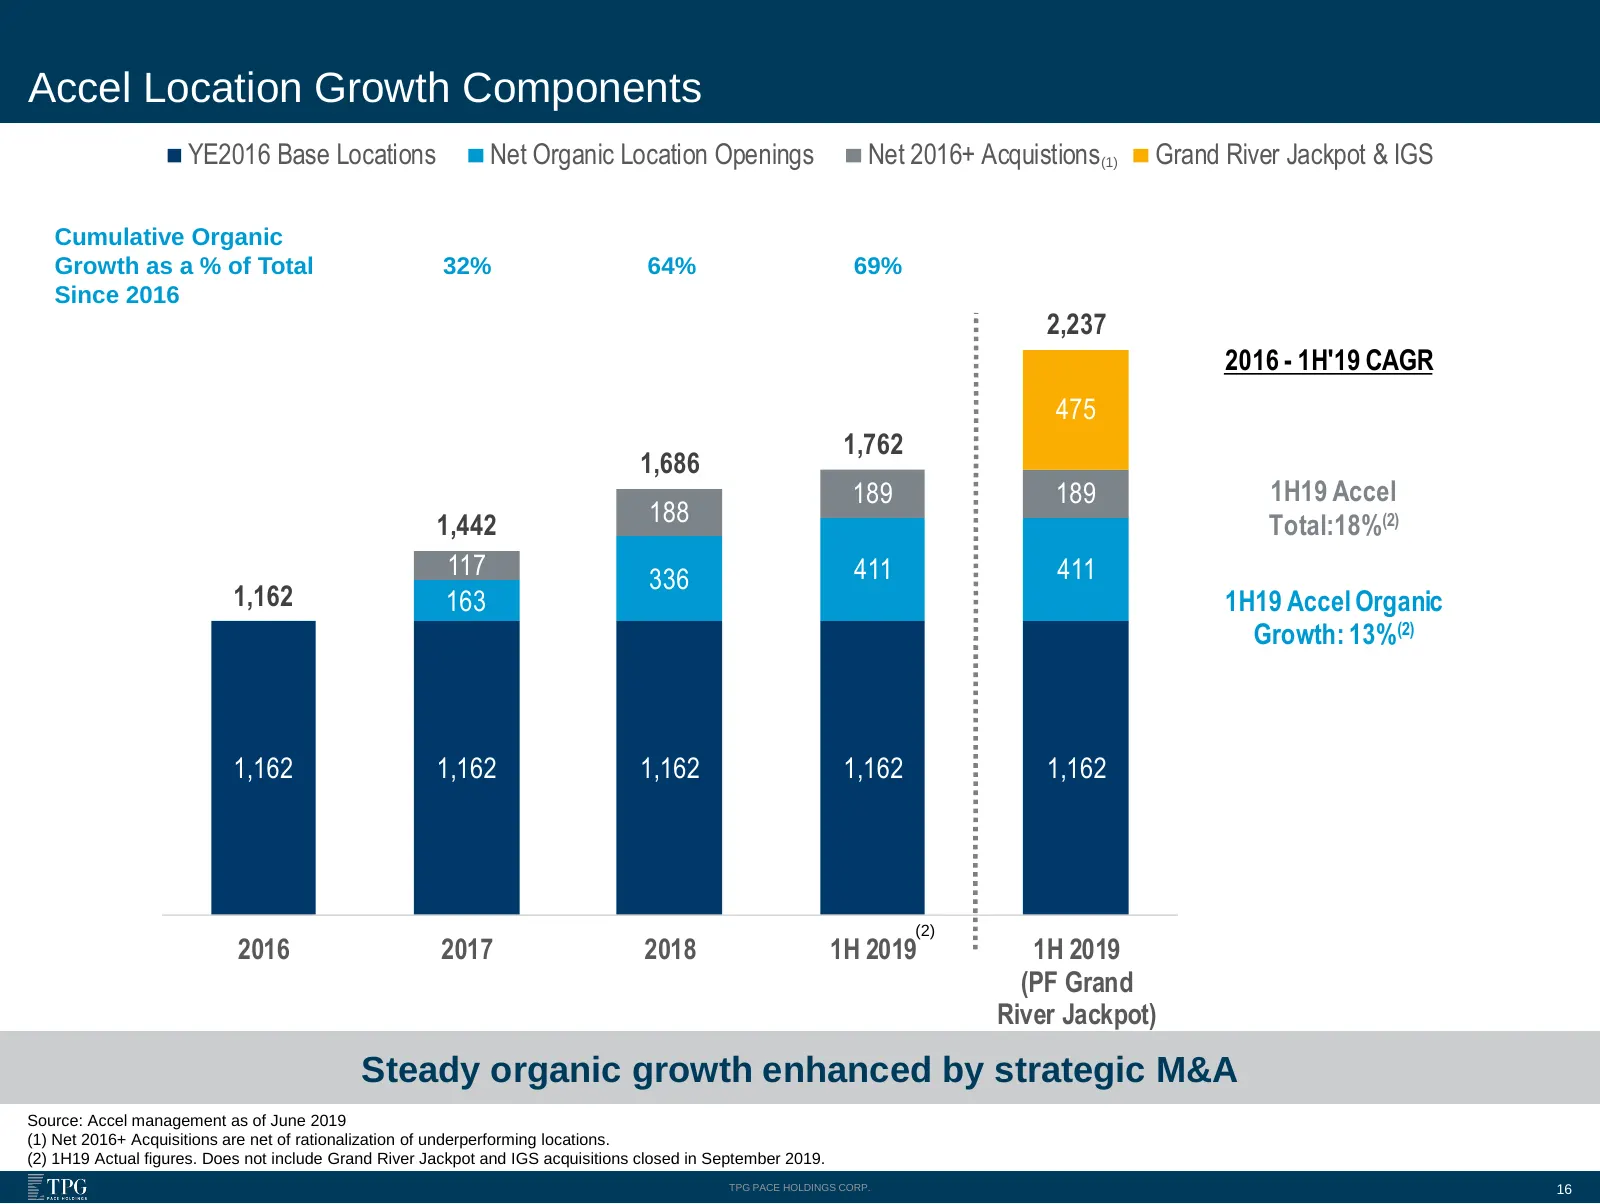
Slide 16: Accel Location Growth Components
Accel Location Growth Components YE2016 Base Locations Net Organic Location Openings Net 2016+ Acquistions(1) Grand River Jackpot & IGS Cumulative Organic Growth as a % of Total 32% 64% 69% Since 2016 2,237 2016 - 1H'19 CAGR 475 1,762 1,686 189 189 1H19 Accel 1,442 188 Total:18%(2) 117 336 411 411 1
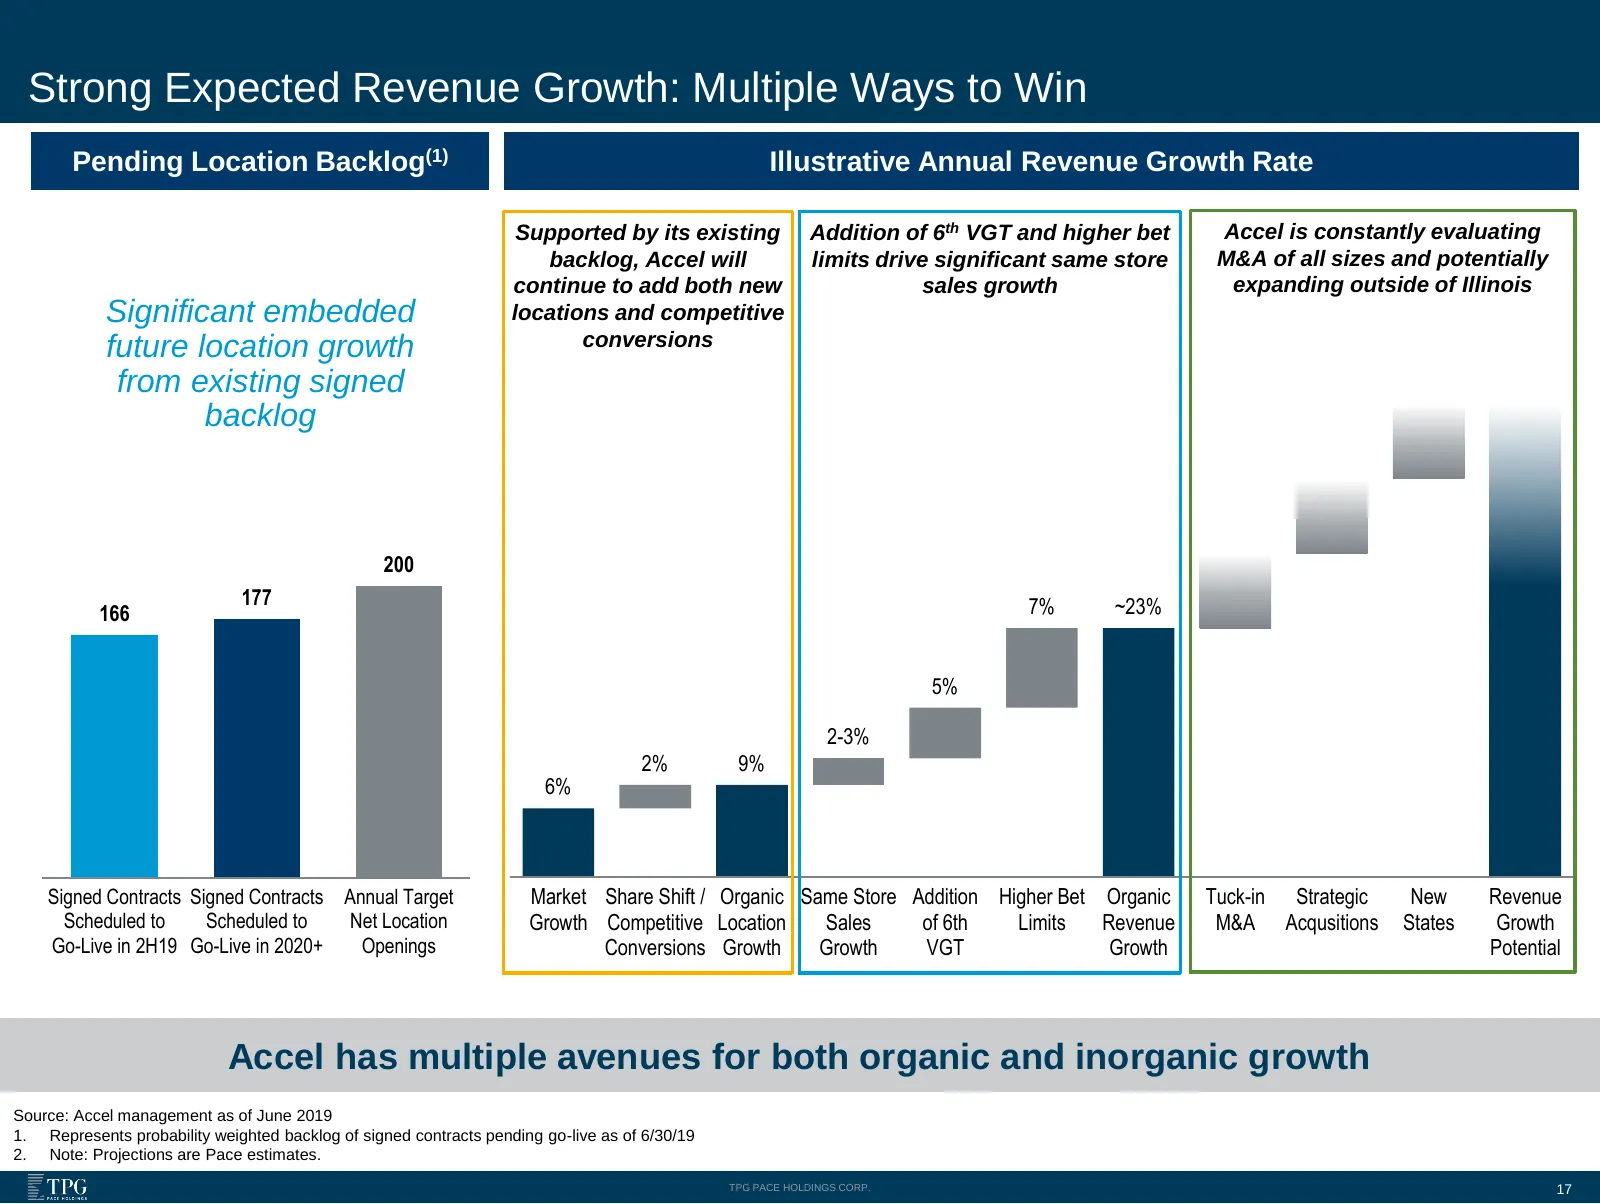
Slide 17: Strong Expected Revenue Growth: Multiple Ways to Win
Strong Expected Revenue Growth: Multiple Ways to Win Pending Location Backlog(1) Illustrative Annual Revenue Growth Rate Supported by its existing Addition of 6th VGT and higher bet Accel is constantly evaluating backlog, Accel will limits drive significant same store M&A of all sizes and potentiall
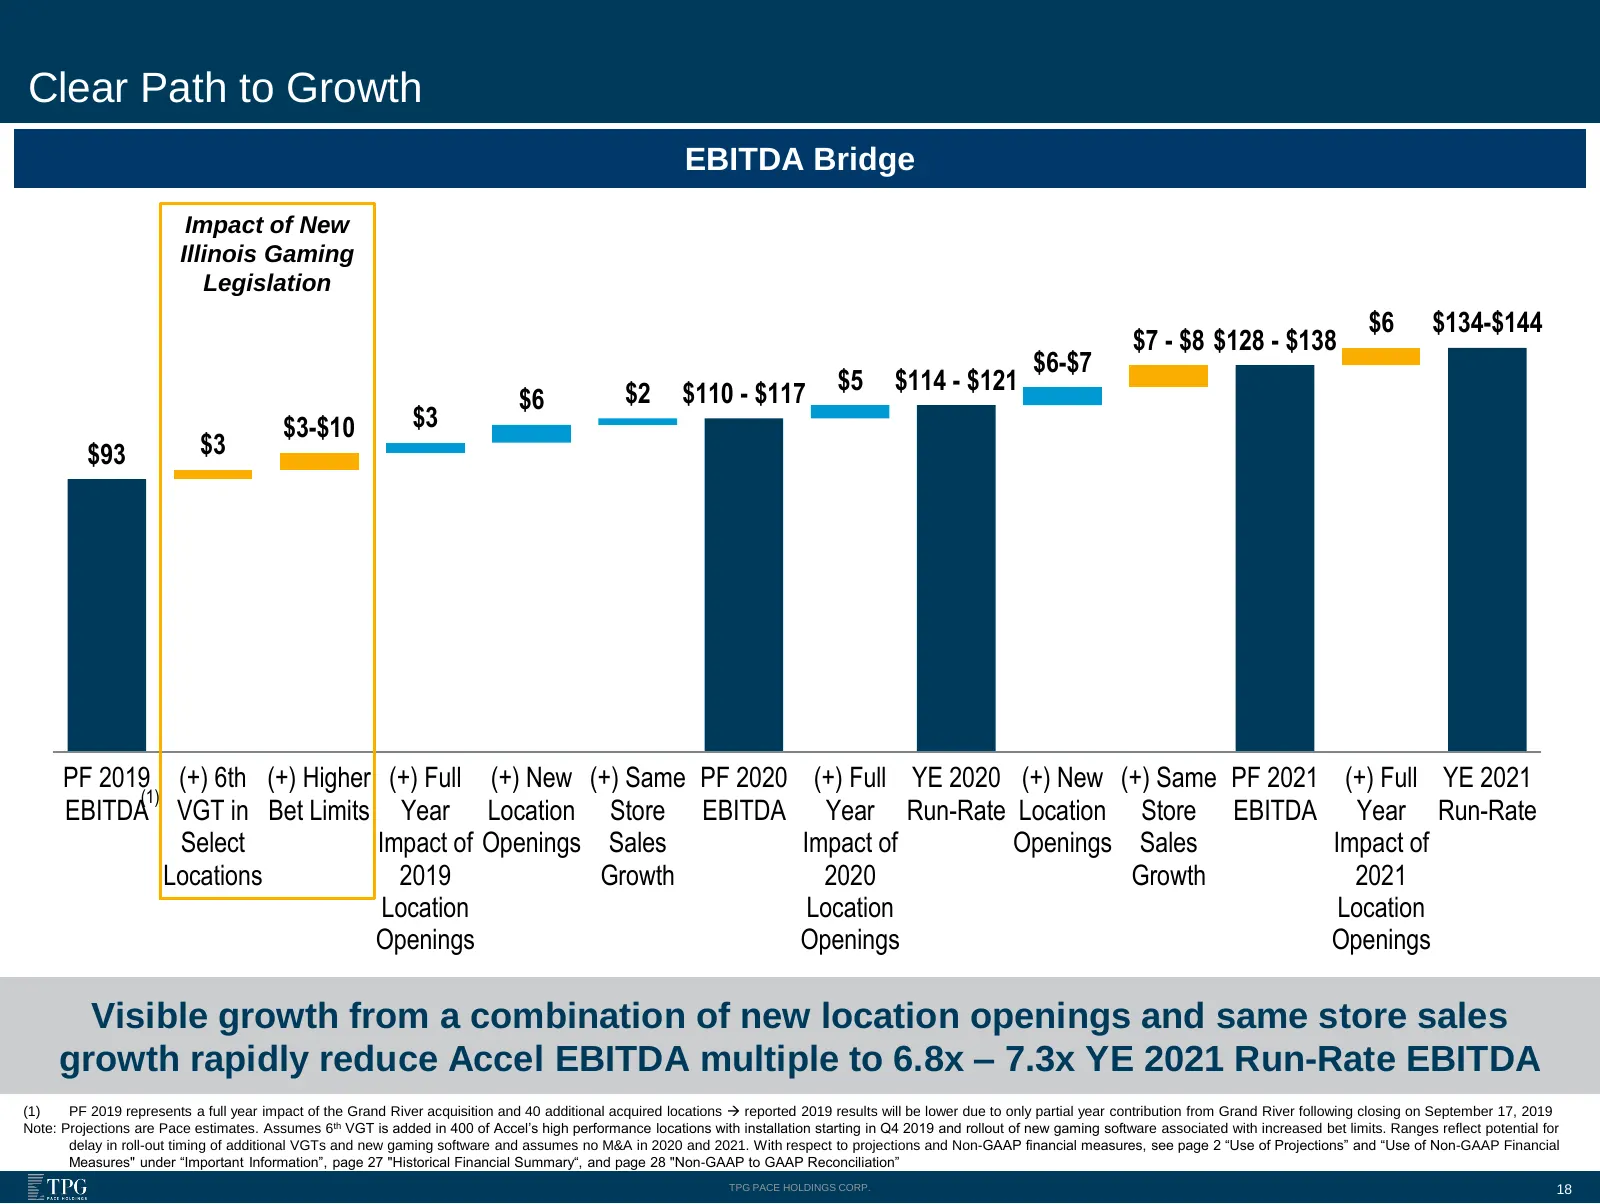
Slide 18: Clear Path to Growth
Clear Path to Growth EBITDA Bridge Impact of New Illinois Gaming Legislation $6 $134-$144 $7 - $8 $128 - $138 $6-$7 $2 $110 - $117 $5 $114 - $121 $6 $3-$10 $3 $93 $3 PF 2019 (+) 6th (+) Higher (+) Full (+) New (+) Same PF 2020 (+) Full YE 2020 (+) New (+) Same PF 2021 (+) Full YE 2021 (1) EBITDA VGT
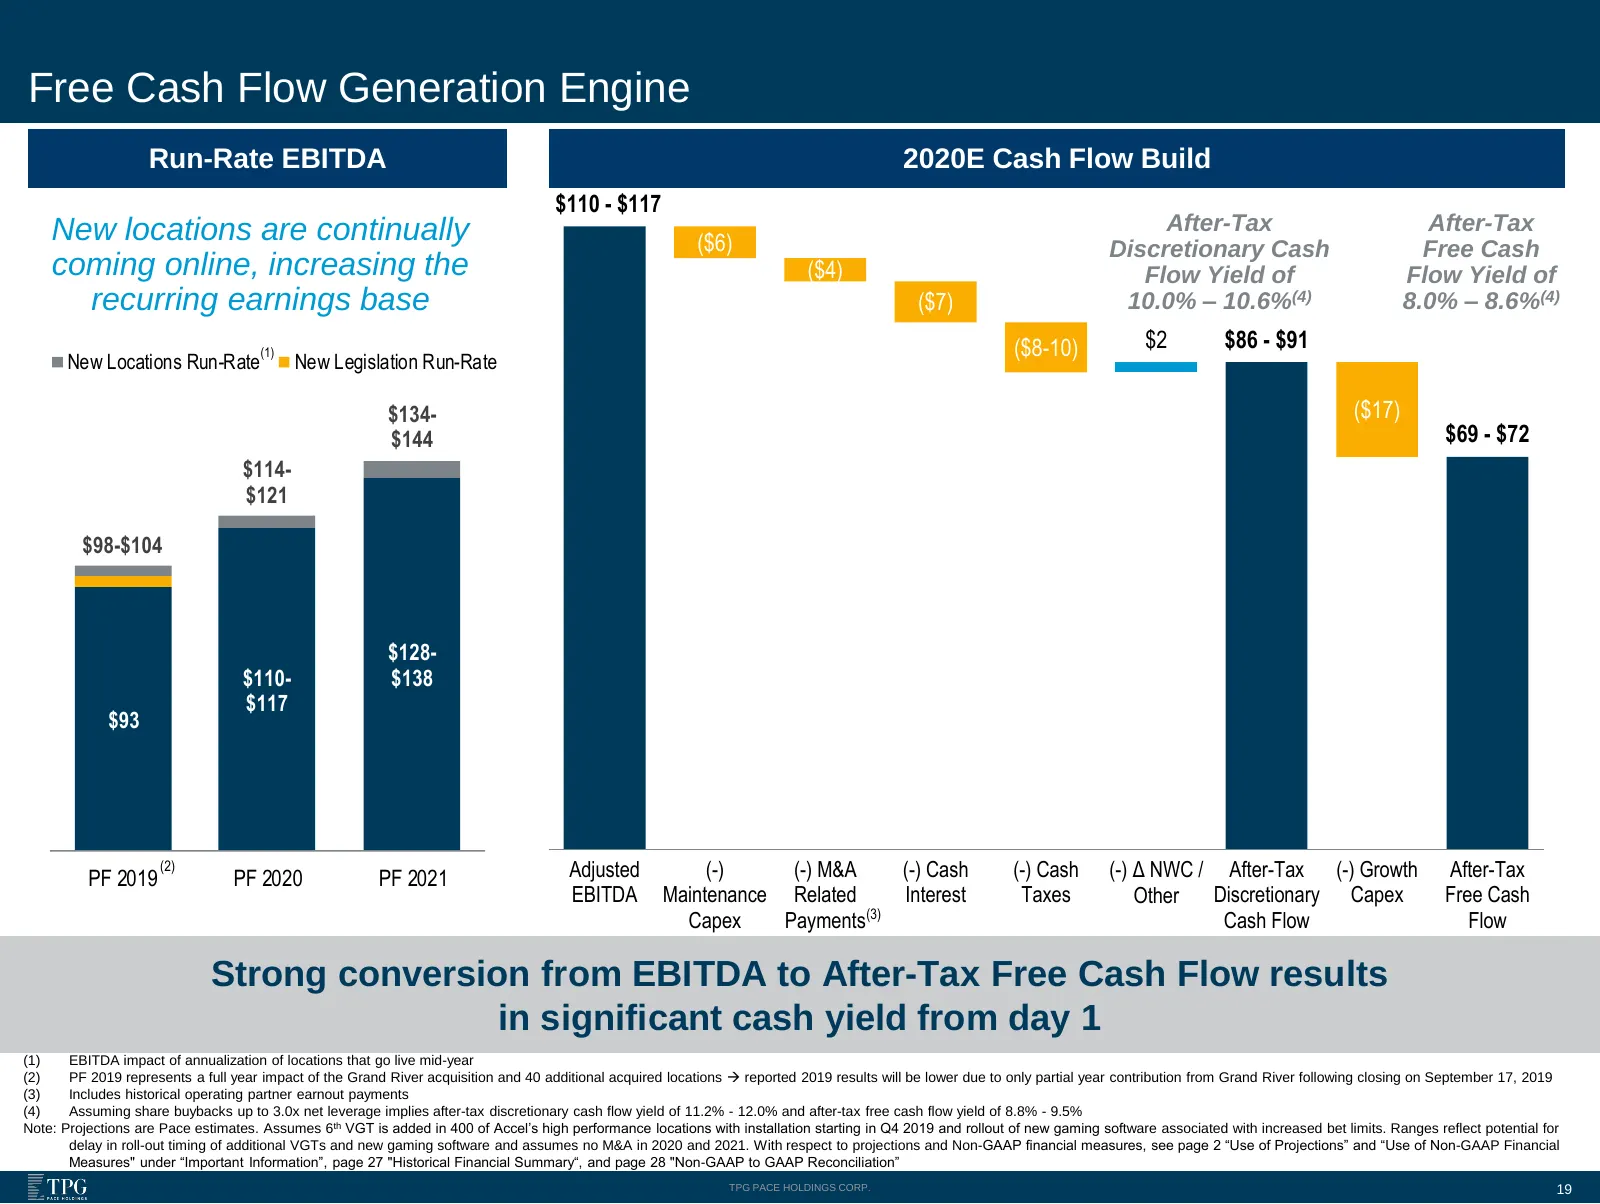
Slide 19: Free Cash Flow Generation Engine
Free Cash Flow Generation Engine Run-Rate EBITDA 2020E Cash Flow Build $110 - $117 New locations are continually After-Tax After-Tax ($6) Discretionary Cash Free Cash coming online, increasing the ($4) Flow Yield of Flow Yield of recurring earnings base ($7) 10.0% – 10.6%(4) 8.0% – 8.6%(4) (1) ($8-1
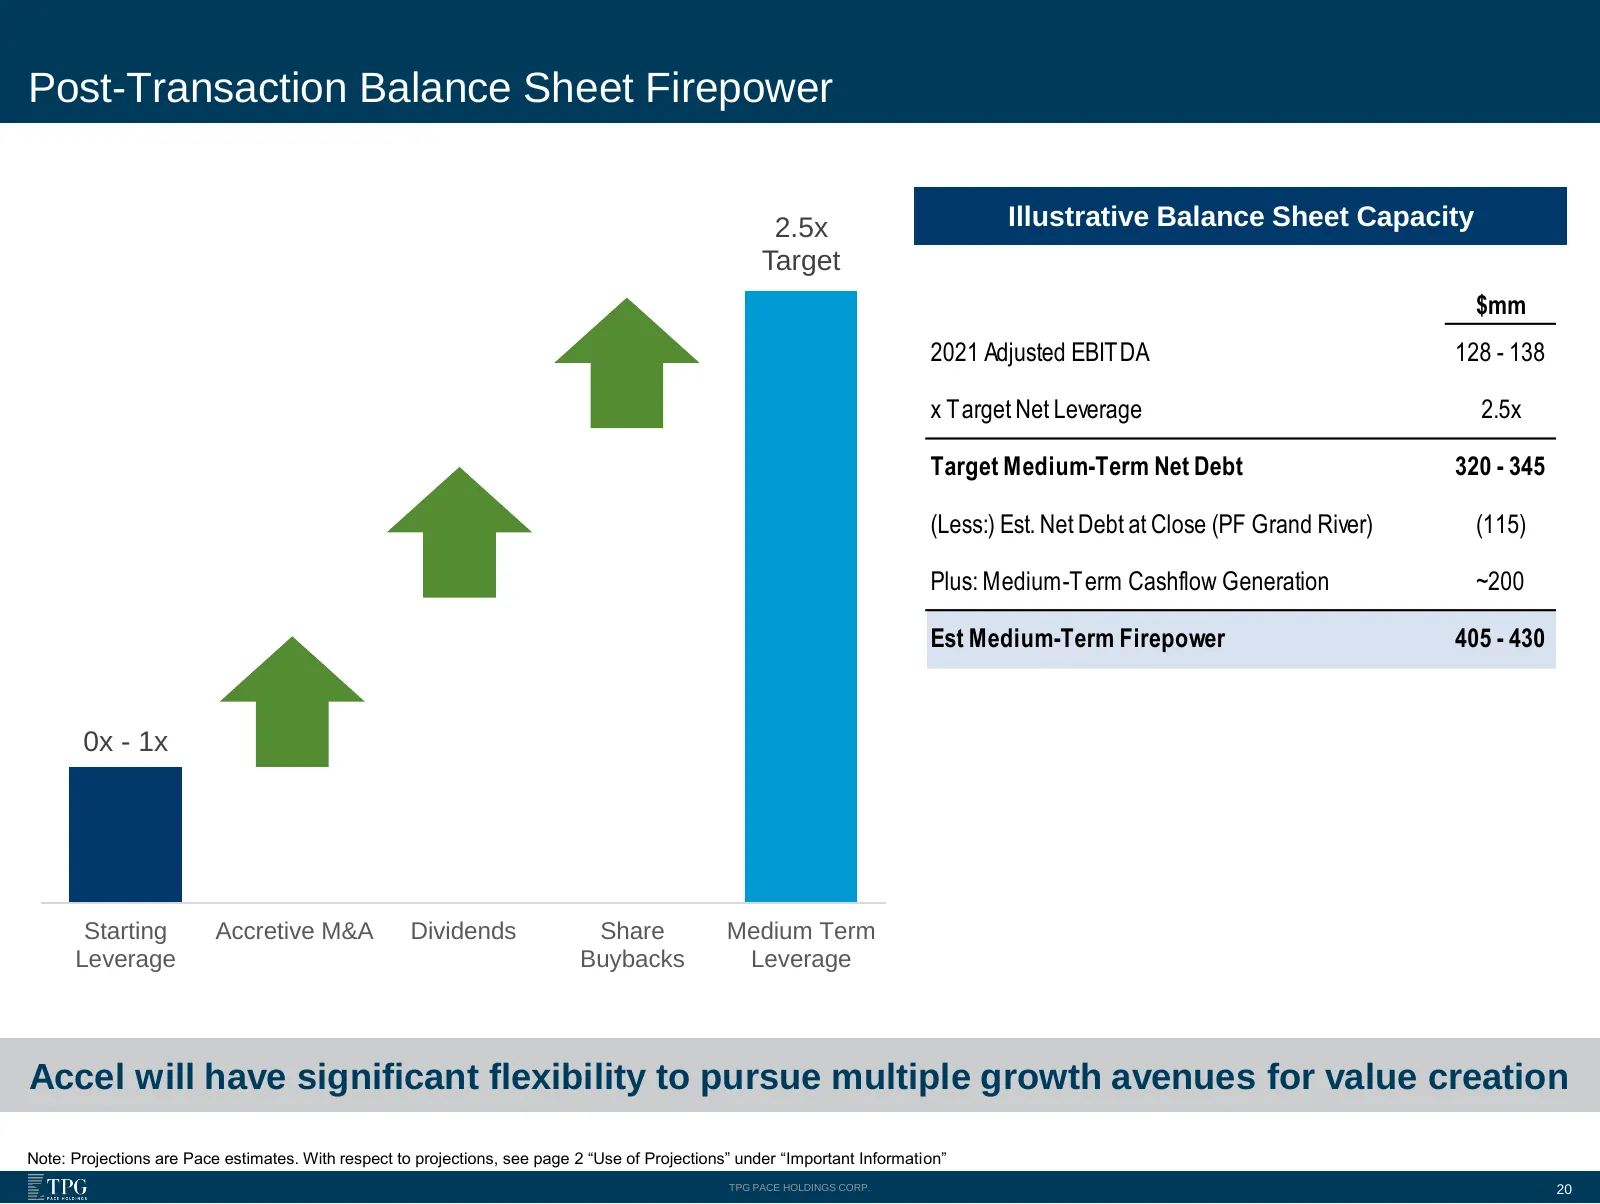
Slide 20: Post-Transaction Balance Sheet Firepower
Post-Transaction Balance Sheet Firepower 2.5x Illustrative Balance Sheet Capacity Target $mm 2021 Adjusted EBITDA 128 - 138 x Target Net Leverage 2.5x Target Medium-Term Net Debt 320 - 345 (Less:) Est. Net Debt at Close (PF Grand River) (115) Plus: Medium-Term Cashflow Generation ~200 Est Medium-Ter
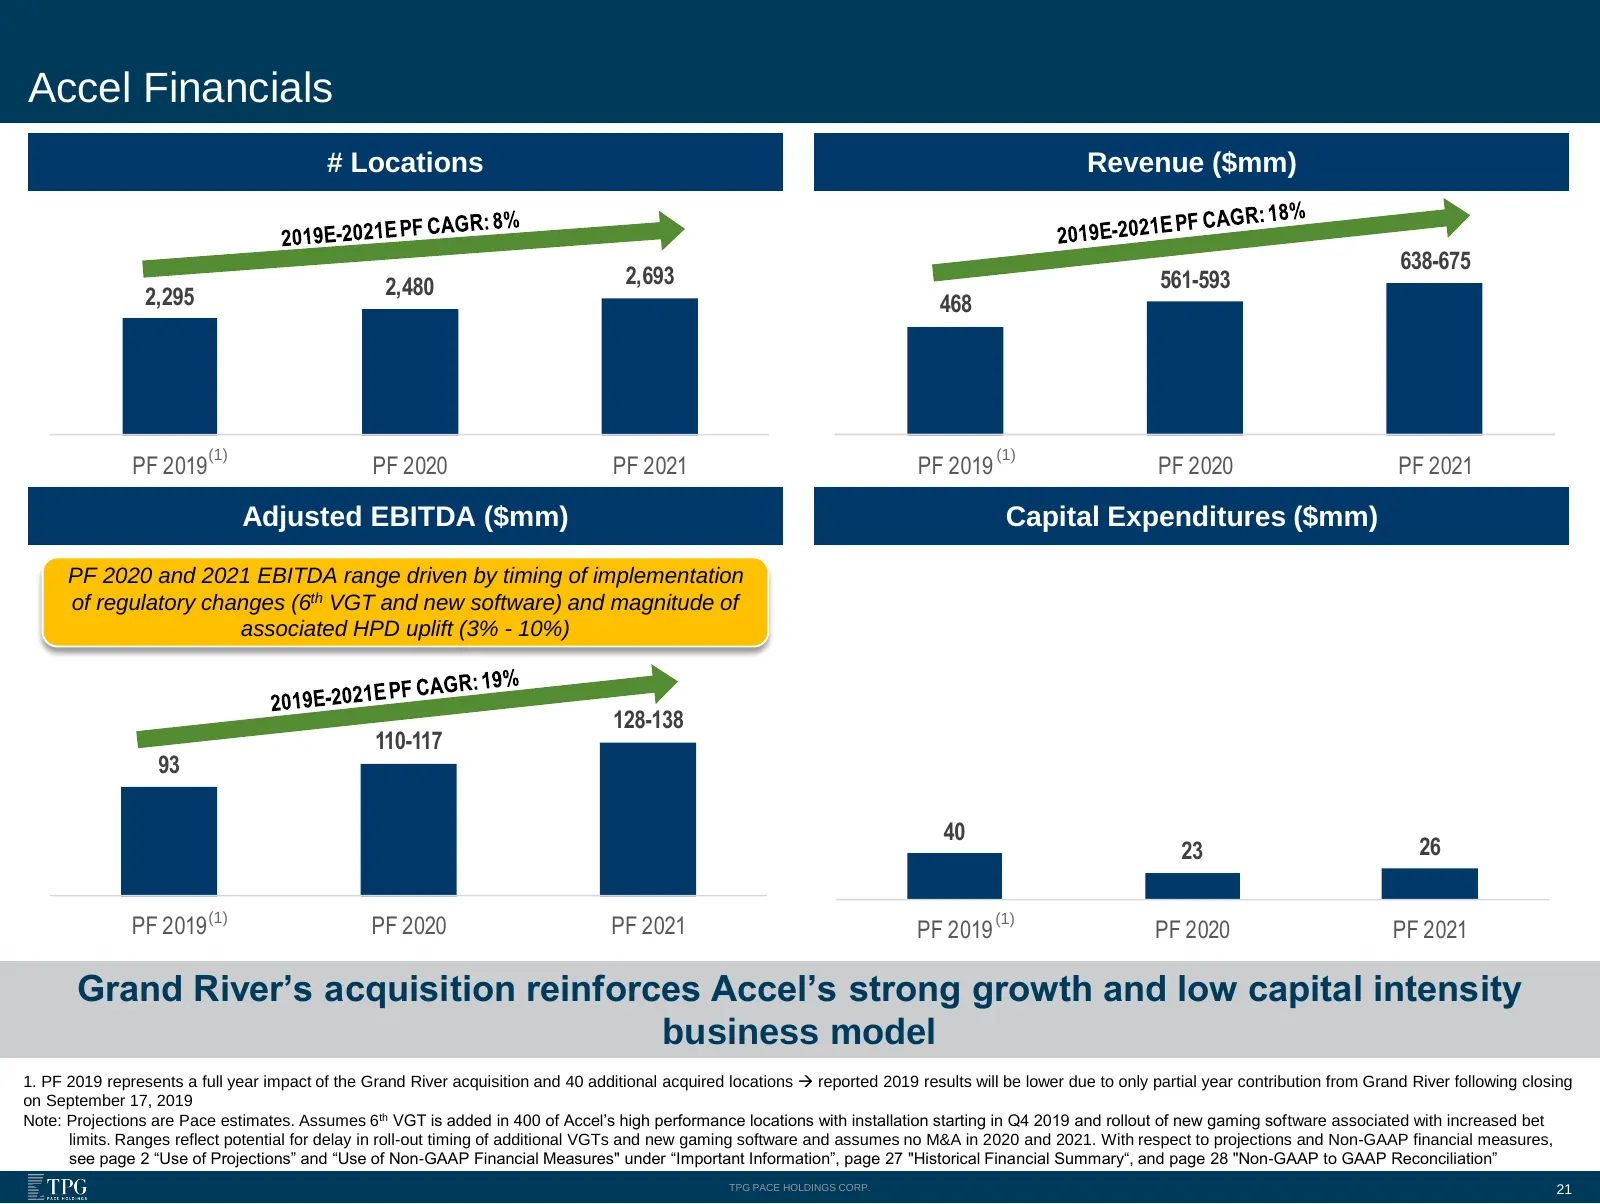
Slide 21: Accel Financials
Accel Financials # Locations Revenue ($mm) 638-675 2,480 2,693 561-593 2,295 468 (1) (1) PF 2019 PF 2020 PF 2021 PF 2019 PF 2020 PF 2021 Adjusted EBITDA ($mm) Capital Expenditures ($mm) PF 2020 and 2021 EBITDA range driven by timing of implementation of regulatory changes (6th VGT and new software)
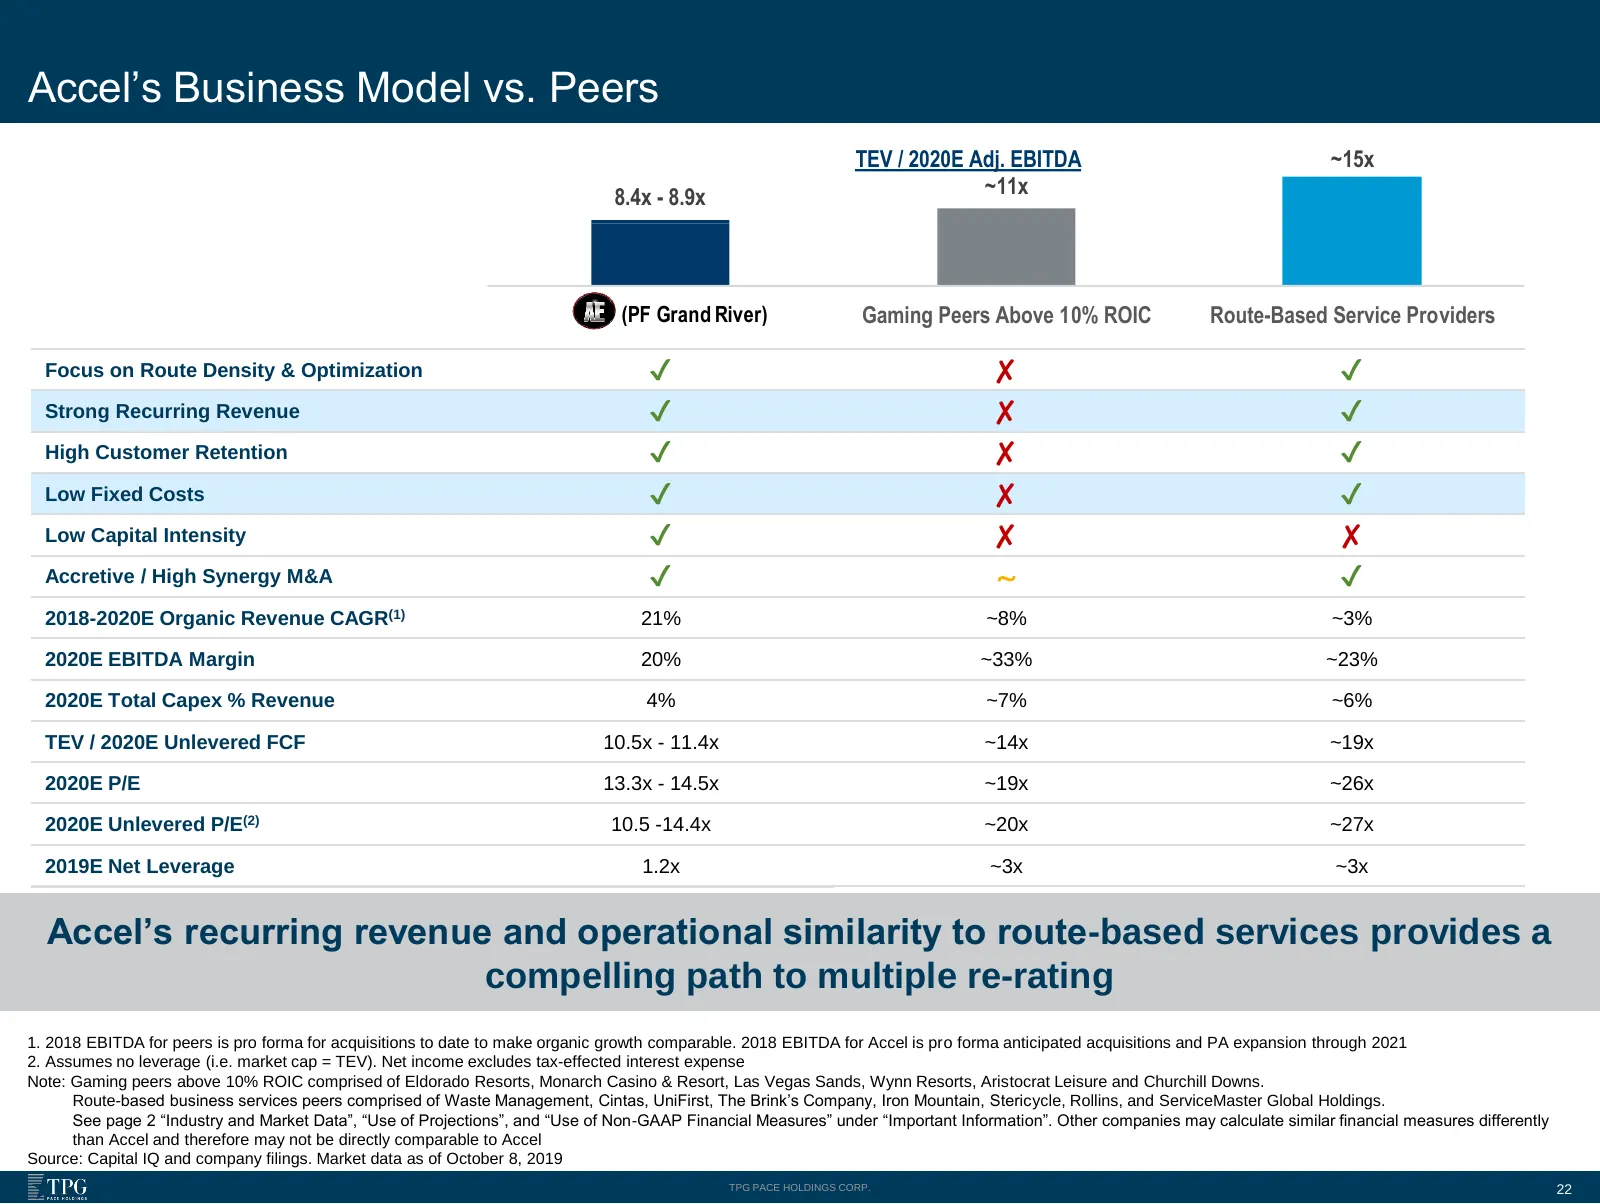
Slide 22: Accel's Business Model vs. Peers
Accel’s Business Model vs. Peers TEV / 2020E Adj. EBITDA ~15x 8.4x - 8.9x ~11x (PF Grand River) Gaming Peers Above 10% ROIC Route-Based Service Providers Focus on Route Density & Optimization ✔ ✘ ✔ Strong Recurring Revenue ✔ ✘ ✔ High Customer Retention ✔ ✘ ✔ Low Fixed Costs ✔ ✘ ✔ Low Capital Intensi
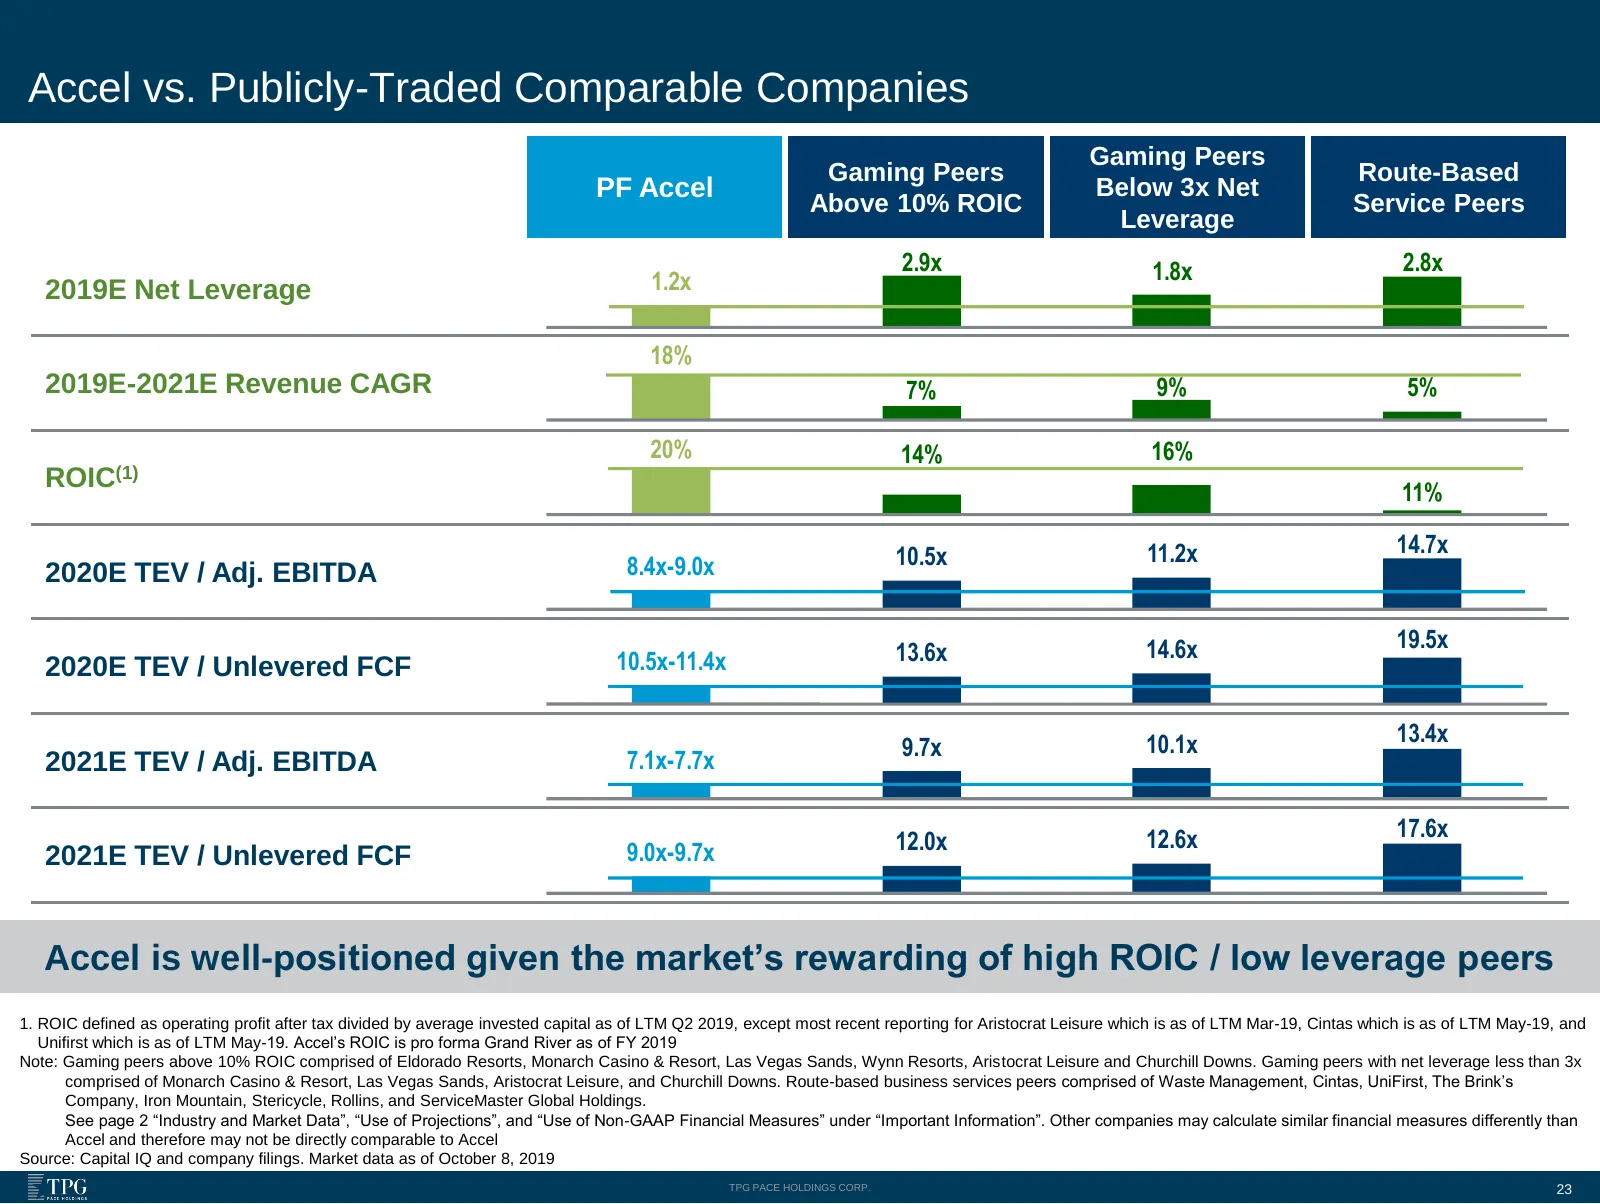
Slide 23: Accel vs. Publicly-Traded Comparable Companies
Accel vs. Publicly-Traded Comparable Companies Gaming Peers Gaming Peers Route-Based PF Accel Below 3x Net Above 10% ROIC Service Peers Leverage 2.9x 1.8x 2.8x 2019E Net Leverage 1.2x 18% 2019E-2021E Revenue CAGR 7% 9% 5% 20% 14% 16% ROIC(1) 11% 10.5x 11.2x 14.7x 2020E TEV / Adj. EBITDA 8.4x-9.0x 14
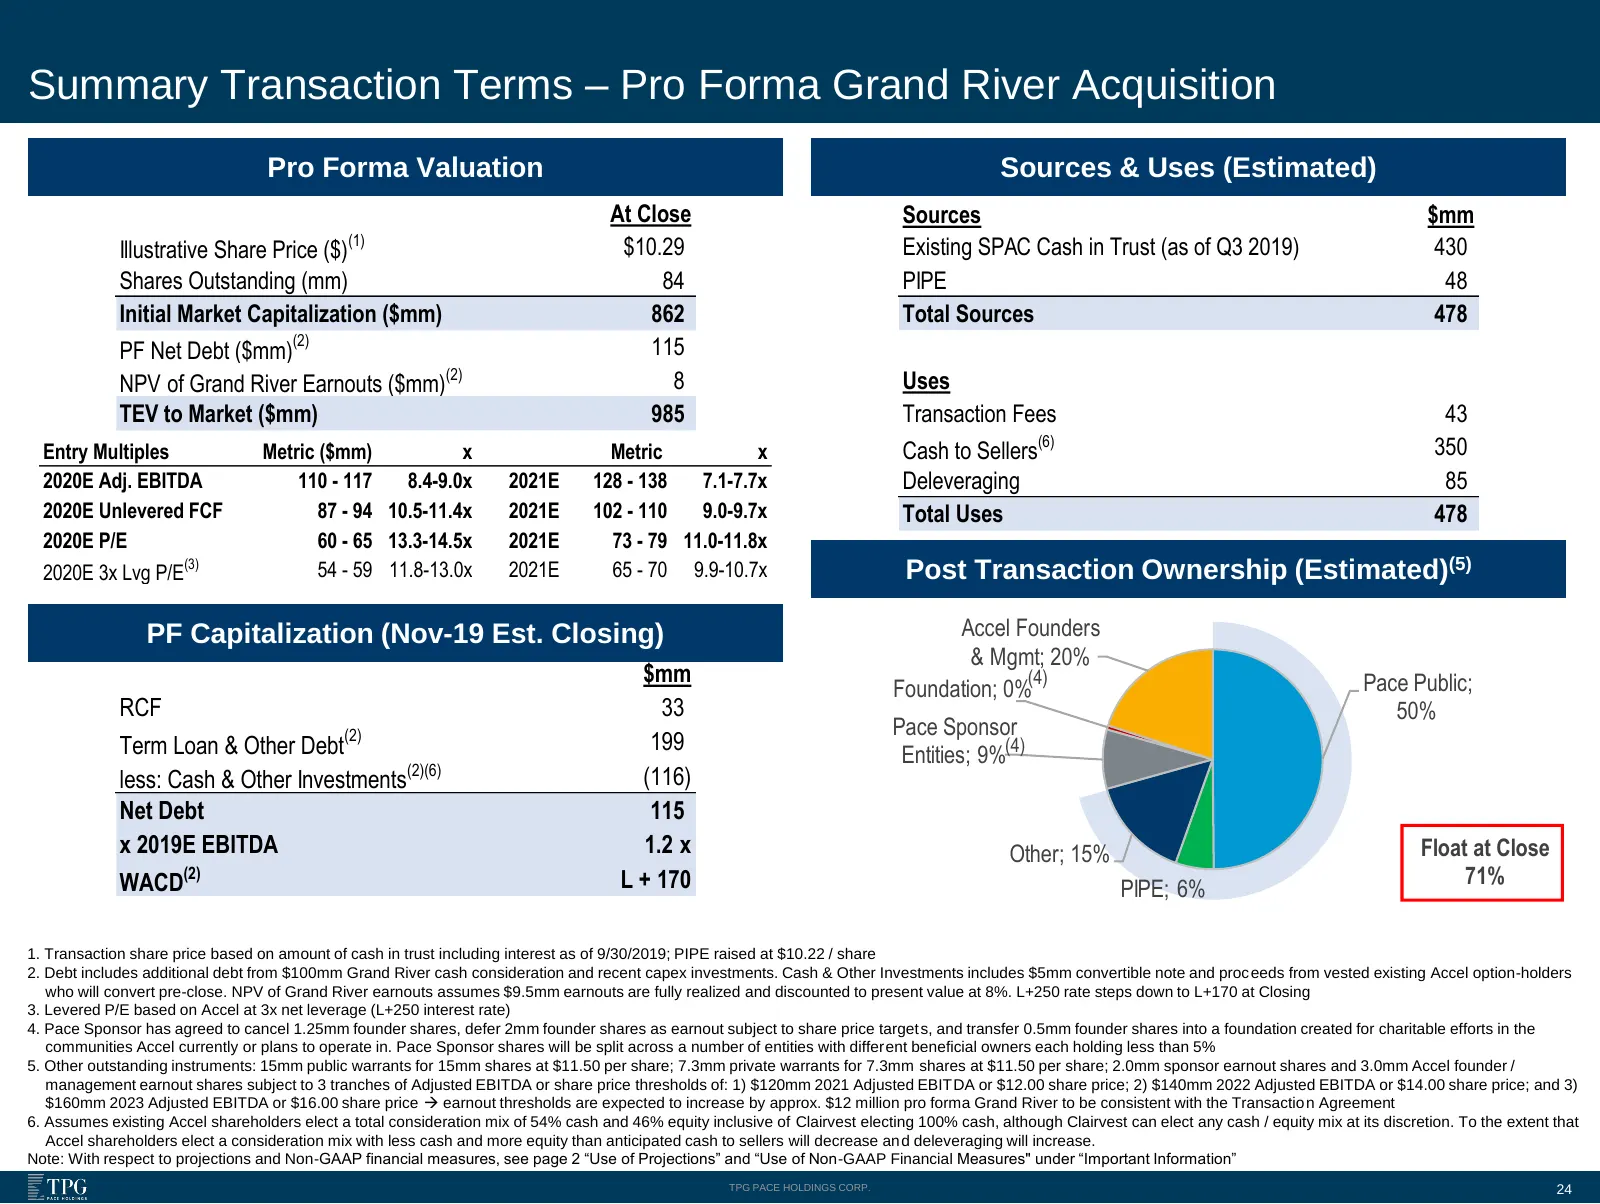
Slide 24: Summary Transaction Terms – Pro Forma Grand River Acquisition
Summary Transaction Terms – Pro Forma Grand River Acquisition Pro Forma Valuation Sources & Uses (Estimated) At Close Sources $mm (1) Illustrative Share Price ($) $10.29 Existing SPAC Cash in Trust (as of Q3 2019) 430 Shares Outstanding (mm) 84 PIPE 48 Initial Market Capitalization ($mm) 862 Total S
Slide 25: Why Invest in Accel Entertainment?
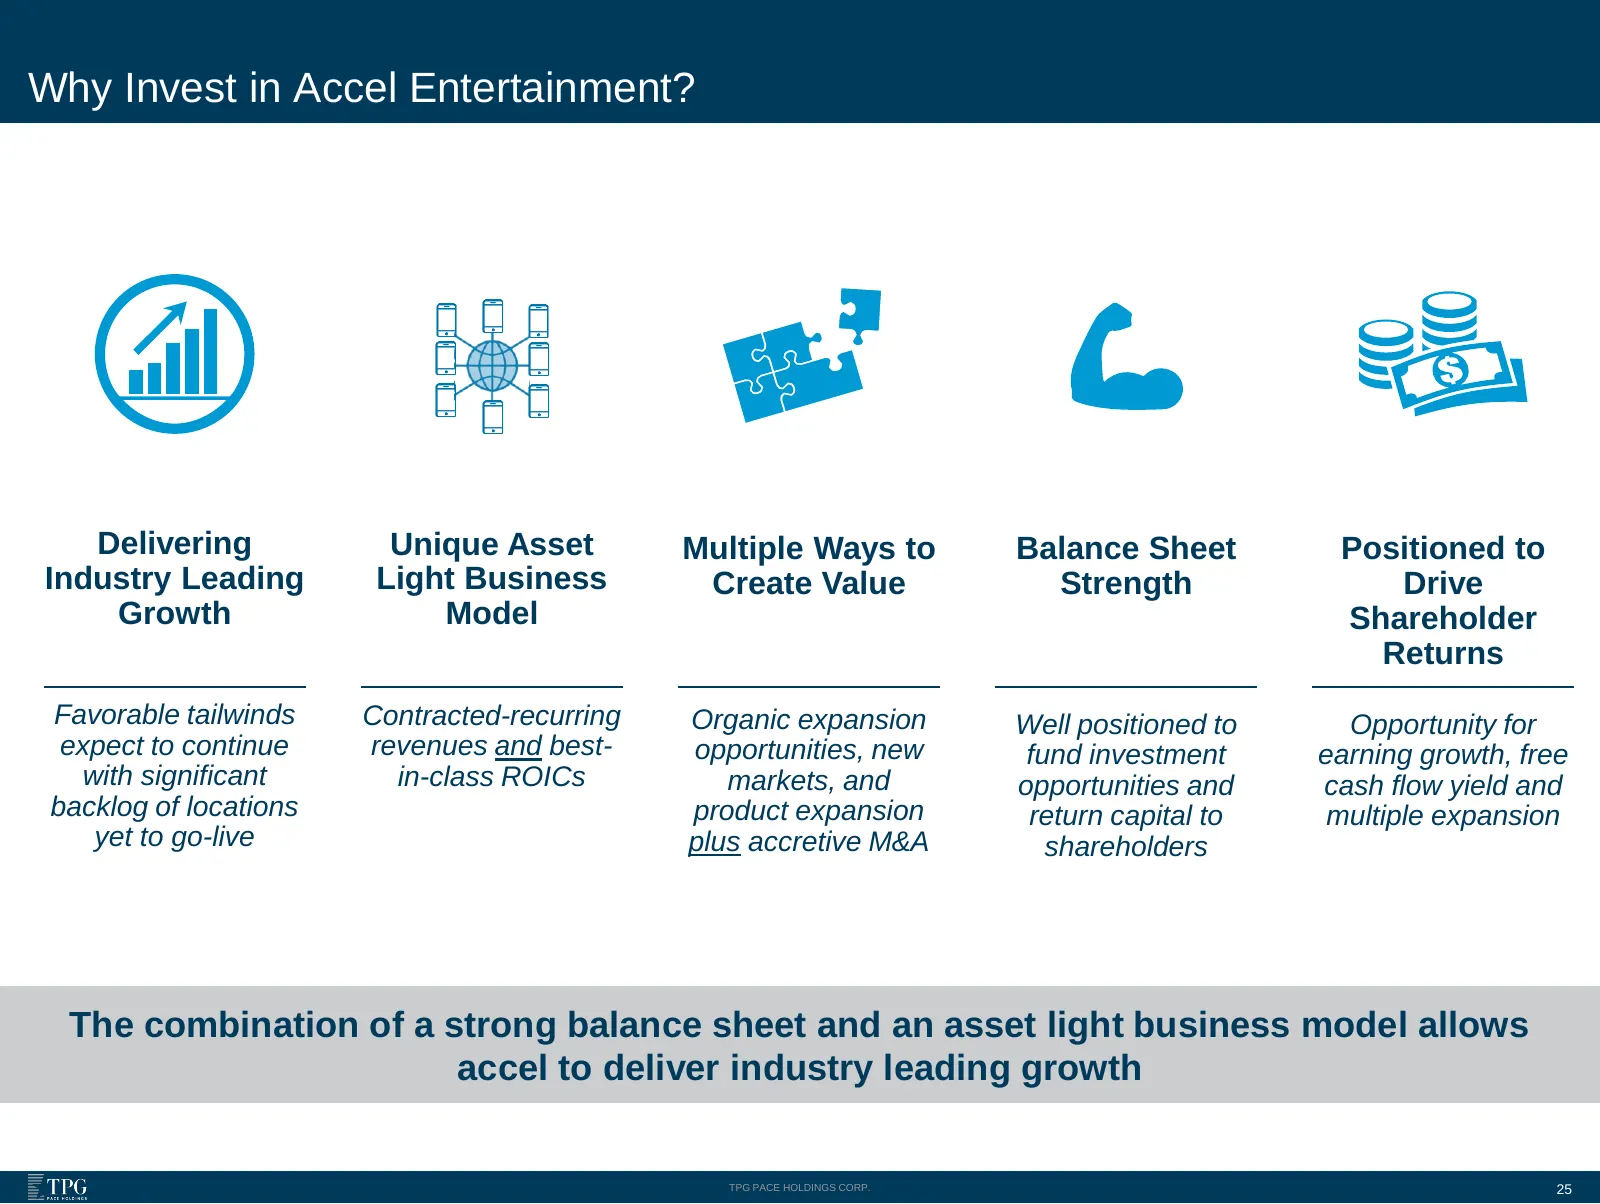
Why Invest in Accel Entertainment? Delivering Unique Asset Multiple Ways to Balance Sheet Positioned to Industry Leading Light Business Create Value Strength Drive Growth Model Shareholder Returns Favorable tailwinds Contracted-recurring Organic expansion Well positioned to Opportunity for expect to
Slide 26: Appendix
Appendix TPG PACE HOLDINGS CORP.
Slide 27: Historical Financial Summary
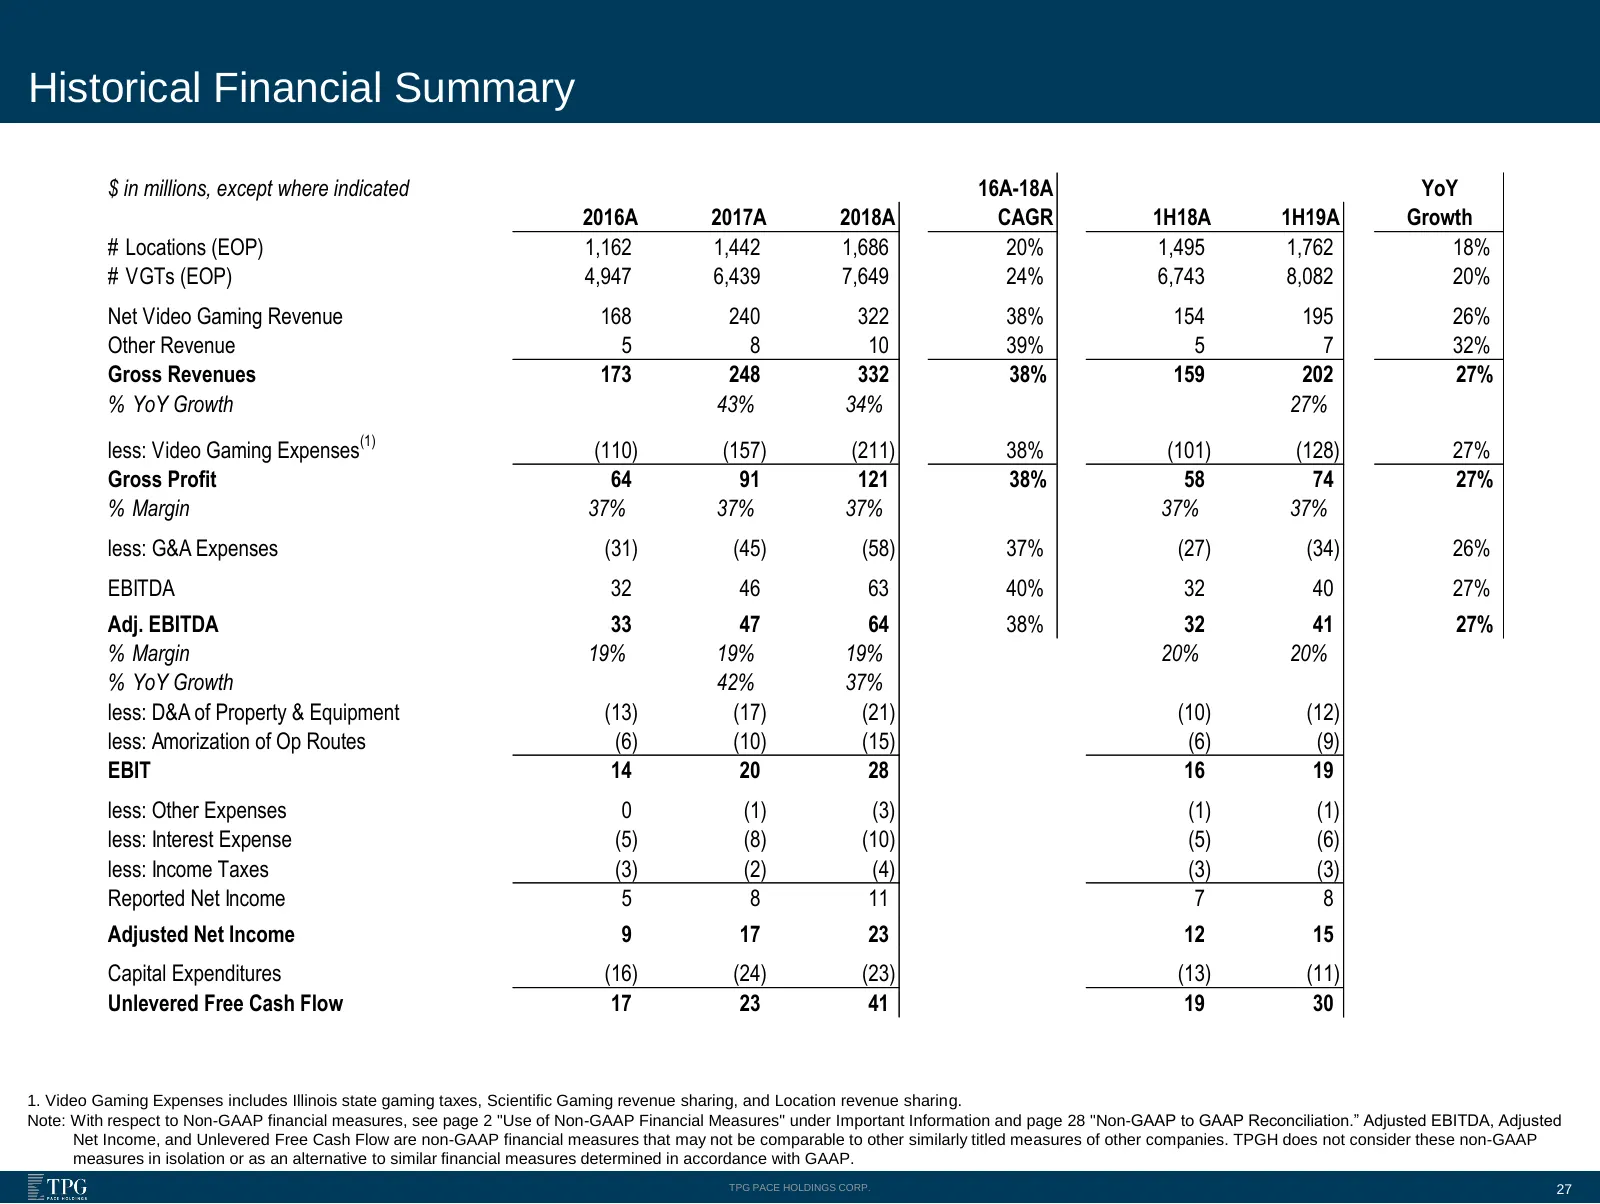
Historical Financial Summary $ in millions, except where indicated 16A-18A YoY 2016A 2017A 2018A CAGR 1H18A 1H19A Growth # Locations (EOP) 1,162 1,442 1,686 20% 1,495 1,762 18% # VGTs (EOP) 4,947 6,439 7,649 24% 6,743 8,082 20% Net Video Gaming Revenue 168 240 322 38% 154 195 26% Other Revenue 5 8 1
Slide 28: Non-GAAP to GAAP Reconciliation
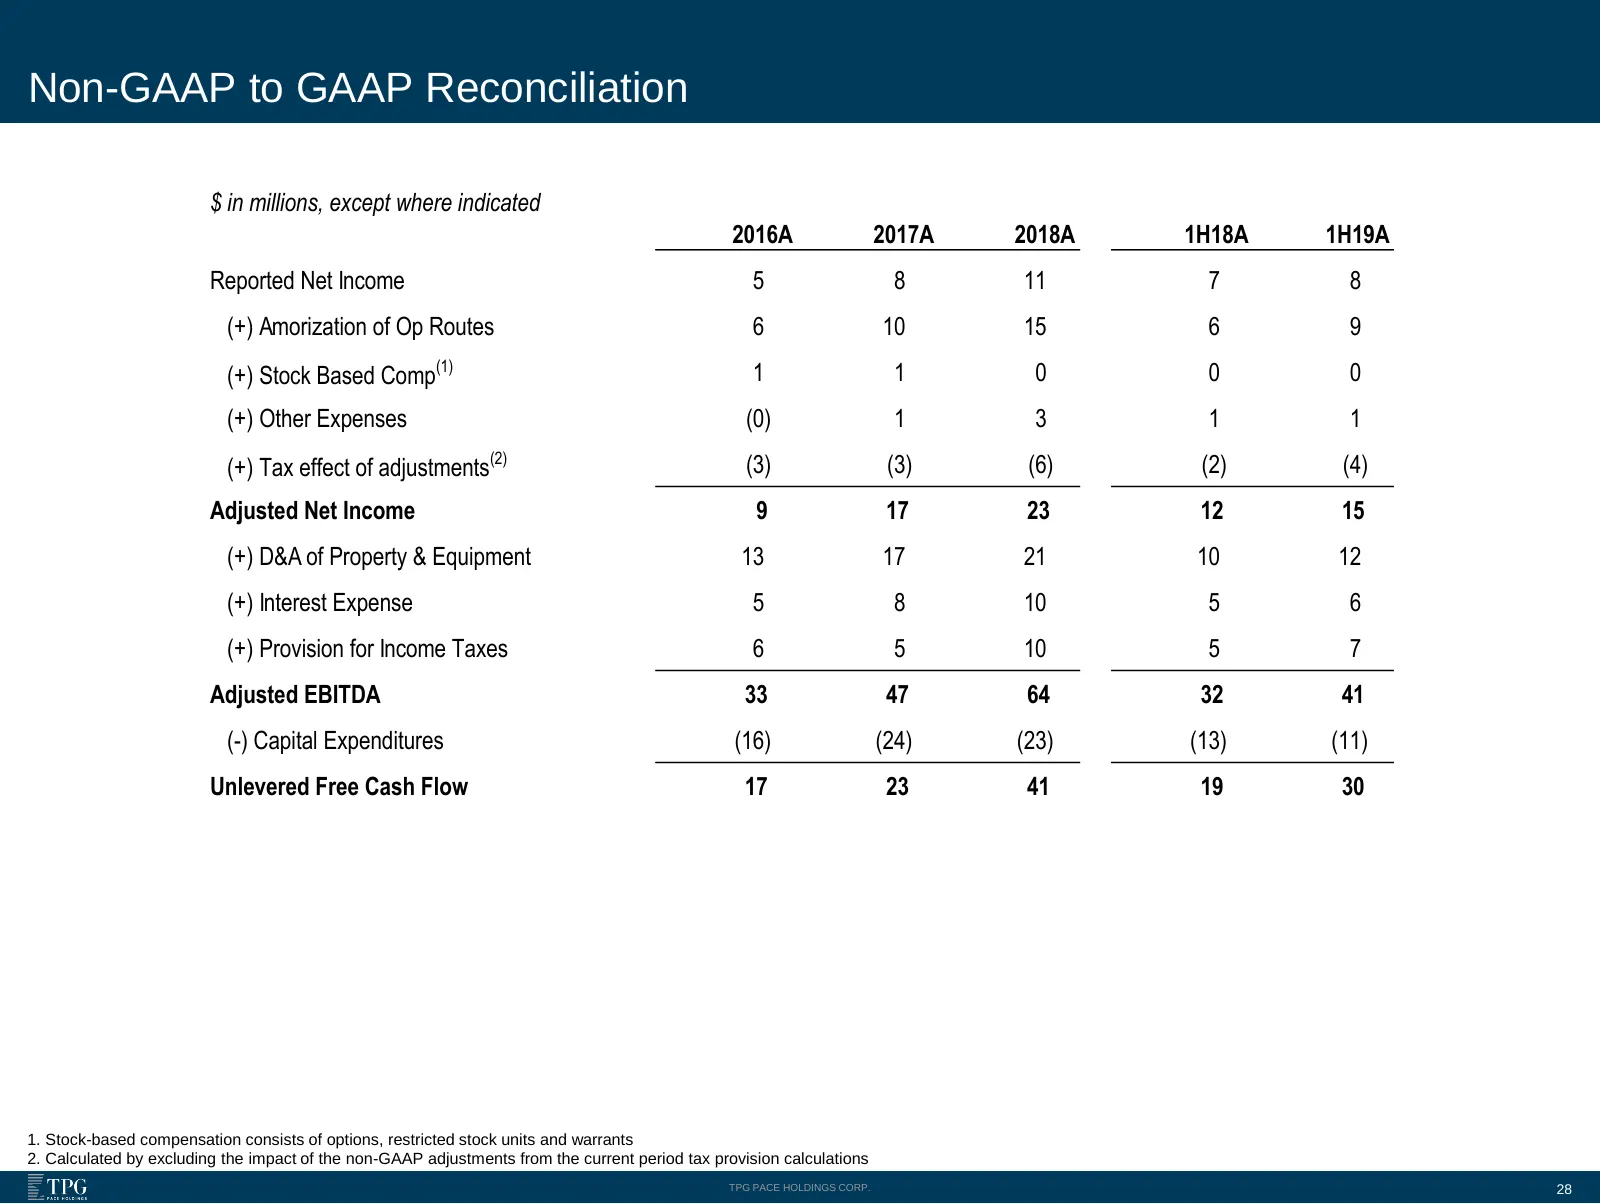
Non-GAAP to GAAP Reconciliation $ in millions, except where indicated 2016A 2017A 2018A 1H18A 1H19A Reported Net Income 5 8 11 7 8 (+) Amorization of Op Routes 6 10 15 6 9 (+) Stock Based Comp(1) 1 1 0 0 0 (+) Other Expenses (0) 1 3 1 1 (+) Tax effect of adjustments(2) (3) (3) (6) (2) (4) Adjusted N
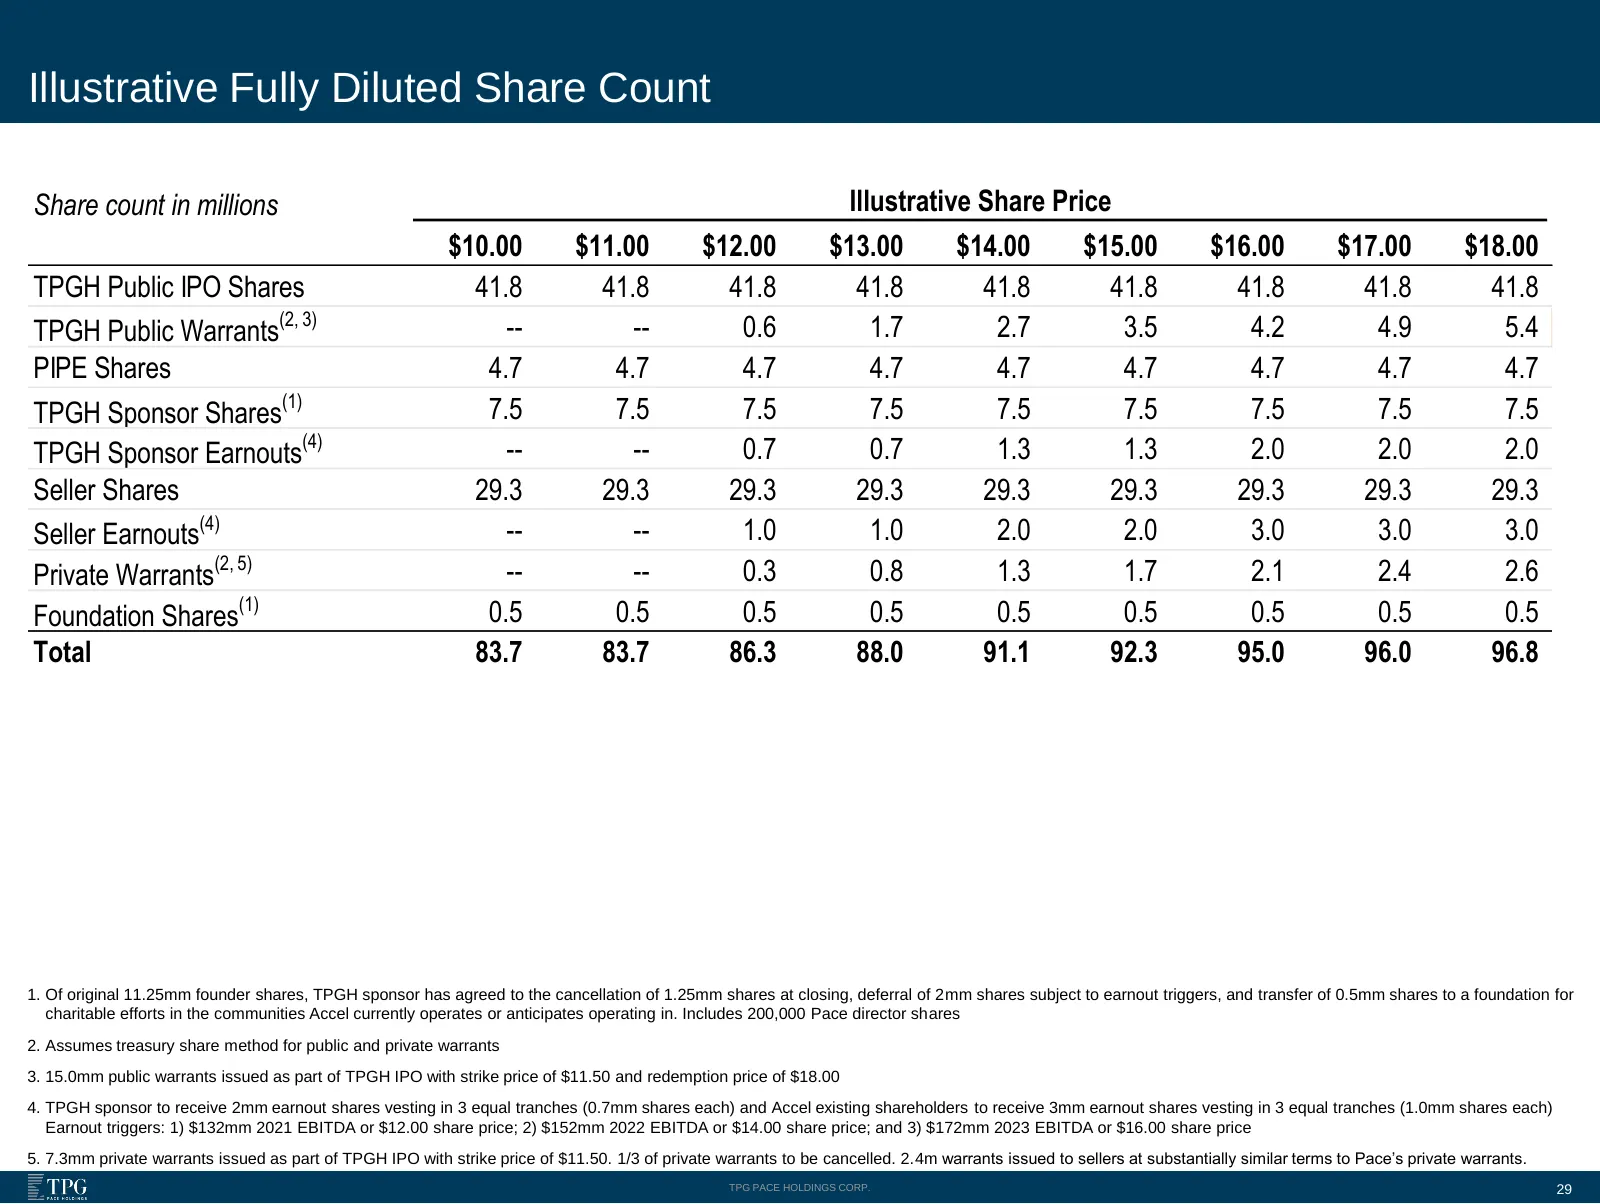
Slide 29: Illustrative Fully Diluted Share Count
Illustrative Fully Diluted Share Count Share count in millions Illustrative Share Price $10.00 $11.00 $12.00 $13.00 $14.00 $15.00 $16.00 $17.00 $18.00 TPGH Public IPO Shares 41.8 41.8 41.8 41.8 41.8 41.8 41.8 41.8 41.8 TPGH Public Warrants(2, 3) -- -- 0.6 1.7 2.7 3.5 4.2 4.9 5.4 PIPE Shares 4.7 4.7
Source: Internet Archive copy of pace.tpg.com
More decks from Accel Entertainment, Inc.
 Q3 2026 Earnings Presentation45 slides · Nov 3, 2026
 Q2 2026 Earnings Presentation36 slides · Aug 4, 2026
 Q1 2026 Earnings Presentation37 slides · May 5, 2026
 Q4 2025 Earnings Presentation37 slides · Mar 3, 2026
 Q3 2025 Earnings Presentation18 slides · Nov 4, 2025
 Q2 2025 Earnings Presentation18 slides · Aug 5, 2025