SKF AB Class A · OMXSTO:SKF_A
SKF AB Class A — Investor Day (November 2015)
19 slides from SKF AB Class A's investor day presentation, Nov 3, 2015
Slide 1: SKF Capital Markets Day
SKF Capital Markets Day Christian Johansson Senior Vice President & CFO
Slide 2: Agenda
Agenda • Financial performance Christian Johansson CFO • Cost reduction and focus areas • Capital efficiency • Financial position • Summary
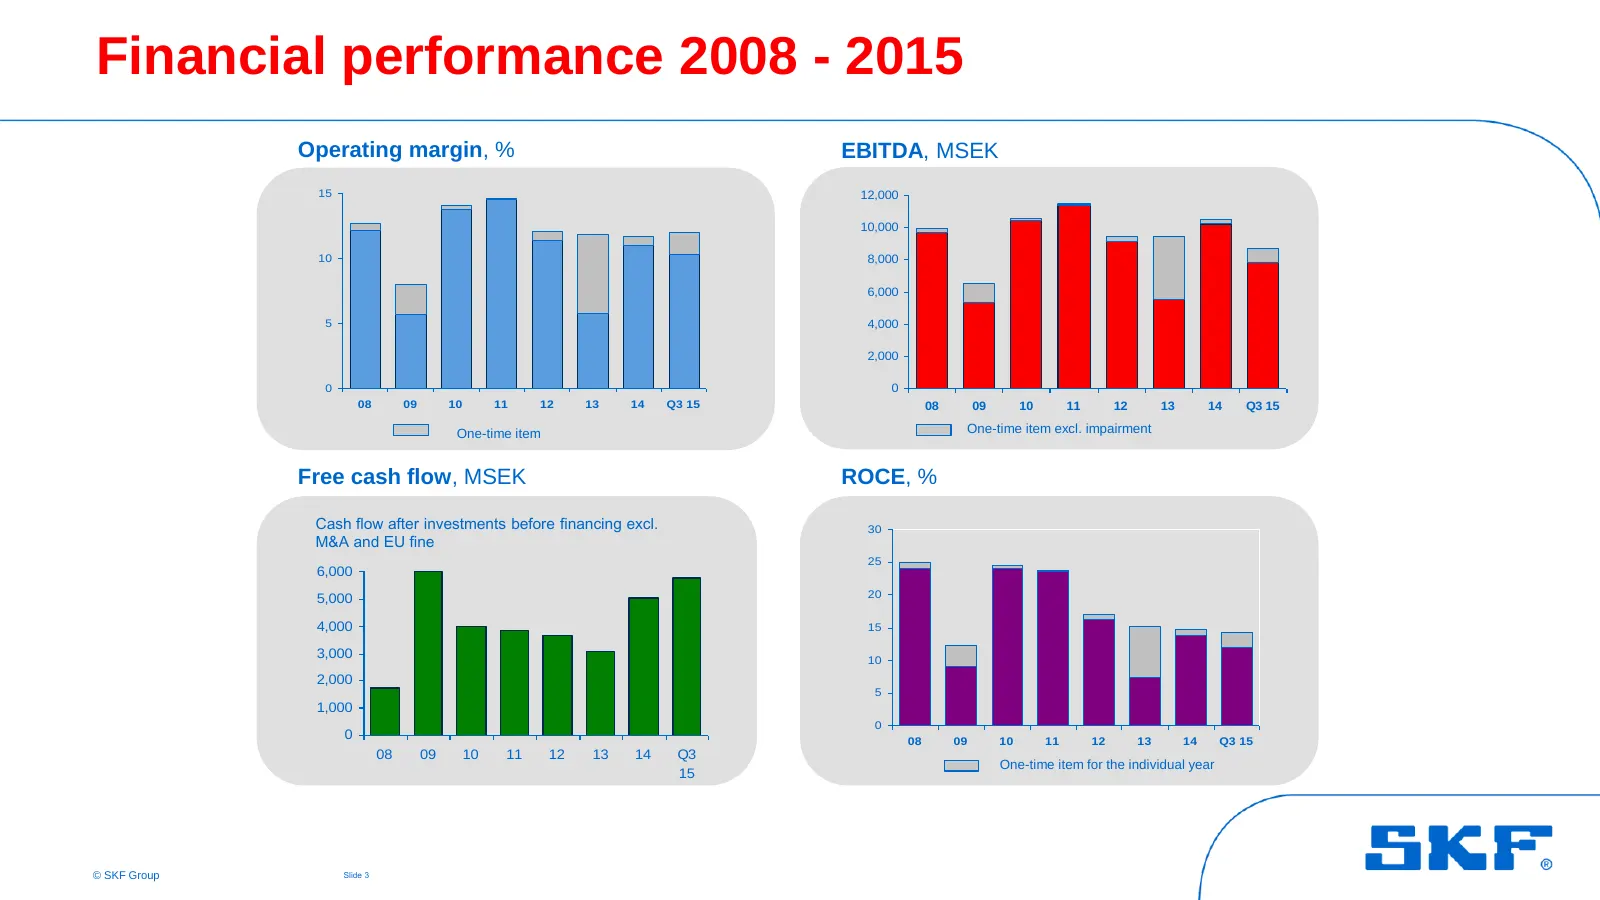
Slide 3: Financial performance 2008 - 2015
Financial performance 2008 - 2015 Operating margin, % EBITDA, MSEK 15 12,000 10,000 10 8,000 6,000 5 4,000 2,000 0 0 08 09 10 11 12 13 14 Q3 15 08 09 10 11 12 13 14 Q3 15 One-time item One-time item excl. impairment Free cash flow, MSEK ROCE, % Cash flow after investments before financing excl. 30 M
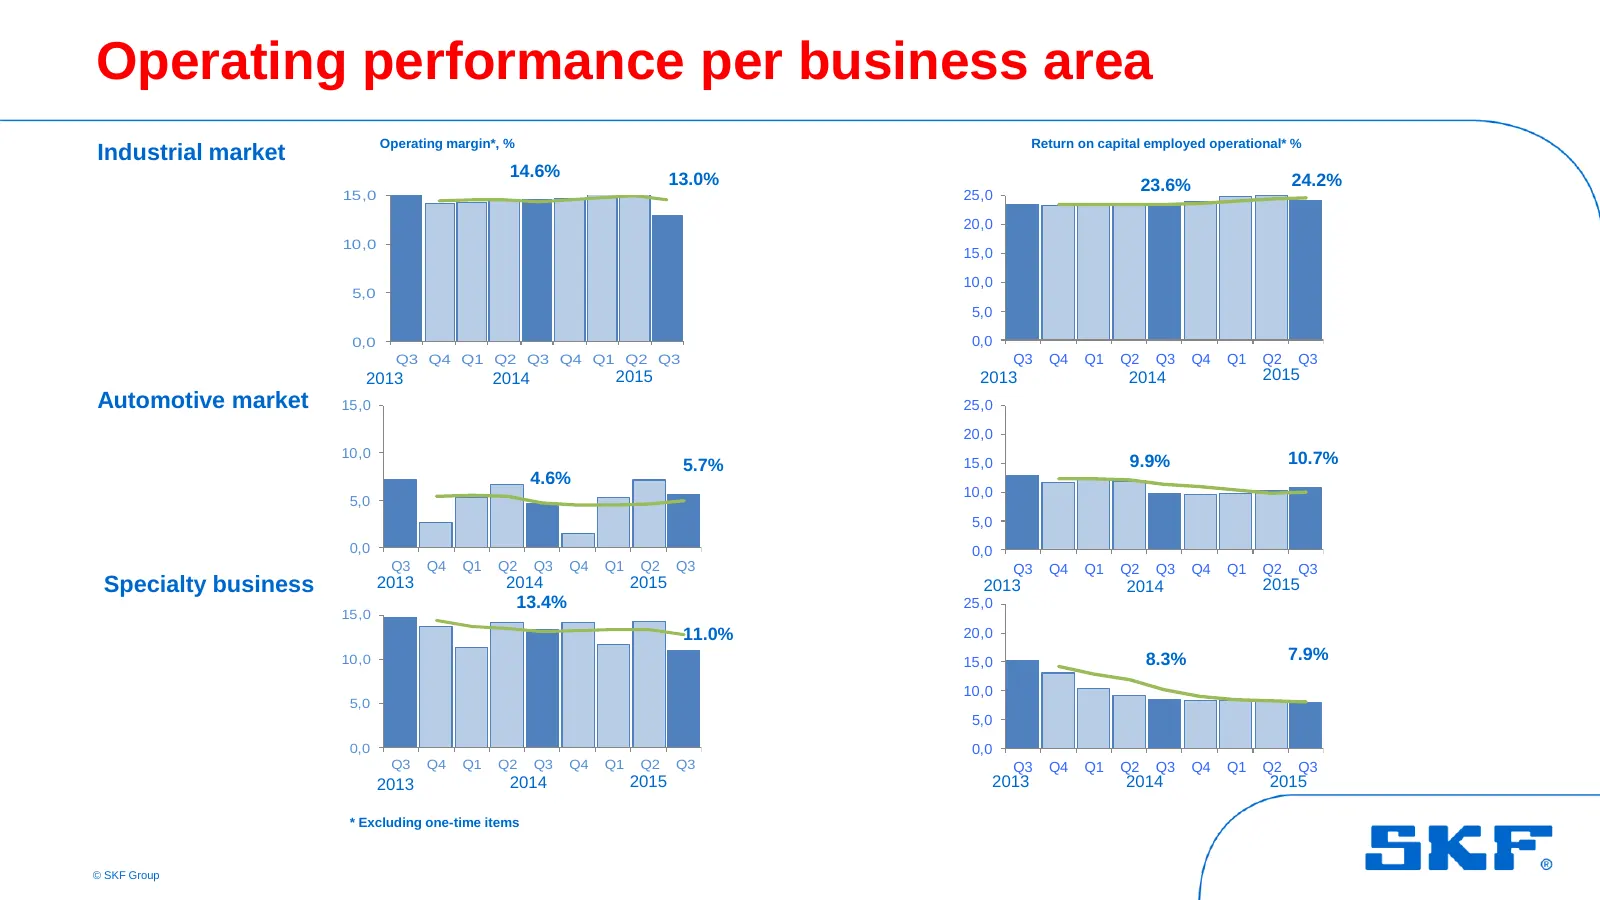
Slide 4: Operating performance per business area
Operating performance per business area Operating margin*, % Return on capital employed operational* % Industrial market 14.6% 13.0% 24.2% 23.6% 15,0 25,0 20,0 10,0 15,0 10,0 5,0 5,0 0,0 0,0 Q3 Q4 Q1 Q2 Q3 Q4 Q1 Q2 Q3 Q3 Q4 Q1 Q2 Q3 Q4 Q1 Q2 Q3 2013 2014 2015 2013 2014 2015 Automotive market 15,0 25
Slide 5: Cost reduction and focus areas
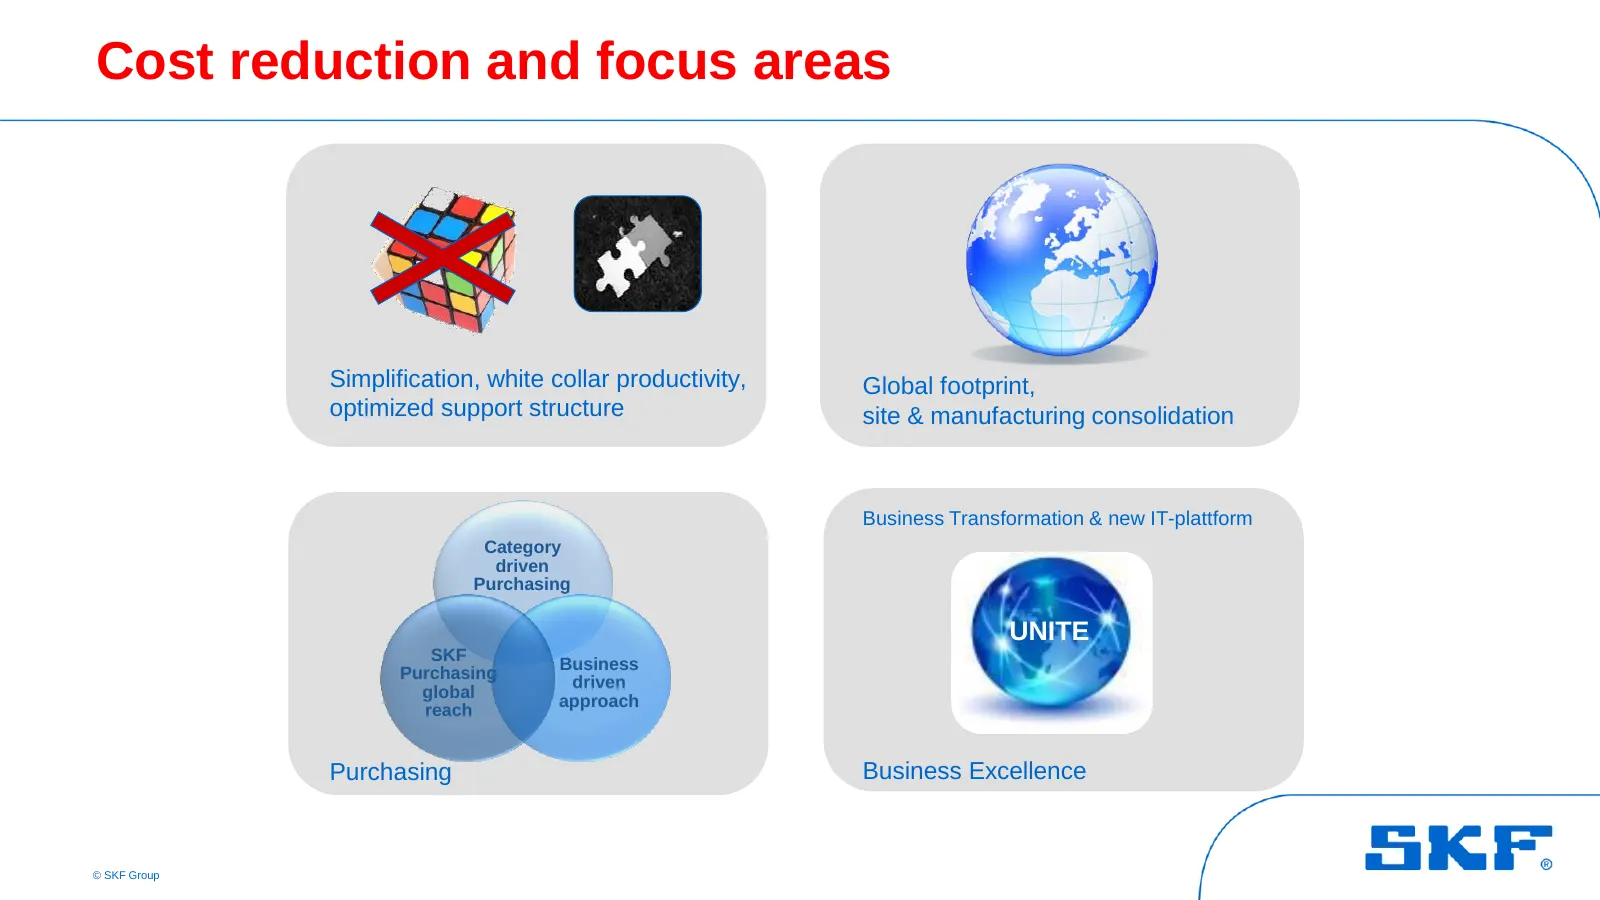
Cost reduction and focus areas Simplification, white collar productivity, Global footprint, optimized support structure site & manufacturing consolidation Business Transformation & new IT-plattform Category driven Purchasing UNITE SKF Business Purchasing driven global approach reach Purchasing Busin
Slide 6: Cost reduction programme (December 2014)
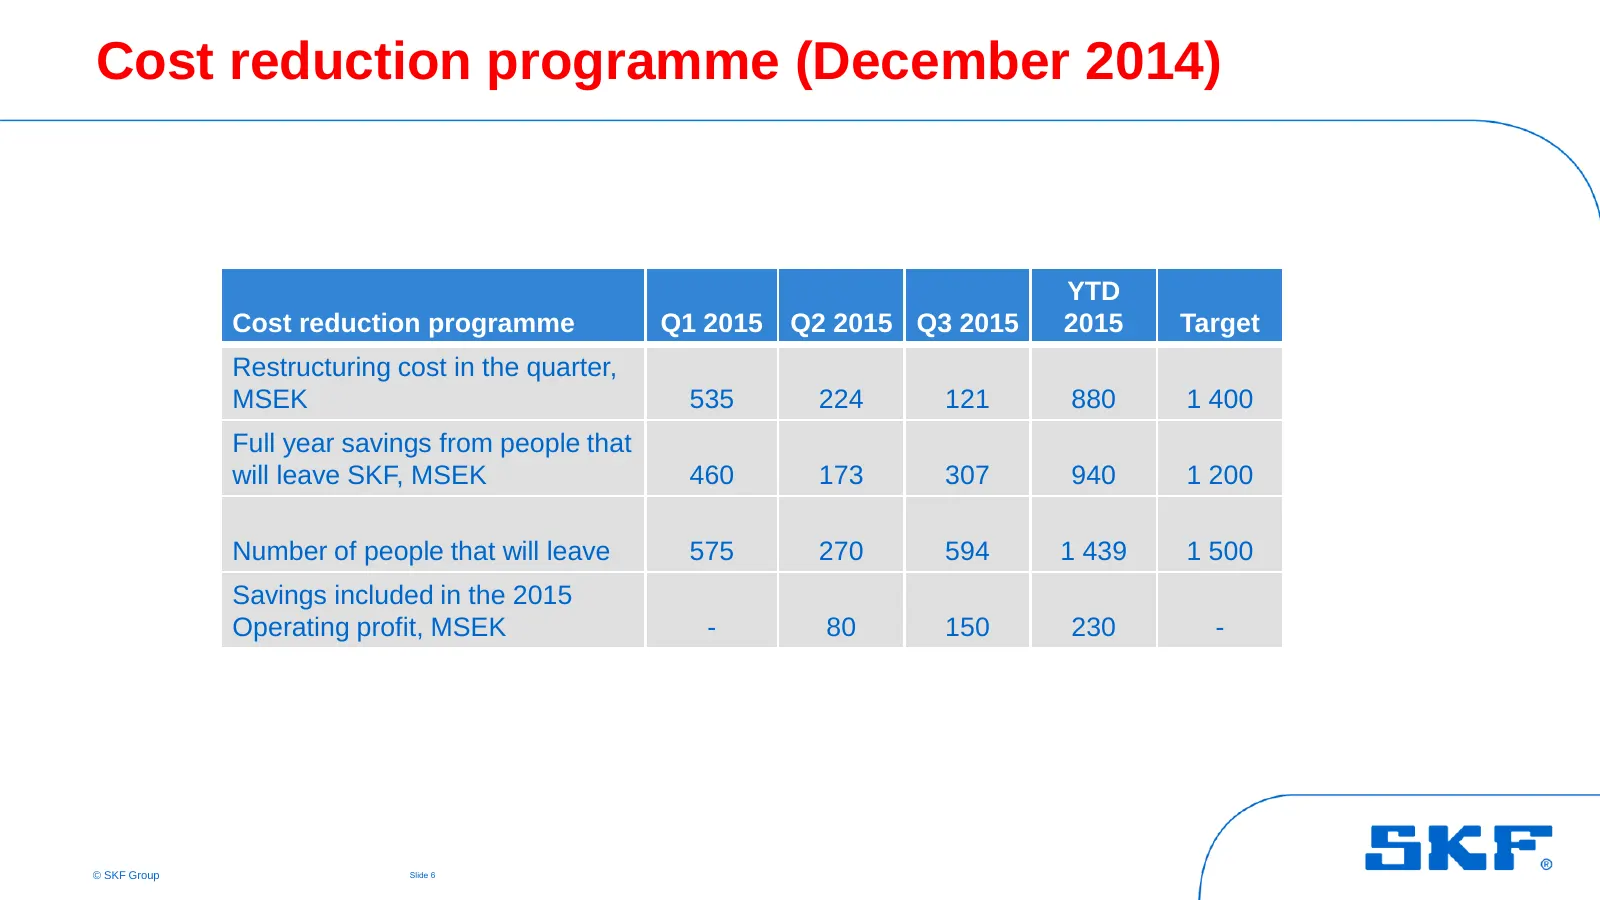
Cost reduction programme (December 2014) YTD Cost reduction programme Q1 2015 Q2 2015 Q3 2015 2015 Target Restructuring cost in the quarter, MSEK 535 224 121 880 1 400 Full year savings from people that will leave SKF, MSEK 460 173 307 940 1 200 Number of people that will leave 575 270 594 1 439 1 5
Slide 7: Fixed cost reduction – do more with less
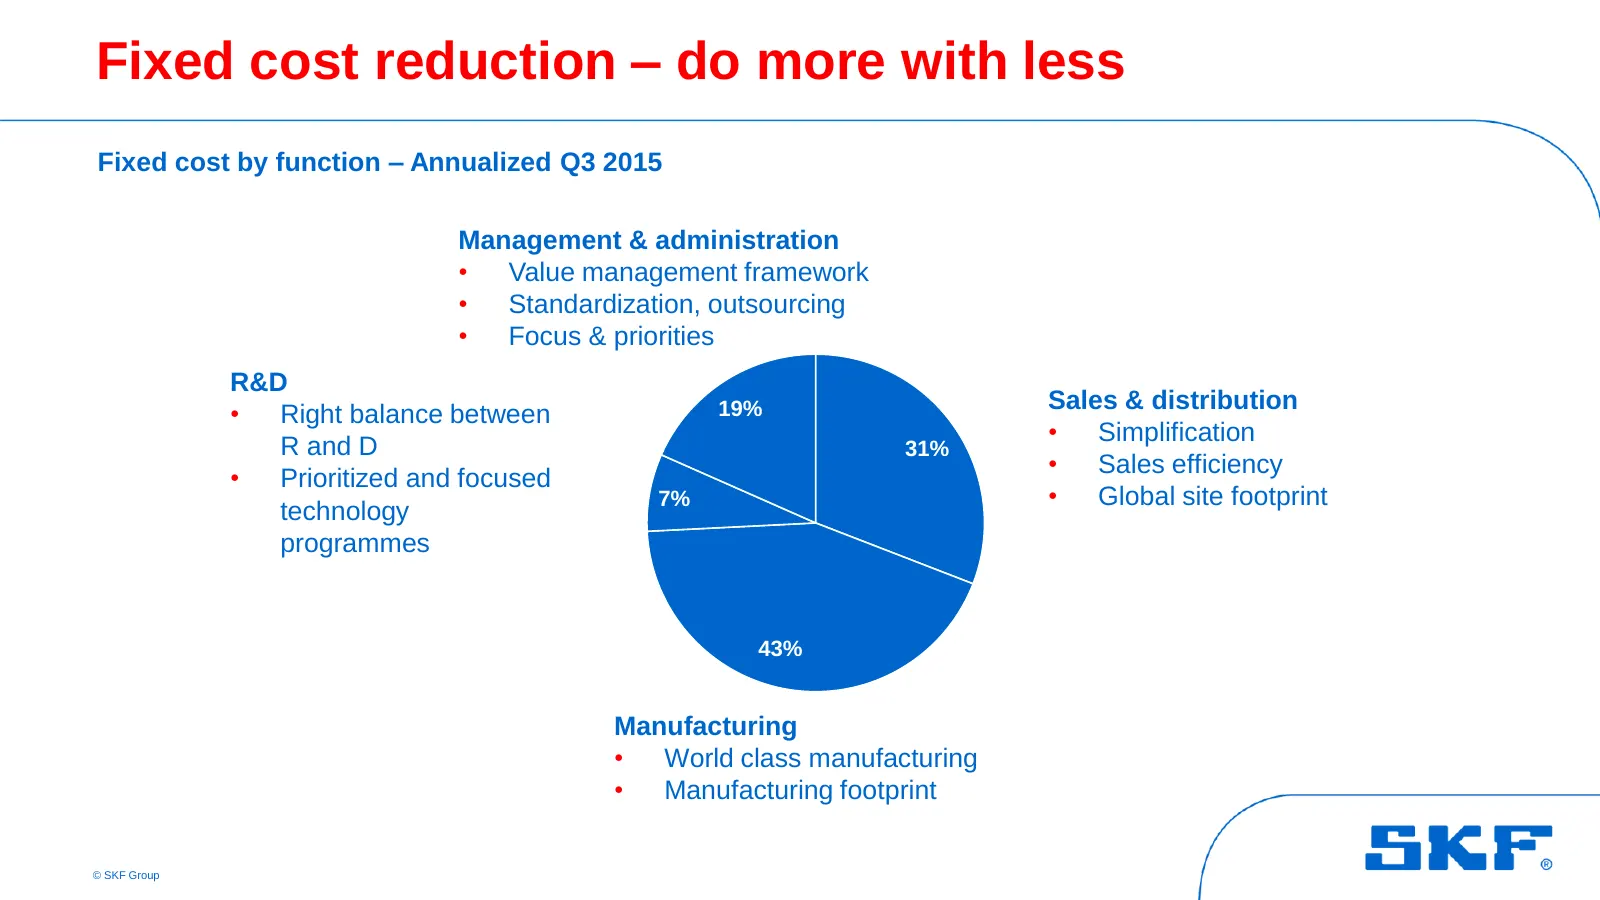
Fixed cost reduction – do more with less Fixed cost by function – Annualized Q3 2015 Management & administration • Value management framework • Standardization, outsourcing • Focus & priorities R&D Sales & distribution • Right balance between 19% • Simplification R and D 31% • Sales efficiency • Pri
Slide 8: Purchasing spend 2014 - further leverage
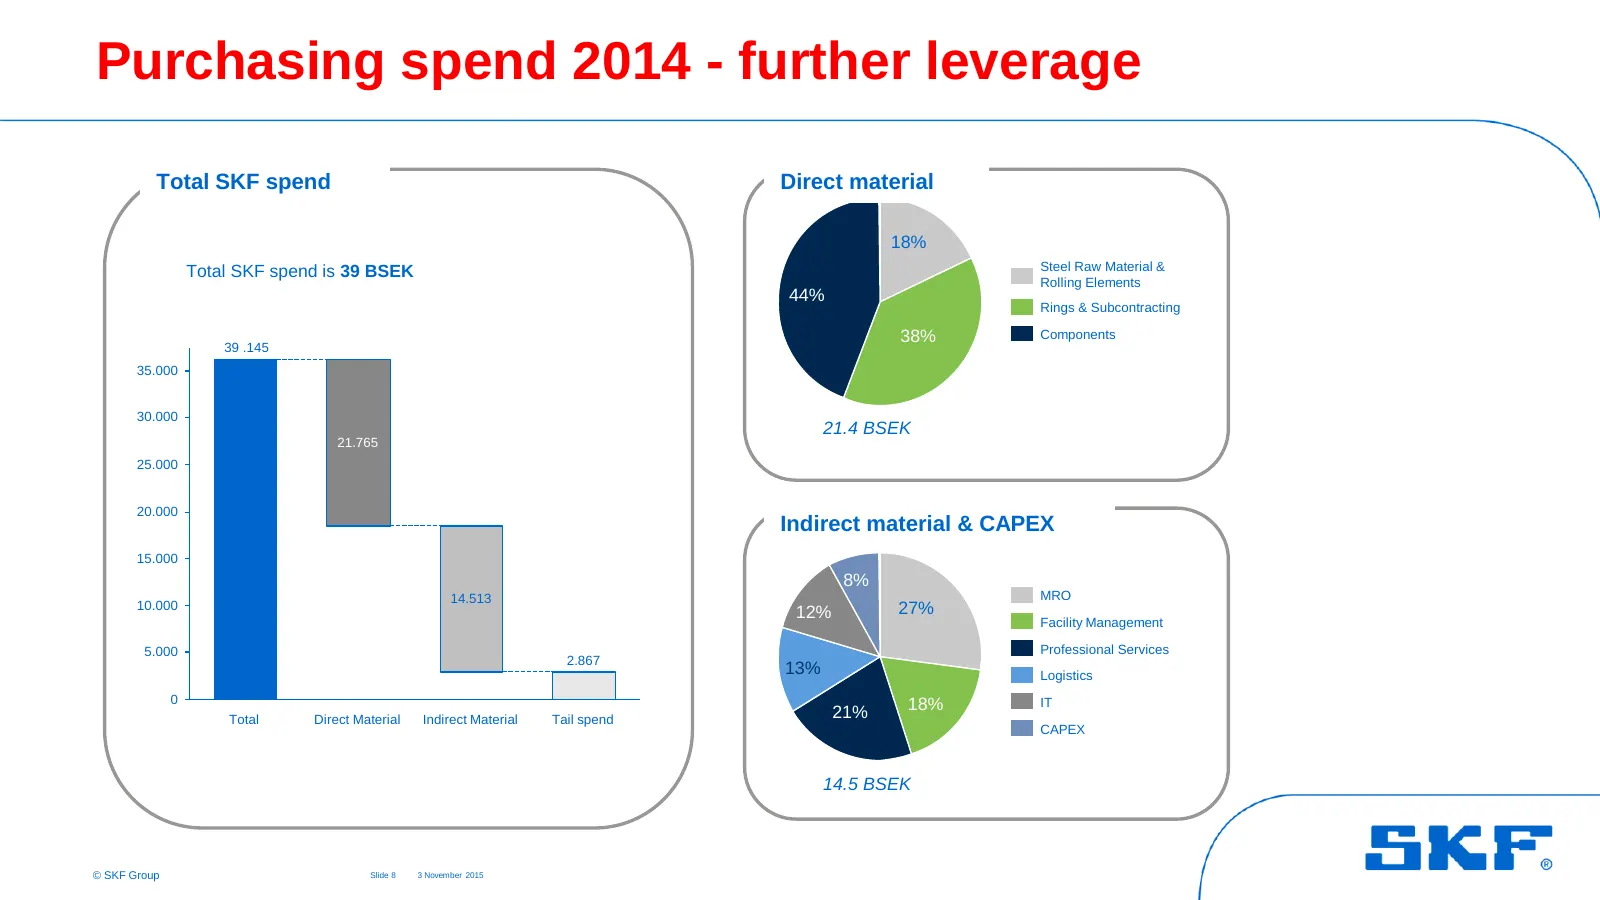
Purchasing spend 2014 - further leverage Total SKF spend Direct Material Direct material 18% Total SKF spend is 39 BSEK Steel Raw Material & Rolling Elements 44% Rings & Subcontracting 38% Components 39 .145 35.000 30.000 21.4 BSEK 21.765 25.000 20.000 Indirect material & CAPEX 15.000 8% 14.513 MRO
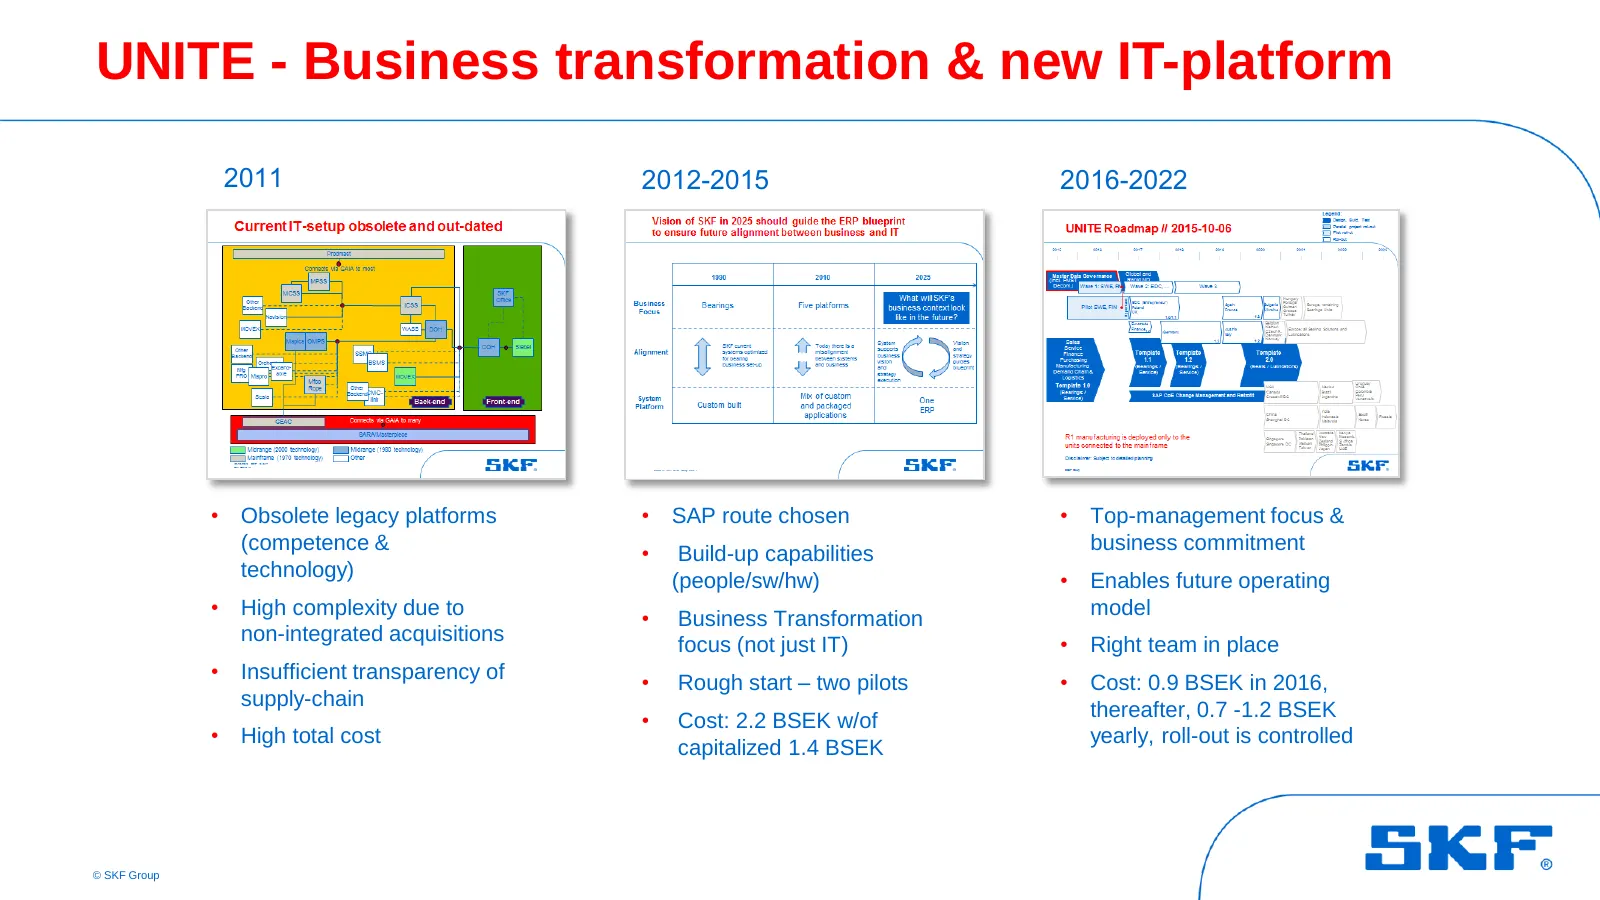
Slide 9: UNITE - Business transformation & new IT-platform
UNITE - Business transformation & new IT-platform 2011 2012-2015 2016-2022 • Obsolete legacy platforms • SAP route chosen • Top-management focus & (competence & business commitment • Build-up capabilities technology) (people/sw/hw) • Enables future operating • High complexity due to • Business Trans
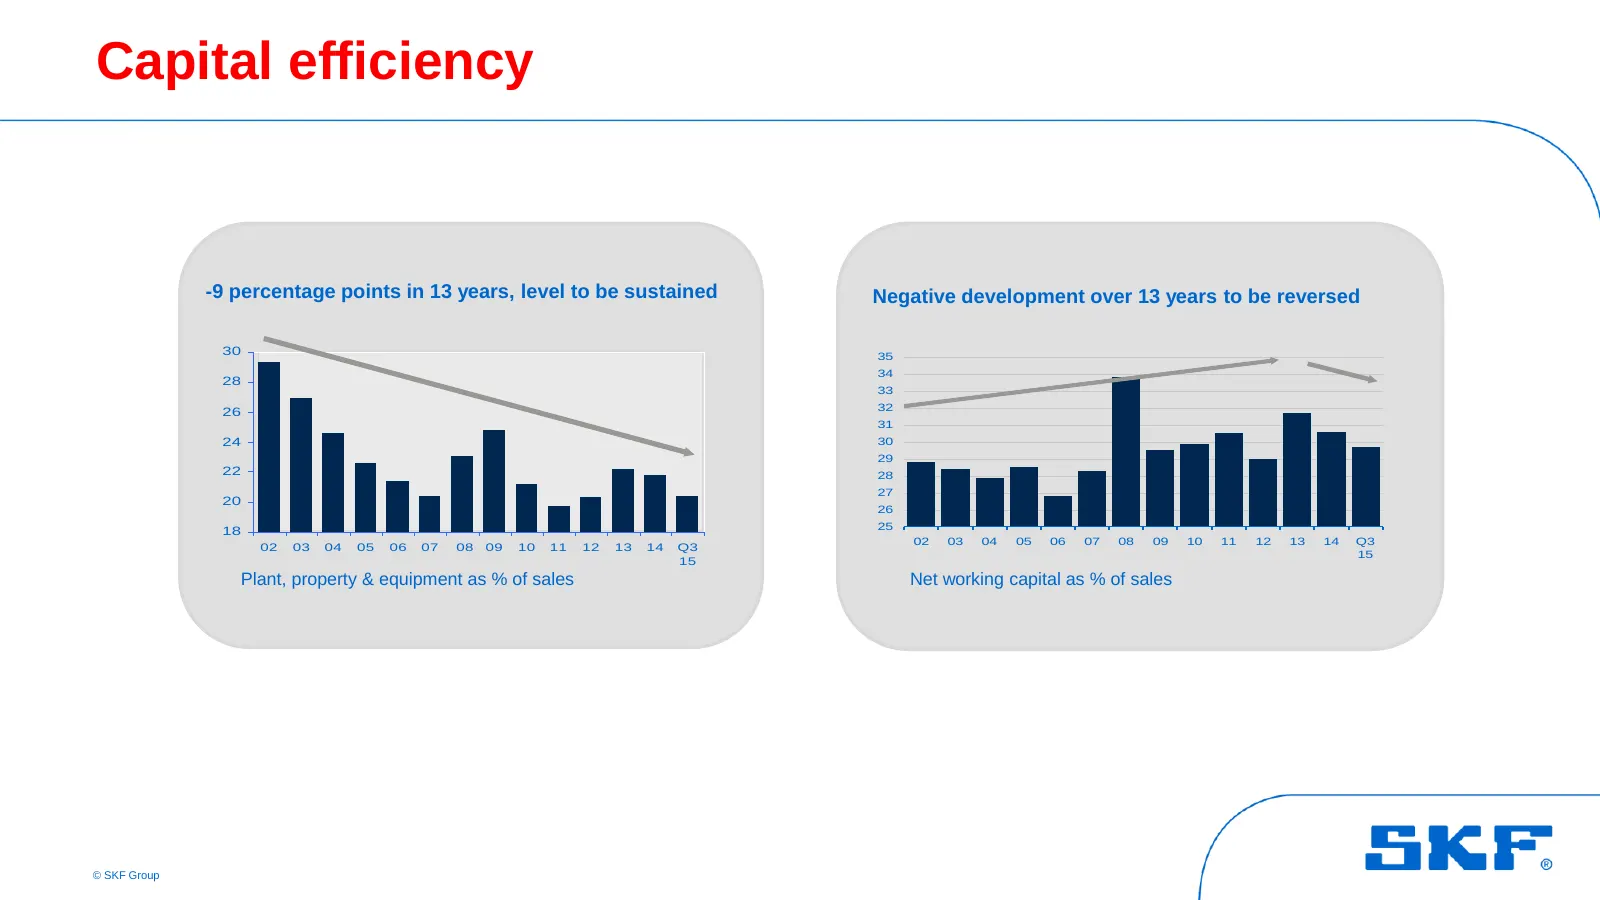
Slide 10: Capital efficiency
Capital efficiency -9 percentage points in 13 years, level to be sustained Negative development over 13 years to be reversed 30 35 34 28 33 26 32 31 24 30 29 22 28 27 20 26 18 25 02 03 04 05 06 07 08 09 10 11 12 13 14 Q3 02 03 04 05 06 07 08 09 10 11 12 13 14 Q3 15 15 Plant, property & equipment as
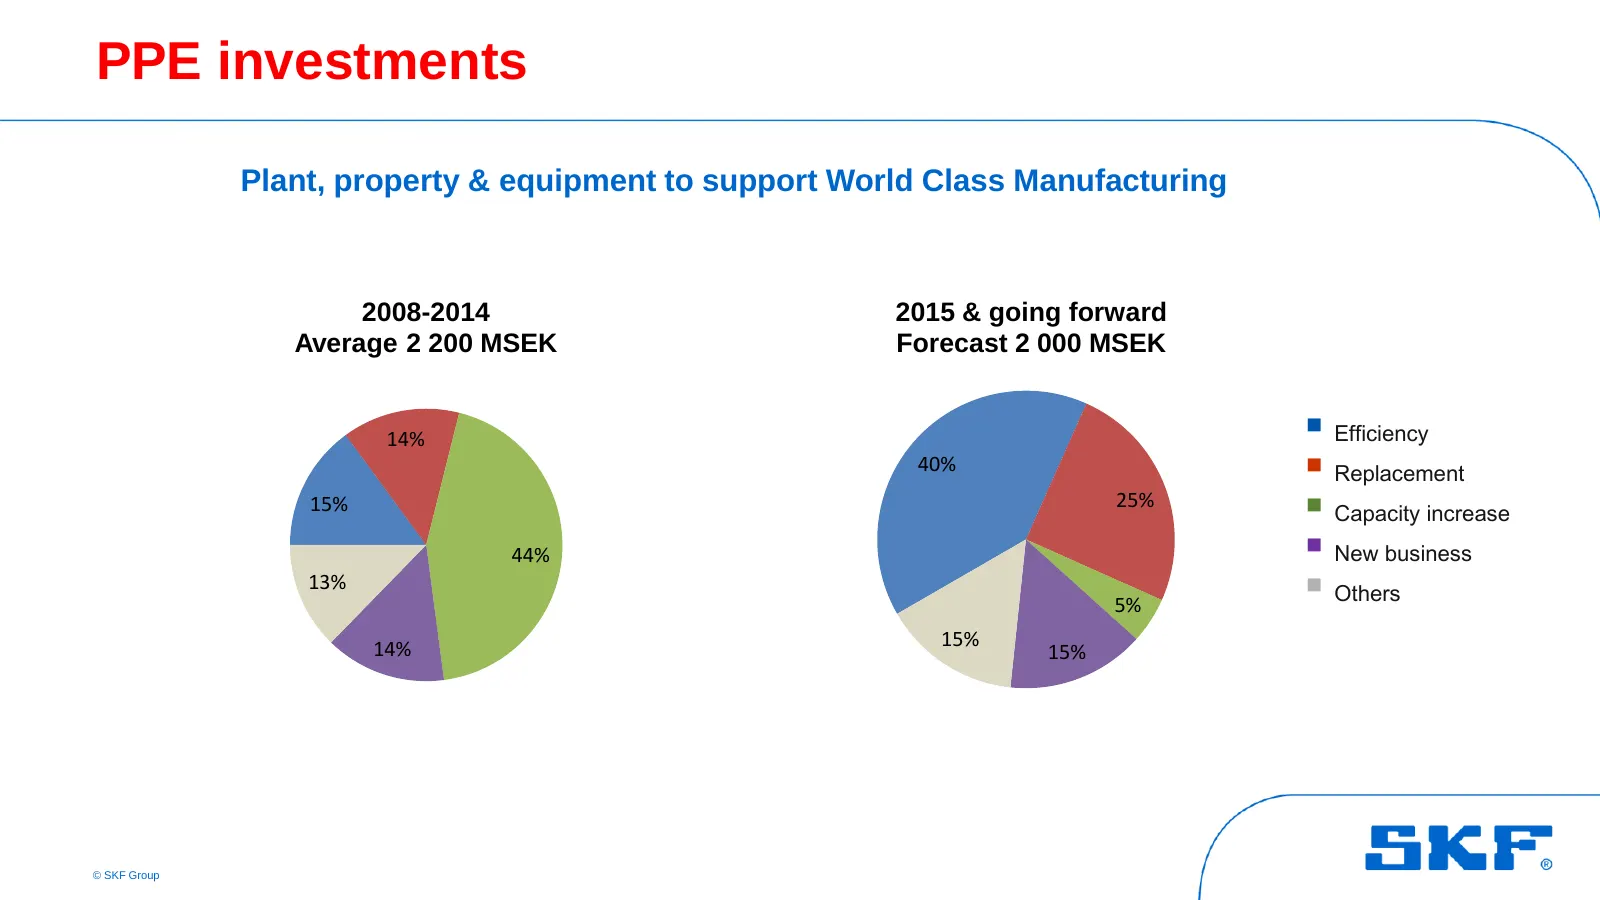
Slide 11: PPE investments
PPE investments Plant, property & equipment to support World Class Manufacturing 2008-2014 2015 & going forward Average 2 200 MSEK Forecast 2 000 MSEK 14% Efficiency 40% Replacement 15% 25% Capacity increase 44% New business 13% 5% Others 14% 15% 15% © SKF Group
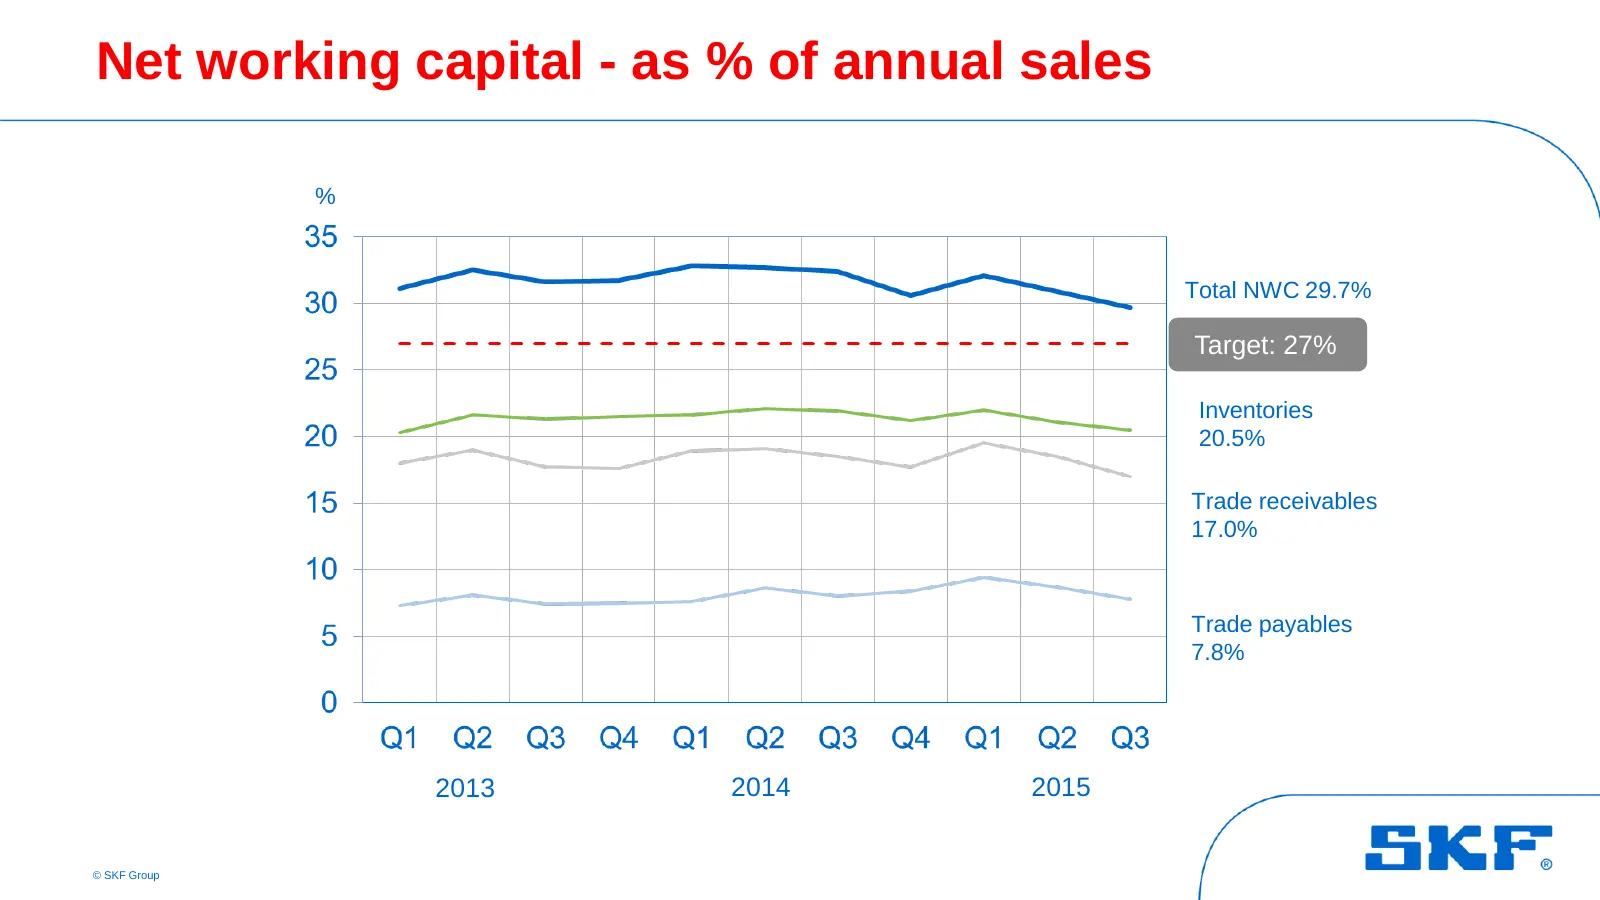
Slide 12: Net working capital - as % of annual sales
Net working capital - as % of annual sales % Total NWC 29.7% Target: 27% Inventories 20.5% Trade receivables 17.0% Trade payables 7.8% 2013 2014 2015 © SKF Group
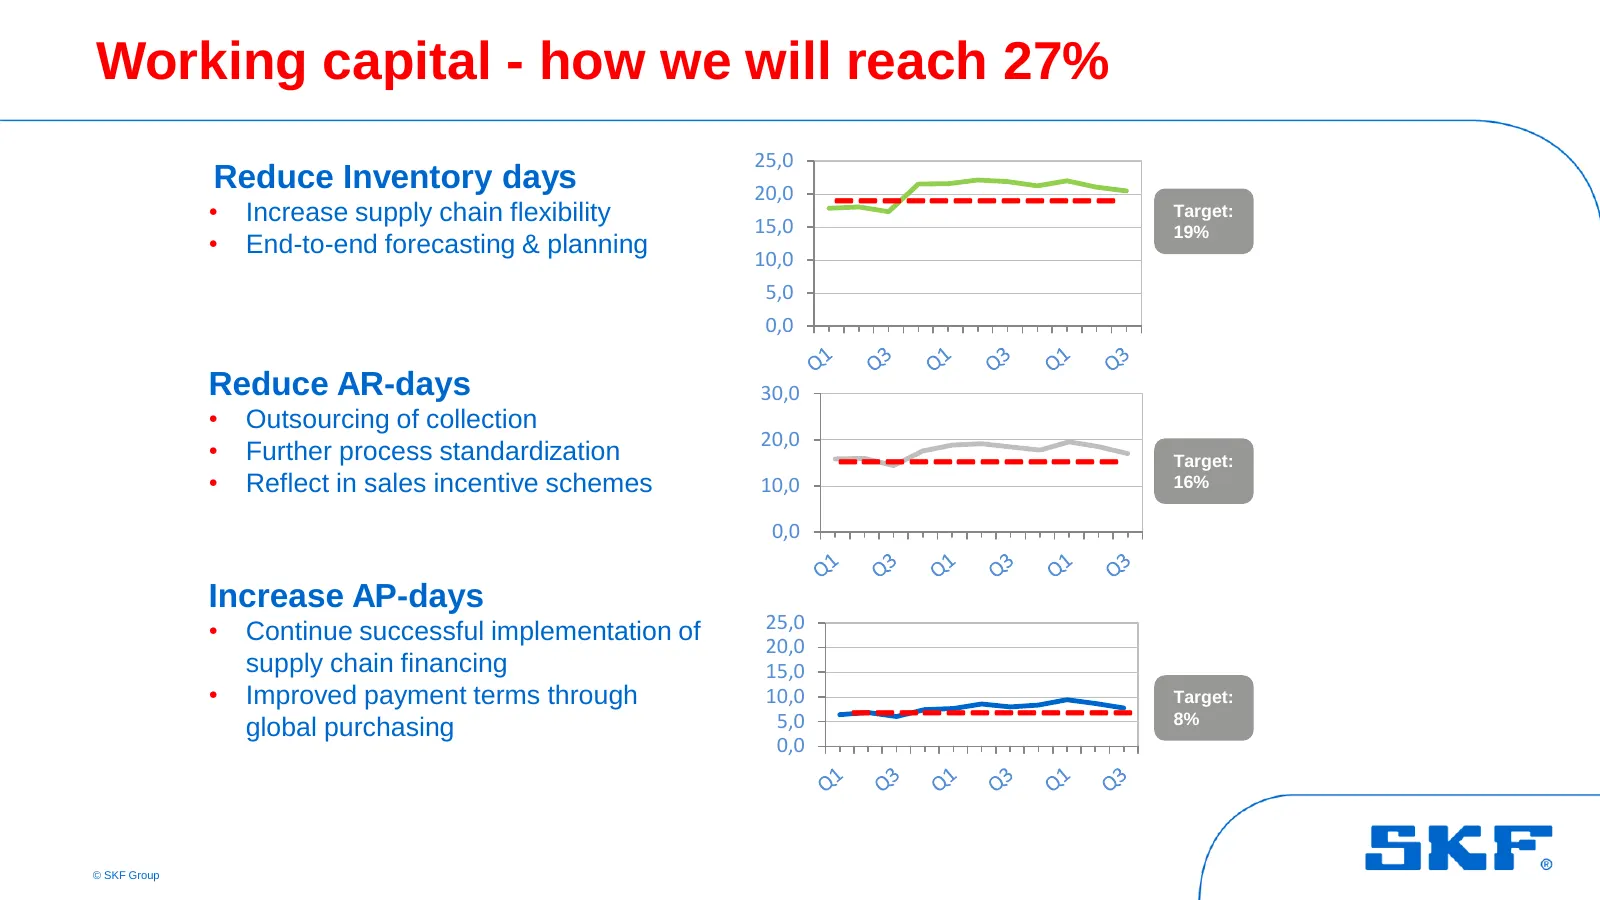
Slide 13: Working capital - how we will reach 27%
Working capital - how we will reach 27% 25,0 Reduce Inventory days • • Increase supply chain flexibility End-to-end forecasting & planning 20,0 15,0 ------------ Target: 19% 10,0 5,0 0,0 Reduce AR-days 30,0 • Outsourcing of collection • • Further process standardization Reflect in sales incentive sc
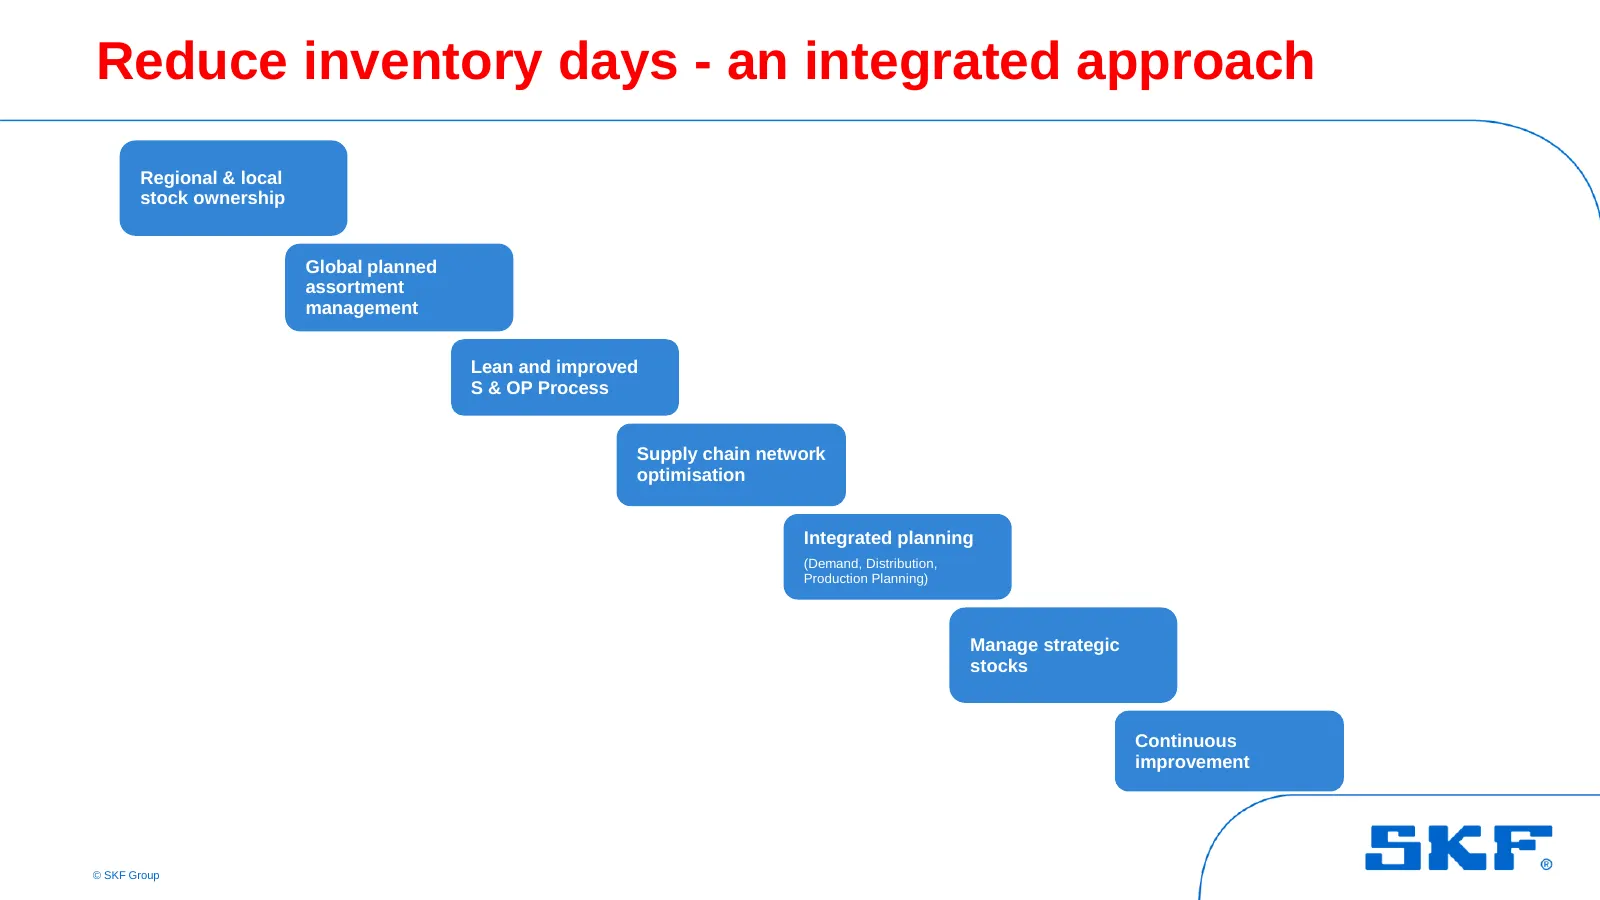
Slide 14: Reduce inventory days - an integrated approach
Reduce inventory days - an integrated approach Regional & local stock ownership Global planned assortment management Lean and improved S & OP Process Supply chain network optimisation Integrated planning (Demand, Distribution, Production Planning) Manage strategic stocks Continuous improvement © SKF
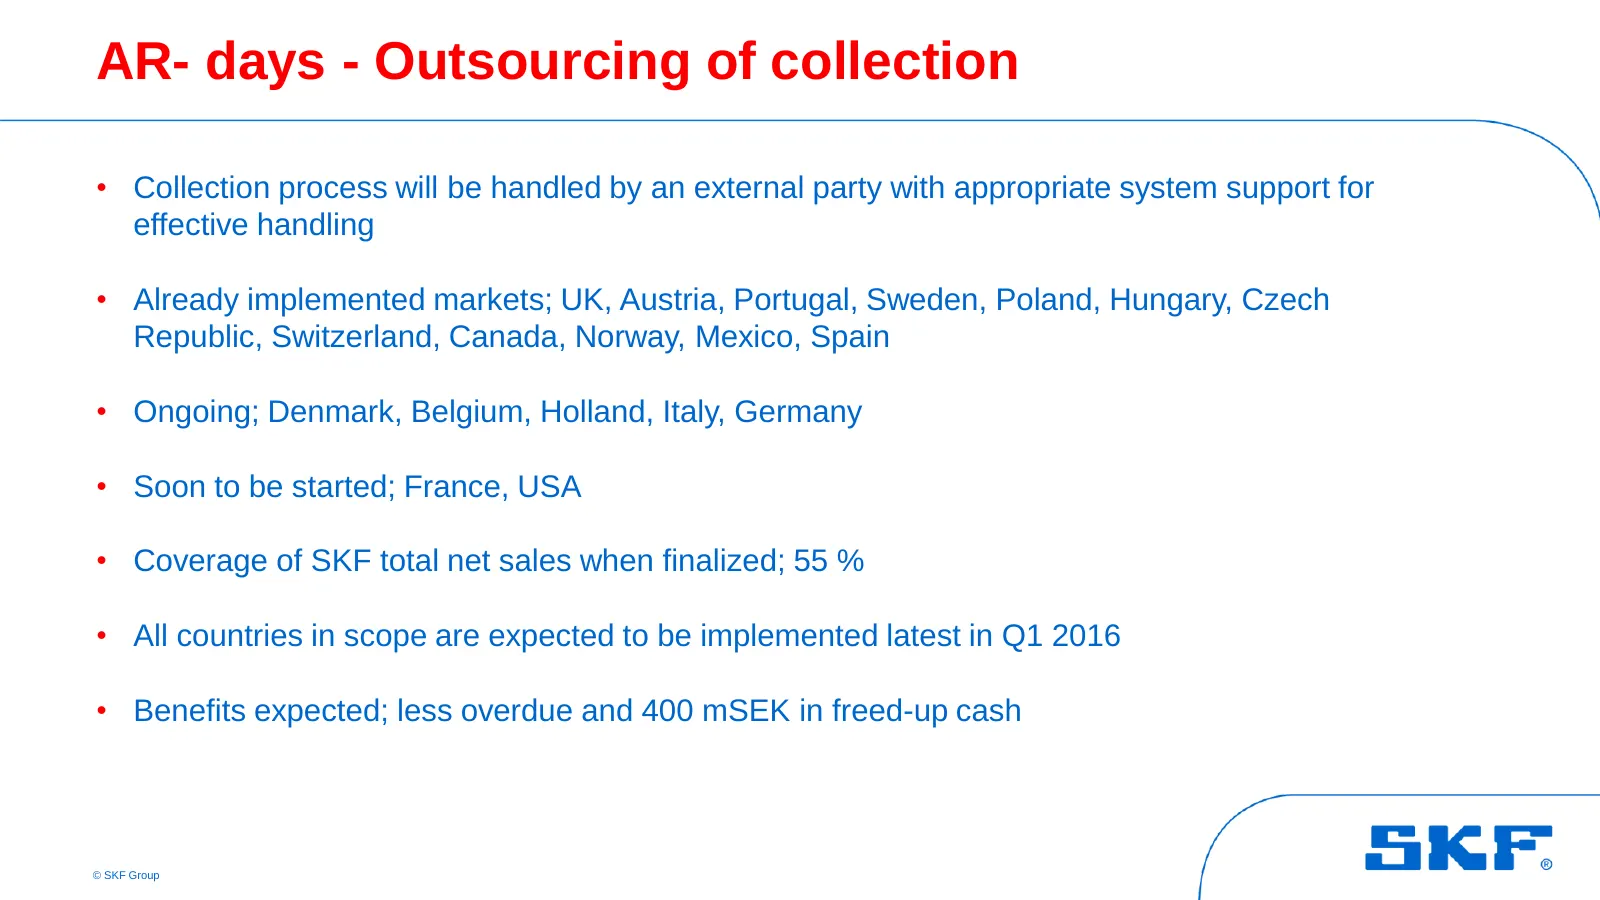
Slide 15: AR- days - Outsourcing of collection
AR- days - Outsourcing of collection • Collection process will be handled by an external party with appropriate system support for effective handling • Already implemented markets; UK, Austria, Portugal, Sweden, Poland, Hungary, Czech Republic, Switzerland, Canada, Norway, Mexico, Spain • Ongoing; D
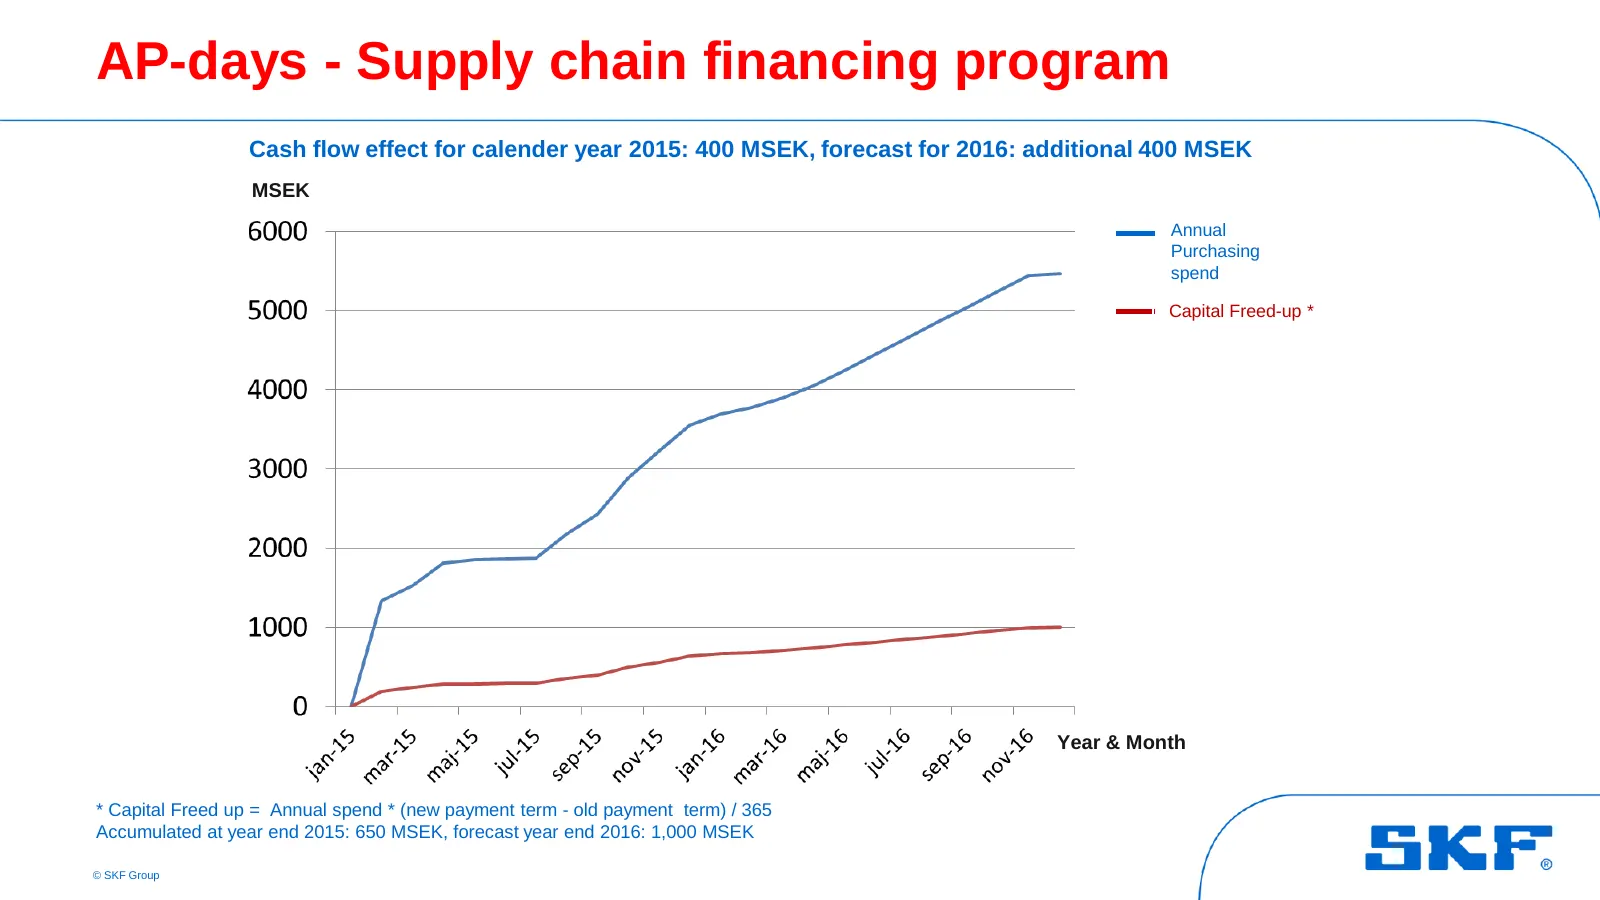
Slide 16: AP-days - Supply chain financing program
AP-days - Supply chain financing program Cash flow effect for calender year 2015: 400 MSEK, forecast for 2016: additional 400 MSEK MSEK Annual Purchasing spend Capital Freed-up * Year & Month * Capital Freed up = Annual spend * (new payment term - old payment term) / 365 Accumulated at year end 2015
Slide 17: Financial position
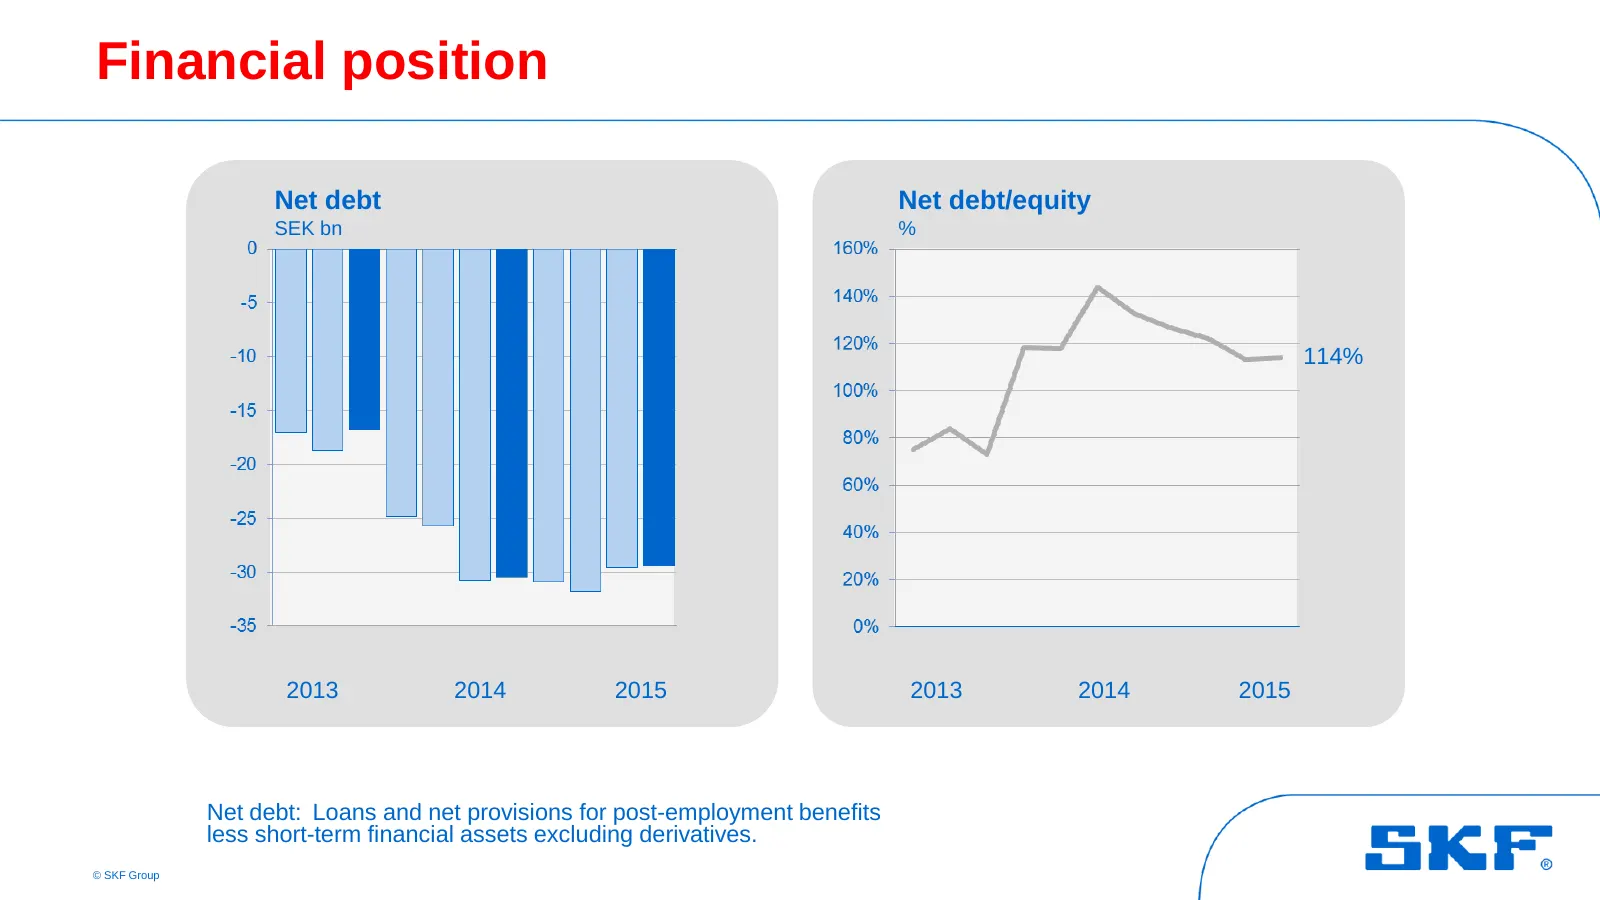
Financial position Net debt Net debt/equity SEK bn % 114% 2013 2014 2015 2013 2014 2015 Net debt: Loans and net provisions for post-employment benefits less short-term financial assets excluding derivatives. © SKF Group
Slide 18: Acquisitions & divestments 2008-2015
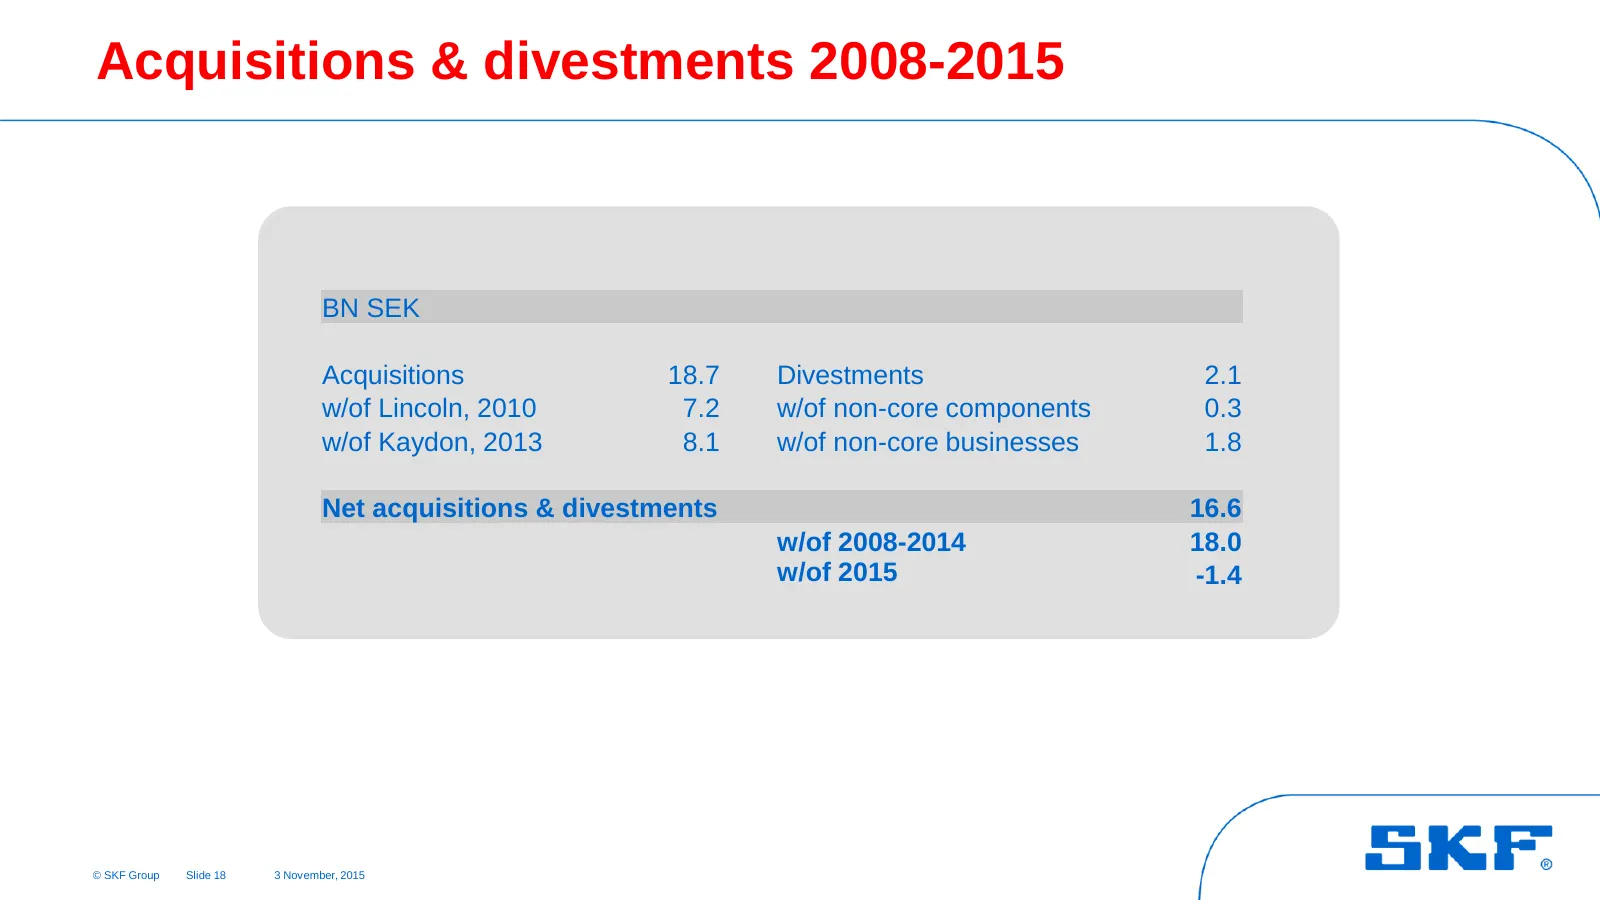
Acquisitions & divestments 2008-2015 BN SEK Acquisitions 18.7 Divestments 2.1 w/of Lincoln, 2010 7.2 w/of non-core components 0.3 w/of Kaydon, 2013 8.1 w/of non-core businesses 1.8 Net acquisitions & divestments 16.6 w/of 2008-2014 18.0 w/of 2015 -1.4 © SKF Group Slide 18 3 November, 2015
Slide 19: Summary
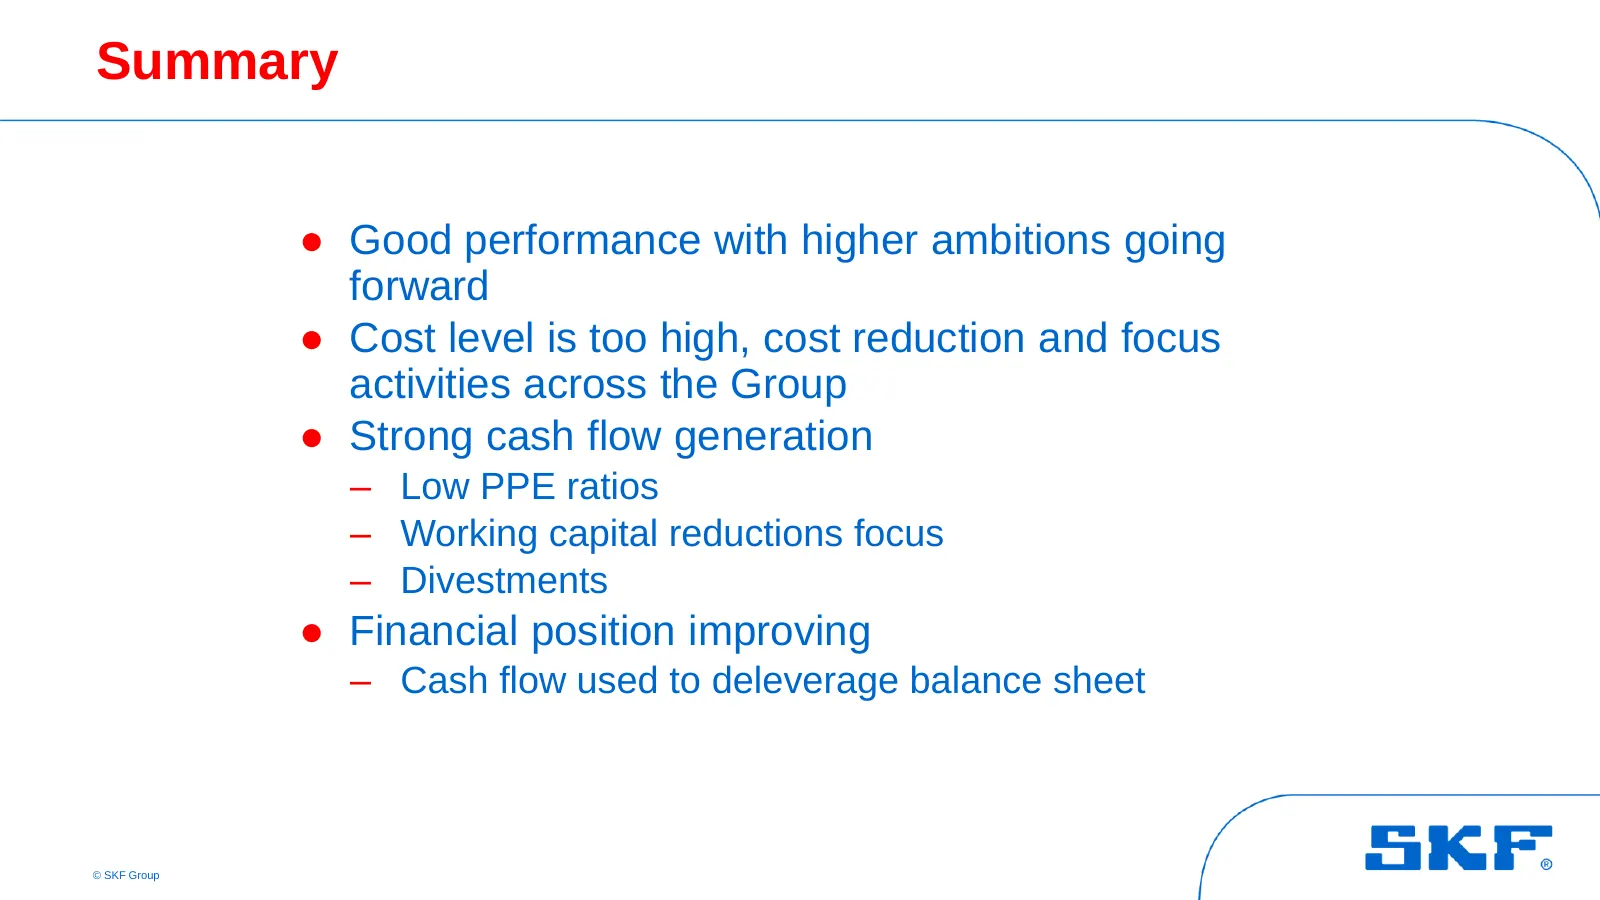
Summary ● Good performance with higher ambitions going forward ● Cost level is too high, cost reduction and focus activities across the Group ● Strong cash flow generation – Low PPE ratios – Working capital reductions focus – Divestments ● Financial position improving – Cash flow used to deleverage
Source: Internet Archive copy of investors.skf.com
More decks from SKF AB Class A
 Q3 2026 Earnings Presentation20 slides · Oct 21, 2026
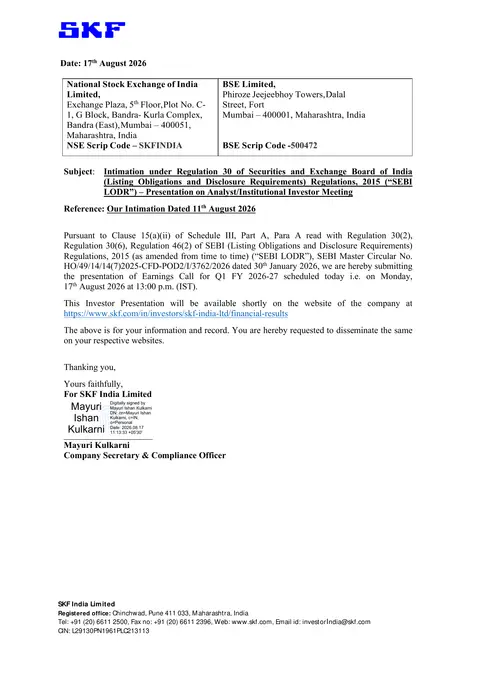 SKF India — Q1 FY2026-27 Earnings Presentation20 slides · Aug 17, 2026
 Q2 2026 Earnings Presentation21 slides · Jul 17, 2026
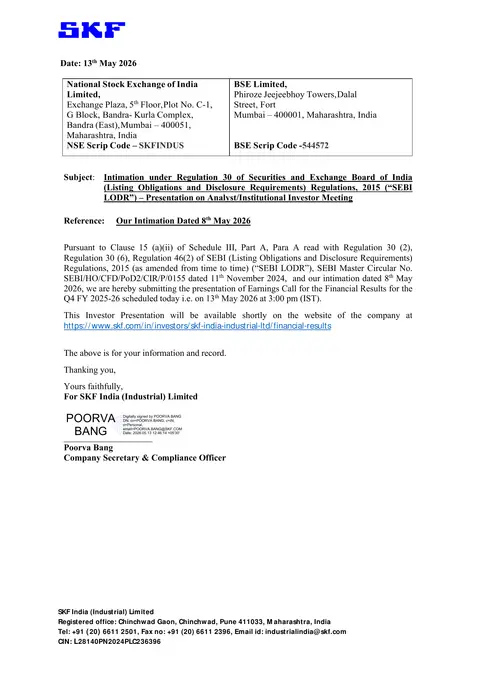 SKF India (Industrial) — Q4 FY2026 Earnings Presentation20 slides · May 13, 2026
 Q1 2026 Earnings Presentation22 slides · Apr 21, 2026
 Q4 2025 Earnings Presentation19 slides · Jan 30, 2026