Allegiance Bancshares — Investor Presentation (May 2016)
16 slides from Allegiance Bancshares's investor presentation, May 2, 2016
Slide 1: Investor Presentation May 2016
4” AllegianceBa NASDAQ: ABTX Investor Presentation May 2016
Slide 2: Safe Harbor Statement
Safe Harbor Statement = “Safe Harbor’ Statement under the Private Securities Litigation Reform Act of 1995: This presentation may contain forward-looking statements within the meaning of the securities laws that are based on various facts and derived utilizing important assumptions, present expectat
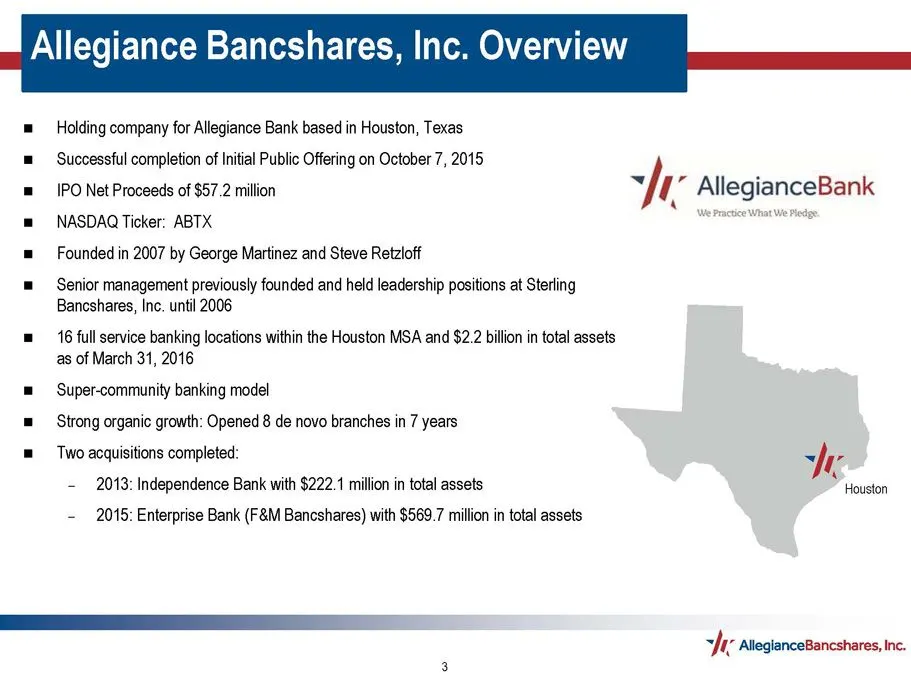
Slide 3: Allegiance Bancshares, Inc. Overview
Allegiance Bancshares, Inc. Overview = ~~ Holding company for Allegiance Bank based in Houston, Texas = Successful completion of Initial Public Offering on October 7, 2015 : wher : m= IPO Net Proceeds of $57.2 milion Wh AllegianceBank = NASDAQ Ticker: ABTX Se = Founded in 2007 by George Martinez and
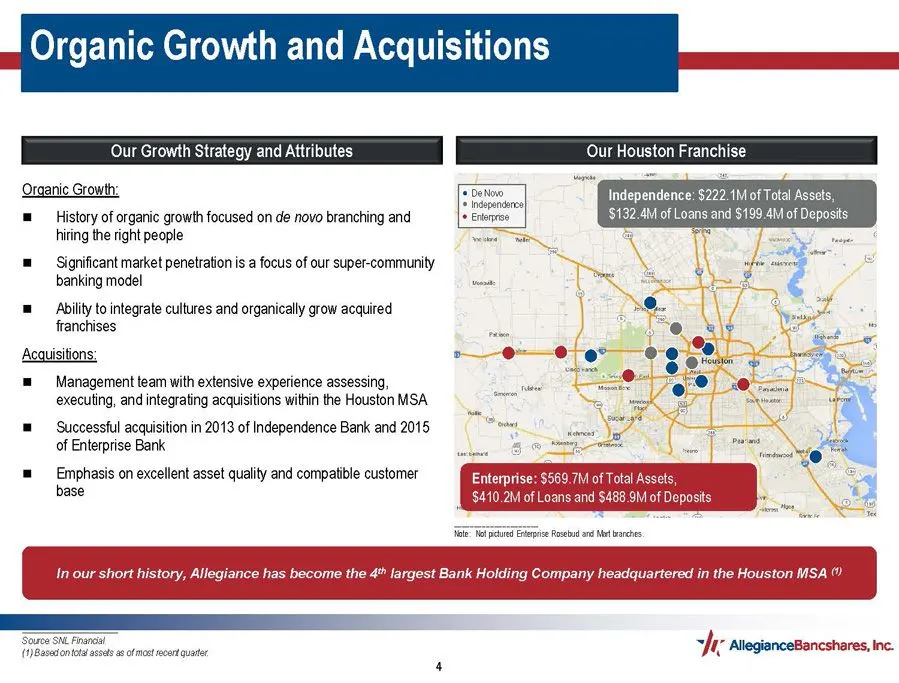
Slide 4: Organic Growth and Acquisitions
Organic Growth and Acquisitions Organic Growth: = History of organic growth focused on de novo branching and hiring the right people = Significant market penetration is a focus of our super-community banking model = Ability to integrate cultures and organically grow acquired franchises Acquisitions:
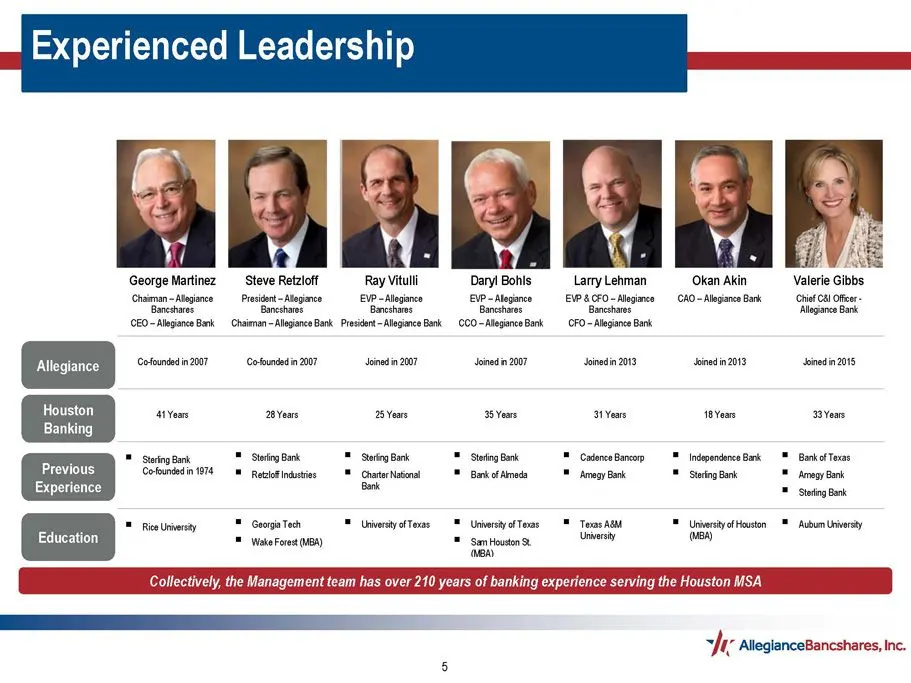
Slide 5: Experienced Leadership
Experienced Leadership Ll George Martinez Steve Retzloff Ray Vitull Daryl Bohs Lary Lehman (Okan Akin Valerie Gibbs (Chaiman-Alagiance President ~Alegince EVP Alegiance EVP-Aleganco EVP &.CFOAlegiance CAO ~AlgjanceBark Chia Cl Ofer. Bancshares Bancehres Bares Baneihaes Boncrhes ‘agance Bak (0E0--Alg
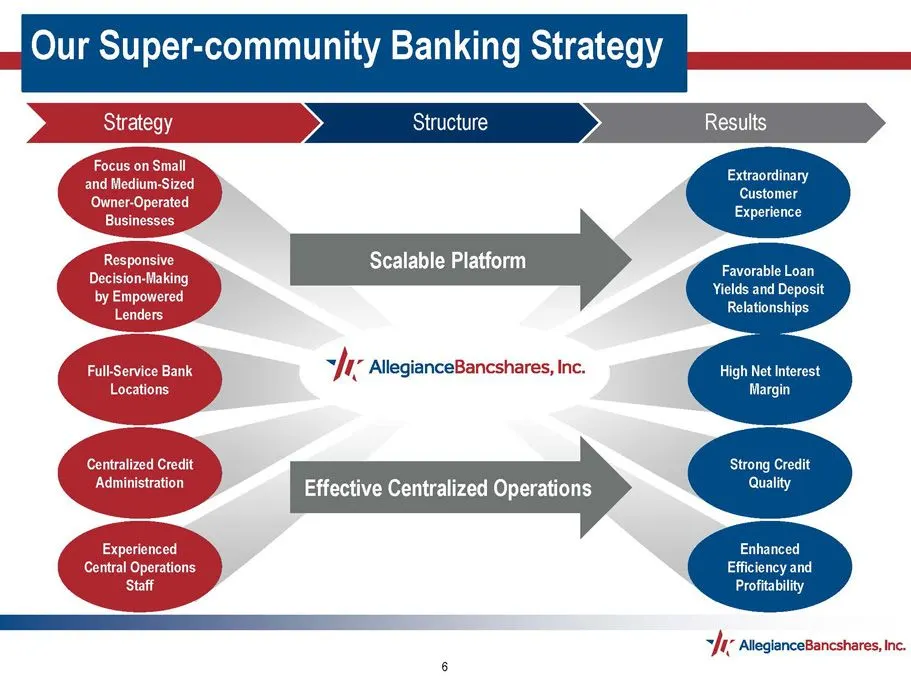
Slide 6: Our Super-community Banking Strategy
Our Super-community Banking Strategy Extraordinary Customer Experience Scalable Platform Favorable Loan Yields and Deposit Relationships High Net interest Margin Strong Credit Quality Effective Centralized Operations Enhanced Efficiency and Profitability aft; Ategiances:
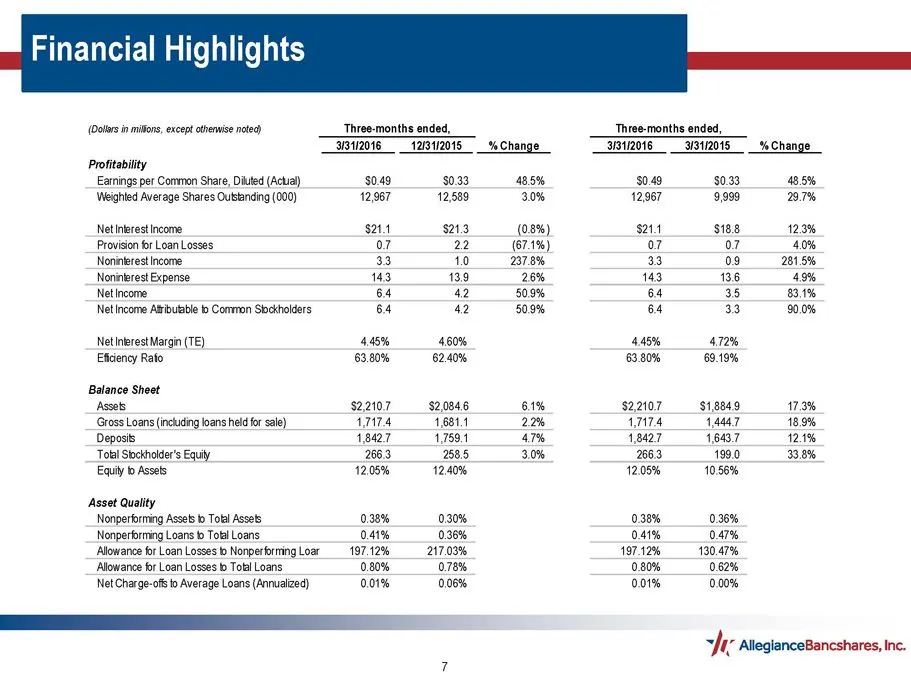
Slide 7: Financial Highlights
Financial Highlights {Golan mitos except eiewise note) Three-months ended, Three-months ended, 12812015 % Change TBO 31201 _% Change Profitability Earnings pet Common Share, Died (Aci) soa $033 48.5% $0.49 $0.33 85% Weihled Average Shares Oustnding (000) 12987 12589 30% 12967 9.999 2% Netinerest inc
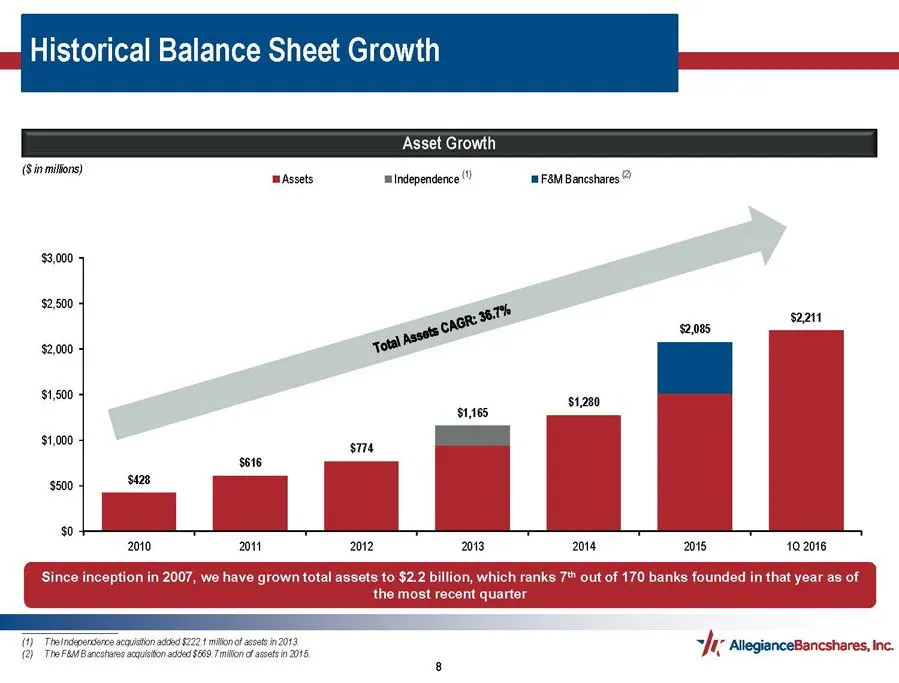
Slide 8: Historical Balance Sheet Growth
Historical Balance Sheet Growth Asset Growth (Sinmilors) rm 7 Assets Independence 1 F8M Bancshares $3,000 $2,500 por $2211 pasos $2.05 $2,000 yo a $1,500 $1280 $165 $1,000 sii aa $616 $500 basi 90+ 2010 2011 2012 2013 2014 2018 102016 ks founded in that year as of | Yass 2018. she nexioncess 1 ast 0
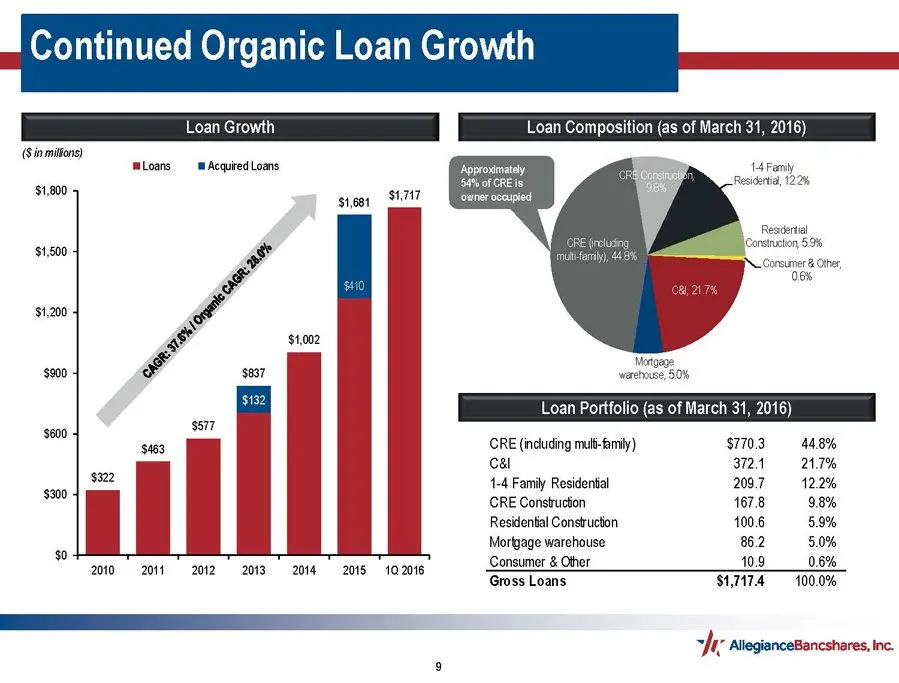
Slide 9: Continued Organic Loan Growth
Continued Organic Loan Growth (Sinmilfons) ‘Loans m Acquired Loans Toosiaatly 1-4 Faniy _ 54% of CRE Ie Reside, 122% PPMMEALAE or occupied Recital CRE (reusing sis $ oats $1,200 $4,002 200 efouse, 5 Loan Portfolio (as of March 31, 2016) ‘ea $617 we OJ CRE (including mul-family) $7703 44.8% I cal 372
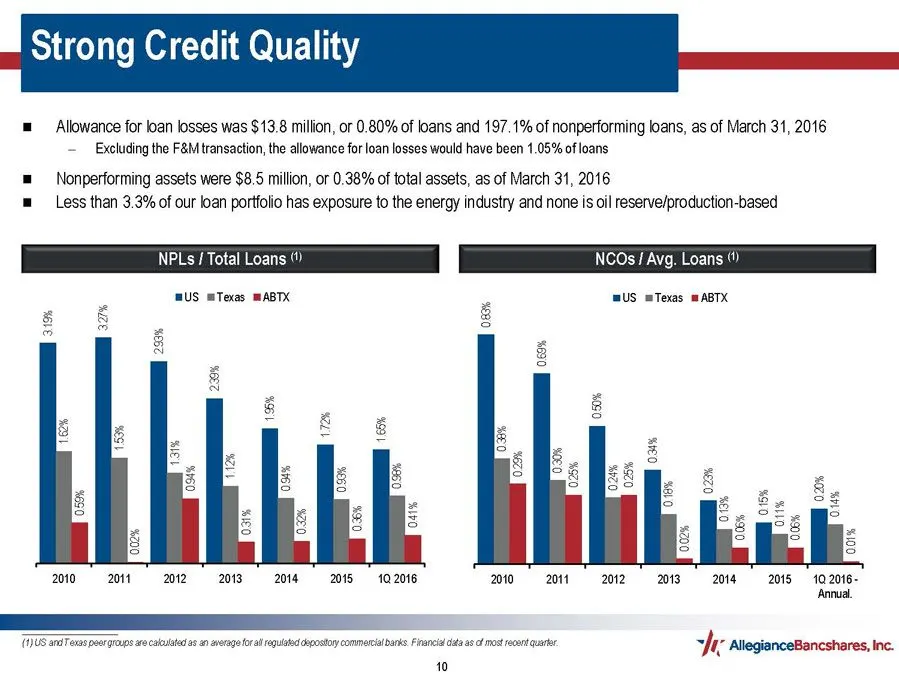
Slide 10: Strong Credit Quality
Strong Credit Quality = Allowance for loan losses was $13.8 million, or 0.80% of loans and 197.1% of nonperforming loans, as of March 31, 2016 Excluding the F&M transaction, the allowance for loan losses would have been 1.05% of loans = Nonperforming assets were $8.5 million, or 0.38% of total asset
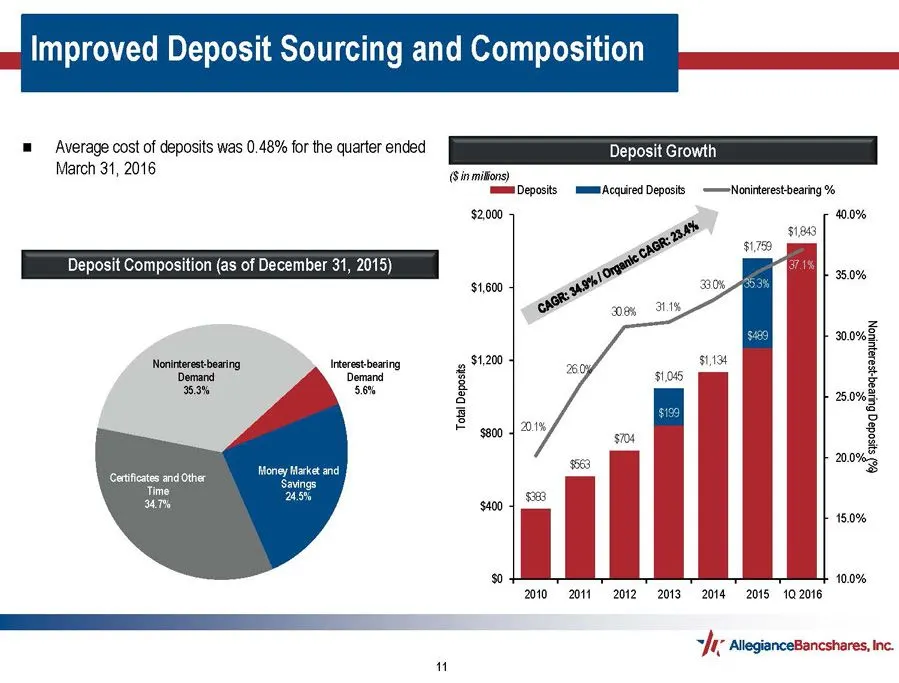
Slide 11: Improved Deposit Sourcing and Composition
Improved Deposit Sourcing and Composition Average cost of deposits was 0.48% for the quarter ended March 31, 2016 Deposits mMMAcquired Deposits —-Noninterest-bearing % 40.0% ou $188 of 58 Deposit Composition (as of December 31, 2015) cs aN $1,800 30.0% 3. sim H Fa F : 50% 3 ‘ S = gem | 21%, g & 200
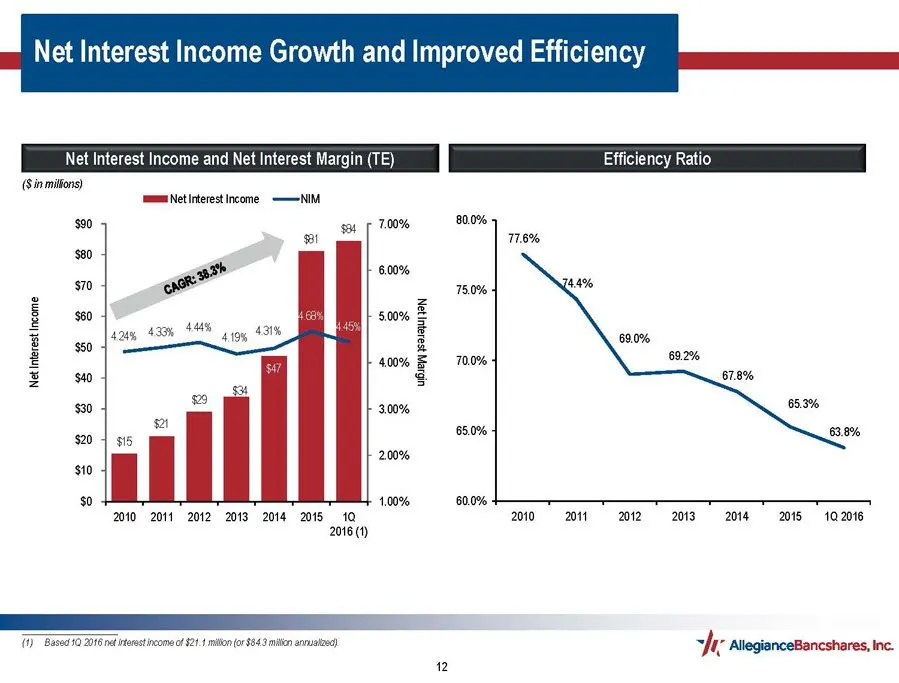
Slide 12: Net Interest Income Growth and Improved Efficiency
Net Interest Income Growth and Improved Efficiency Net Interest Income and Net Interest Margin (TE) Efficiency Ratio (Sinmilfons) mm Netirterest Income —=NIM Net interest income 2010 2011 2012 2013 2014 2015 10 2016(1) TH) Based 10 2576 et ees ncomeof $21.4 mien for $4. mien anrueowa) ey 35311) }2N
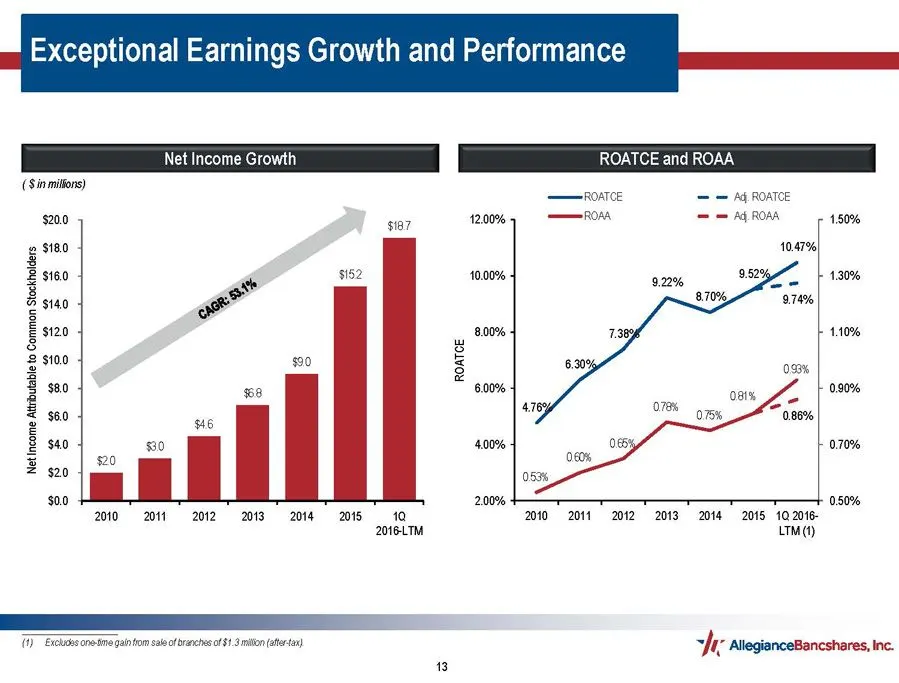
Slide 13: Exceptional Earnings Growth and Performance
Exceptional Earnings Growth and Performance Net Income Growth ROATCE and ROAA (Sinmilions) —ronrce = = Ag ROATOE $200 12.00% —rom = AG ROMA 150% 2 $180 10.47% 3 2 ste0 10.00% B sao i $120 8.00% 8 2 $10.0 & 3 2 S s80 6.00% E so 2 8 sto 4.00% 3 = s20 0 2.00% + + 050% 2010 it 2012 134 2010 2011 2012 20
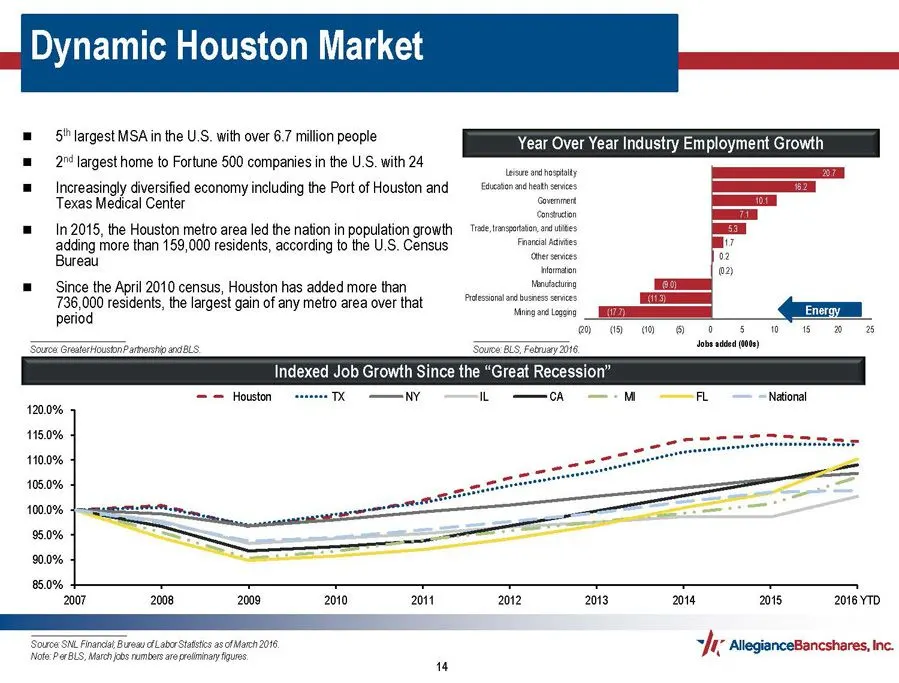
Slide 14: Dynamic Houston Market
Dynamic Houston Market SIGS MSA BE US. esr A lion people Year Over Year Industry Employment Growth = ~— 2" largest home to Fortune 500 companies in the U.S. with 24 sue valet m= Increasingly diversified economy including the Port of Houston and sain sets Texas Medical Center ommet = 12045, the Houst
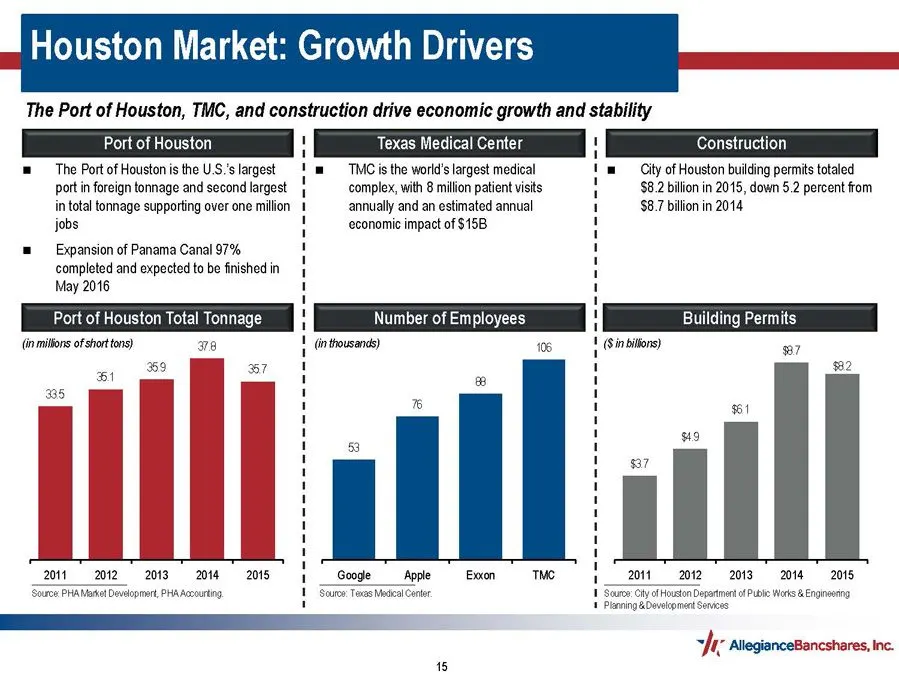
Slide 15: Houston Market: Growth Drivers
Houston Market: Growth Drivers The Port of Houston, TMC, and construction drive economic growth and stability Port of Houston The Port of Houston is the U.S.'s largest Pott in foreign tonnage and second largest in total tonnage supporting over one milion jobs = Expansion of Panama Canal 97% complete
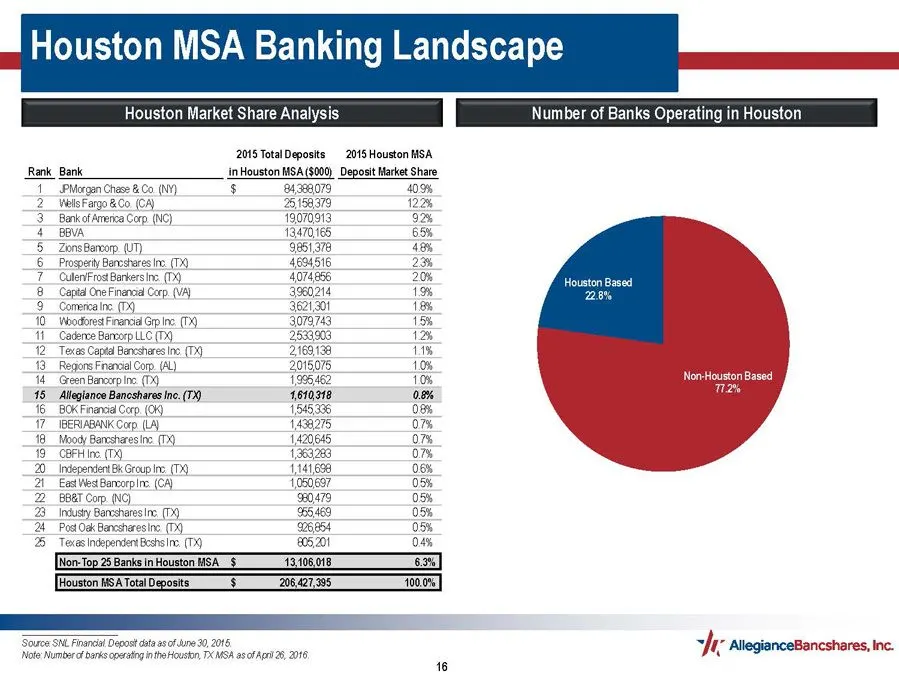
Slide 16: Houston MSA Banking Landscape
Houston MSA Banking Landscape Houston Market Share Analysis Number of Banks Operating in Houston 2015 Total Deposits 2015 Houston HSA Rank Bank in Houston MSA ($000) Deposit Market Share 1 PMargan Chase & Ca (NY) $ 4388079 40.9% 2 Wells Fargo &Co. (CA) 25158379. 422% 3 Bankof America Corp. (NC) 1907
Source: SEC EDGAR · 8-K filed May 2, 2016
More decks from Allegiance Bancshares Inc
 Q2 2022 Earnings Presentation16 slides · Jul 29, 2022
 Q1 2022 Earnings Presentation19 slides · Apr 28, 2022
 FY2021 Earnings Presentation18 slides · Jan 28, 2022
 Q4 2021 Earnings Presentation19 slides · Jan 28, 2022
 Merger or Acquisition (November 2021)28 slides · Nov 8, 2021
 Q3 2021 Earnings Presentation17 slides · Oct 28, 2021