Pioneer Natural Resources — Investor Presentation (January 2013)
54 slides from Pioneer Natural Resources's investor presentation, Jan 7, 2013

Slide 1: Investor Presentation January 2013
Exhibit 99.1 Investor Presentation January 2013

Slide 2: Forward-Looking Statements
Forward-Looking Statements Except for historical information contained herein, the statements, charts and graphs in this presentation are forward-looking statements that are made pursuant to the Safe Harbor Provisions of the Private Securities Litigation Reform Act of 1995. Forward-looking statement
Slide 3: Investment Highlights
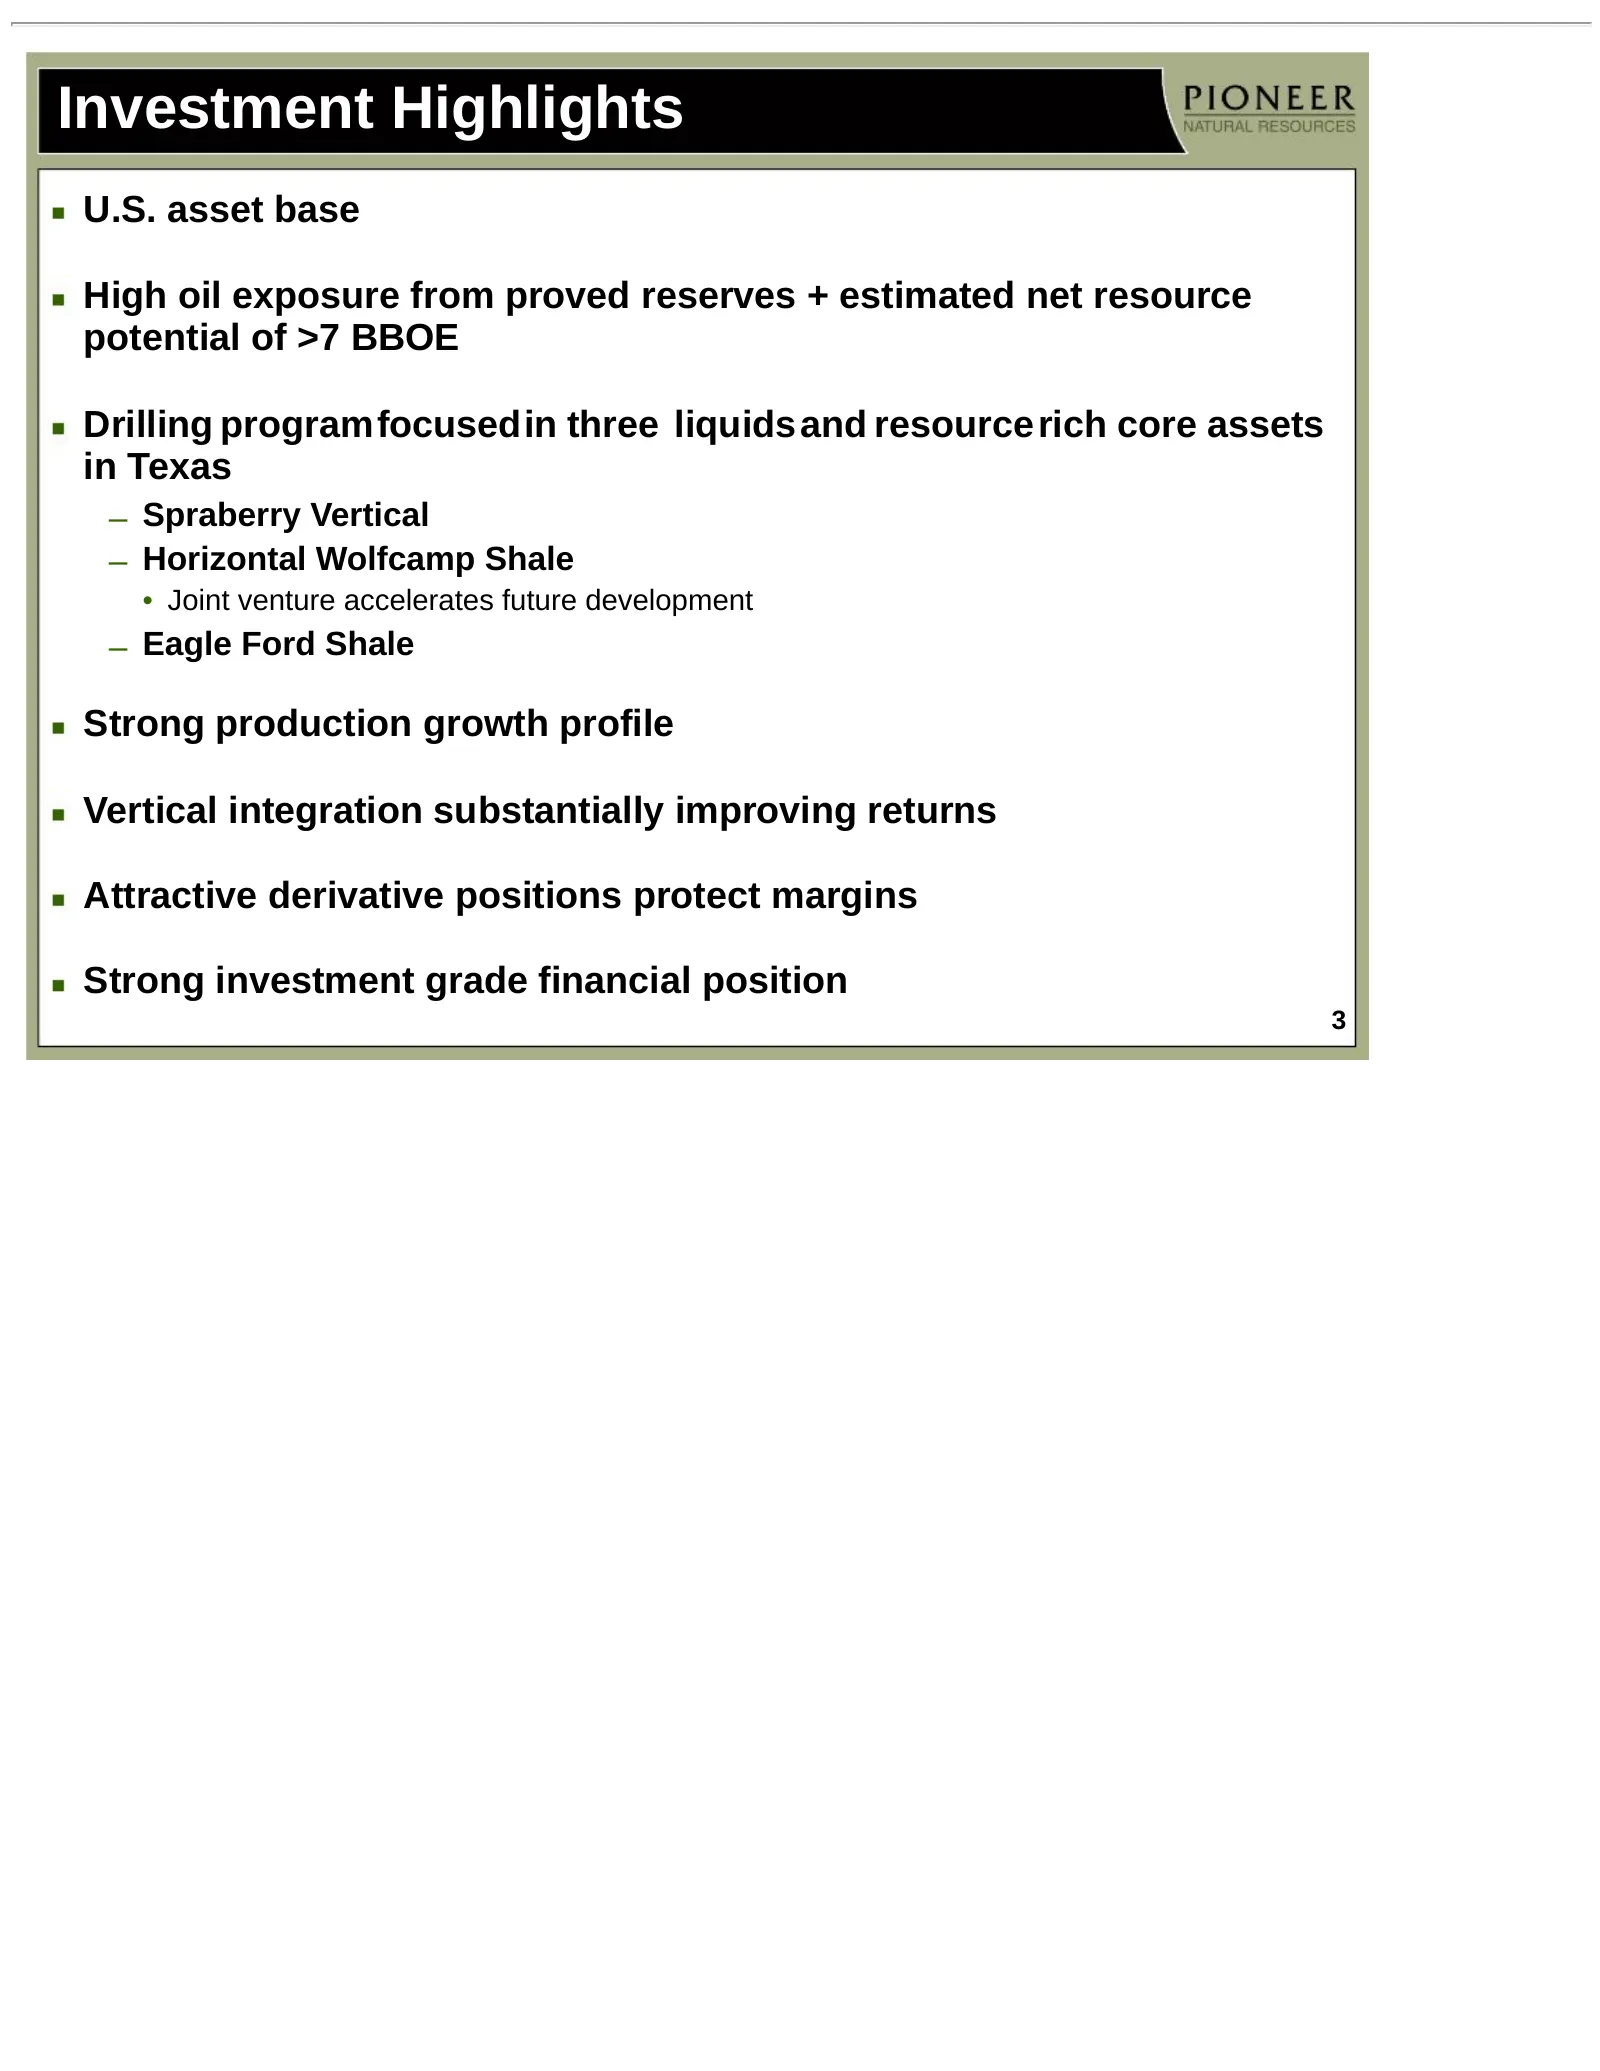
Investment Highlights U.S. asset base High oil exposure from proved reserves + estimated net resource potential of >7 BBOE Drilling programfocusedin three liquids and resource rich core assets in Texas – Spraberry Vertical – Horizontal Wolfcamp Shale • Joint venture accelerates future development –
Slide 4: Strong Production Growth in 2012
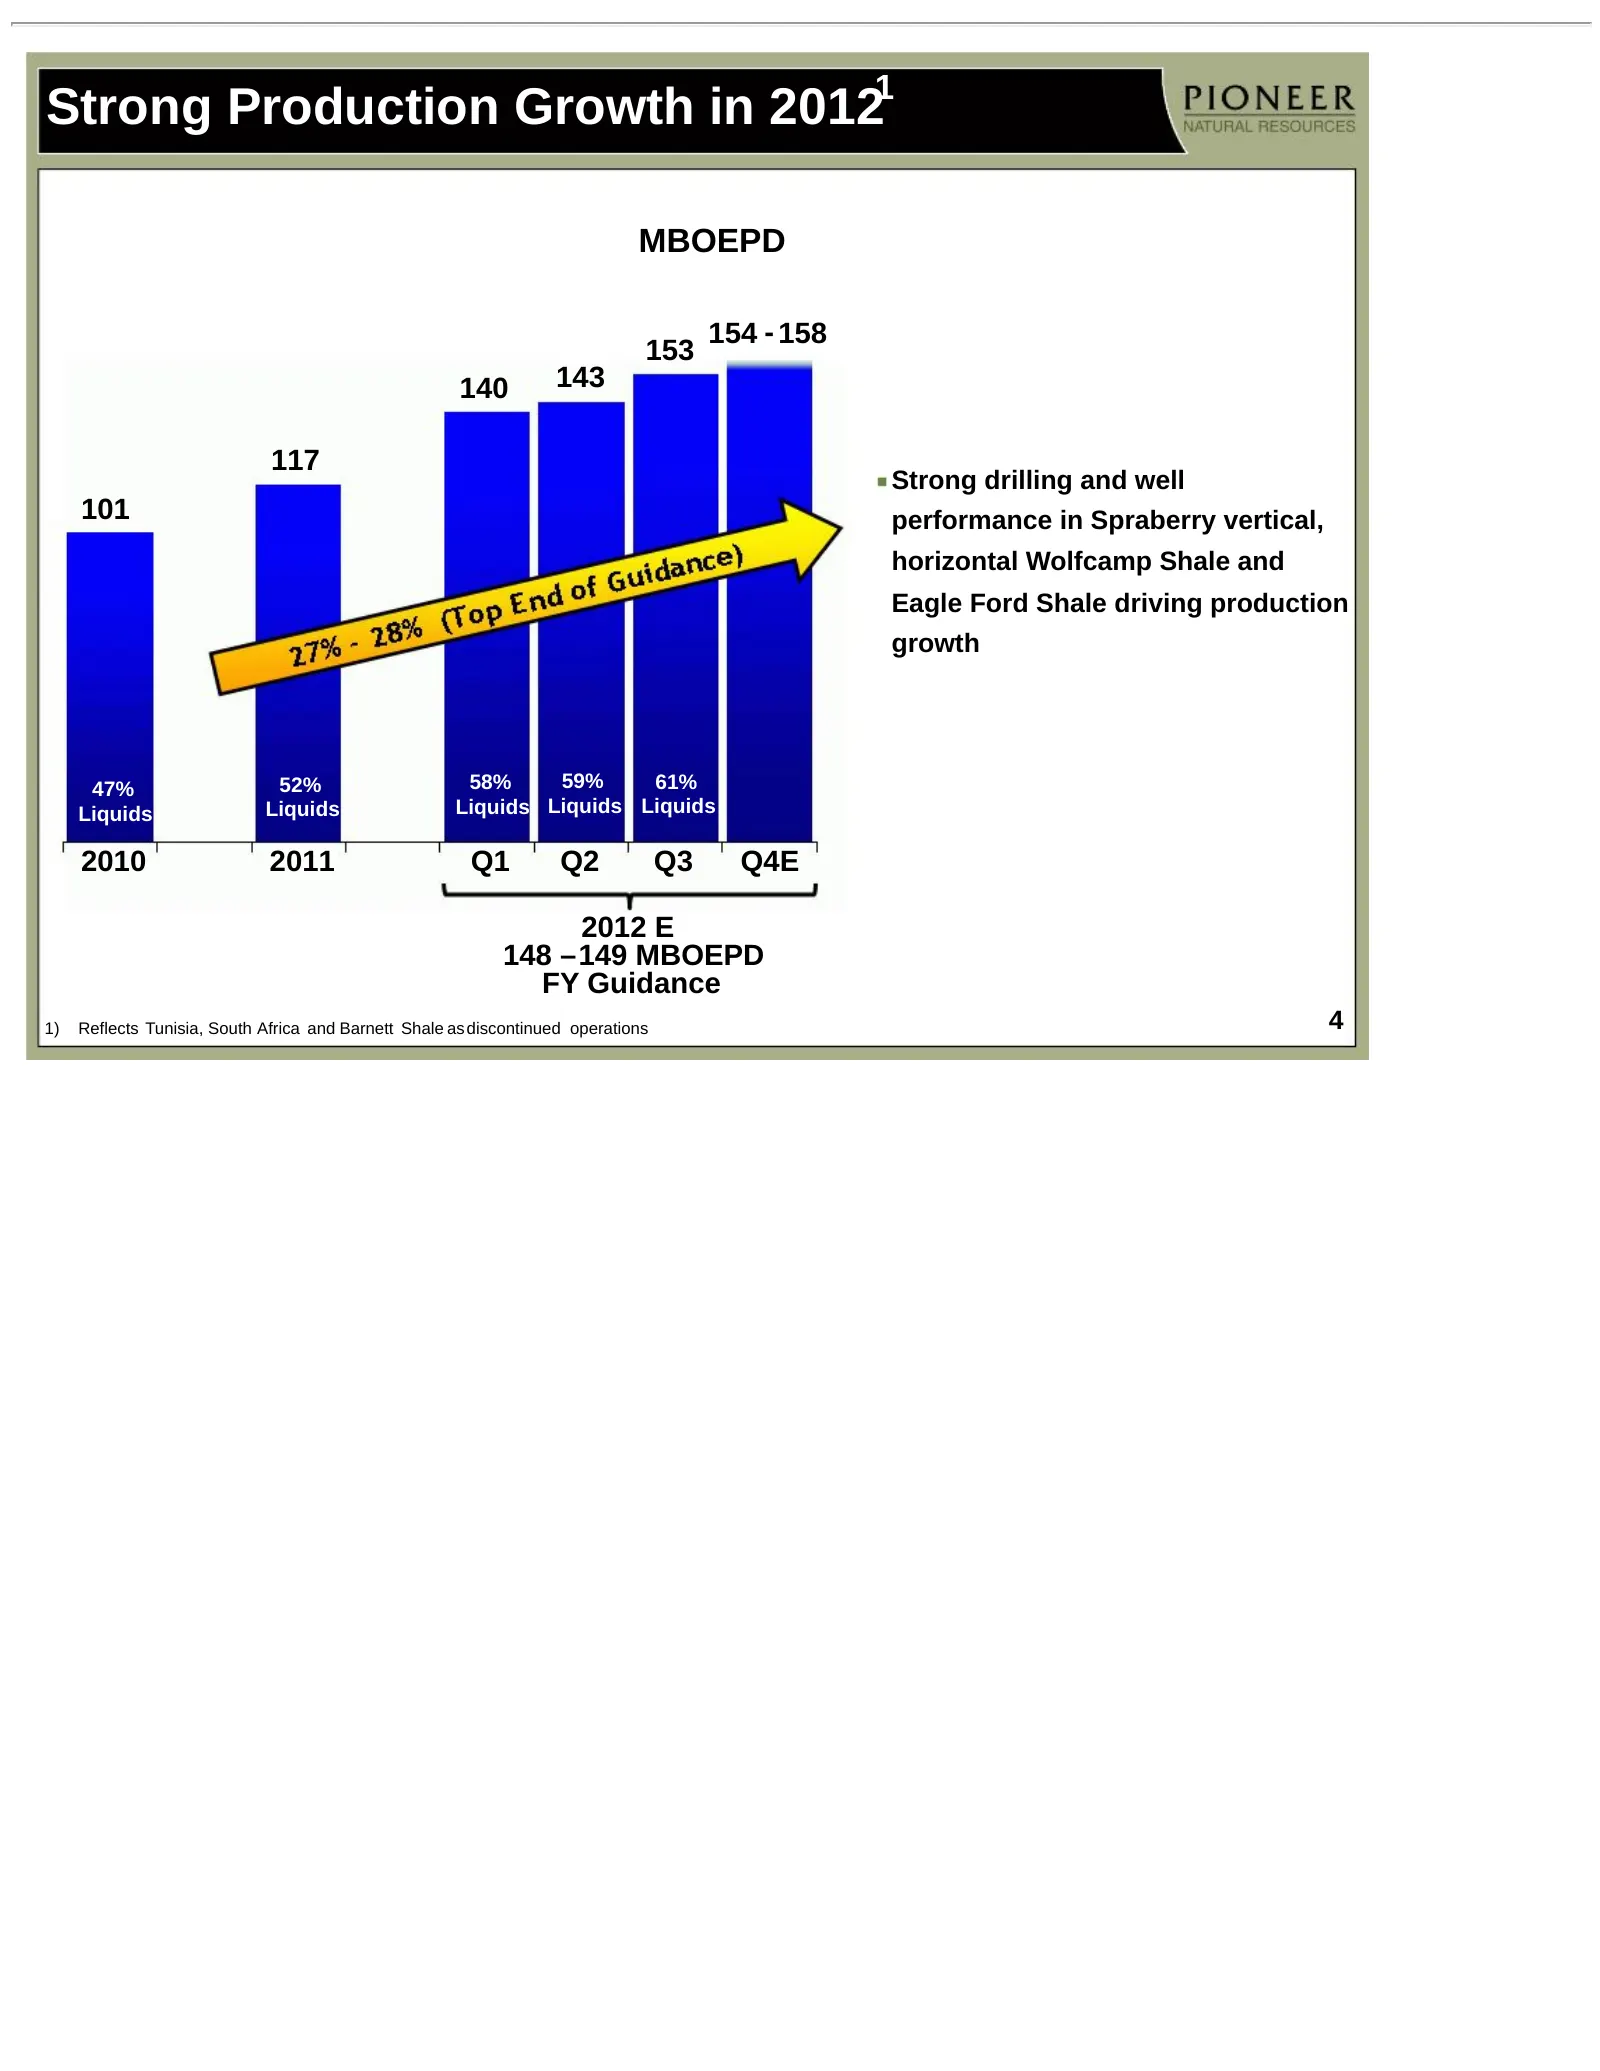
Strong Production Growth in 20121 MBOEPD 154 - 158 153 140 143 117 Strong drilling and well 101 performance in Spraberry vertical, horizontal Wolfcamp Shale and Eagle Ford Shale driving production growth 47% 52% 58% 59% 61% Liquids Liquids Liquids Liquids Liquids 2010 2011 Q1 Q2 Q3 Q4E 2012 E 148 –1
Slide 5: 2012E Capital Spending and Cash Flow
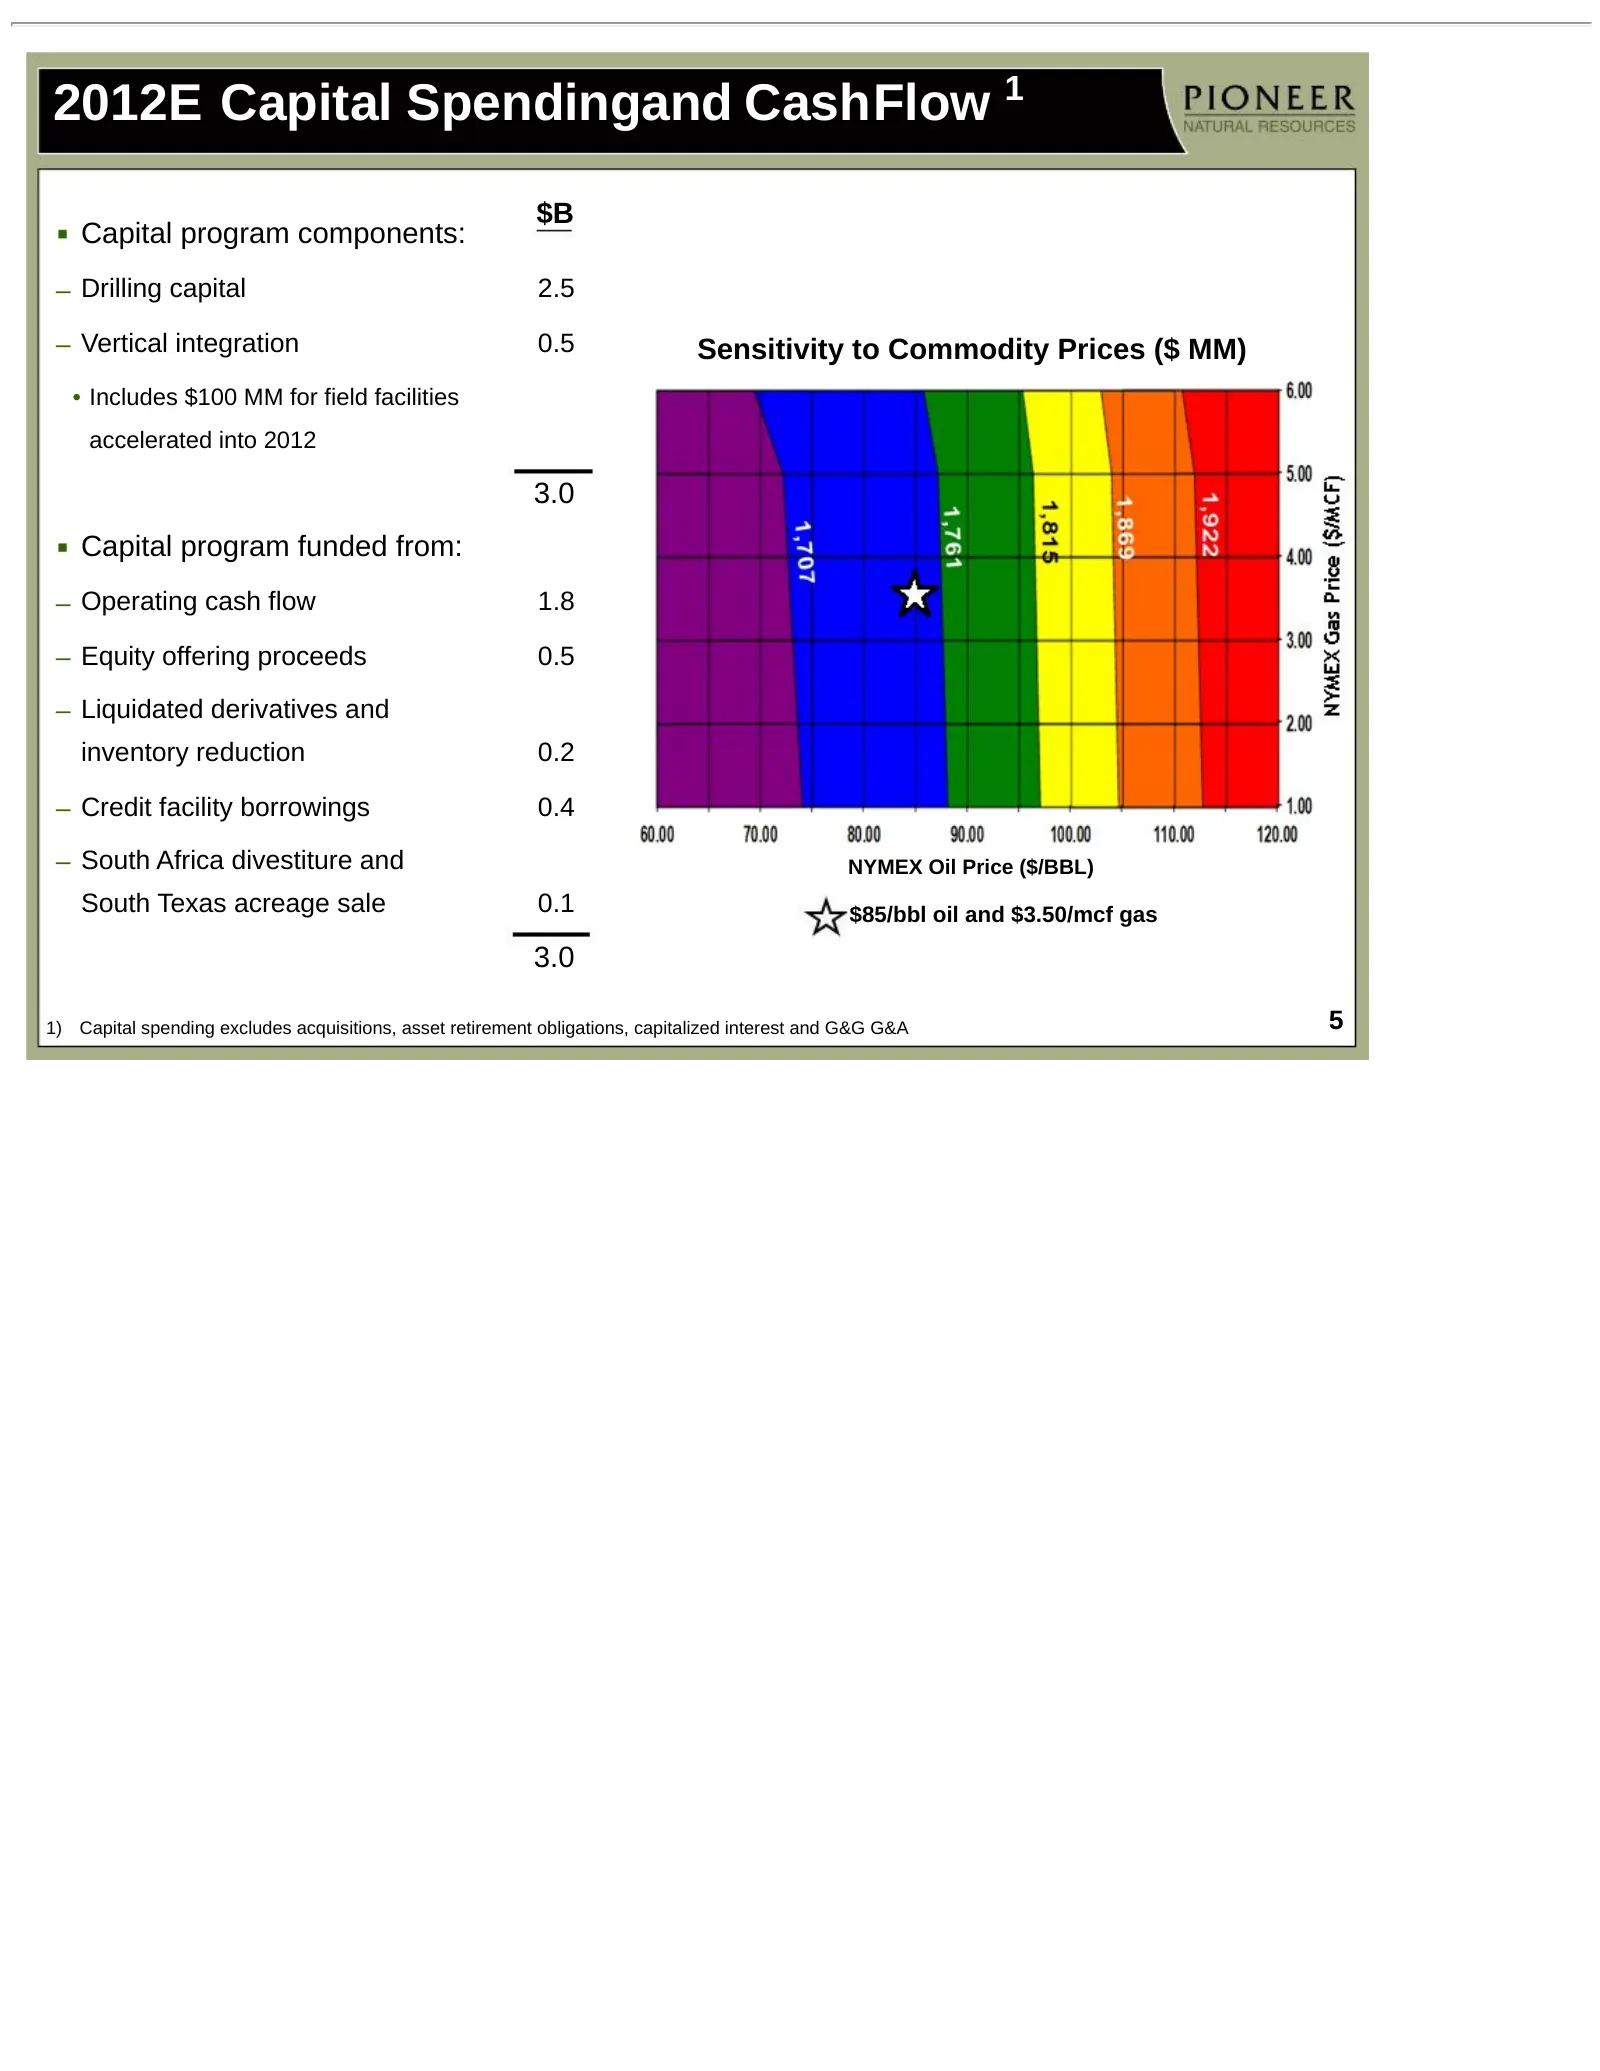
2012E Capital Spendingand CashFlow 1 $B Capital program components: – Drilling capital 2.5 – Vertical integration 0.5 Sensitivity to Commodity Prices ($ MM) • Includes $100 MM for field facilities accelerated into 2012 3.0 Capital program funded from: – Operating cash flow 1.8 – Equity offering proc
Slide 6: Significant Proved Reserves and Resource Potential
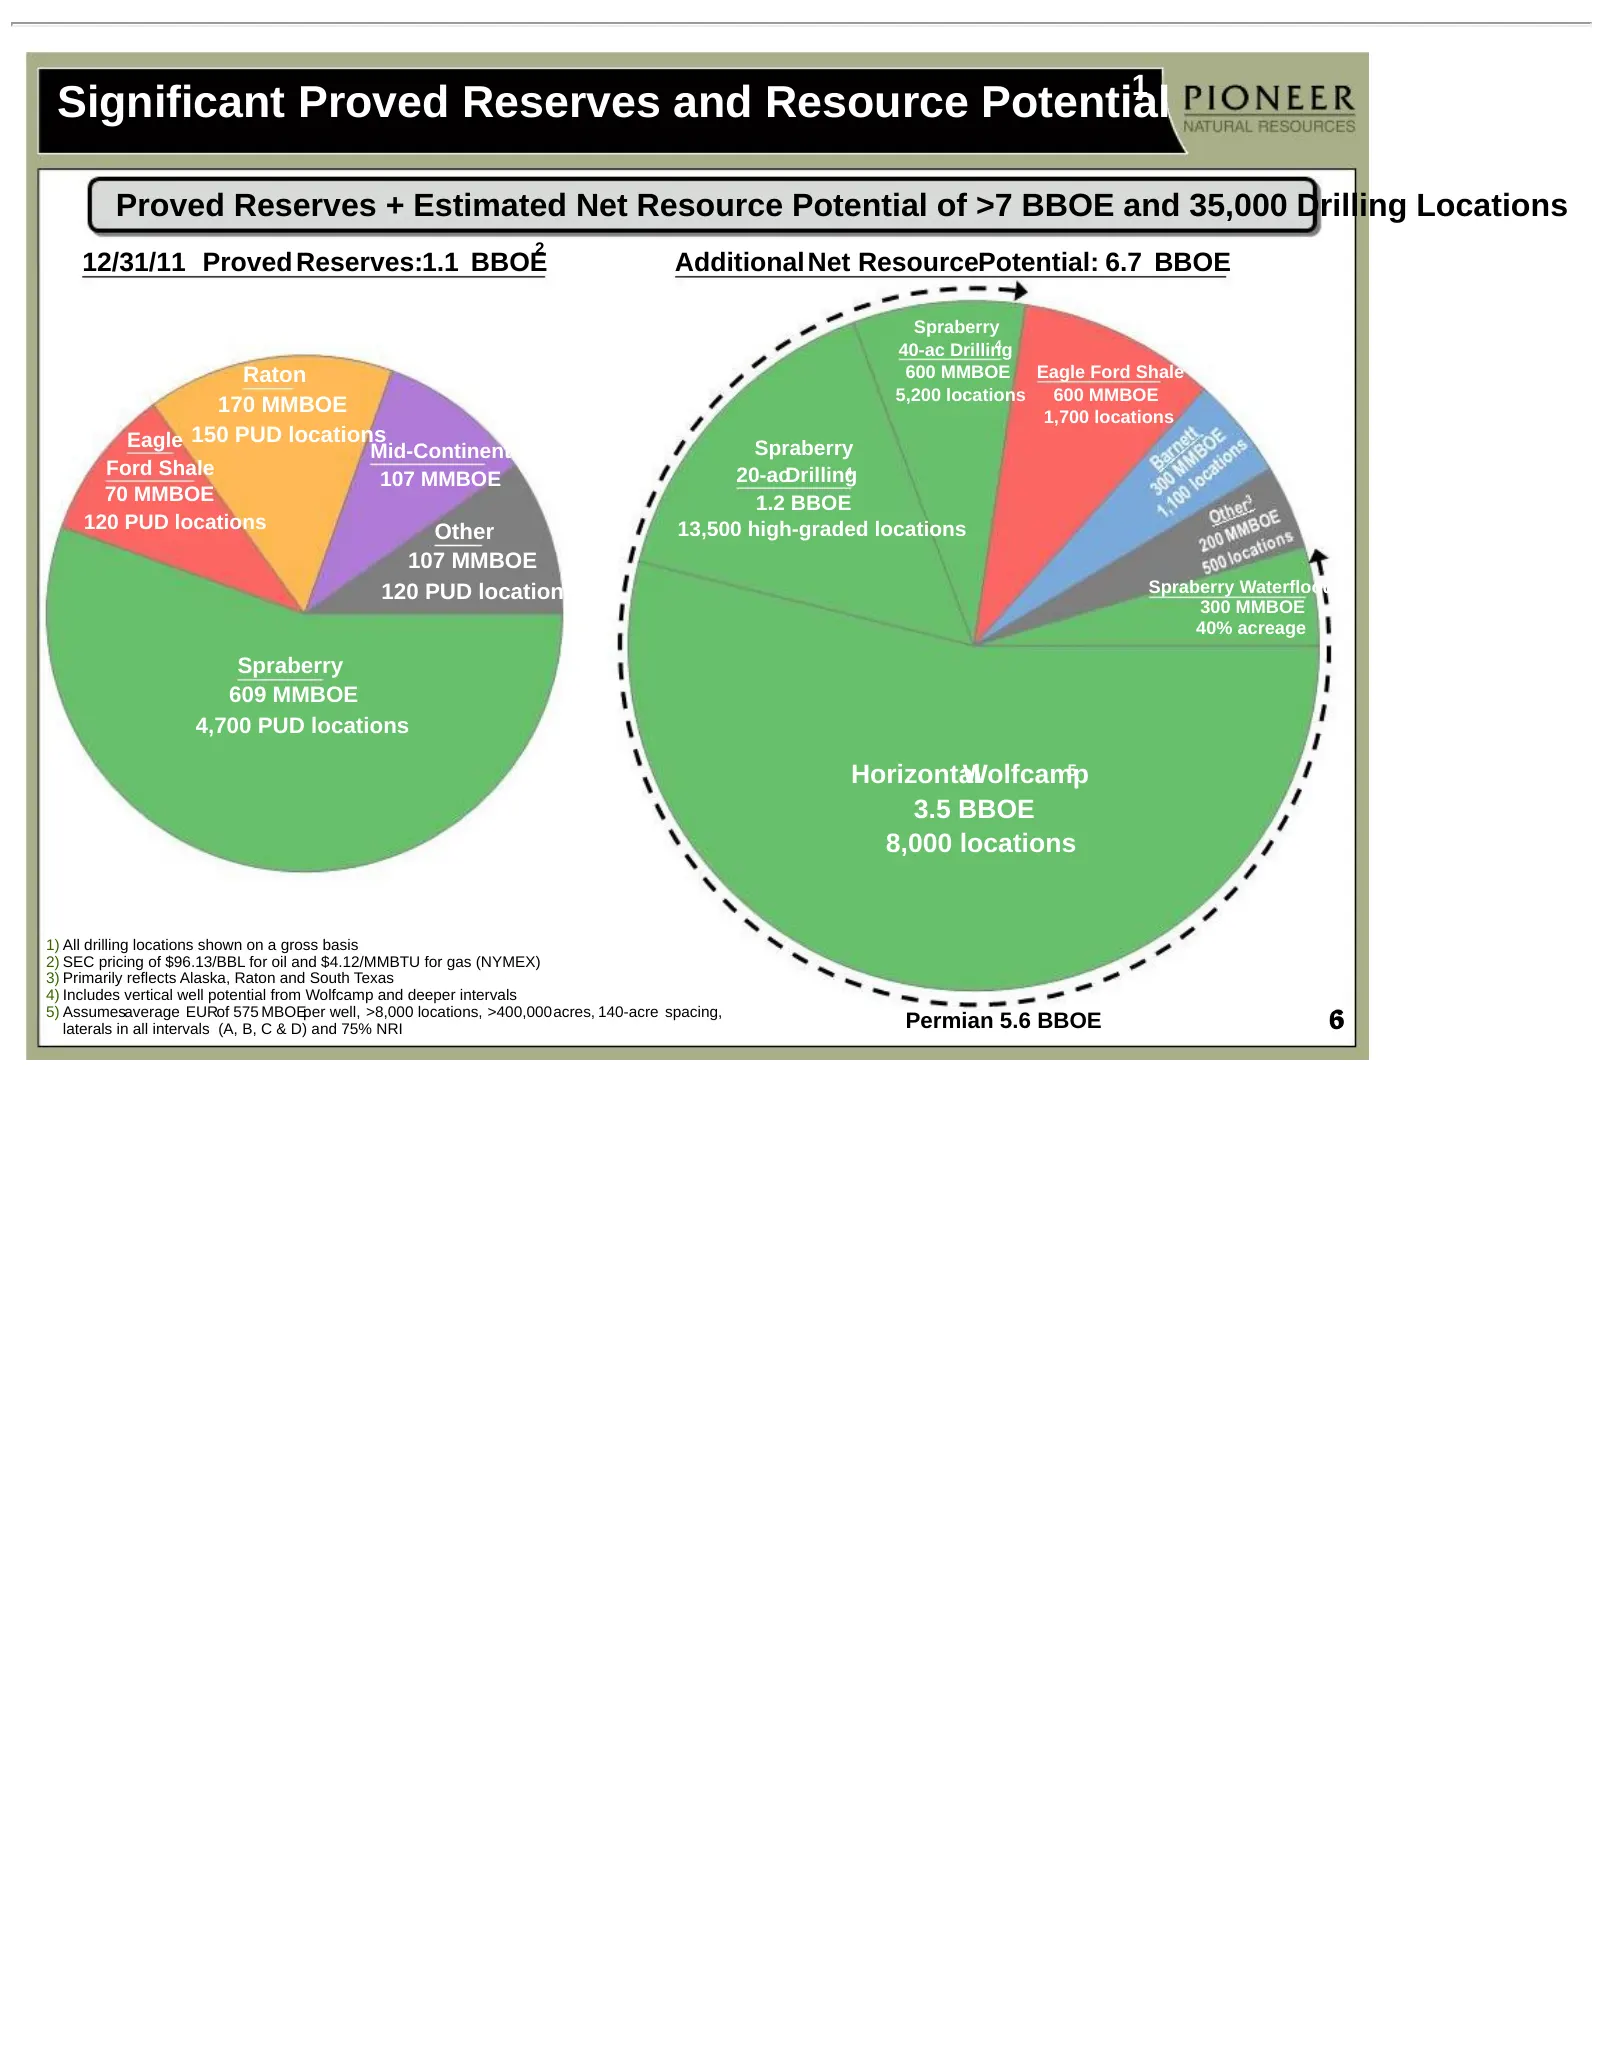
1 Significant Proved Reserves and Resource Potential Proved Reserves + Estimated Net Resource Potential of >7 BBOE and 35,000 Drilling Locations 2 12/31/11 Proved Reserves:1.1 BBOE Additional Net ResourcePotential: 6.7 BBOE Spraberry 4 40-ac Drilling Raton 600 MMBOE Eagle Ford Shale 5,200 locations
Slide 7: Wolfcamp Shale JV Opportunity
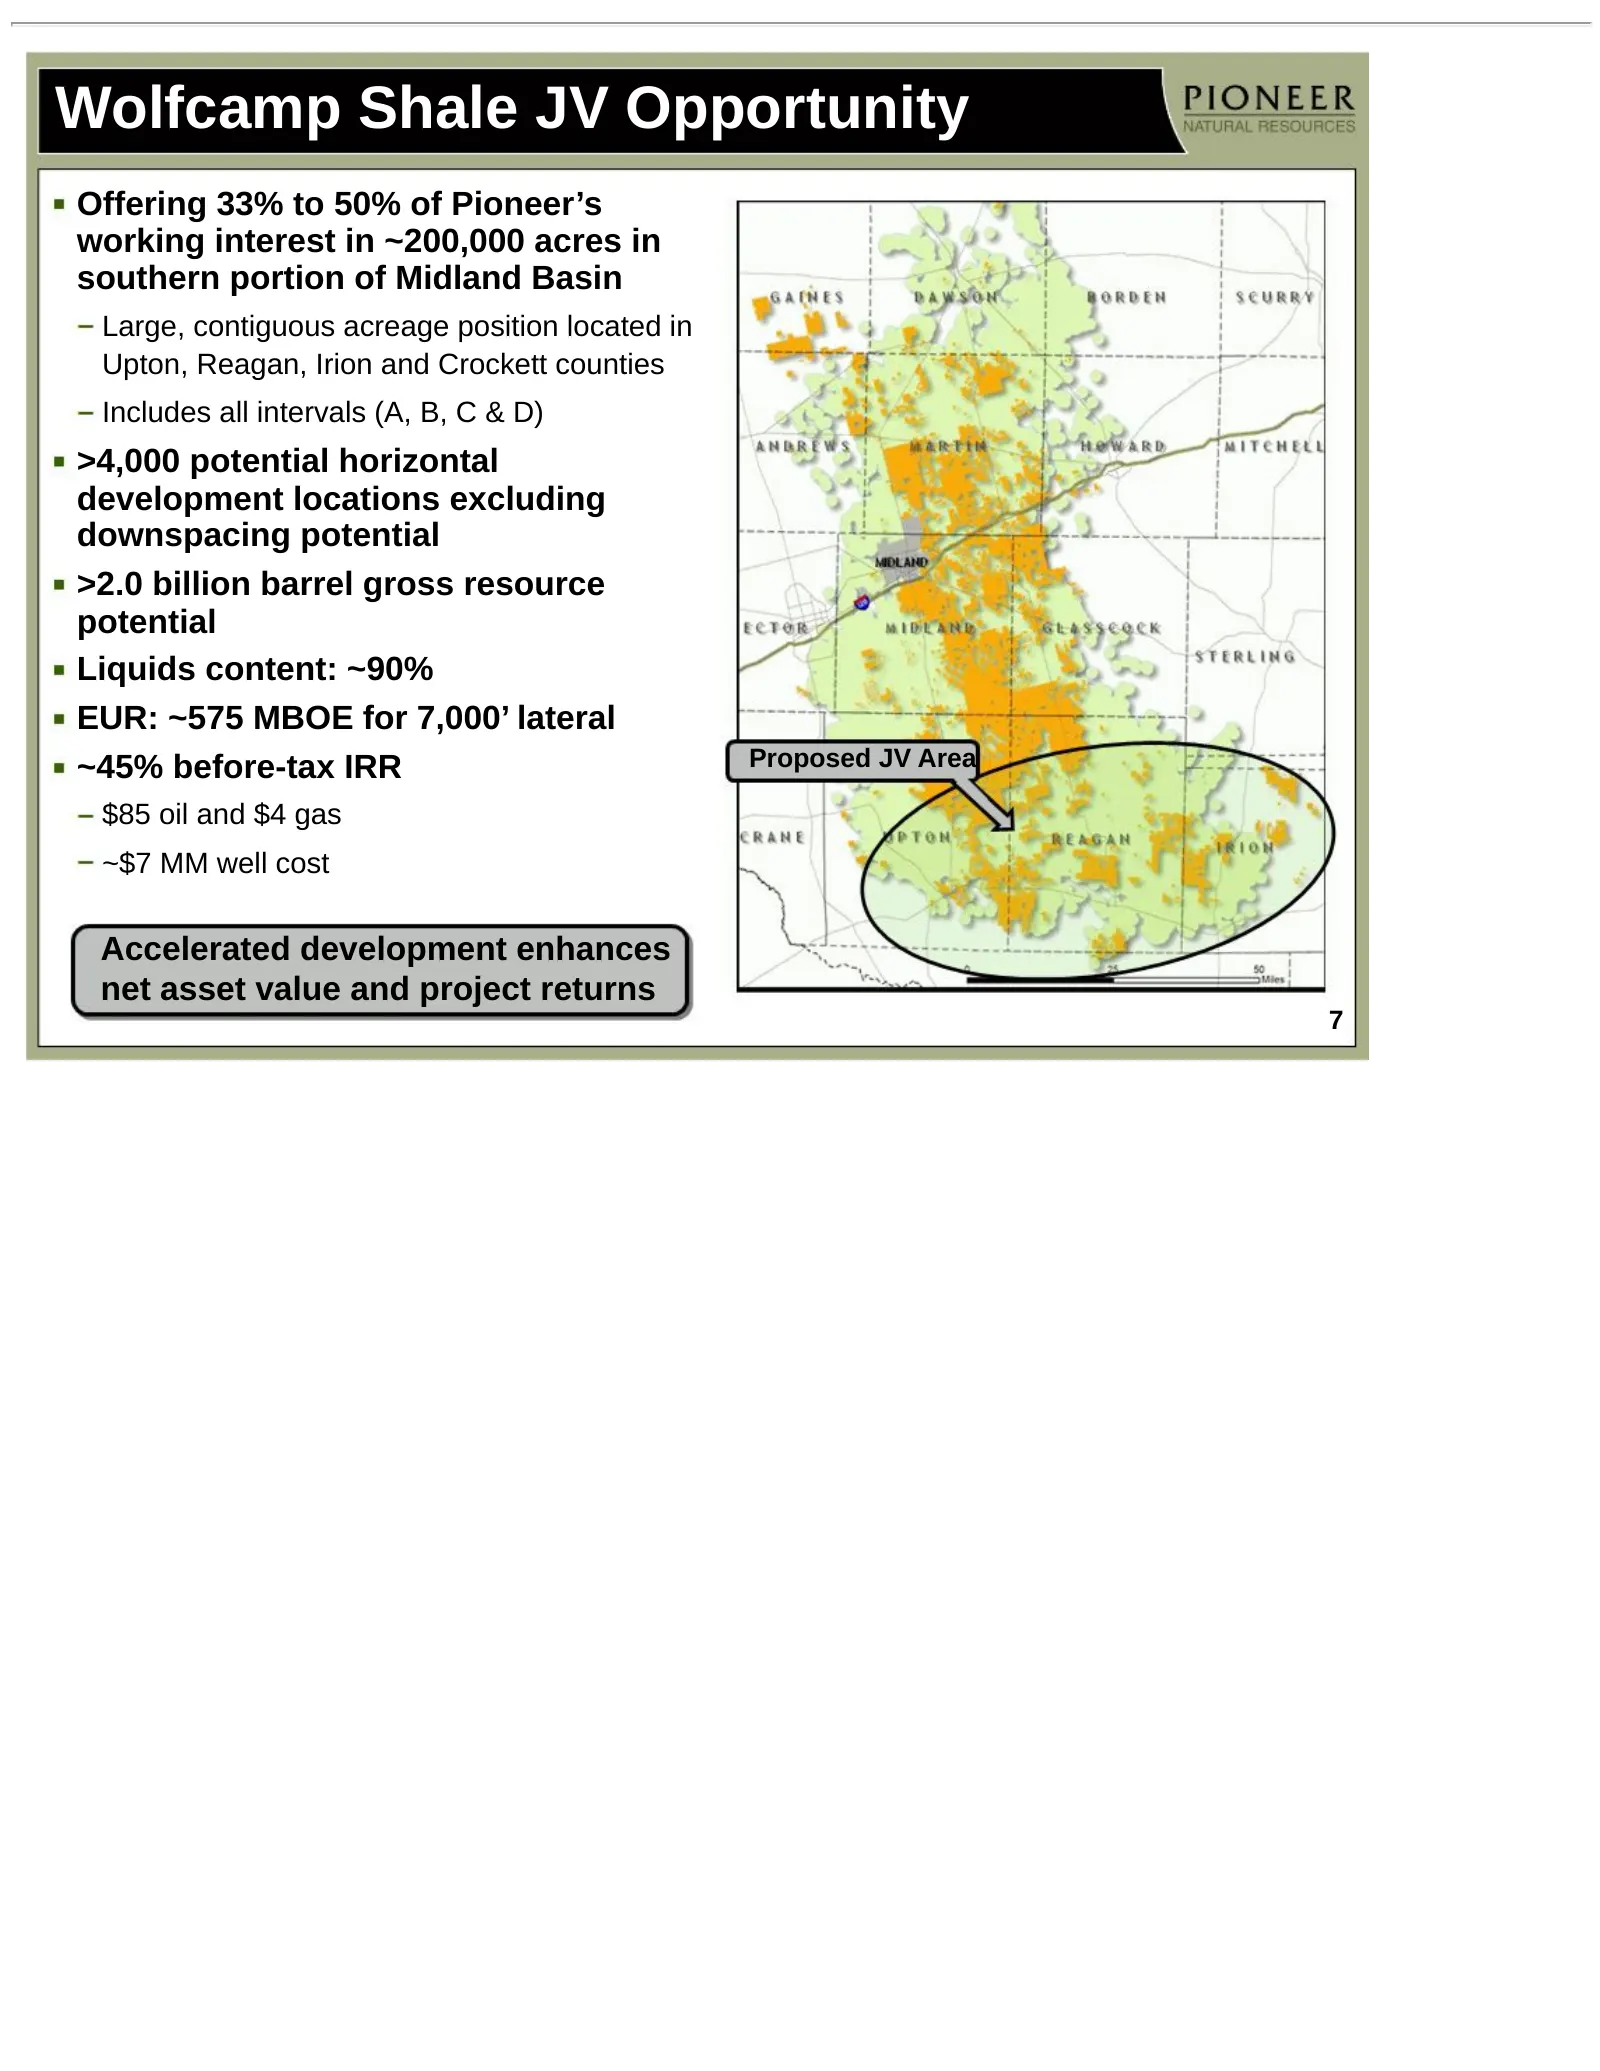
Wolfcamp Shale JV Opportunity Offering 33% to 50% of Pioneer’s working interest in ~200,000 acres in southern portion of Midland Basin Large, contiguous acreage position located in Upton, Reagan, Irion and Crockett counties Includes all intervals (A, B, C & D) >4,000 potential horizontal development
Slide 8: Horizontal Wolfcamp Shale Results Meeting Expectations
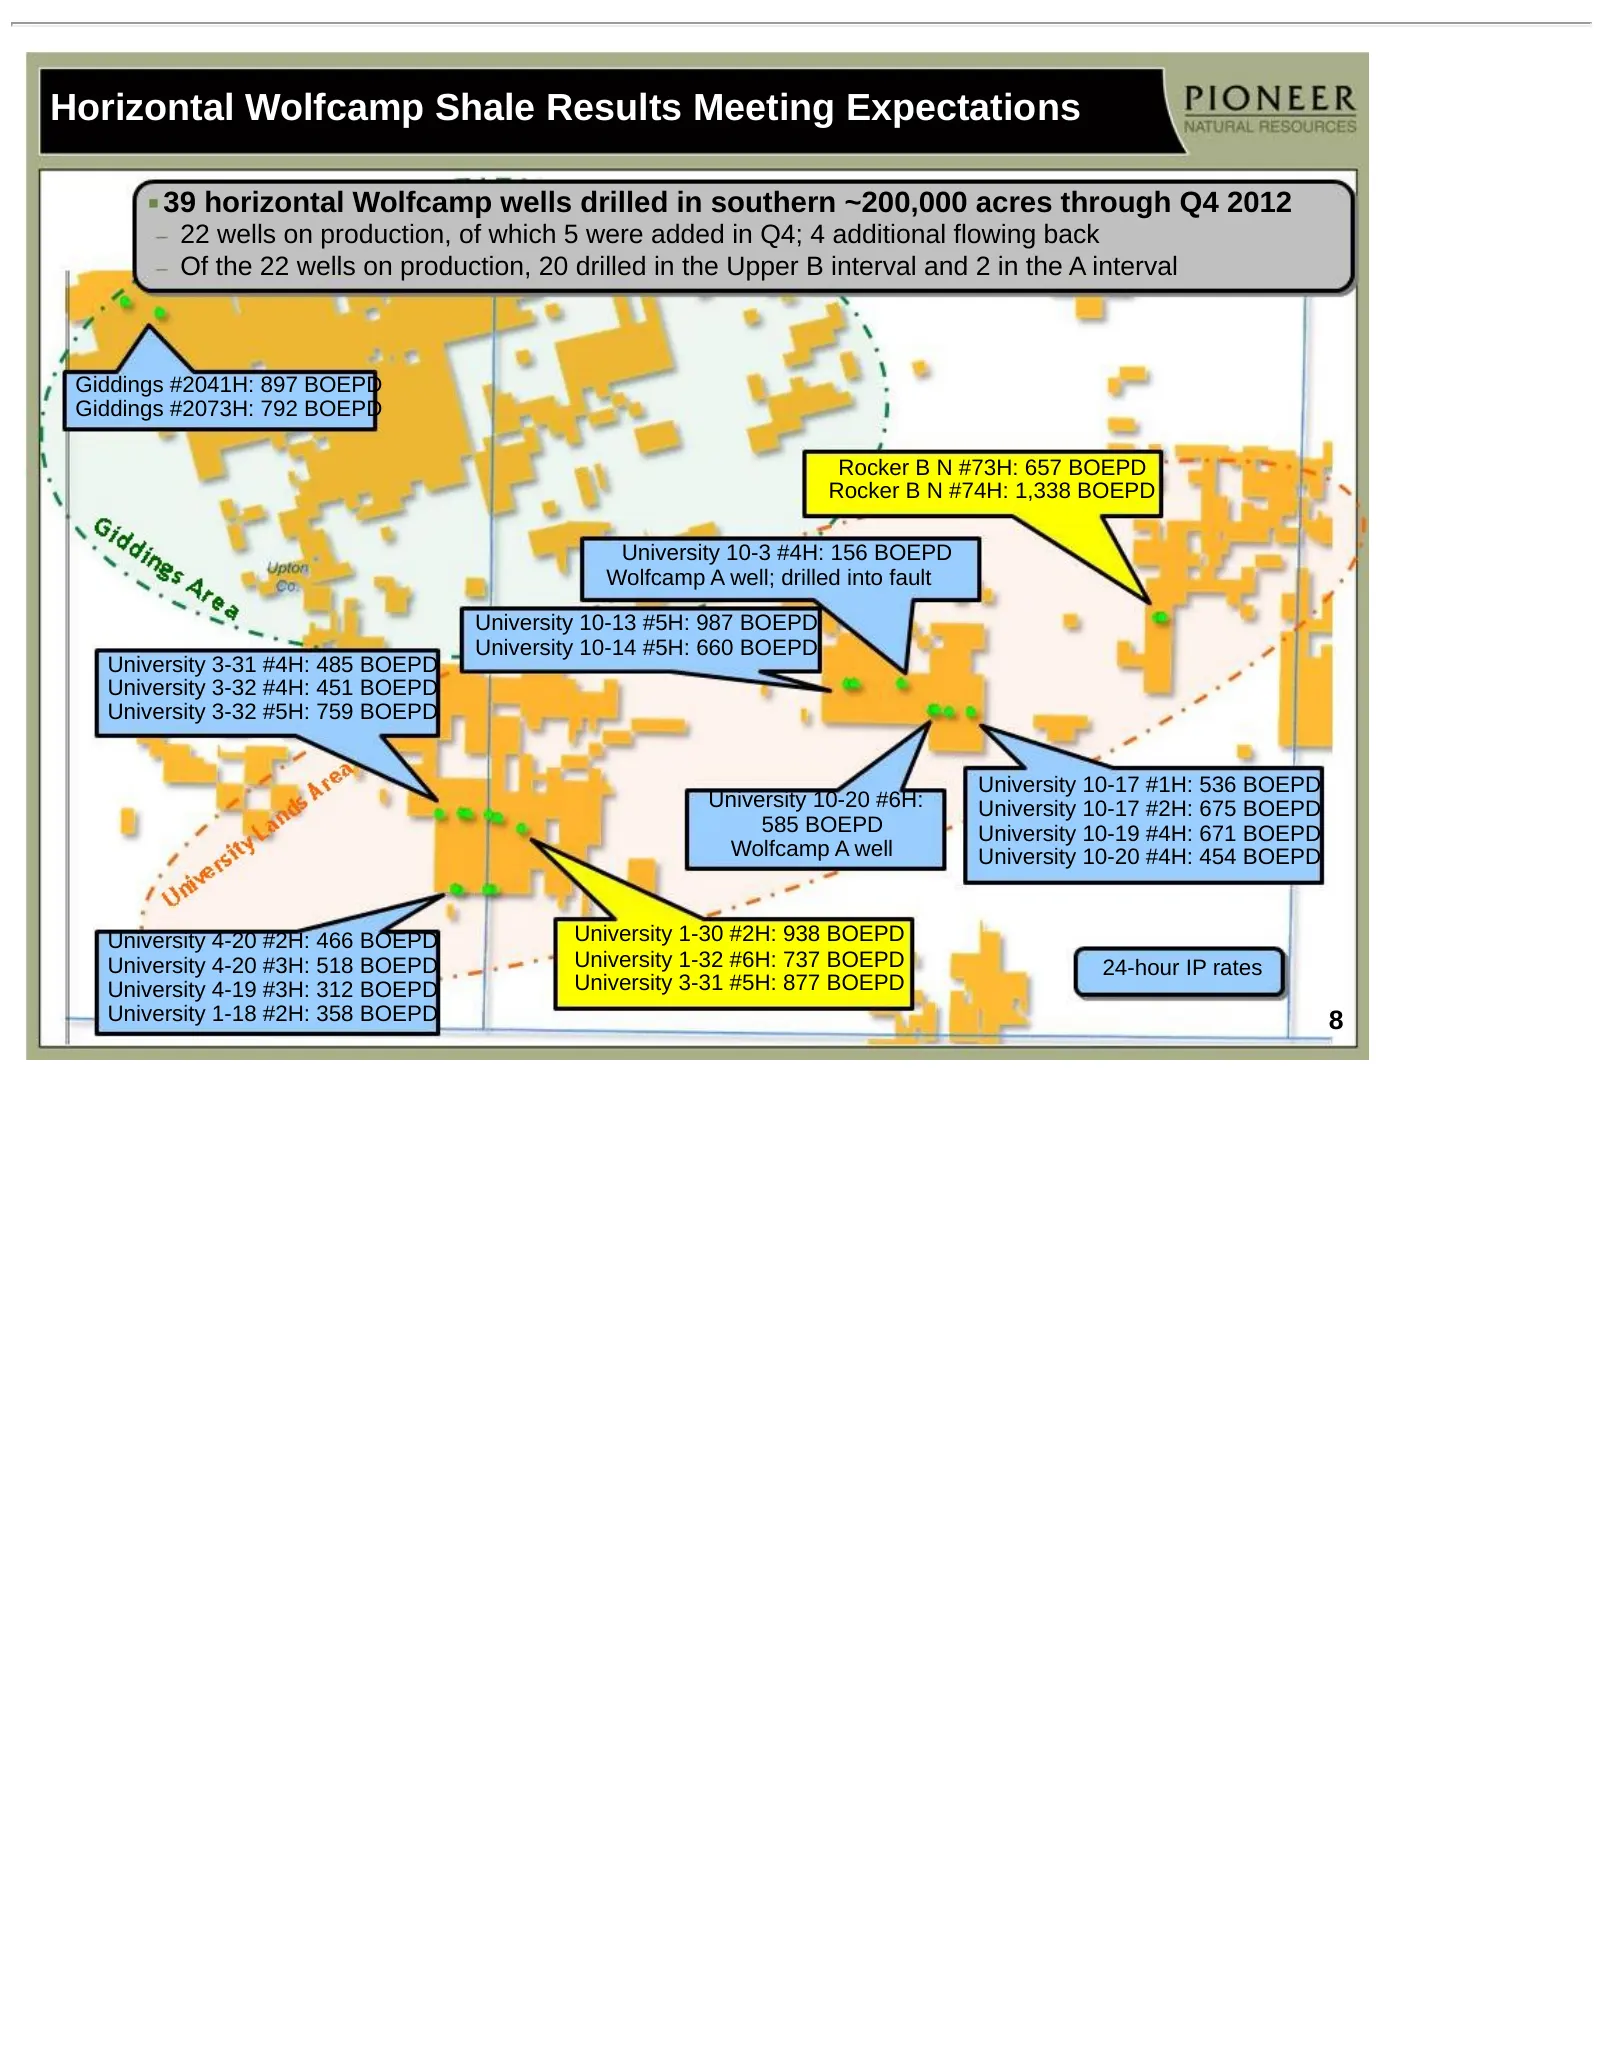
Horizontal Wolfcamp Shale Results Meeting Expectations 39 horizontal Wolfcamp wells drilled in southern ~200,000 acres through Q4 2012 22 wells on production, of which 5 were added in Q4; 4 additional flowing back Of the 22 wells on production, 20 drilled in the Upper B interval and 2 in the A inter
Slide 9: Horizontal Wolfcamp Upper B Well Performance Through Q3
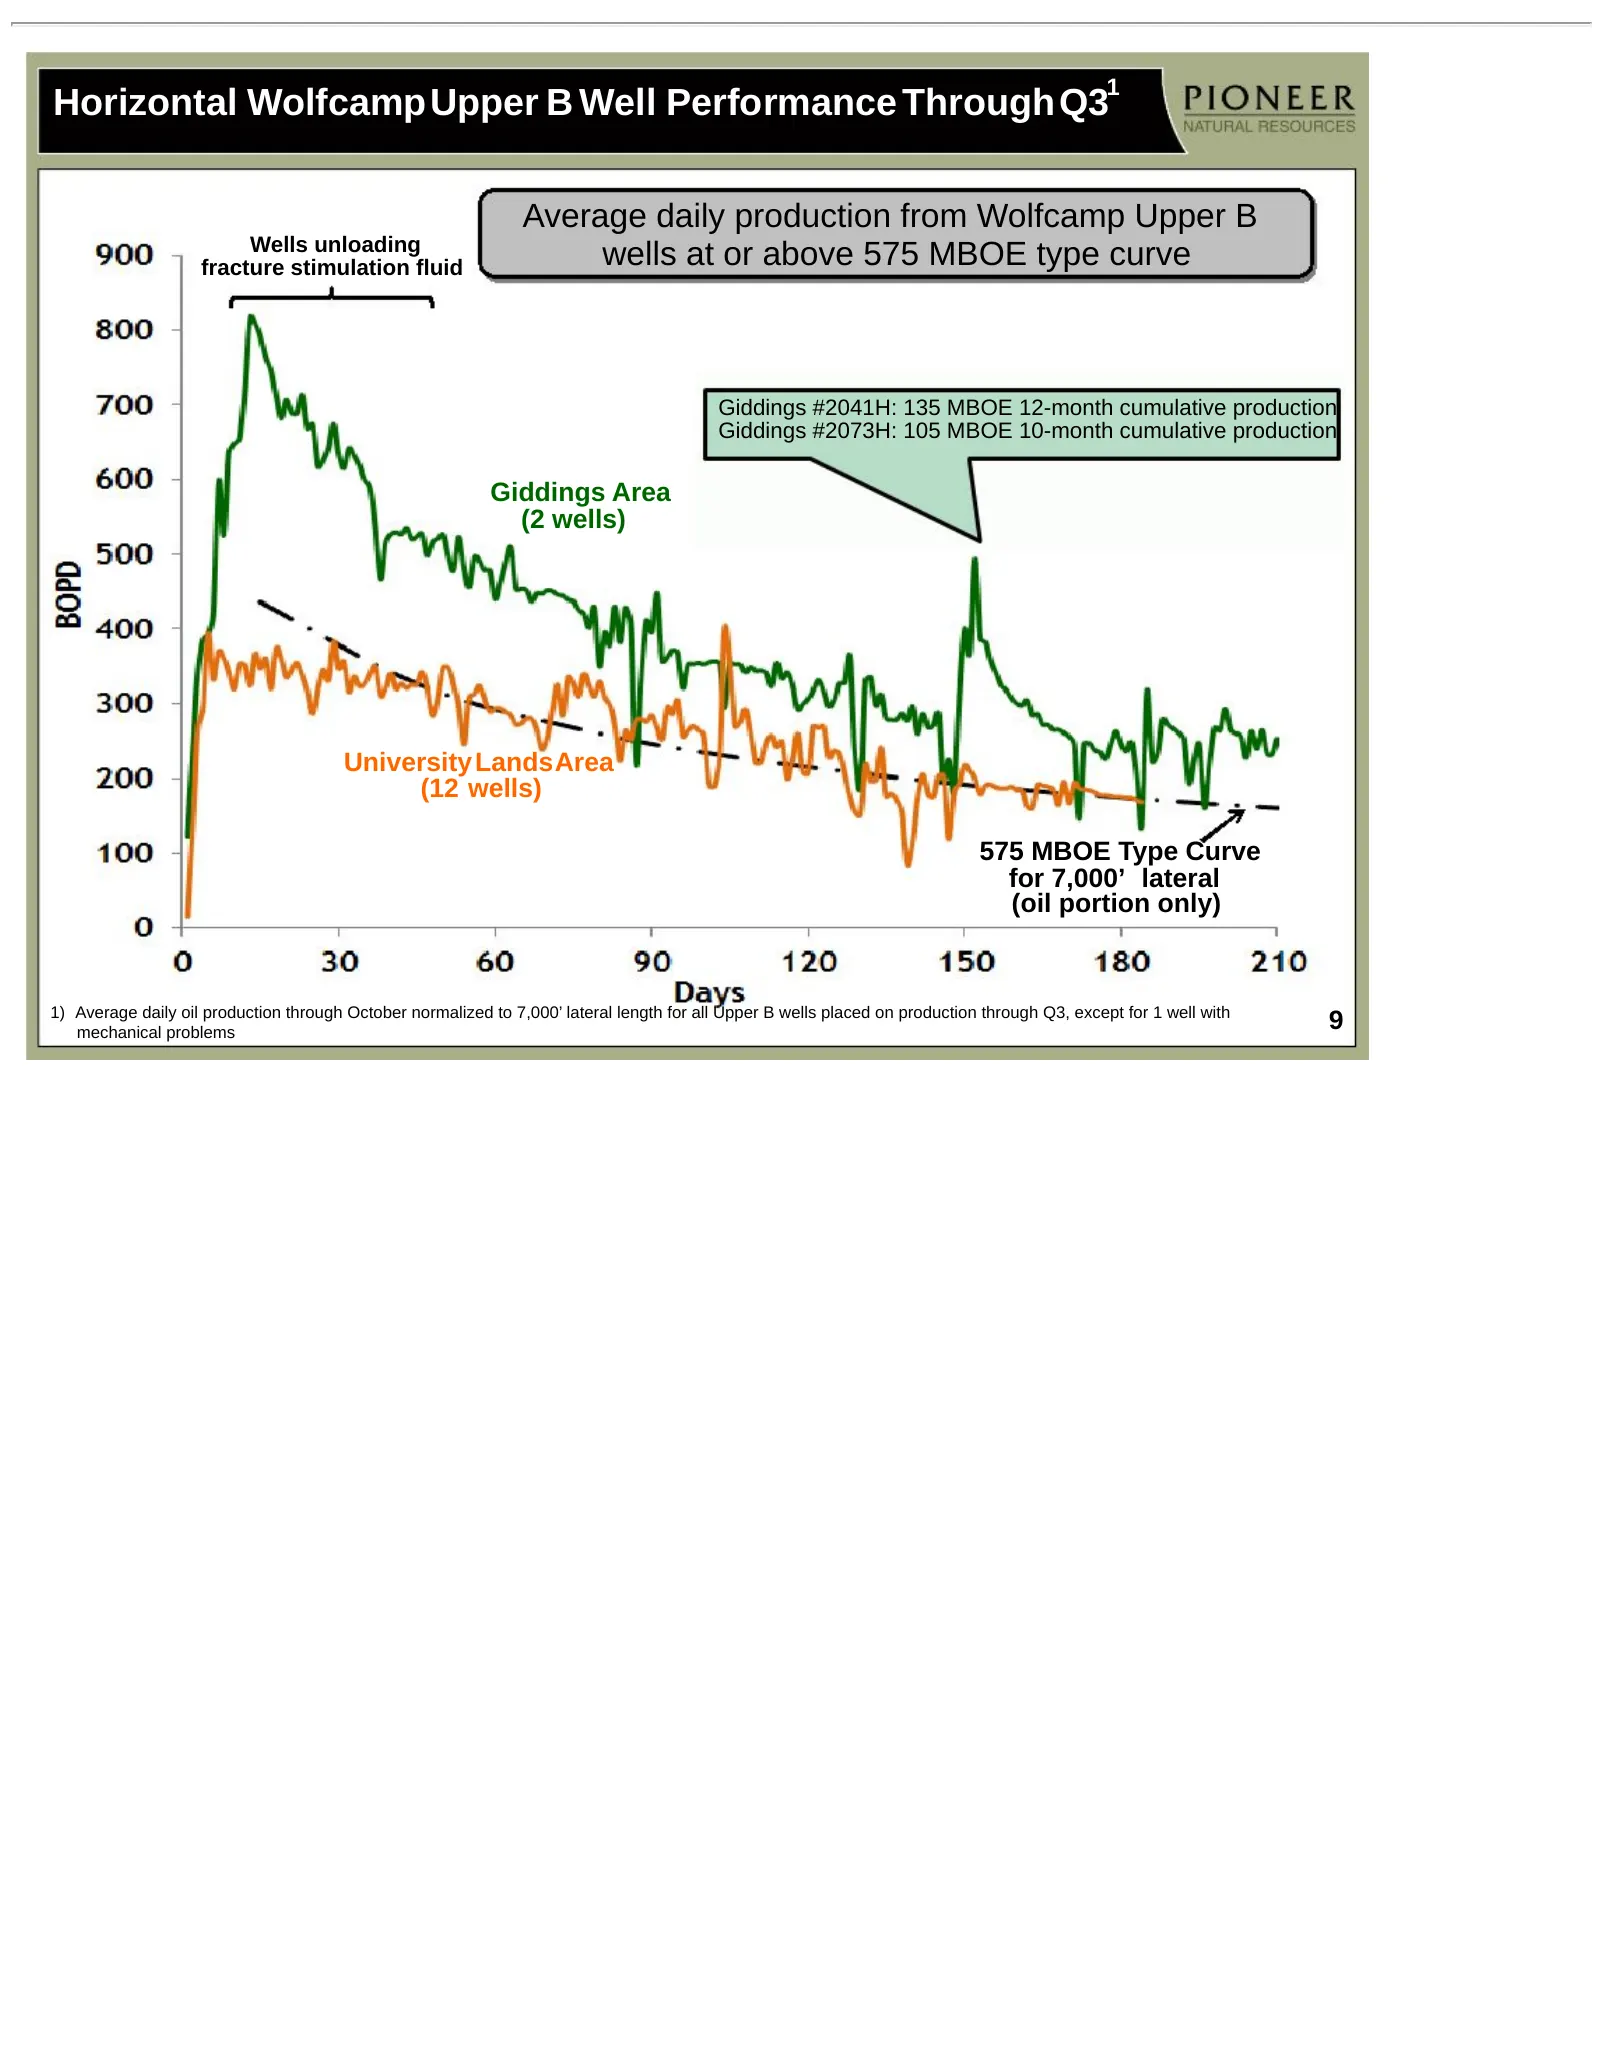
1 Horizontal WolfcampUpper B Well Performance ThroughQ3 Average daily production from Wolfcamp Upper B Wells unloading fracture stimulation fluid wells at or above 575 MBOE type curve Giddings #2041H: 135 MBOE 12-month cumulative production Giddings #2073H: 105 MBOE 10-month cumulative production Gi
Slide 10: PXD Has Multiple Horizontal Target Intervals
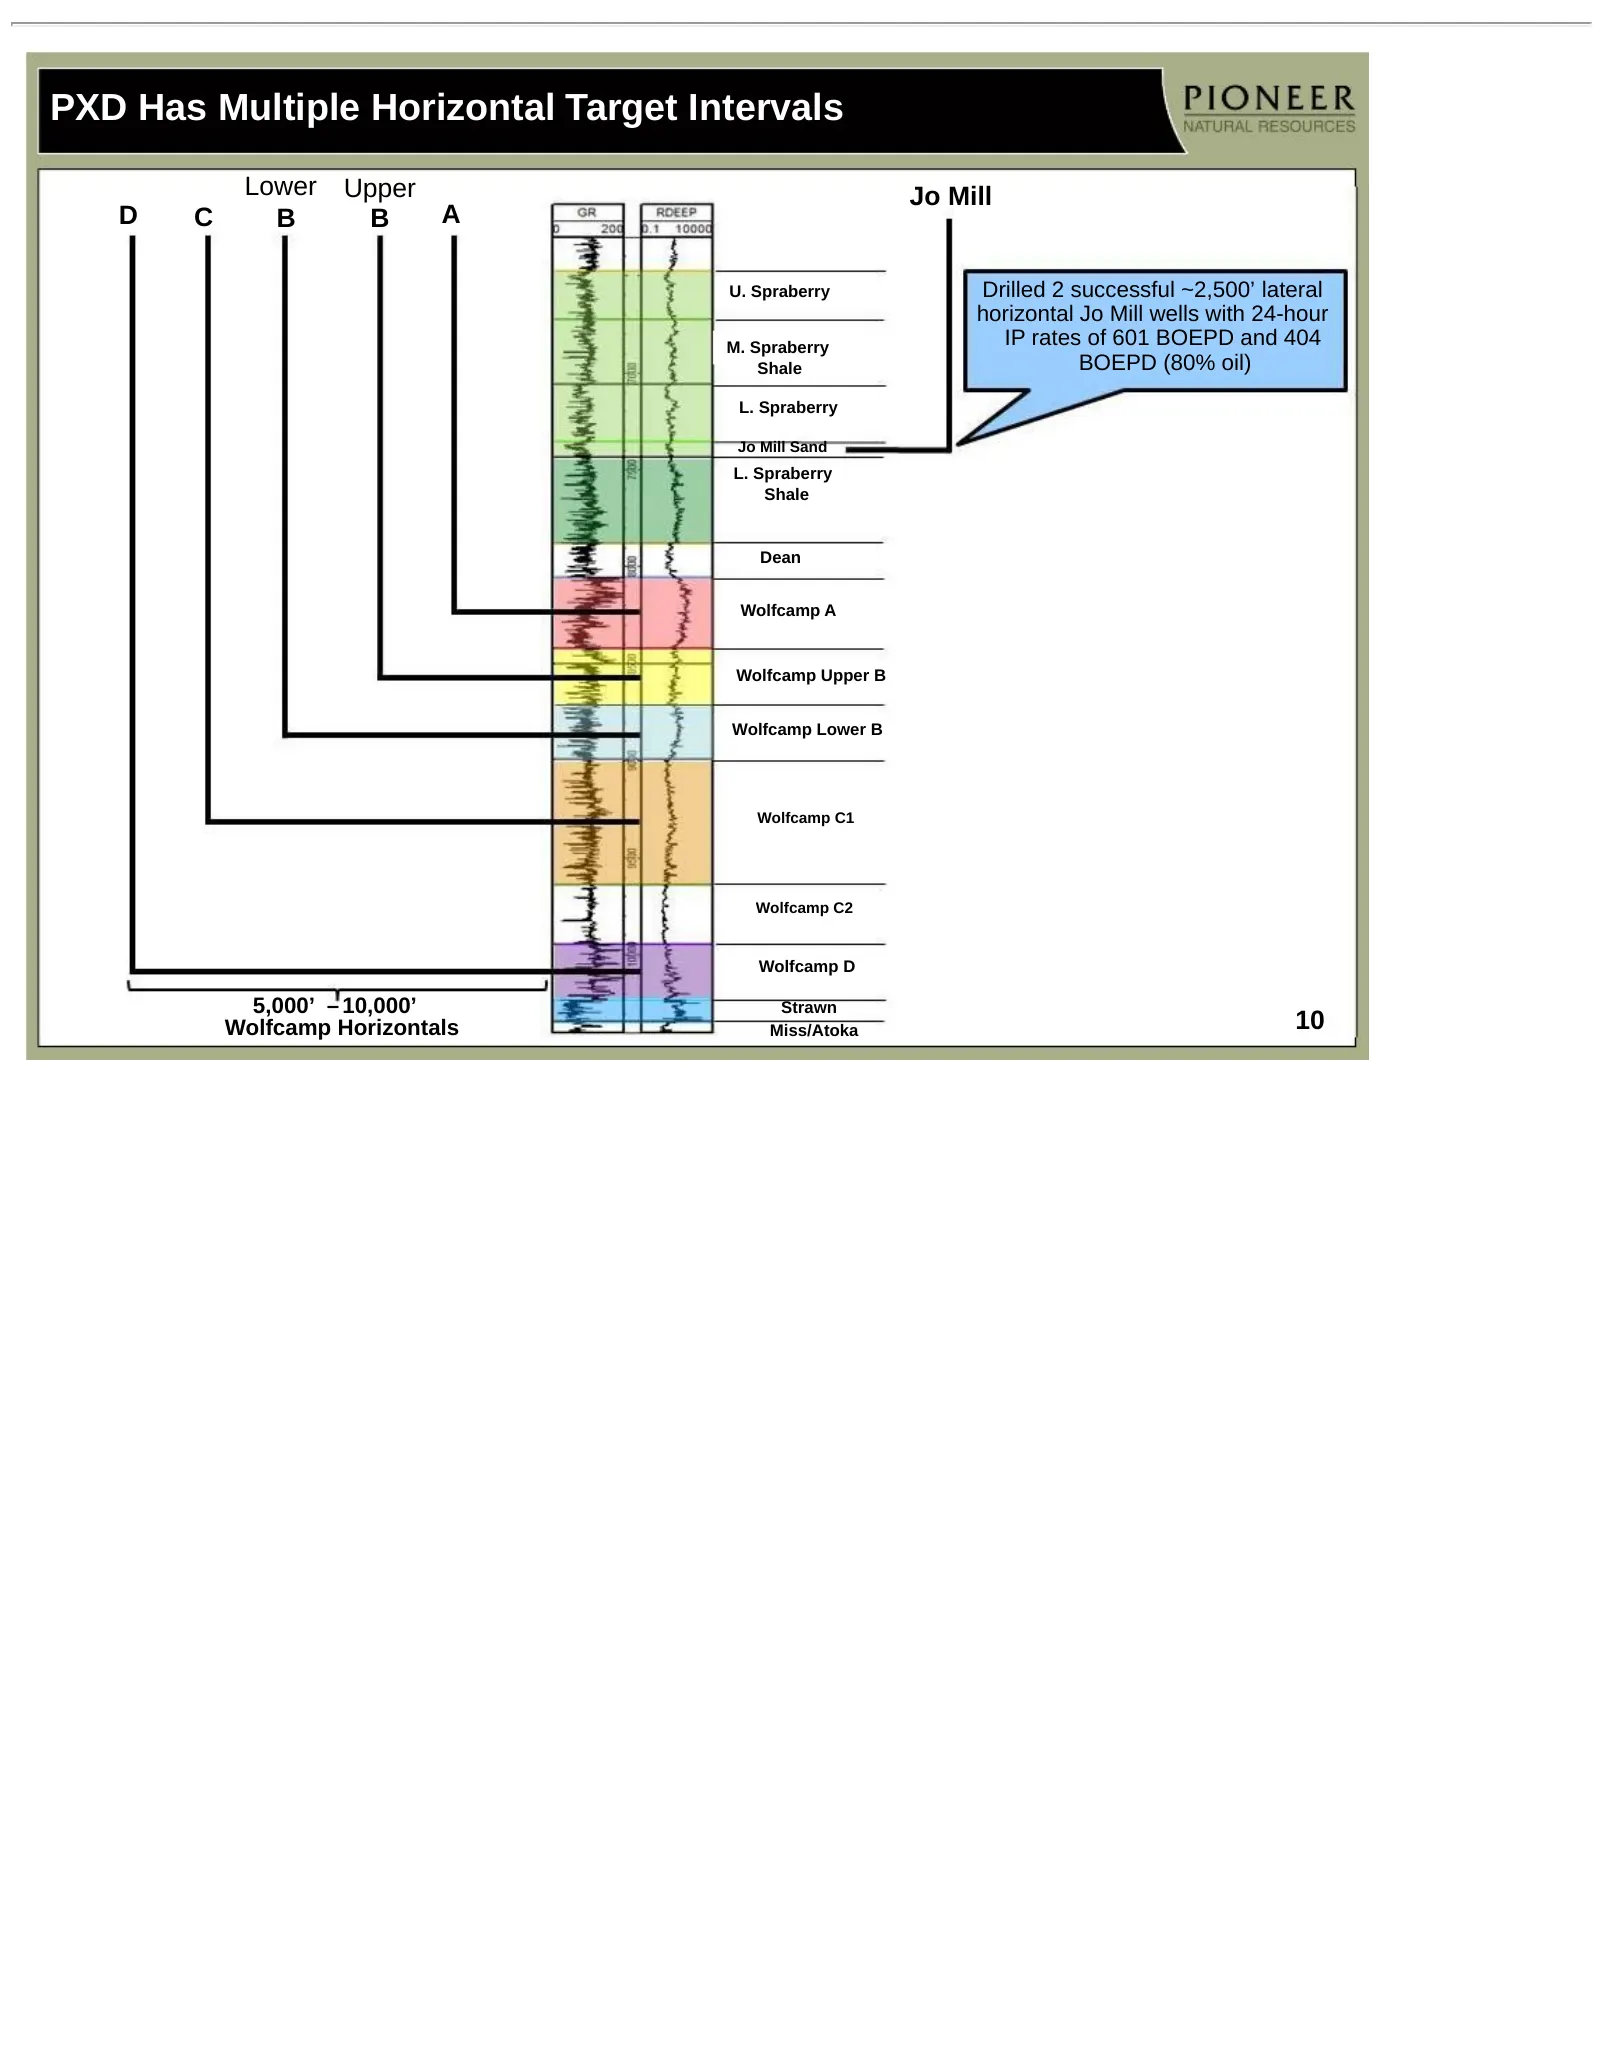
PXD Has Multiple Horizontal Target Intervals Lower Upper Jo Mill D C B B A U. Spraberry Drilled 2 successful ~2,500’ lateral horizontal Jo Mill wells with 24-hour M. Spraberry IP rates of 601 BOEPD and 404 Shale BOEPD (80% oil) L. Spraberry Jo Mill Sand L. Spraberry Shale Dean Wolfcamp A Wolfcamp Up
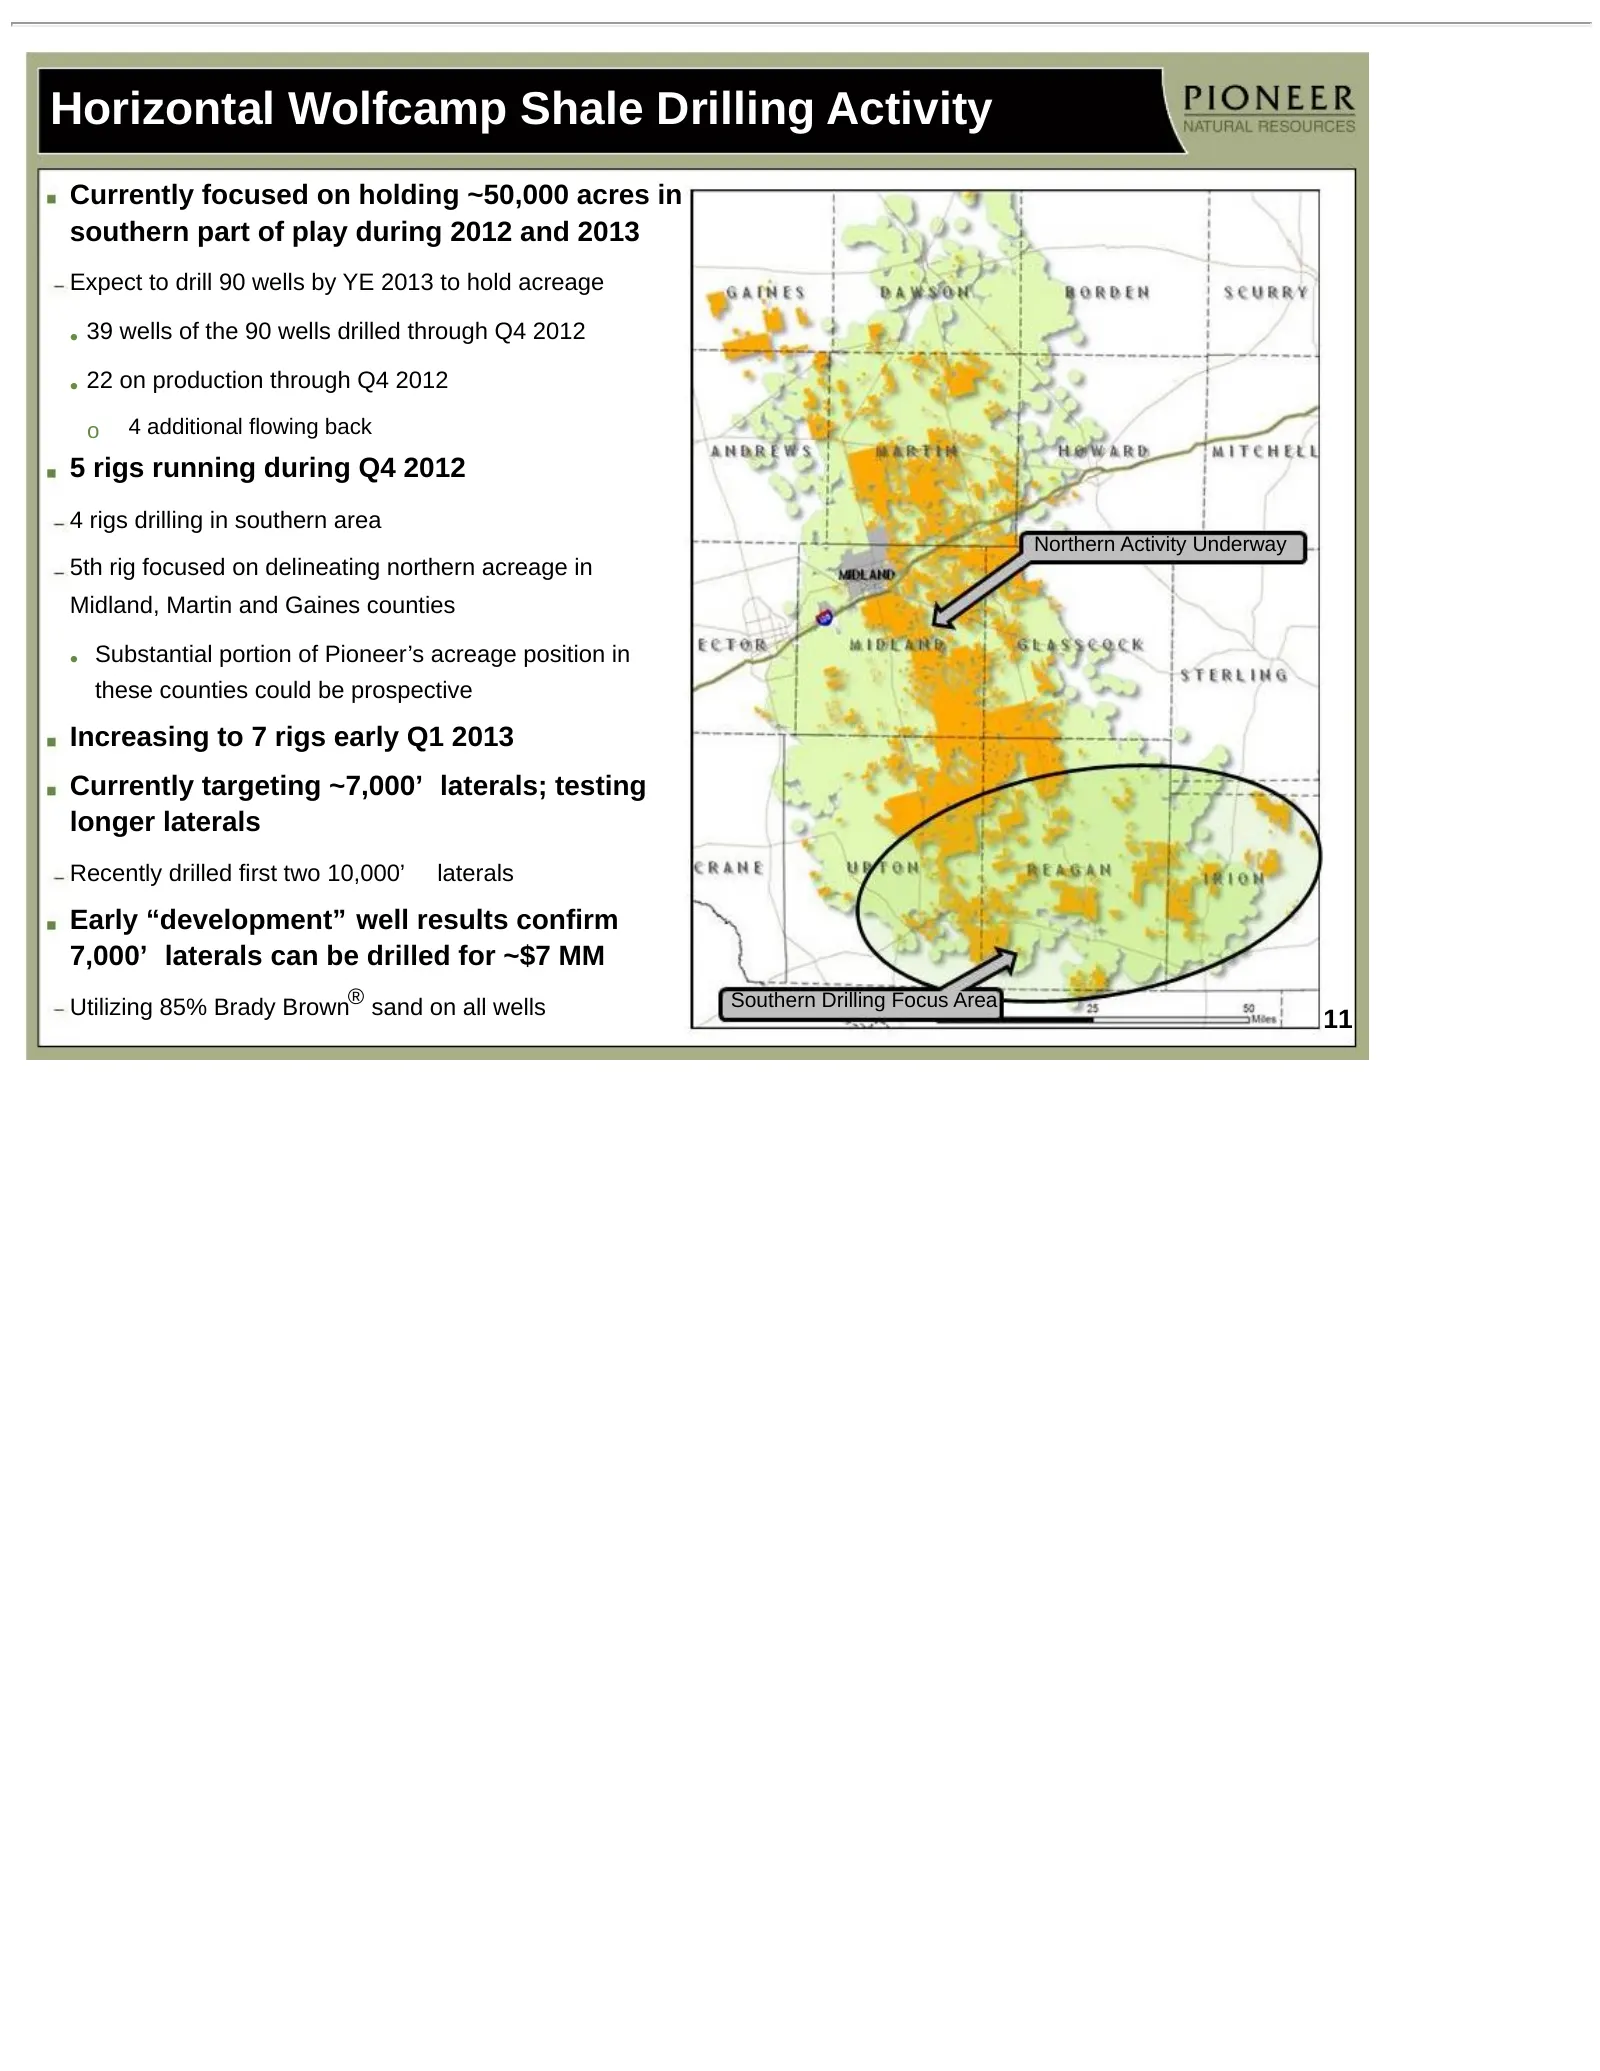
Slide 11: Horizontal Wolfcamp Shale Drilling Activity
Horizontal Wolfcamp Shale Drilling Activity Currently focused on holding ~50,000 acres in southern part of play during 2012 and 2013 Expect to drill 90 wells by YE 2013 to hold acreage • 39 wells of the 90 wells drilled through Q4 2012 • 22 on production through Q4 2012 o 4 additional flowing back 5
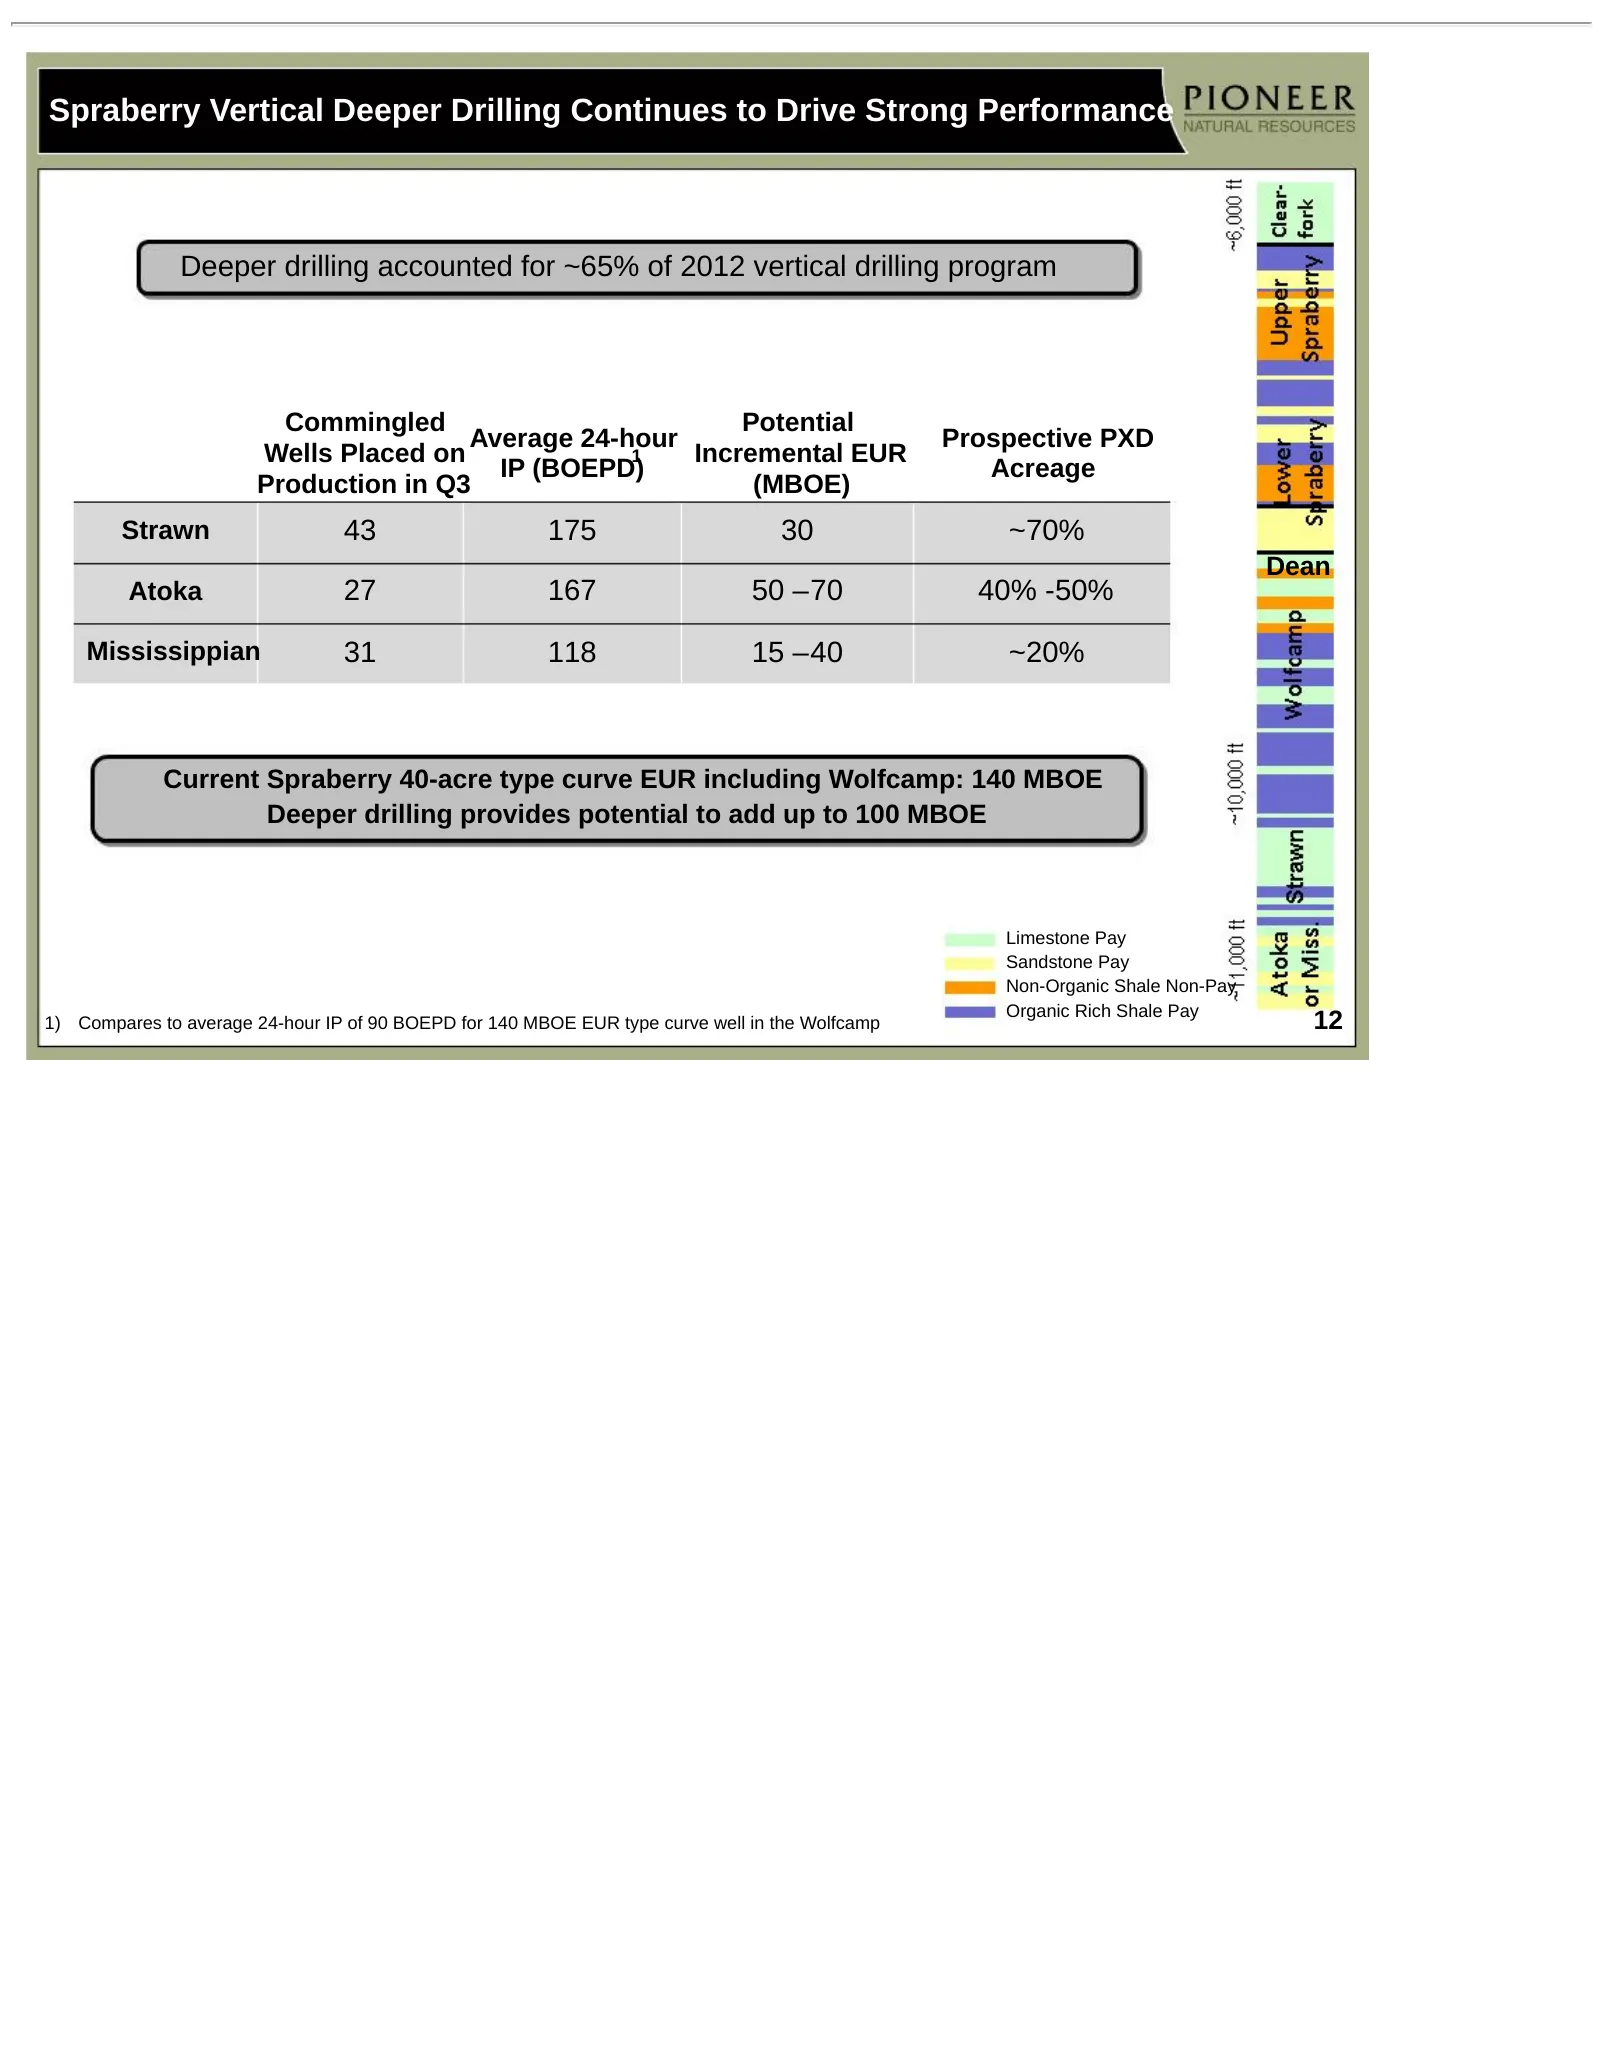
Slide 12: Spraberry Vertical Deeper Drilling Continues to Drive Strong Performance
Spraberry Vertical Deeper Drilling Continues to Drive Strong Performance Deeper drilling accounted for ~65% of 2012 vertical drilling program Commingled Potential Average 24-hour Prospective PXD Wells Placed on 1 Incremental EUR IP (BOEPD) Acreage Production in Q3 (MBOE) Strawn 43 175 30 ~70% Dean A
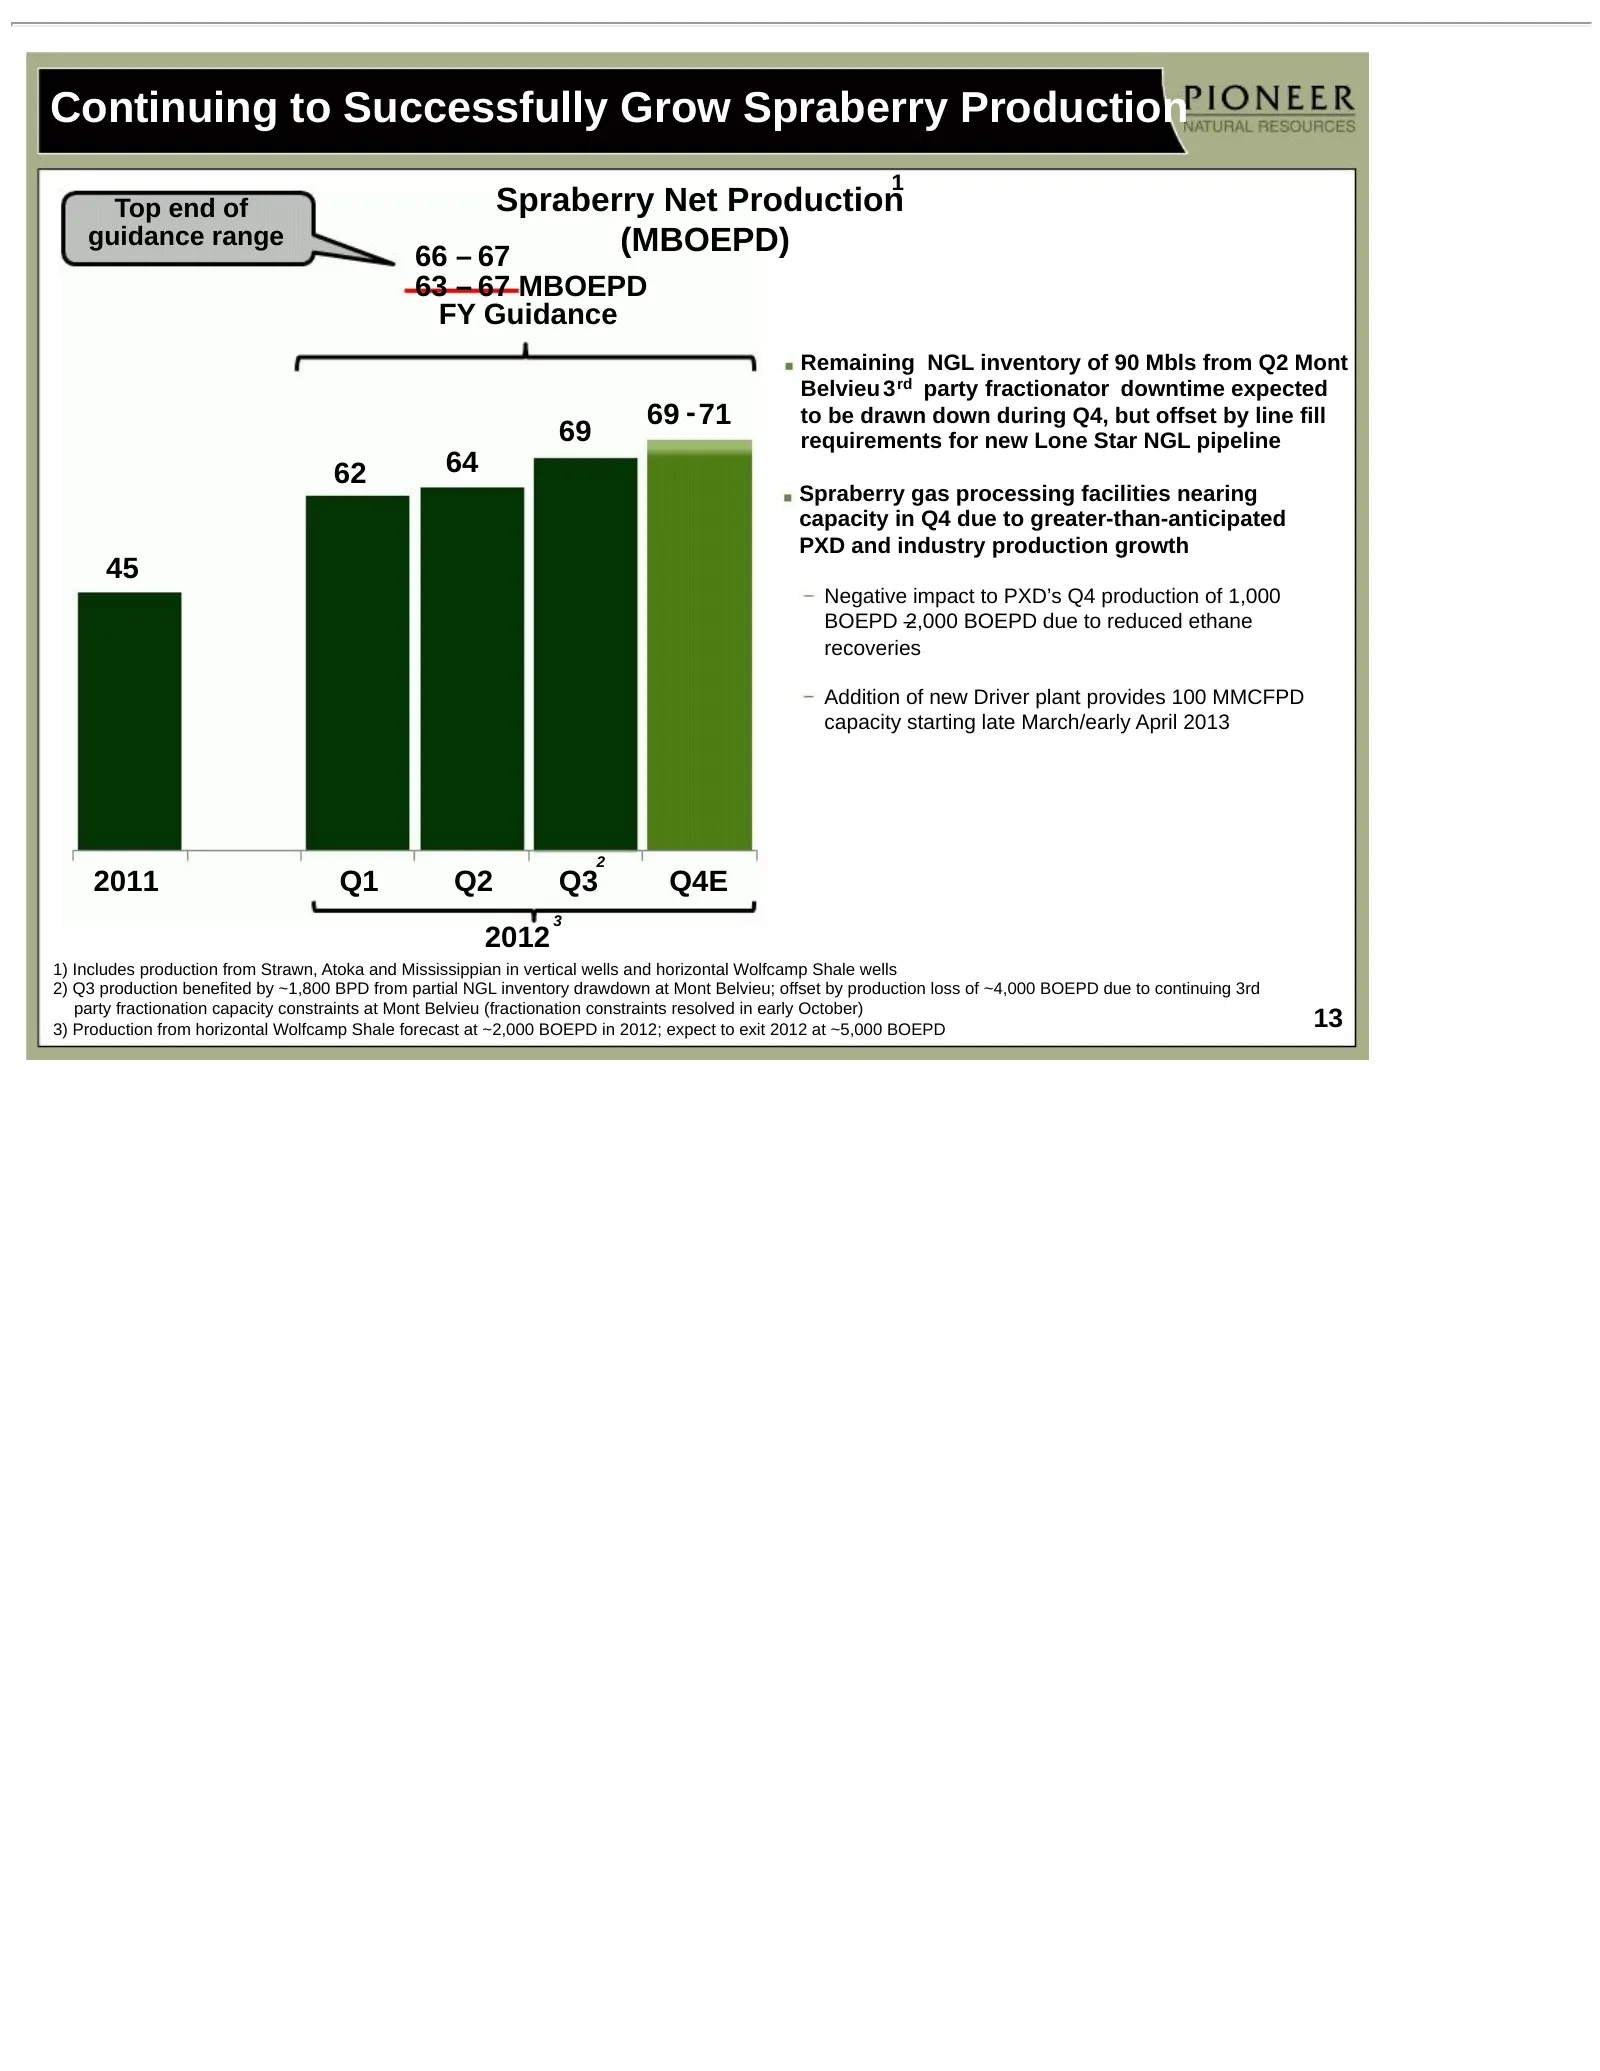
Slide 13: Continuing to Successfully Grow Spraberry Production
Continuing to Successfully Grow Spraberry Production 1 Top end of Spraberry Net Production guidance range 66 – 67 (MBOEPD) 63 – 67 MBOEPD FY Guidance Remaining NGL inventory of 90 Mbls from Q2 Mont Belvieu 3 rd party fractionator downtime expected 69 - 71 to be drawn down during Q4, but offset by li
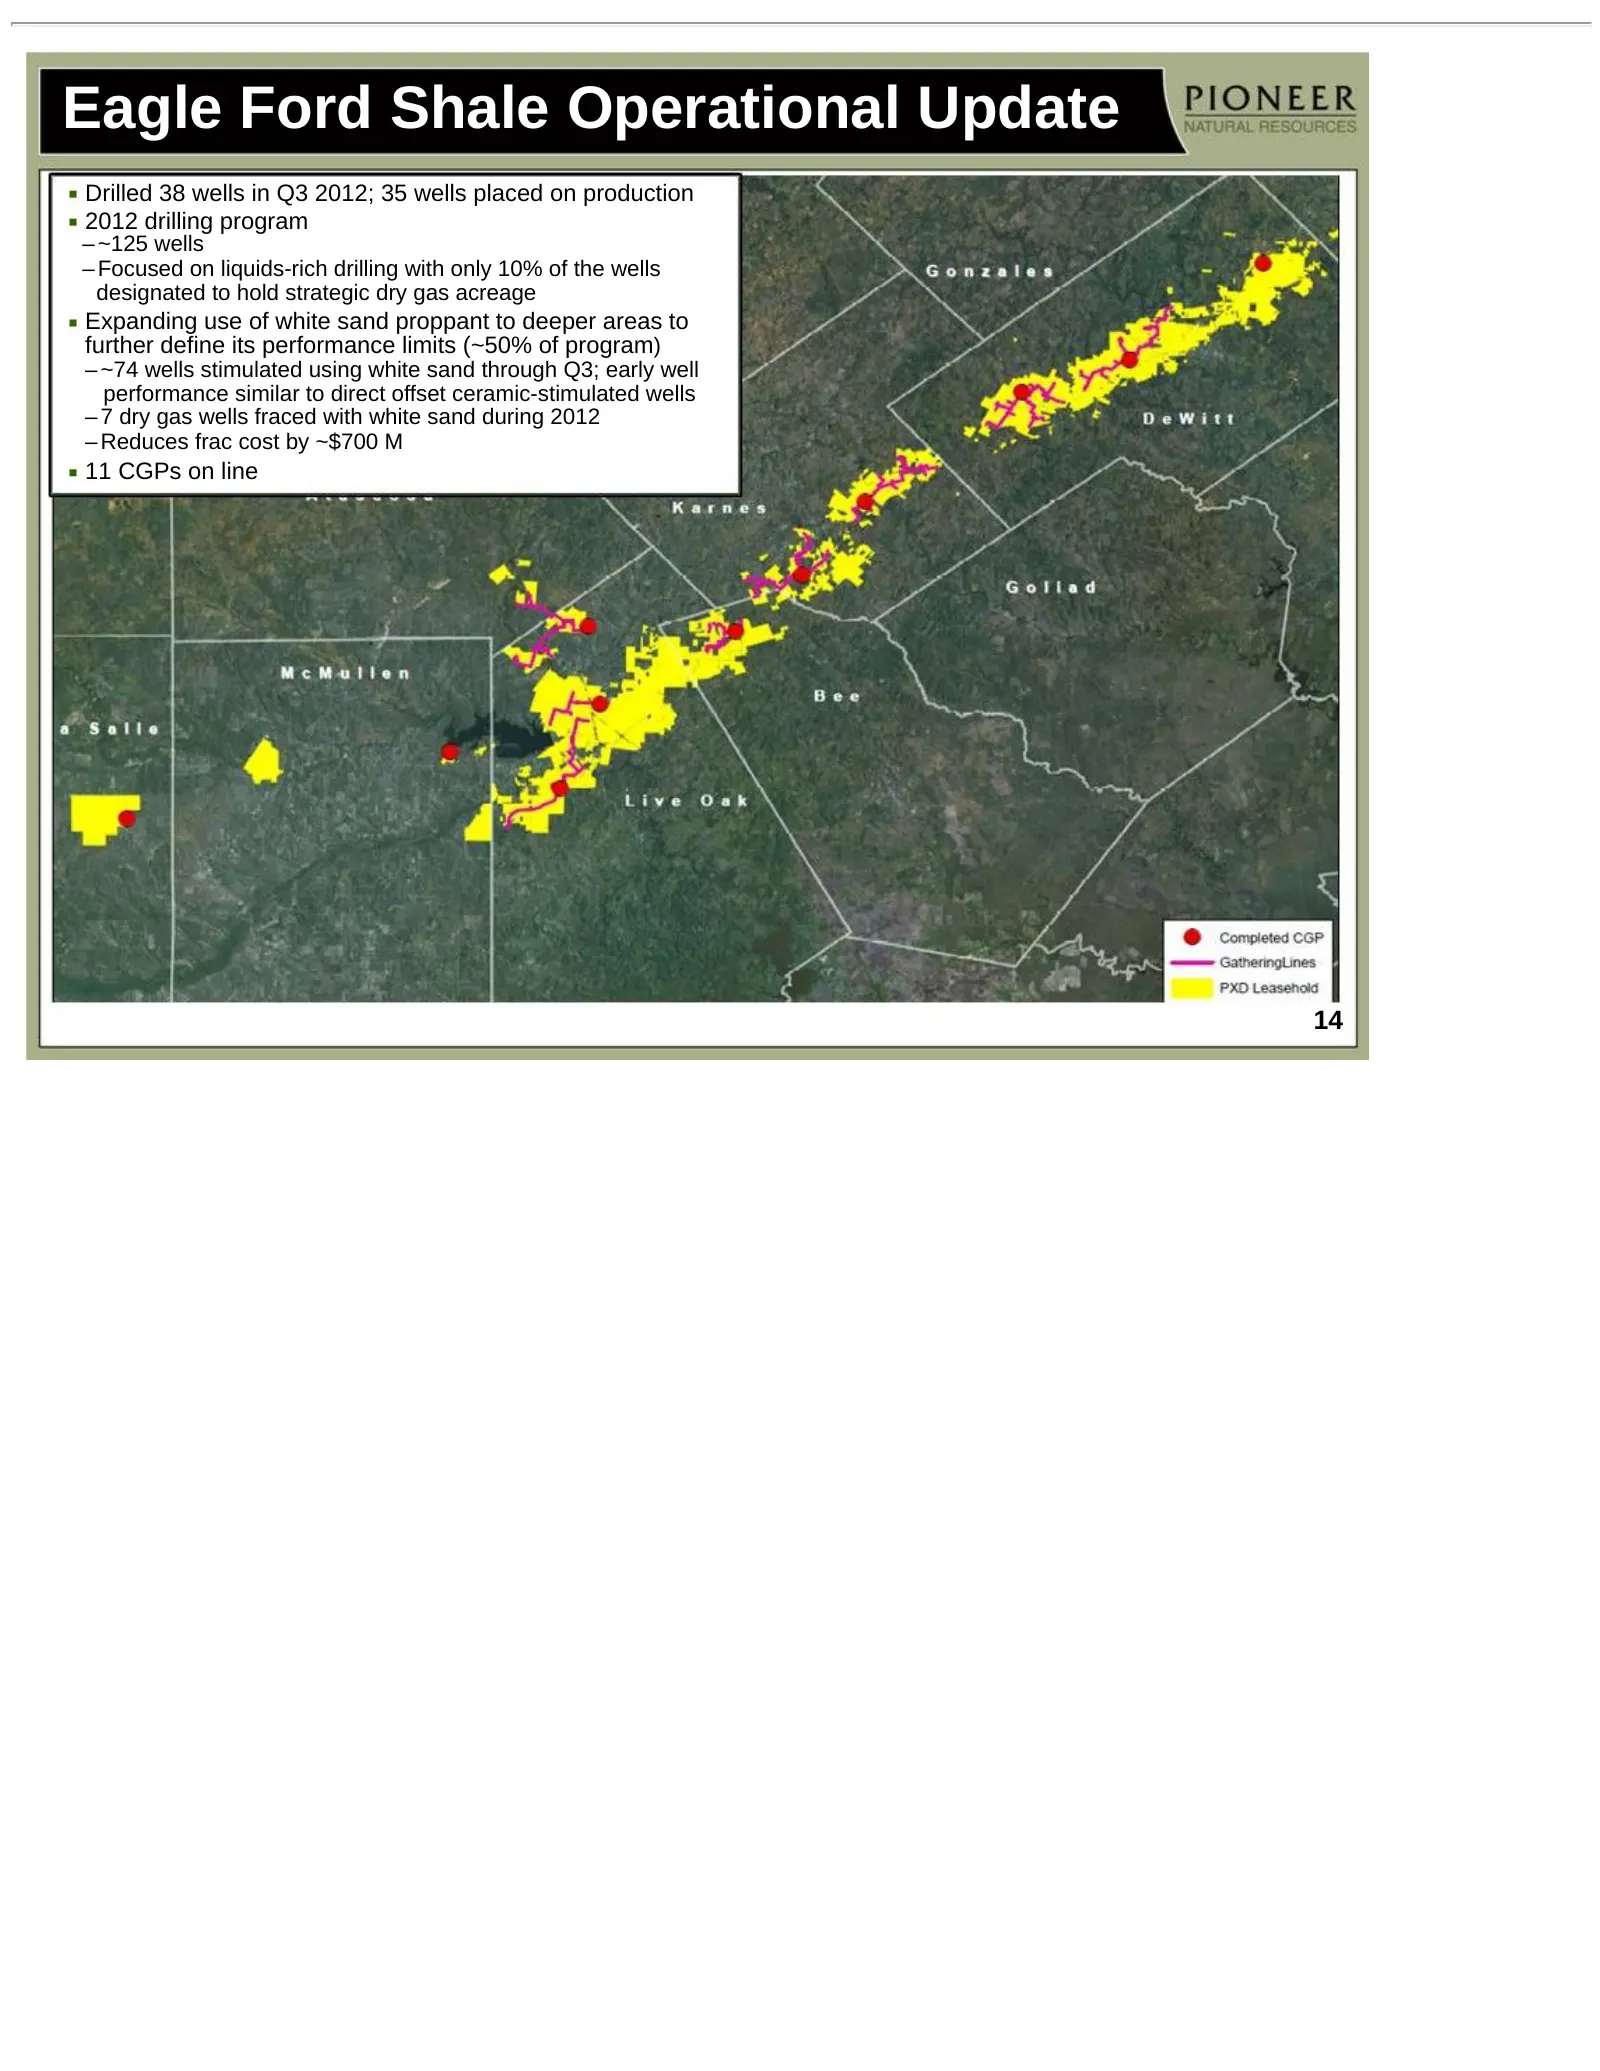
Slide 14: Eagle Ford Shale Operational Update
Eagle Ford Shale Operational Update Drilled 38 wells in Q3 2012; 35 wells placed on production 2012 drilling program – ~125 wells – Focused on liquids-rich drilling with only 10% of the wells designated to hold strategic dry gas acreage Expanding use of white sand proppant to deeper areas to further
Slide 15: Drilling Efficiency Improving
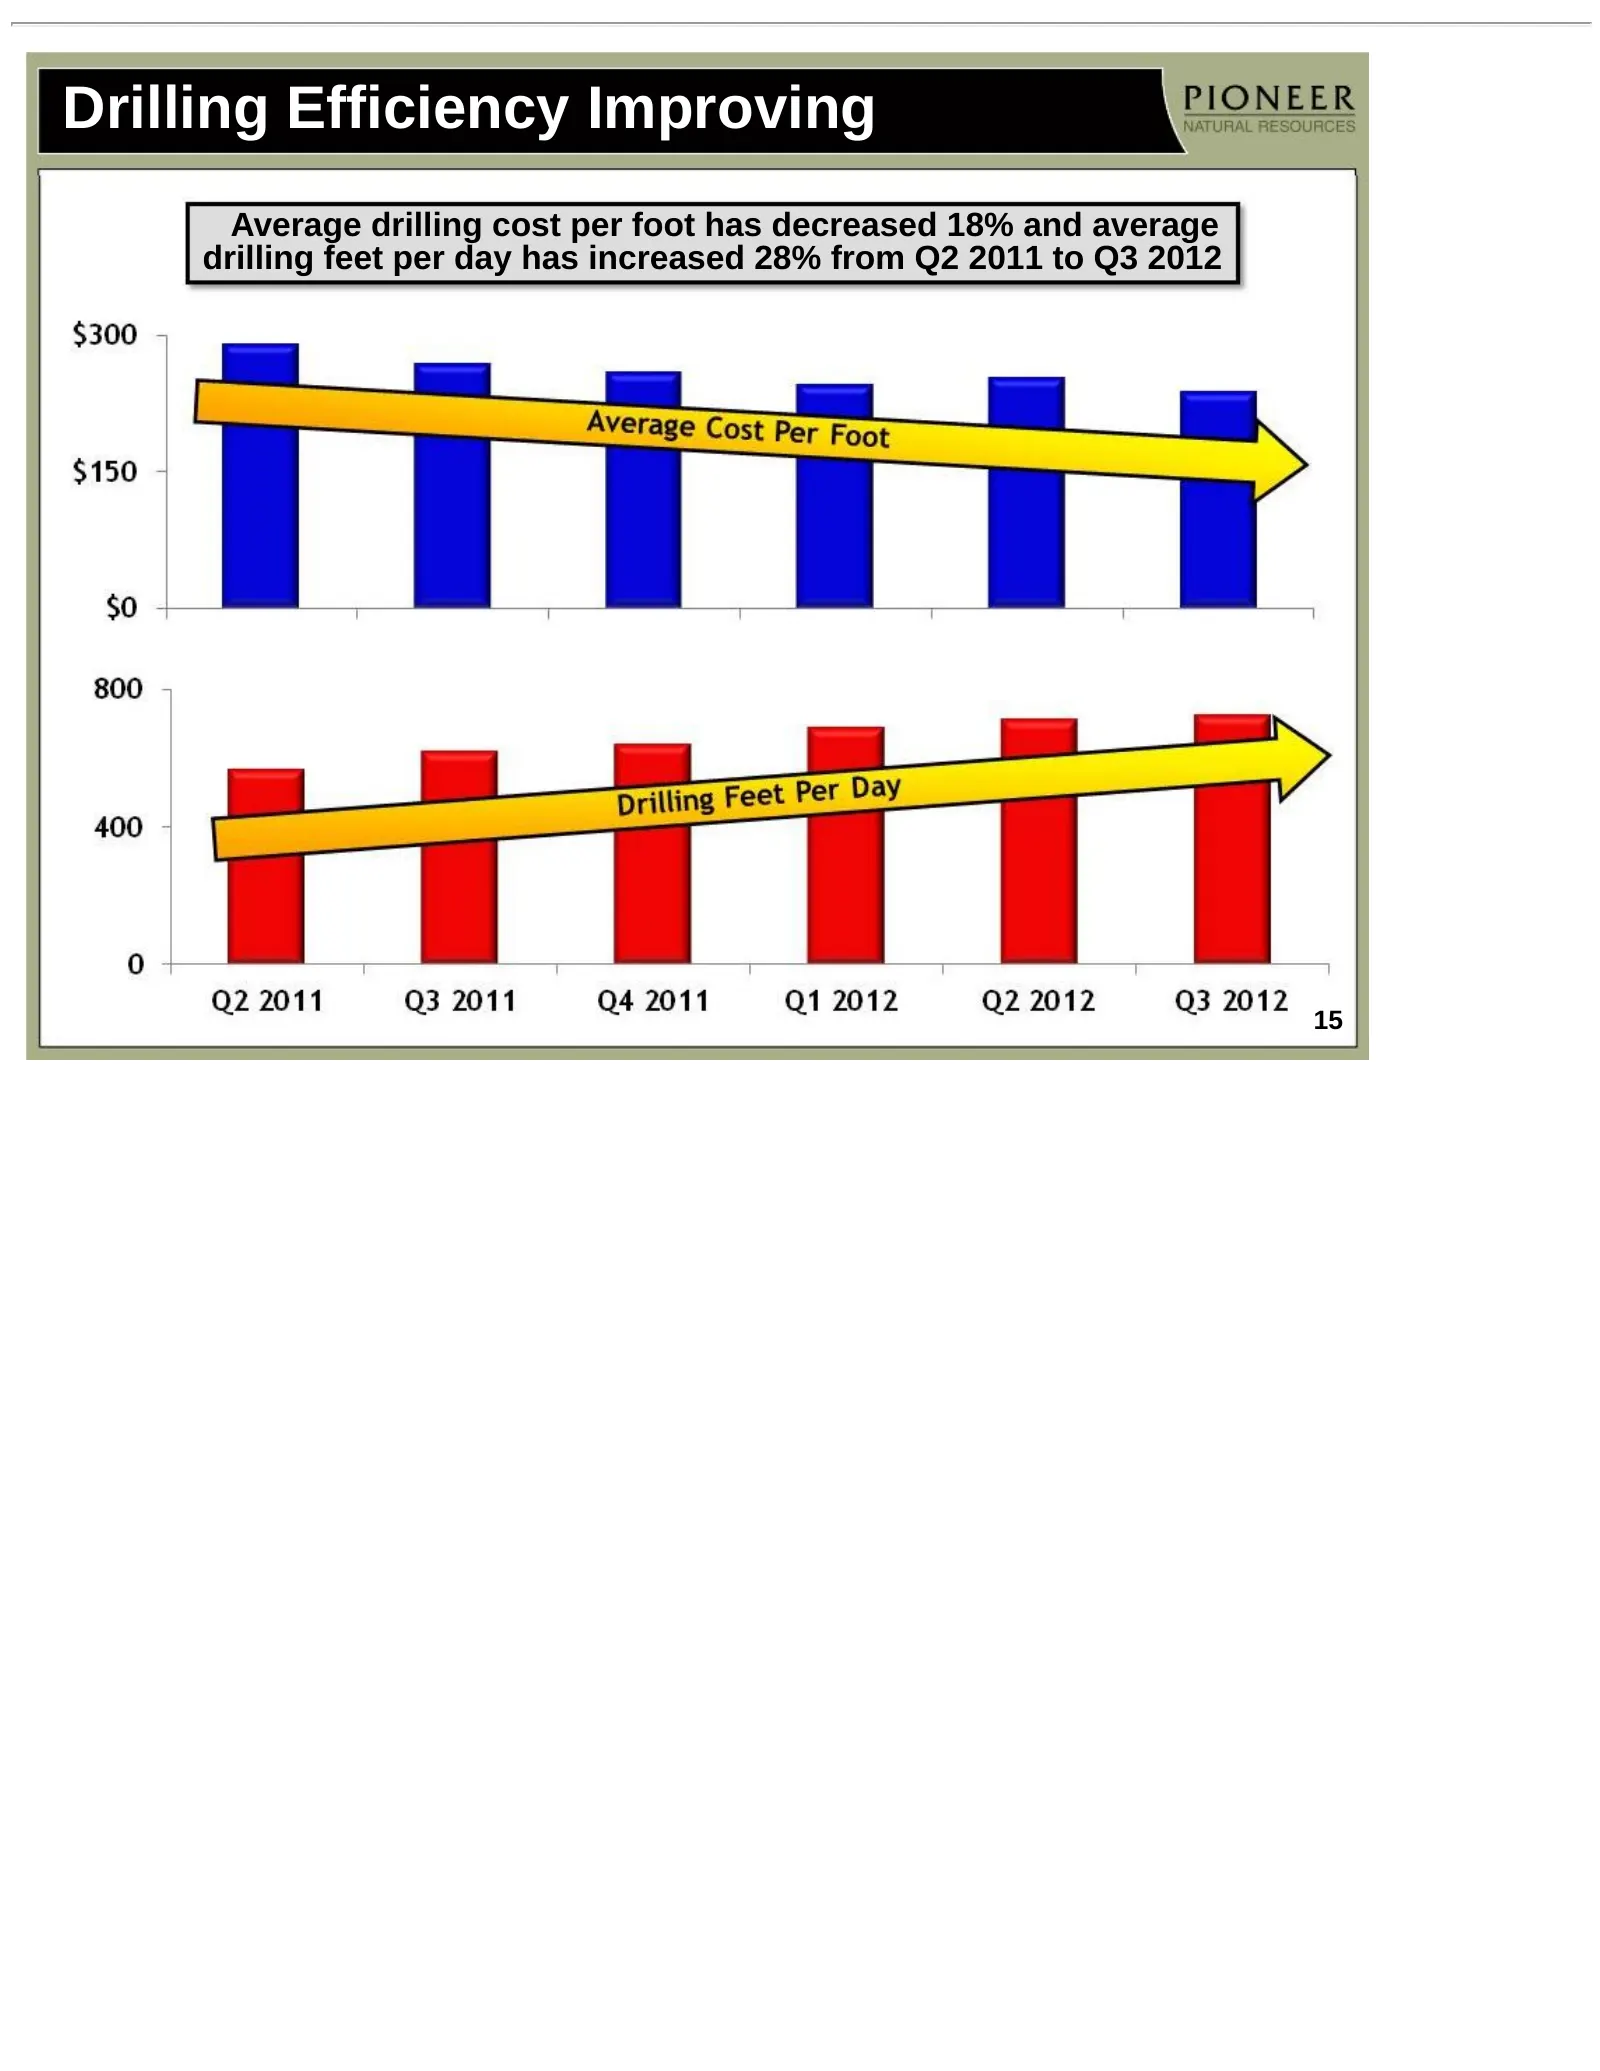
Drilling Efficiency Improving Average drilling cost per foot has decreased 18% and average drilling feet per day has increased 28% from Q2 2011 to Q3 2012 15
Slide 16: Pad Drilling Expected To Increase in 2013
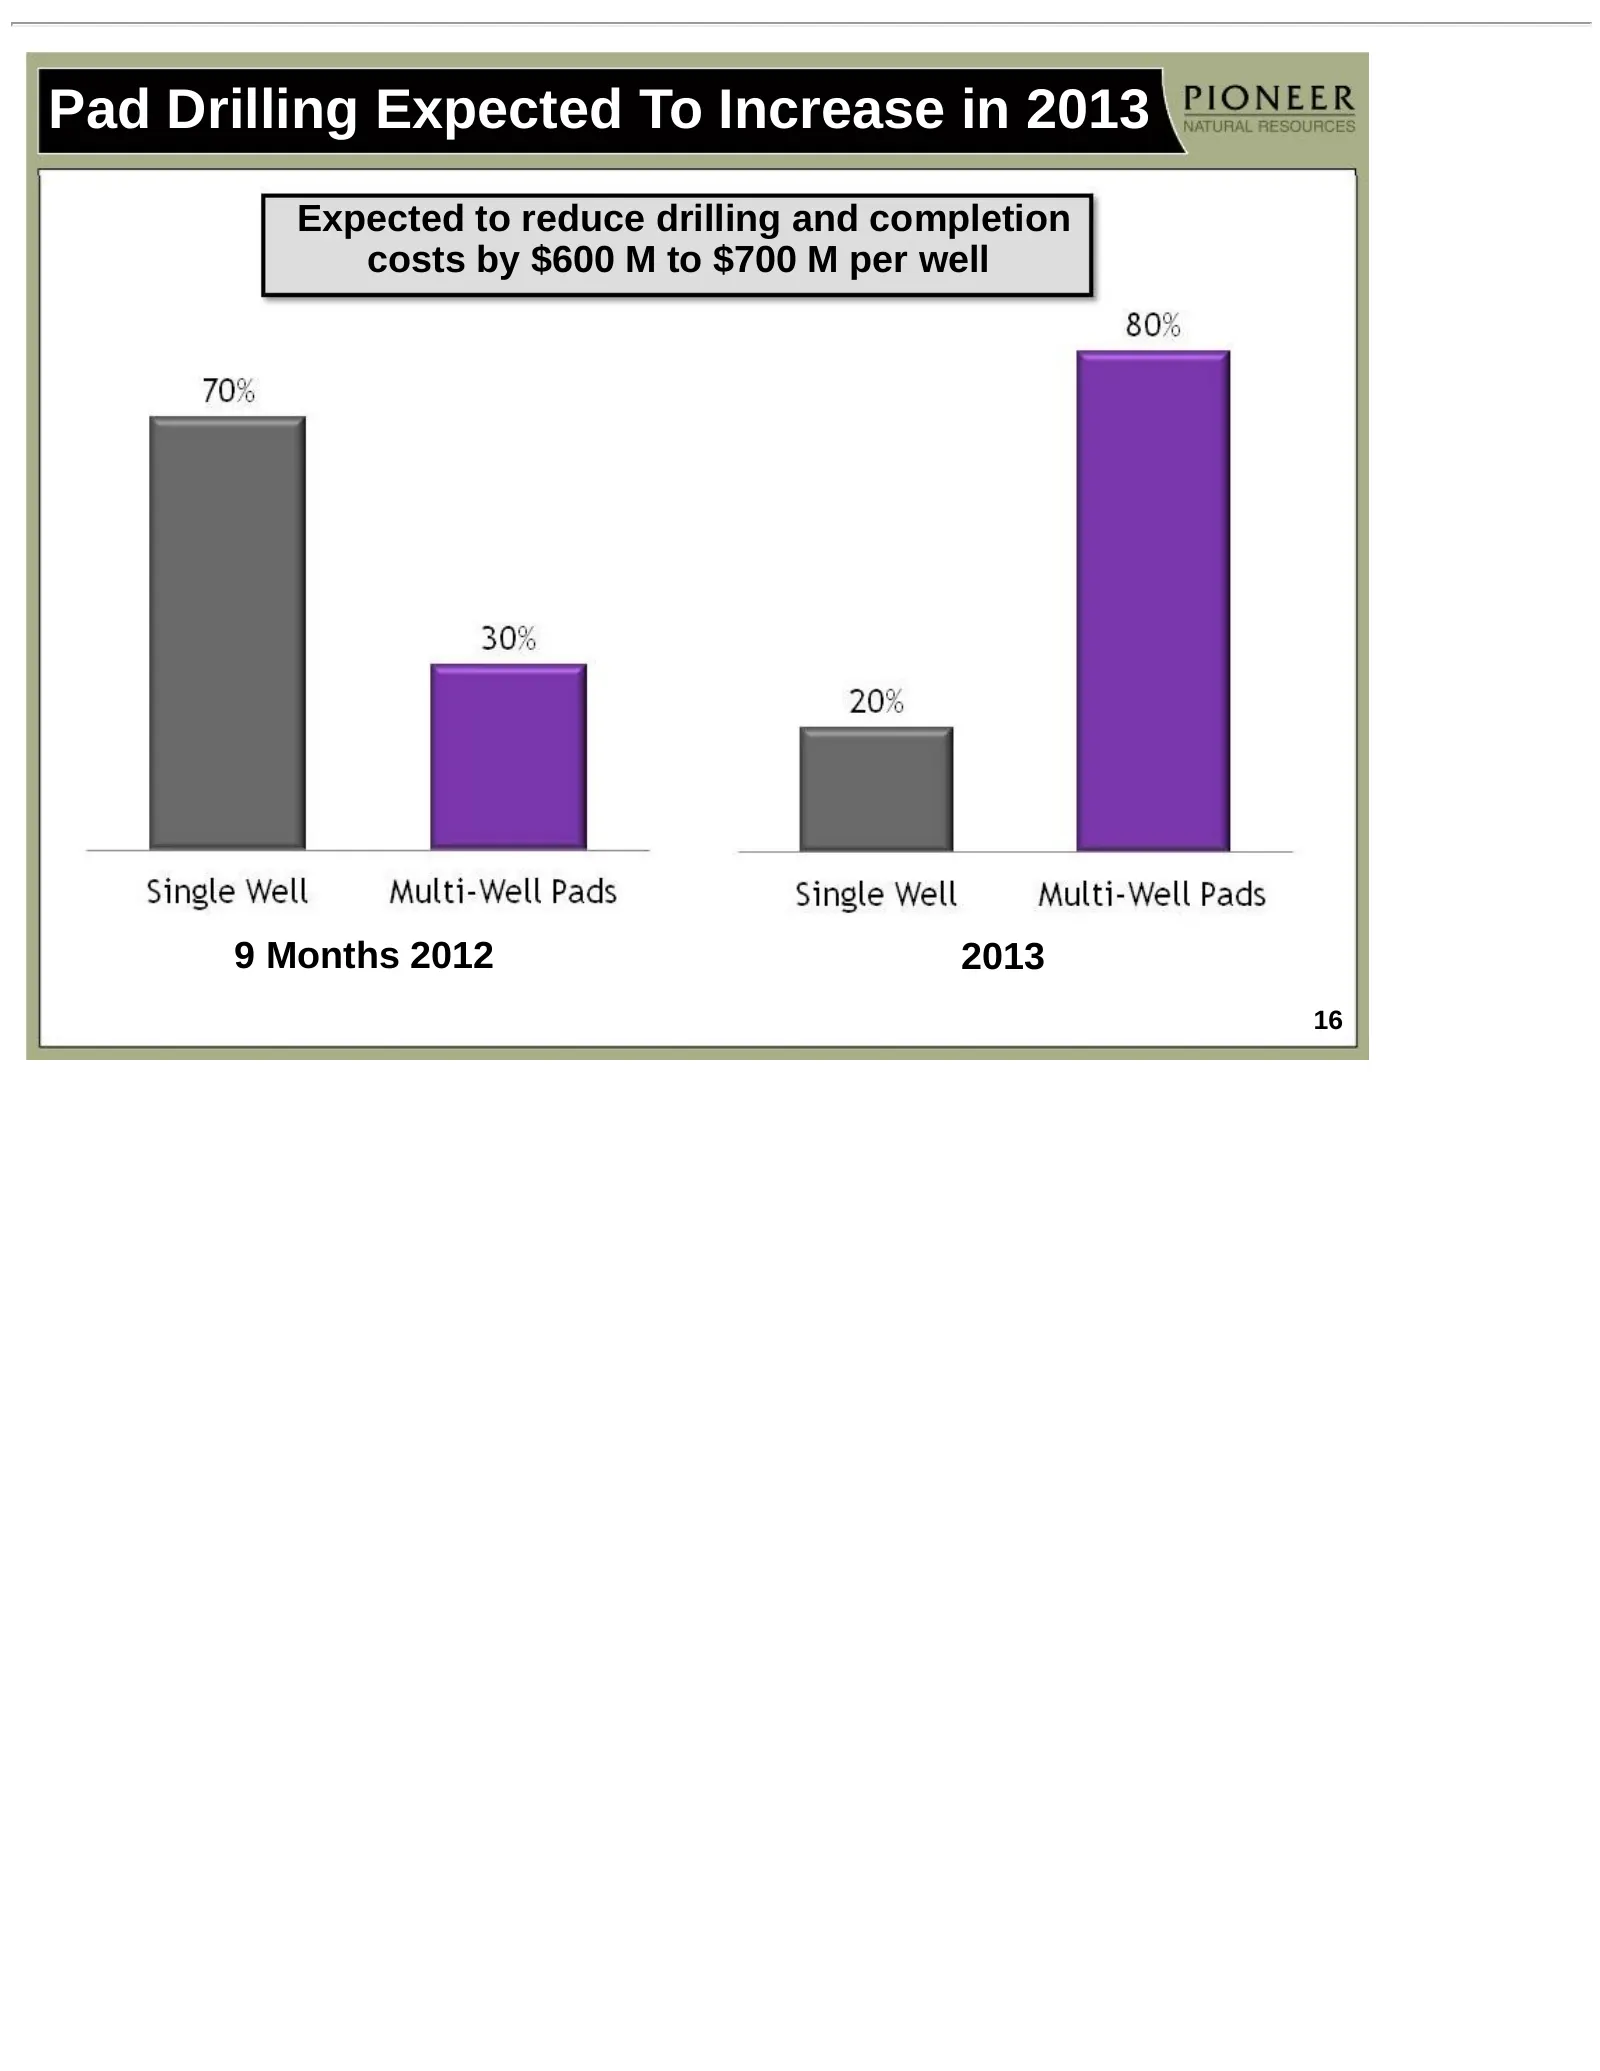
Pad Drilling Expected To Increase in 2013 Expected to reduce drilling and completion costs by $600 M to $700 M per well 9 Months 2012 2013 16
Slide 17: Eagle Ford Shale Continues to Set New Production Records
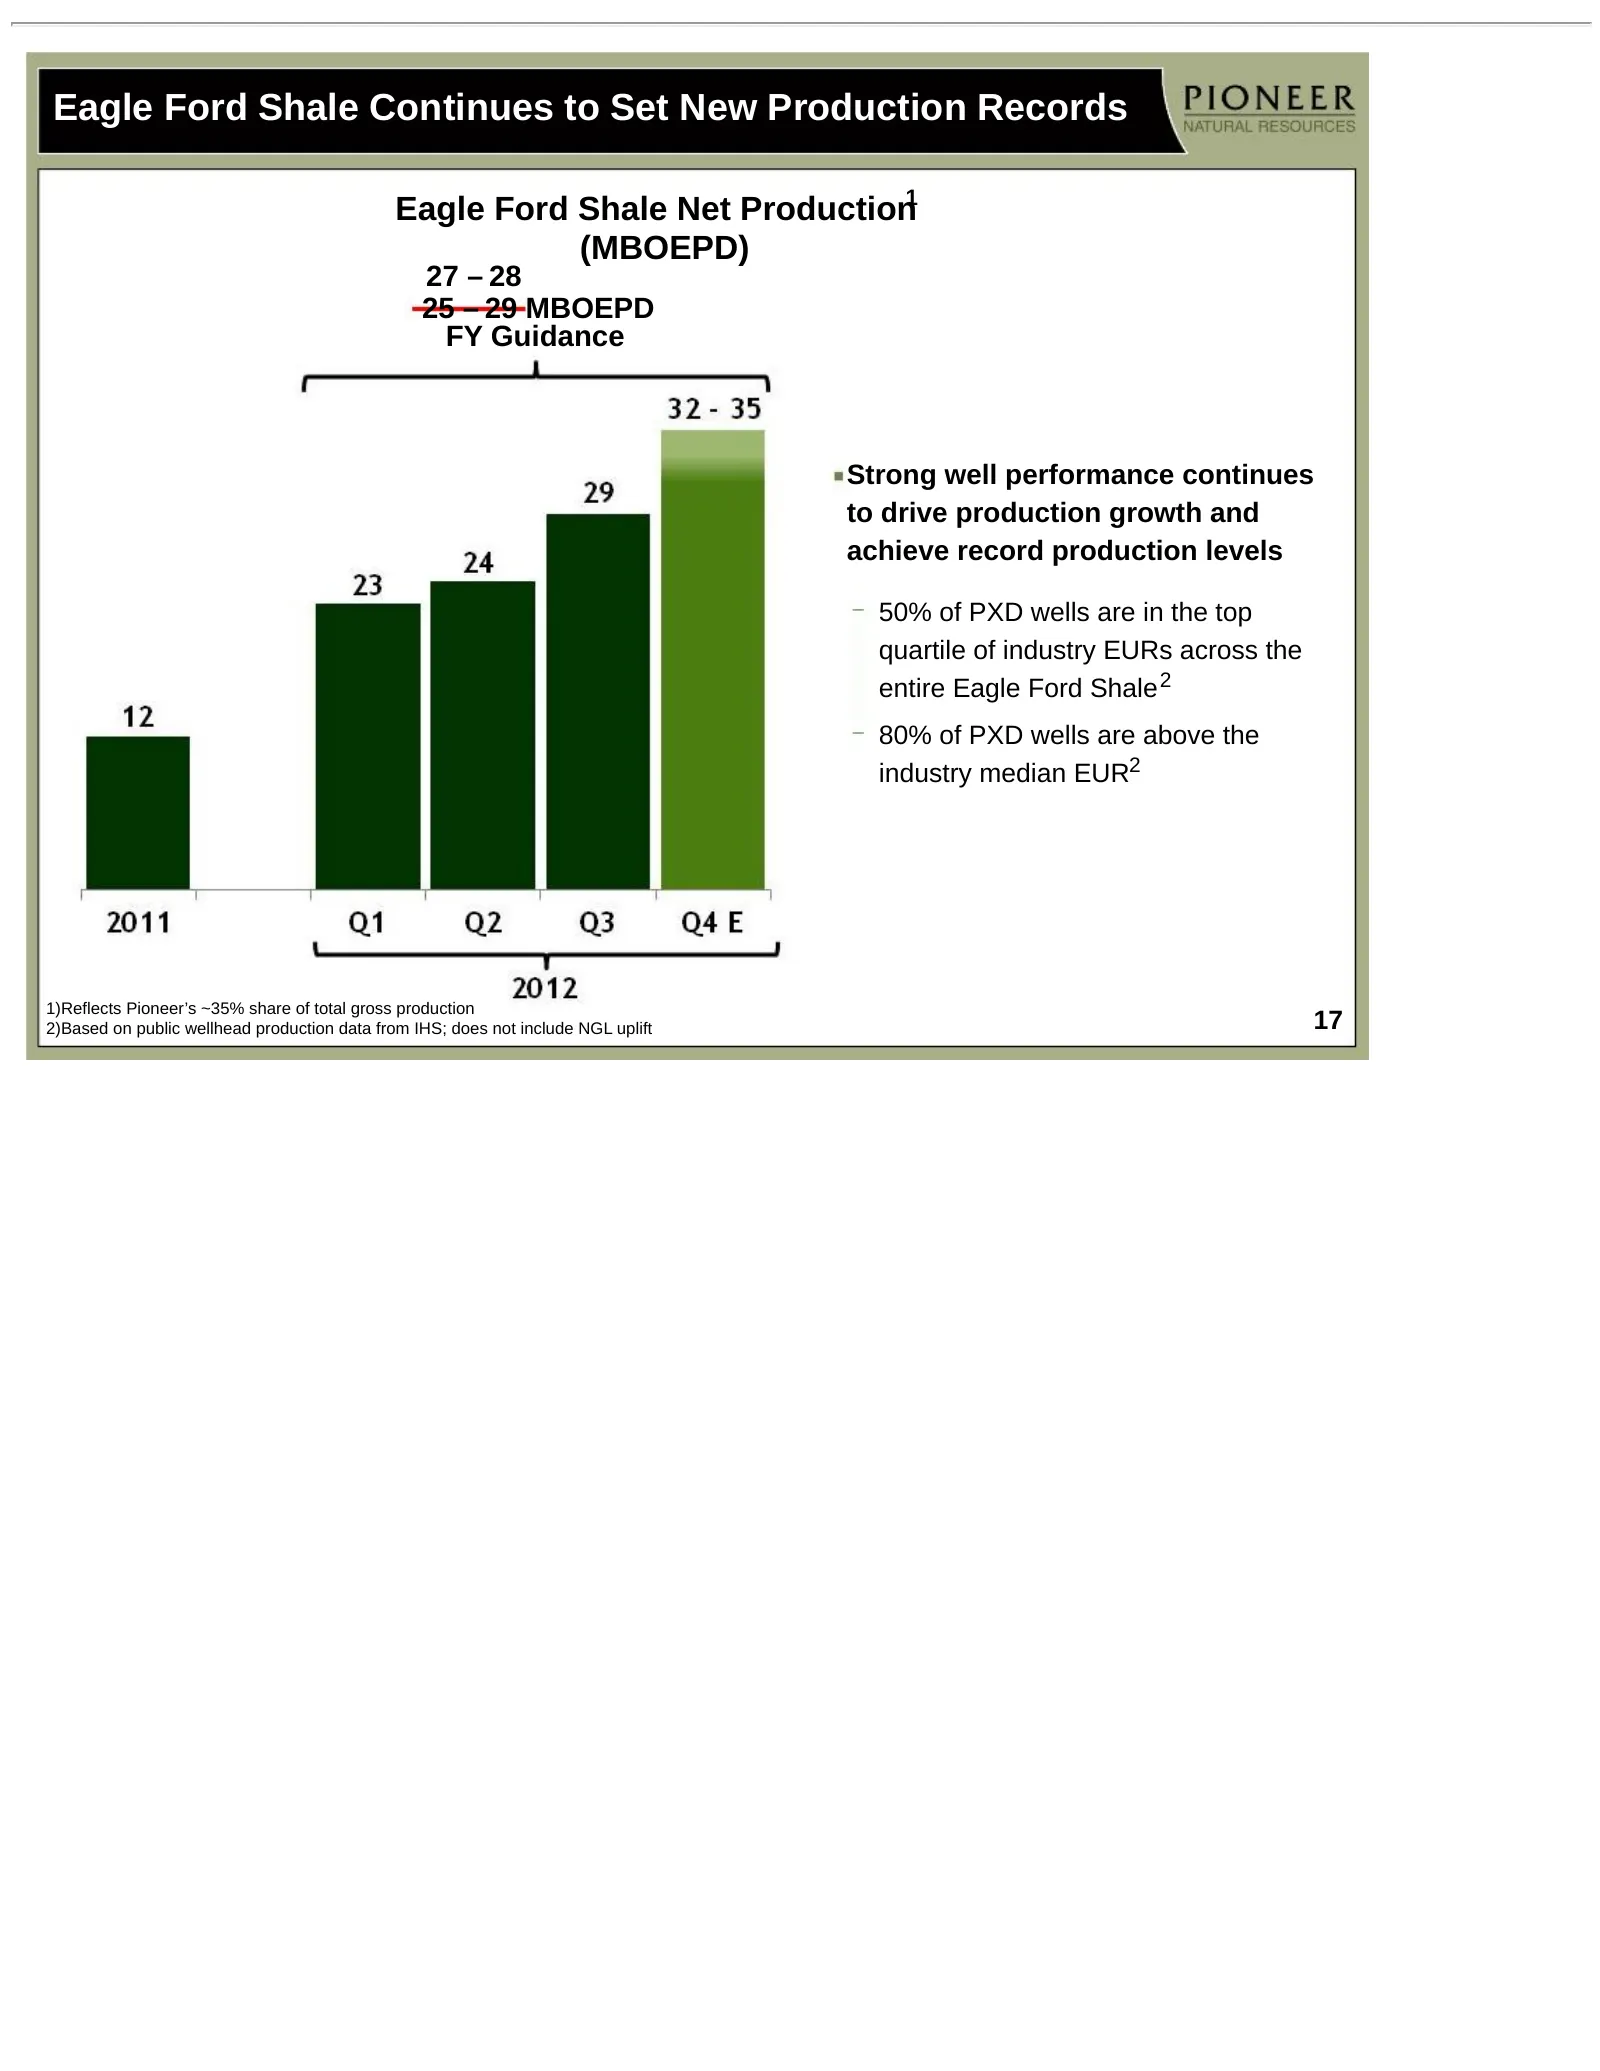
Eagle Ford Shale Continues to Set New Production Records Eagle Ford Shale Net Production1 (MBOEPD) 27 – 28 25 – 29 MBOEPD FY Guidance Strong well performance continues to drive production growth and achieve record production levels 50% of PXD wells are in the top quartile of industry EURs across the
Slide 18: Barnett Shale Planned Divestiture
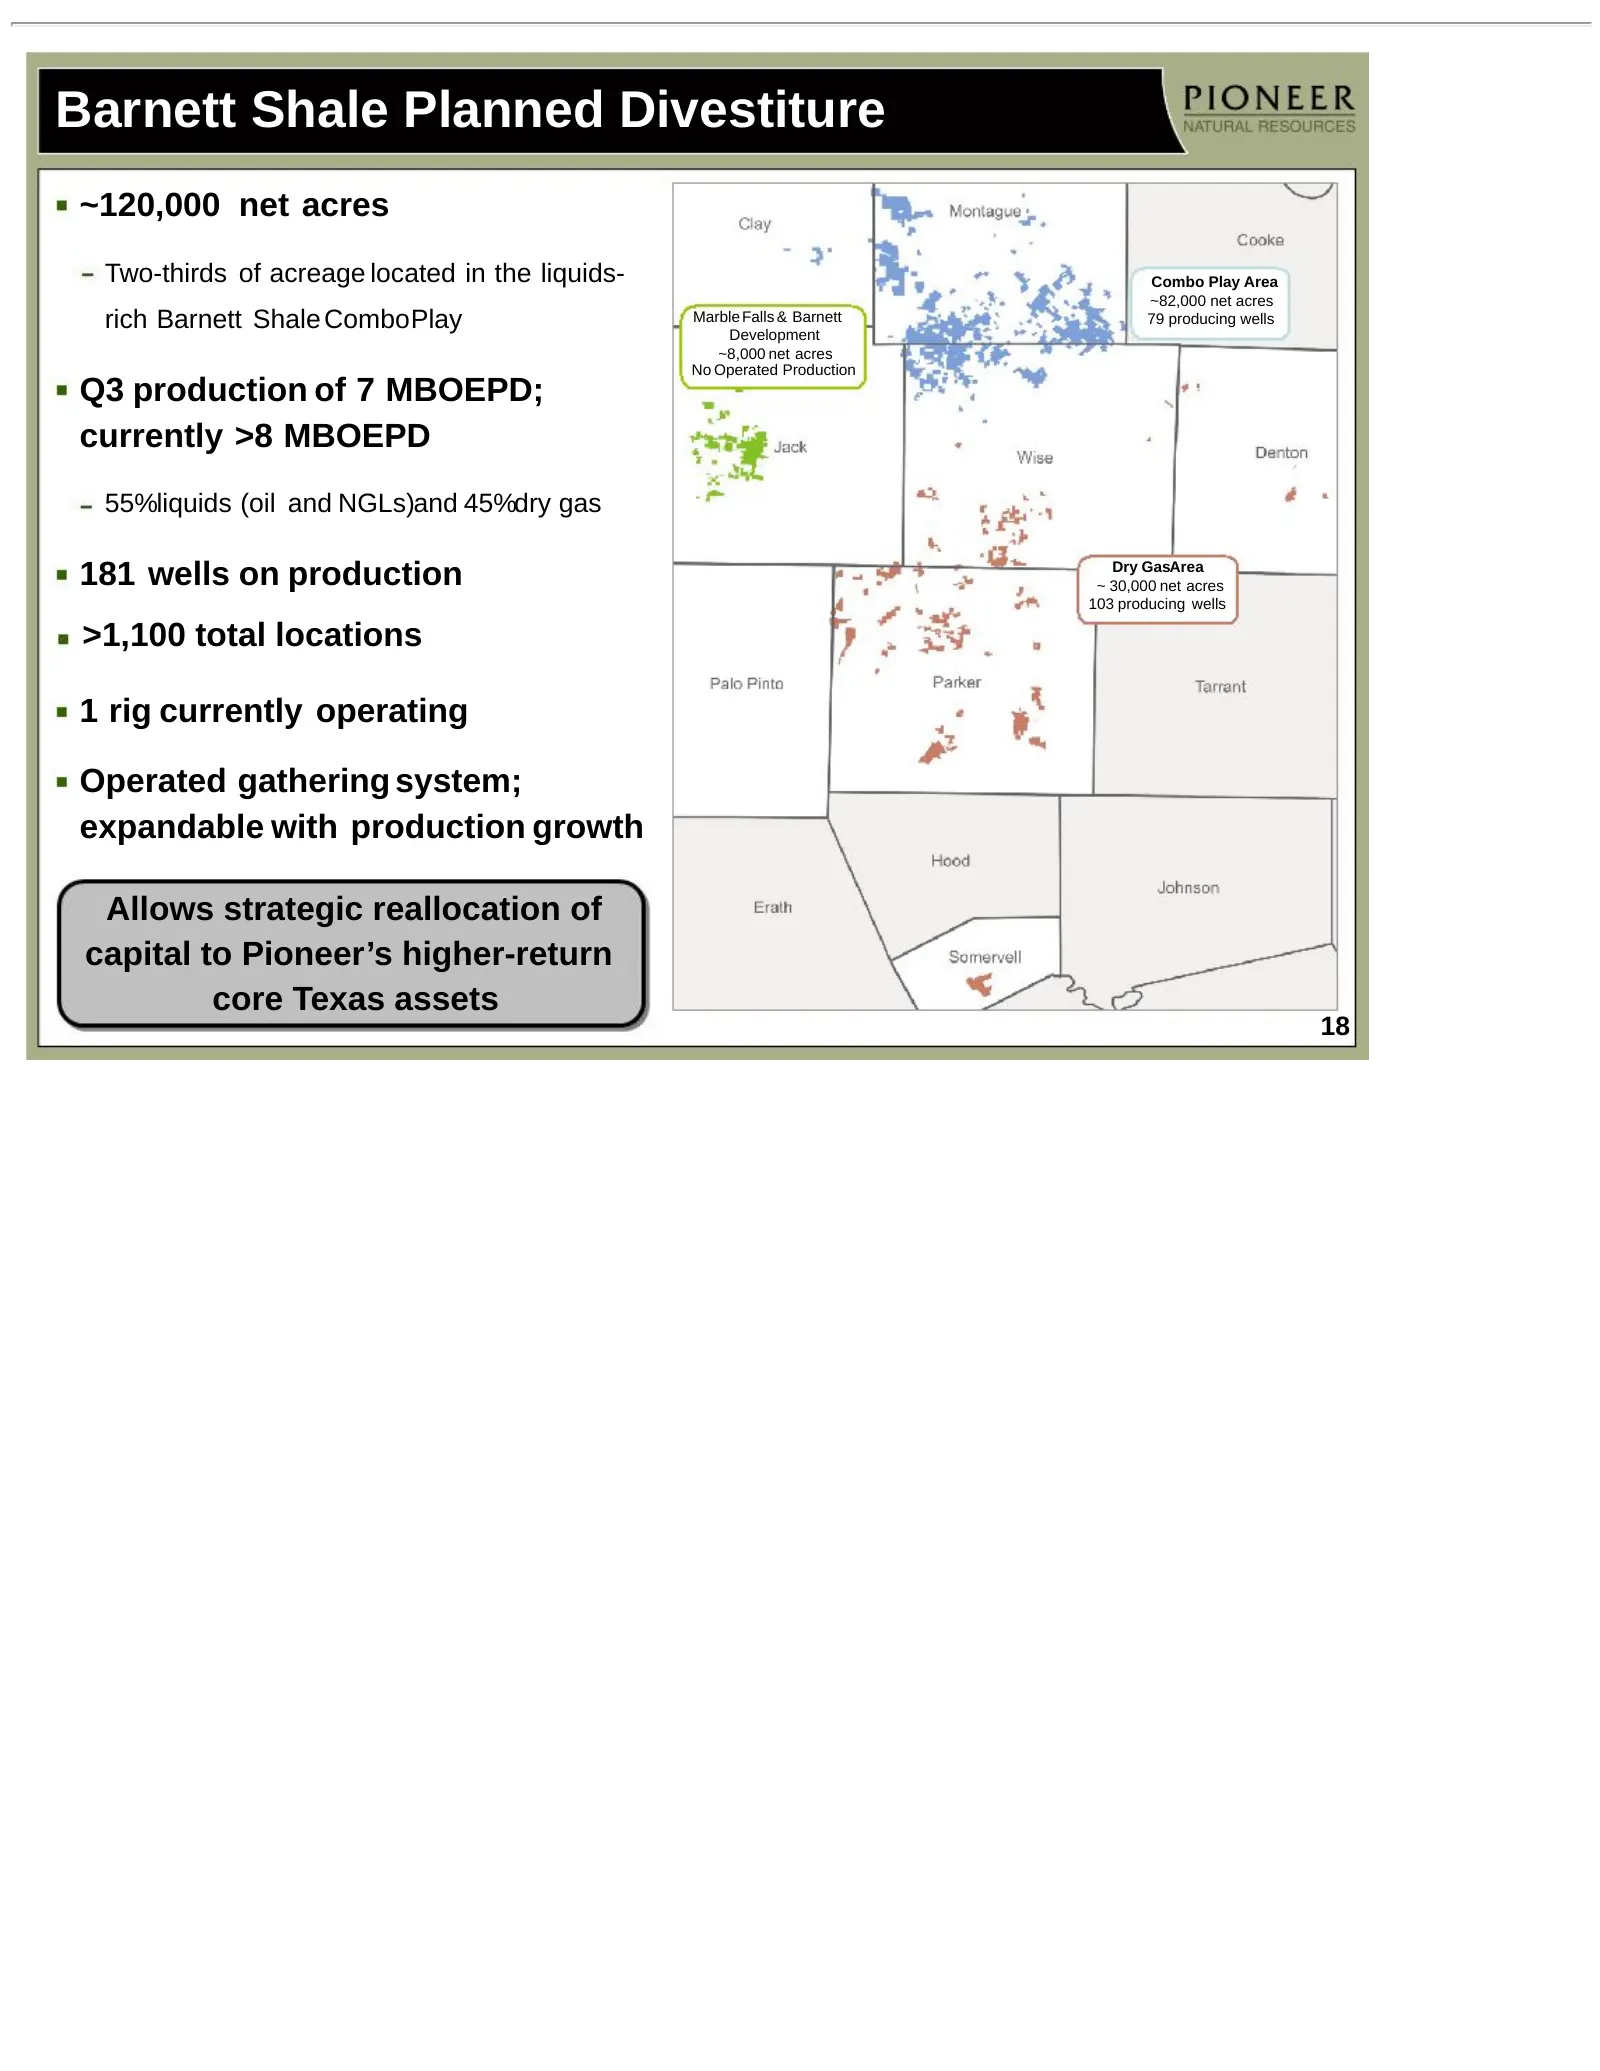
Barnett Shale Planned Divestiture ~120,000 net acres Two-thirds of acreage located in the liquids- Combo Play Area ~82,000 net acres rich Barnett Shale ComboPlay Marble Falls & Barnett Development 79 producing wells ~8,000 net acres No Operated Production Q3 production of 7 MBOEPD; currently >8 MBOE
Slide 19: Alaska
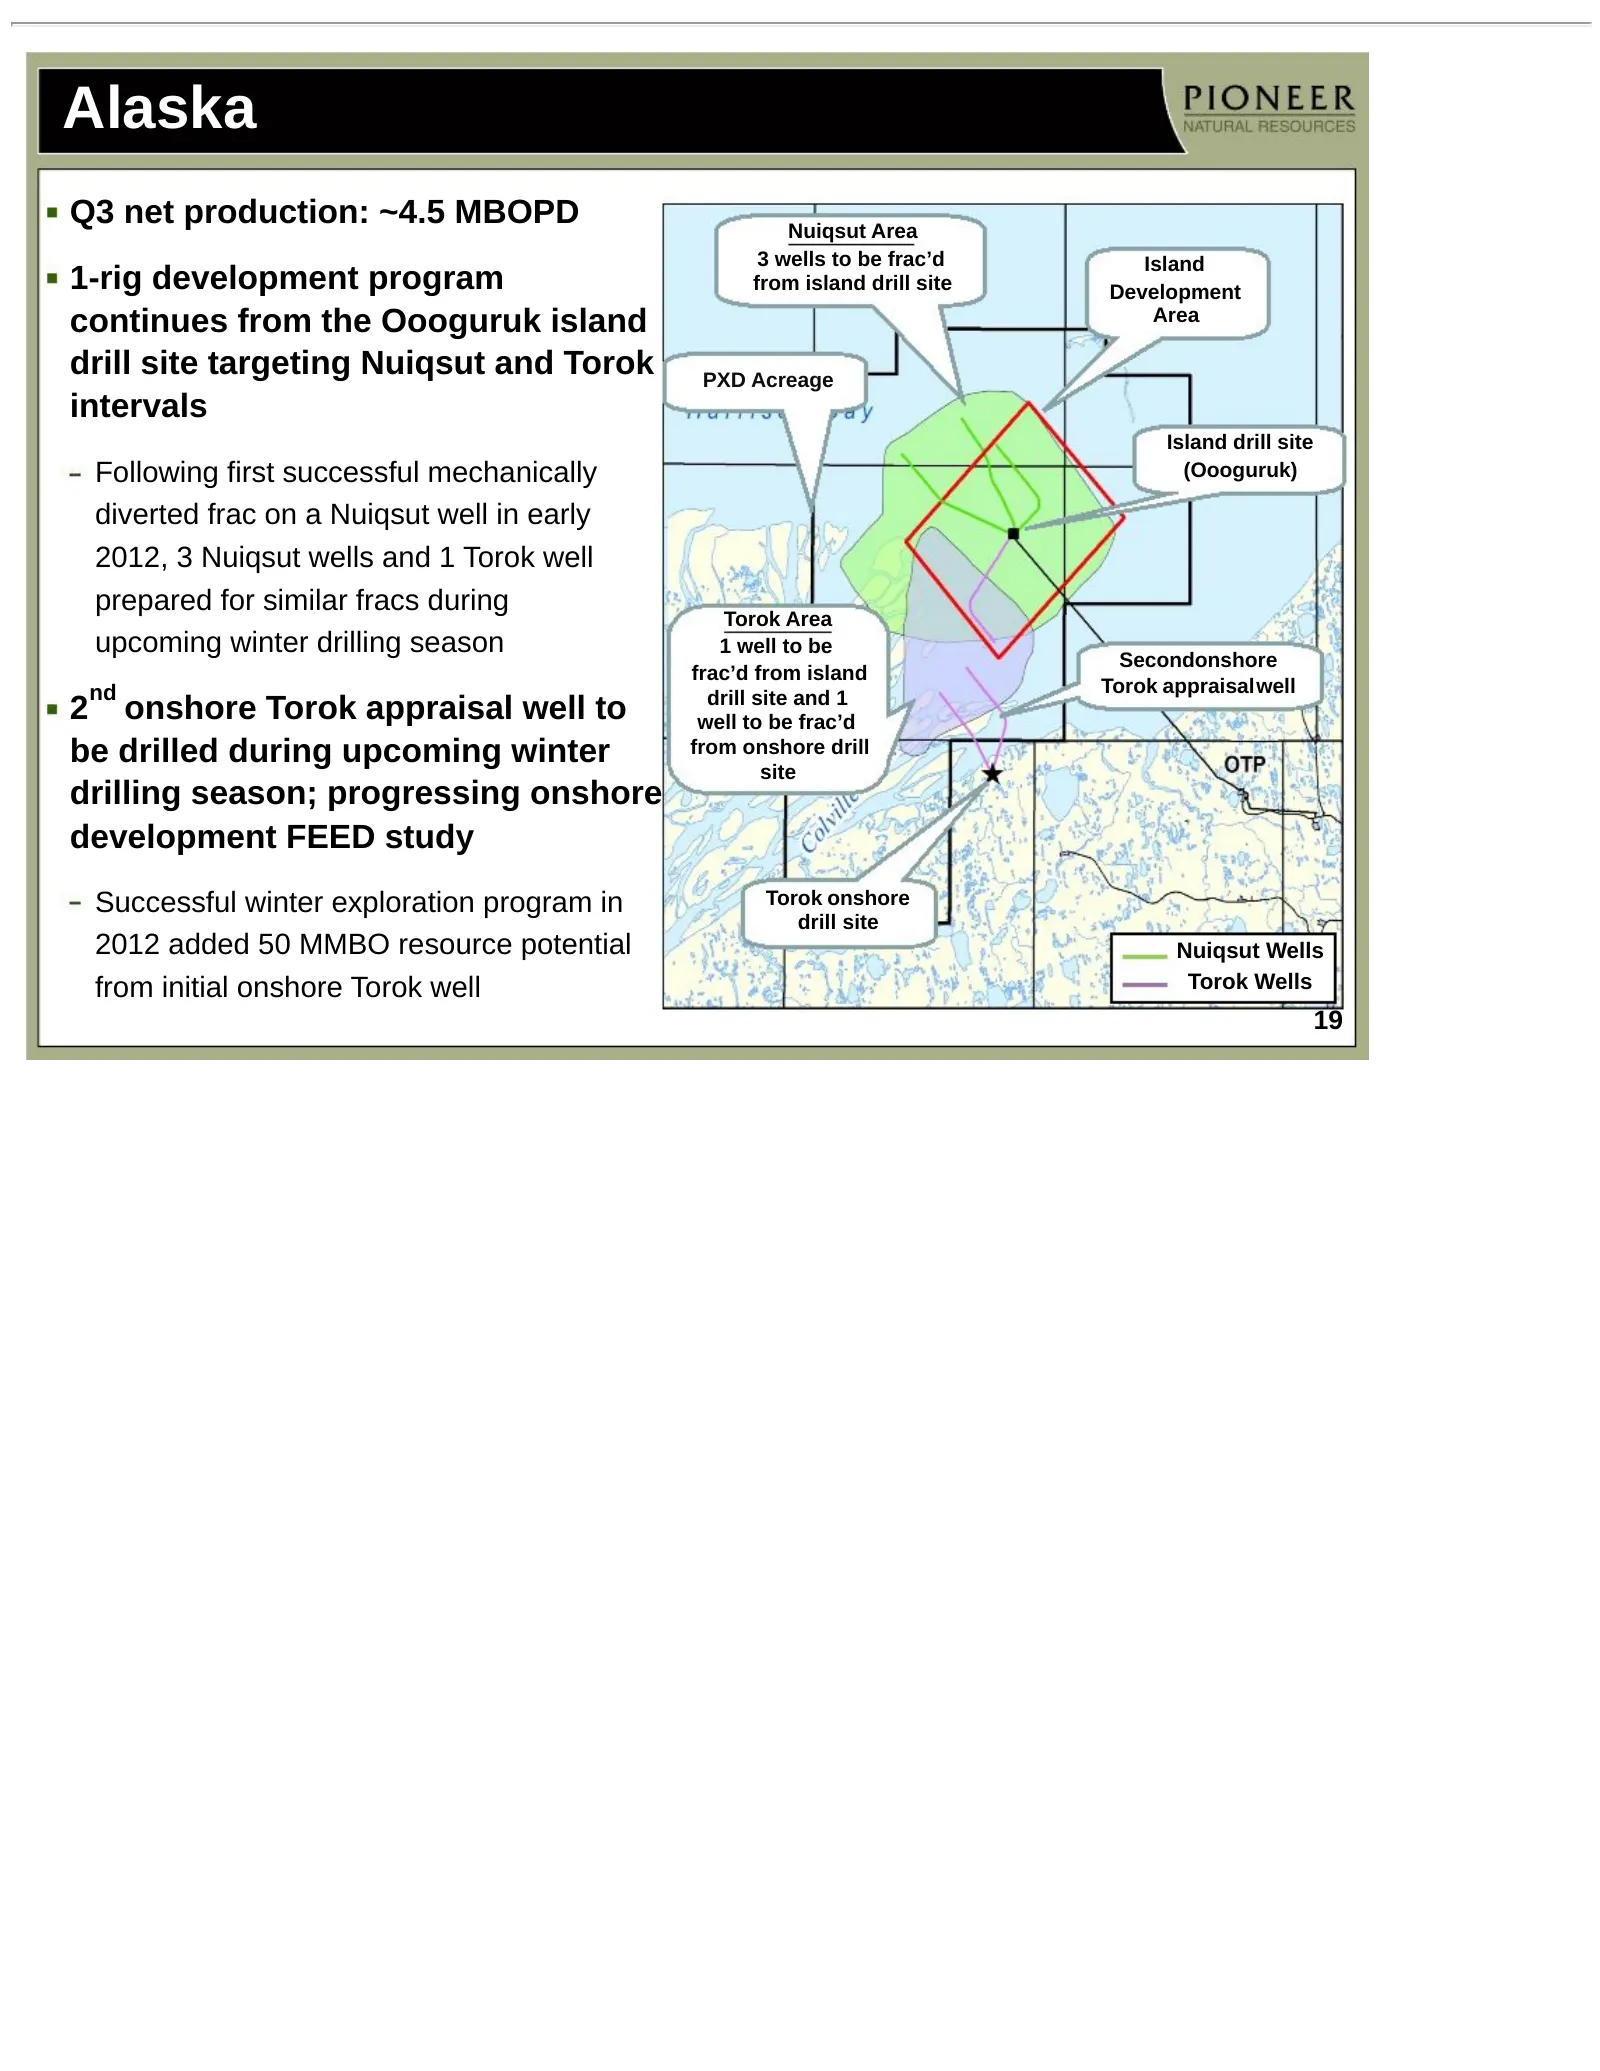
Alaska Q3 net production: ~4.5 MBOPD Nuiqsut Area 3 wells to be frac’d Island 1-rig development program from island drill site Development continues from the Oooguruk island Area drill site targeting Nuiqsut and Torok PXD Acreage intervals Island drill site Following first successful mechanically (O
Slide 20: Why Invest In PXD?
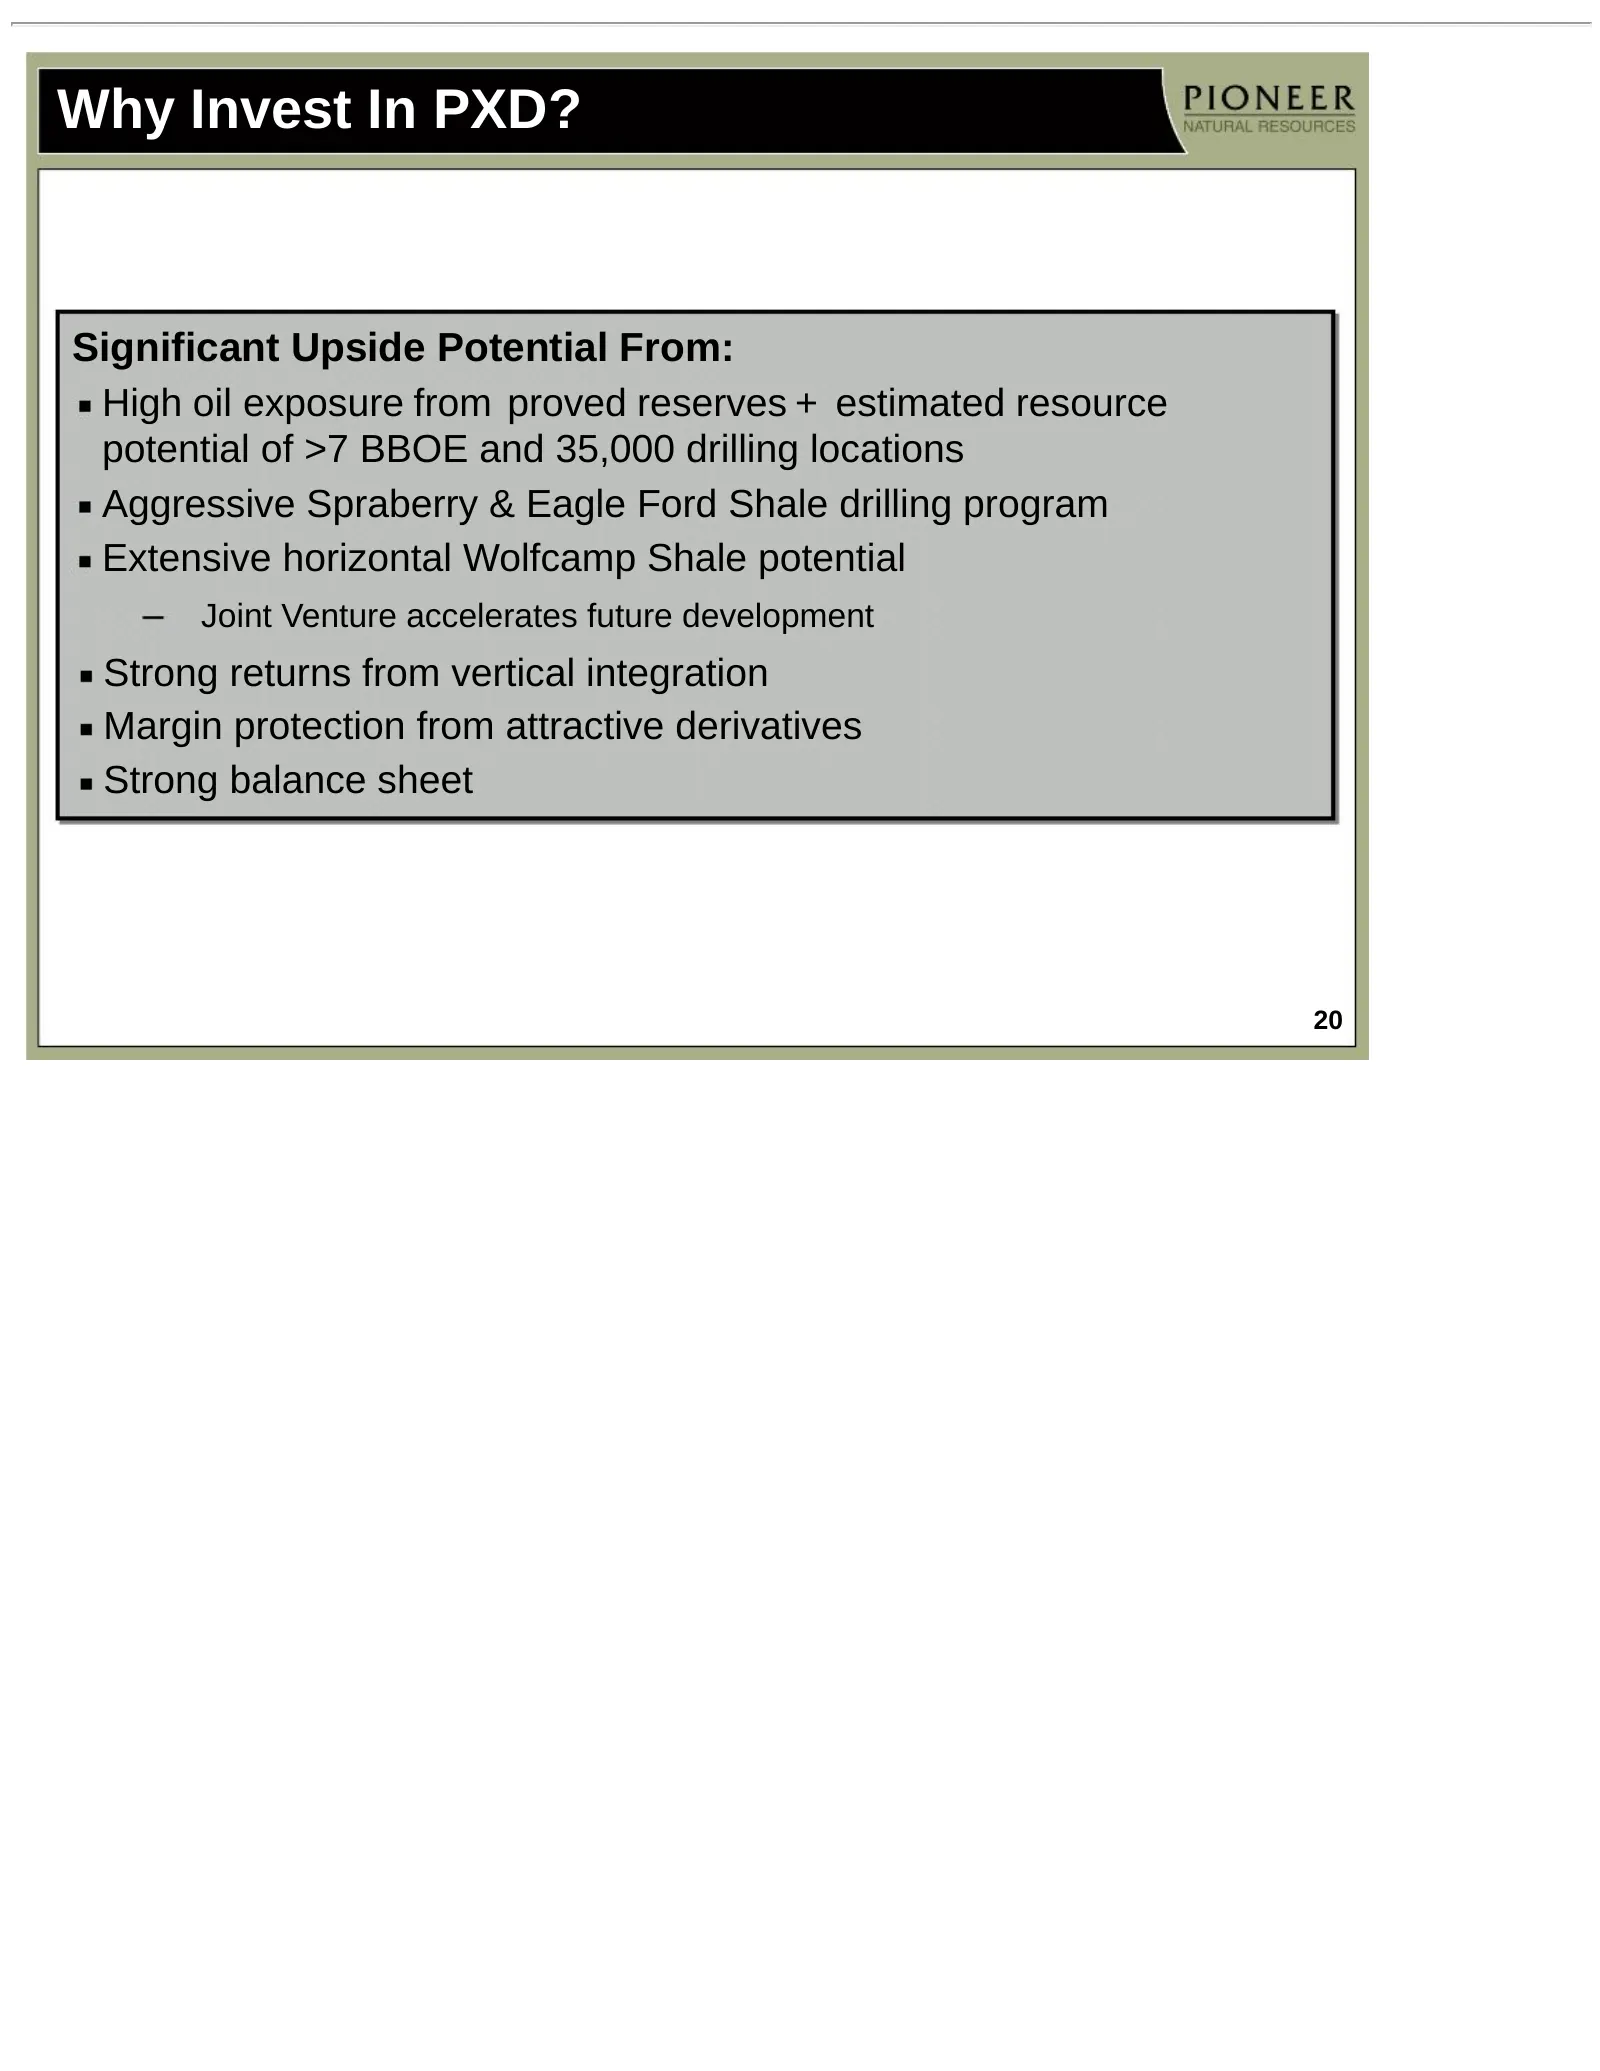
Why Invest In PXD? Significant Upside Potential From: High oil exposure from proved reserves + estimated resource potential of >7 BBOE and 35,000 drilling locations Aggressive Spraberry & Eagle Ford Shale drilling program Extensive horizontal Wolfcamp Shale potential Joint Venture accelerates future
Slide 21: Appendix
Appendix
Slide 22: Pioneer Operations
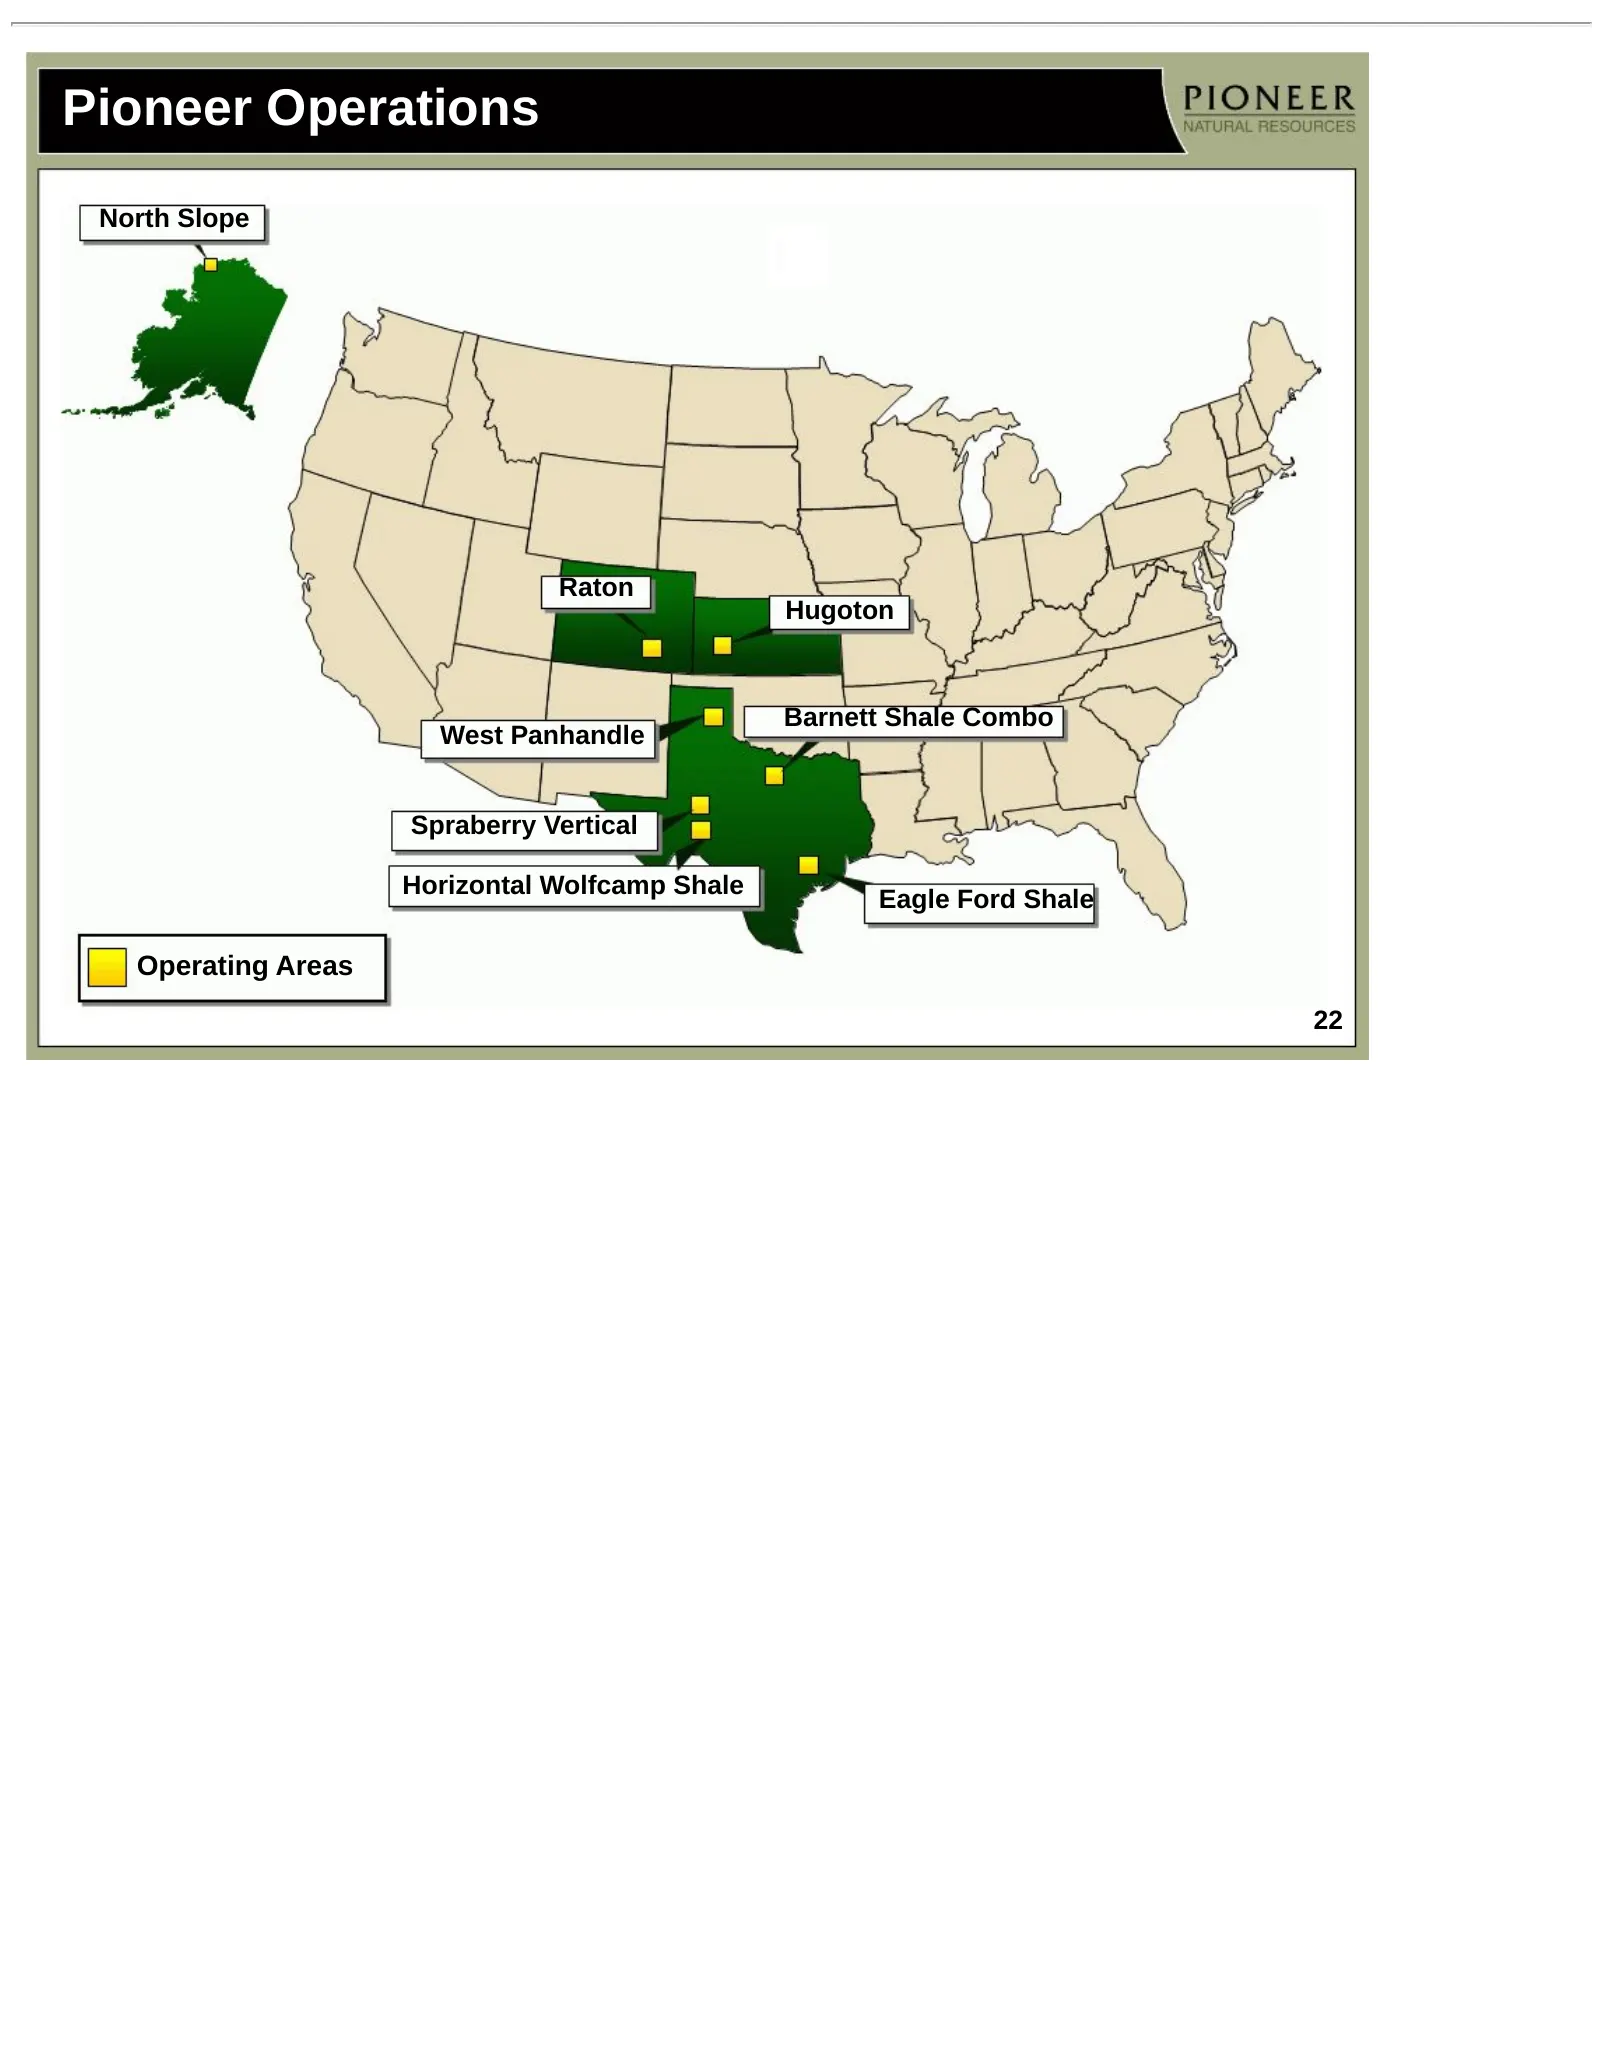
Pioneer Operations North Slope Raton Hugoton Barnett Shale Combo West Panhandle Spraberry Vertical Horizontal Wolfcamp Shale Eagle Ford Shale Operating Areas 22
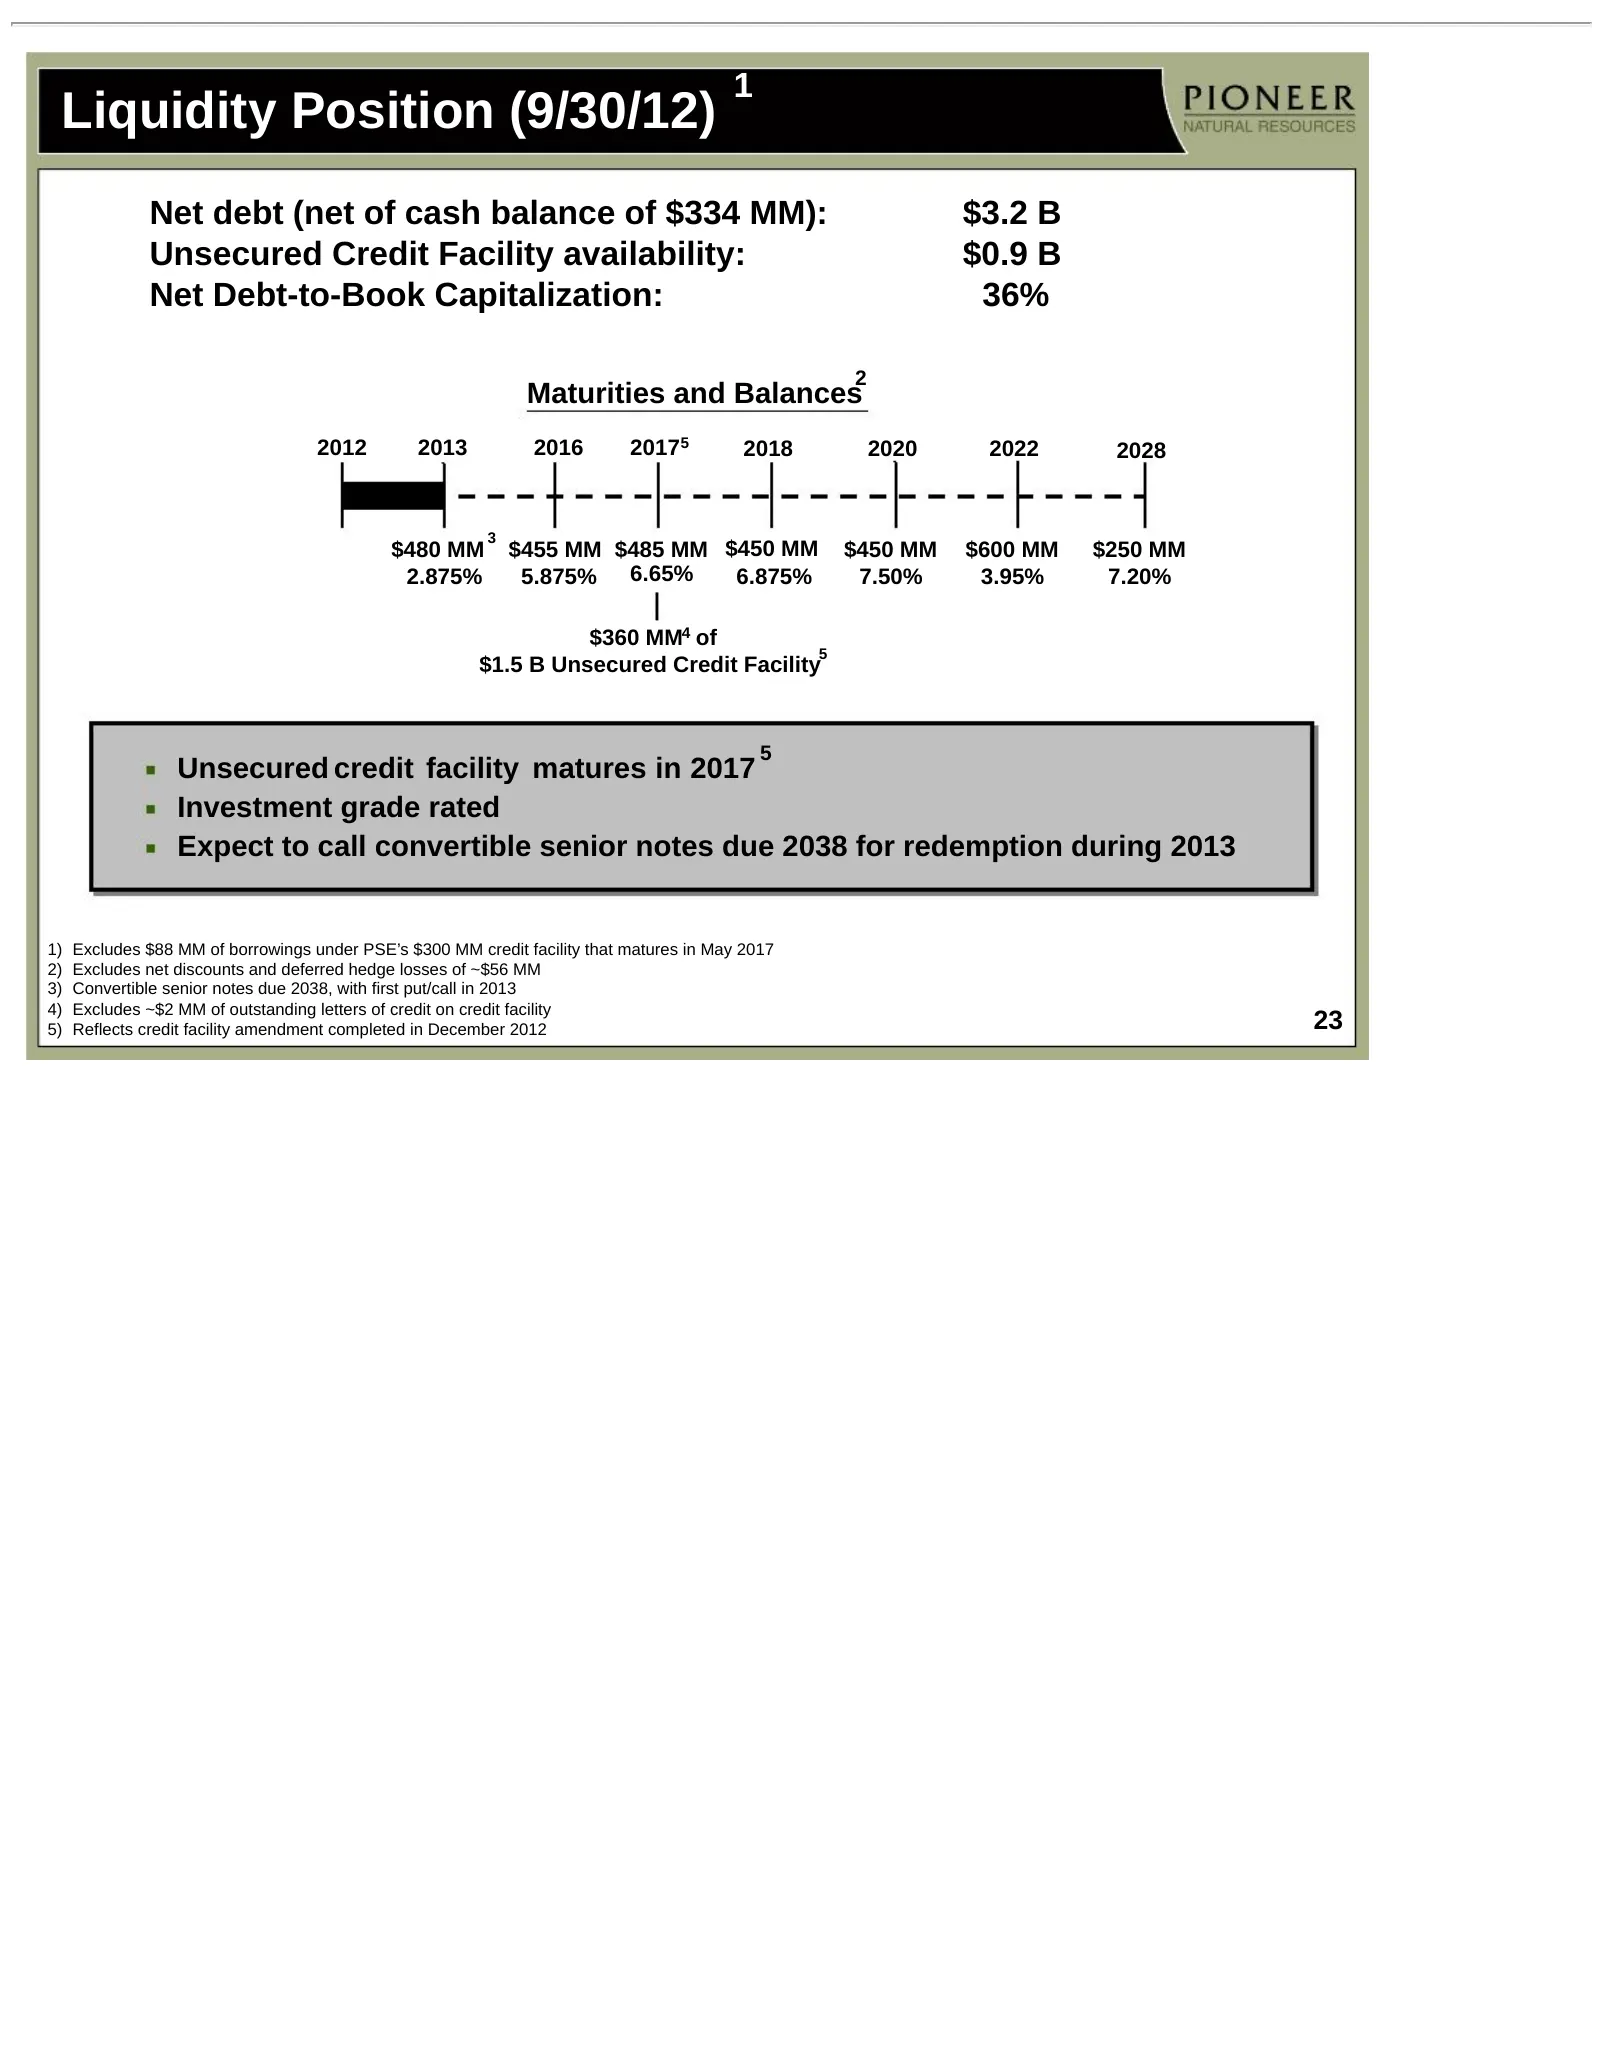
Slide 23: Liquidity Position (9/30/12)
1 Liquidity Position (9/30/12) Net debt (net of cash balance of $334 MM): $3.2 B Unsecured Credit Facility availability: $0.9 B Net Debt-to-Book Capitalization: 36% 2 Maturities and Balances 2012 2013 2016 20175 2018 2020 2022 2028 3 $480 MM $455 MM $485 MM $450 MM $450 MM $600 MM $250 MM 2.875% 5.8
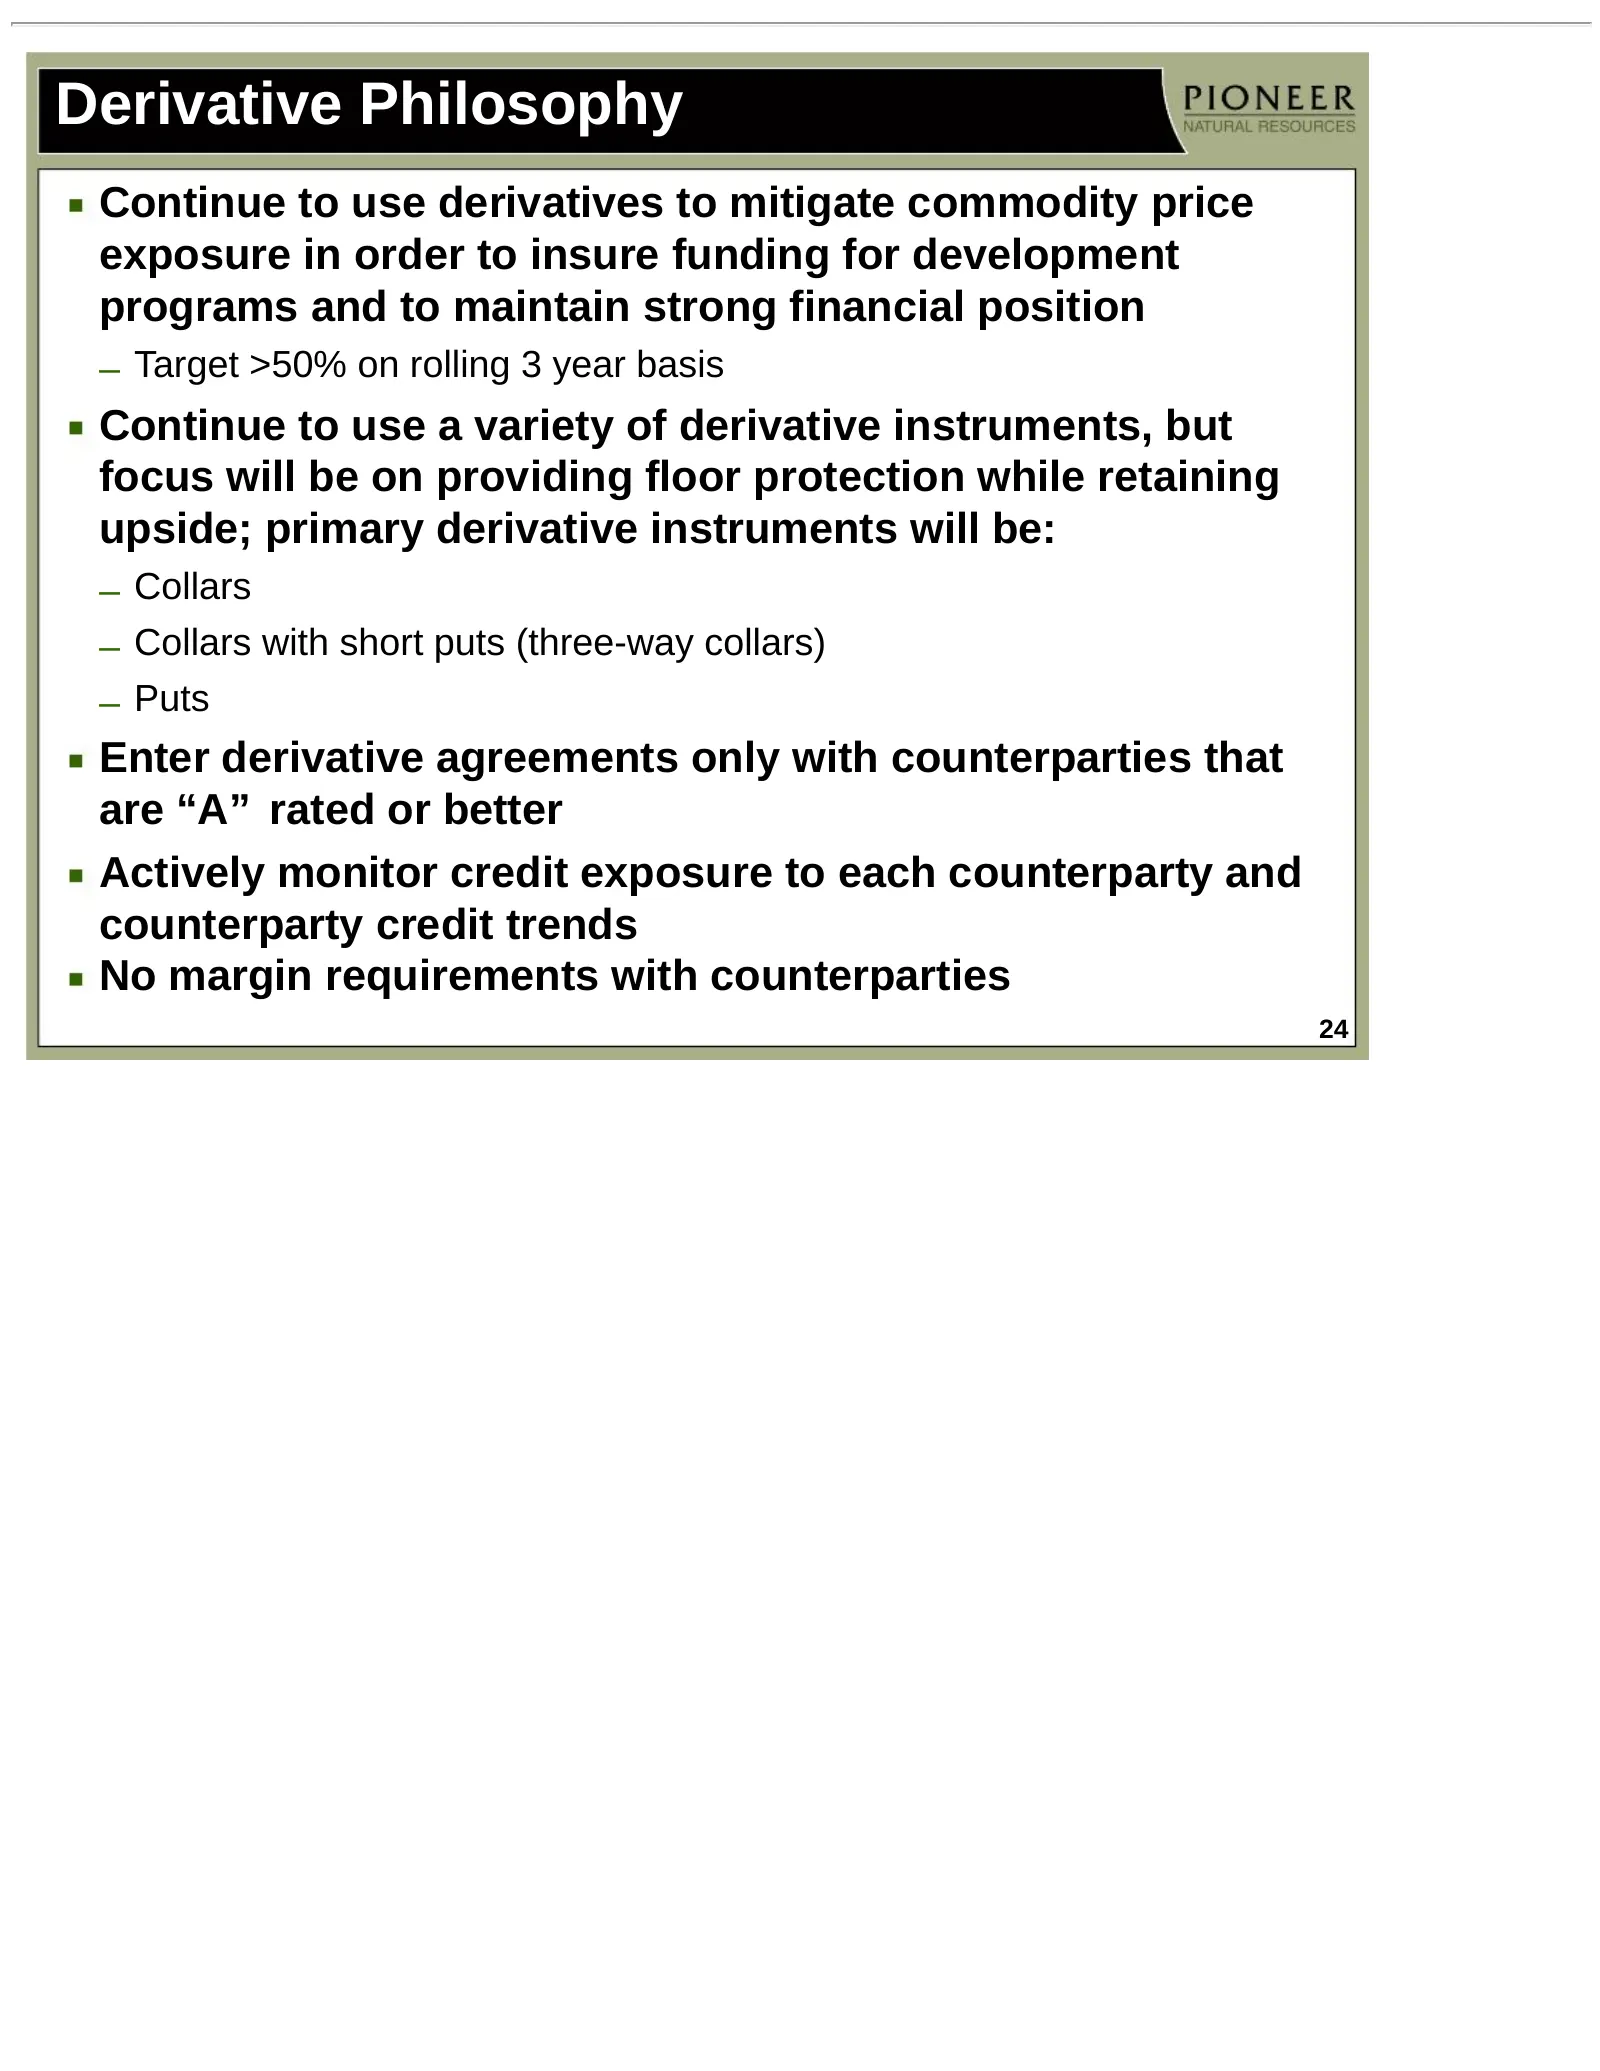
Slide 24: Derivative Philosophy
Derivative Philosophy Continue to use derivatives to mitigate commodity price exposure in order to insure funding for development programs and to maintain strong financial position – Target >50% on rolling 3 year basis Continue to use a variety of derivative instruments, but focus will be on providi
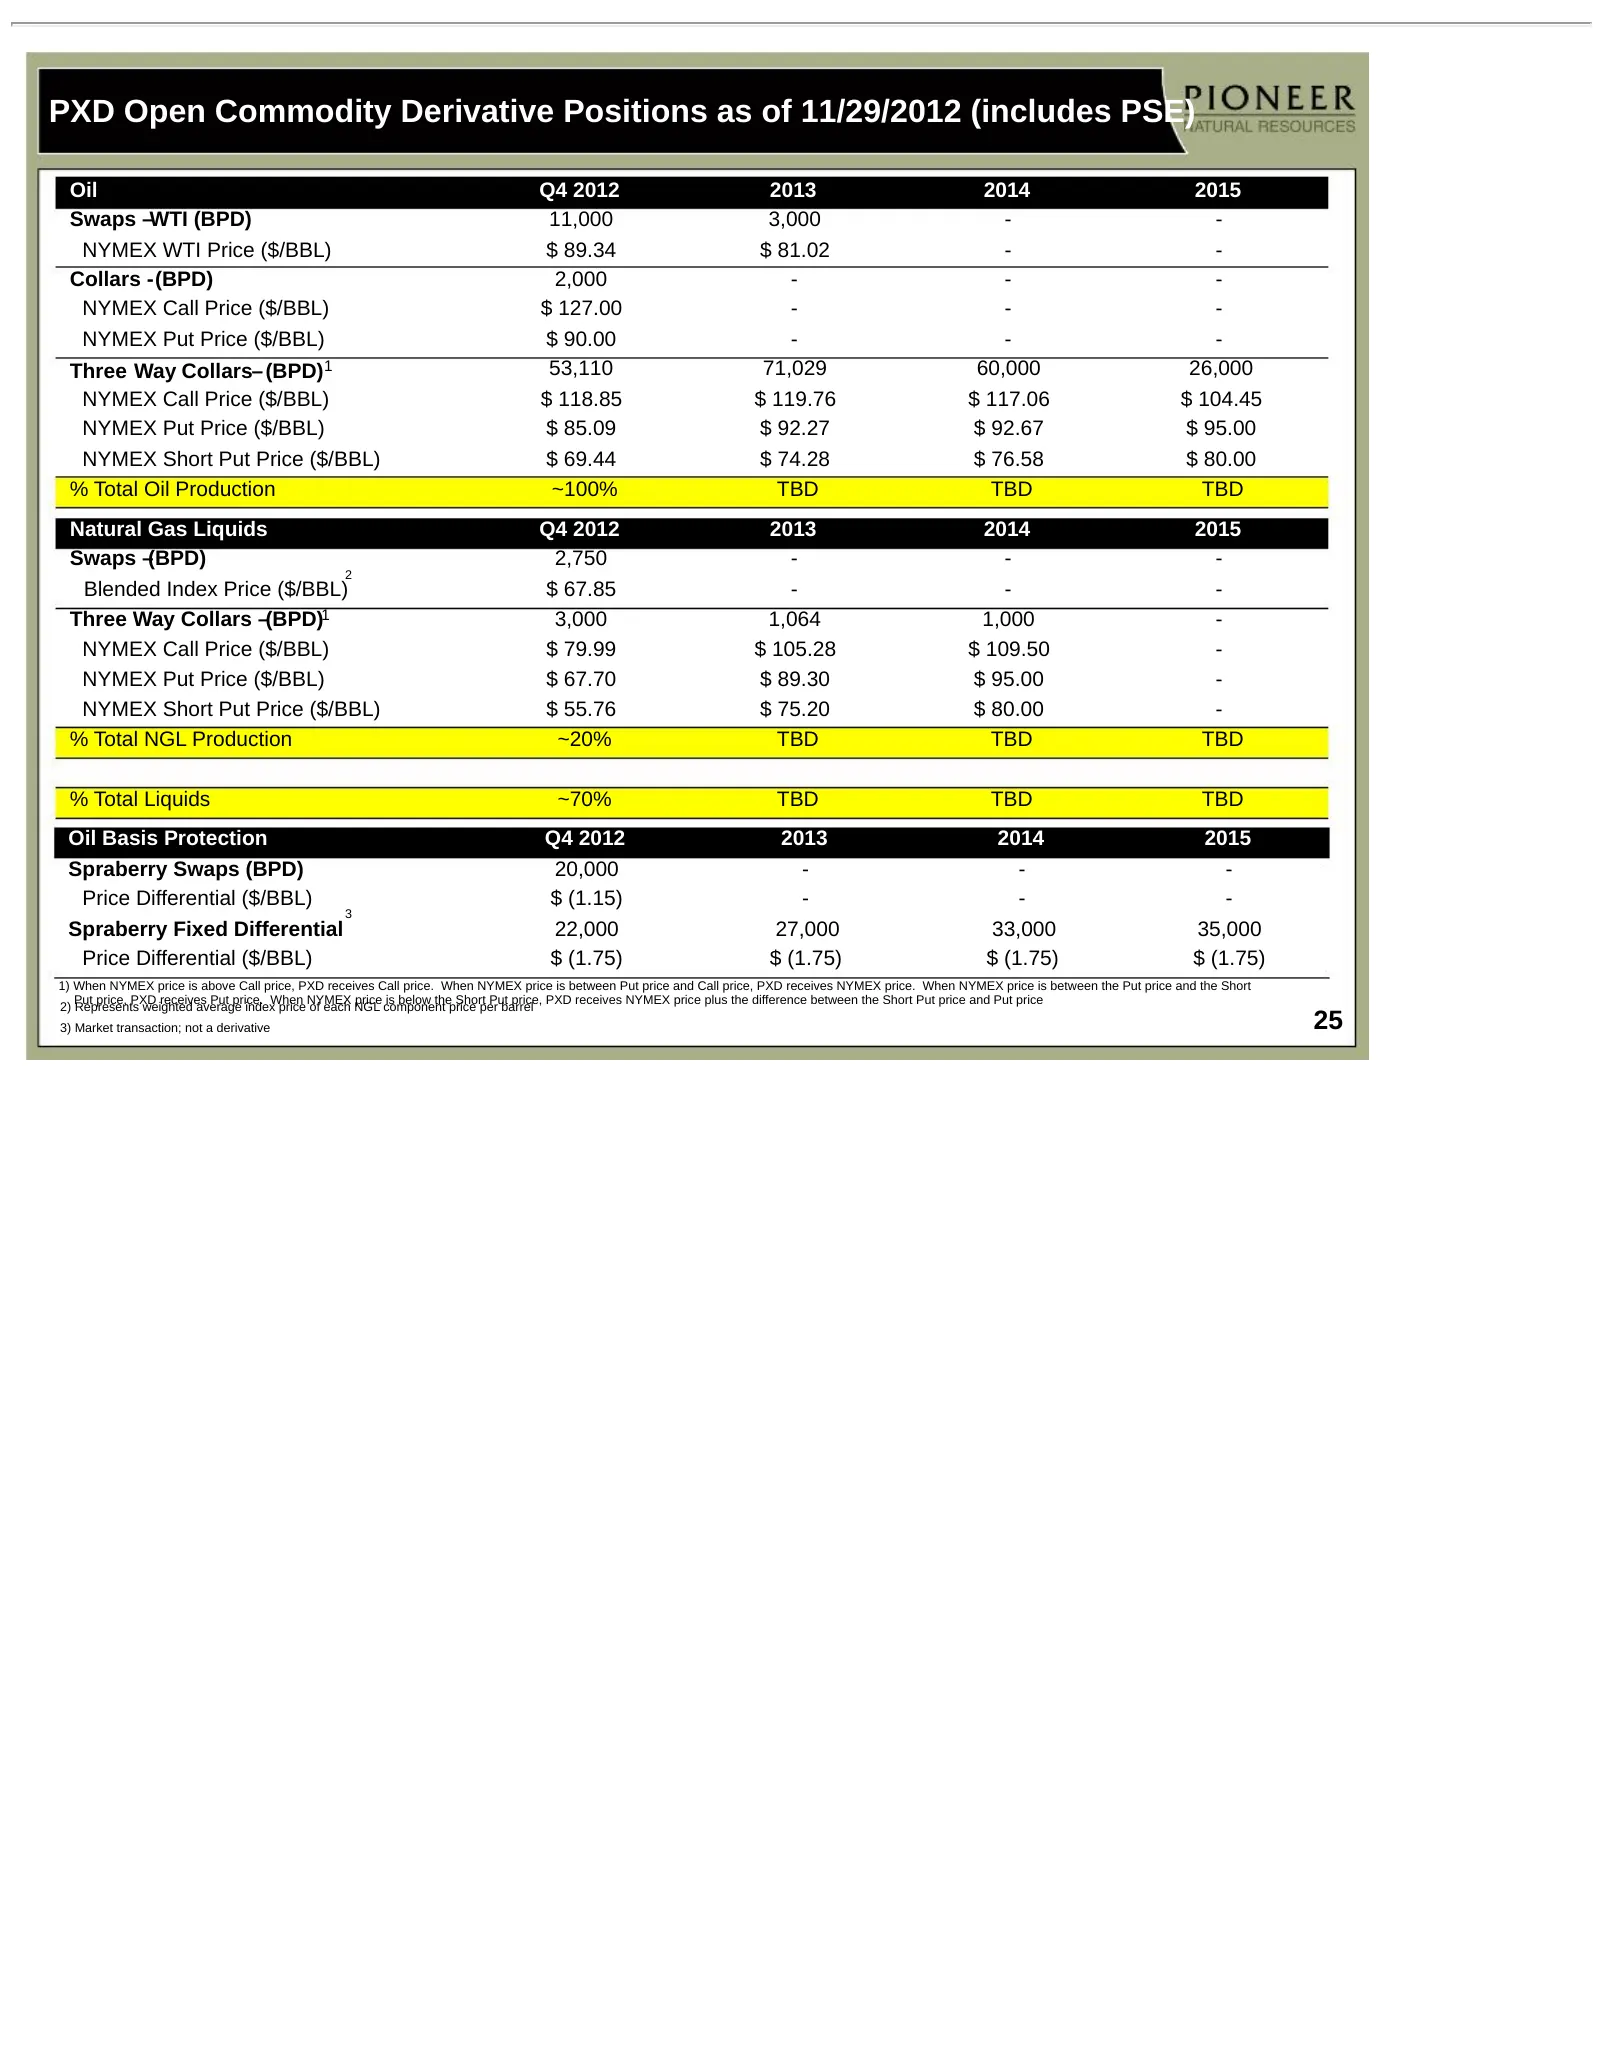
Slide 25: PXD Open Commodity Derivative Positions as of 11/29/2012
PXD Open Commodity Derivative Positions as of 11/29/2012 (includes PSE) Oil Q4 2012 2013 2014 2015 Swaps –WTI (BPD) 11,000 3,000 - - NYMEX WTI Price ($/BBL) $ 89.34 $ 81.02 - - Collars -(BPD) 2,000 - - - NYMEX Call Price ($/BBL) $ 127.00 - - - NYMEX Put Price ($/BBL) $ 90.00 - - - Three Way Collars–
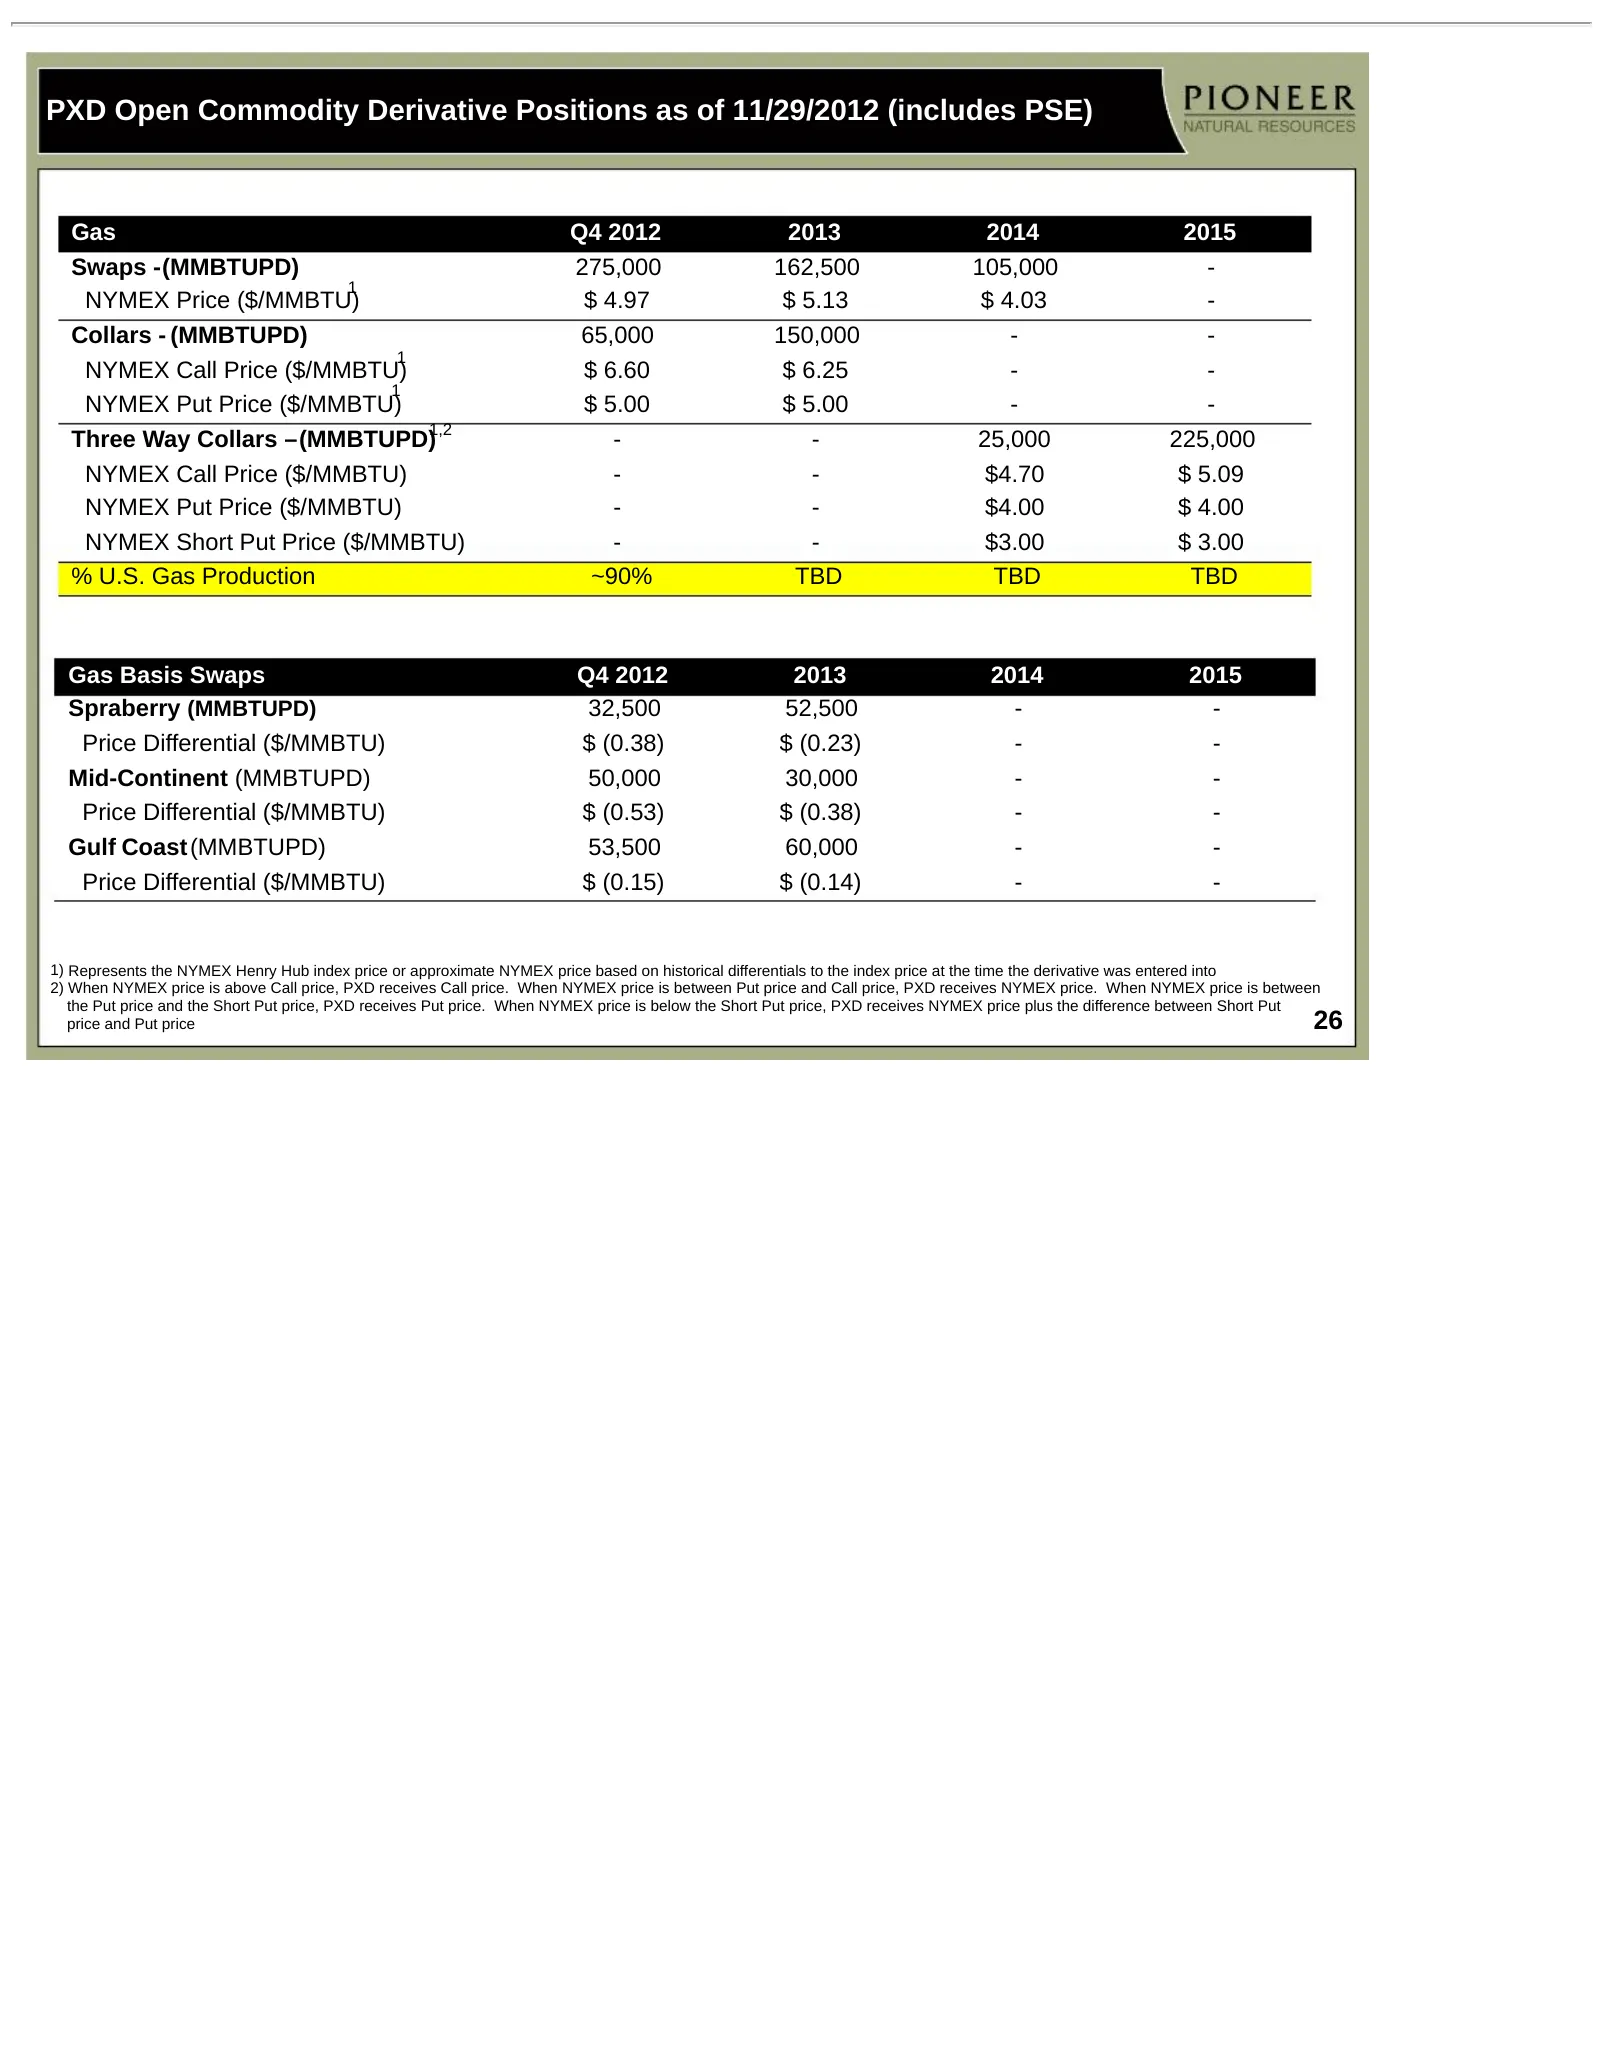
Slide 26: PXD Open Commodity Derivative Positions as of 11/29/2012
PXD Open Commodity Derivative Positions as of 11/29/2012 (includes PSE) Gas Q4 2012 2013 2014 2015 Swaps -(MMBTUPD) 275,000 162,500 105,000 - 1 NYMEX Price ($/MMBTU) $ 4.97 $ 5.13 $ 4.03 - Collars - (MMBTUPD) 65,000 150,000 - - 1 NYMEX Call Price ($/MMBTU) $ 6.60 $ 6.25 - - 1 NYMEX Put Price ($/MMBT
Slide 27: PSE Derivative Position as of 11/29/2012
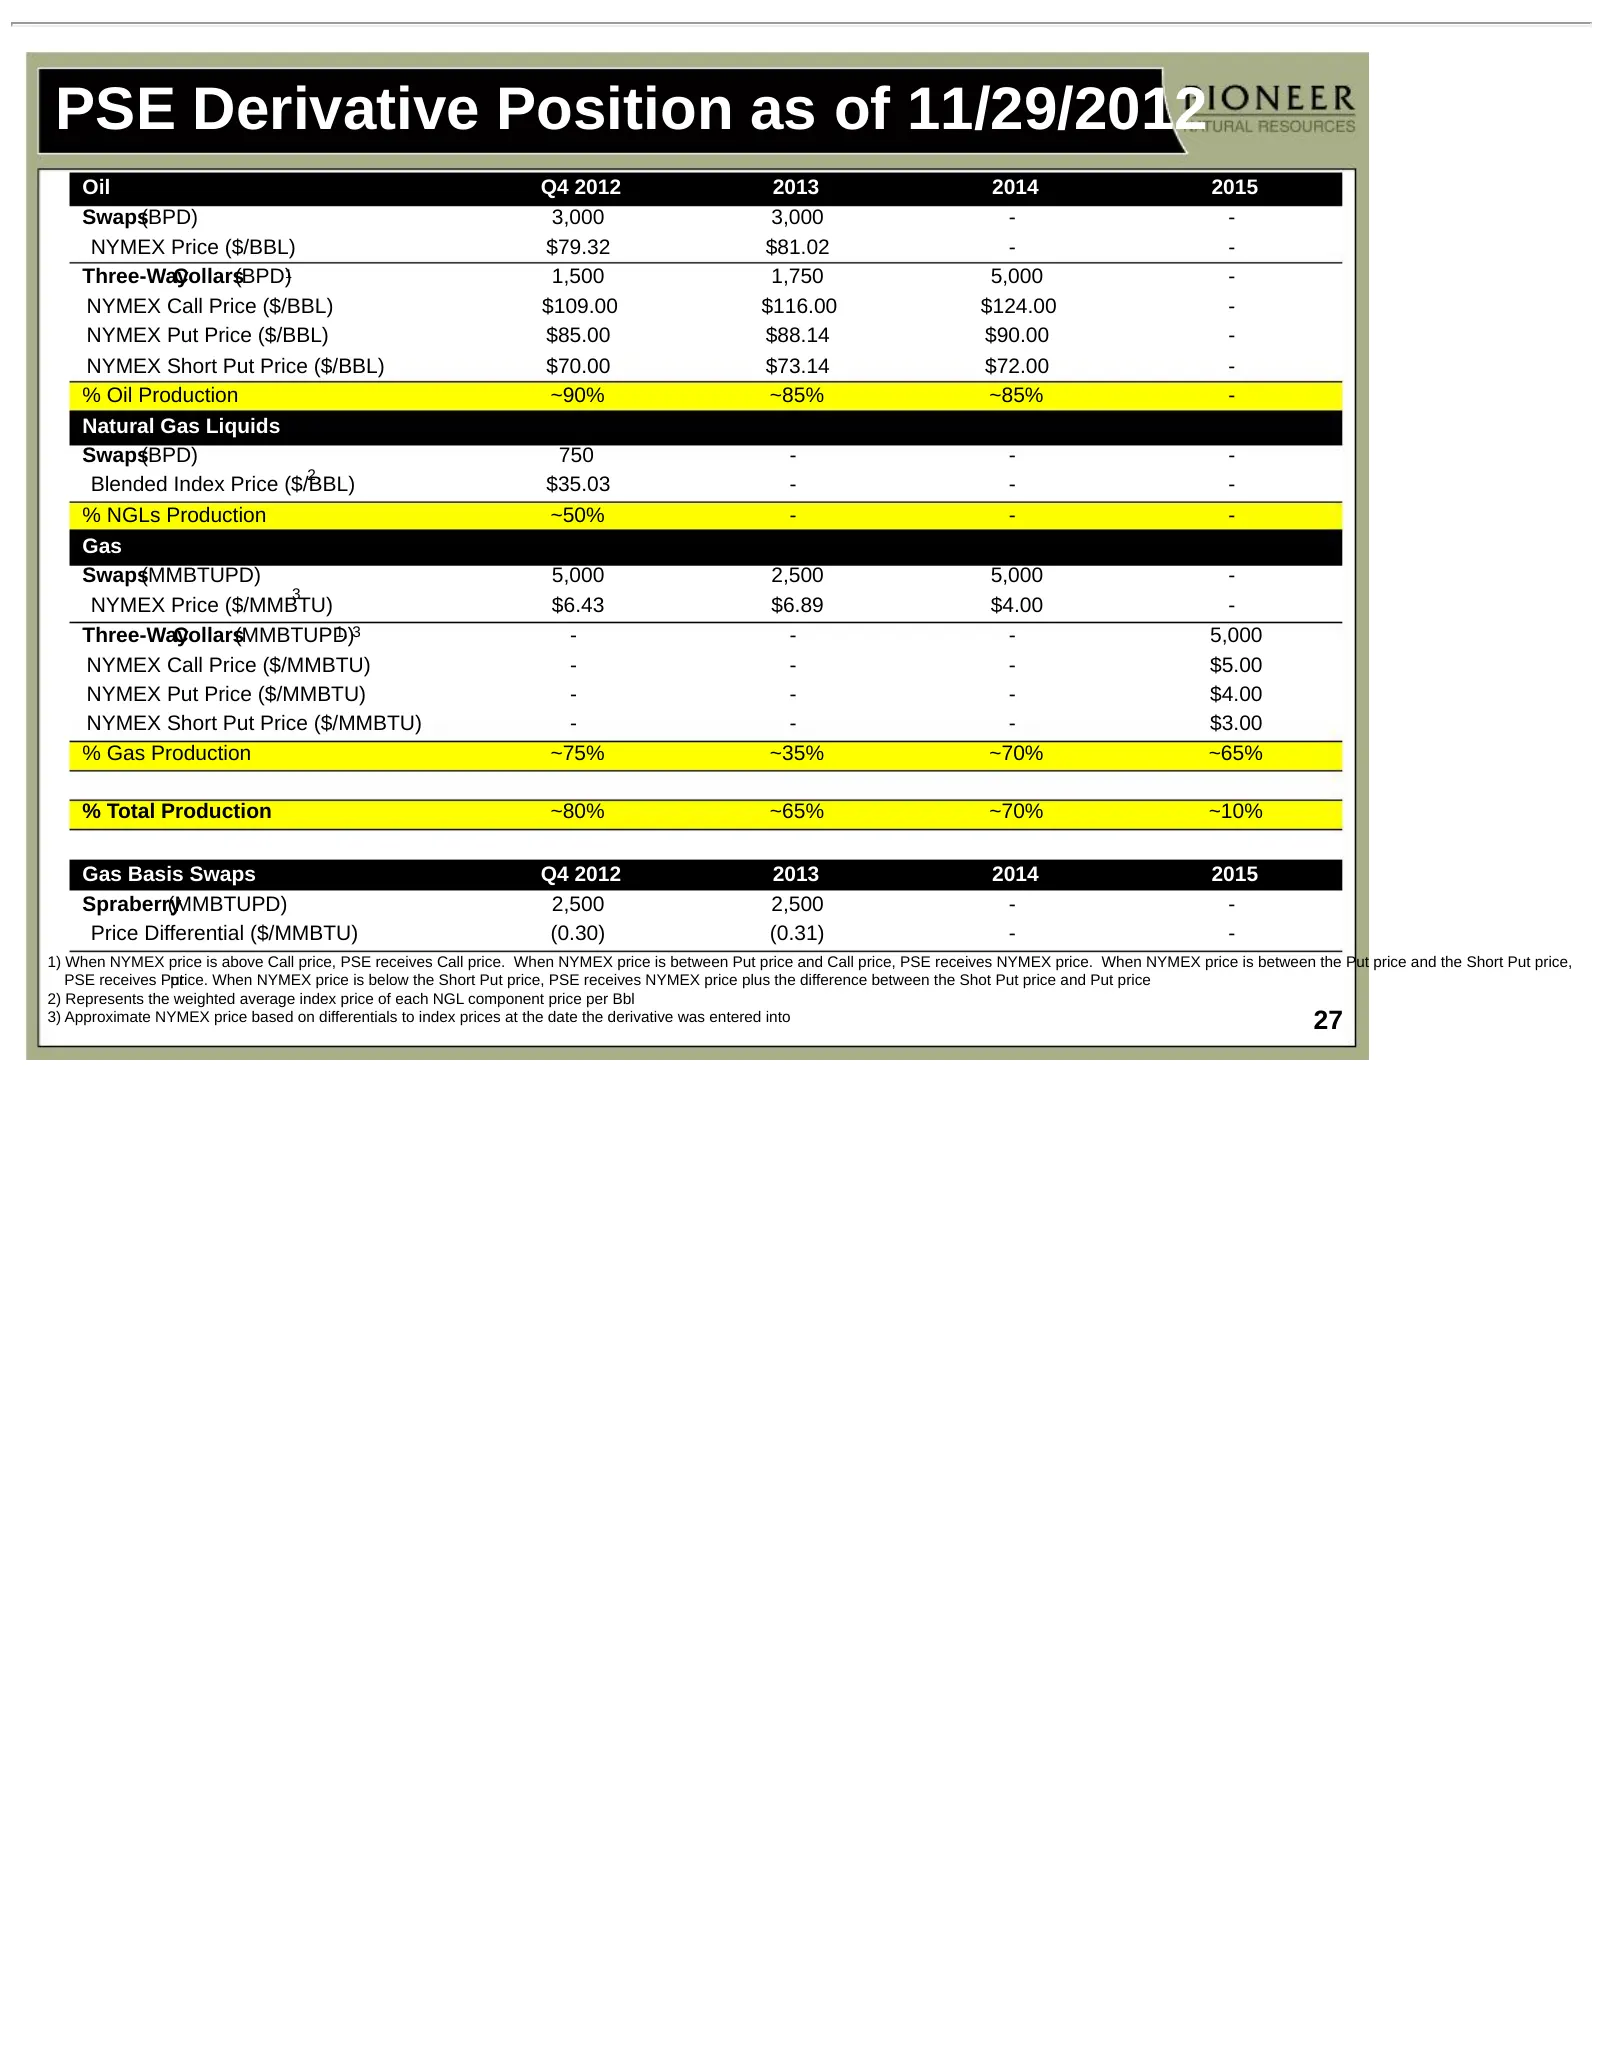
PSE Derivative Position as of 11/29/2012 Oil Q4 2012 2013 2014 2015 Swaps(BPD) 3,000 3,000 - - NYMEX Price ($/BBL) $79.32 $81.02 - - Three-WayCollars(BPD)1 1,500 1,750 5,000 - NYMEX Call Price ($/BBL) $109.00 $116.00 $124.00 - NYMEX Put Price ($/BBL) $85.00 $88.14 $90.00 - NYMEX Short Put Price ($/B
Slide 28: Three-Way Collars ($75 by $90 by $135 example)
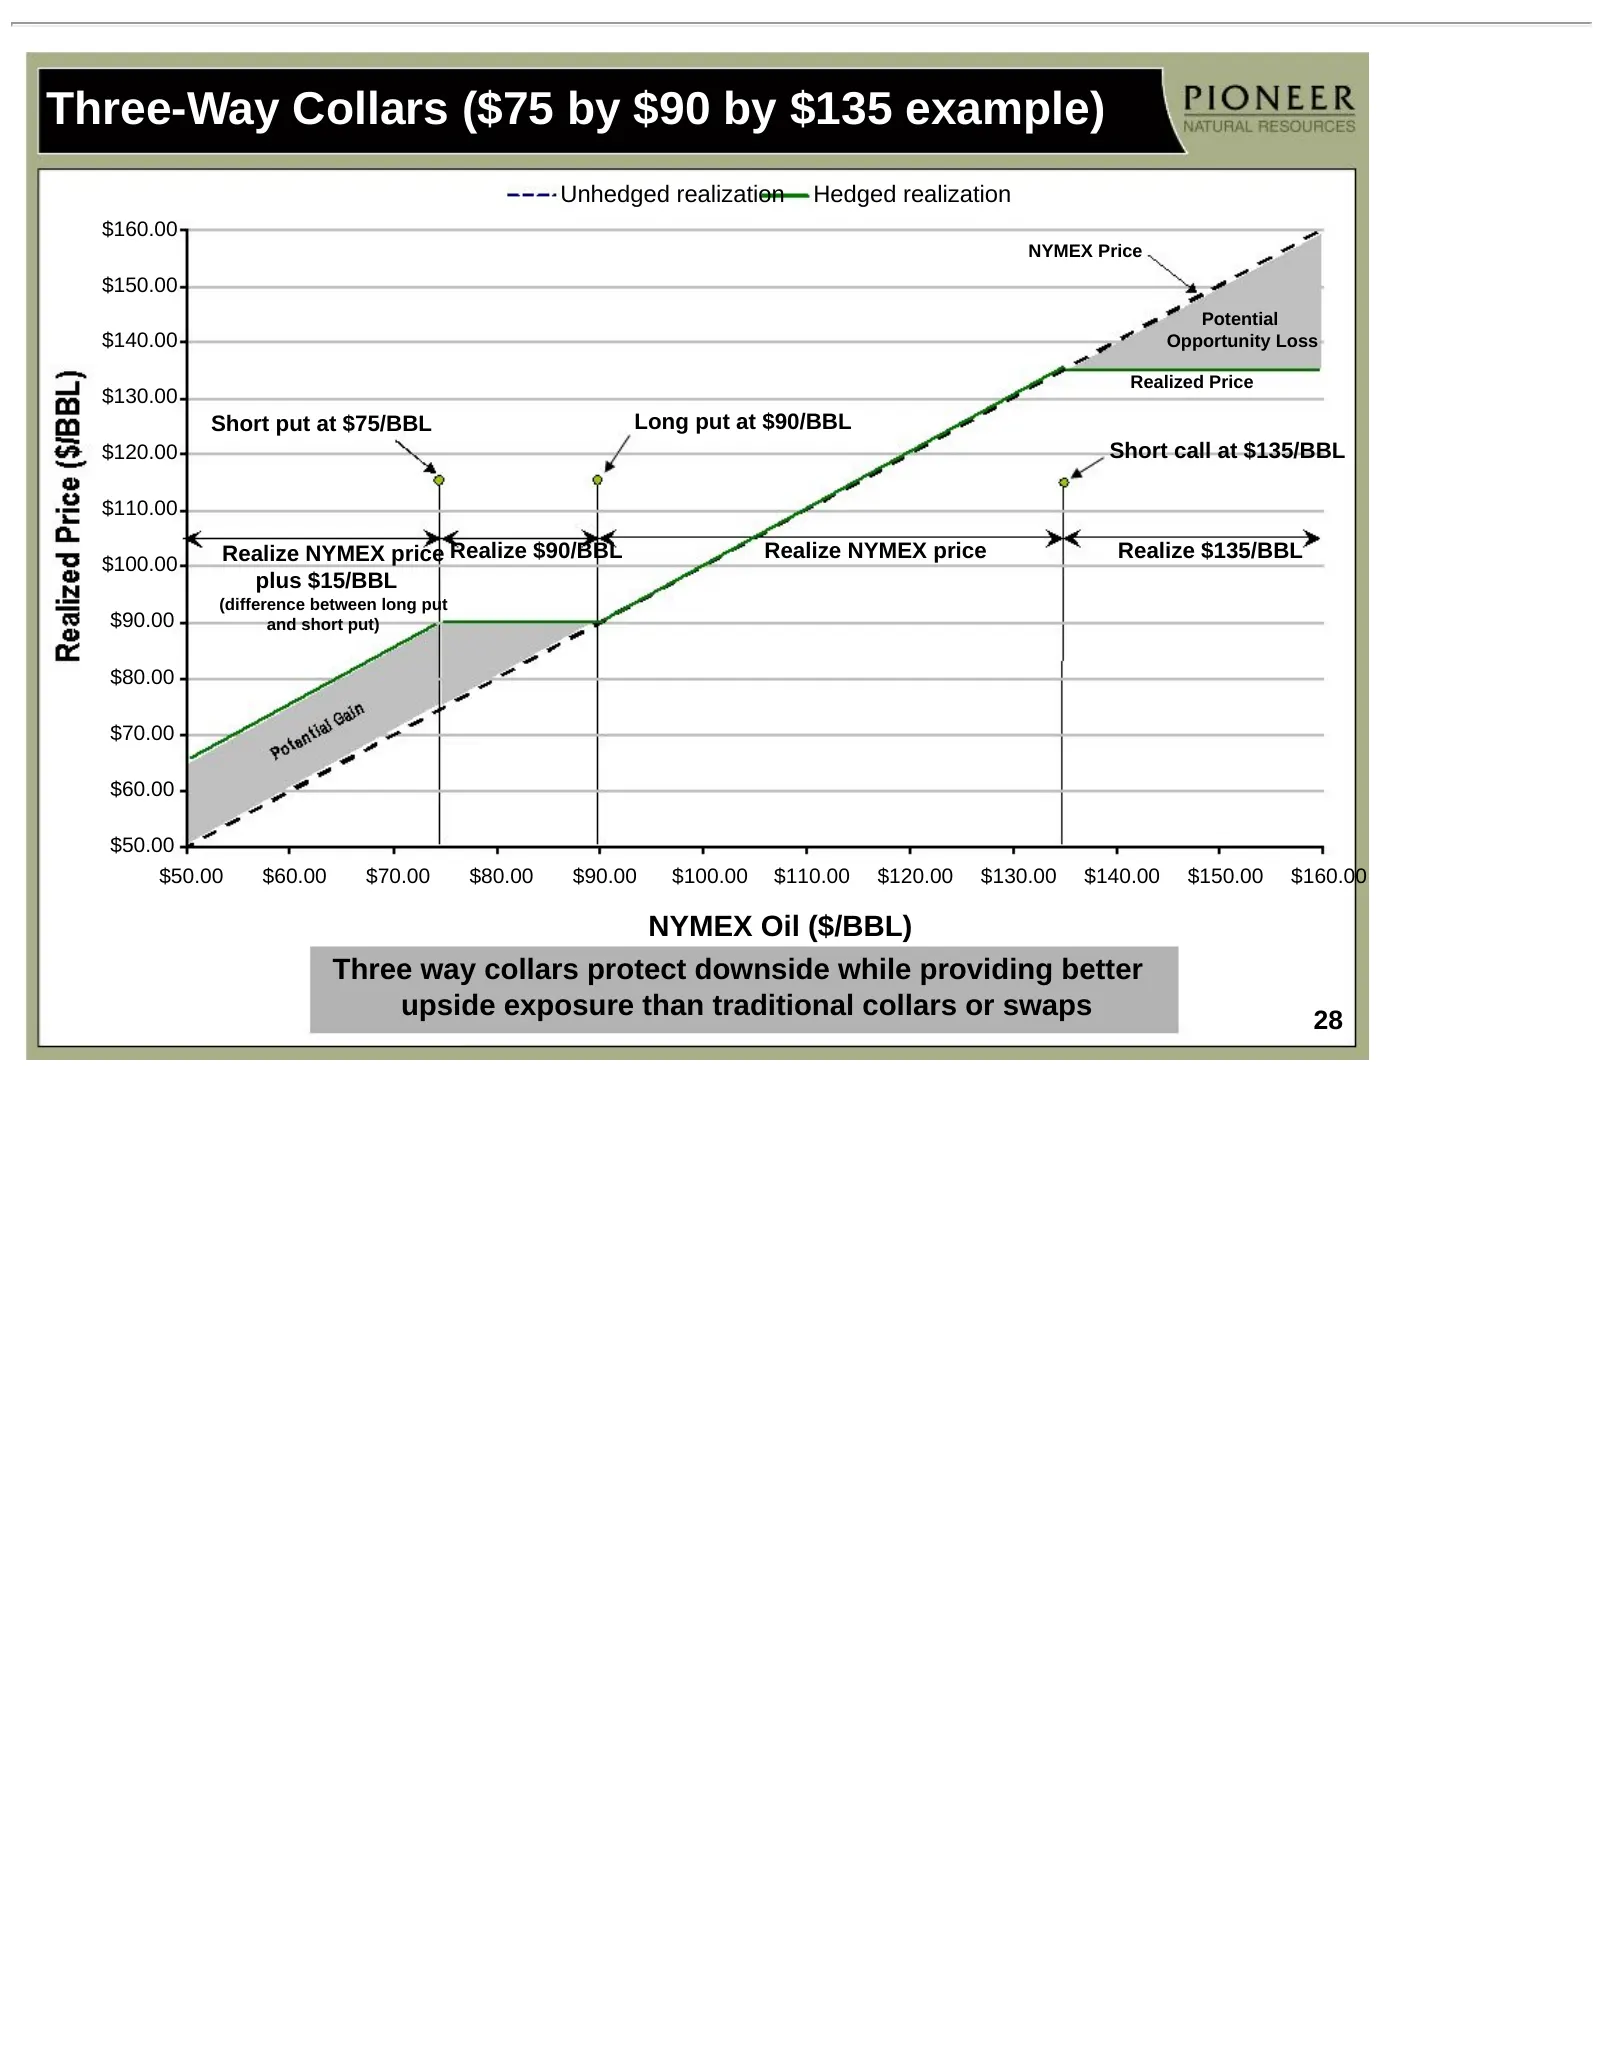
Three-Way Collars ($75 by $90 by $135 example) Unhedged realization Hedged realization $160.00 NYMEX Price $150.00 Potential $140.00 Opportunity Loss Realized Price $130.00 Short put at $75/BBL Long put at $90/BBL $120.00 Short call at $135/BBL $110.00 $100.00 Realize NYMEX price Realize $90/BBL Rea
Slide 29: PXD's Vertical Integration Reduces Costs and Enhances Execution
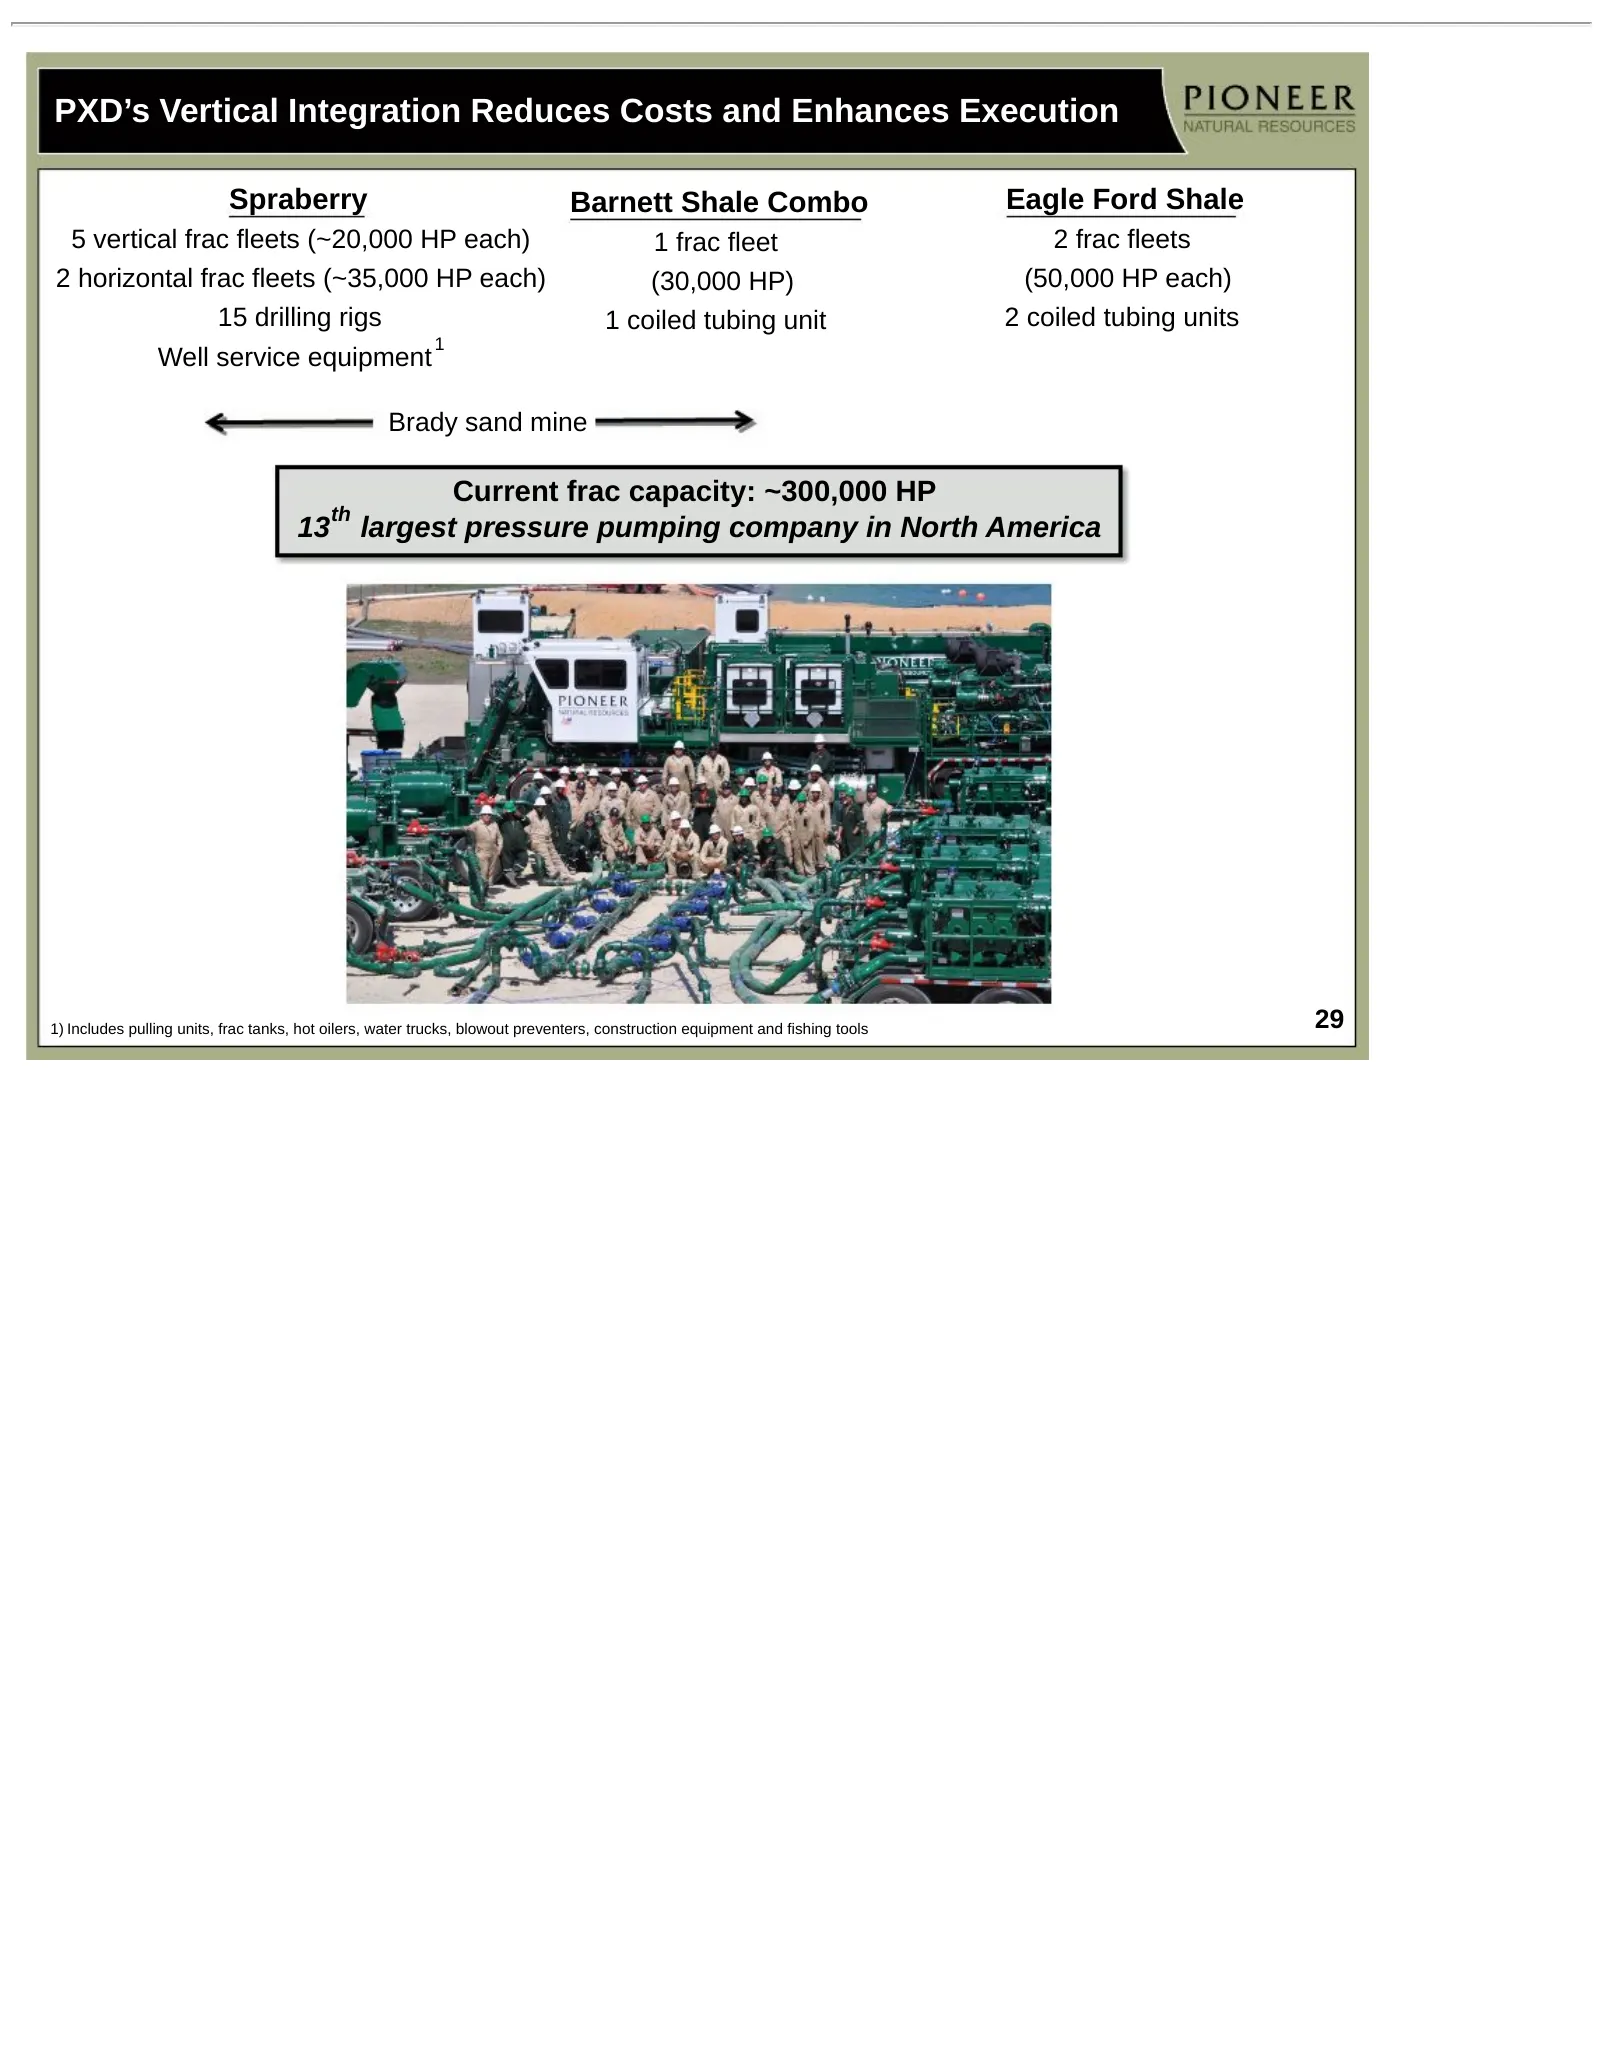
PXD’s Vertical Integration Reduces Costs and Enhances Execution Spraberry Barnett Shale Combo Eagle Ford Shale 5 vertical frac fleets (~20,000 HP each) 1 frac fleet 2 frac fleets 2 horizontal frac fleets (~35,000 HP each) (30,000 HP) (50,000 HP each) 15 drilling rigs 1 coiled tubing unit 2 coiled tu
Slide 30: Geologic Provinces of the Permian Basin
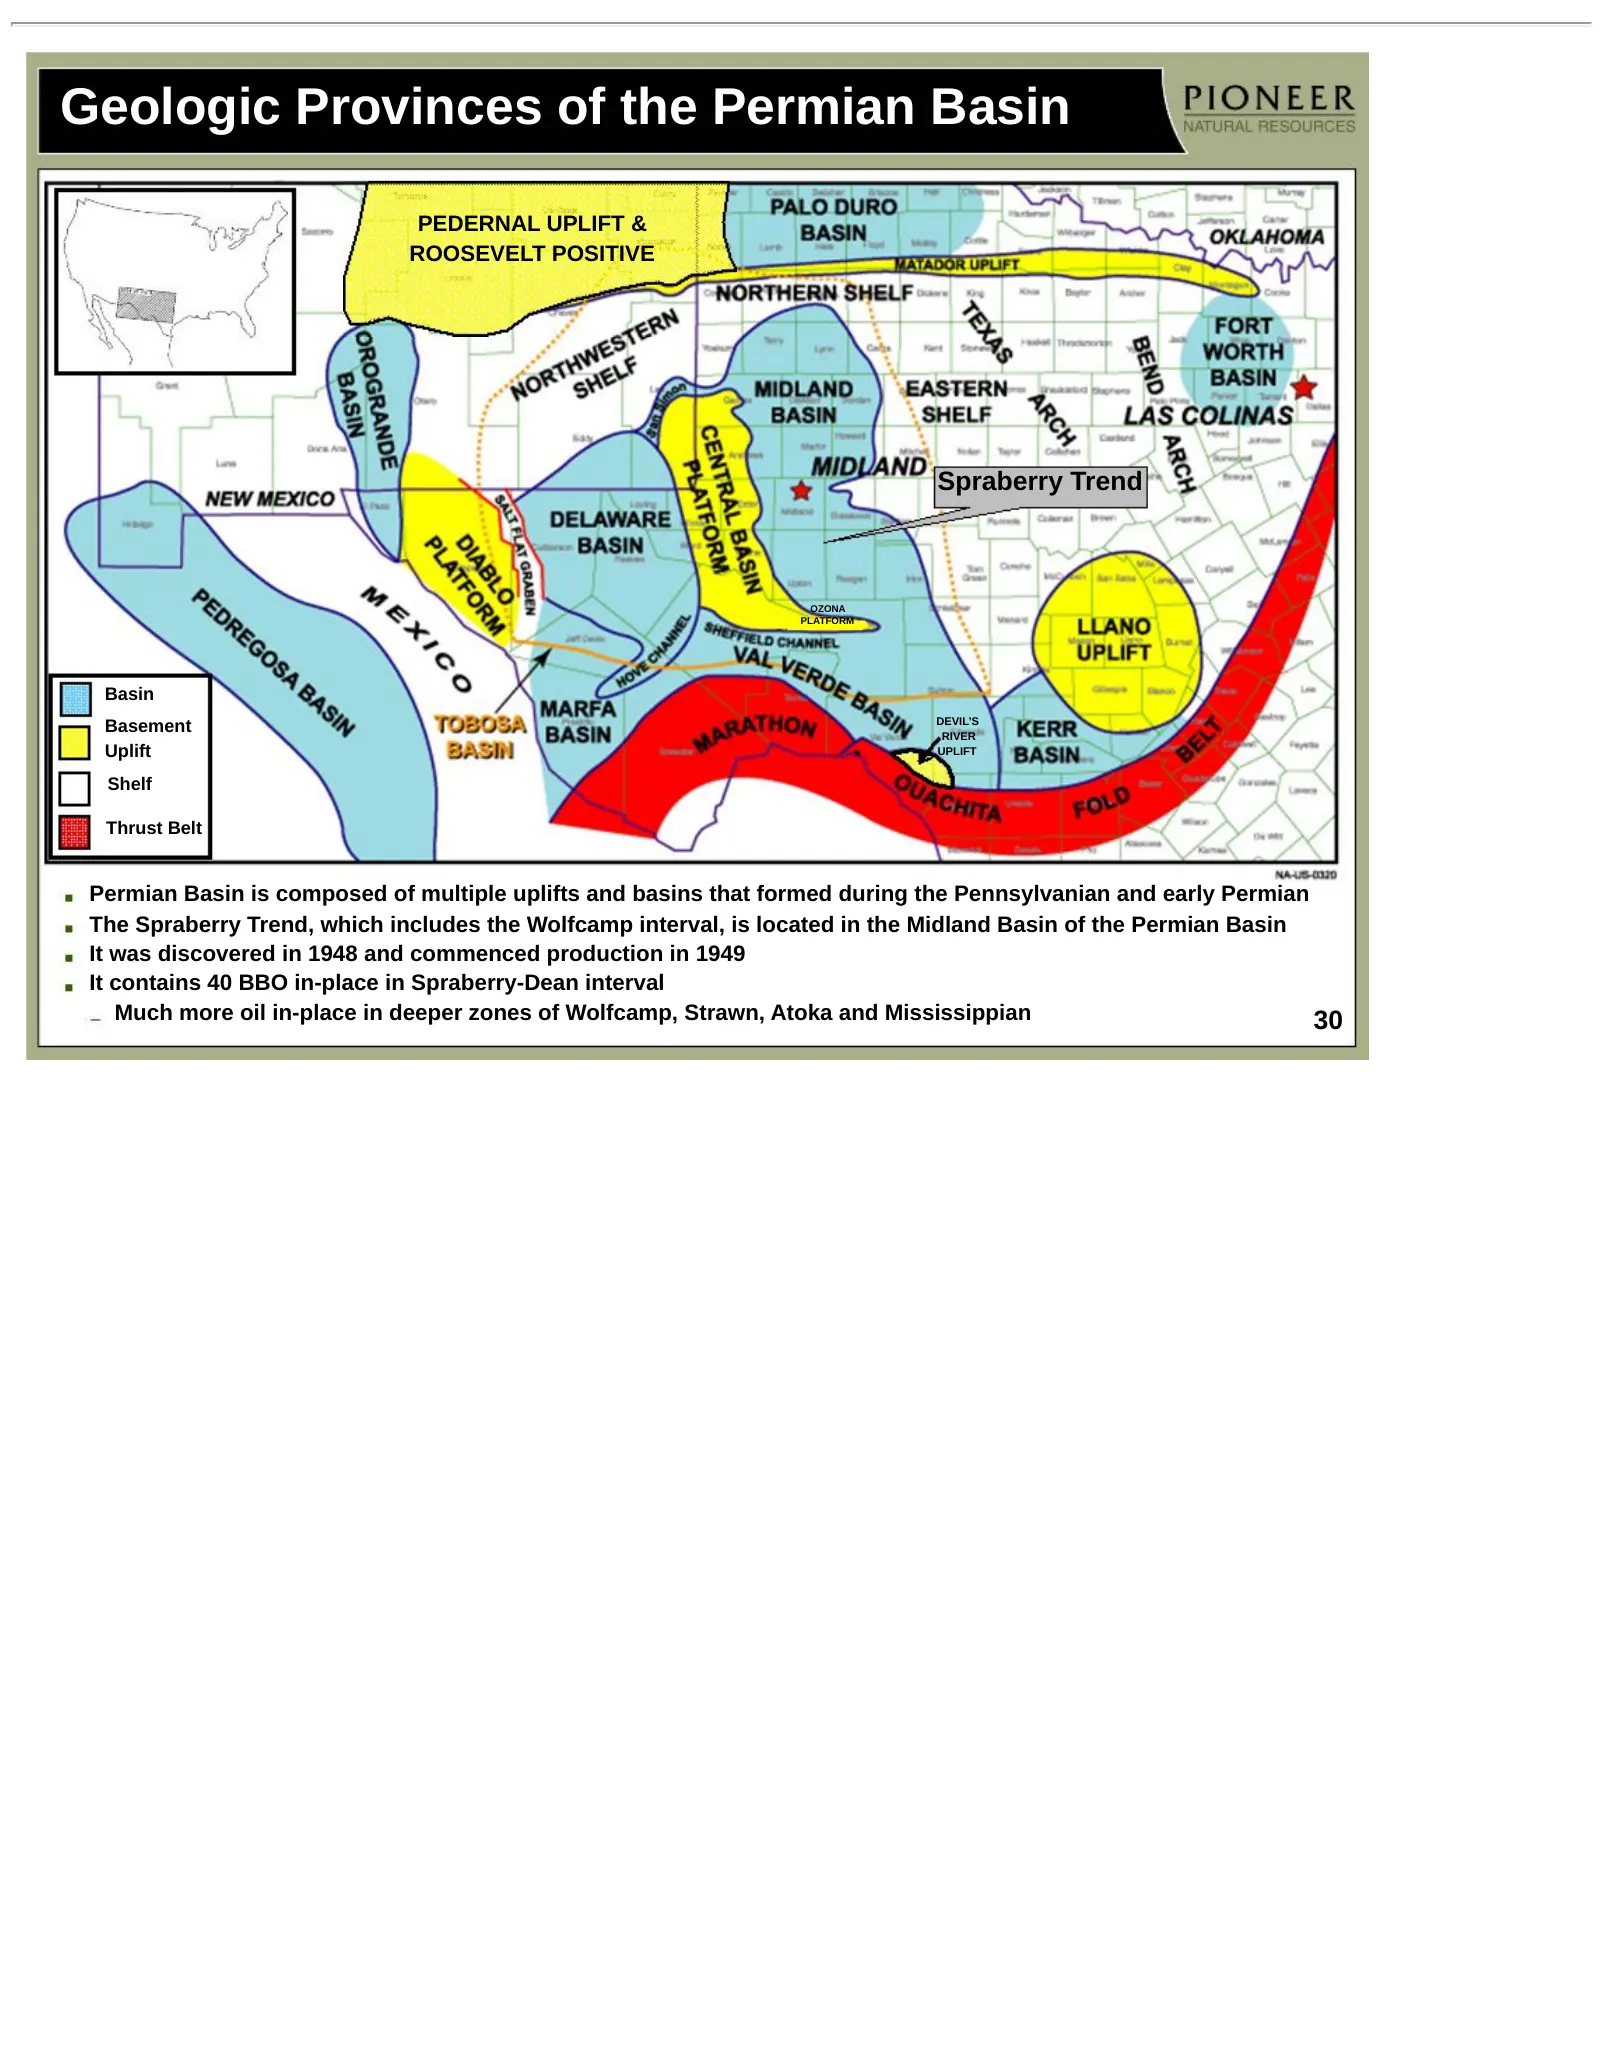
Geologic Provinces of the Permian Basin PEDERNAL UPLIFT & ROOSEVELT POSITIVE Spraberry Trend OZONA PLATFORM Basin DEVIL’S Basement RIVER Uplift UPLIFT Shelf Thrust Belt Permian Basin is composed of multiple uplifts and basins that formed during the Pennsylvanian and early Permian The Spraberry Trend
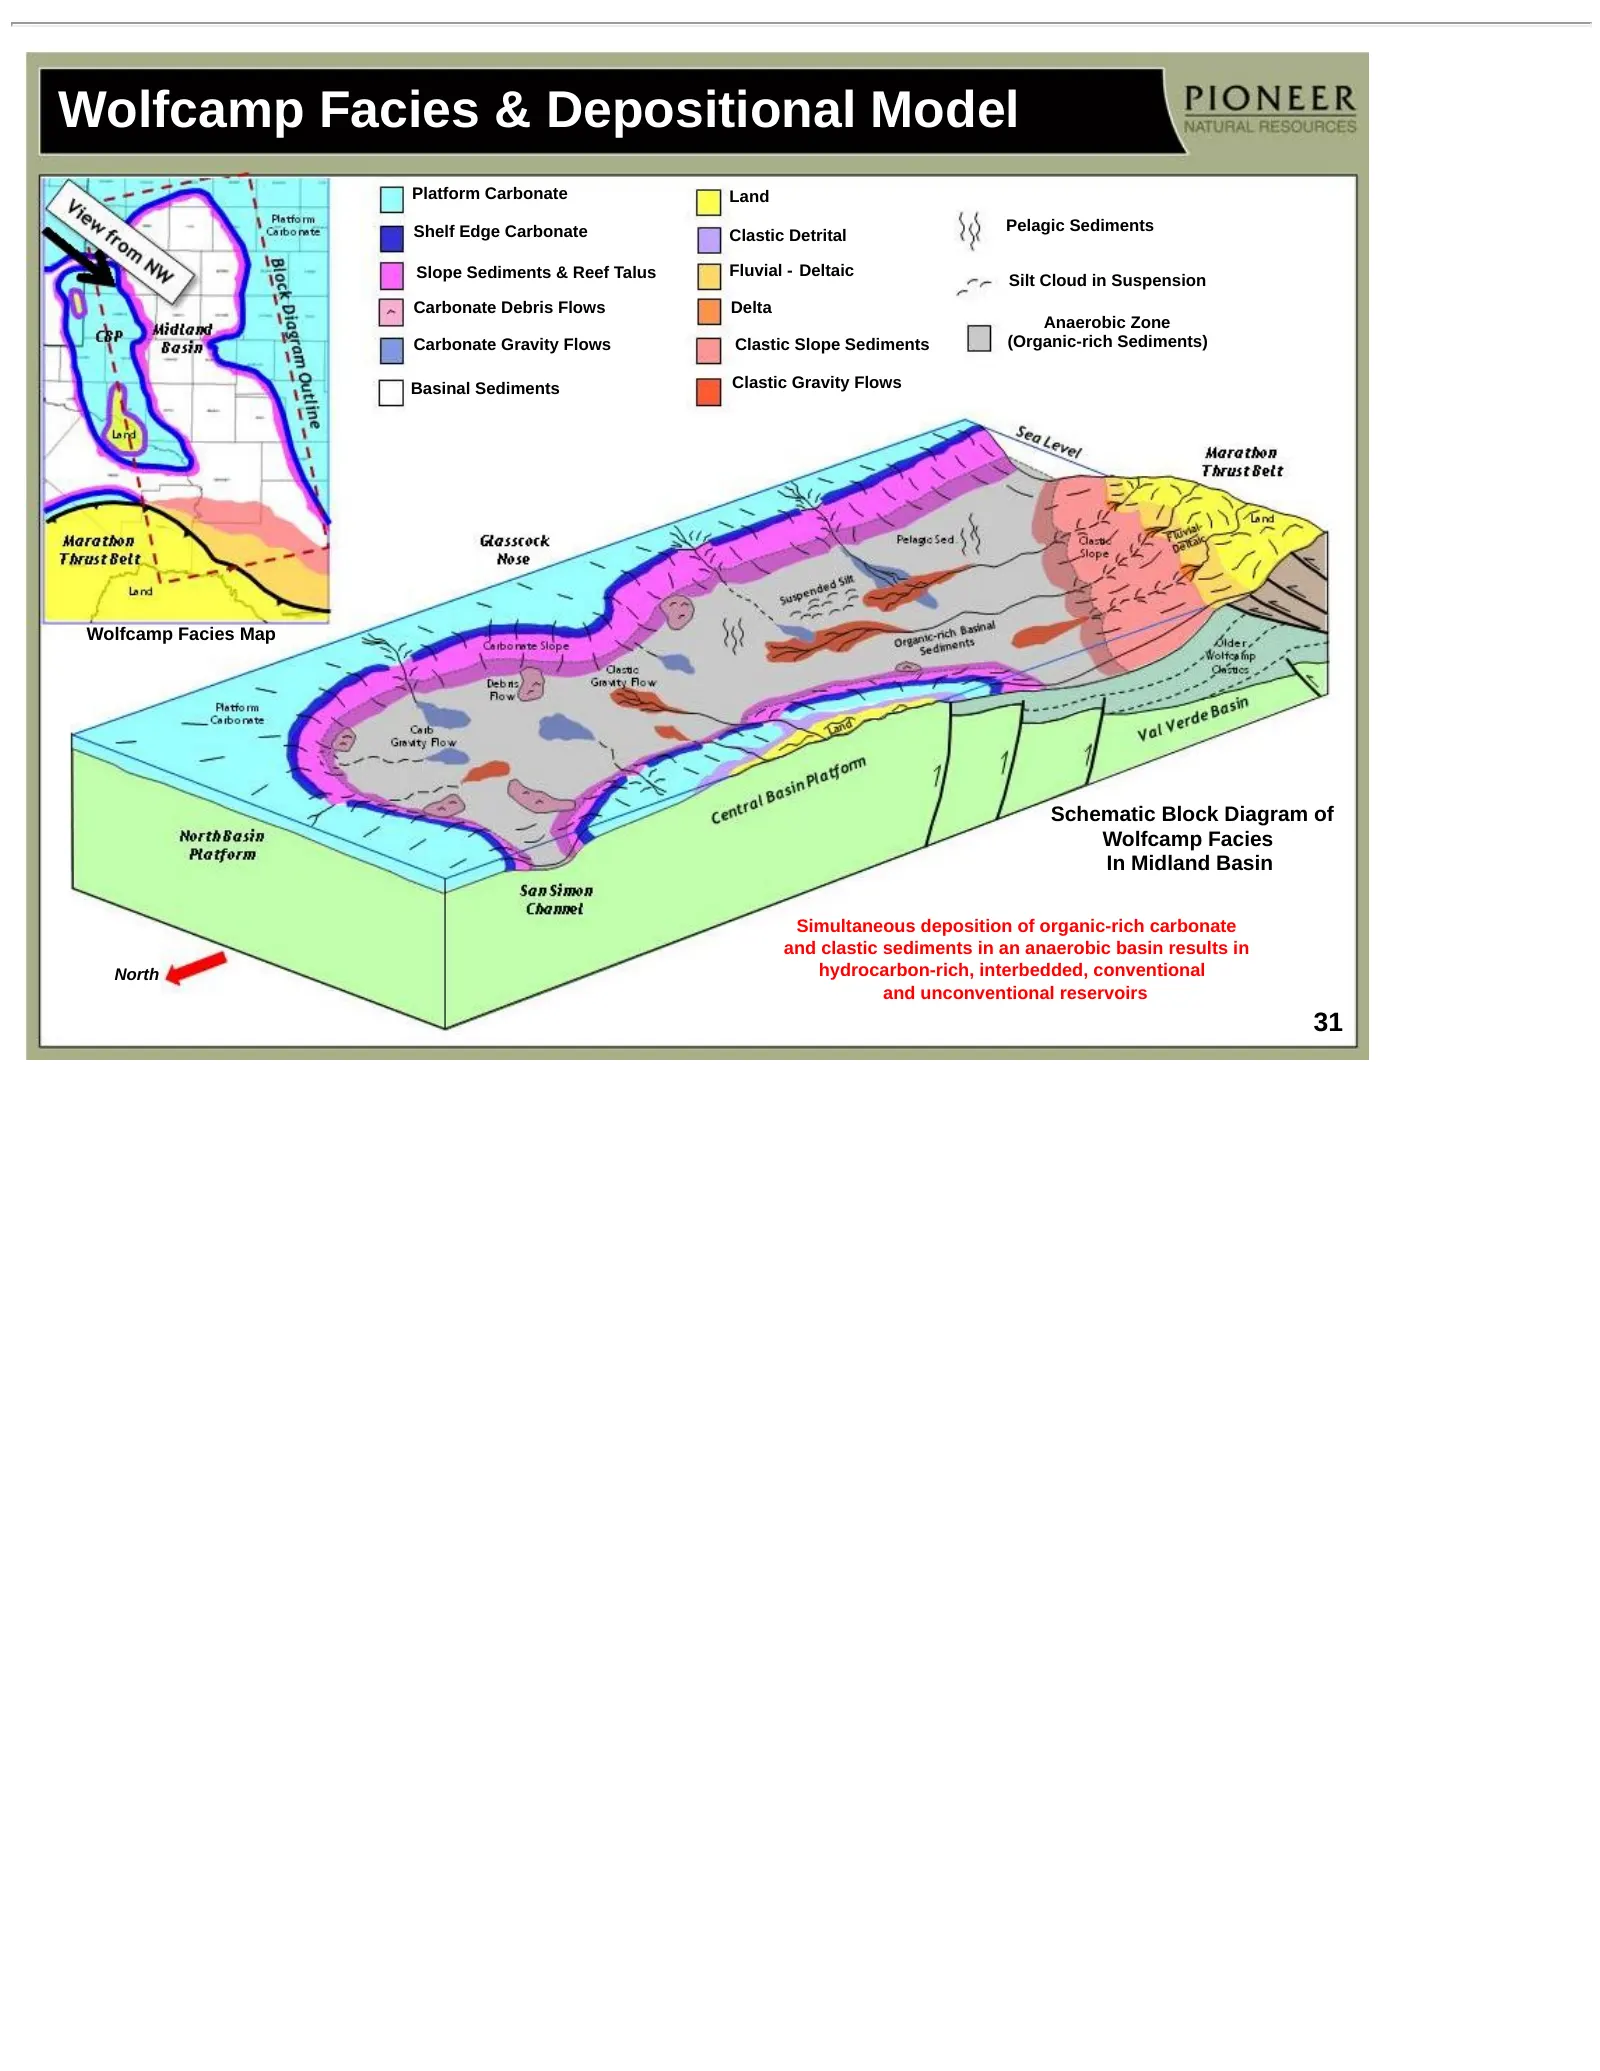
Slide 31: Wolfcamp Facies & Depositional Model
Wolfcamp Facies & Depositional Model Platform Carbonate Land Shelf Edge Carbonate Pelagic Sediments Clastic Detrital Slope Sediments & Reef Talus Fluvial - Deltaic Silt Cloud in Suspension Carbonate Debris Flows Delta Anaerobic Zone Carbonate Gravity Flows Clastic Slope Sediments (Organic-rich Sedim
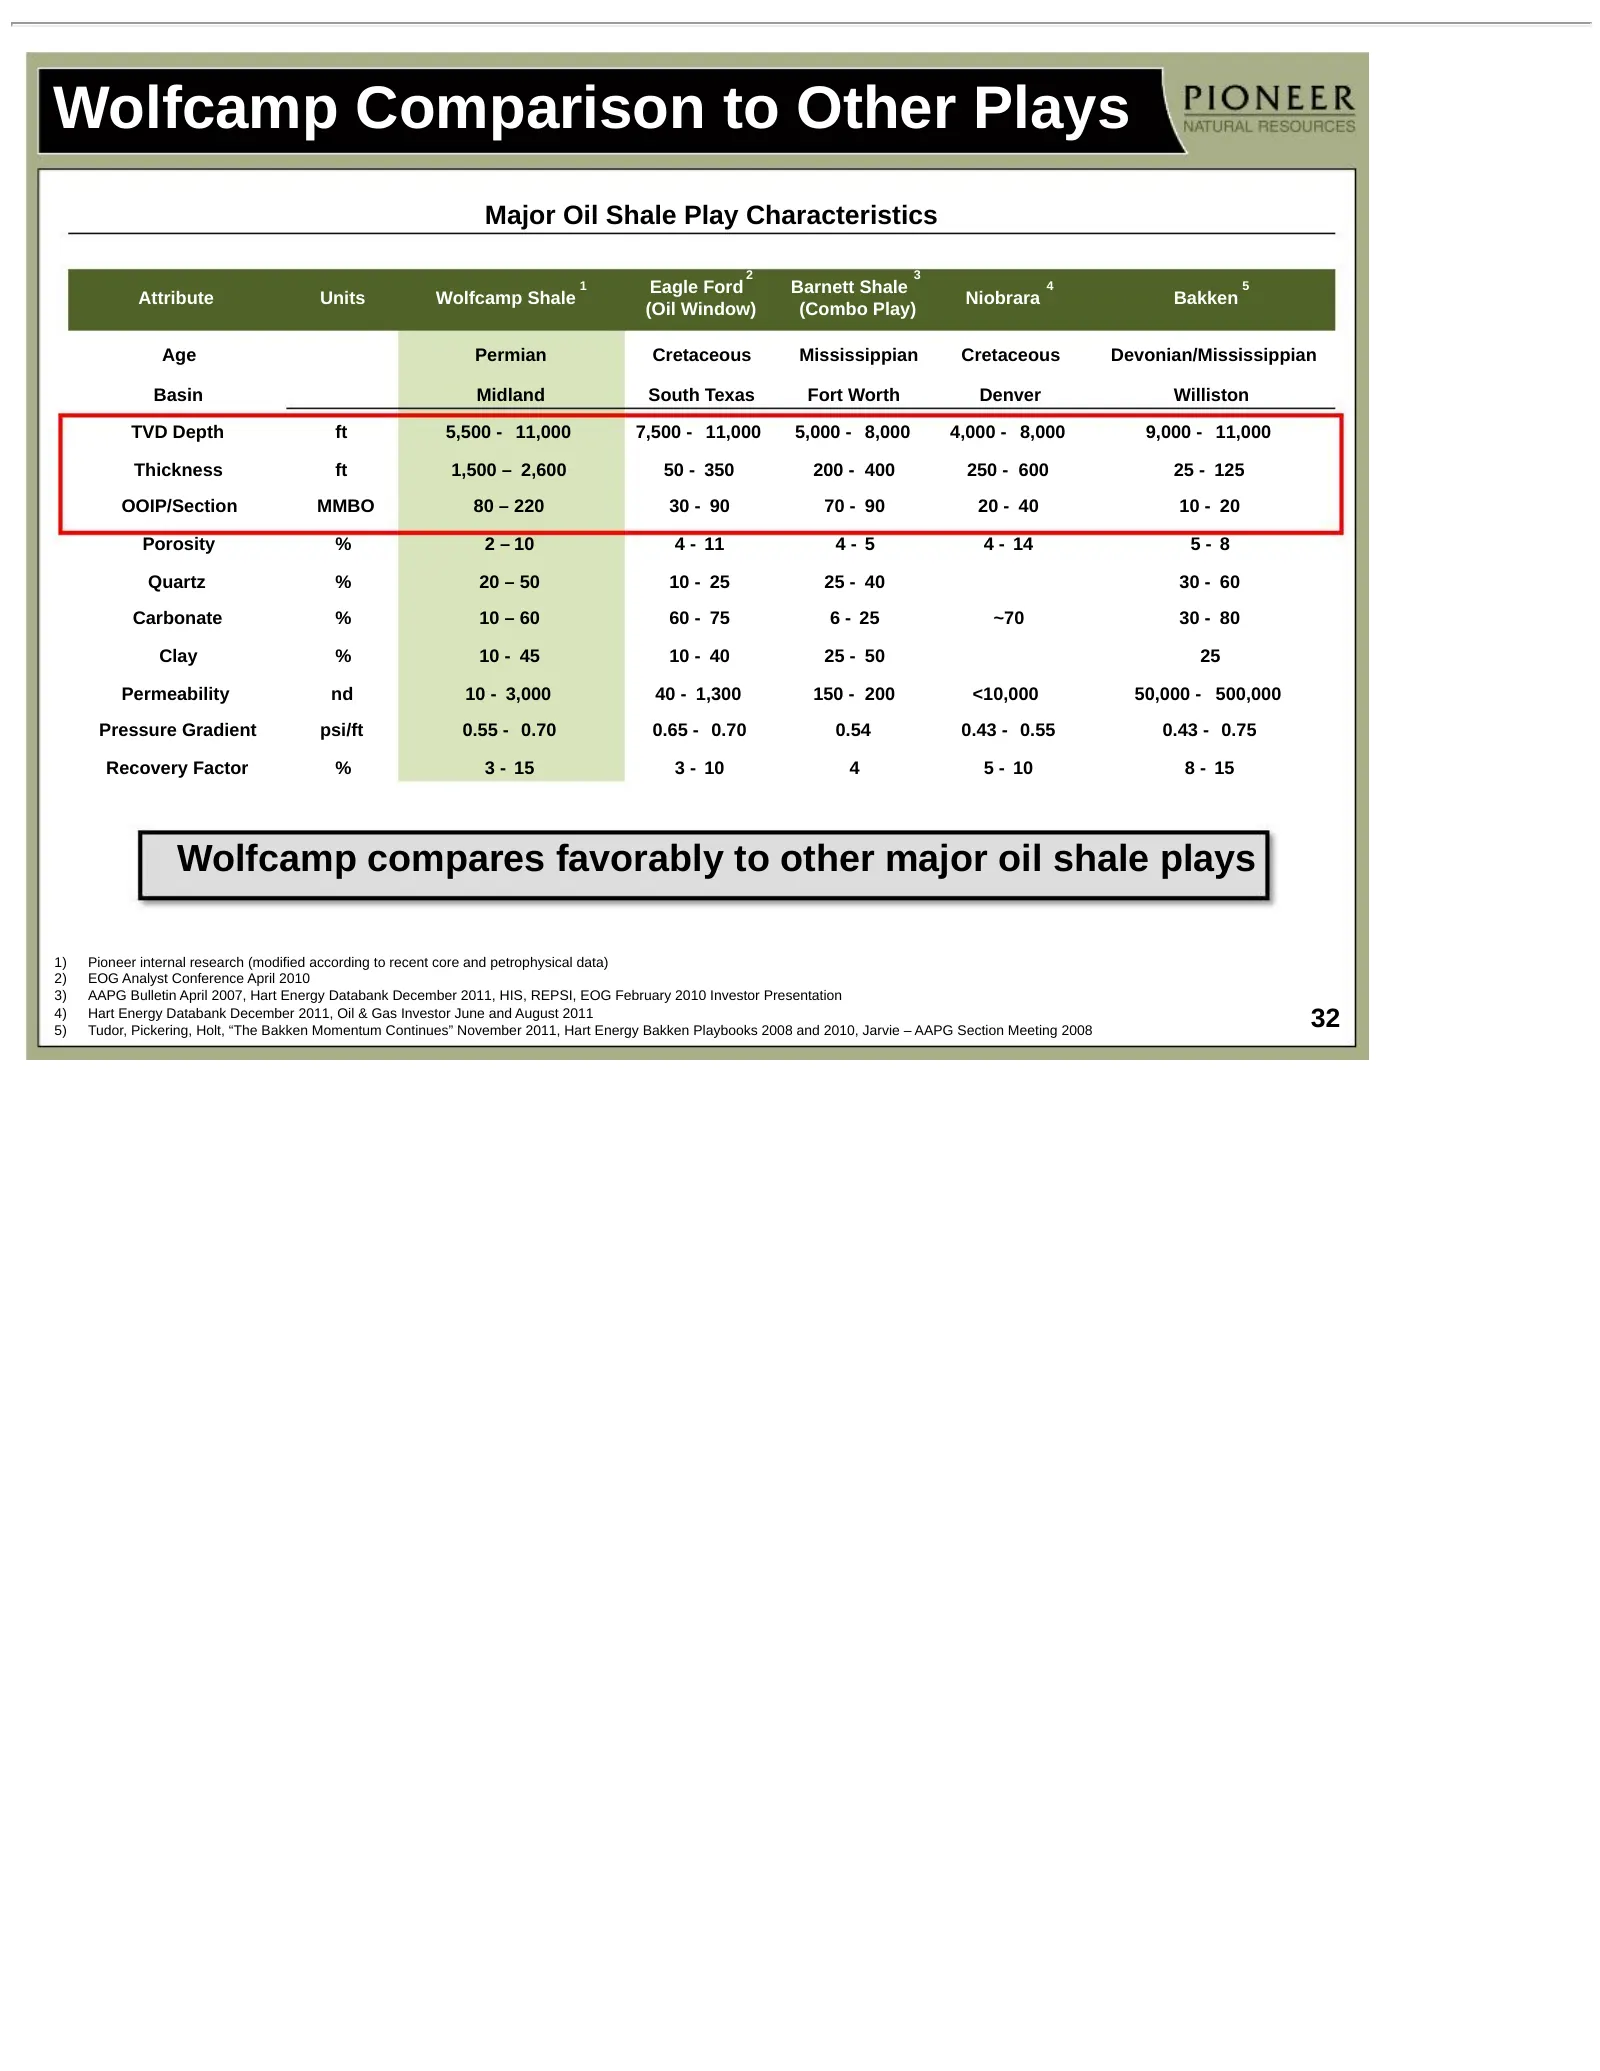
Slide 32: Wolfcamp Comparison to Other Plays
Wolfcamp Comparison to Other Plays Major Oil Shale Play Characteristics 2 3 1 Eagle Ford Barnett Shale 4 5 Attribute Units Wolfcamp Shale Niobrara Bakken (Oil Window) (Combo Play) Age Permian Cretaceous Mississippian Cretaceous Devonian/Mississippian Basin Midland South Texas Fort Worth Denver Willi
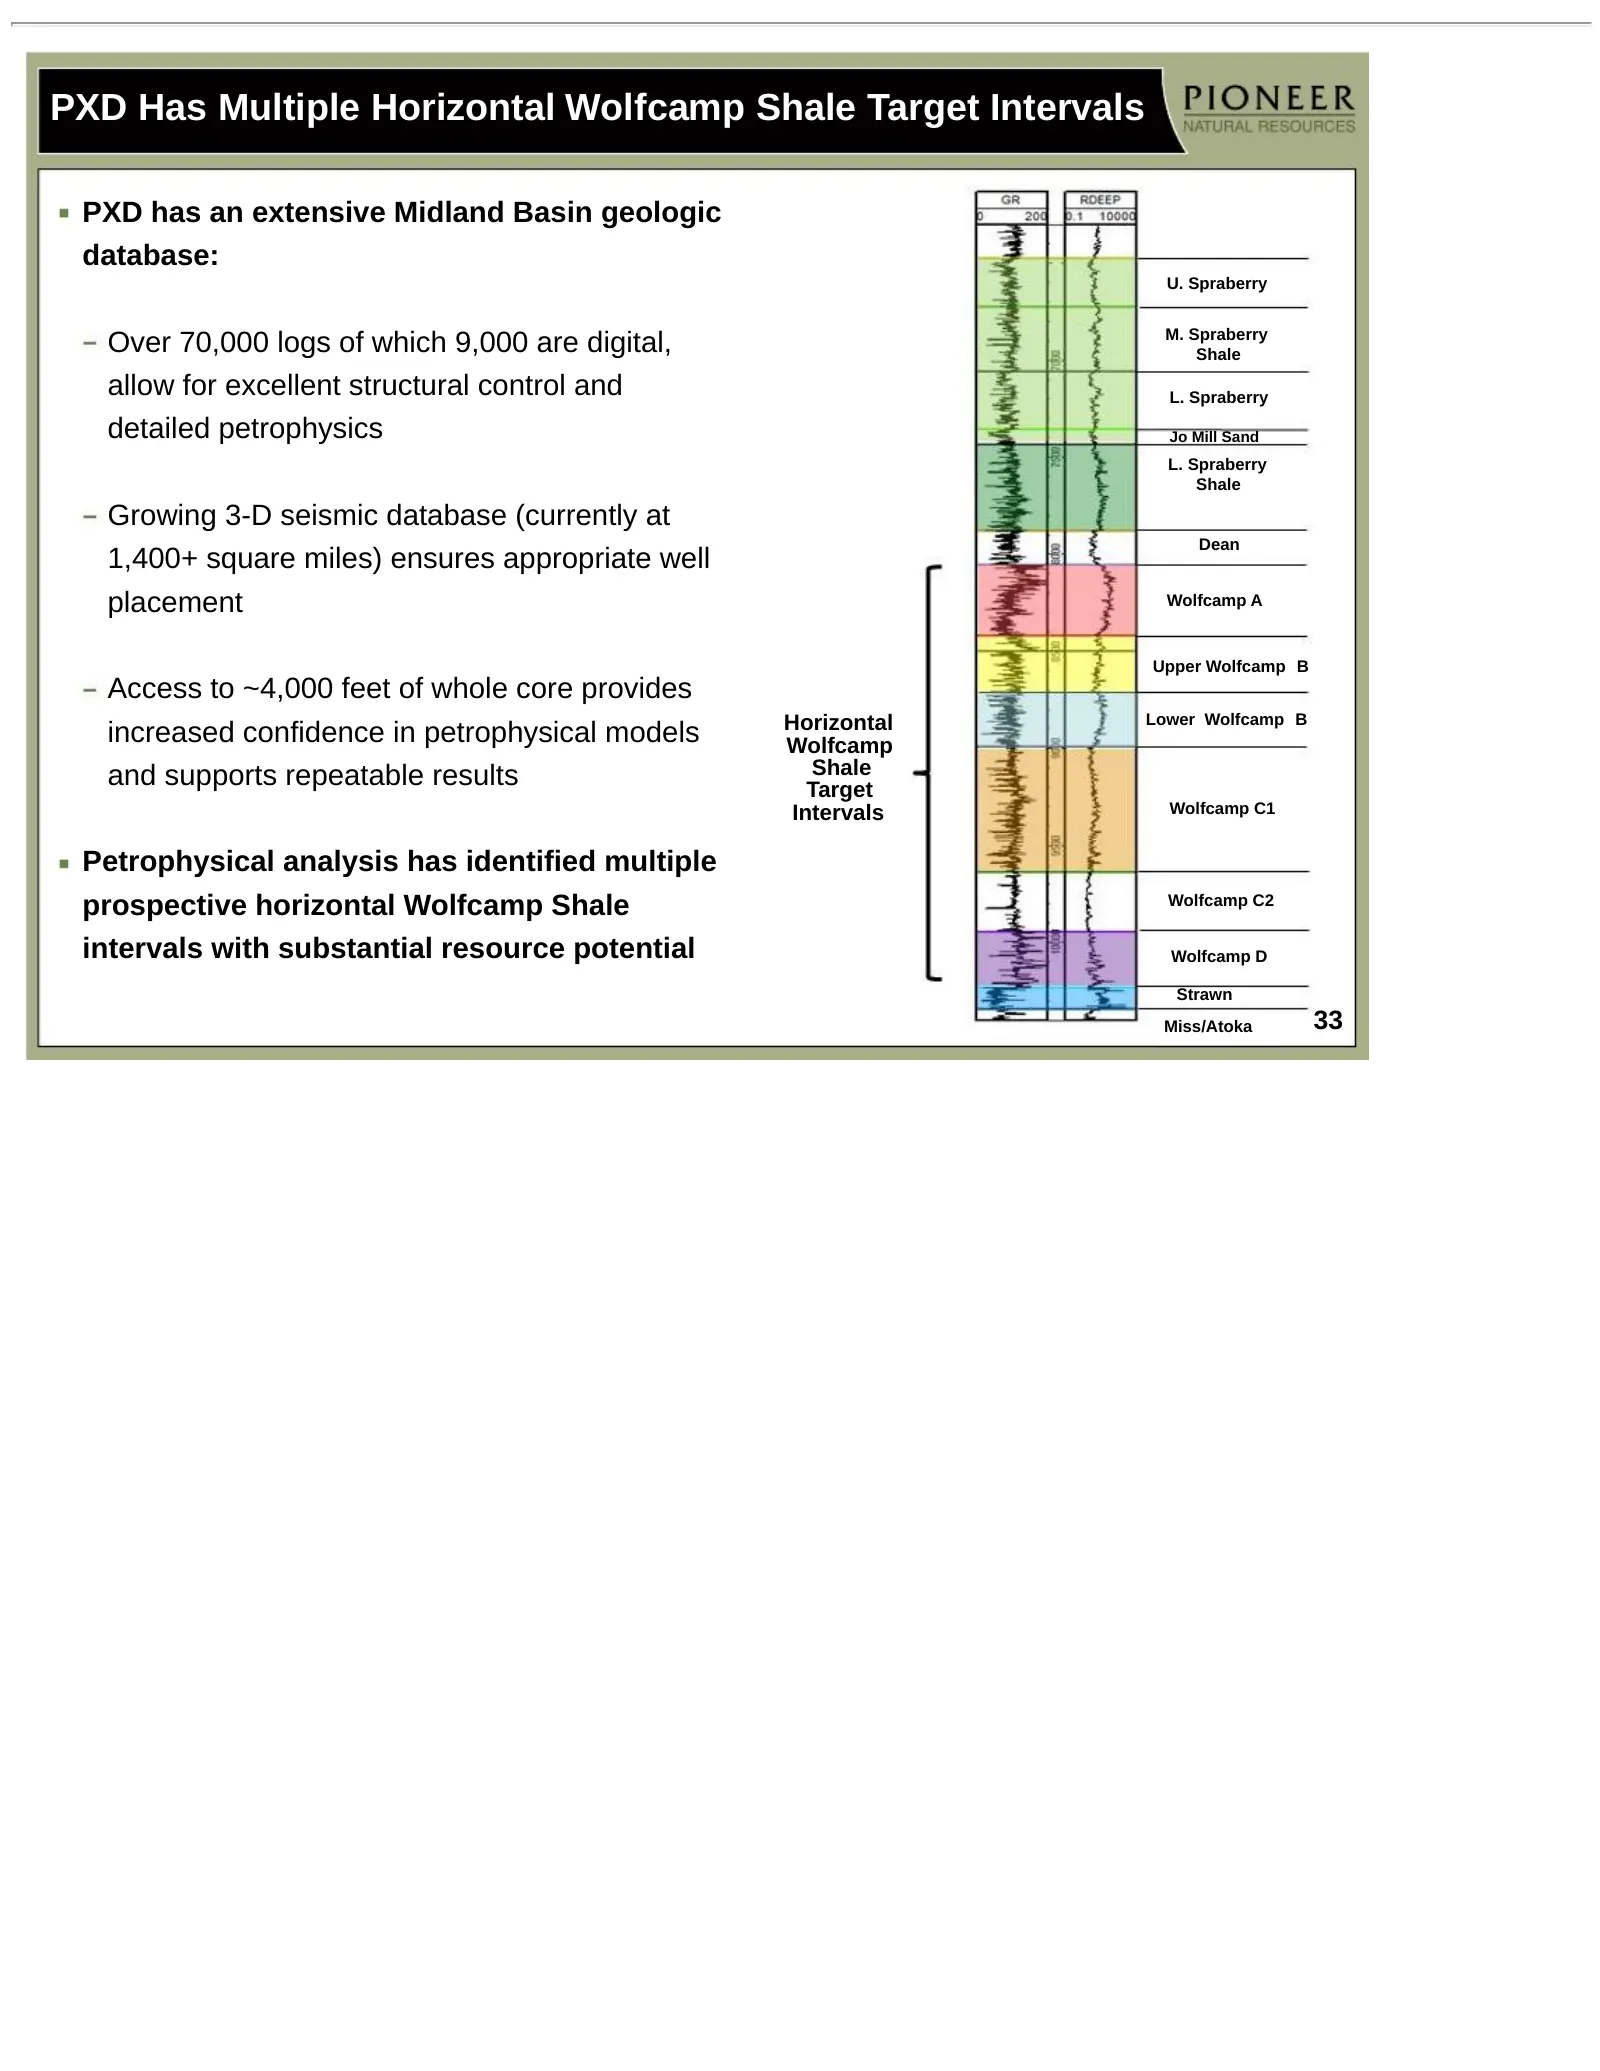
Slide 33: PXD Has Multiple Horizontal Wolfcamp Shale Target Intervals
PXD Has Multiple Horizontal Wolfcamp Shale Target Intervals PXD has an extensive Midland Basin geologic database: U. Spraberry Over 70,000 logs of which 9,000 are digital, M. Spraberry Shale allow for excellent structural control and L. Spraberry detailed petrophysics Jo Mill Sand L. Spraberry Shale
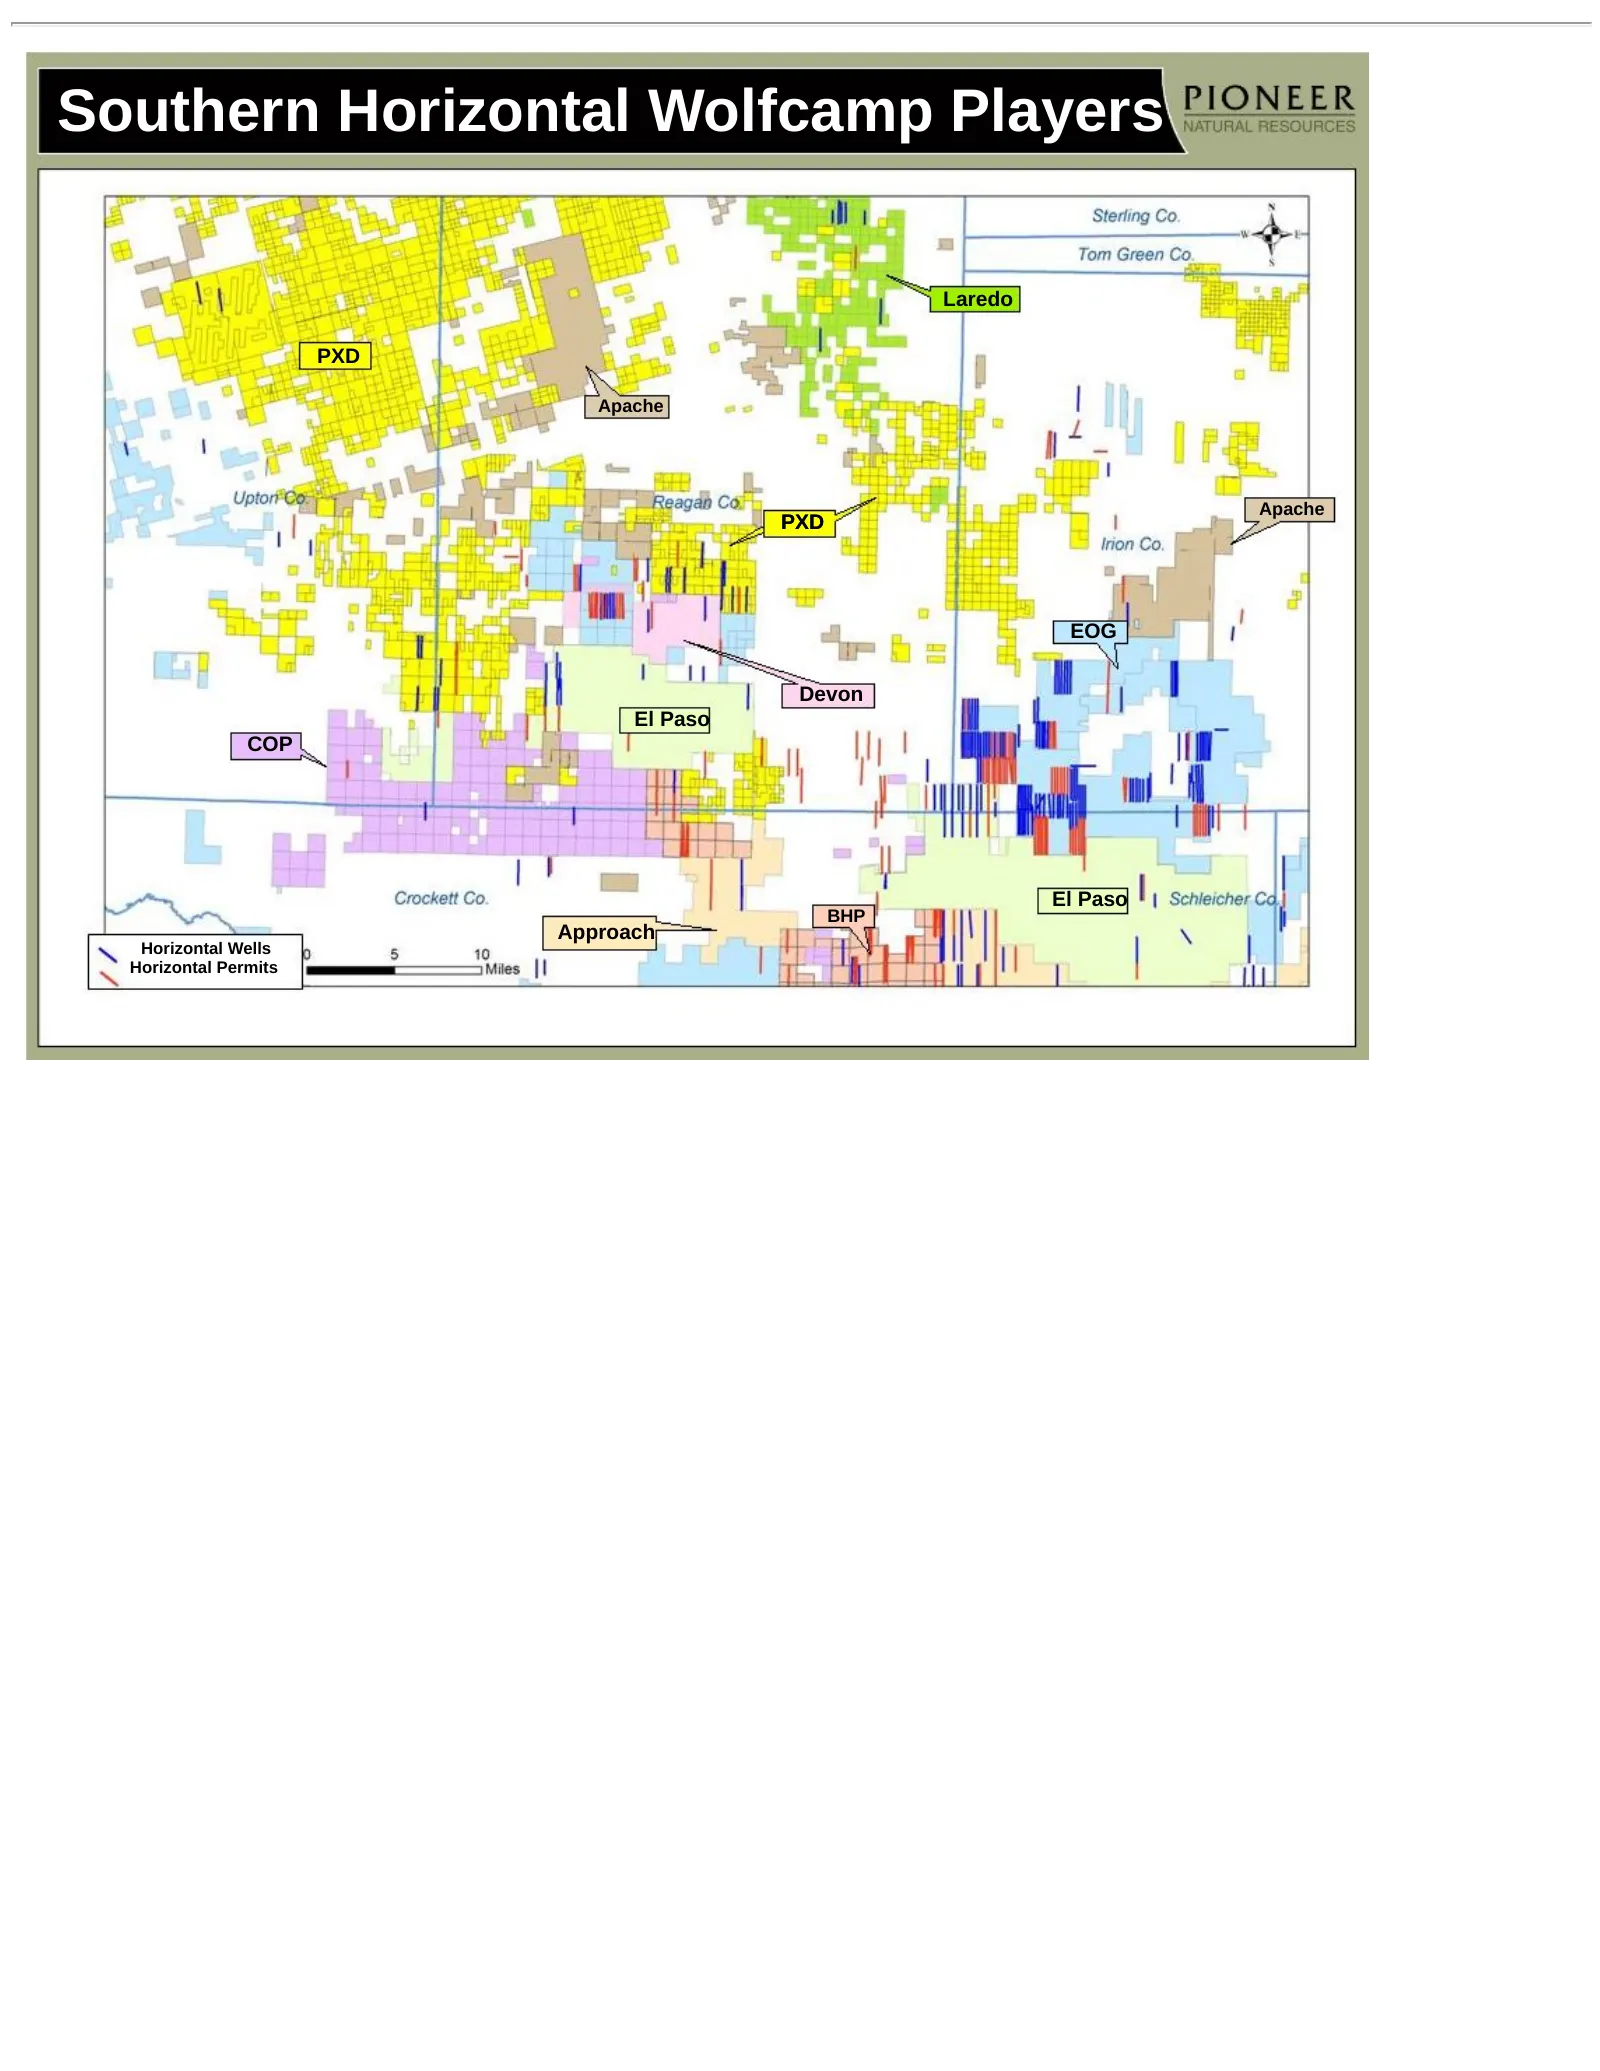
Slide 34: Southern Horizontal Wolfcamp Players
Southern Horizontal Wolfcamp Players Laredo PXD Apache Apache PXD EOG Devon El Paso COP El Paso BHP Approach Horizontal Wells Horizontal Permits
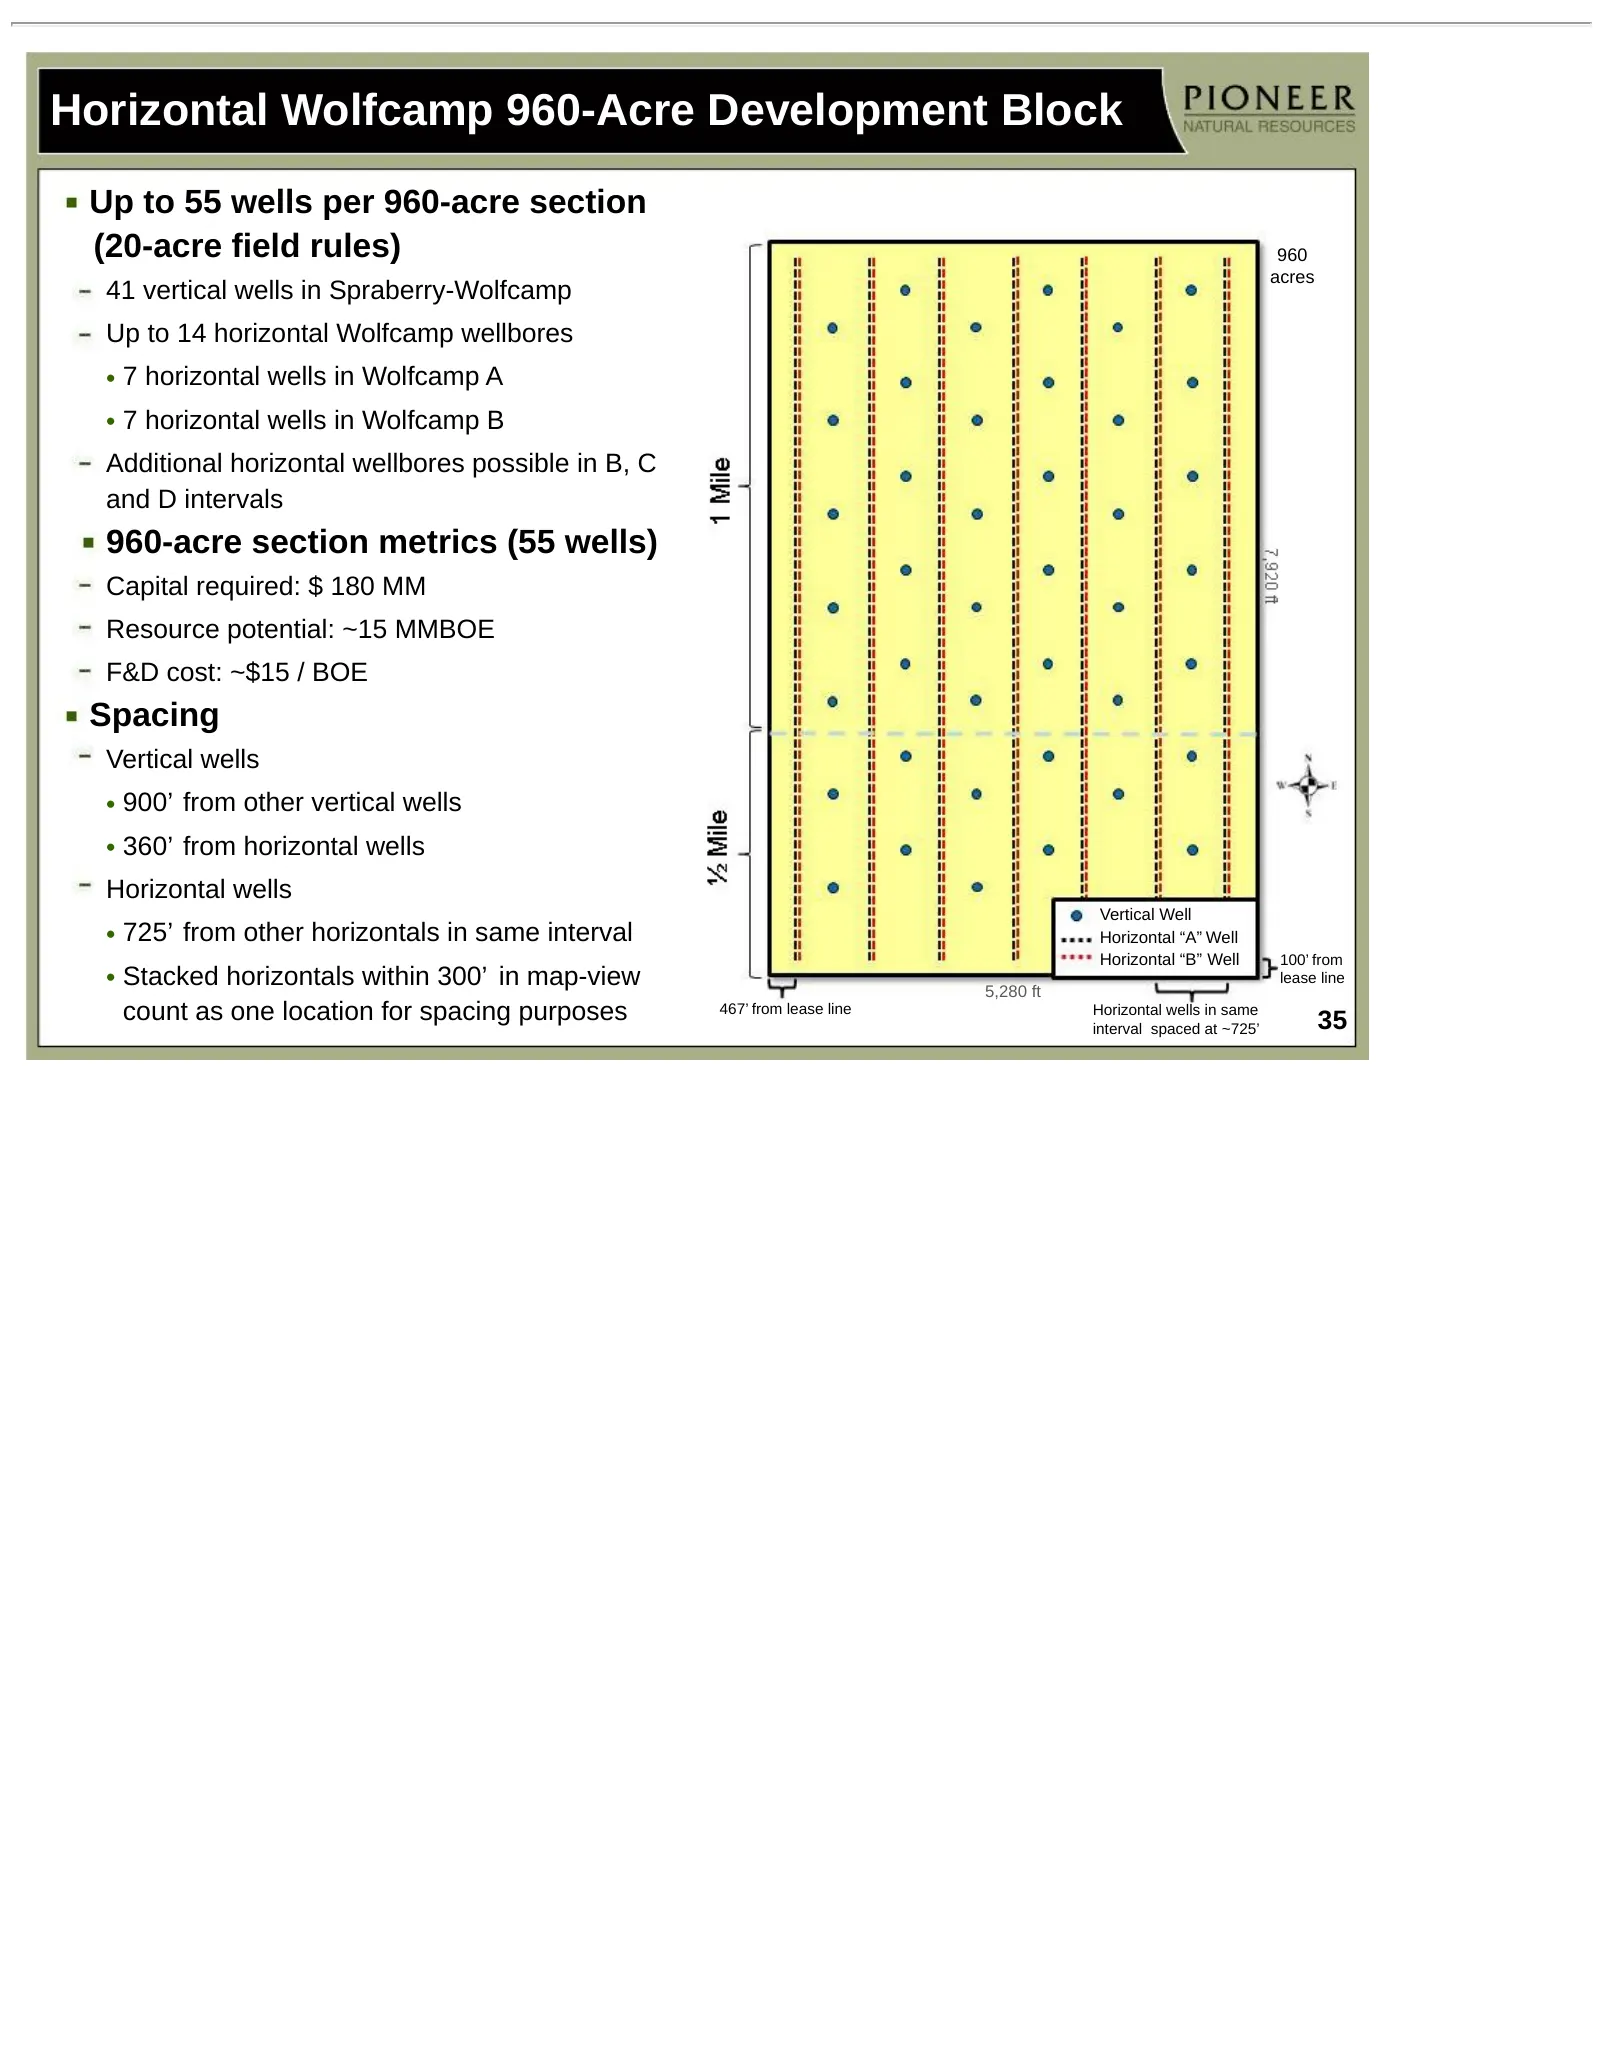
Slide 35: Horizontal Wolfcamp 960-Acre Development Block
Horizontal Wolfcamp 960-Acre Development Block Up to 55 wells per 960-acre section (20-acre field rules) 960 acres 41 vertical wells in Spraberry-Wolfcamp Up to 14 horizontal Wolfcamp wellbores • 7 horizontal wells in Wolfcamp A • 7 horizontal wells in Wolfcamp B Additional horizontal wellbores poss
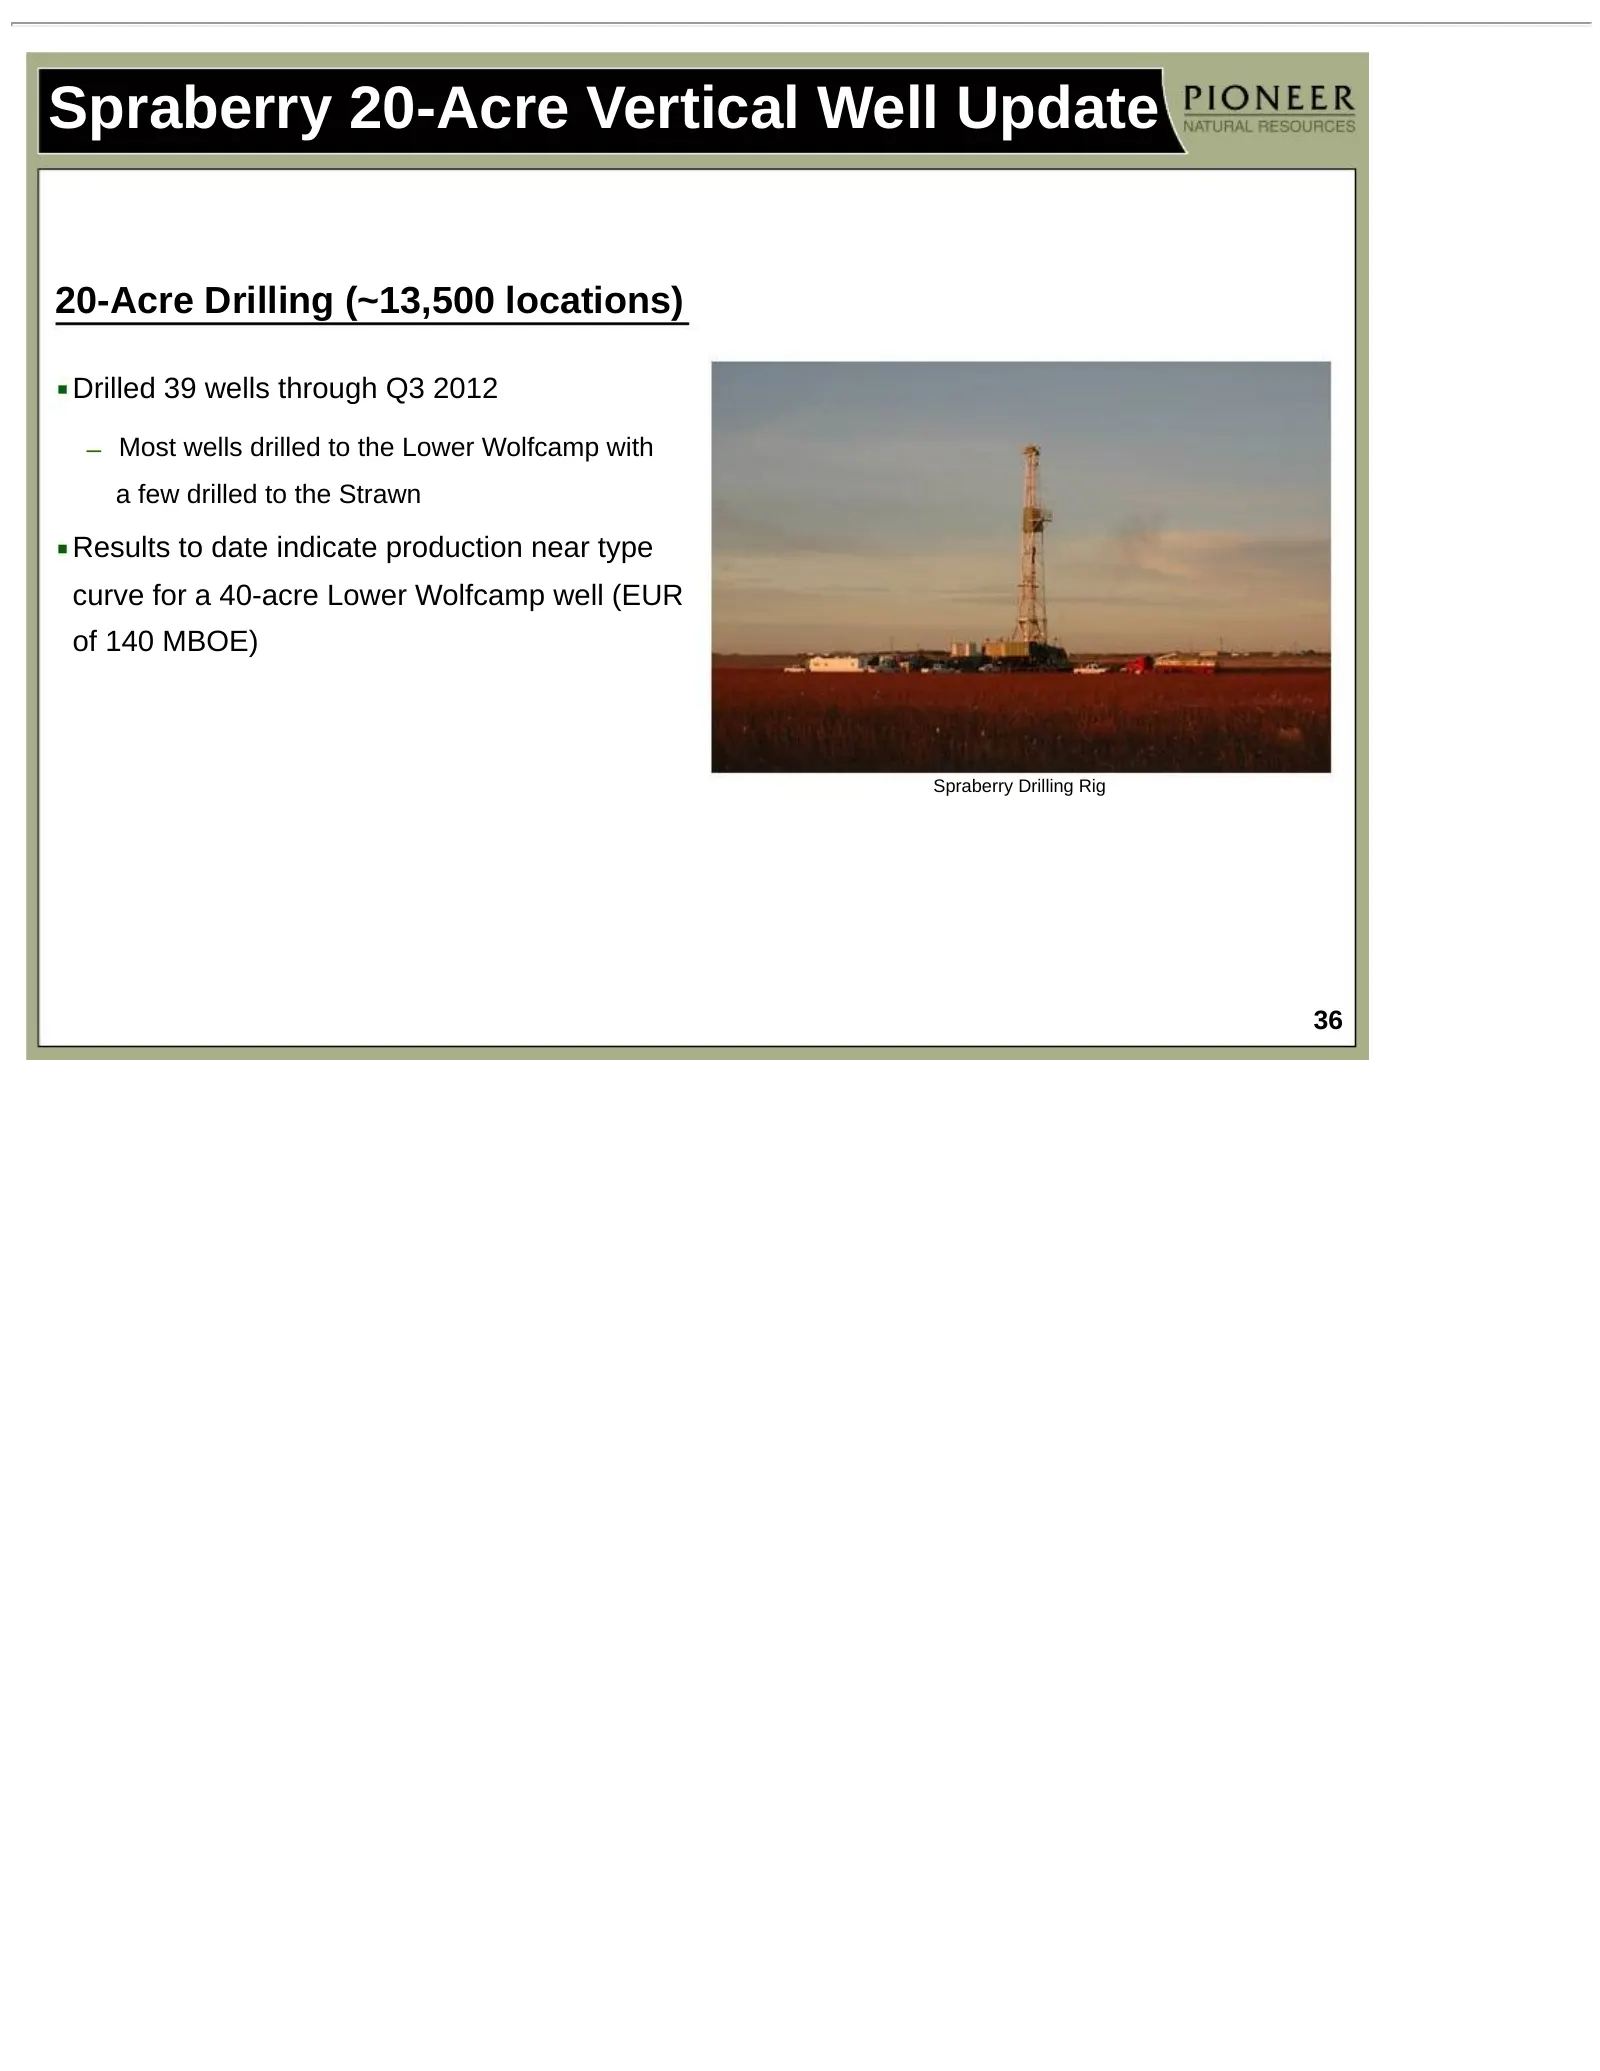
Slide 36: Spraberry 20-Acre Vertical Well Update
Spraberry 20-Acre Vertical Well Update 20-Acre Drilling (~13,500 locations) Drilled 39 wells through Q3 2012 – Most wells drilled to the Lower Wolfcamp with a few drilled to the Strawn Results to date indicate production near type curve for a 40-acre Lower Wolfcamp well (EUR of 140 MBOE) Spraberry D
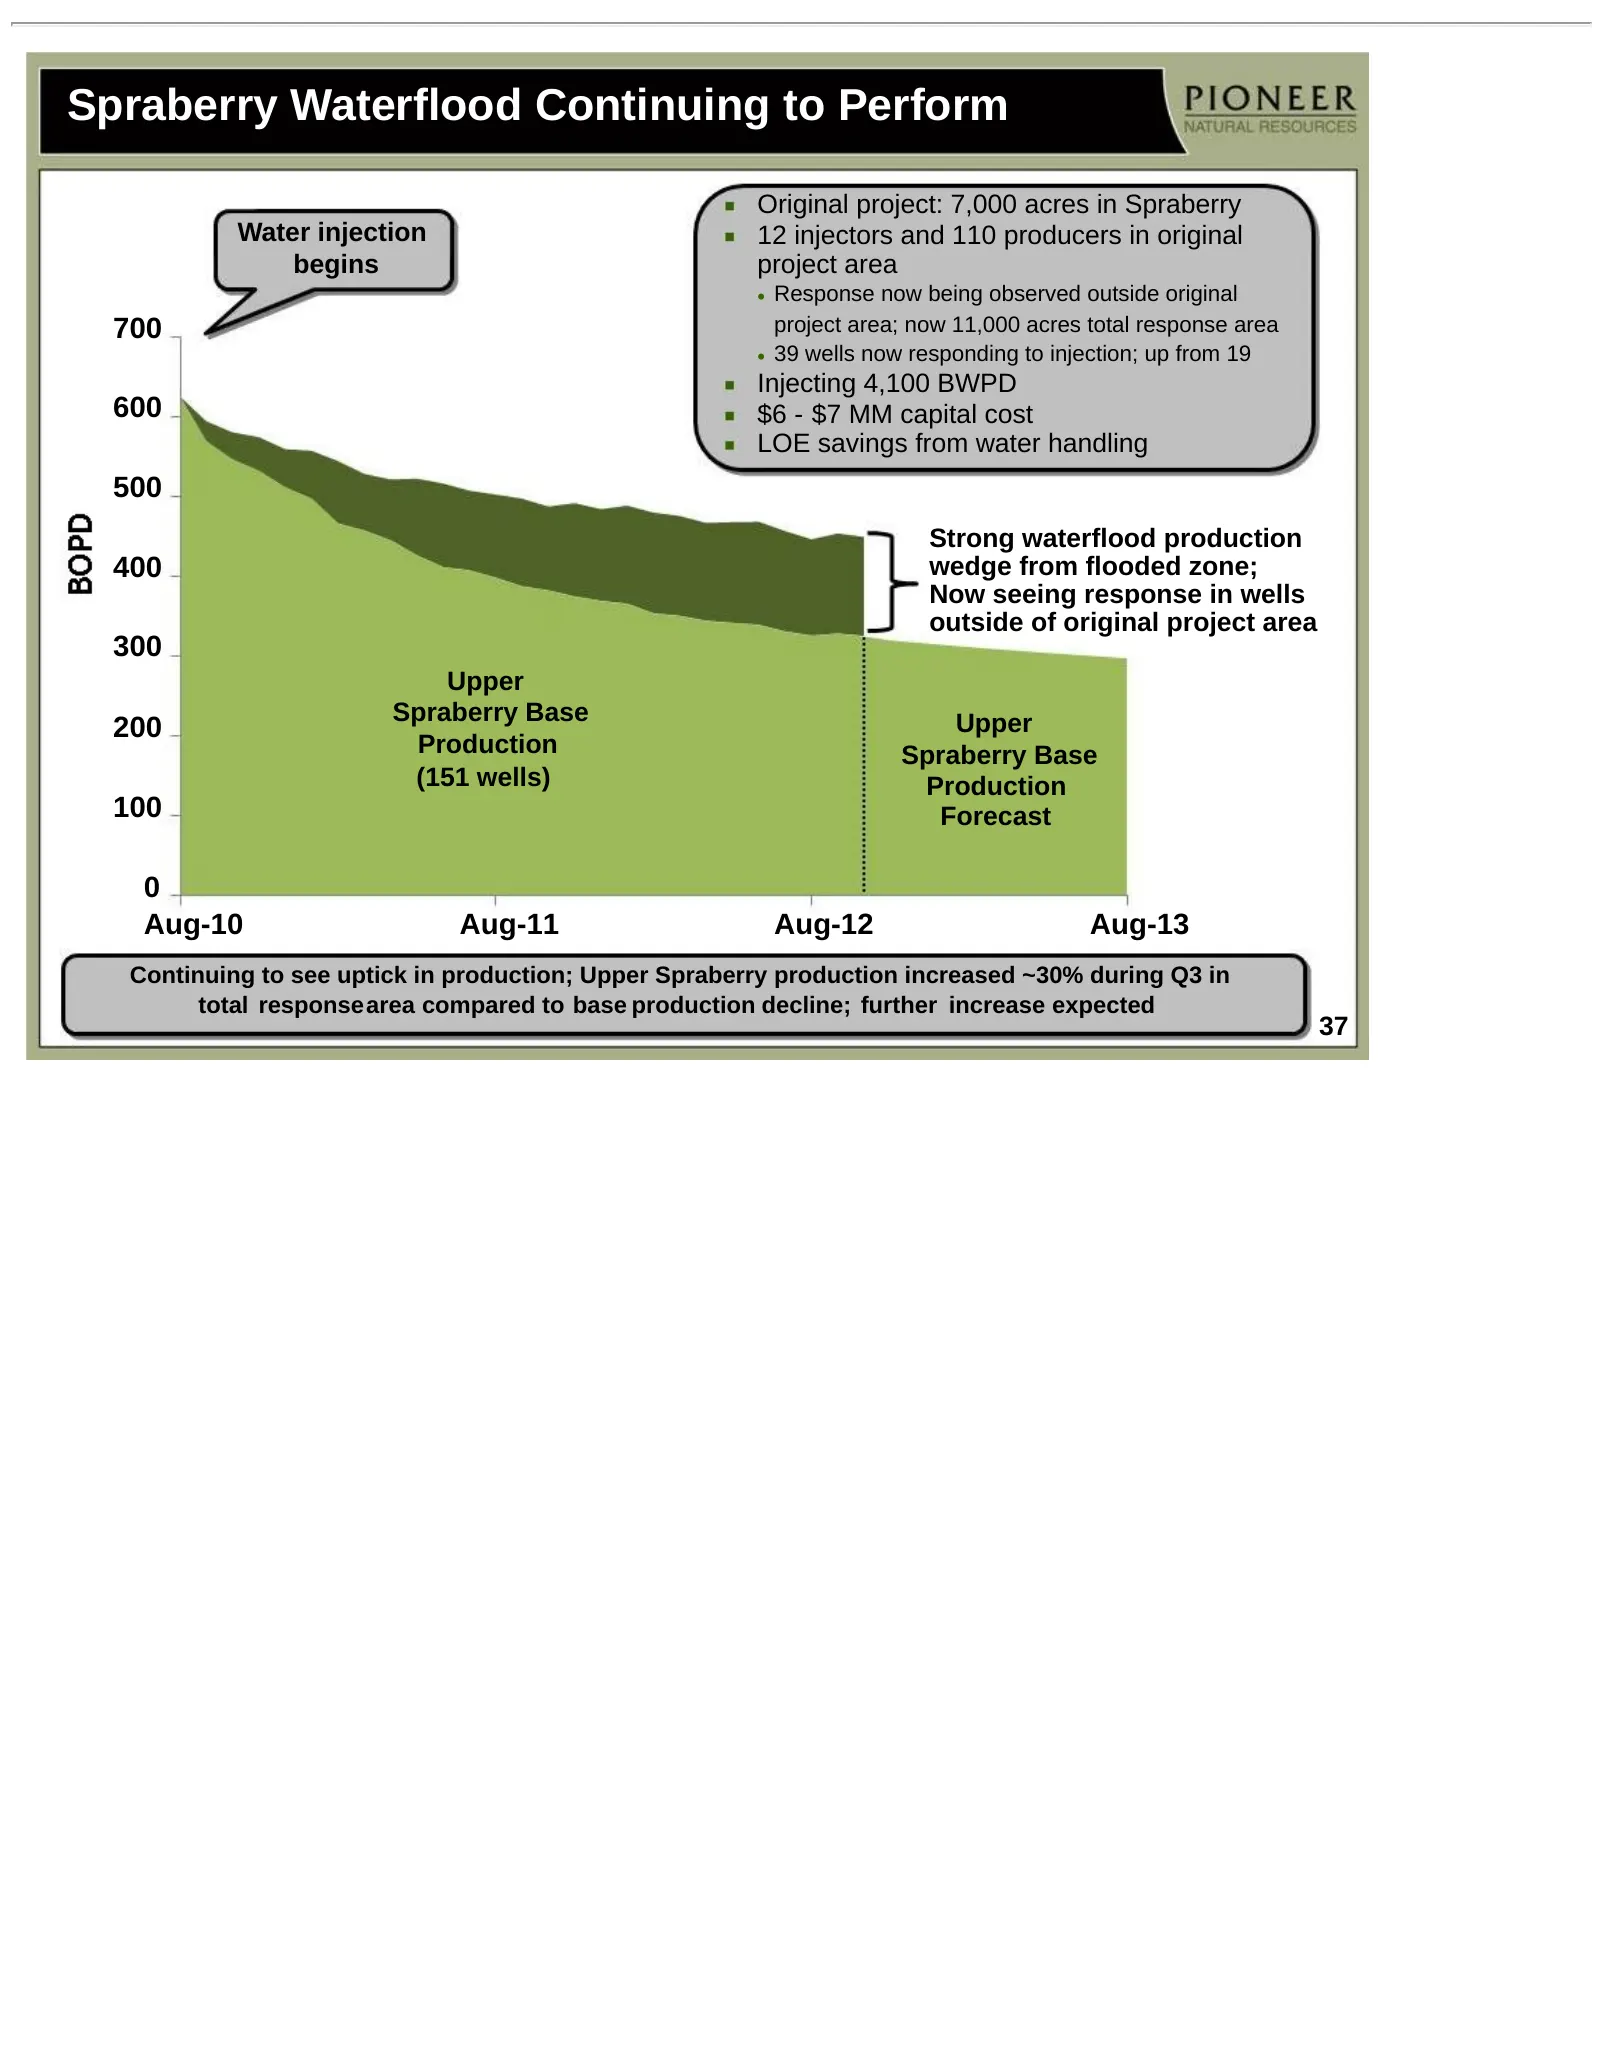
Slide 37: Spraberry Waterflood Continuing to Perform
Spraberry Waterflood Continuing to Perform Original project: 7,000 acres in Spraberry Water injection 12 injectors and 110 producers in original begins project area • Response now being observed outside original 700 project area; now 11,000 acres total response area • 39 wells now responding to inje
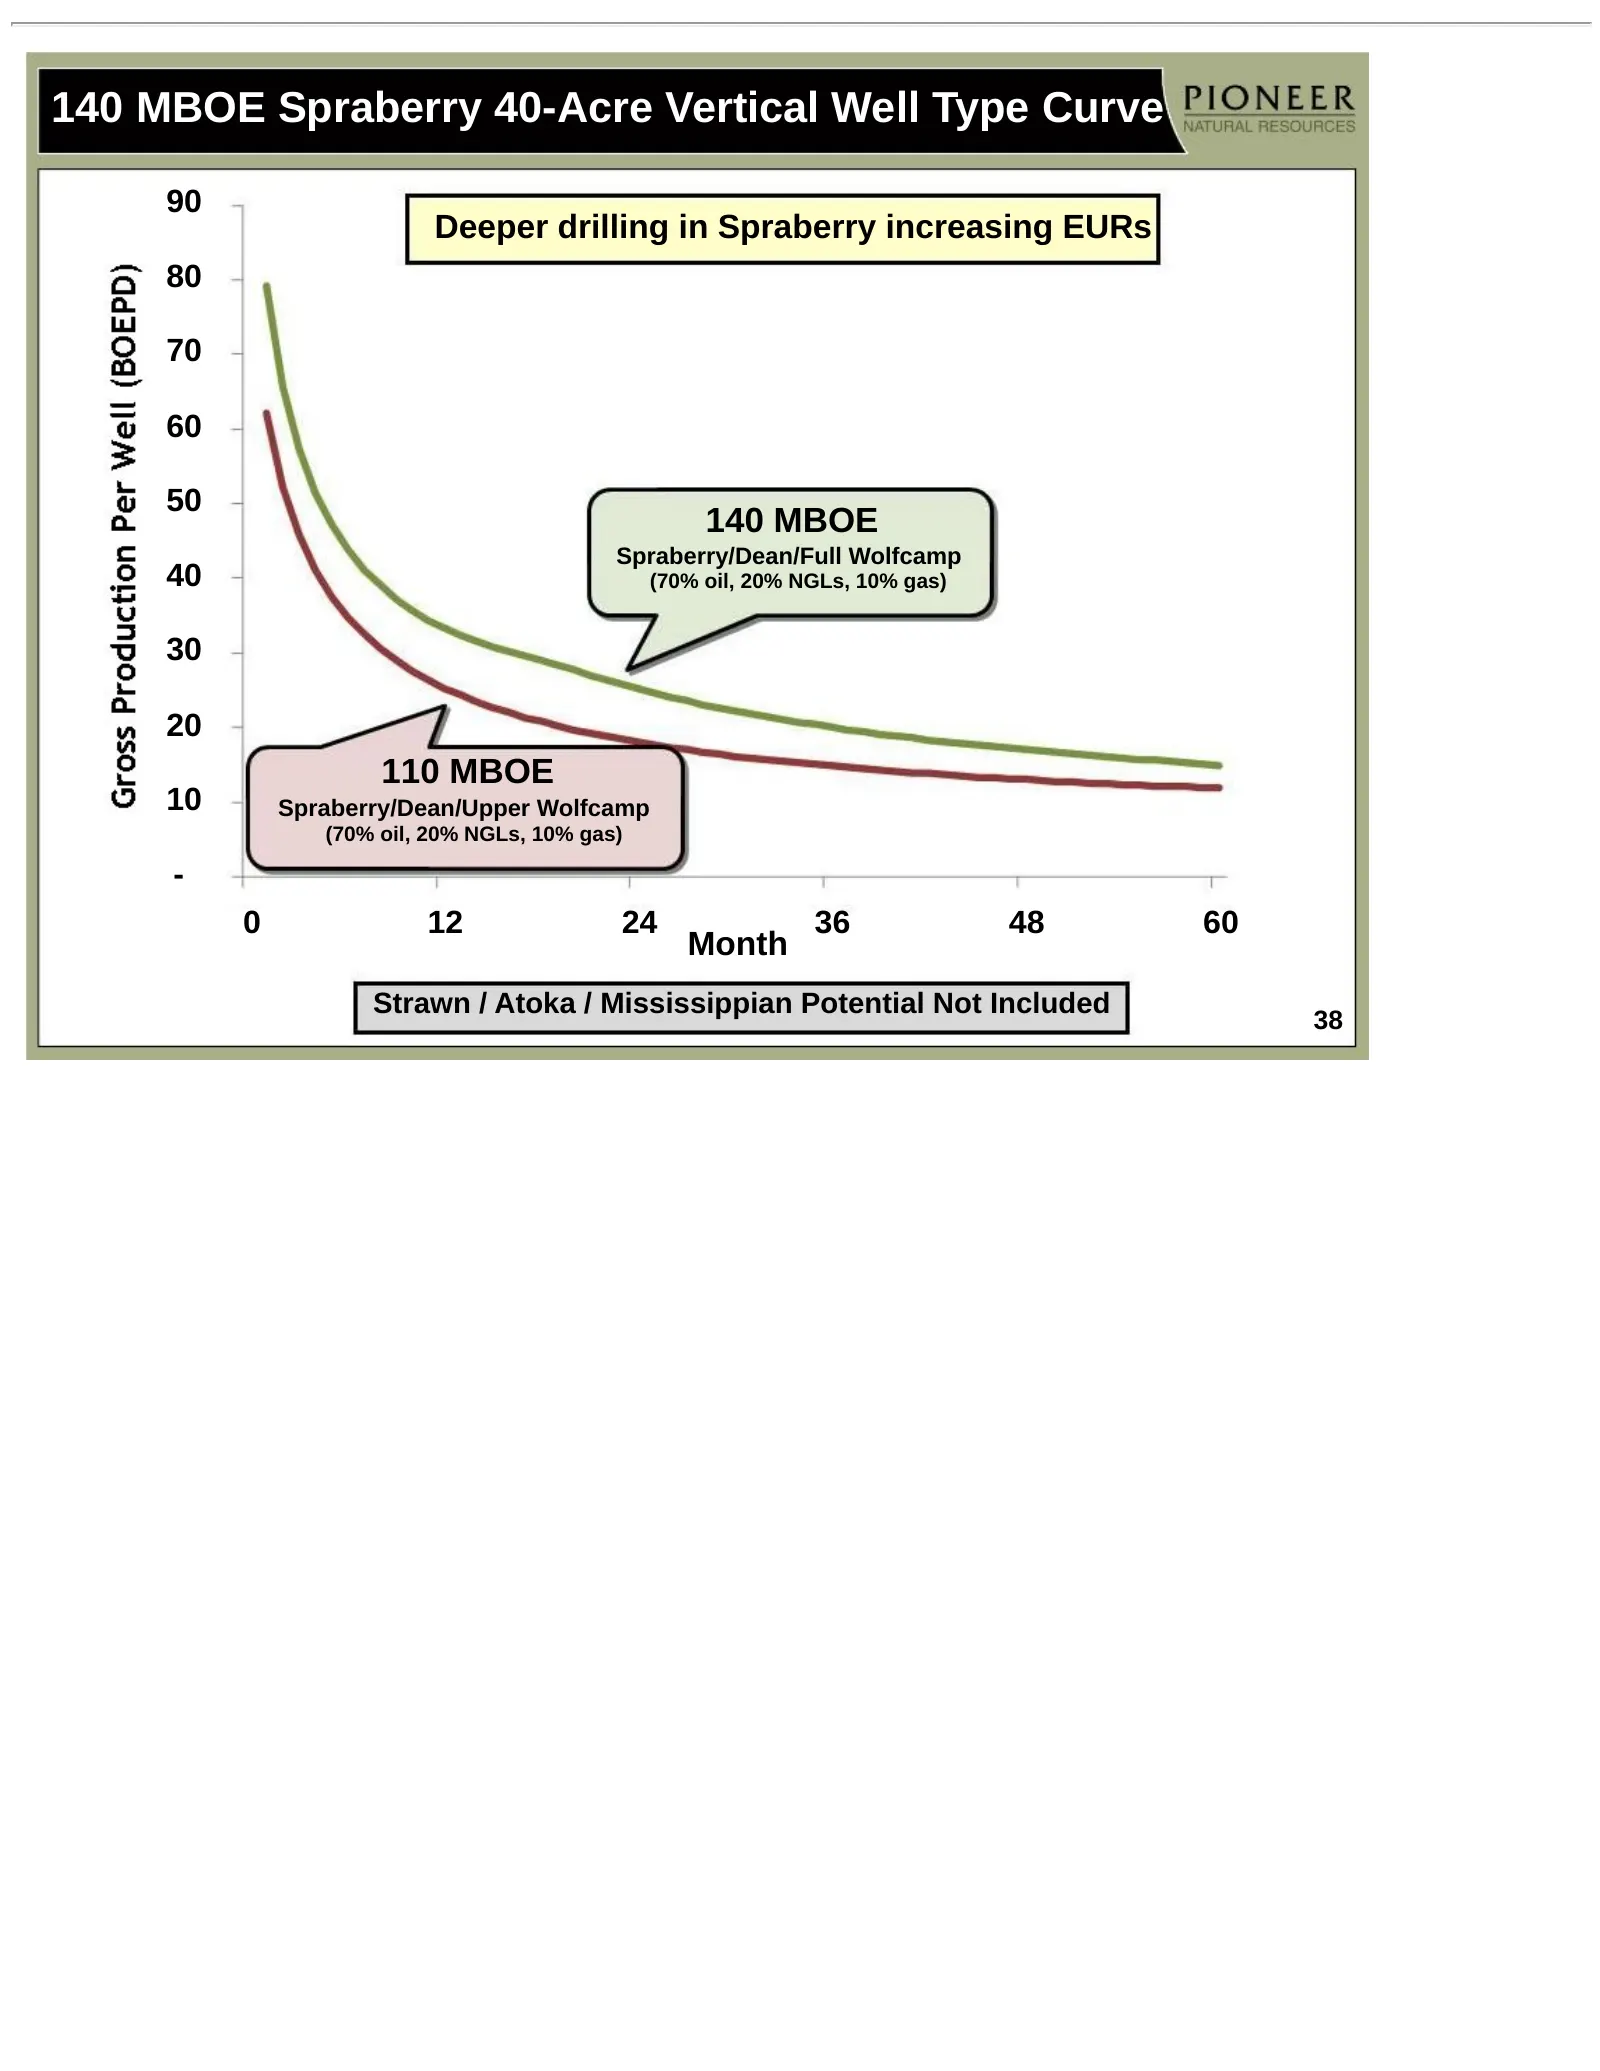
Slide 38: 140 MBOE Spraberry 40-Acre Vertical Well Type Curve
140 MBOE Spraberry 40-Acre Vertical Well Type Curve 90 Deeper drilling in Spraberry increasing EURs 80 70 60 50 140 MBOE Spraberry/Dean/Full Wolfcamp 40 (70% oil, 20% NGLs, 10% gas) 30 20 110 MBOE 10 Spraberry/Dean/Upper Wolfcamp (70% oil, 20% NGLs, 10% gas) - 0 12 24 36 48 60 Month Strawn / Atoka /
Slide 39: Pioneer's Permian Resource Potential Continues To Grow
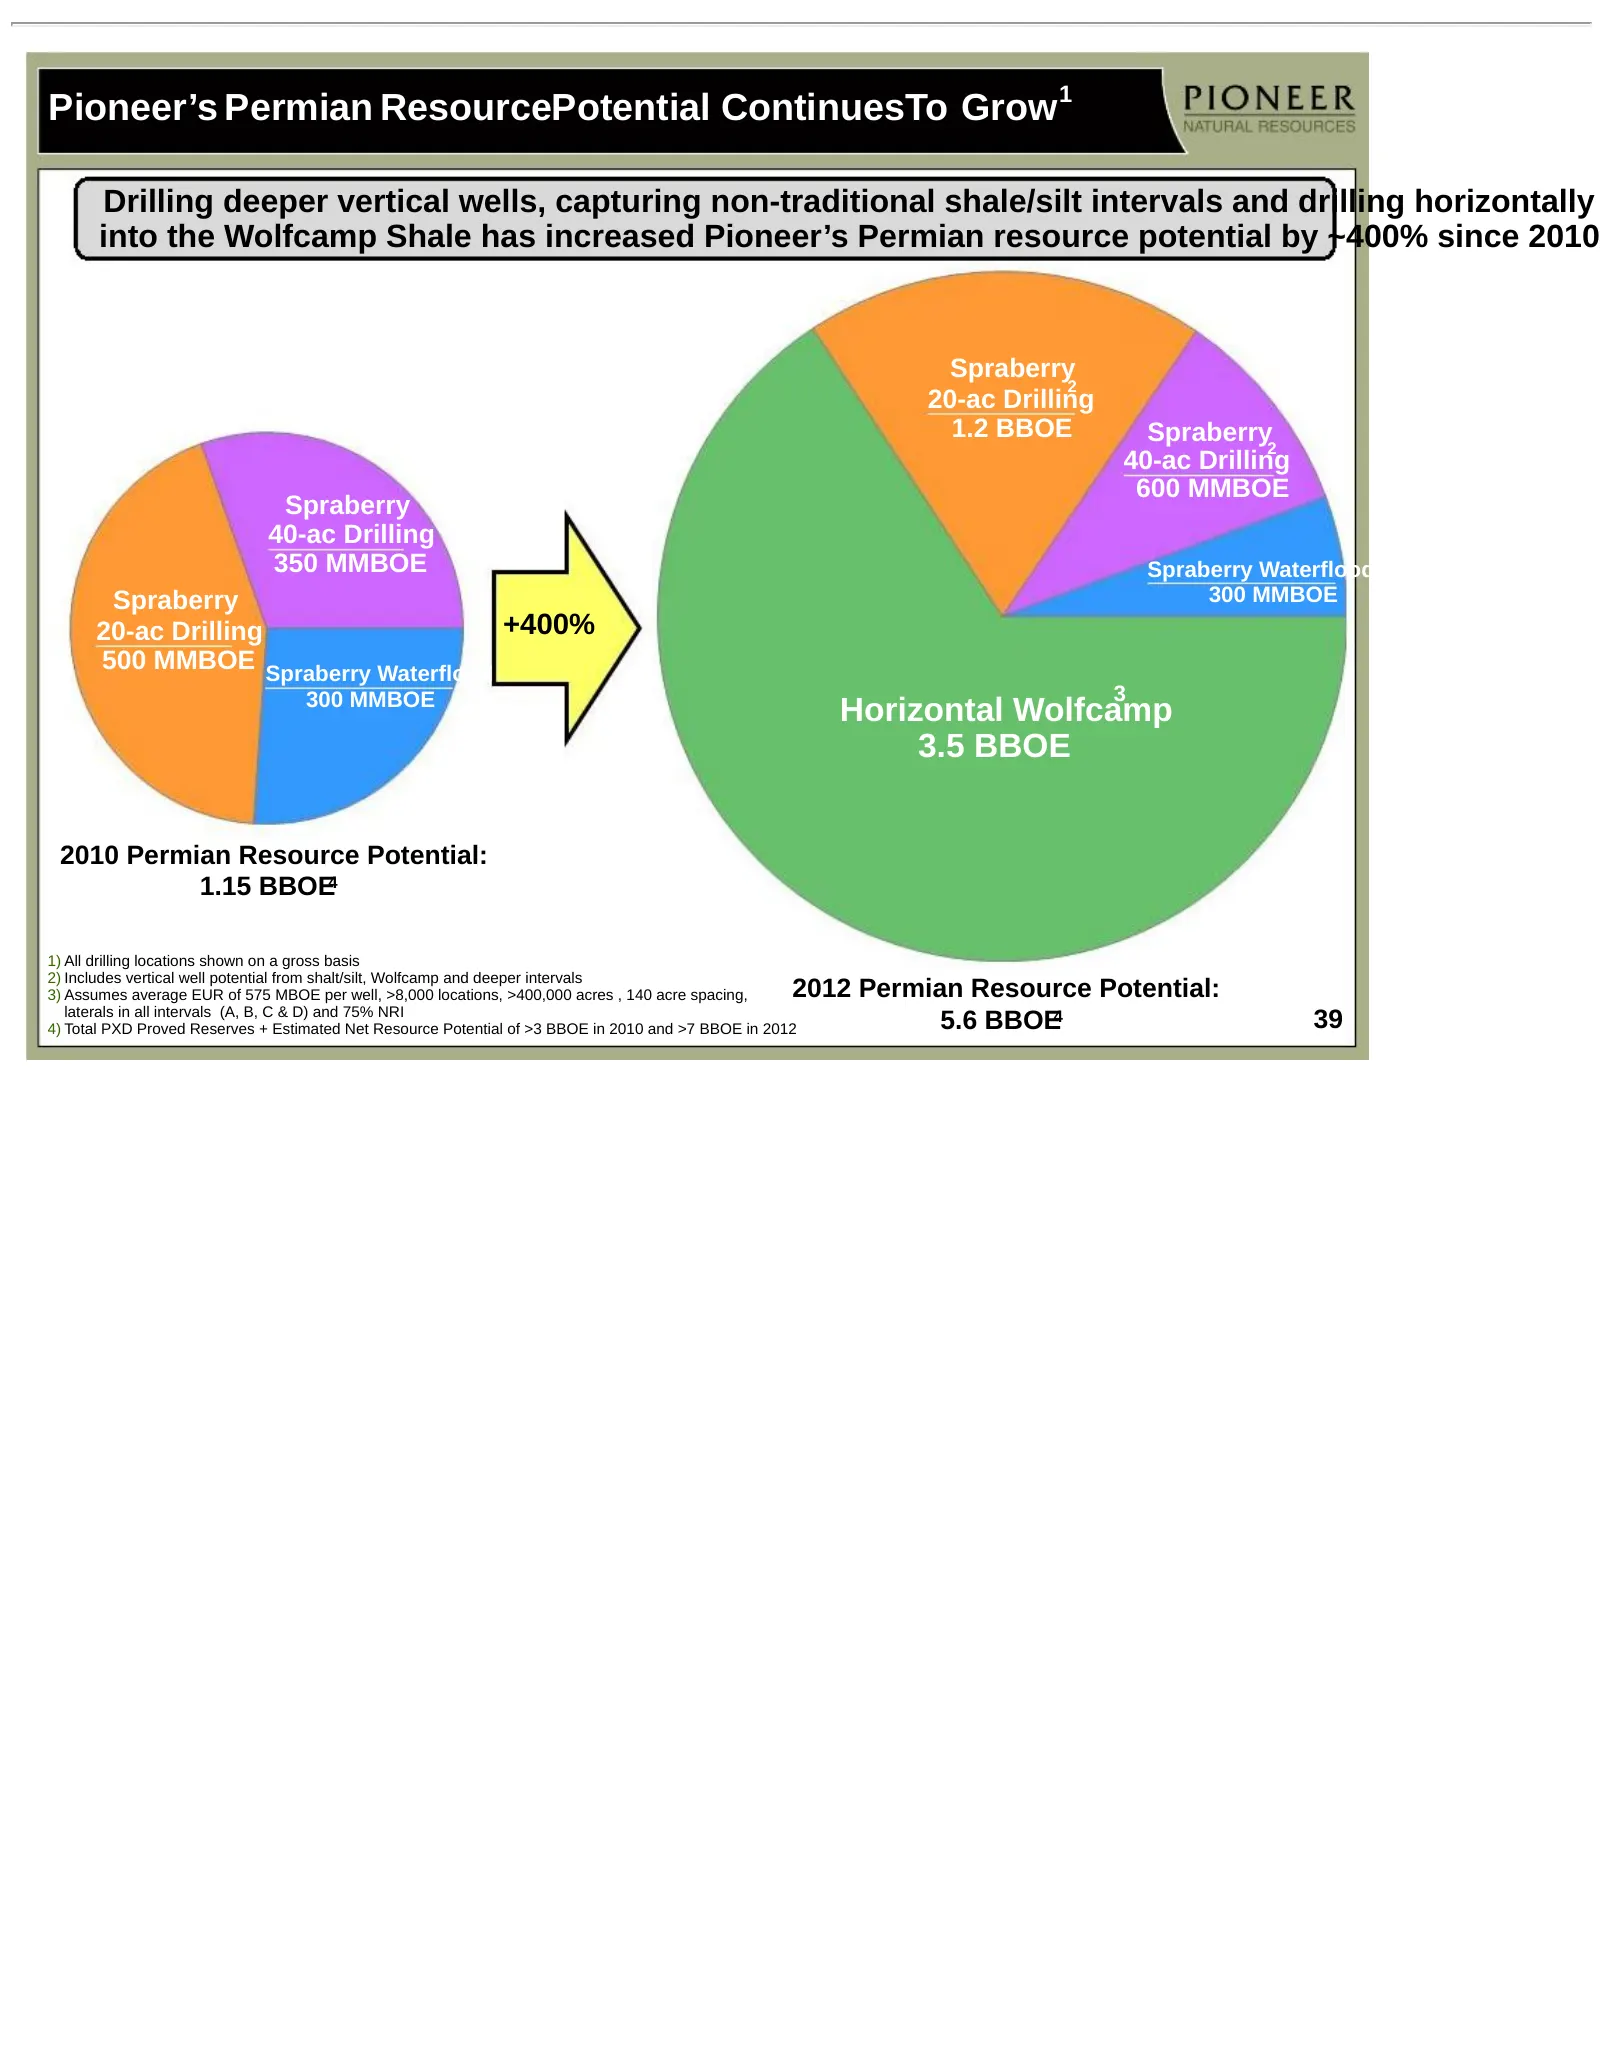
Pioneer’s Permian ResourcePotential ContinuesTo Grow 1 Drilling deeper vertical wells, capturing non-traditional shale/silt intervals and drilling horizontally into the Wolfcamp Shale has increased Pioneer’s Permian resource potential by ~400% since 2010 Spraberry 2 20-ac Drilling 1.2 BBOE Spraberry
Slide 40: Permian Oil Production Transport Options
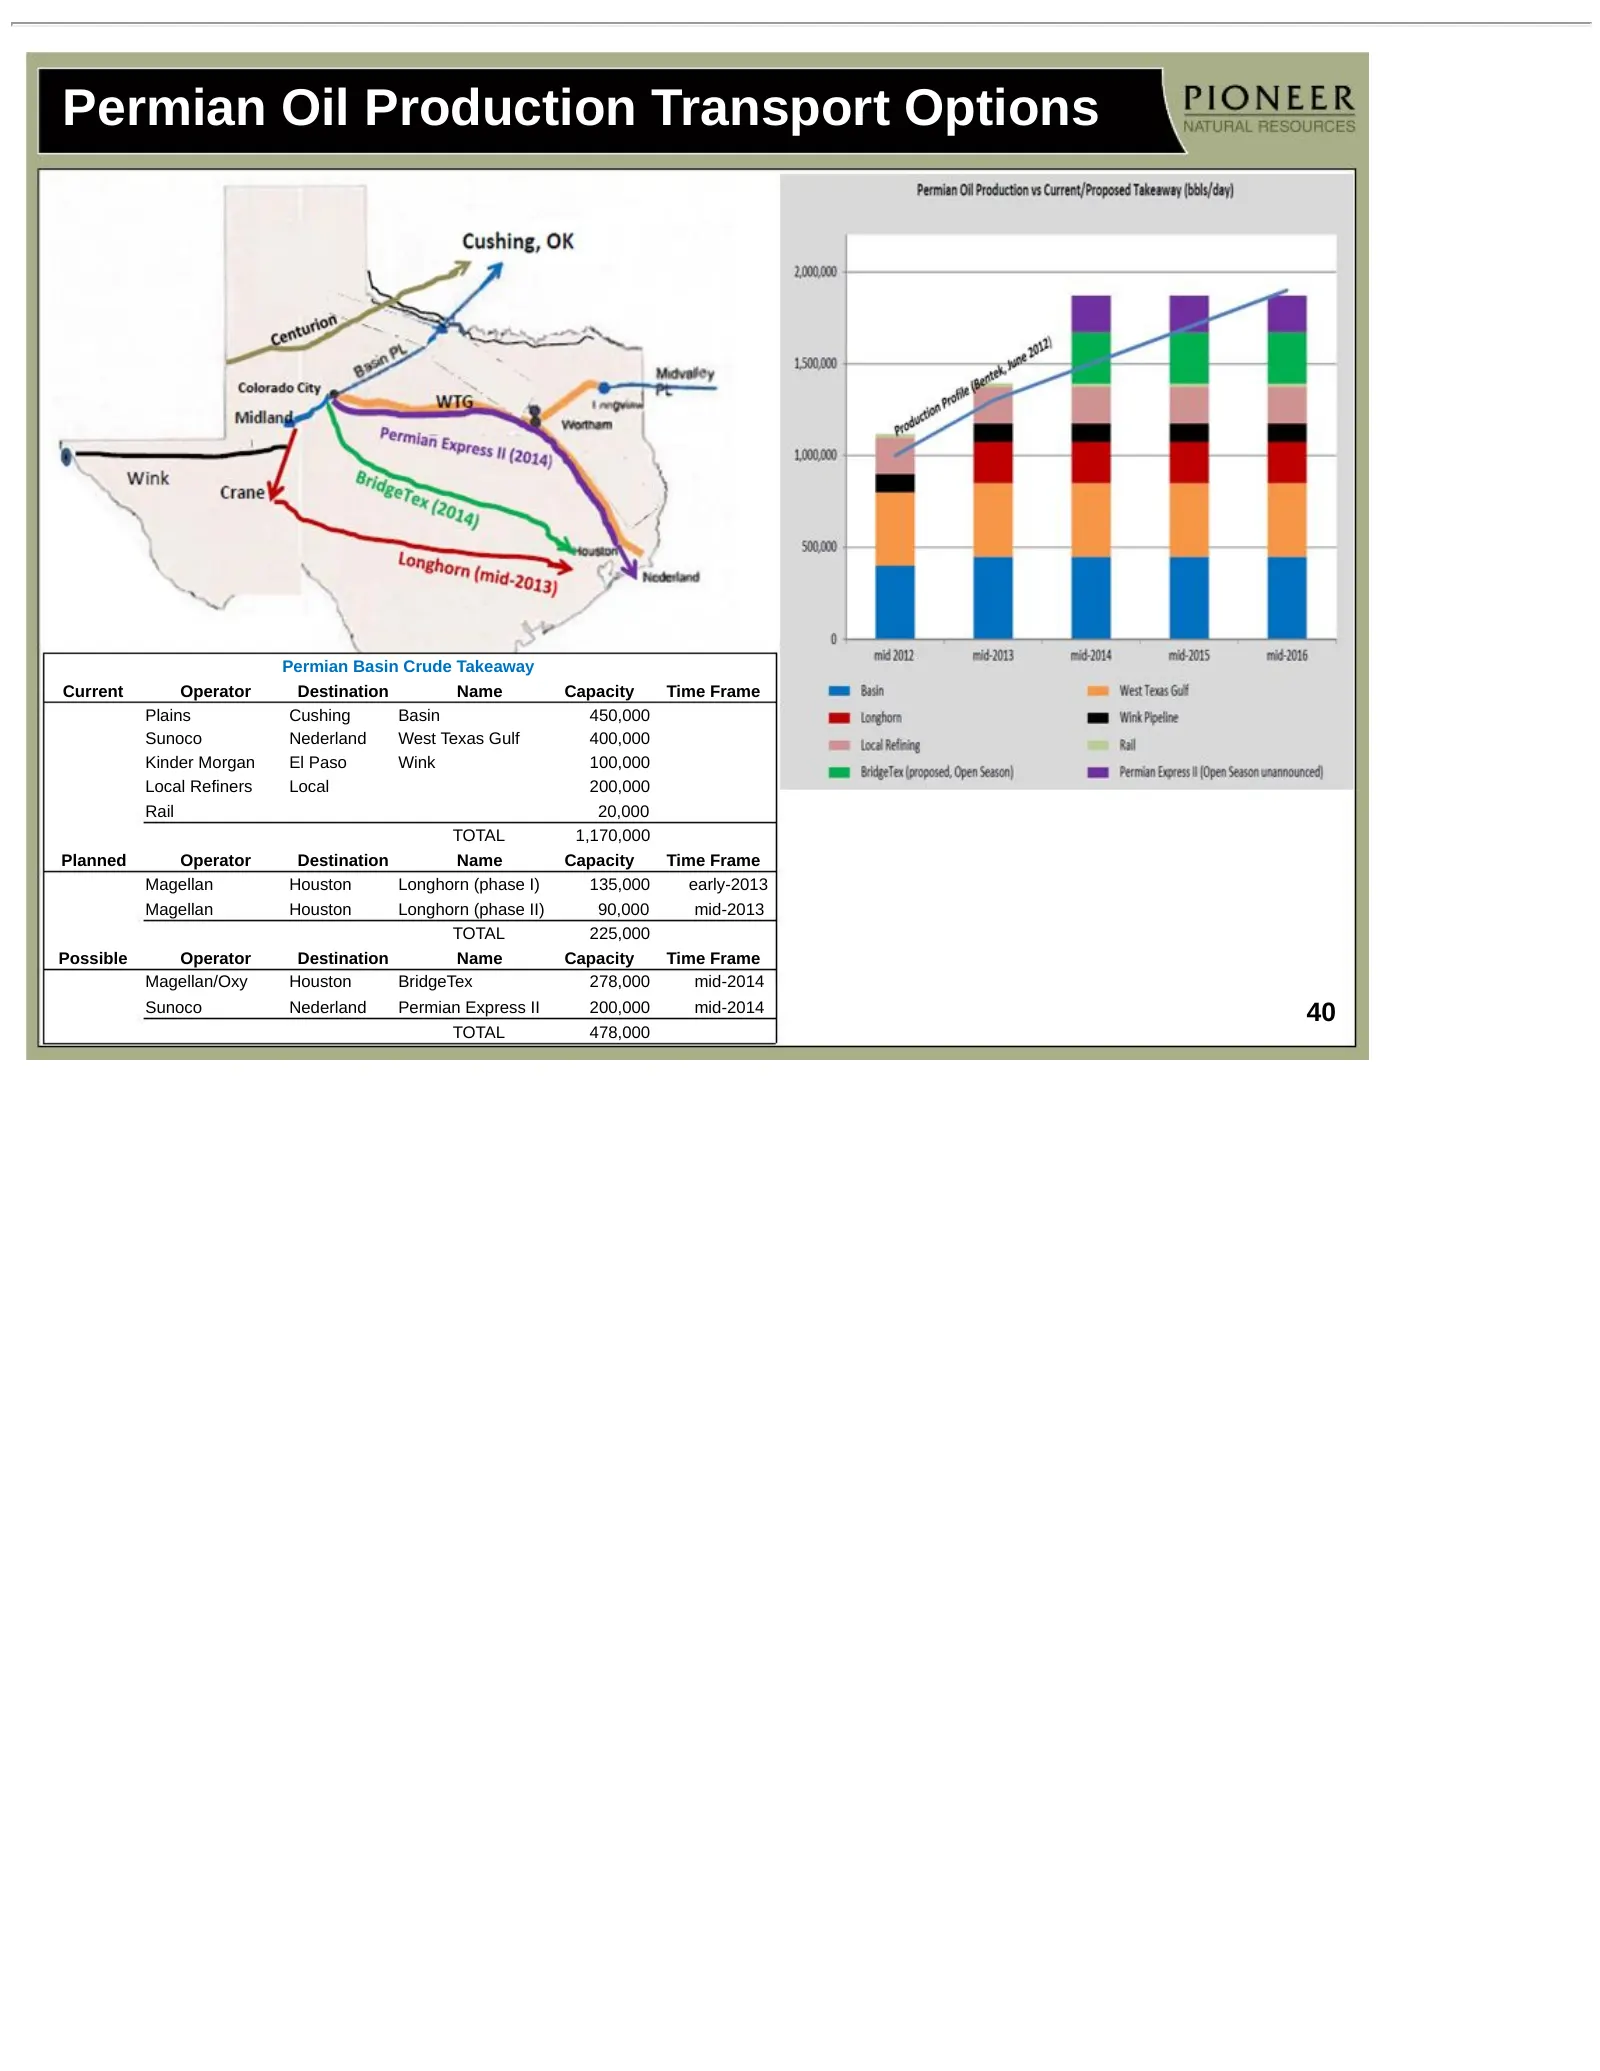
Permian Oil Production Transport Options Permian Basin Crude Takeaway Current Operator Destination Name Capacity Time Frame Plains Cushing Basin 450,000 Sunoco Nederland West Texas Gulf 400,000 Kinder Morgan El Paso Wink 100,000 Local Refiners Local 200,000 Rail 20,000 TOTAL 1,170,000 Planned Operat
Slide 41: Growing Midstream Infrastructure to Support Production Growth
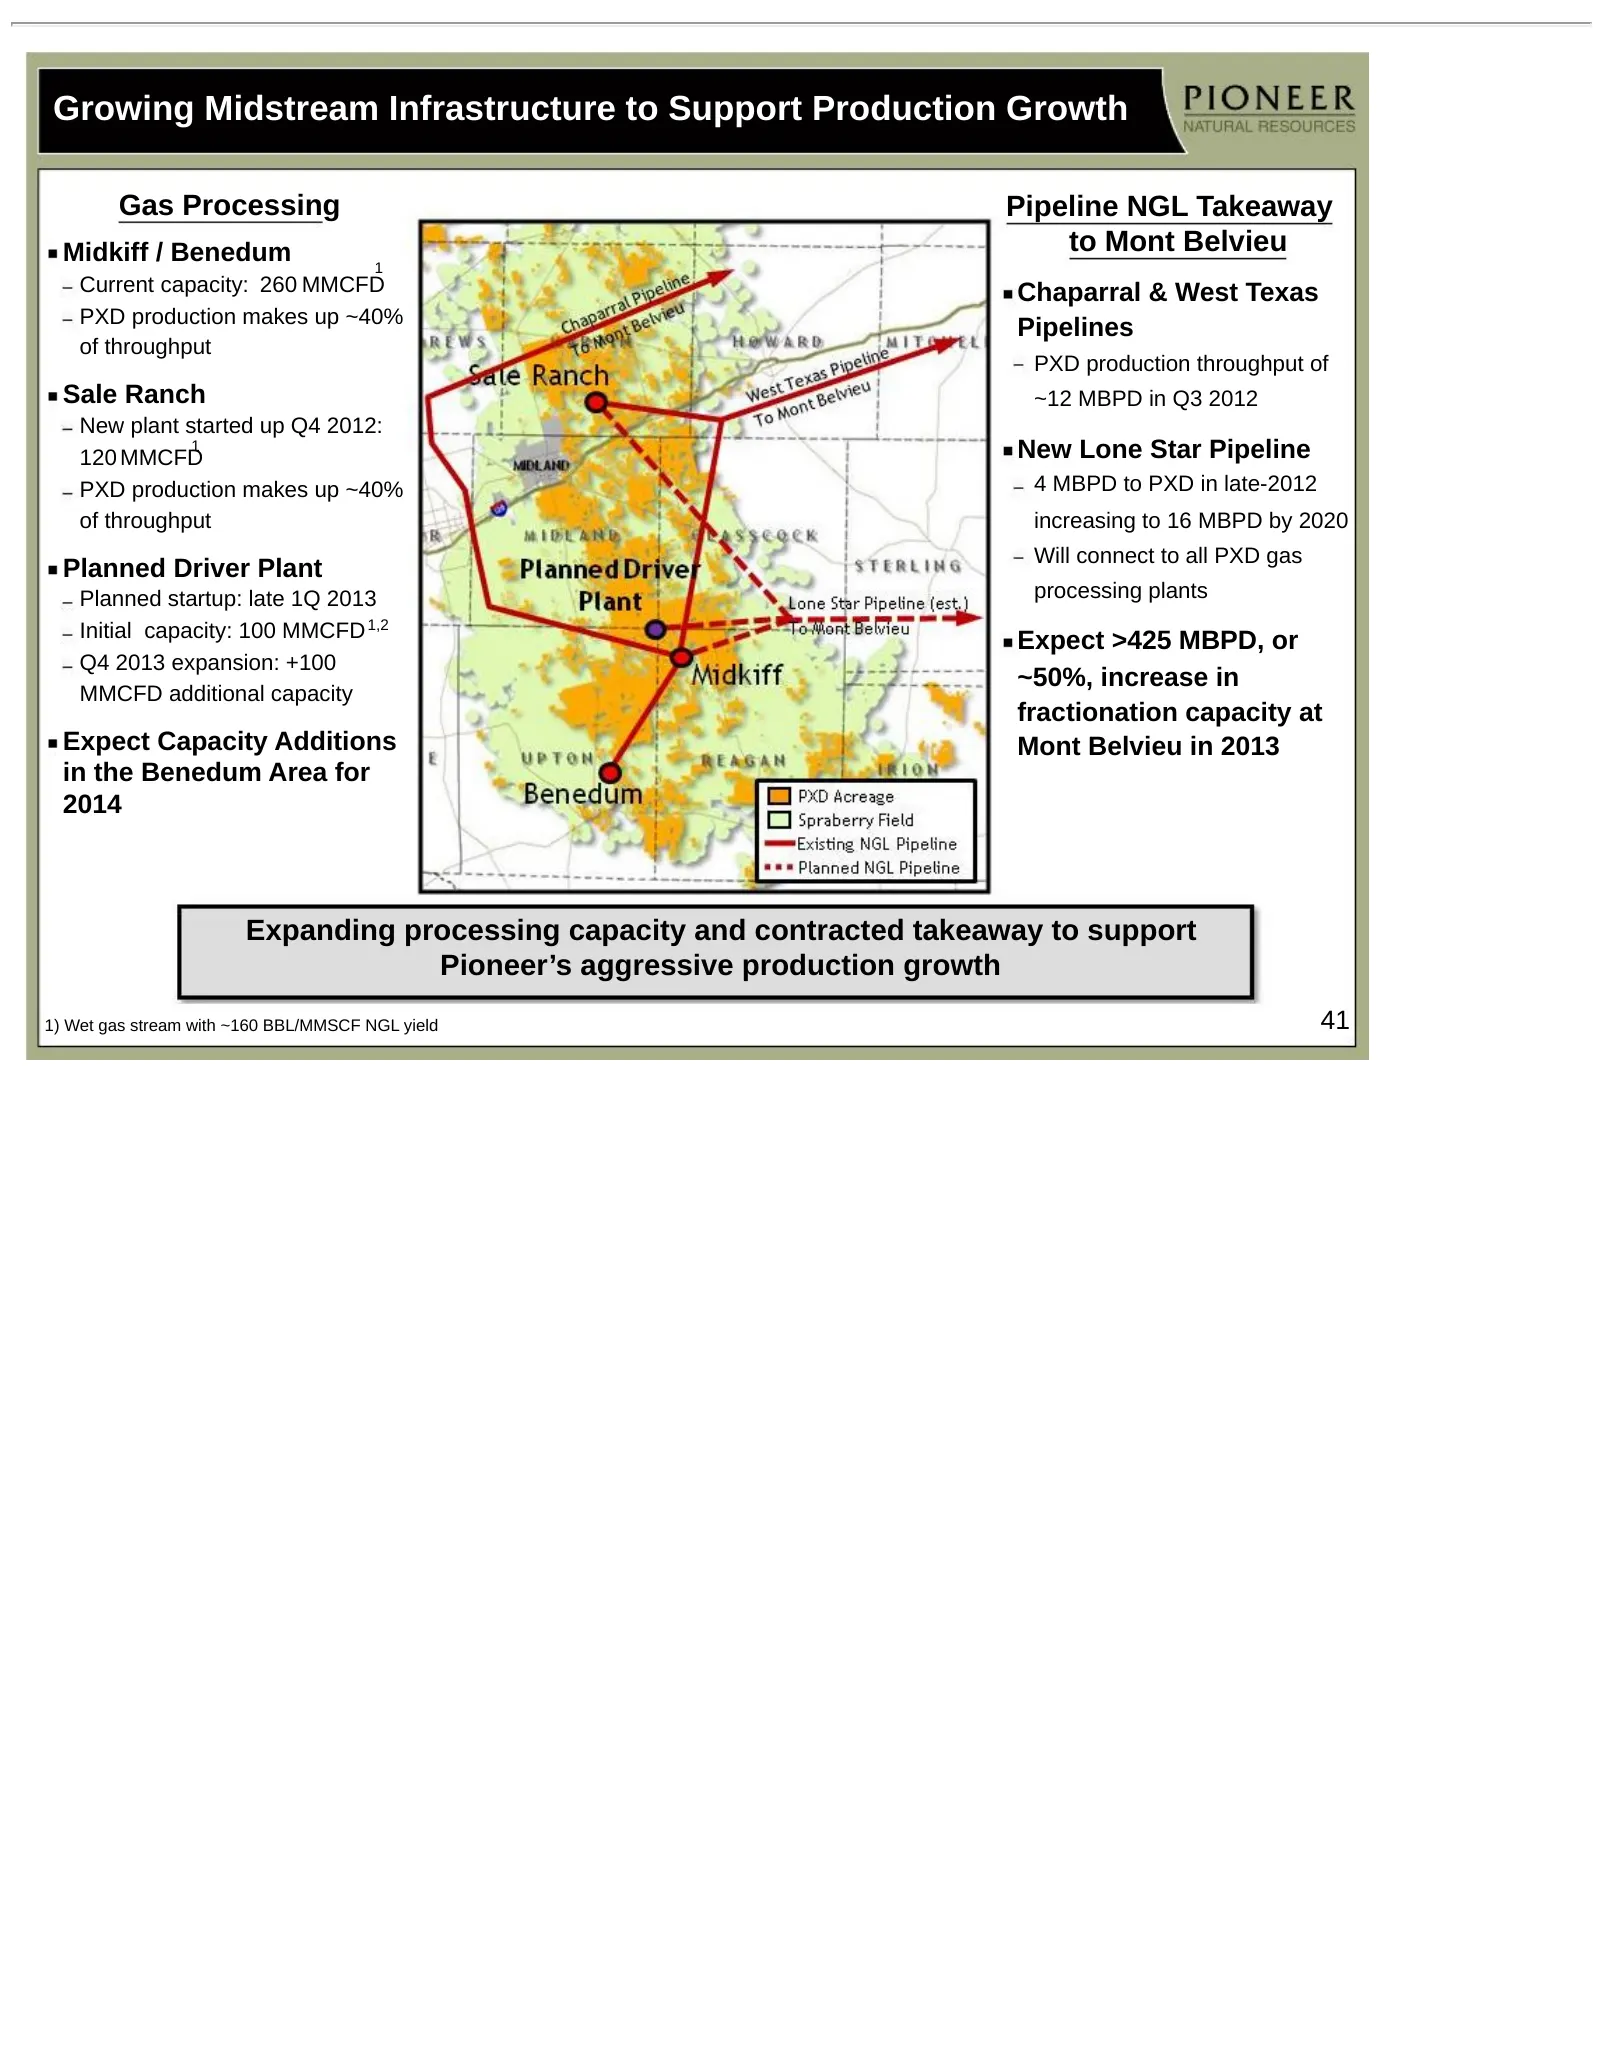
Growing Midstream Infrastructure to Support Production Growth Gas Processing Pipeline NGL Takeaway Midkiff / Benedum to Mont Belvieu 1 Current capacity: 260 MMCFD Chaparral & West Texas PXD production makes up ~40% Pipelines of throughput PXD production throughput of Sale Ranch ~12 MBPD in Q3 2012 N
Slide 42: Eagle Ford Shale: A Burgeoning Liquids-Rich Shale Play
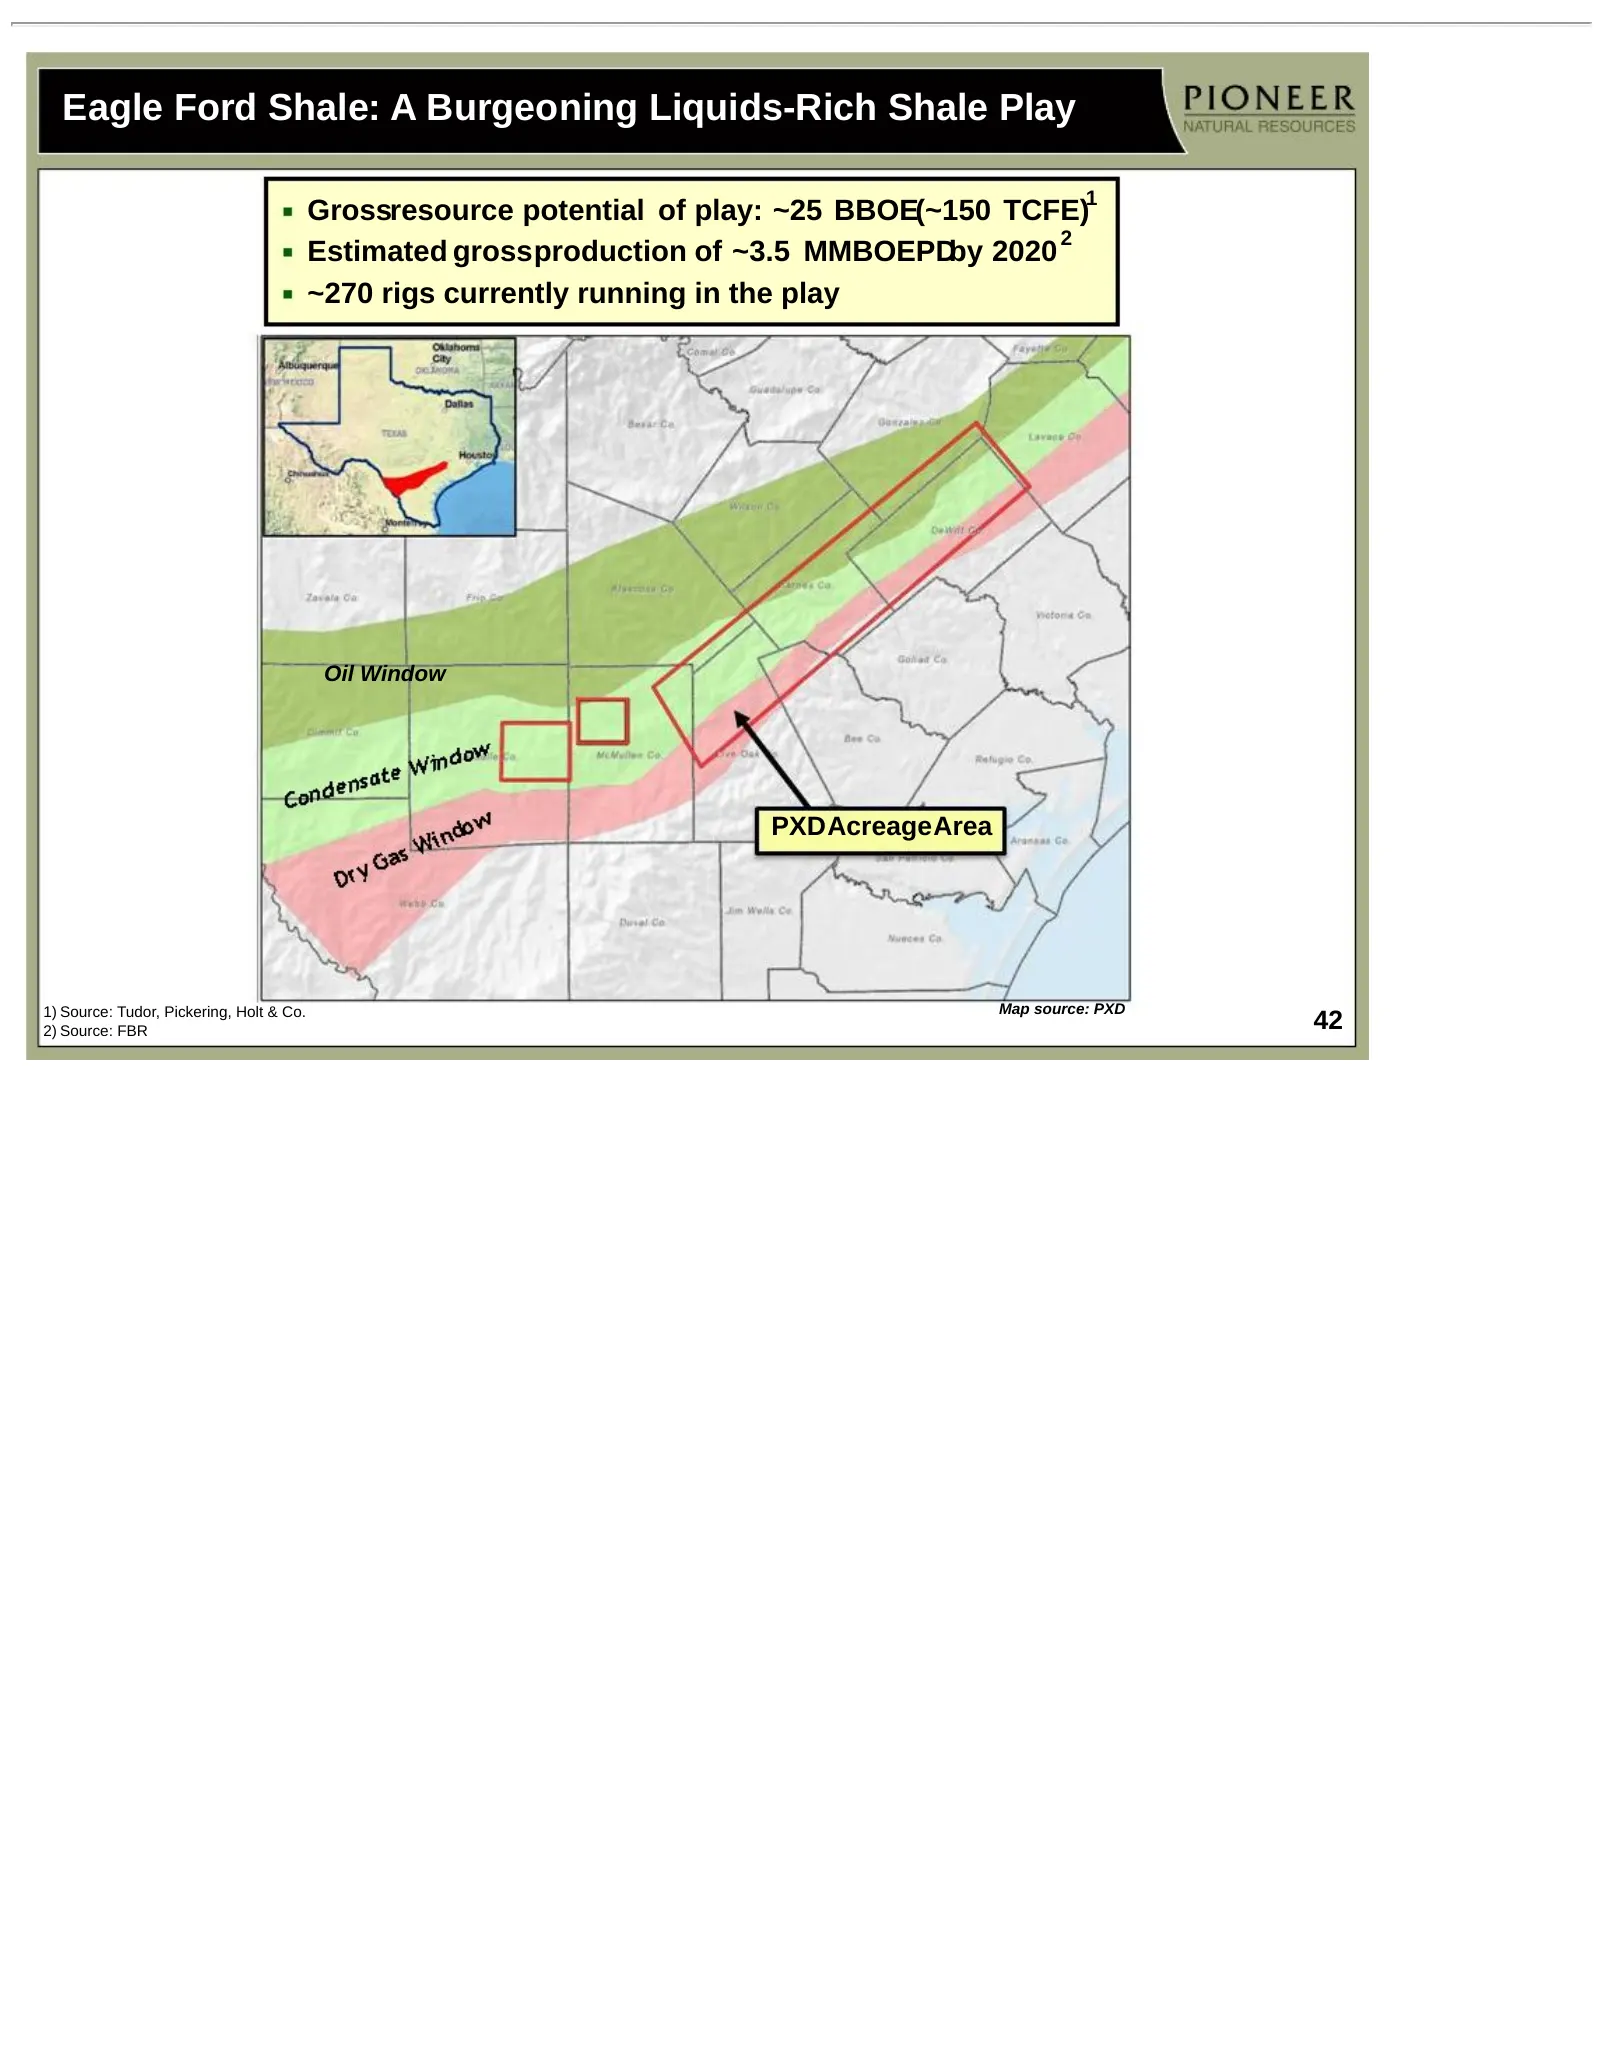
Eagle Ford Shale: A Burgeoning Liquids-Rich Shale Play 1 Grossresource potential of play: ~25 BBOE(~150 TCFE) 2 Estimated grossproduction of ~3.5 MMBOEPDby 2020 ~270 rigs currently running in the play Oil Window PXDAcreageArea 1) Source: Tudor, Pickering, Holt & Co. Map source: PXD 2) Source: FBR 42
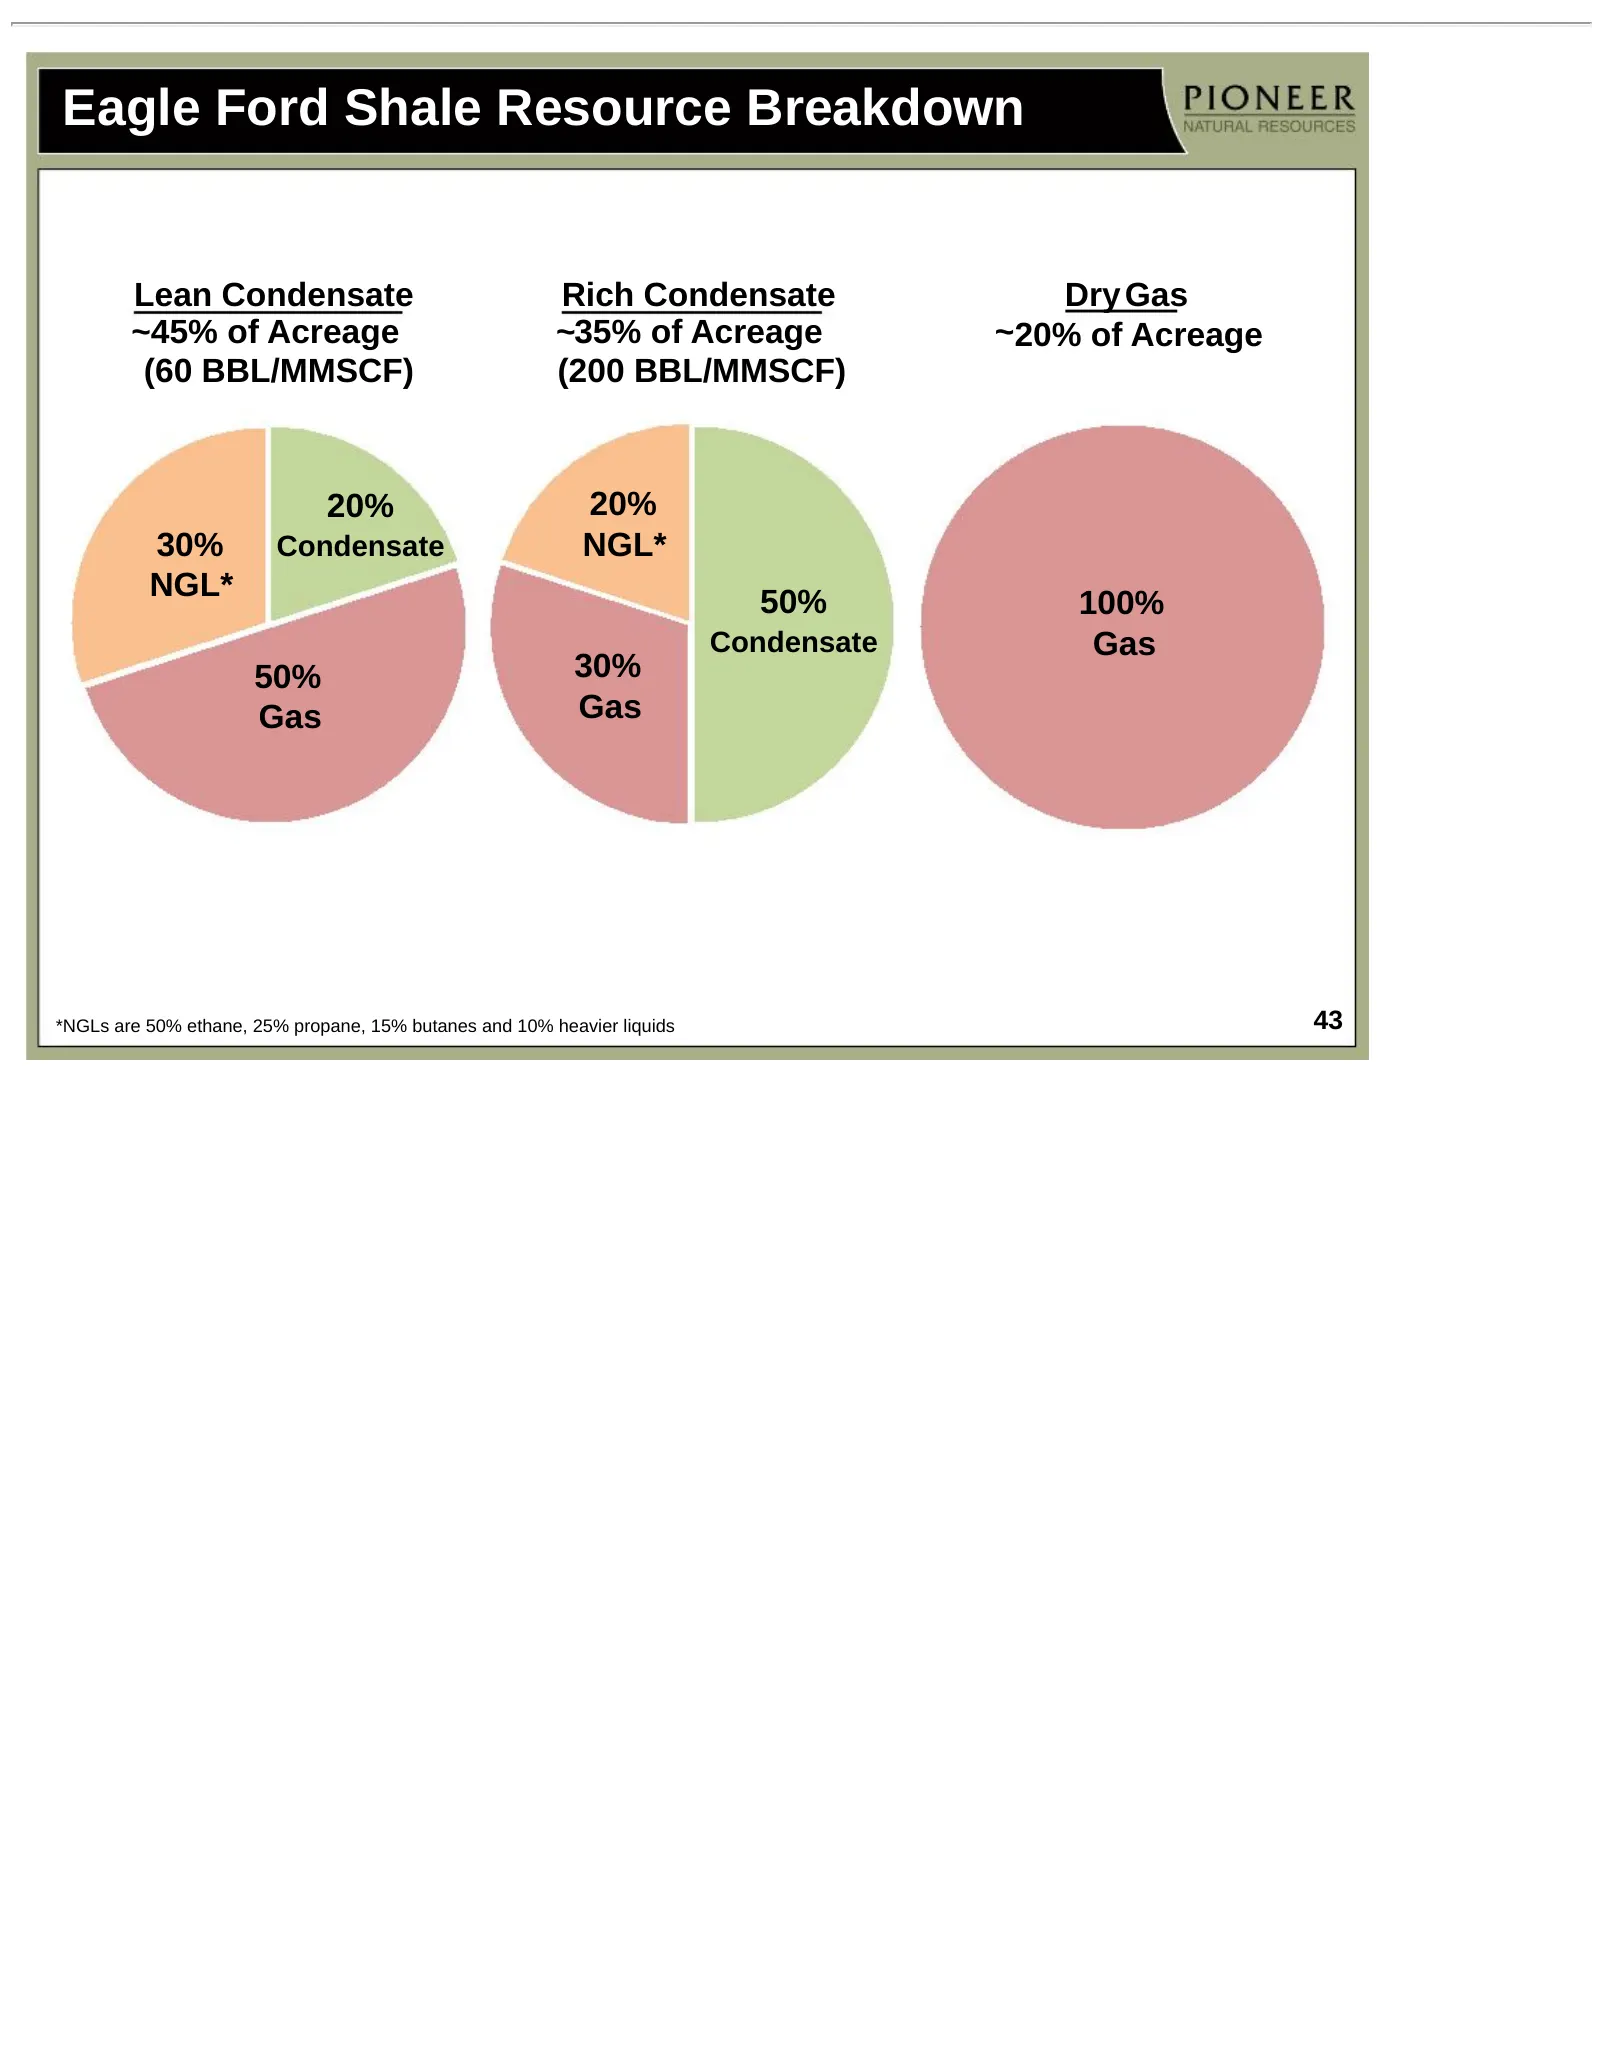
Slide 43: Eagle Ford Shale Resource Breakdown
Eagle Ford Shale Resource Breakdown Lean Condensate Rich Condensate Dry Gas ~45% of Acreage ~35% of Acreage ~20% of Acreage (60 BBL/MMSCF) (200 BBL/MMSCF) 20% 20% 30% Condensate NGL* NGL* 50% 100% Condensate Gas 50% 30% Gas Gas *NGLs are 50% ethane, 25% propane, 15% butanes and 10% heavier liquids 4
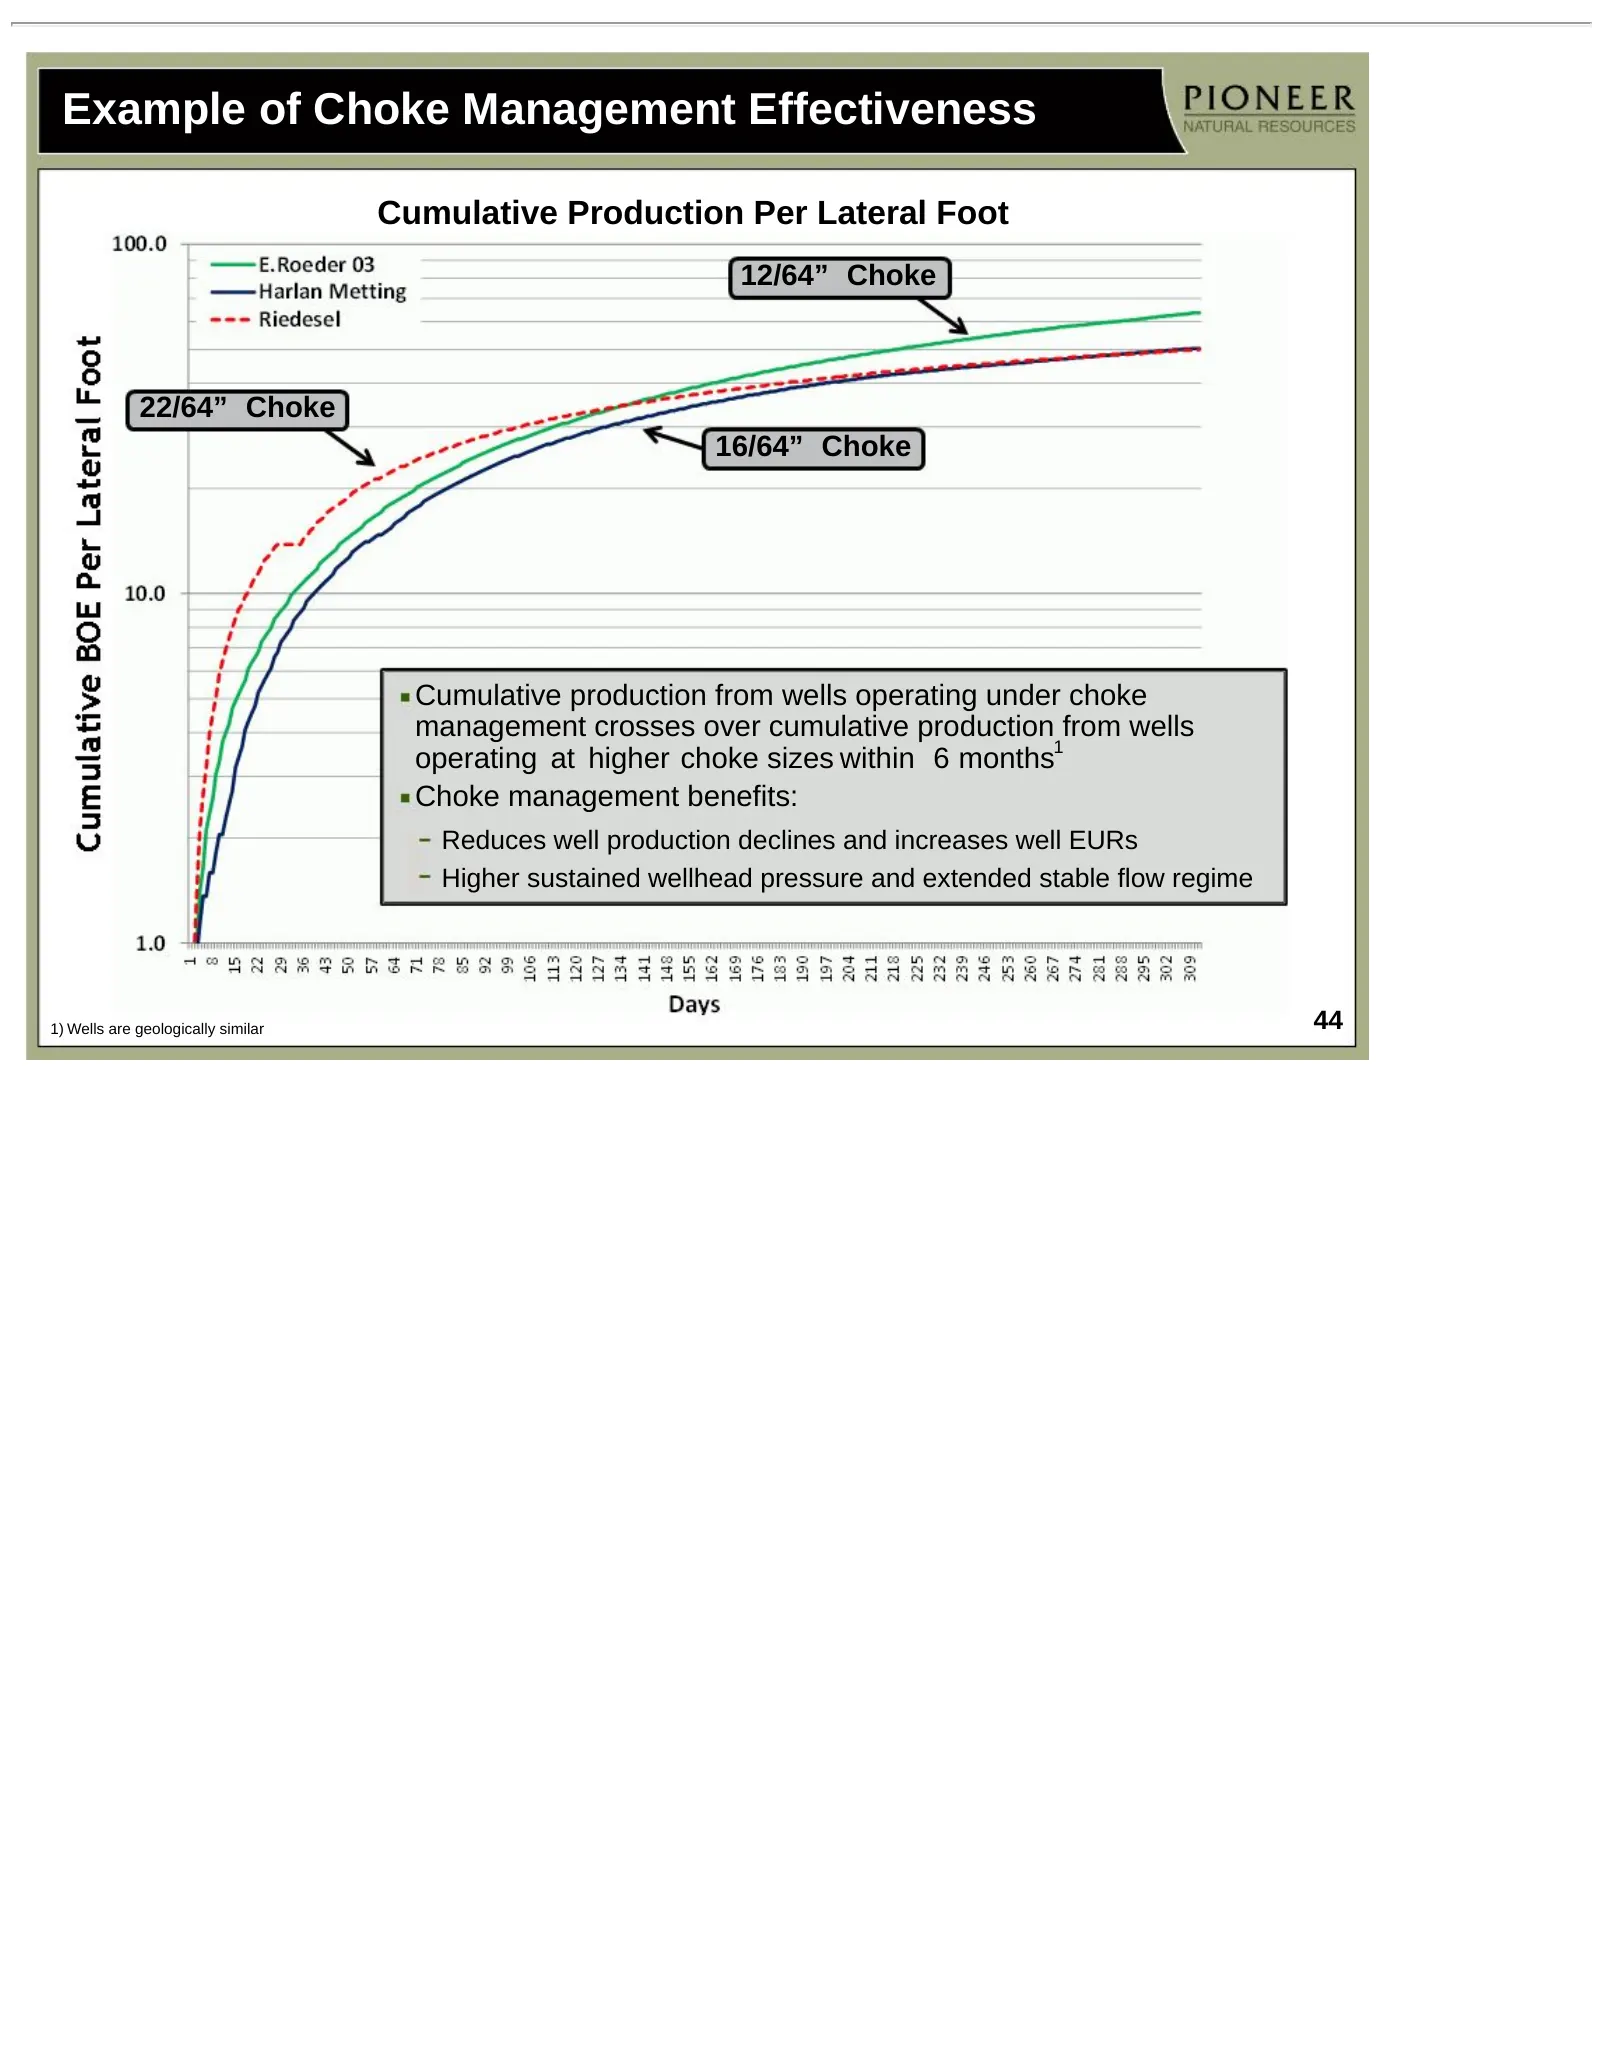
Slide 44: Example of Choke Management Effectiveness
Example of Choke Management Effectiveness Cumulative Production Per Lateral Foot 12/64” Choke 22/64” Choke 16/64” Choke Cumulative production from wells operating under choke management crosses over cumulative production from wells 1 operating at higher choke sizes within 6 months Choke management b
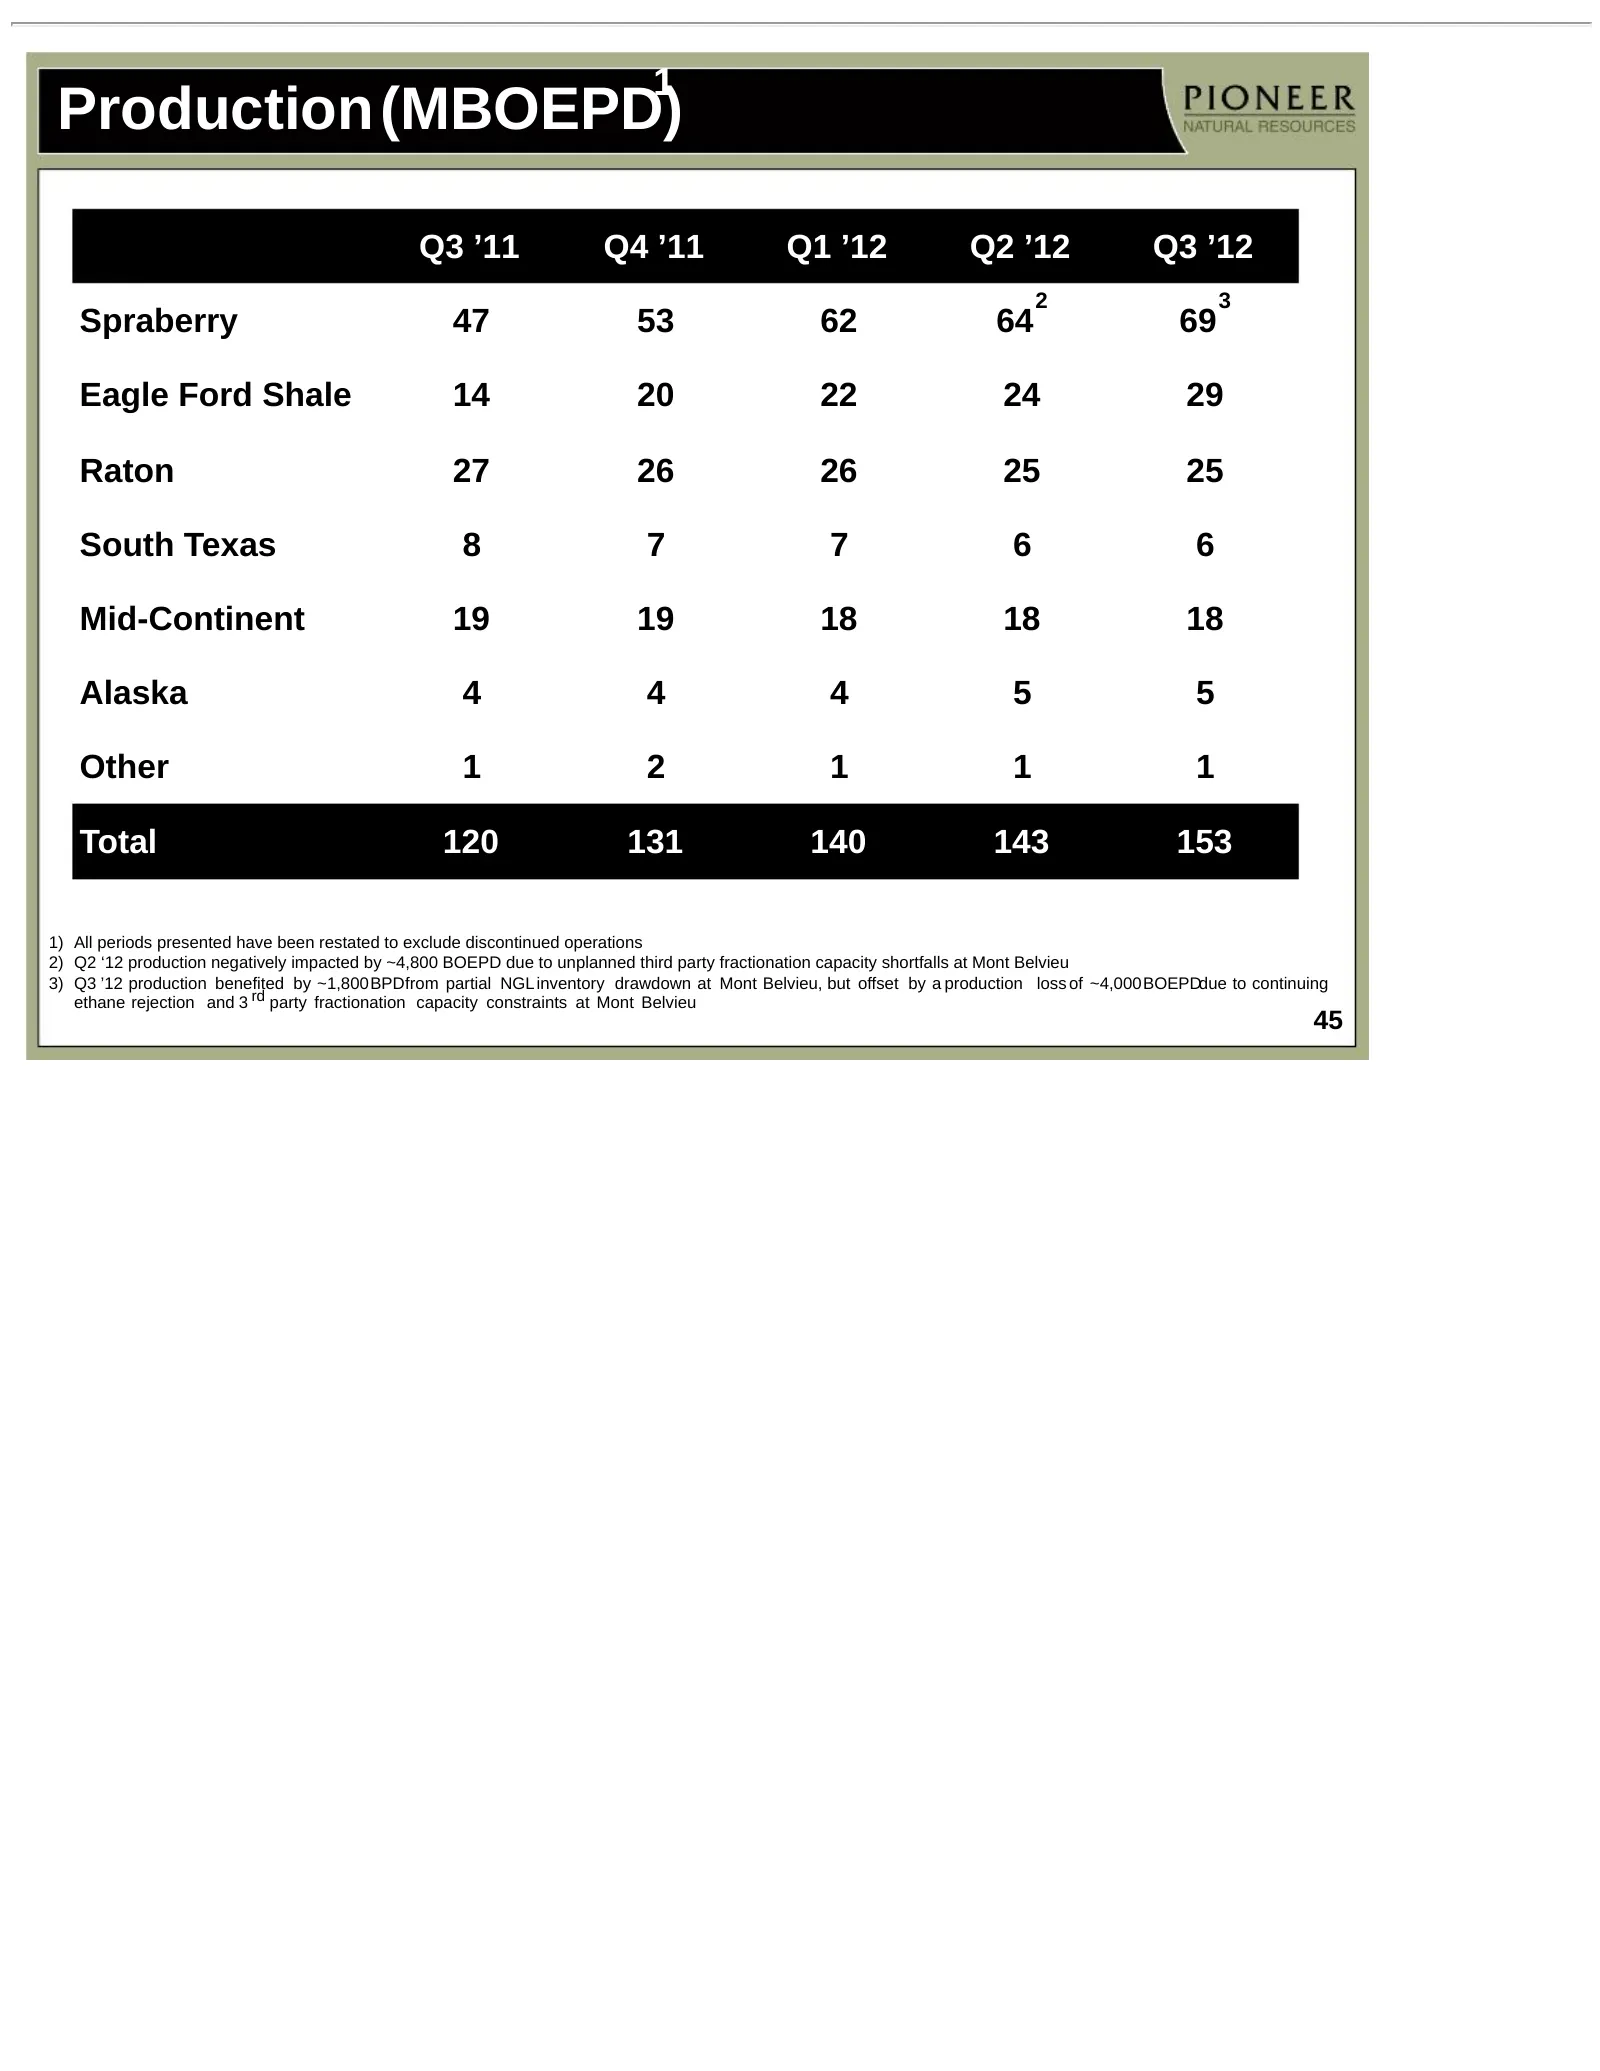
Slide 45: Production (MBOEPD)
1 Production(MBOEPD) Q3 ’11 Q4 ’11 Q1 ’12 Q2 ’12 Q3 ’12 2 3 Spraberry 47 53 62 64 69 Eagle Ford Shale 14 20 22 24 29 Raton 27 26 26 25 25 South Texas 8 7 7 6 6 Mid-Continent 19 19 18 18 18 Alaska 4 4 4 5 5 Other 1 2 1 1 1 Total 120 131 140 143 153 1) All periods presented have been restated to exclu
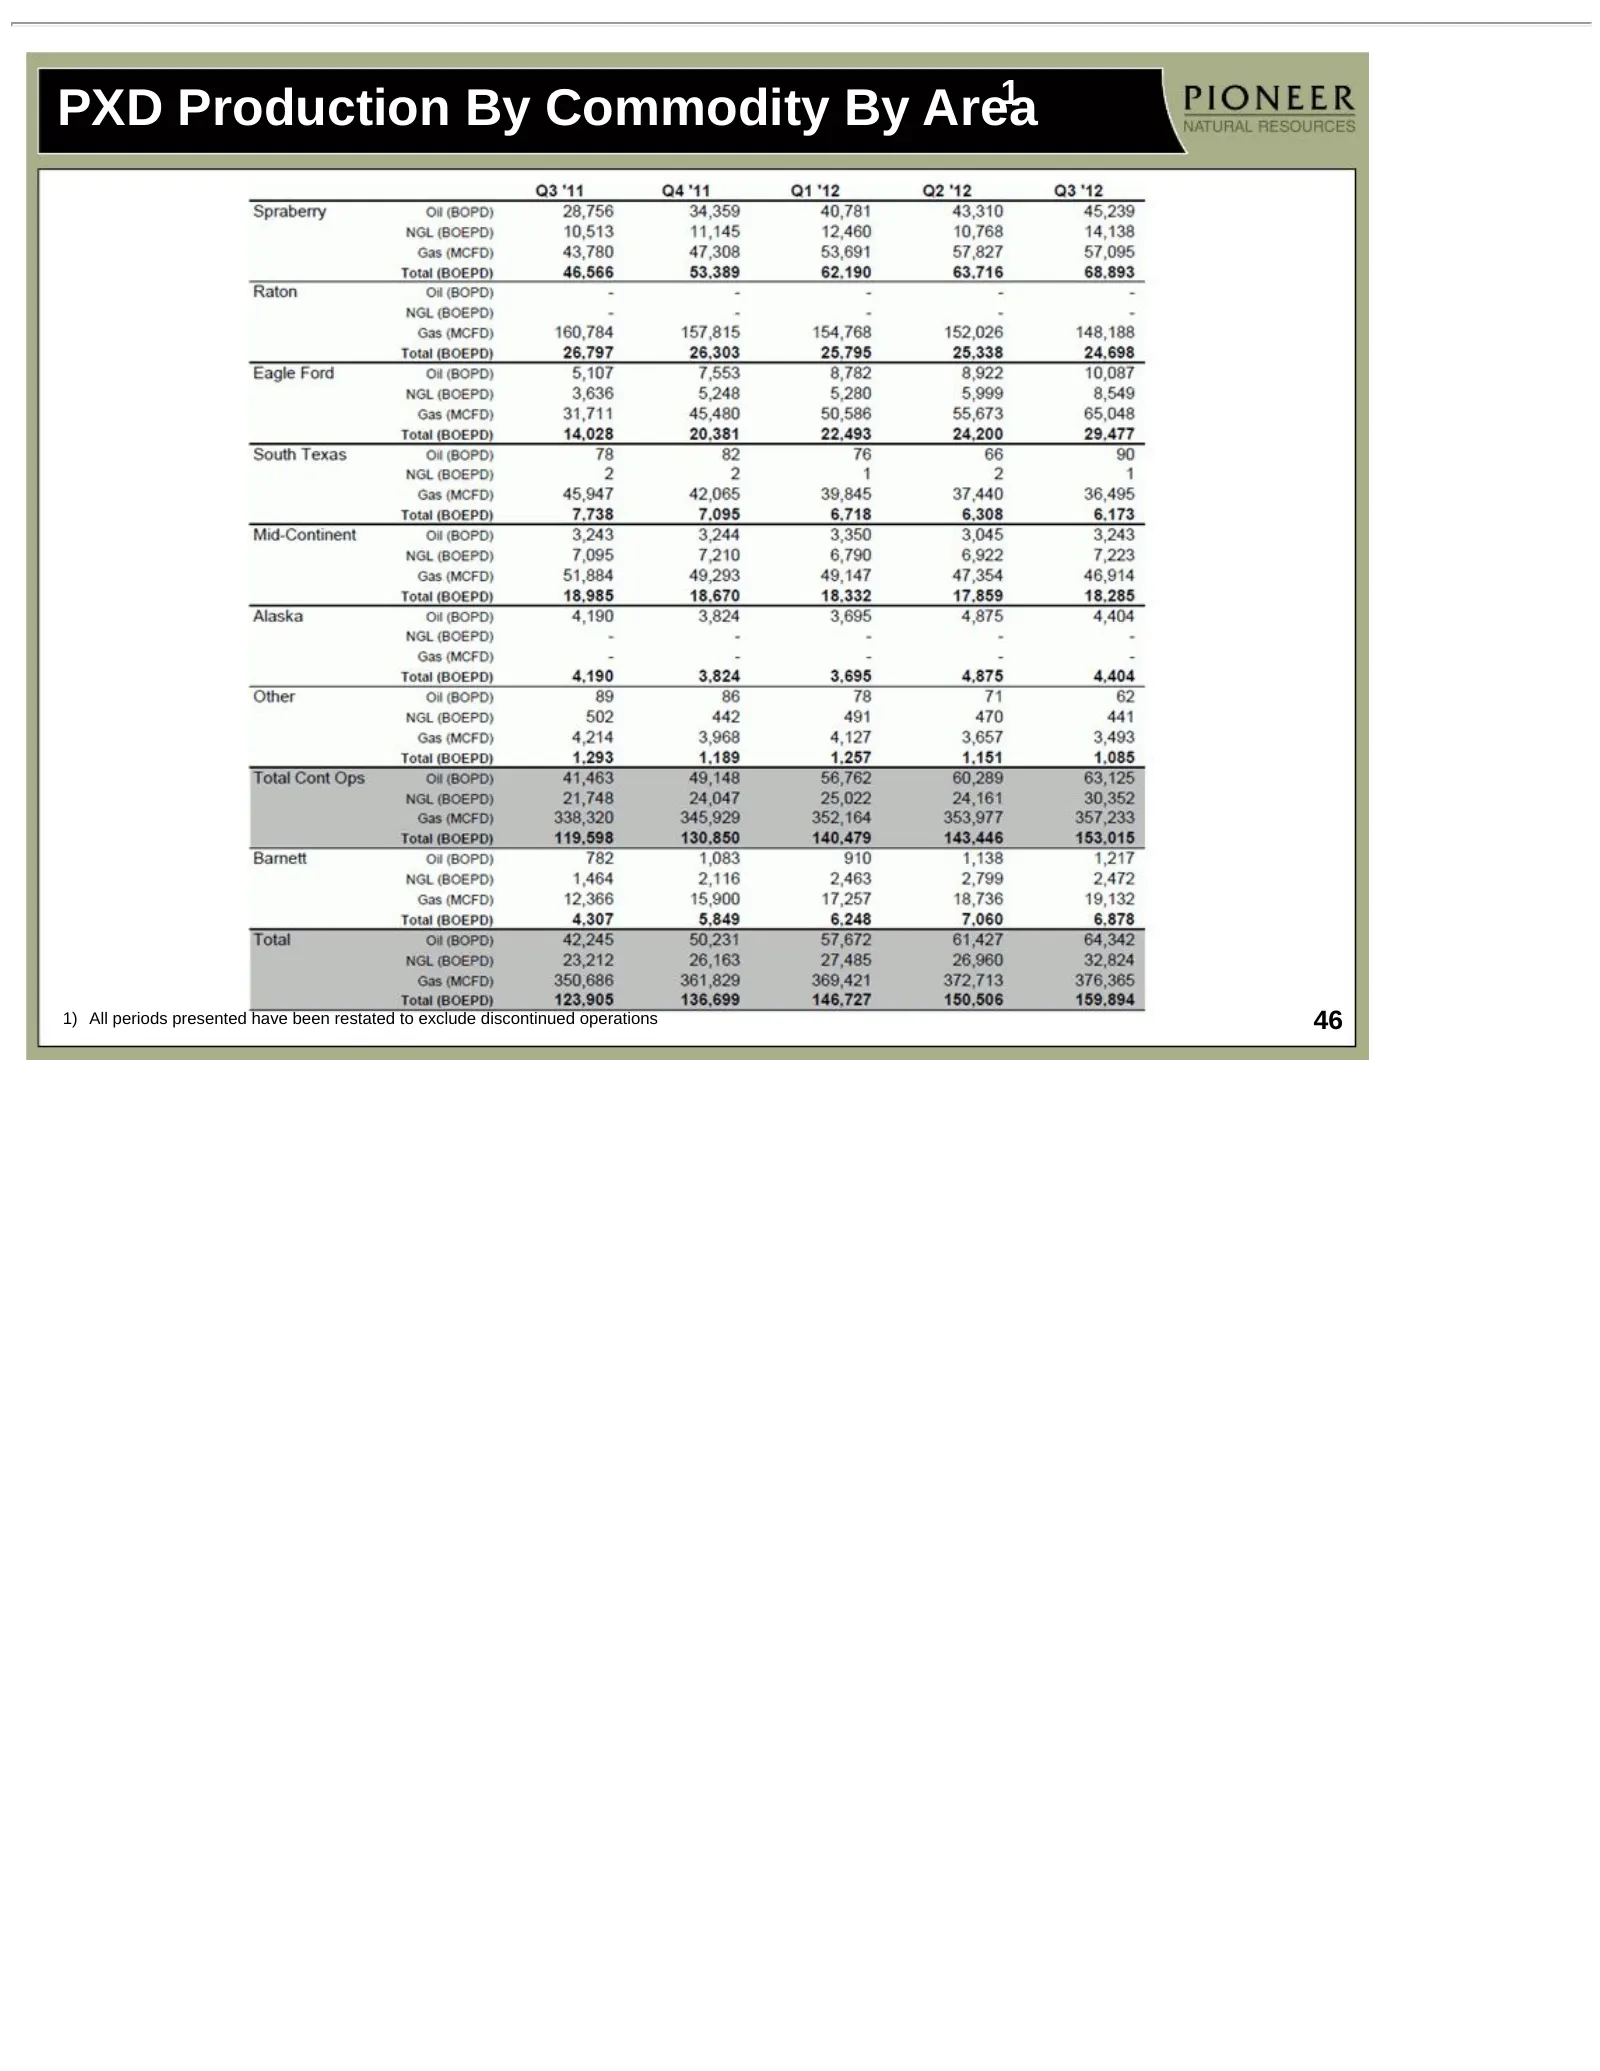
Slide 46: PXD Production By Commodity By Area
1 PXD Production By Commodity By Area 1) All periods presented have been restated to exclude discontinued operations 46
Slide 47: Production Costs (per BOE)
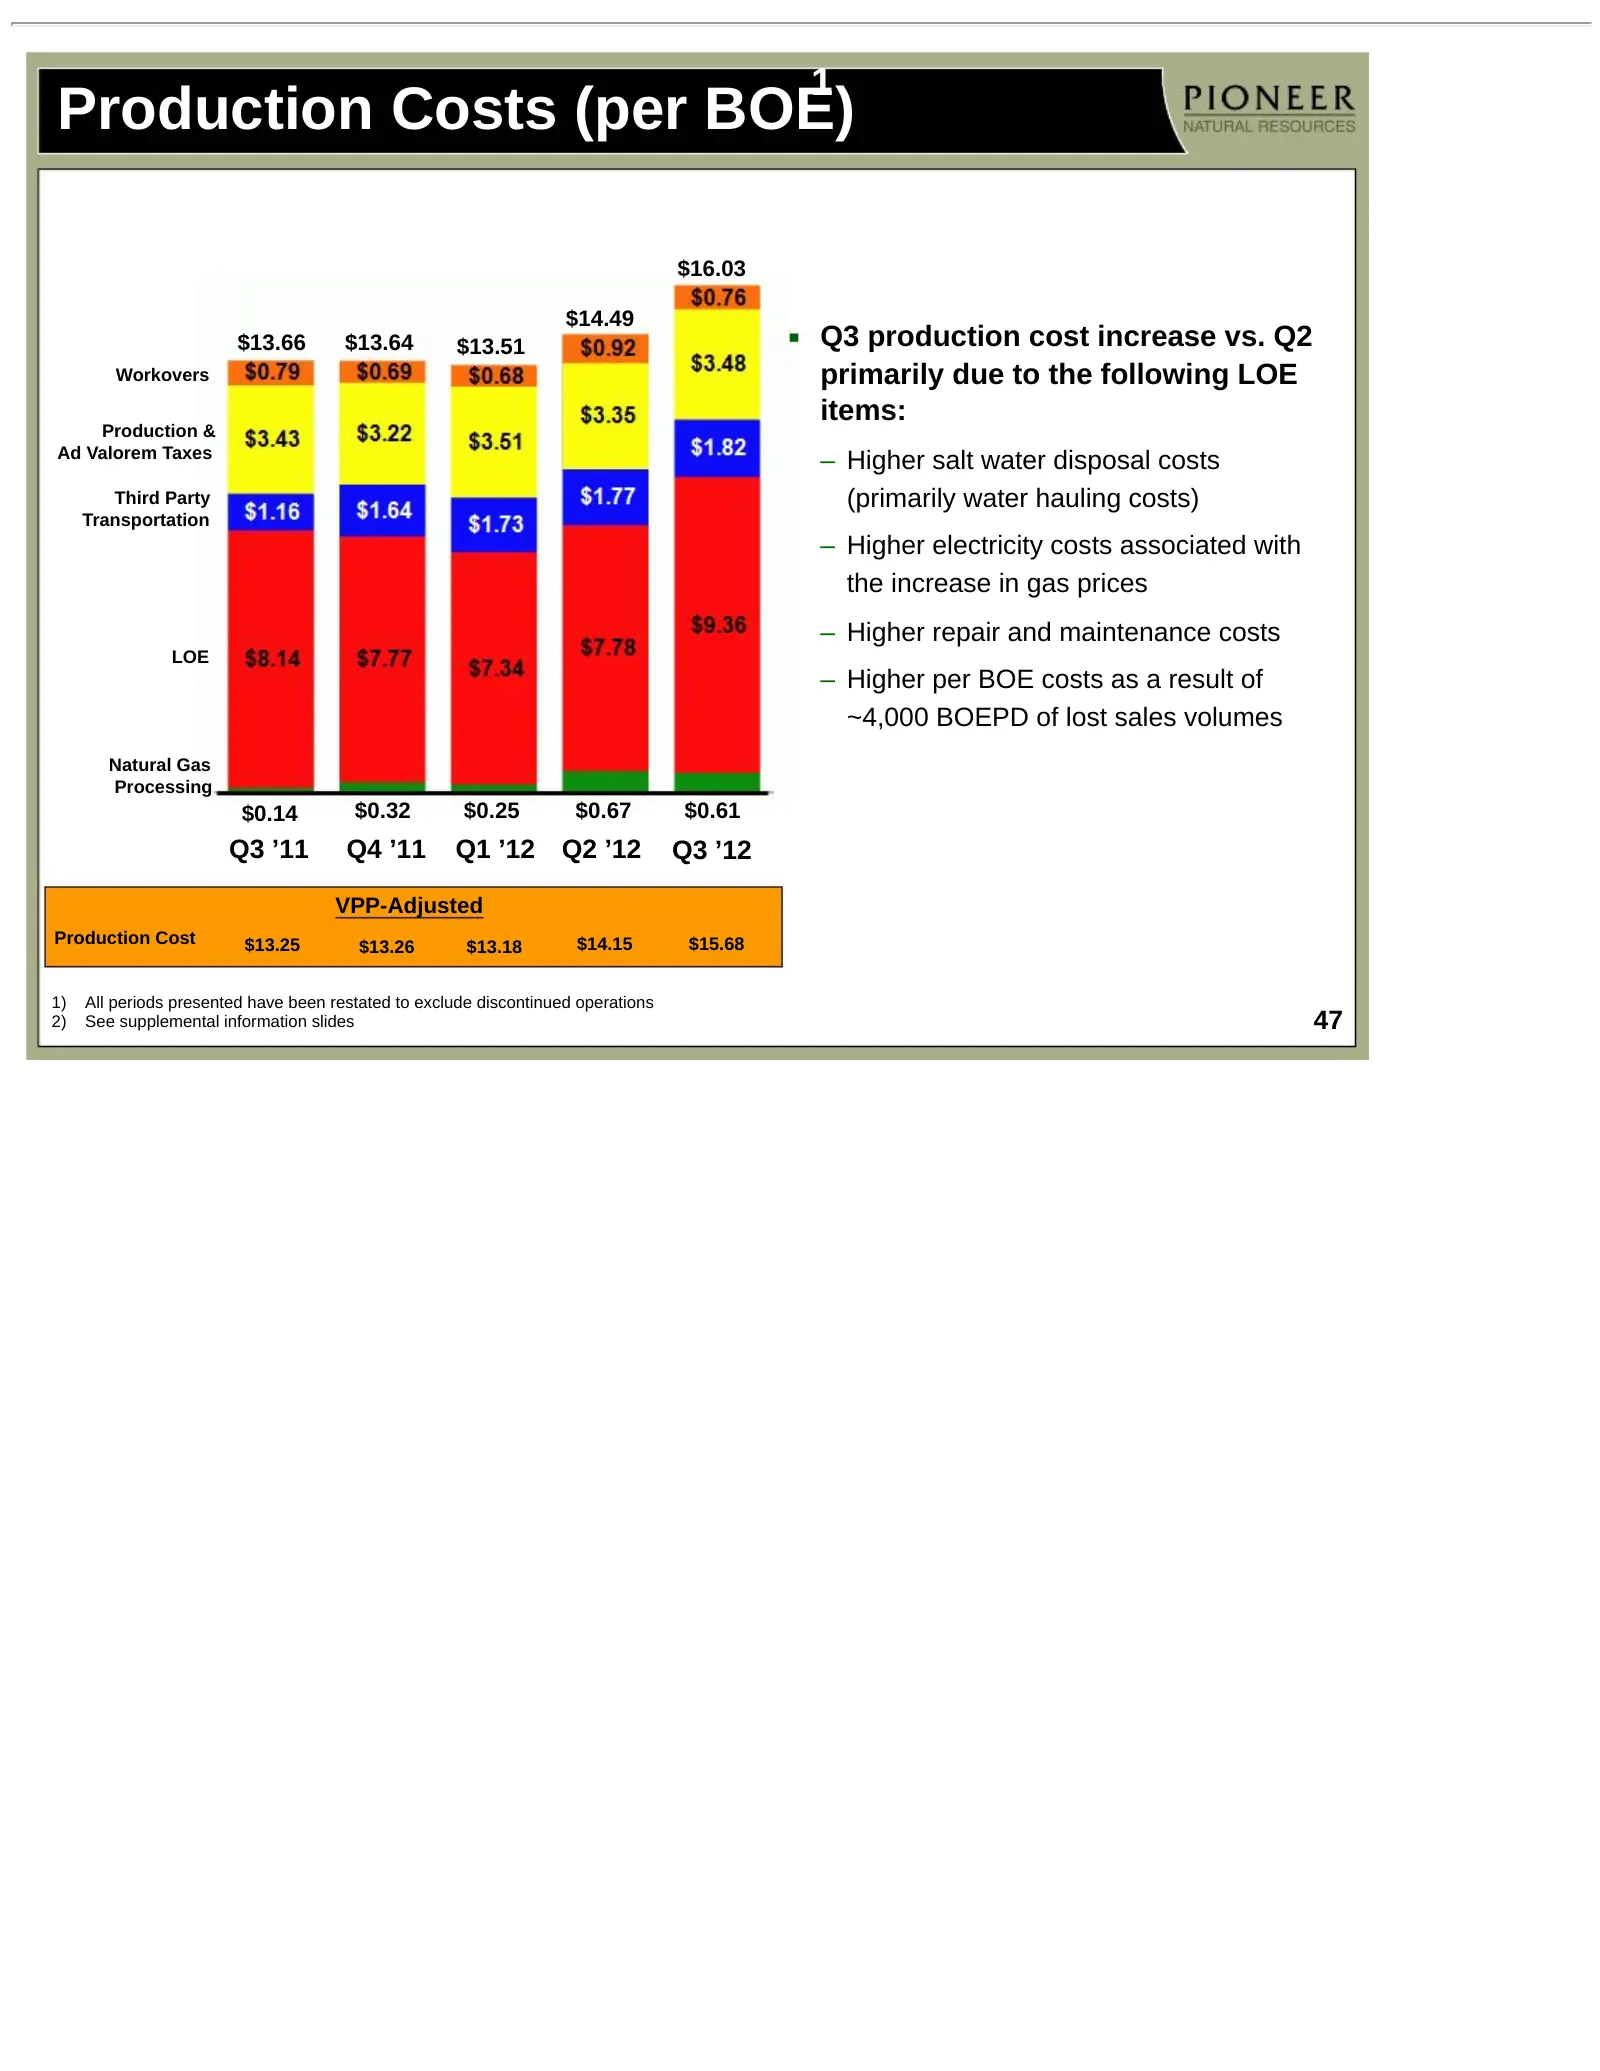
1 Production Costs (per BOE) $16.03 $14.49 $13.66 $13.64 $13.51 Q3 production cost increase vs. Q2 Workovers primarily due to the following LOE items: Production & Ad Valorem Taxes – Higher salt water disposal costs Third Party (primarily water hauling costs) Transportation – Higher electricity cost
Slide 48: VPP-Adjusted Production Costs
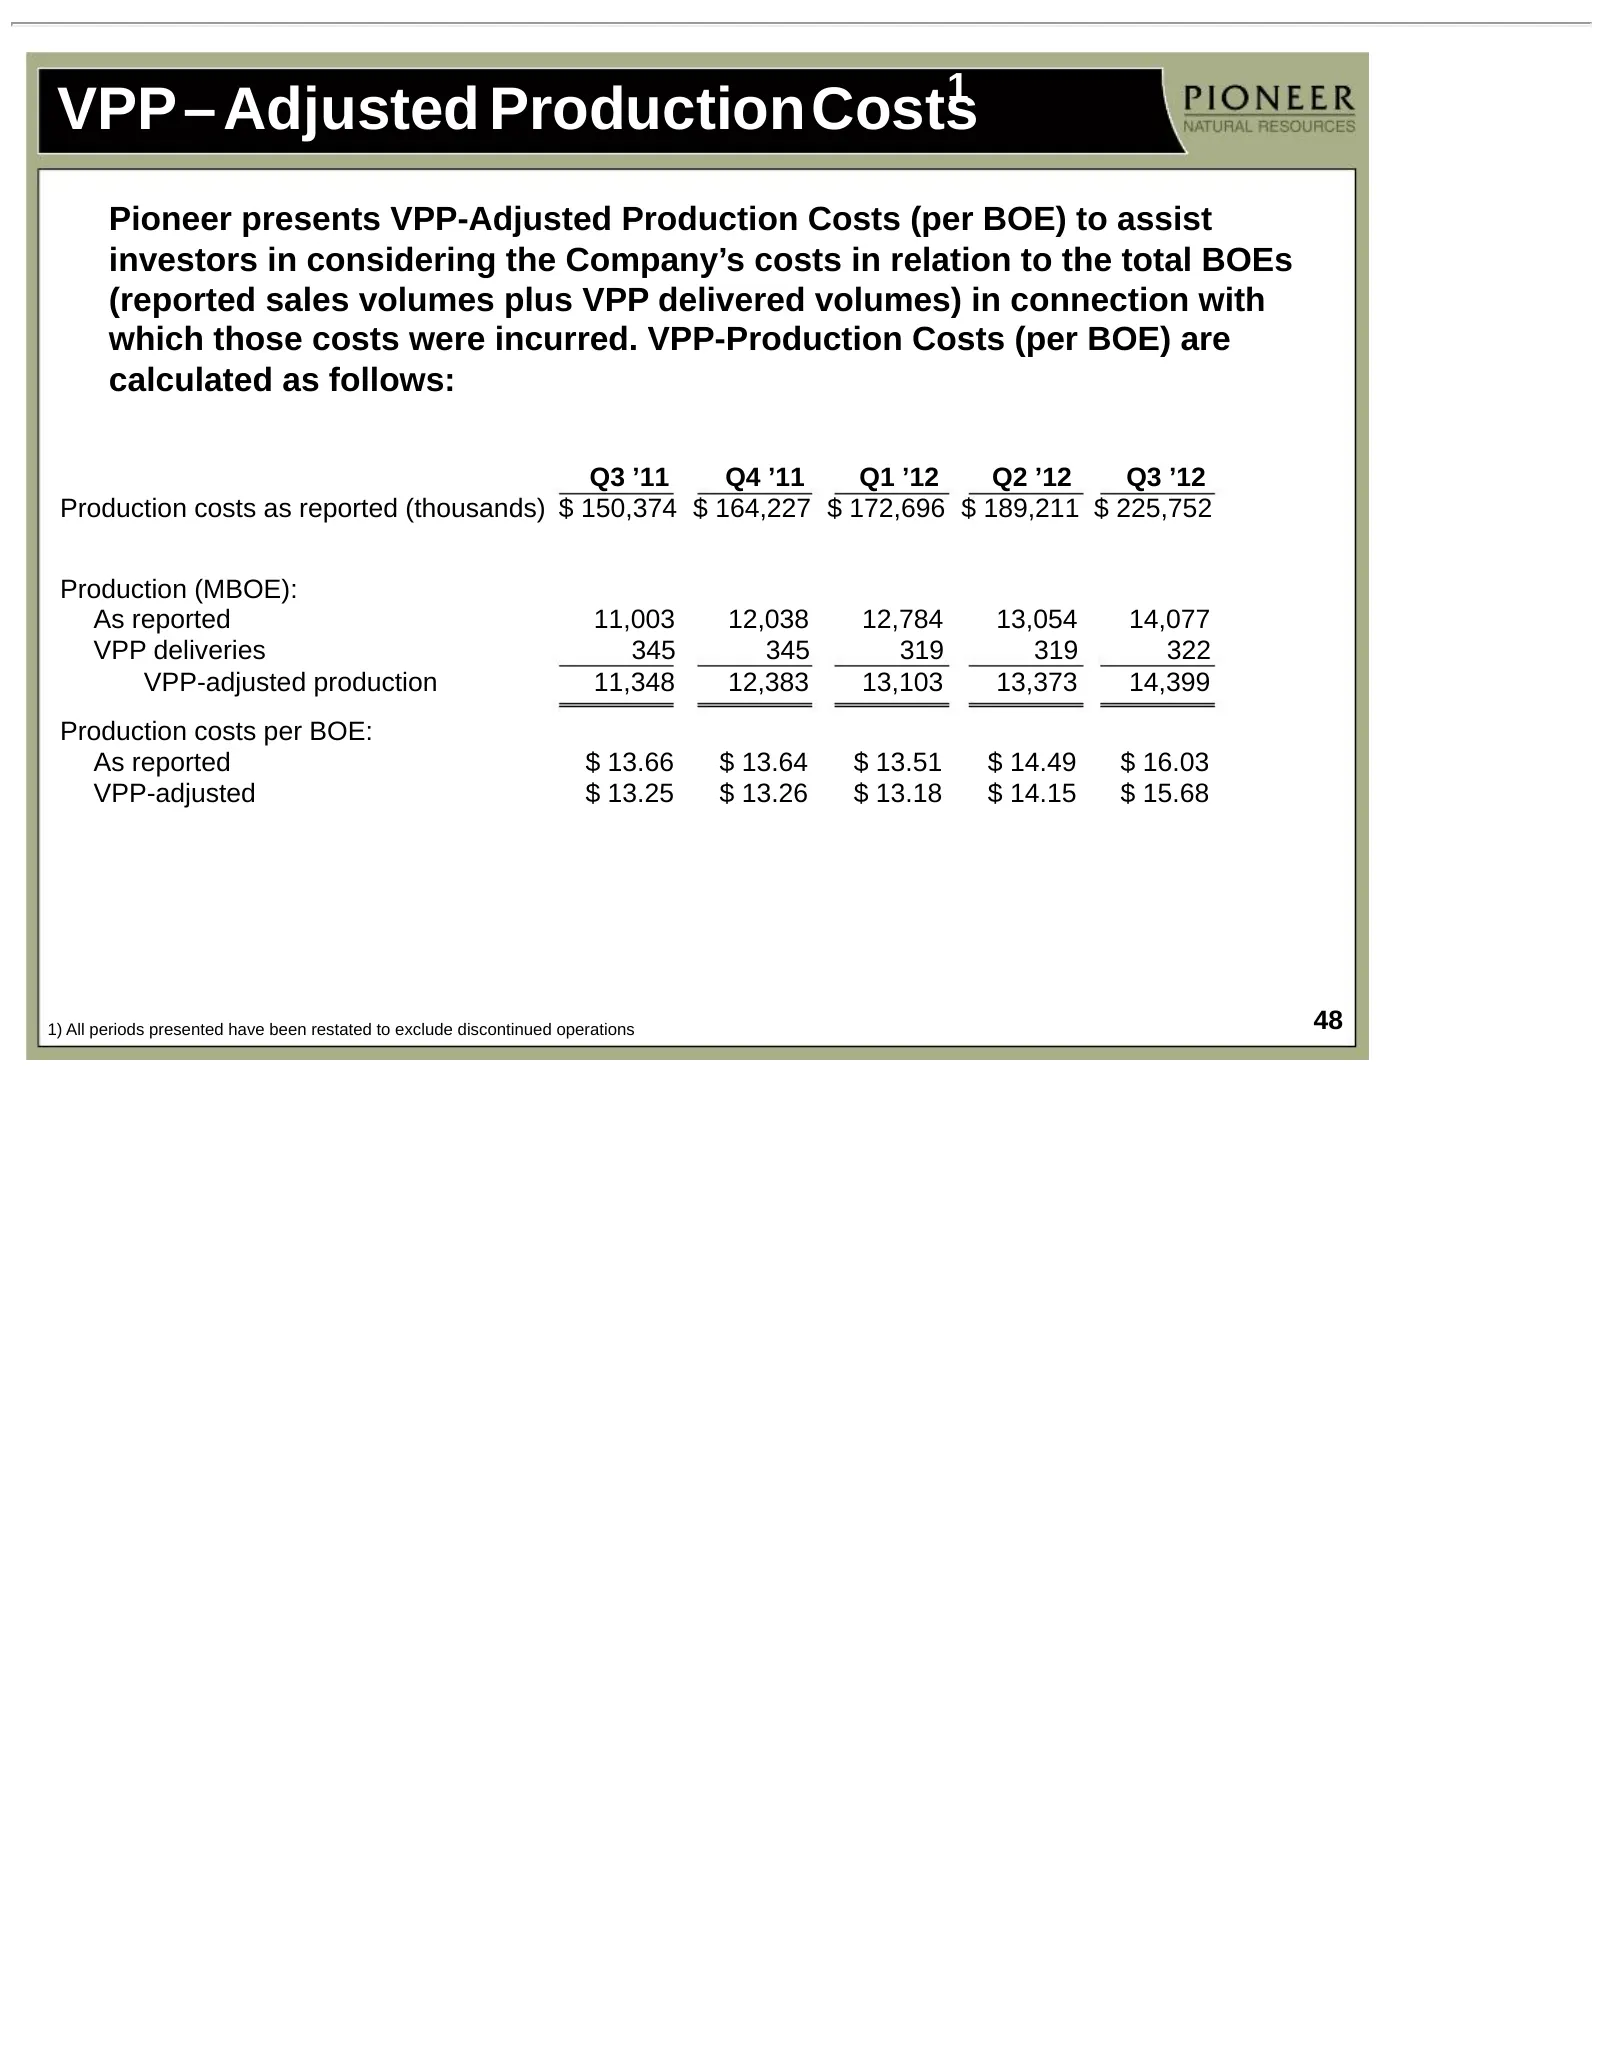
1 VPP– Adjusted ProductionCosts Pioneer presents VPP-Adjusted Production Costs (per BOE) to assist investors in considering the Company’s costs in relation to the total BOEs (reported sales volumes plus VPP delivered volumes) in connection with which those costs were incurred. VPP-Production Costs (
Slide 49: VPP Expirations
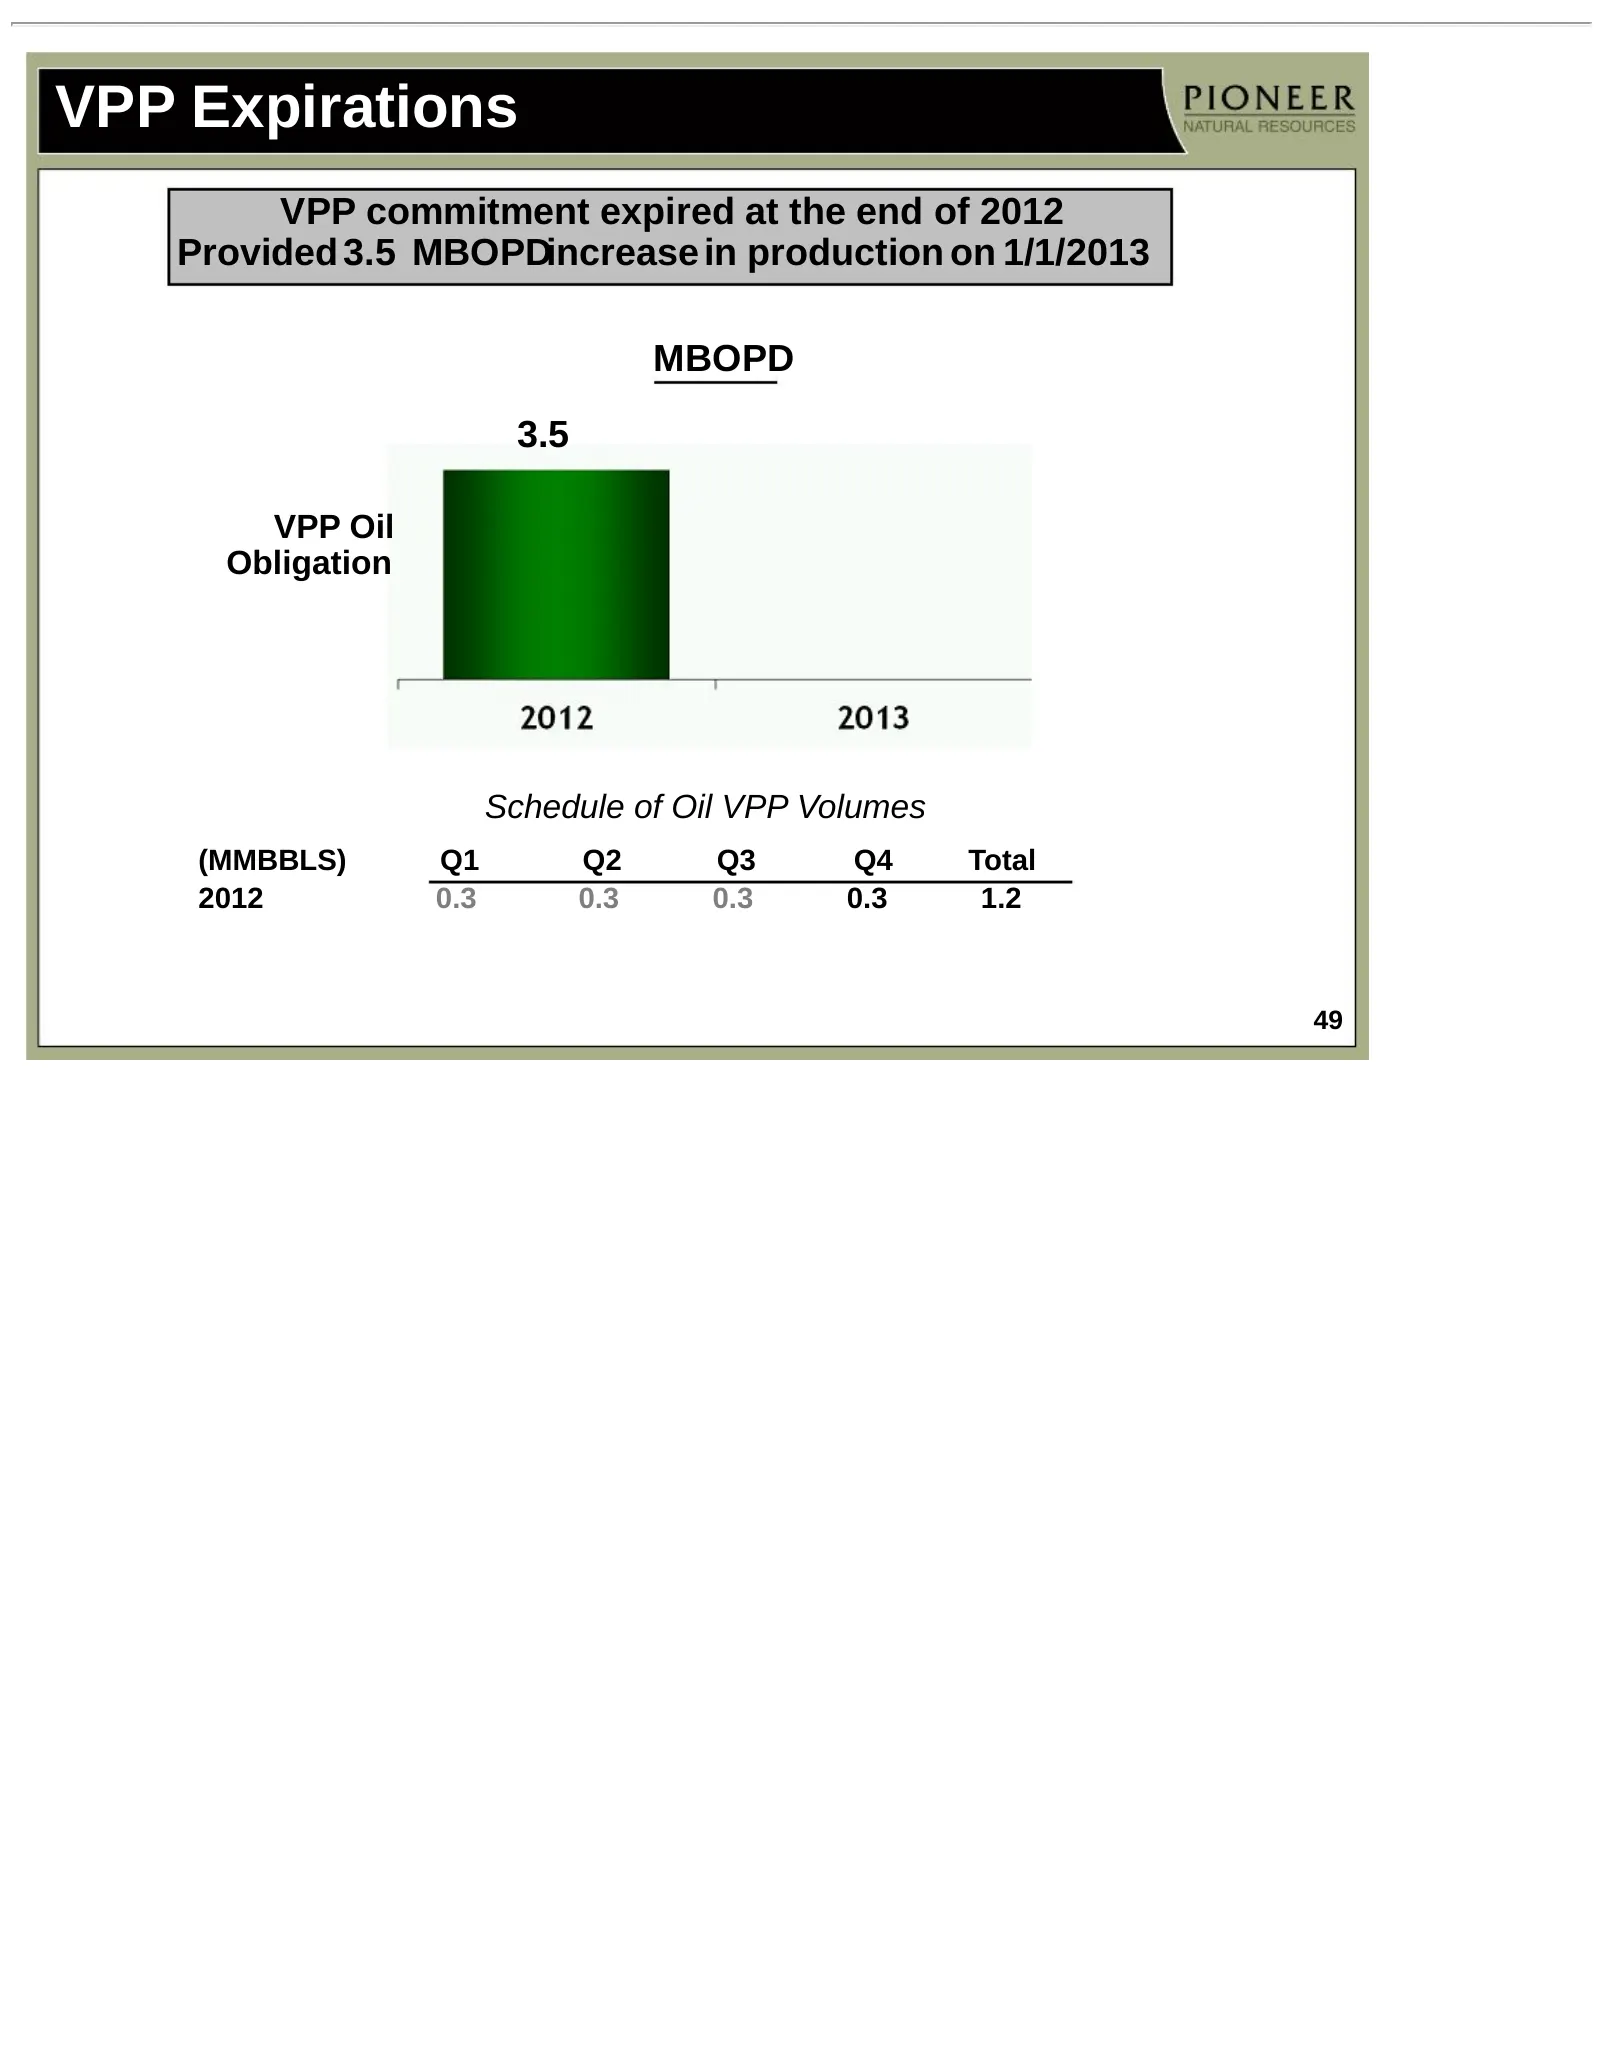
VPP Expirations VPP commitment expired at the end of 2012 Provided 3.5 MBOPDincrease in production on 1/1/2013 MBOPD 3.5 VPP Oil Obligation Schedule of Oil VPP Volumes (MMBBLS) Q1 Q2 Q3 Q4 Total 2012 0.3 0.3 0.3 0.3 1.2 49
Slide 50: Strong 2011 Reserve Additions
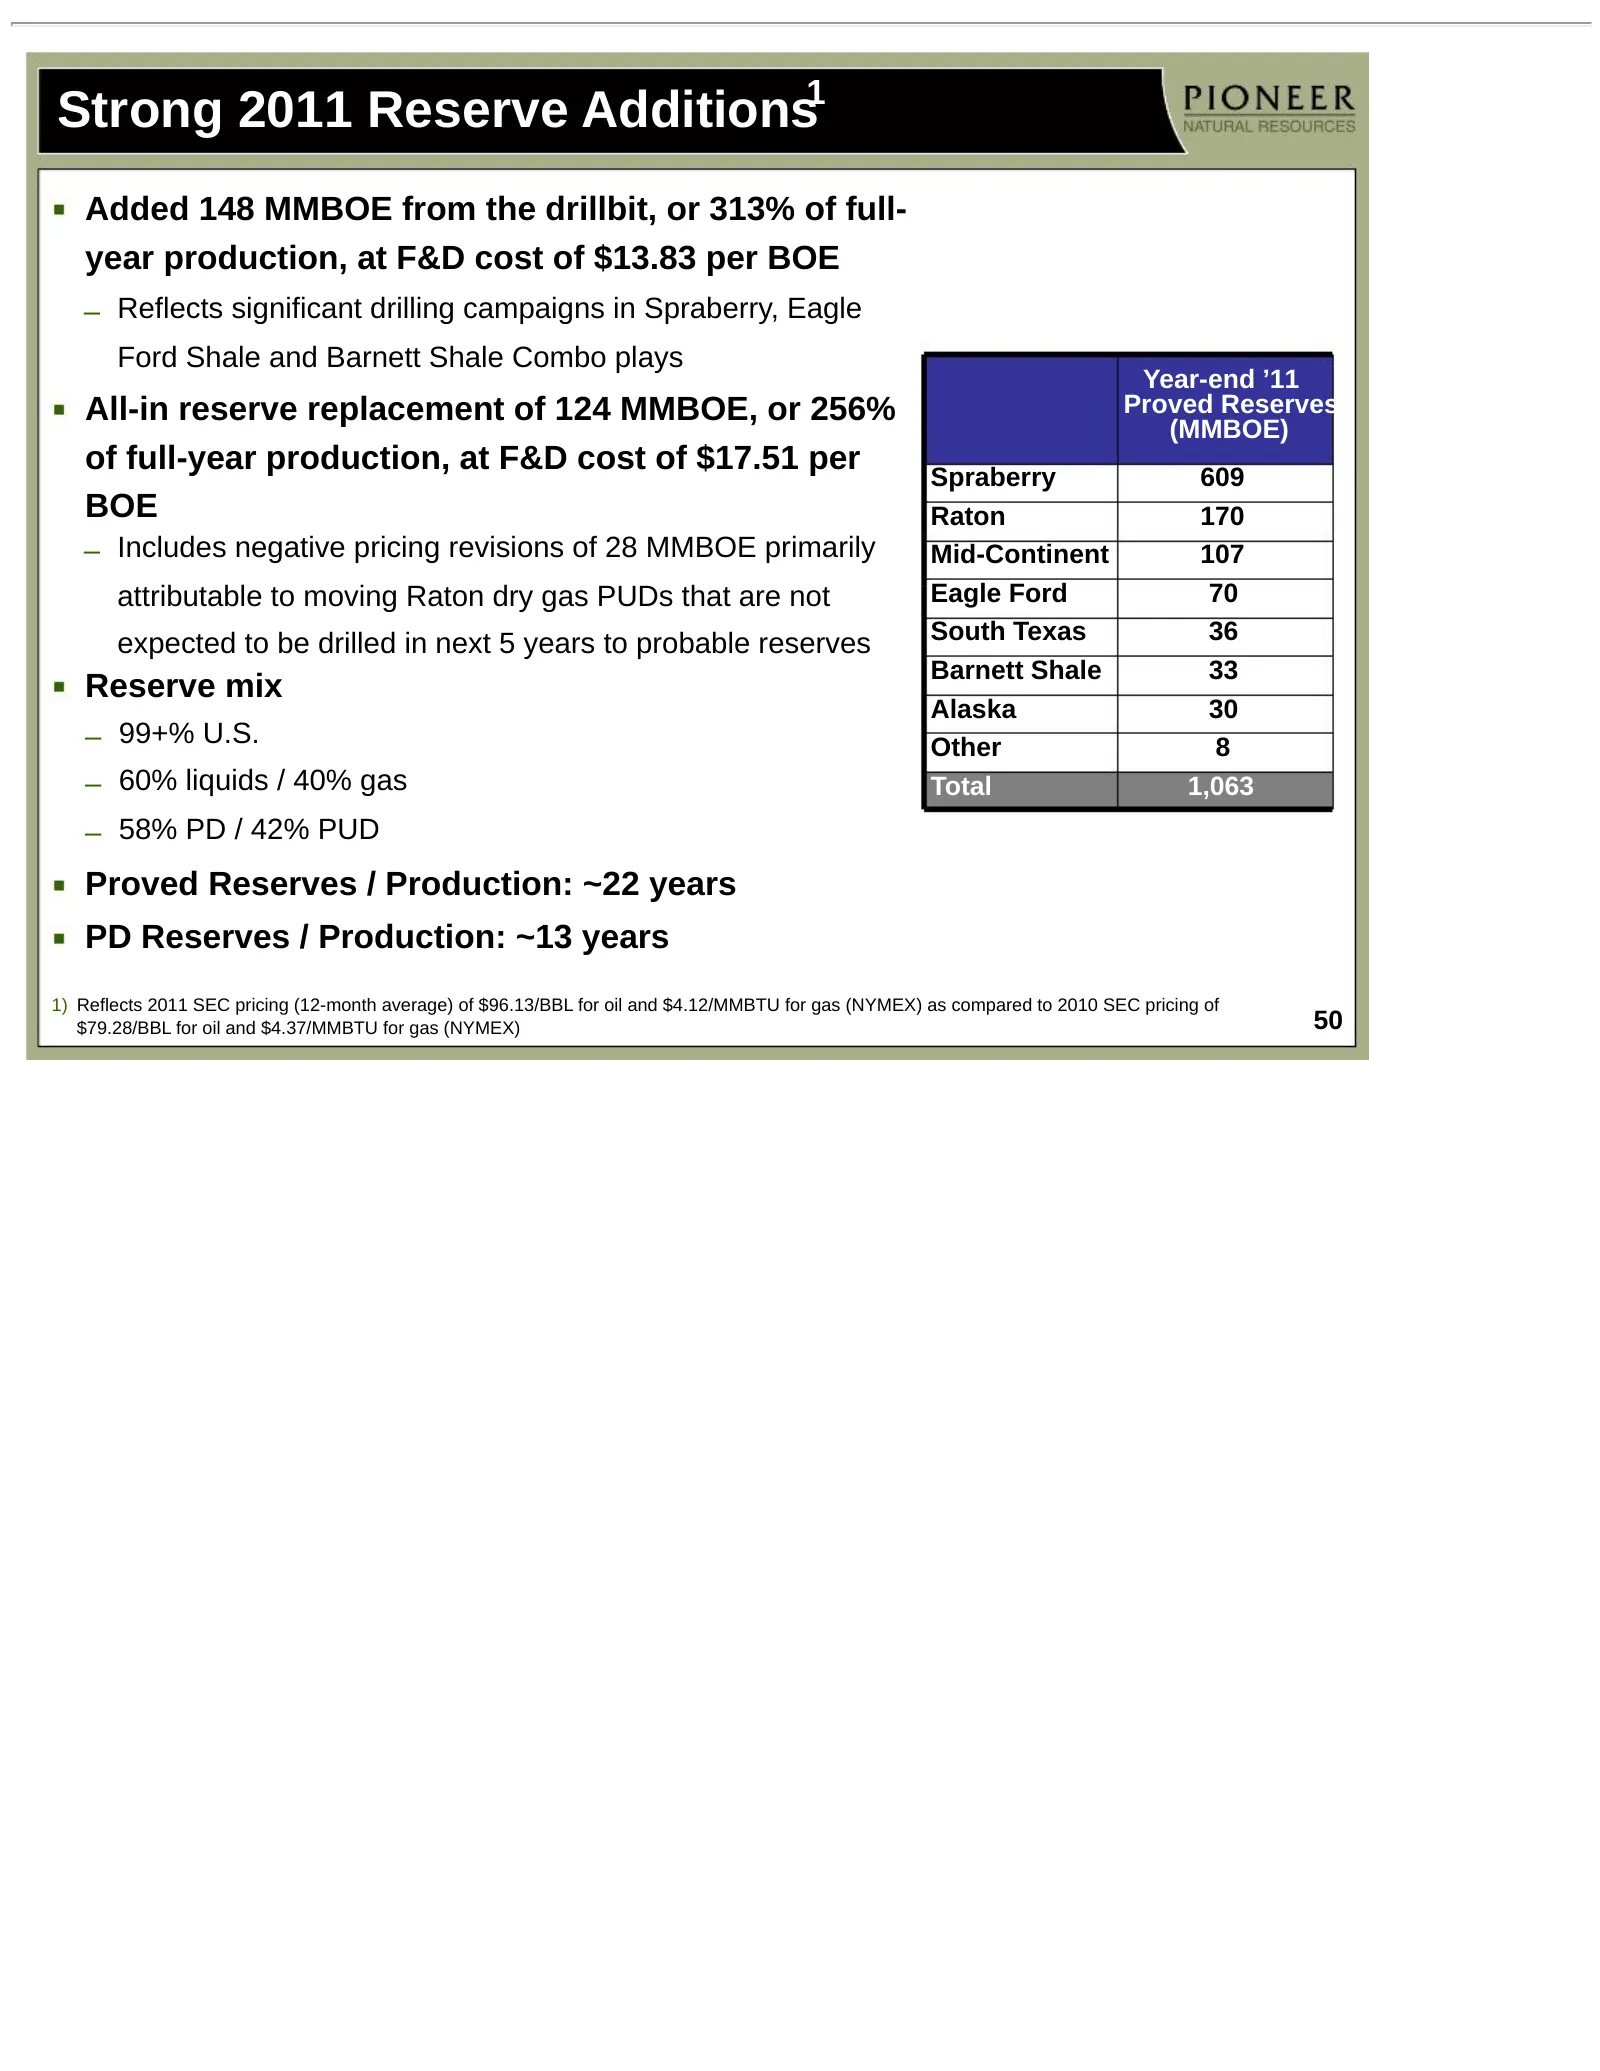
Strong 2011 Reserve Additions1 Added 148 MMBOE from the drillbit, or 313% of full- year production, at F&D cost of $13.83 per BOE – Reflects significant drilling campaigns in Spraberry, Eagle Ford Shale and Barnett Shale Combo plays Year-end ’11 All-in reserve replacement of 124 MMBOE, or 256% Prove
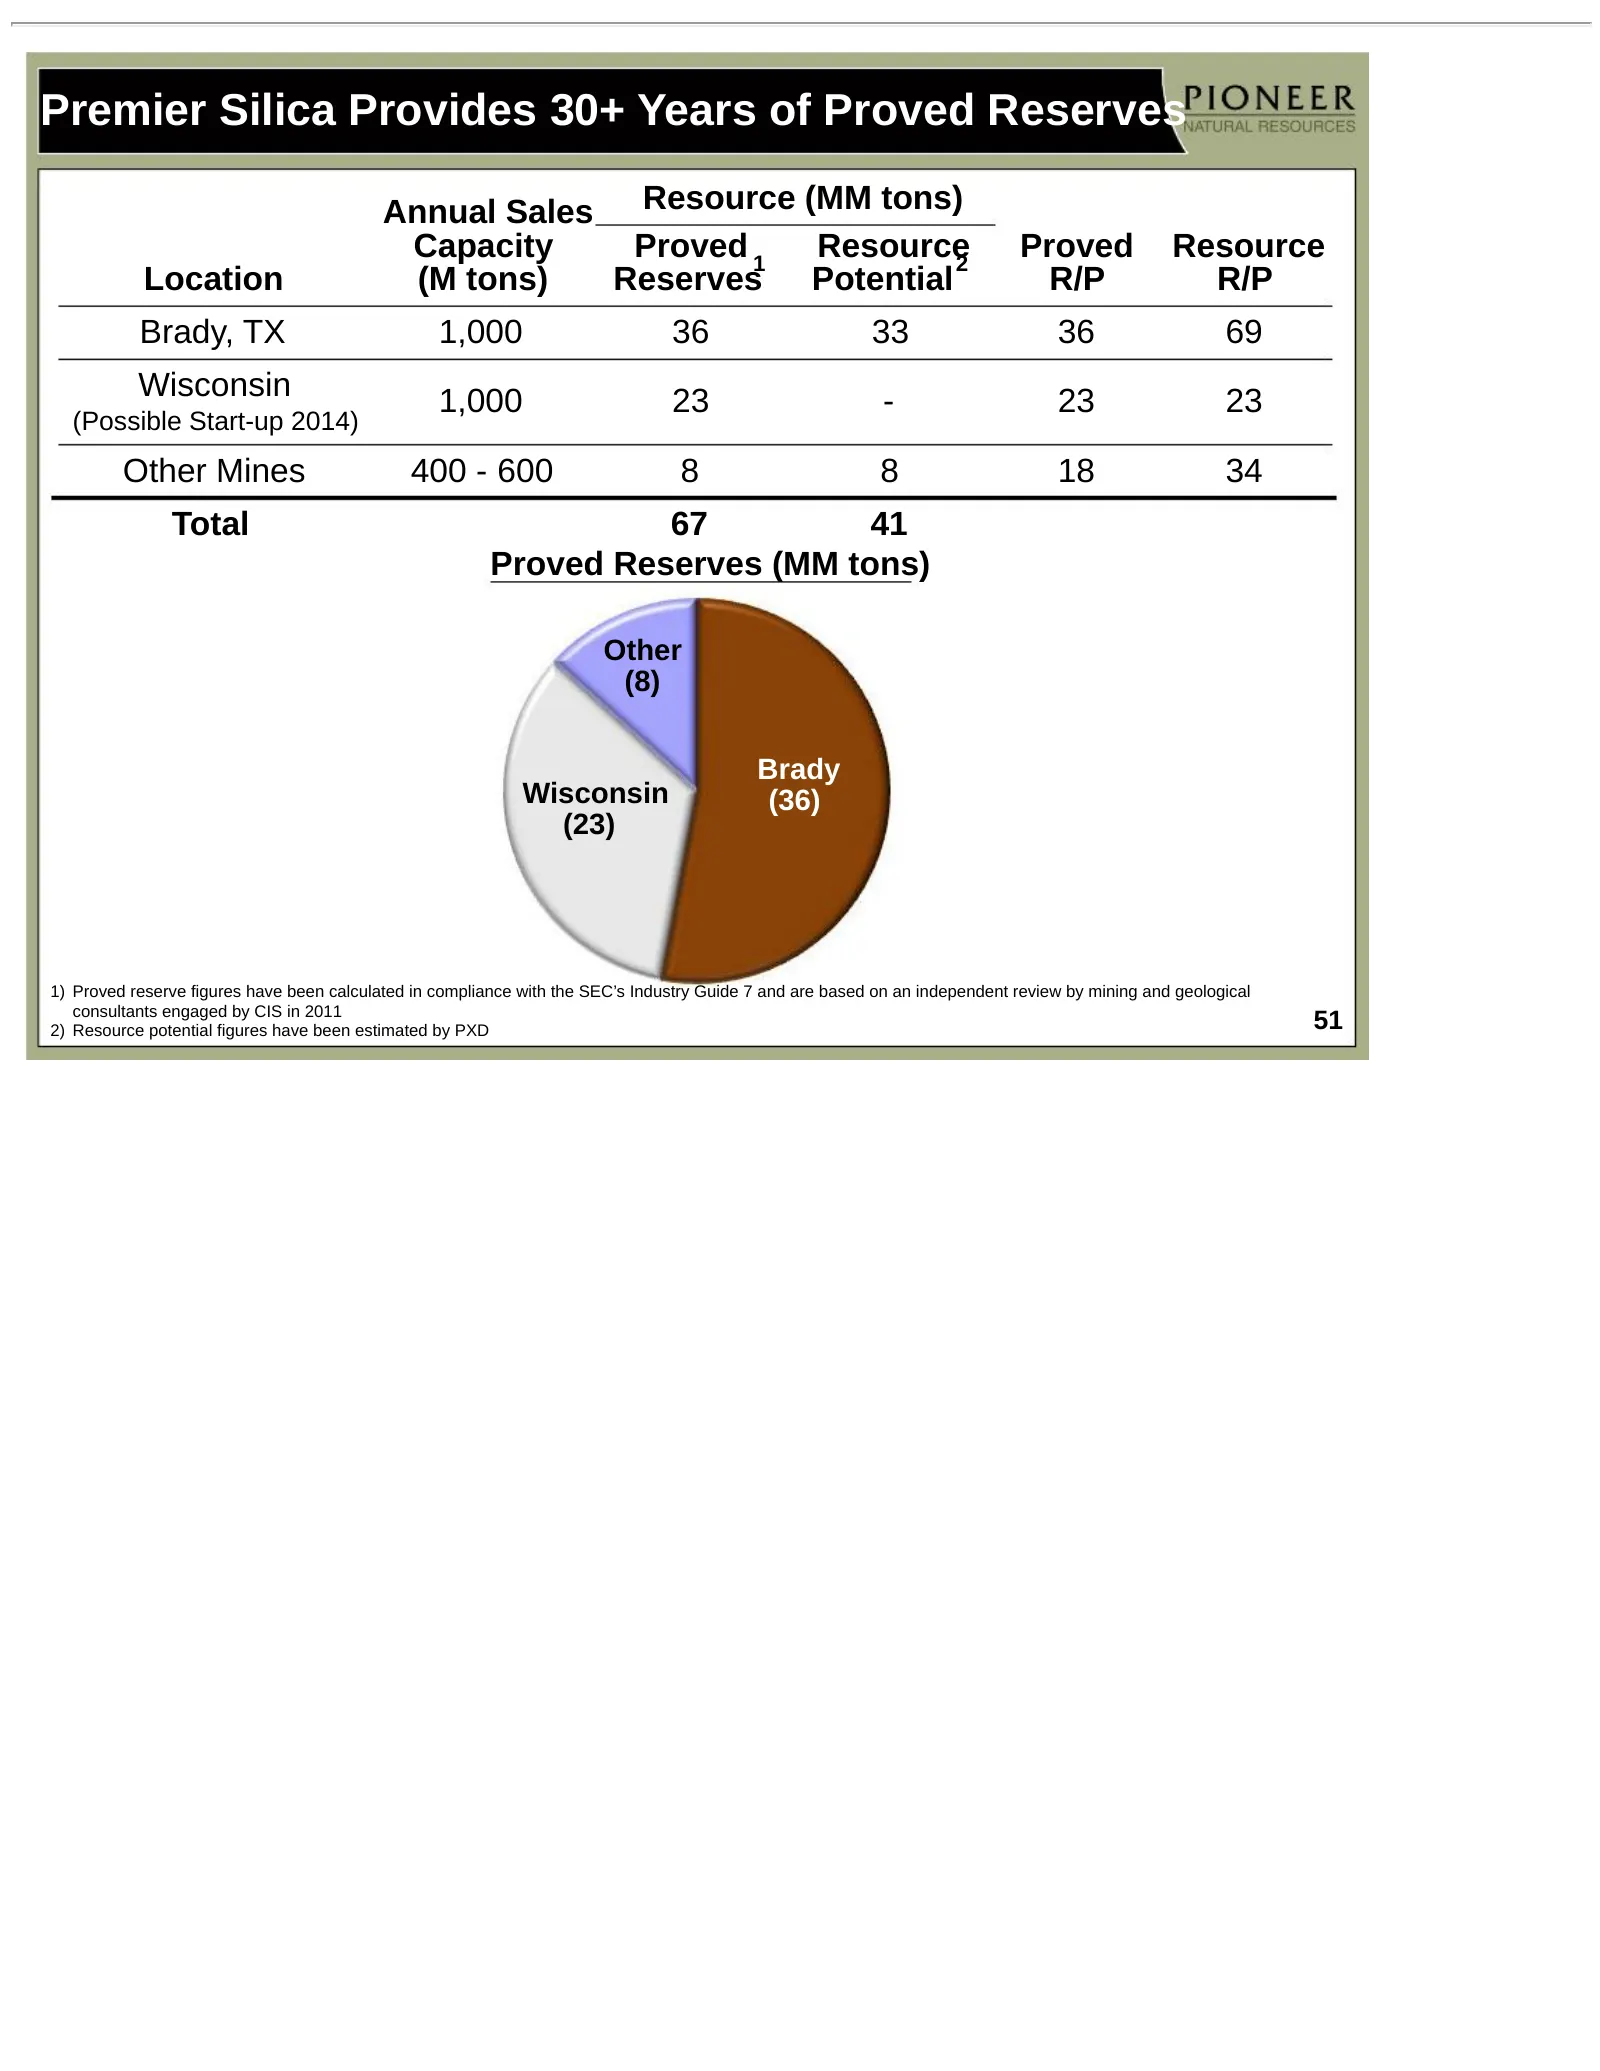
Slide 51: Premier Silica Provides 30+ Years of Proved Reserves
Premier Silica Provides 30+ Years of Proved Reserves Annual Sales Resource (MM tons) Capacity Proved 1 Resource2 Proved Resource Location (M tons) Reserves Potential R/P R/P Brady, TX 1,000 36 33 36 69 Wisconsin 1,000 23 - 23 23 (Possible Start-up 2014) Other Mines 400 - 600 8 8 18 34 Total 67 41 Pr
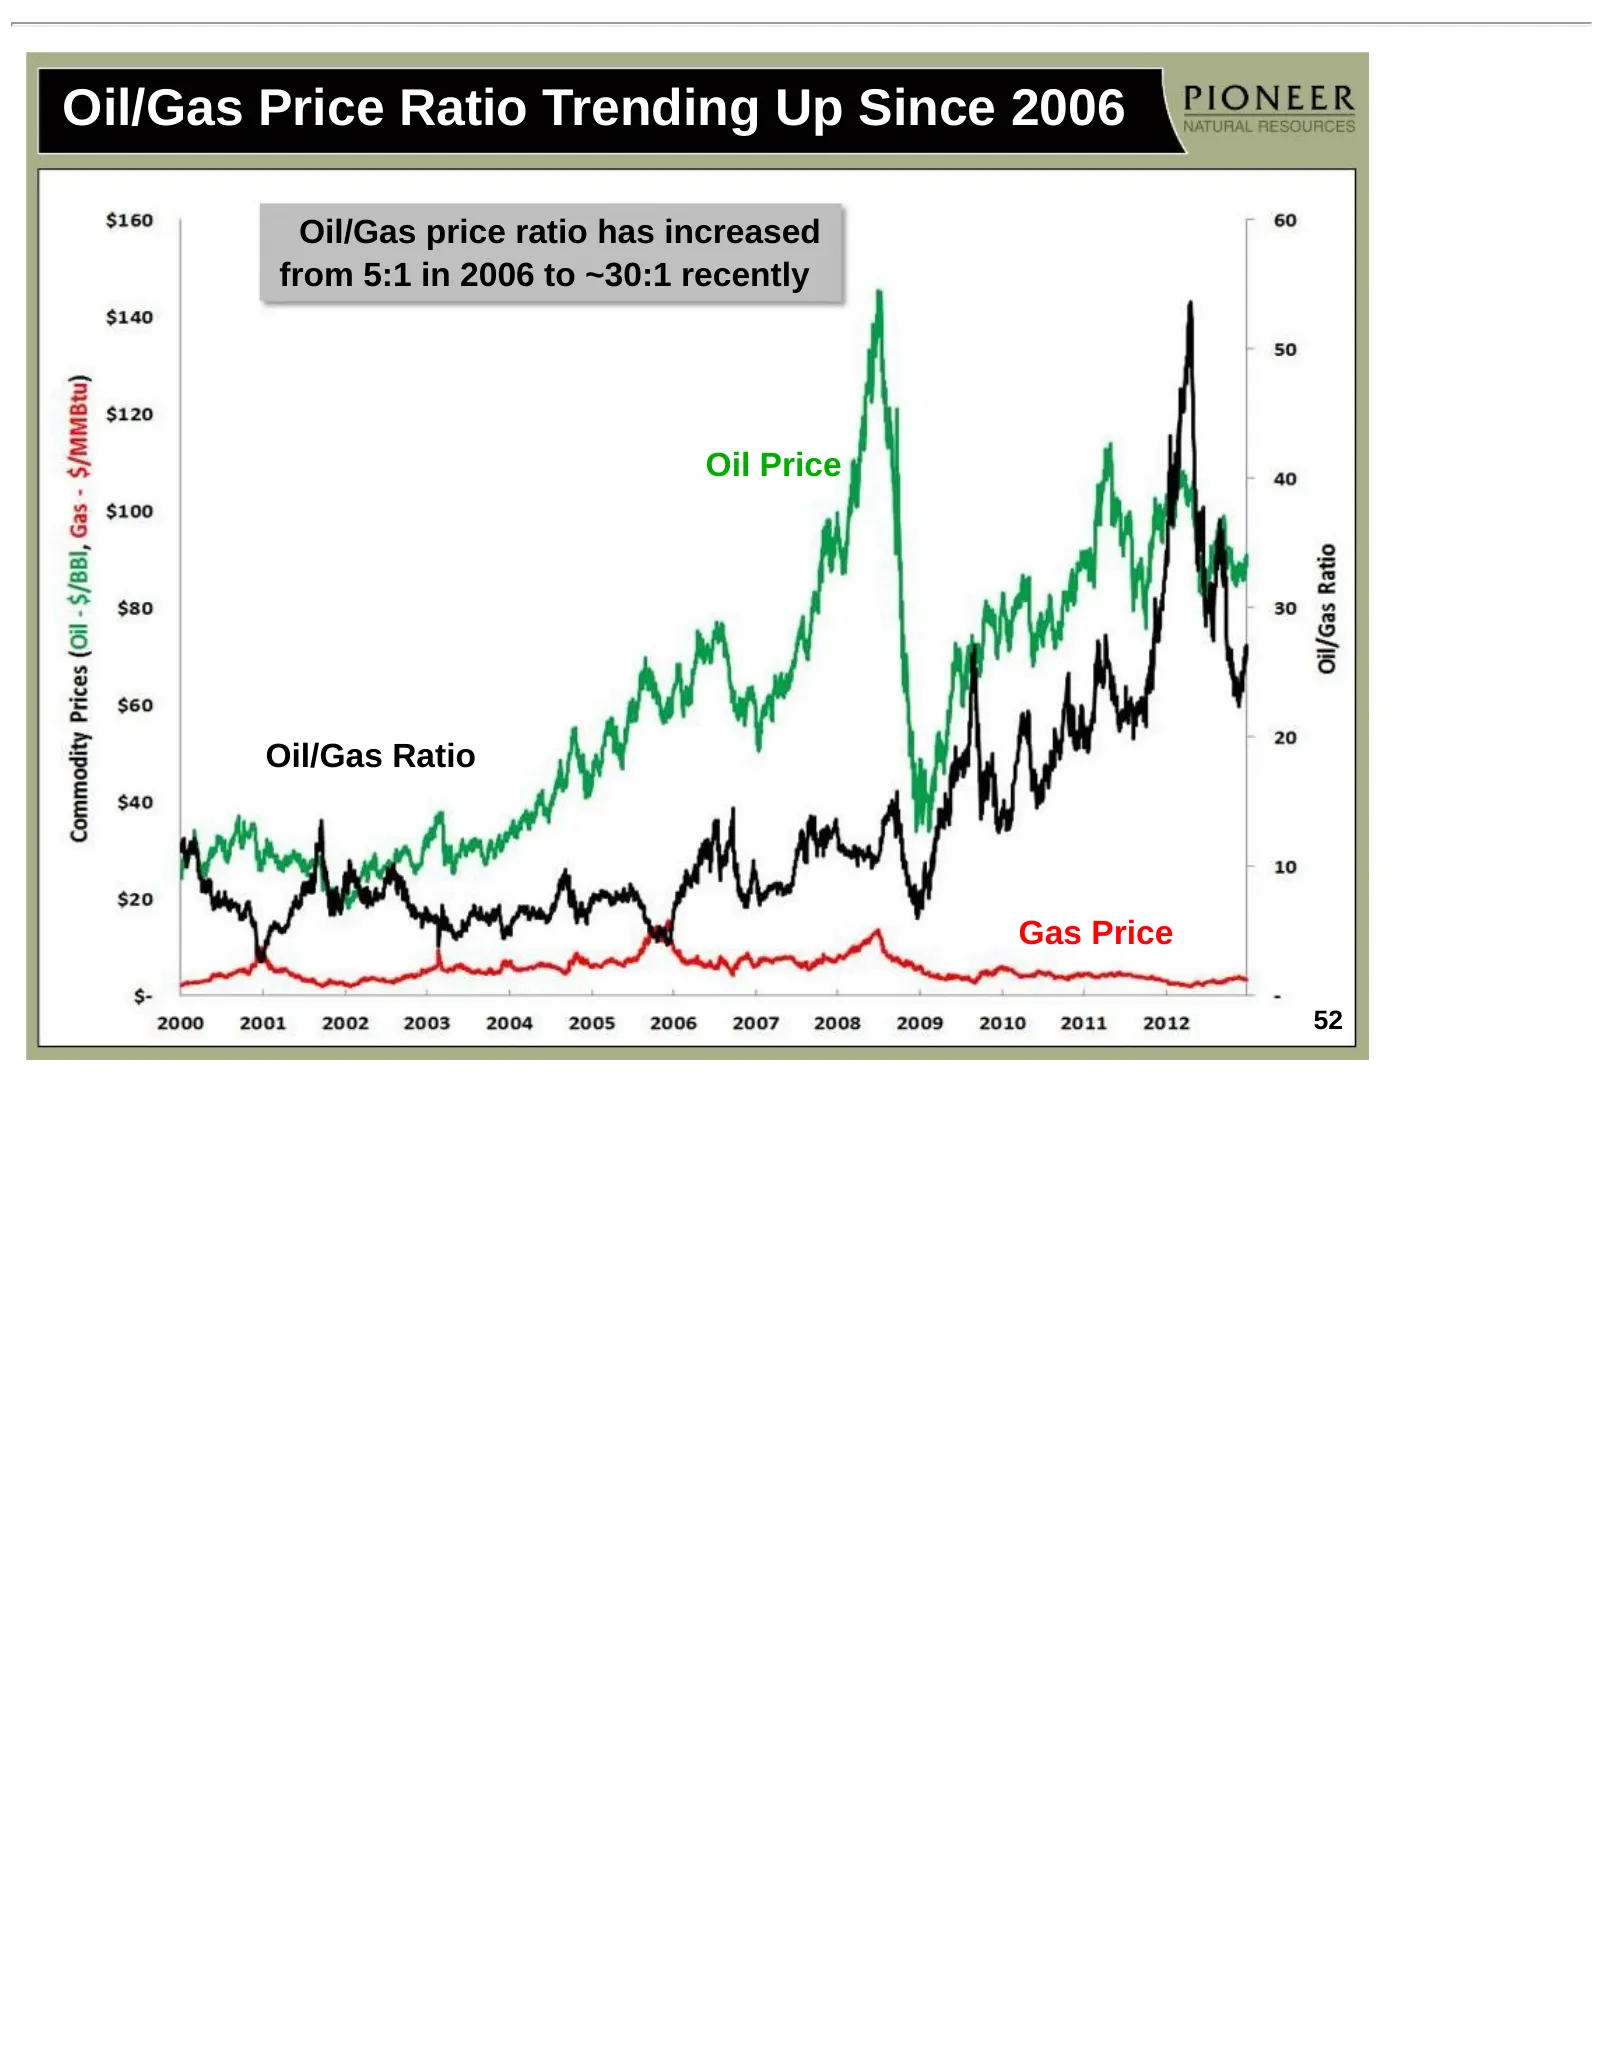
Slide 52: Oil/Gas Price Ratio Trending Up Since 2006
Oil/Gas Price Ratio Trending Up Since 2006 Oil/Gas price ratio has increased from 5:1 in 2006 to ~30:1 recently Oil Price Oil/Gas Ratio Gas Price 52
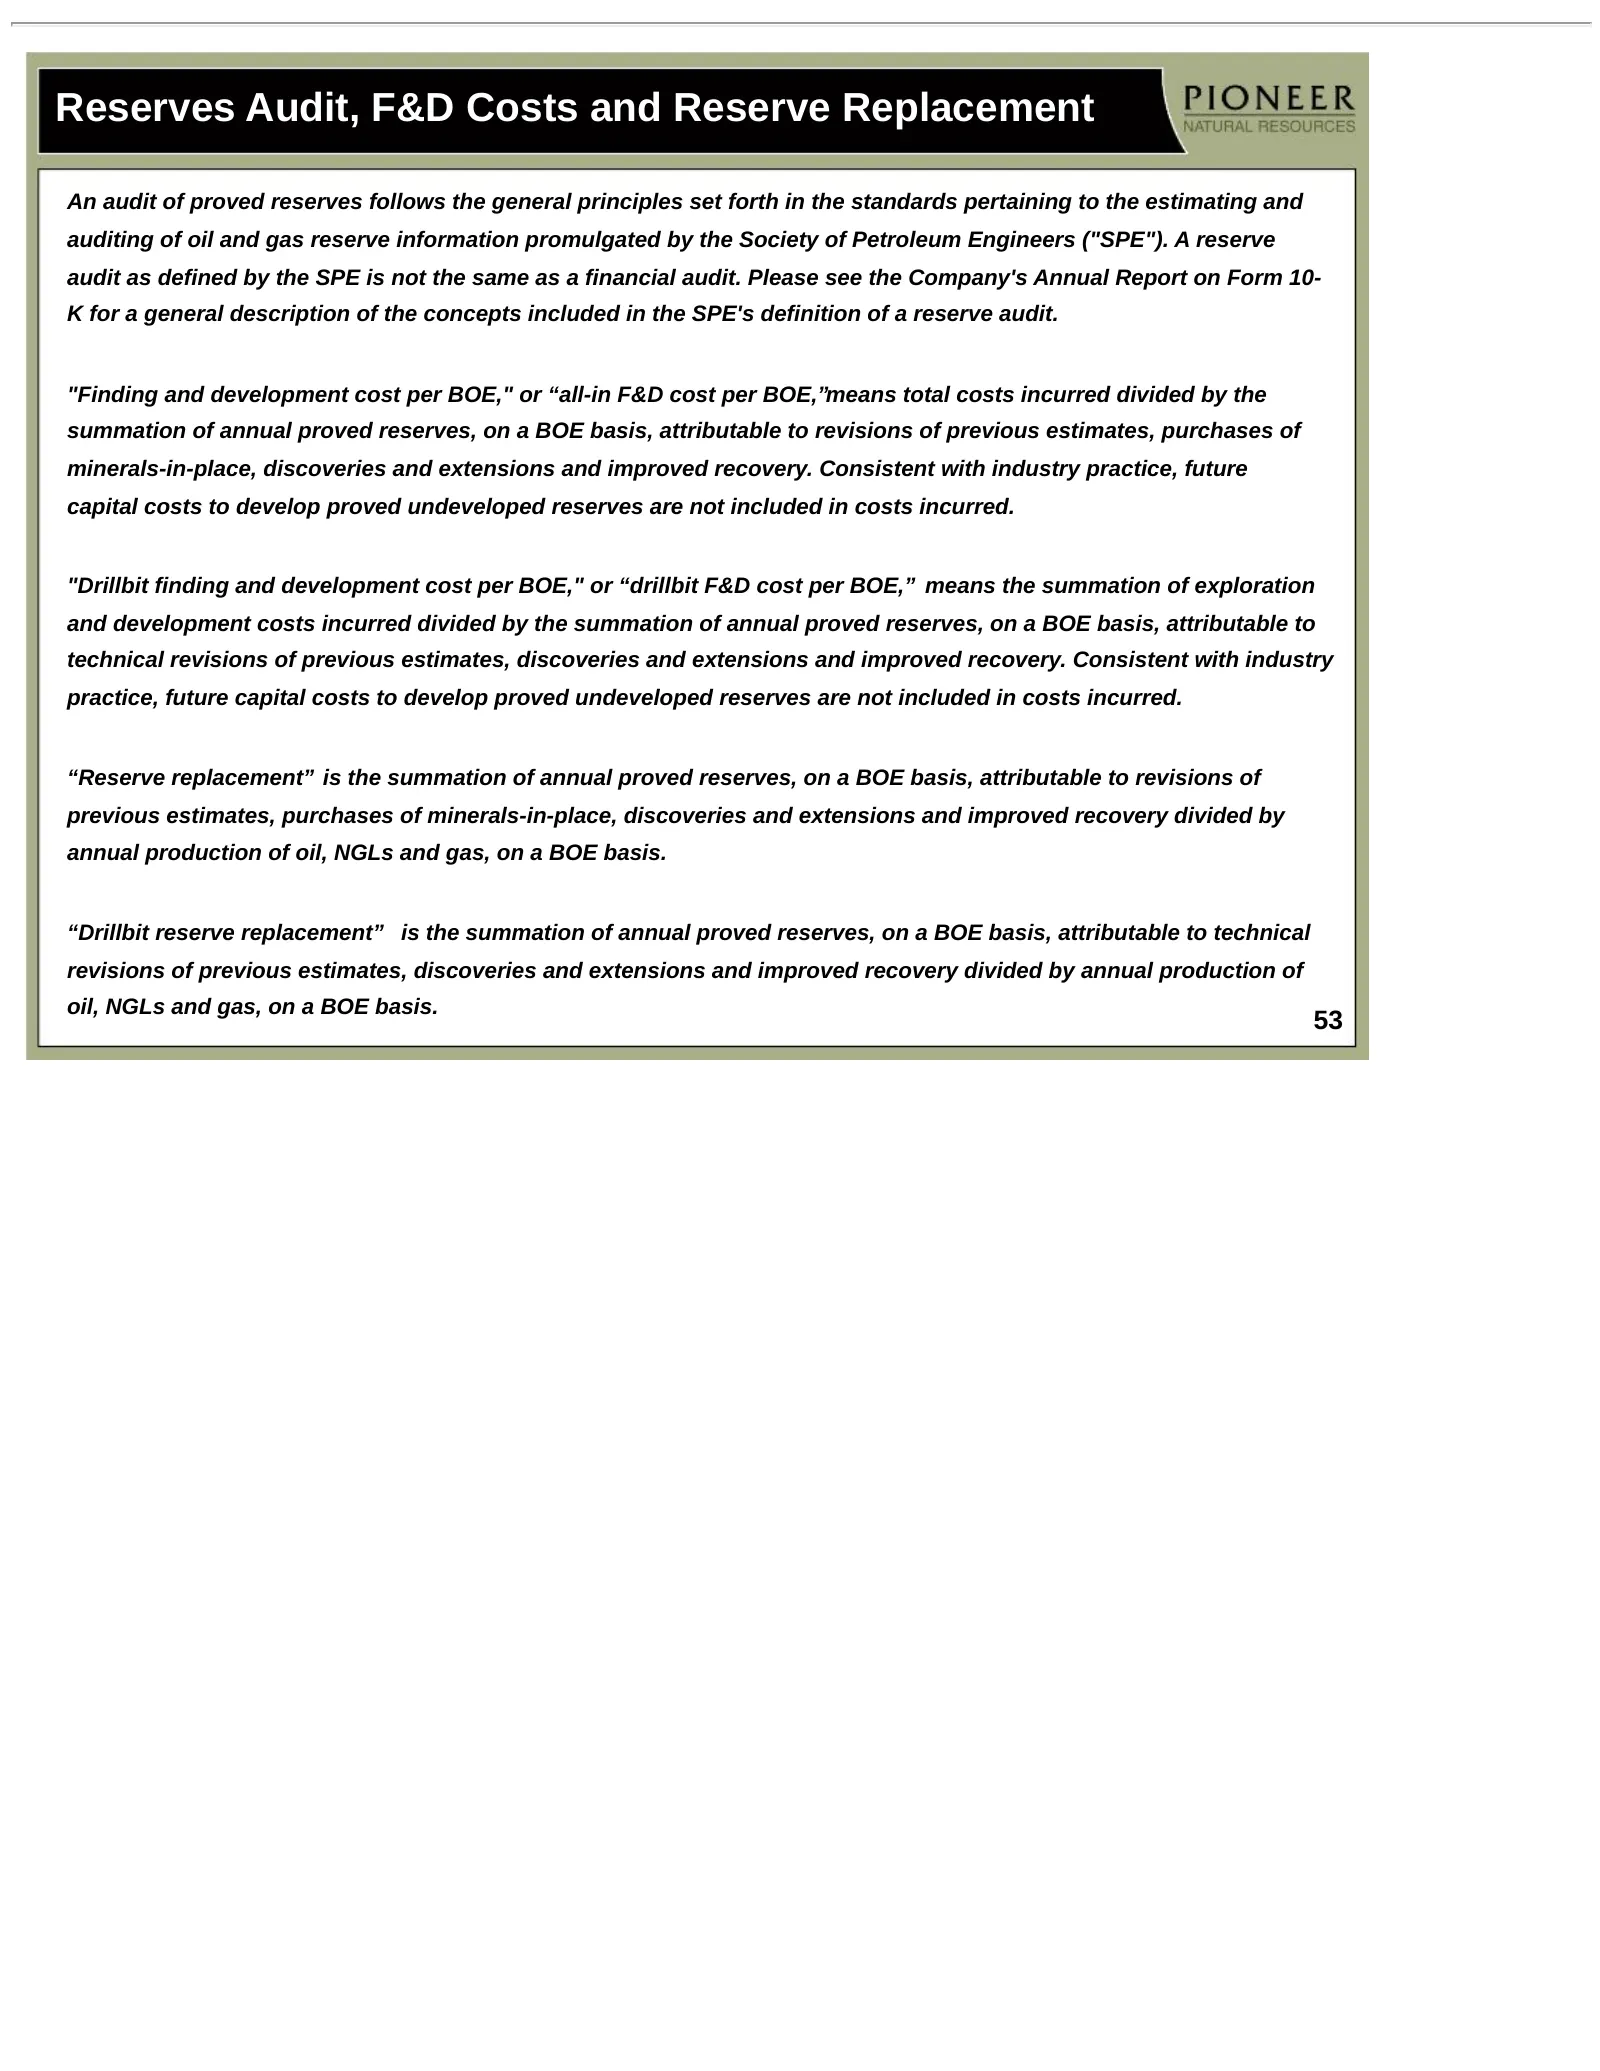
Slide 53: Reserves Audit, F&D Costs and Reserve Replacement
Reserves Audit, F&D Costs and Reserve Replacement An audit of proved reserves follows the general principles set forth in the standards pertaining to the estimating and auditing of oil and gas reserve information promulgated by the Society of Petroleum Engineers ("SPE"). A reserve audit as defined b
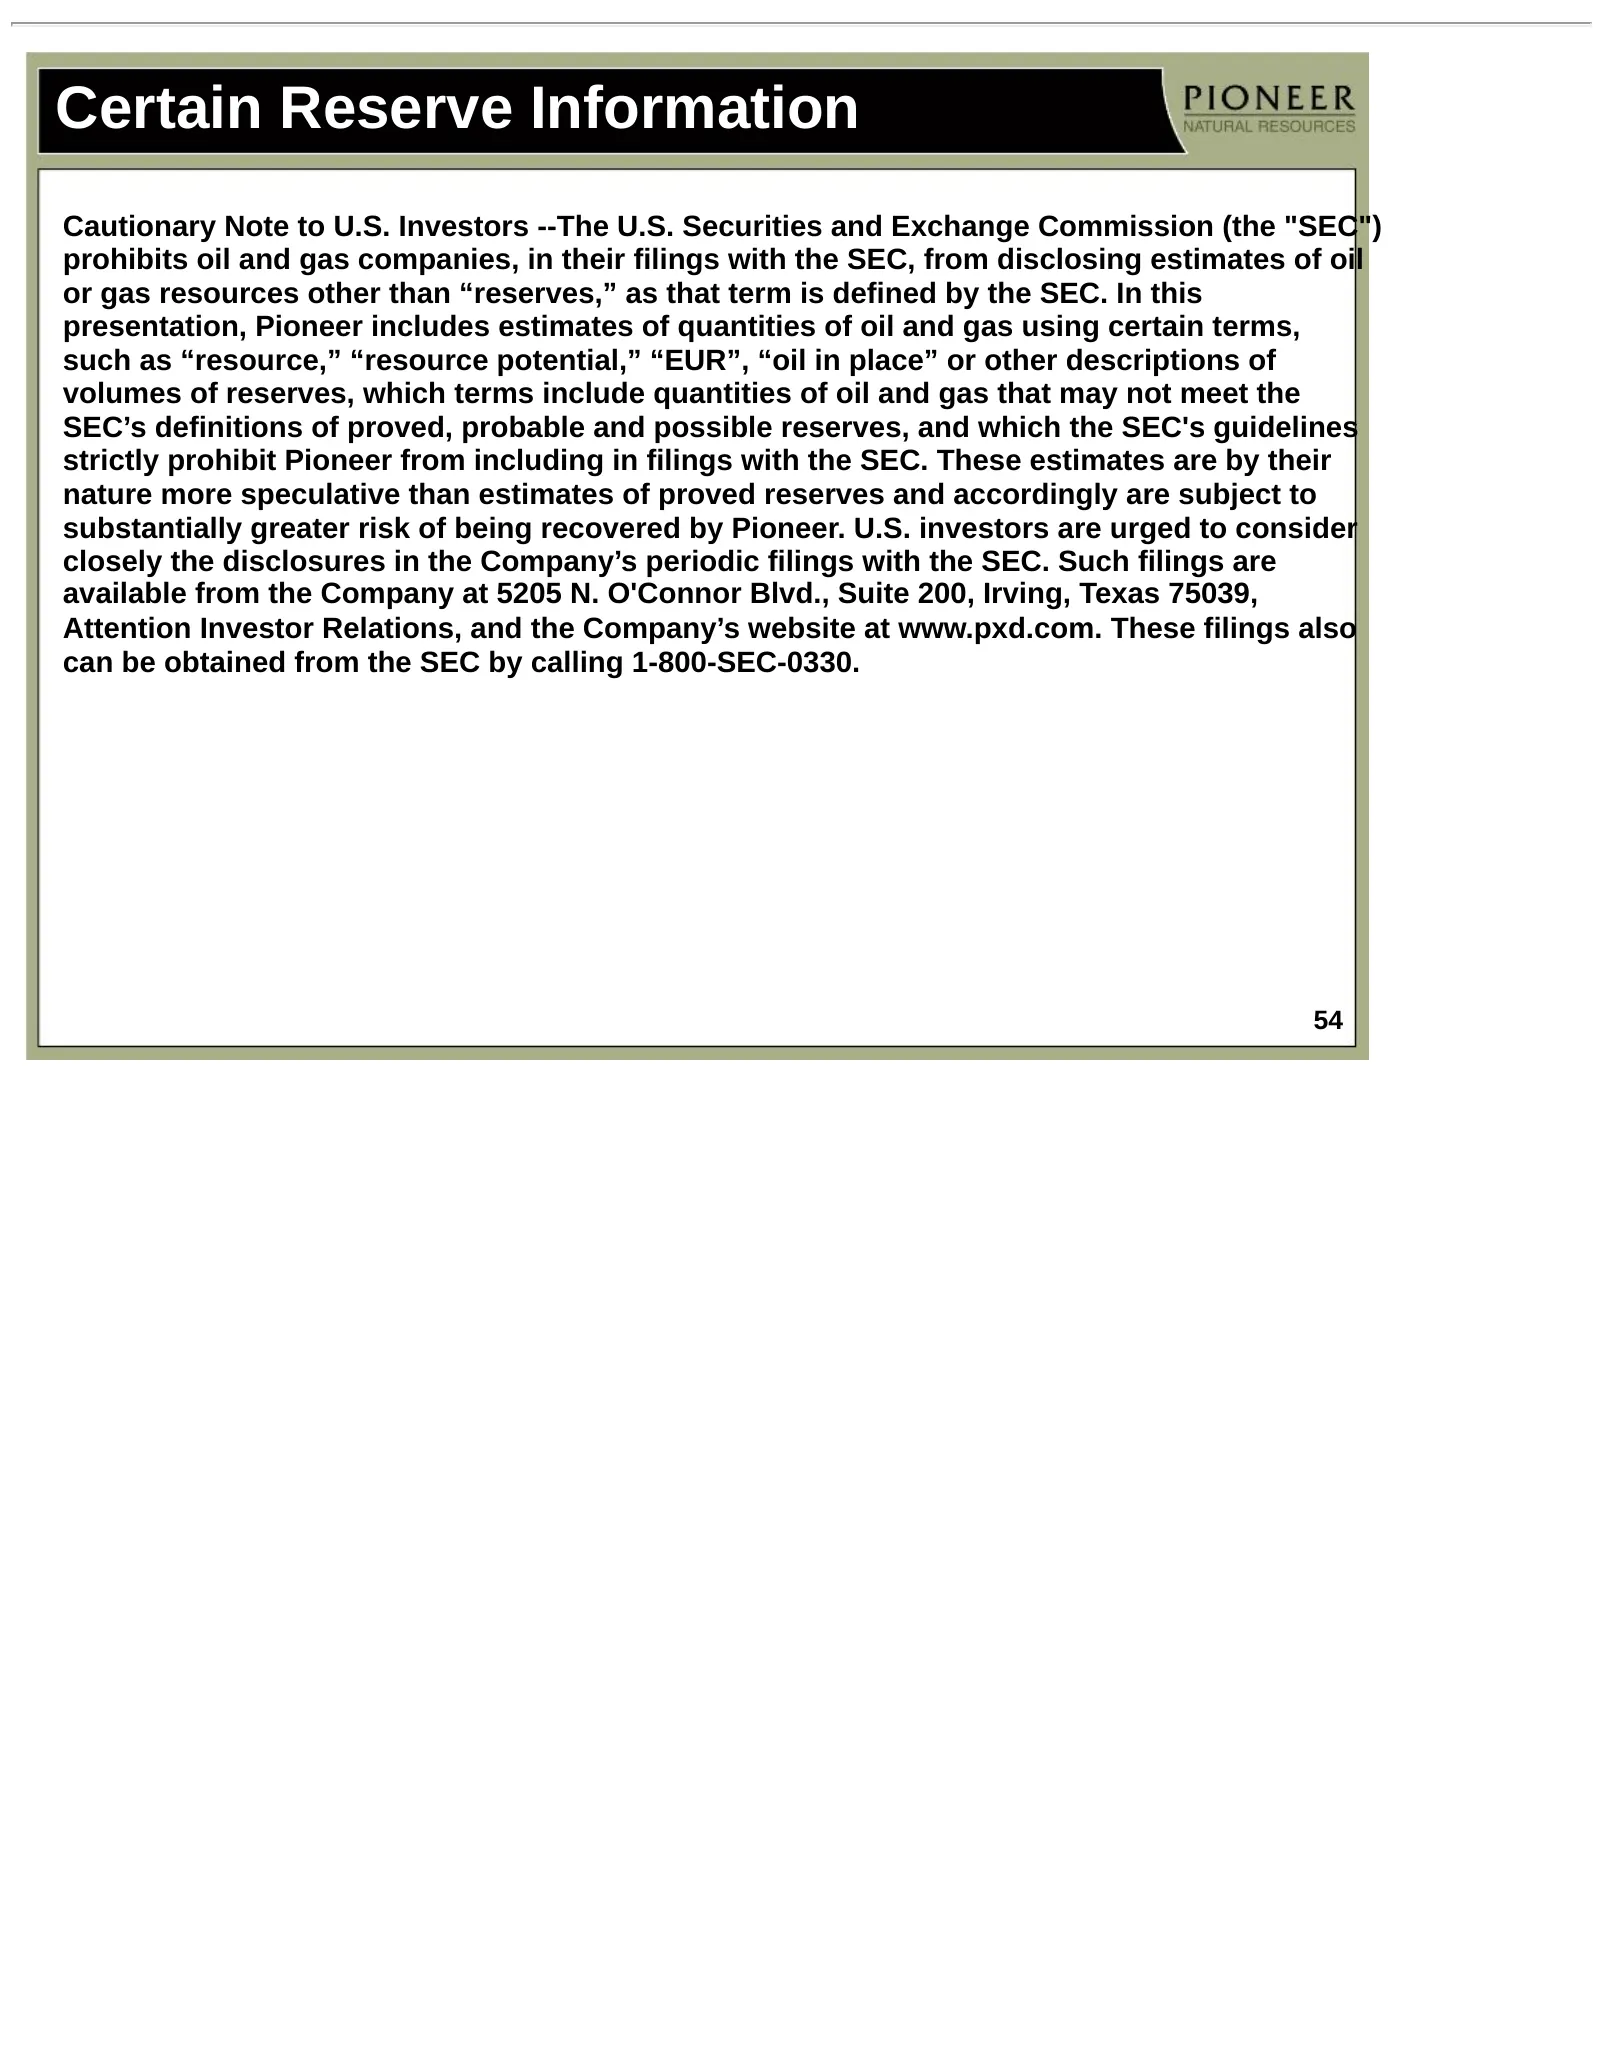
Slide 54: Certain Reserve Information
Certain Reserve Information Cautionary Note to U.S. Investors --The U.S. Securities and Exchange Commission (the "SEC") prohibits oil and gas companies, in their filings with the SEC, from disclosing estimates of oil or gas resources other than “reserves,” as that term is defined by the SEC. In this
Source: SEC EDGAR · 8-K filed Jan 7, 2013
More decks from Pioneer Natural Resources Co
 Merger or Acquisition (October 2023)15 slides · Oct 11, 2023
 Q3 2020 Earnings Presentation30 slides · Nov 4, 2020
 Merger or Acquisition (October 2020)18 slides · Oct 20, 2020
 IPAA Oil & Gas Investment Symposium 201846 slides · Apr 9, 2018
 Investor Presentation (January 2014)80 slides · Jan 6, 2014
 Q4 2012 Earnings Presentation48 slides · Feb 13, 2013