Howard Bancorp — Raymond James U.S. Bank Conference 2020
49 slides from Howard Bancorp's conference presentation, Sep 9, 2020
Slide 1: Raymond James U.S. Bank Conference September 9-10, 2020
Raymond James U.S. Bank Conference September 9-10, 2020

Slide 2: Forward Looking Statements
FORWARD LOOKING STATEMENTS This presentation and statements by the Company’s management contains “forward-looking statements” as that phrase is defined in the Private Securities Litigation Reform Act of 1995. Forward looking statements can be identified by words such as “anticipated,” “expects,” “in

Slide 3: About Us
HOWARD BANCORP ABOUT US
Slide 4: Company Overview
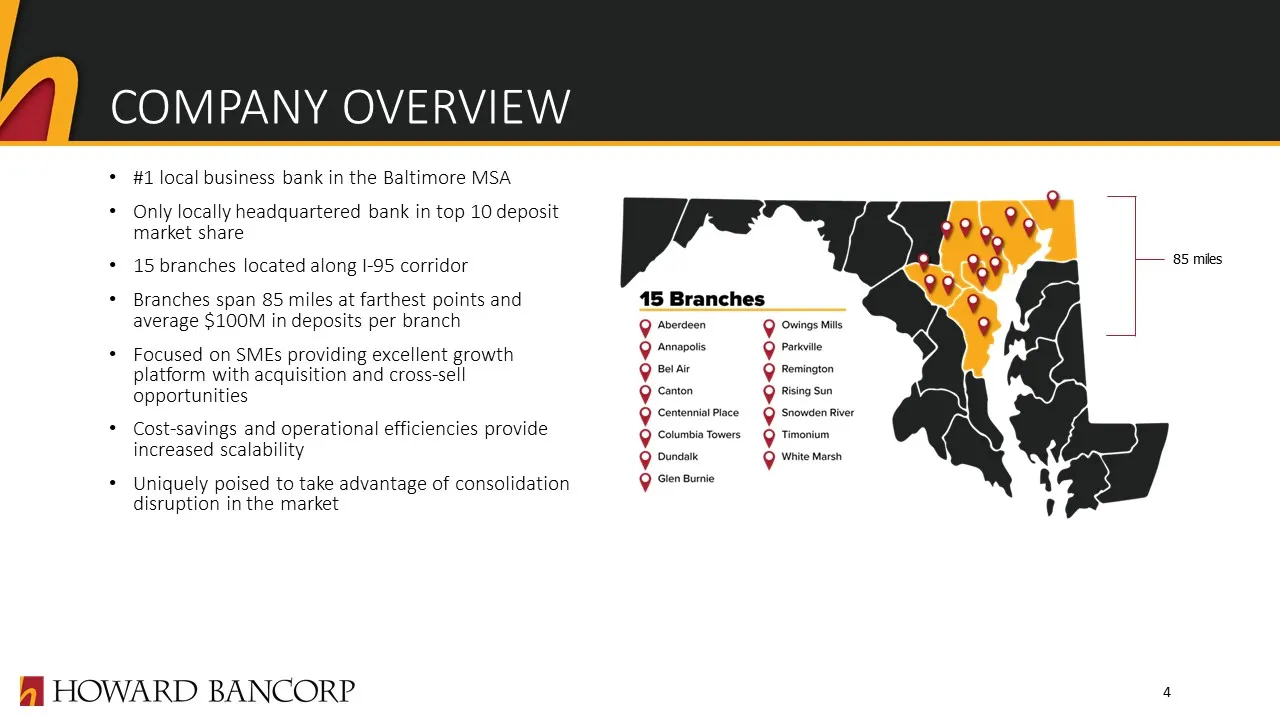
COMPANY OVERVIEW #1 local business bank in the Baltimore MSAOnly locally headquartered bank in top 10 deposit market share15 branches located along I-95 corridorBranches span 85 miles at farthest points and average $100M in deposits per branchFocused on SMEs providing excellent growth platform with
Slide 5: Our Management Team
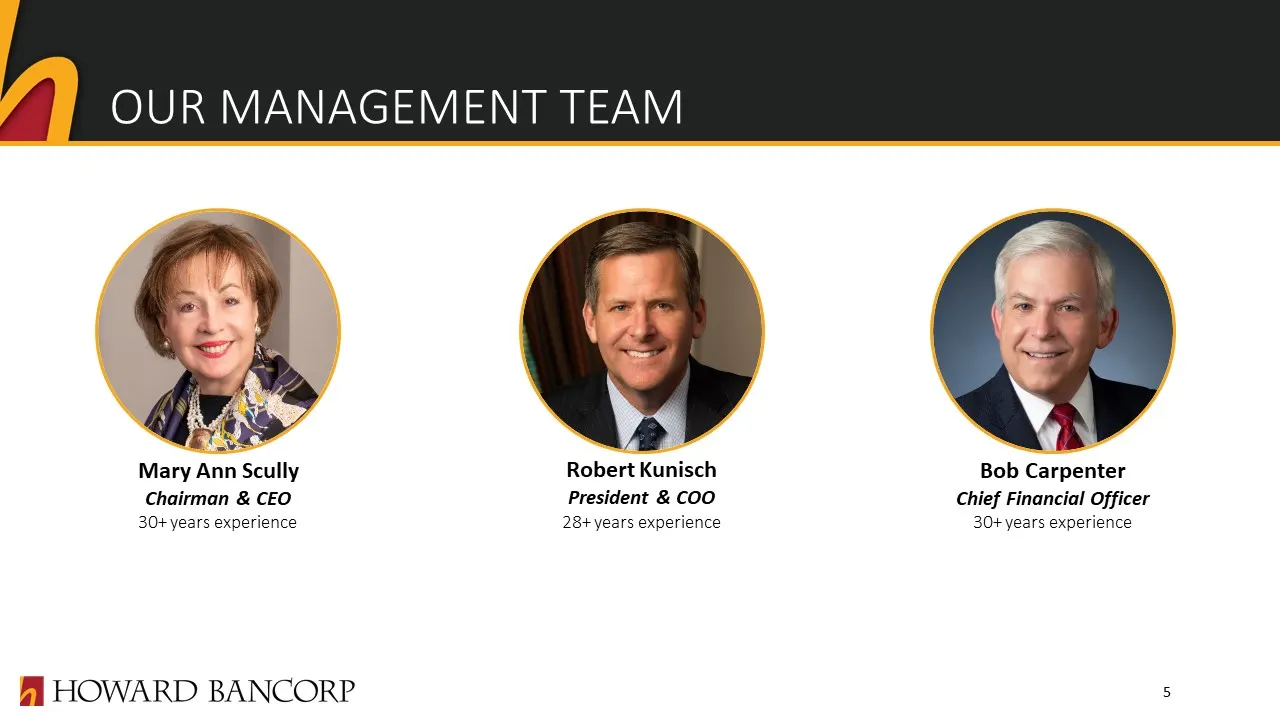
OUR MANAGEMENT TEAM Mary Ann ScullyChairman & CEO 30+ years experience Robert KunischPresident & COO 28+ years experience Bob CarpenterChief Financial Officer 30+ years experience 5
Slide 6: Non-GAAP Information
NON-GAAP INFORMATION This presentation contains references to financial measures that are not defined in generally accepted accounting principles (“GAAP”). Such non-GAAP financial measures should not be considered in isolation or as a substitute for the most directly comparable or other financial me
Slide 7: Investment Value Thesis
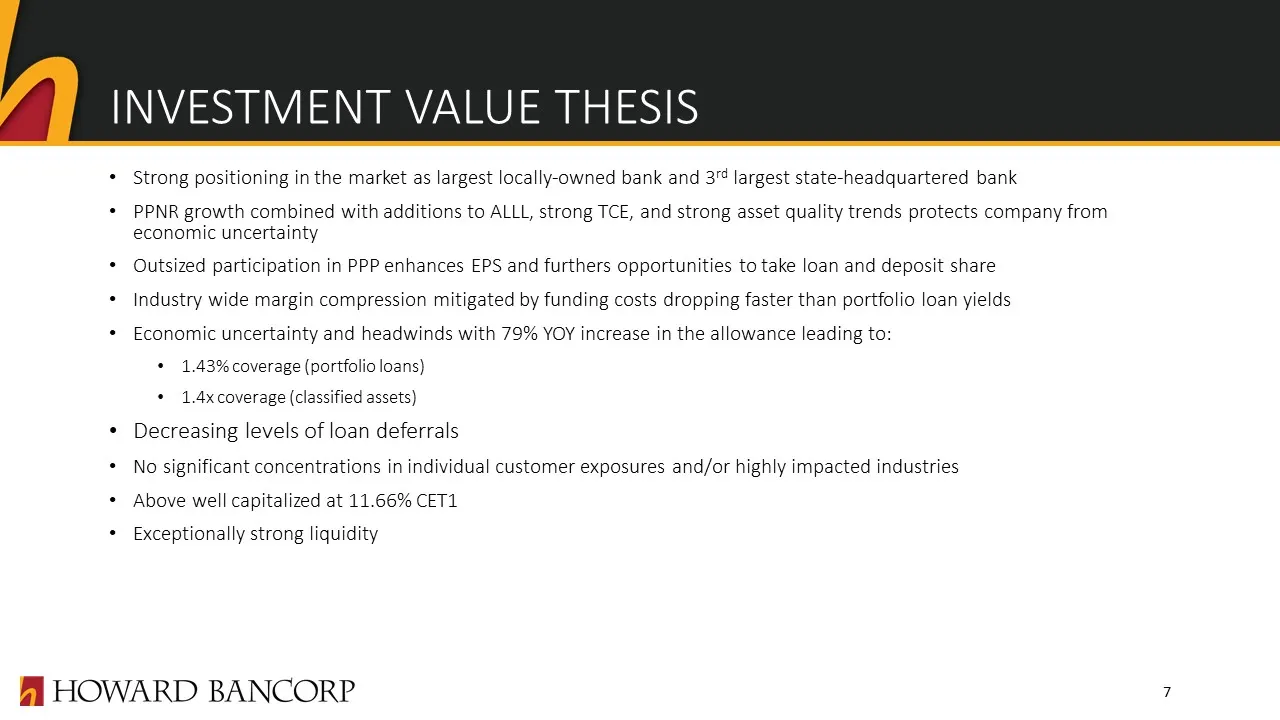
INVESTMENT VALUE THESIS Strong positioning in the market as largest locally-owned bank and 3rd largest state-headquartered bankPPNR growth combined with additions to ALLL, strong TCE, and strong asset quality trends protects company from economic uncertaintyOutsized participation in PPP enhances EPS

Slide 8: COVID-19 Updates
HOWARD BANCORP COVID-19 UPDATES
Slide 9: COVID-19: Impact on Local Economy
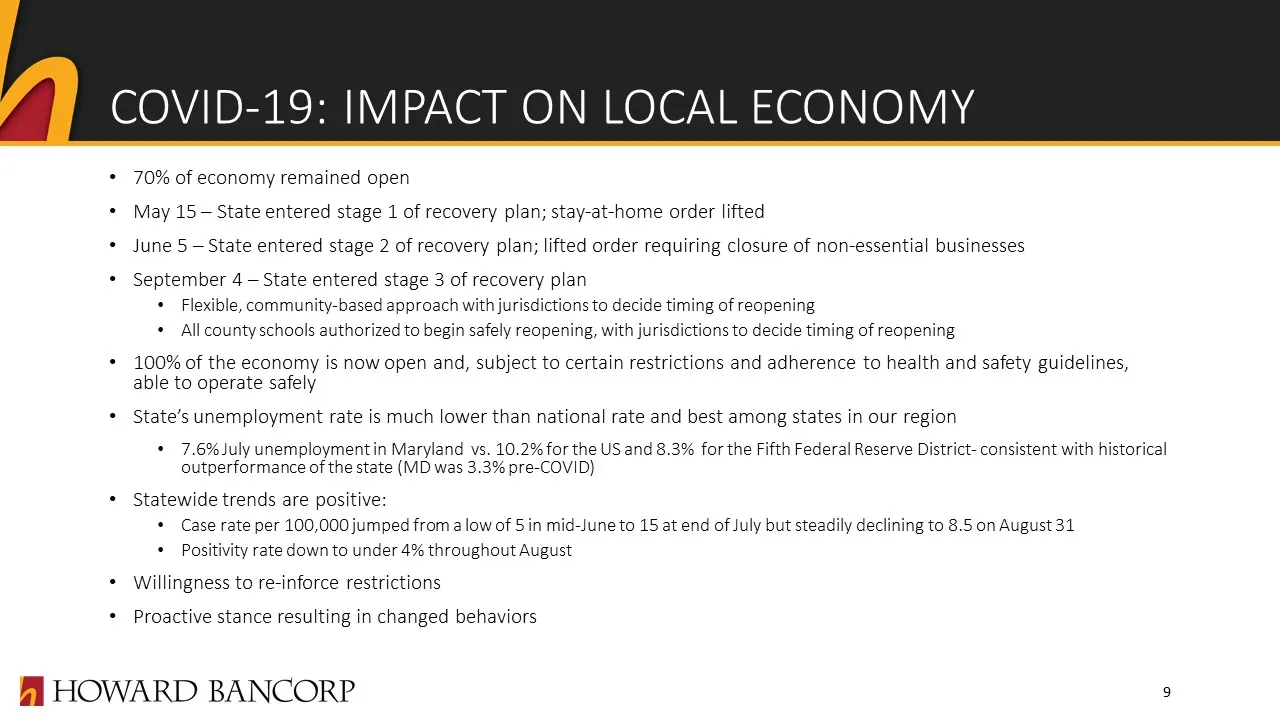
COVID-19: IMPACT ON LOCAL ECONOMY 70% of economy remained openMay 15 – State entered stage 1 of recovery plan; stay-at-home order liftedJune 5 – State entered stage 2 of recovery plan; lifted order requiring closure of non-essential businessesSeptember 4 – State entered stage 3 of recovery planFlexi
Slide 10: COVID-19: Customer Experience & Employee Operations
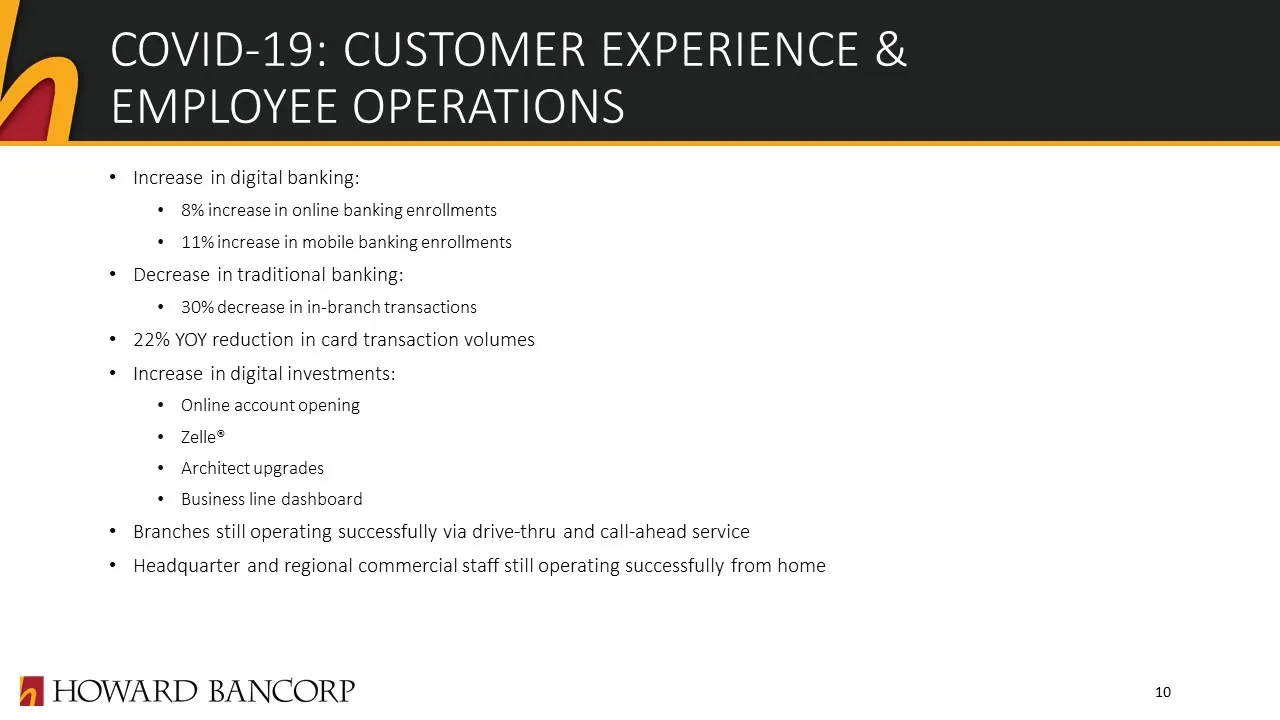
COVID-19: CUSTOMER EXPERIENCE & EMPLOYEE OPERATIONS Increase in digital banking:8% increase in online banking enrollments11% increase in mobile banking enrollmentsDecrease in traditional banking:30% decrease in in-branch transactions22% YOY reduction in card transaction volumesIncrease in digital in

Slide 11: Well-Positioned Franchise
HOWARD BANCORP WELL-POSITIONED FRANCHISE
Slide 12: Capital Position
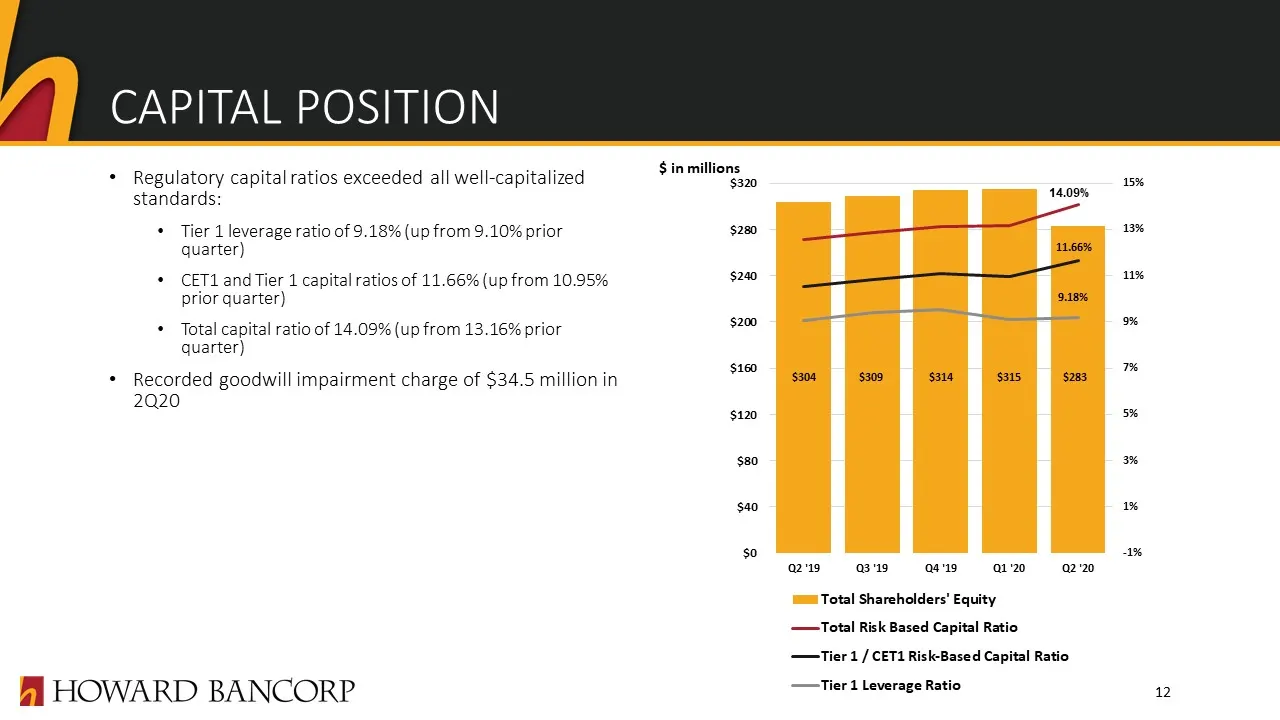
CAPITAL POSITION Regulatory capital ratios exceeded all well-capitalized standards:Tier 1 leverage ratio of 9.18% (up from 9.10% prior quarter)CET1 and Tier 1 capital ratios of 11.66% (up from 10.95% prior quarter)Total capital ratio of 14.09% (up from 13.16% prior quarter)Recorded goodwill impairme
Slide 13: Liquidity Position
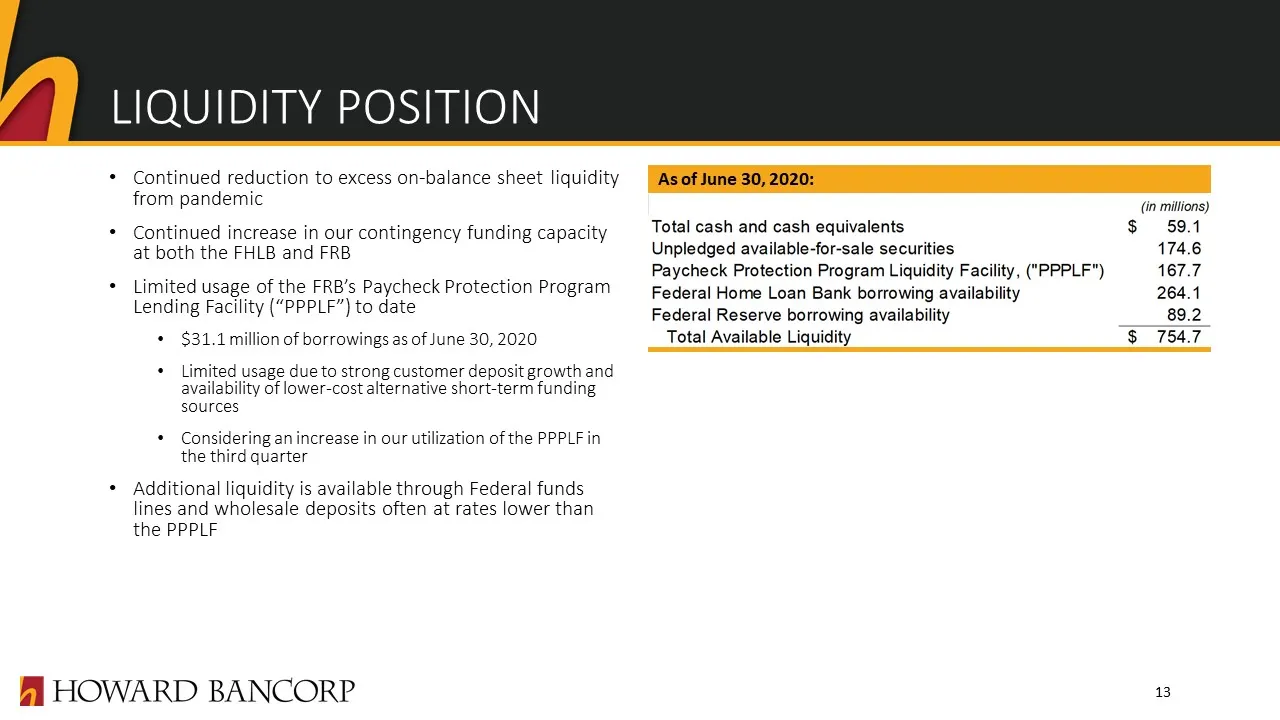
LIQUIDITY POSITION Continued reduction to excess on-balance sheet liquidity from pandemicContinued increase in our contingency funding capacity at both the FHLB and FRBLimited usage of the FRB’s Paycheck Protection Program Lending Facility (“PPPLF”) to date$31.1 million of borrowings as of June 30,
Slide 14: SBA Paycheck Protection Program
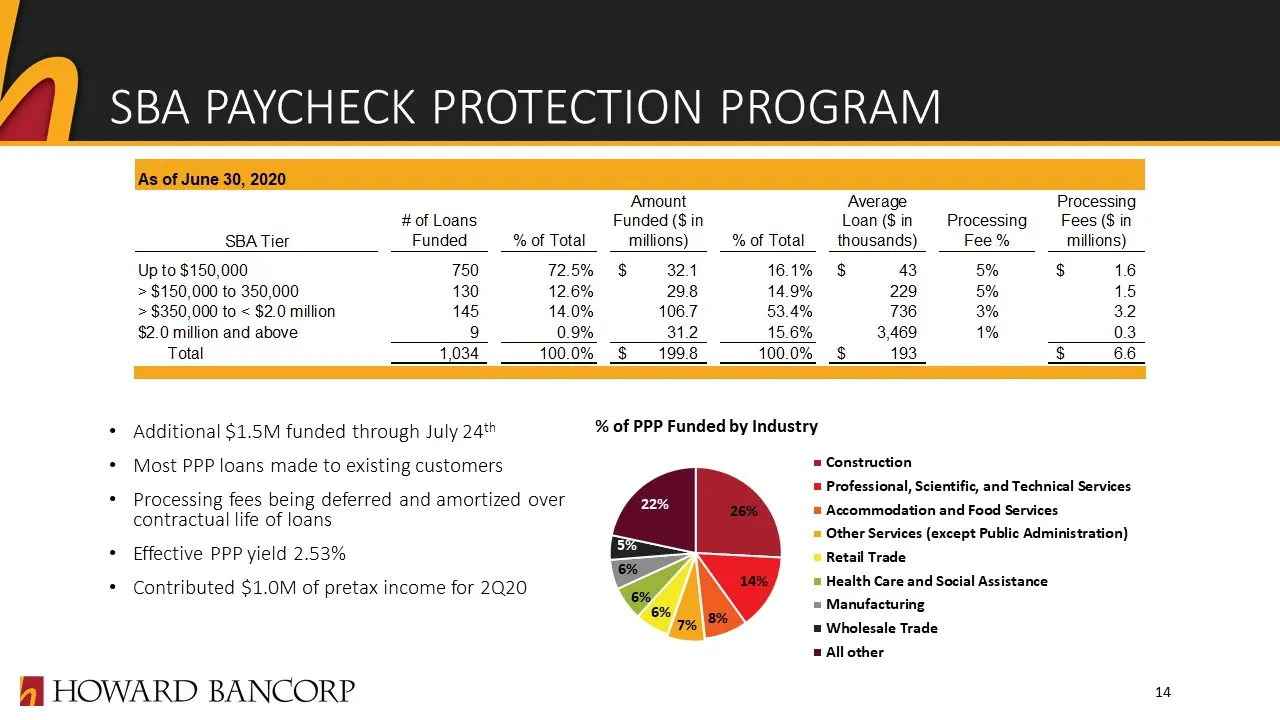
SBA PAYCHECK PROTECTION PROGRAM Additional $1.5M funded through July 24th Most PPP loans made to existing customersProcessing fees being deferred and amortized over contractual life of loansEffective PPP yield 2.53%Contributed $1.0M of pretax income for 2Q20 14
Slide 15: Loan Portfolio Composition
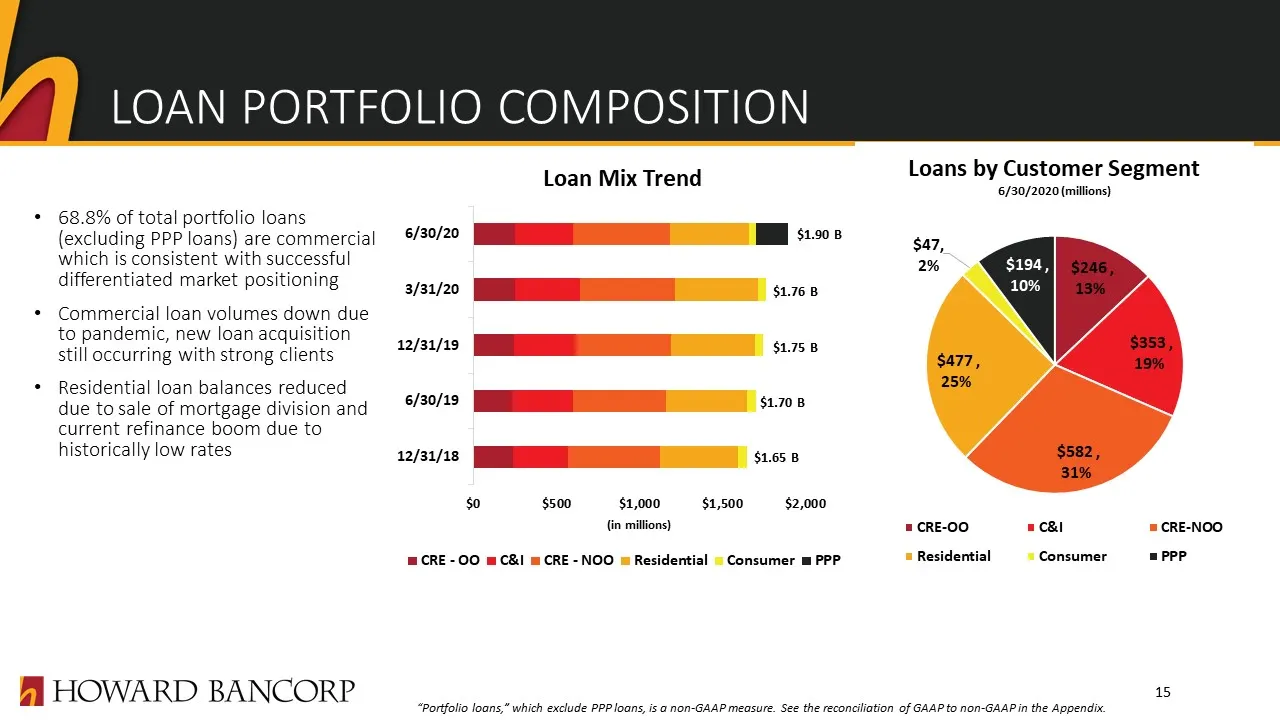
LOAN PORTFOLIO COMPOSITION 68.8% of total portfolio loans (excluding PPP loans) are commercial which is consistent with successful differentiated market positioningCommercial loan volumes down due to pandemic, new loan acquisition still occurring with strong clientsResidential loan balances reduced
Slide 16: Credit Line Utilization
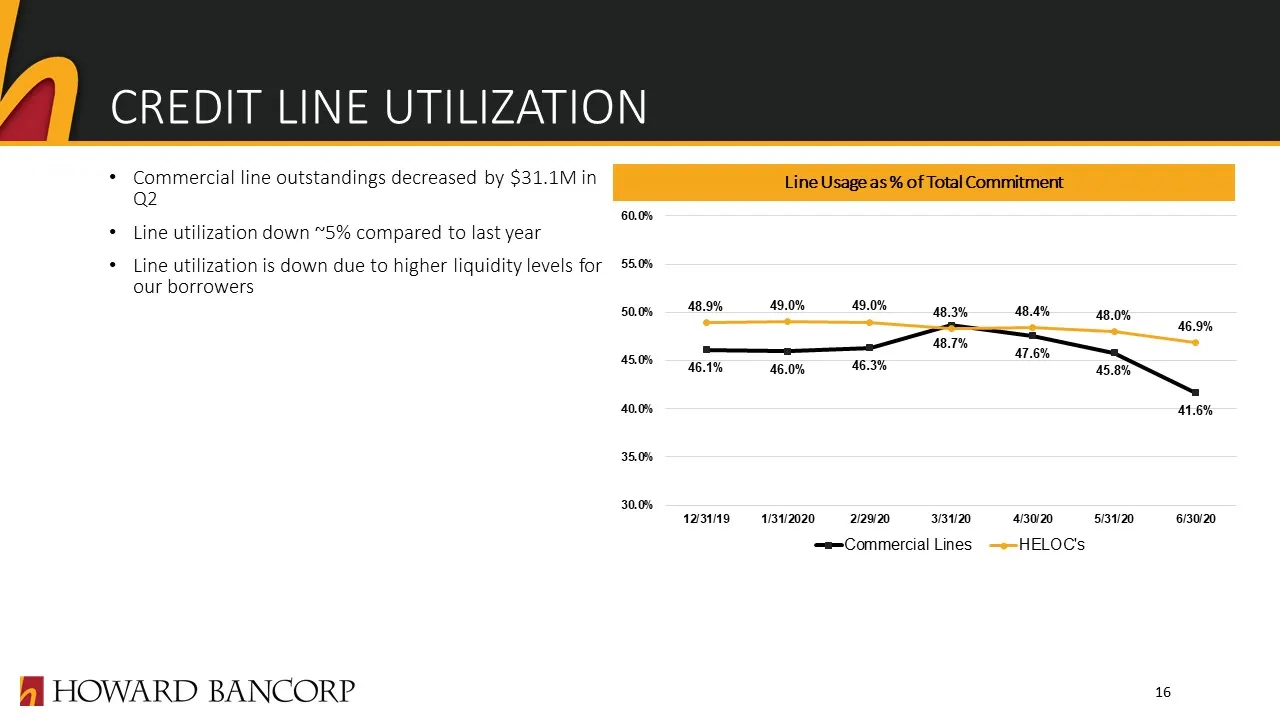
CREDIT LINE UTILIZATION Commercial line outstandings decreased by $31.1M in Q2Line utilization down ~5% compared to last yearLine utilization is down due to higher liquidity levels for our borrowers 16 Line Usage as % of Total Commitment
Slide 17: Credit Culture & Underwriting Standards
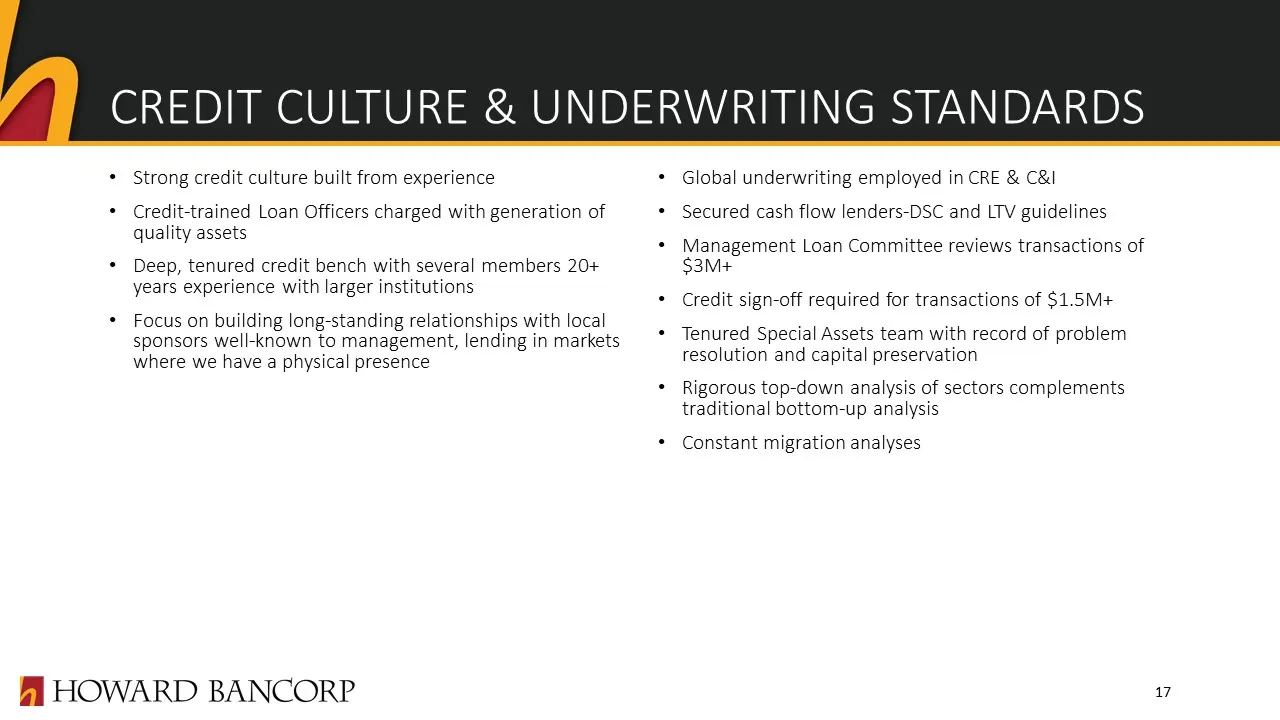
CREDIT CULTURE & UNDERWRITING STANDARDS Strong credit culture built from experienceCredit-trained Loan Officers charged with generation of quality assetsDeep, tenured credit bench with several members 20+ years experience with larger institutionsFocus on building long-standing relationships with loc
Slide 18: Asset Quality Trends
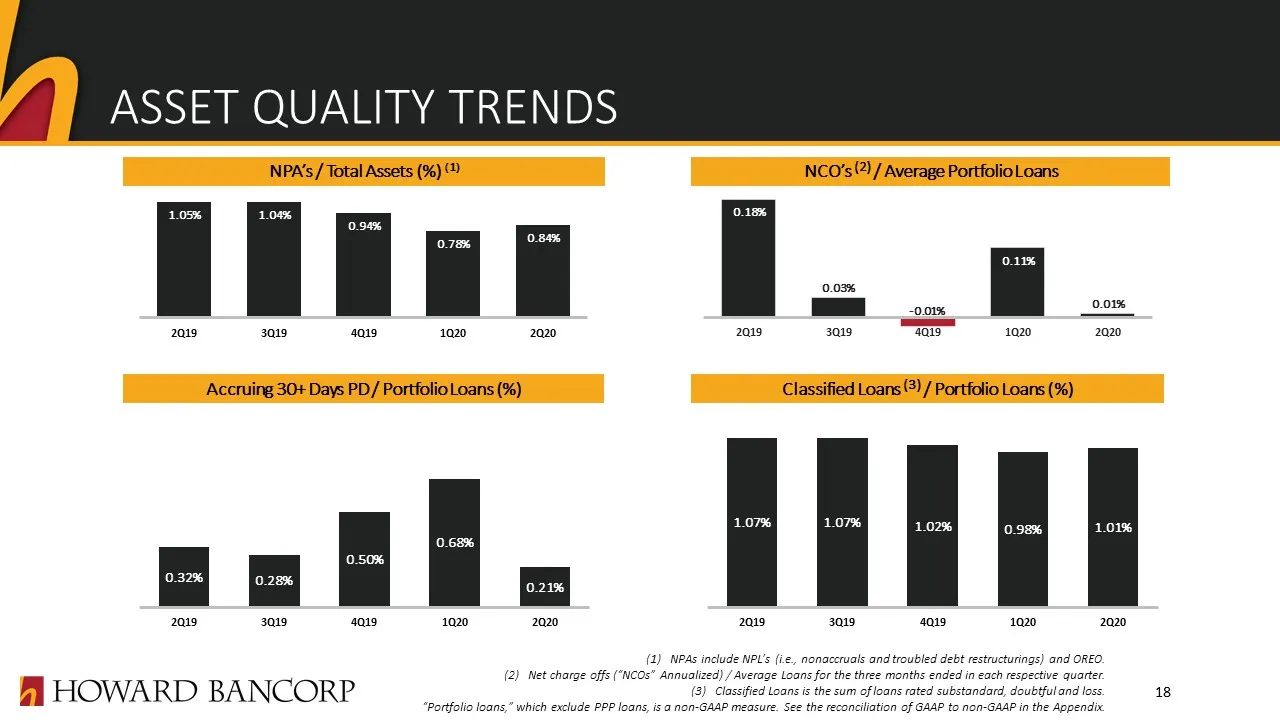
ASSET QUALITY TRENDS NPAs include NPL’s (i.e., nonaccruals and troubled debt restructurings) and OREO.Net charge offs (“NCOs” Annualized) / Average Loans for the three months ended in each respective quarter.Classified Loans is the sum of loans rated substandard, doubtful and loss.“Portfolio loans,”
Slide 19: Asset Quality Trends (continued)
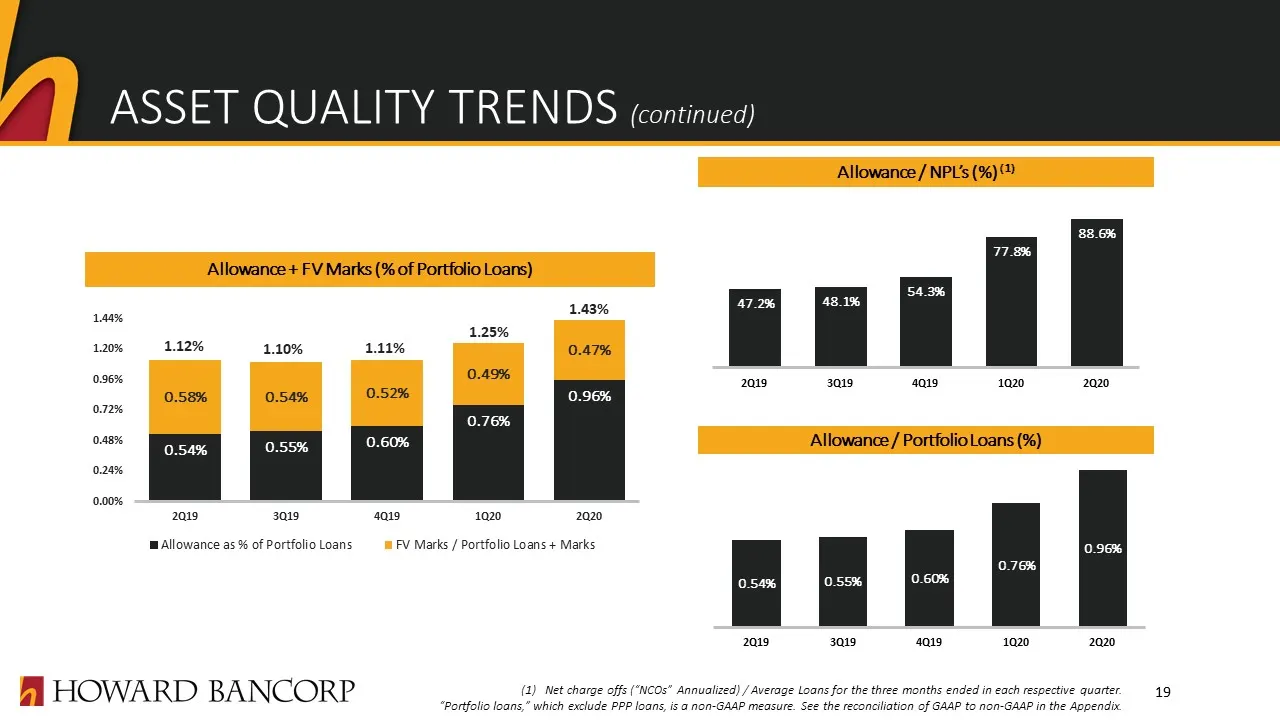
ASSET QUALITY TRENDS (continued) Net charge offs (“NCOs” Annualized) / Average Loans for the three months ended in each respective quarter.“Portfolio loans,” which exclude PPP loans, is a non-GAAP measure. See the reconciliation of GAAP to non-GAAP in the Appendix. Allowance / NPL’s (%) (1) Allowanc
Slide 20: Loan Modifications for Borrowers
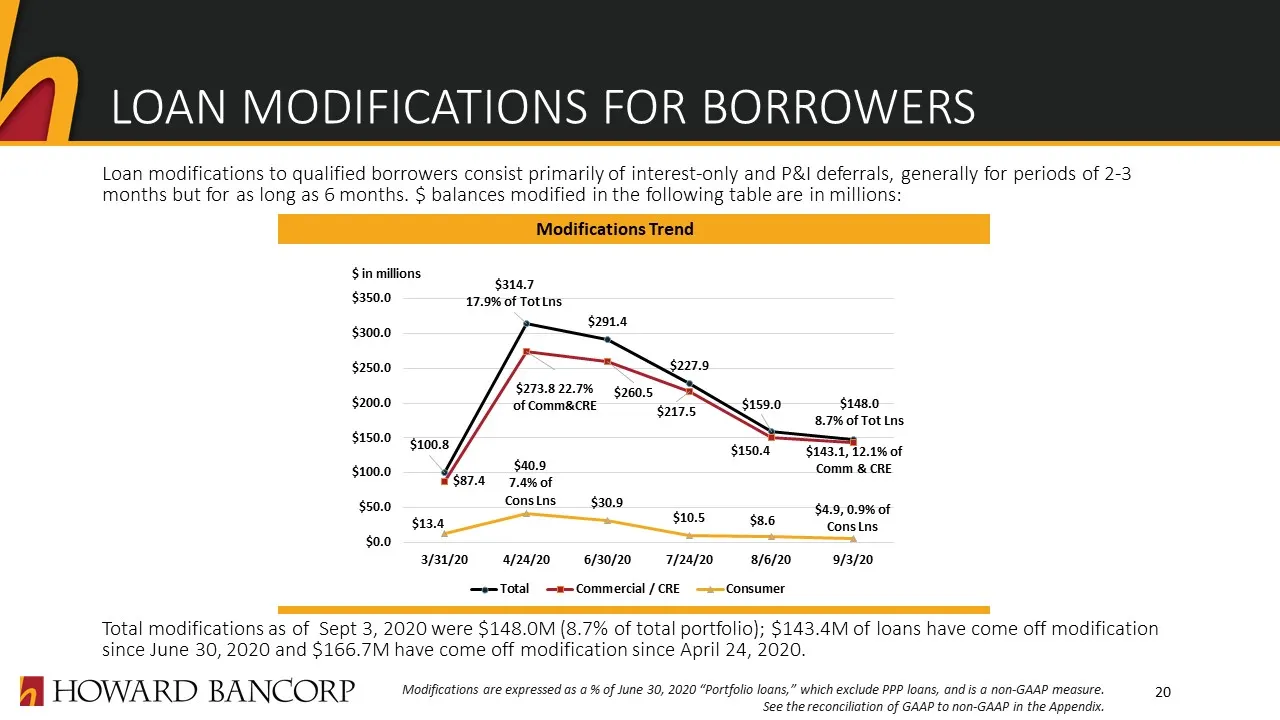
LOAN MODIFICATIONS FOR BORROWERS Loan modifications to qualified borrowers consist primarily of interest-only and P&I deferrals, generally for periods of 2-3 months but for as long as 6 months. $ balances modified in the following table are in millions: Total modifications as of Sept 3, 2020 were $1
Slide 21: Loan Modifications for Borrowers
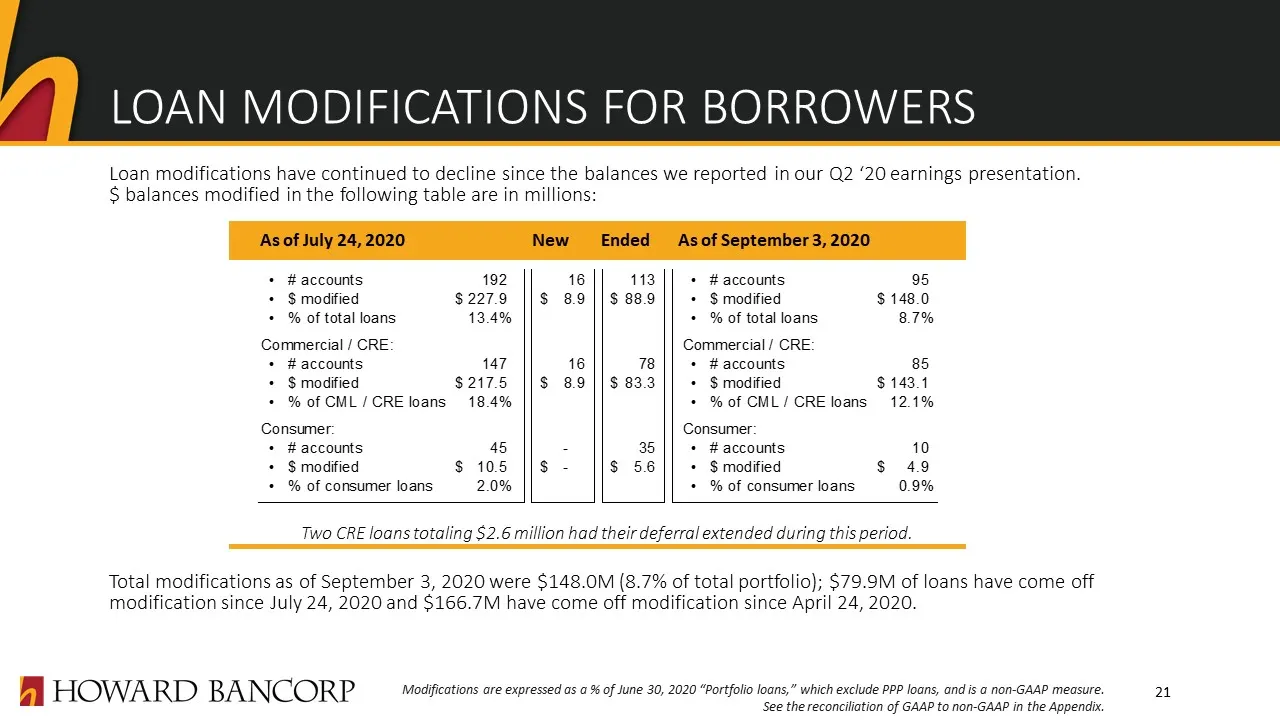
LOAN MODIFICATIONS FOR BORROWERS Loan modifications have continued to decline since the balances we reported in our Q2 ‘20 earnings presentation. $ balances modified in the following table are in millions: Two CRE loans totaling $2.6 million had their deferral extended during this period.Total modif
Slide 22: Potentially Highly Impacted Loan Sectors
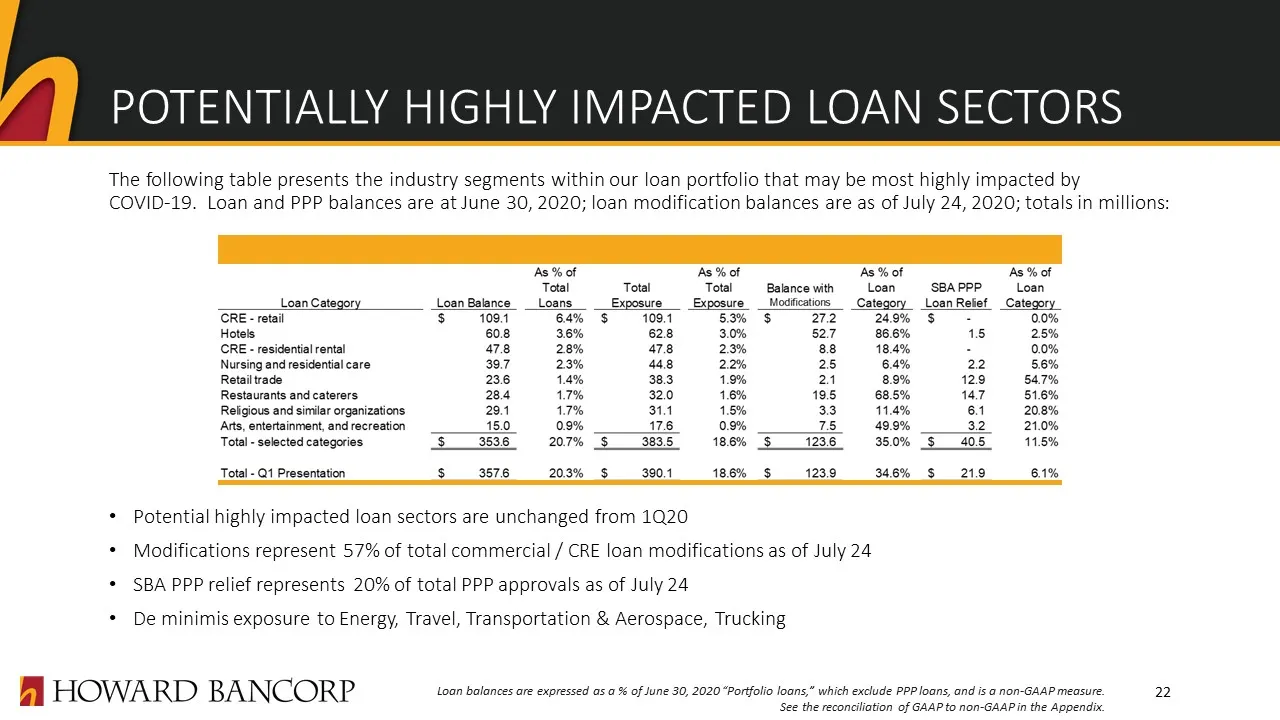
The following table presents the industry segments within our loan portfolio that may be most highly impacted by COVID-19. Loan and PPP balances are at June 30, 2020; loan modification balances are as of July 24, 2020; totals in millions: Potential highly impacted loan sectors are unchanged from 1Q2
Slide 23: Potentially Highly Impacted Loan Sectors
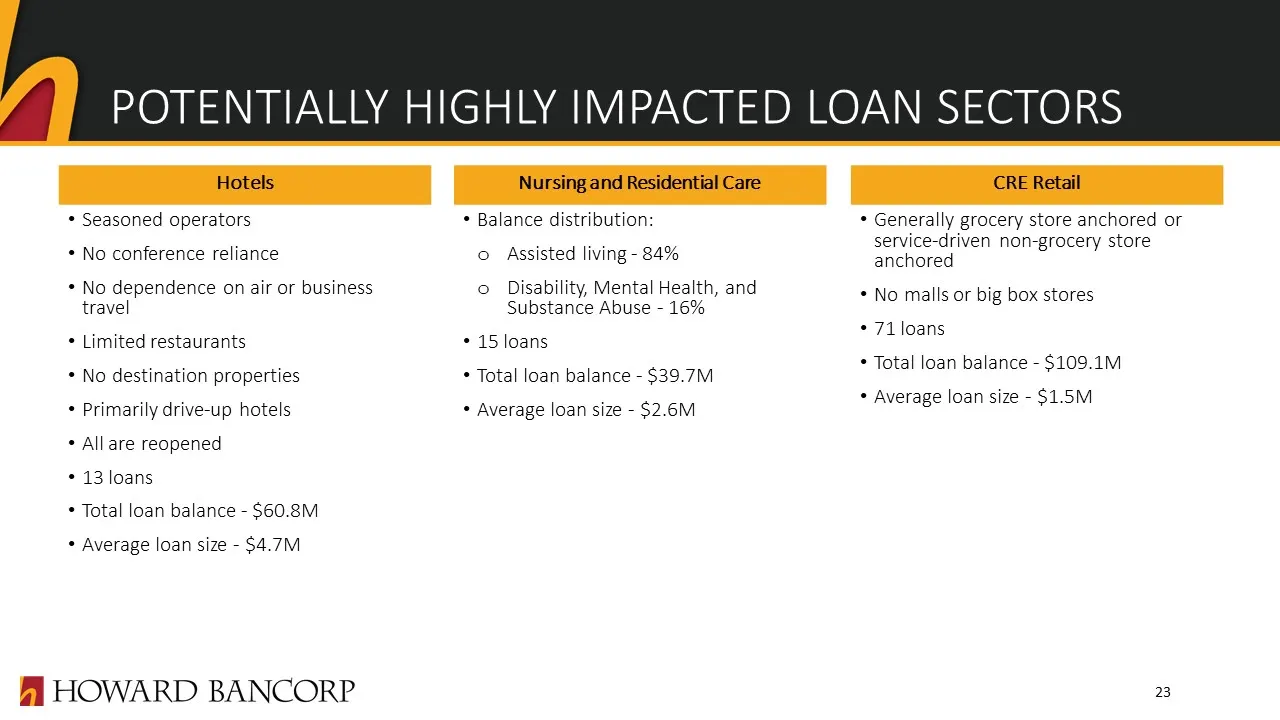
POTENTIALLY HIGHLY IMPACTED LOAN SECTORS 23 Hotels Nursing and Residential Care CRE Retail Seasoned operatorsNo conference relianceNo dependence on air or business travelLimited restaurantsNo destination propertiesPrimarily drive-up hotelsAll are reopened 13 loansTotal loan balance - $60.8MAverage l
Slide 24: Increased Allowance for Credit Losses
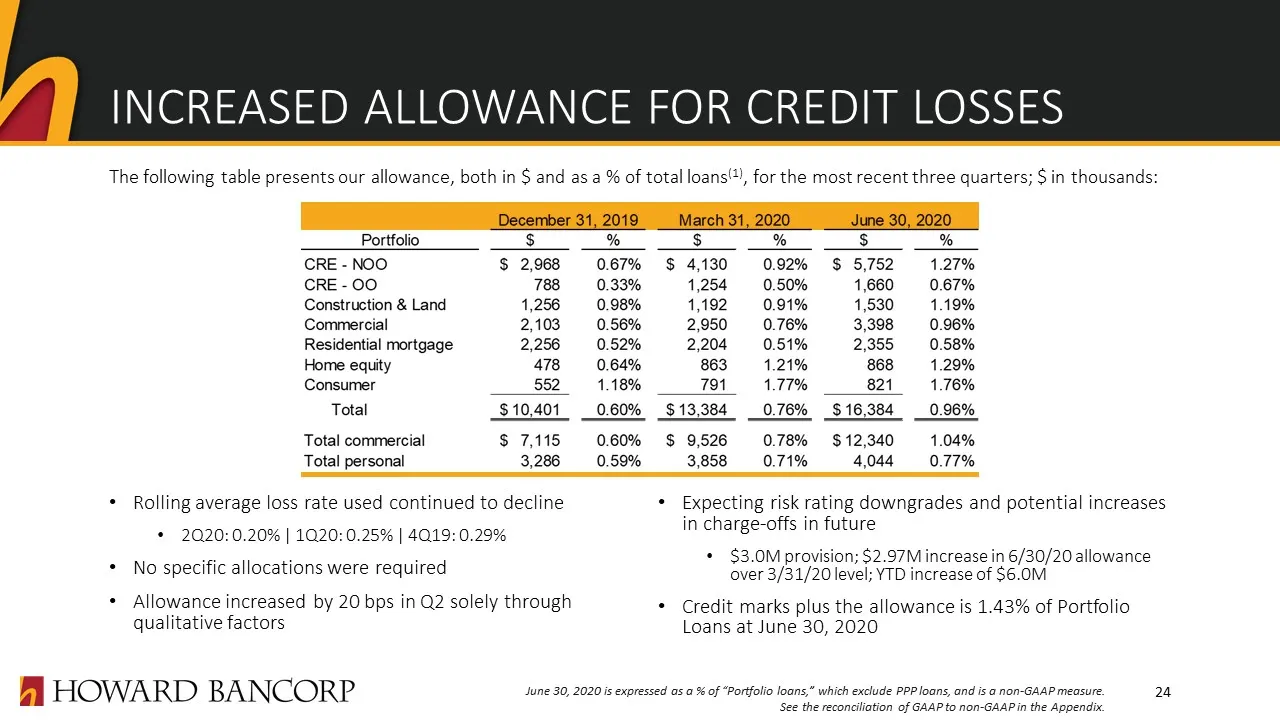
The following table presents our allowance, both in $ and as a % of total loans(1), for the most recent three quarters; $ in thousands: INCREASED ALLOWANCE FOR CREDIT LOSSES June 30, 2020 is expressed as a % of “Portfolio loans,” which exclude PPP loans, and is a non-GAAP measure.See the reconciliat
Slide 25: Net Interest Income & NIM
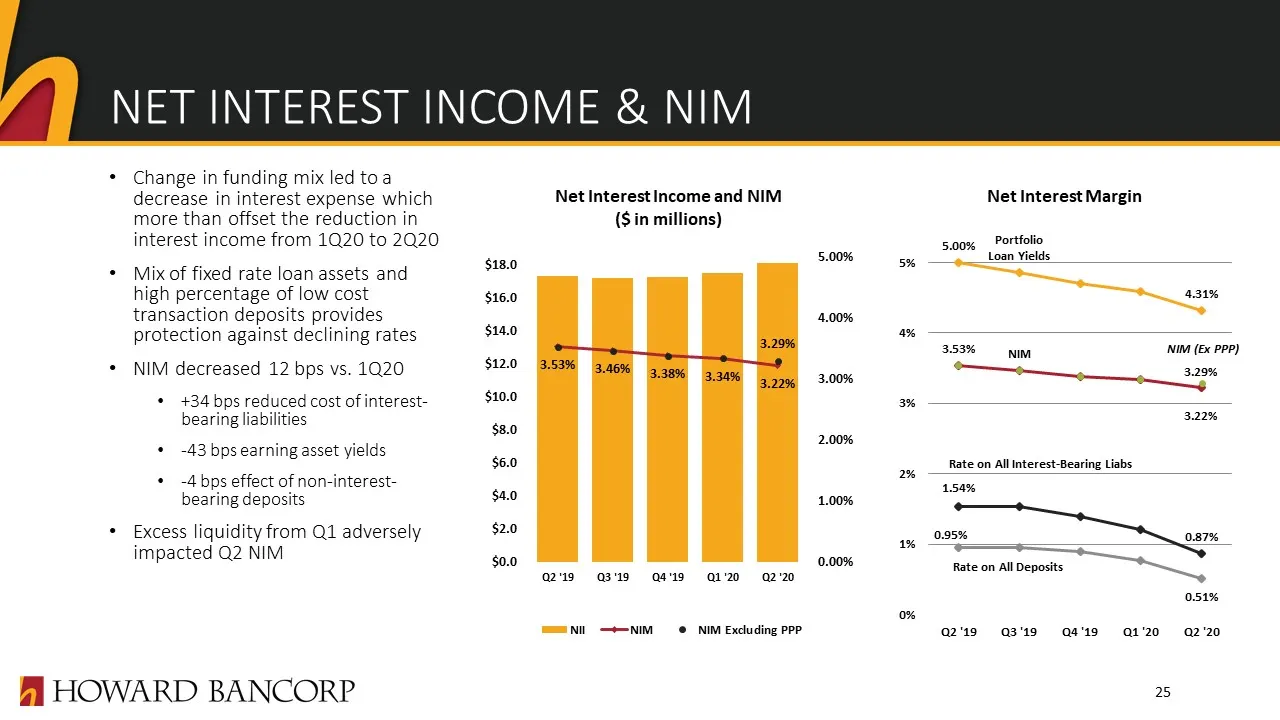
NET INTEREST INCOME & NIM Change in funding mix led to a decrease in interest expense which more than offset the reduction in interest income from 1Q20 to 2Q20Mix of fixed rate loan assets and high percentage of low cost transaction deposits provides protection against declining ratesNIM decreased 1
Slide 26: Loan Yields & Deposit Rate Trends
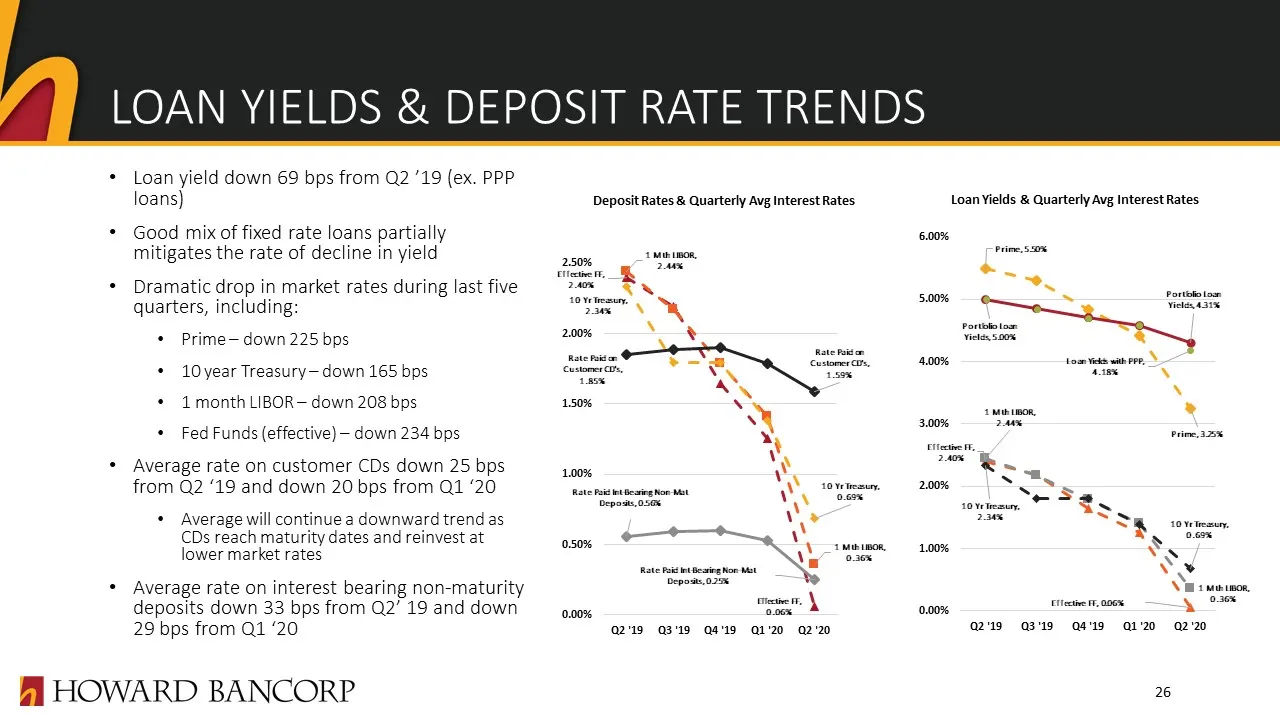
LOAN YIELDS & DEPOSIT RATE TRENDS Loan yield down 69 bps from Q2 ’19 (ex. PPP loans)Good mix of fixed rate loans partially mitigates the rate of decline in yieldDramatic drop in market rates during last five quarters, including:Prime – down 225 bps10 year Treasury – down 165 bps1 month LIBOR – down
Slide 27: Deposit Composition & Trends
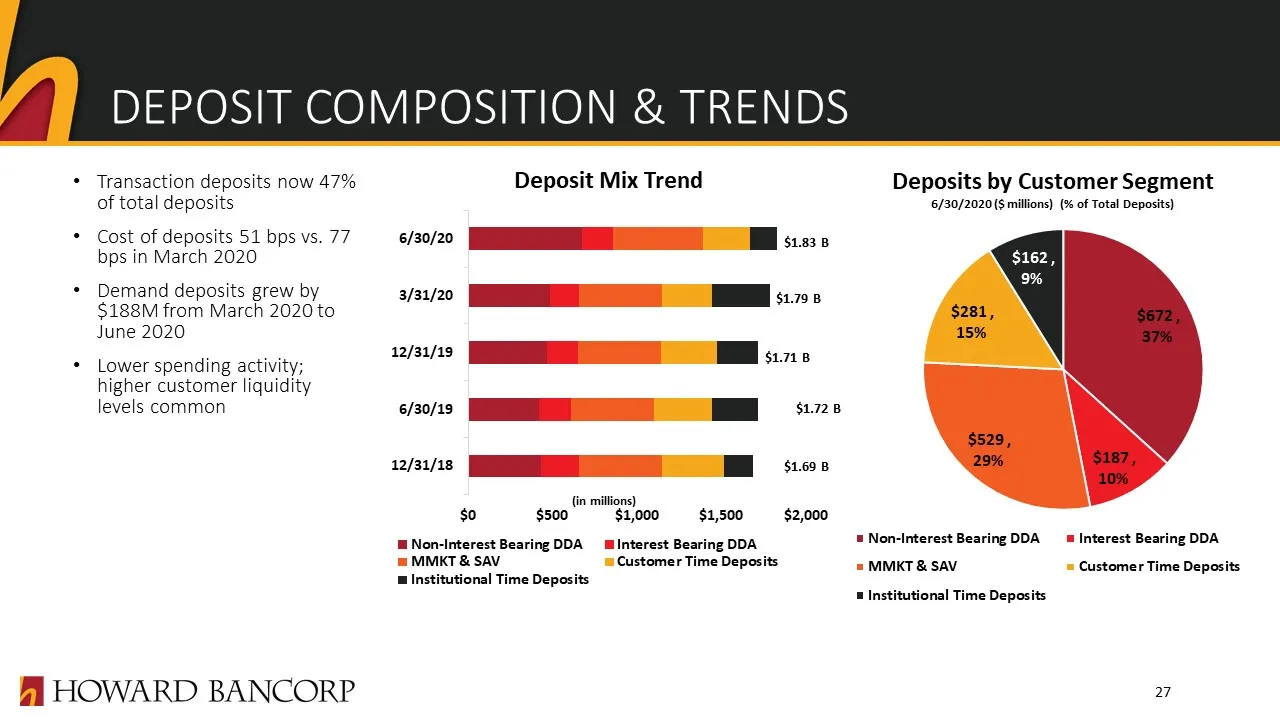
DEPOSIT COMPOSITION & TRENDS Transaction deposits now 47% of total depositsCost of deposits 51 bps vs. 77 bps in March 2020Demand deposits grew by $188M from March 2020 to June 2020 Lower spending activity; higher customer liquidity levels common 27 $1.72 B $1.69 B
Slide 28: Growth & Opportunities
GROWTH & OPPORTUNITIES Leverage heightened brand awareness Hire experienced Commercial Bankers Commercial and Industrial Commercial real estateBusiness Bankers & Business Development OfficersContinue expanding into the greater Washington, D.C. marketplace Restructured health care lending team along
Slide 29: Cost Savings Post-Merger
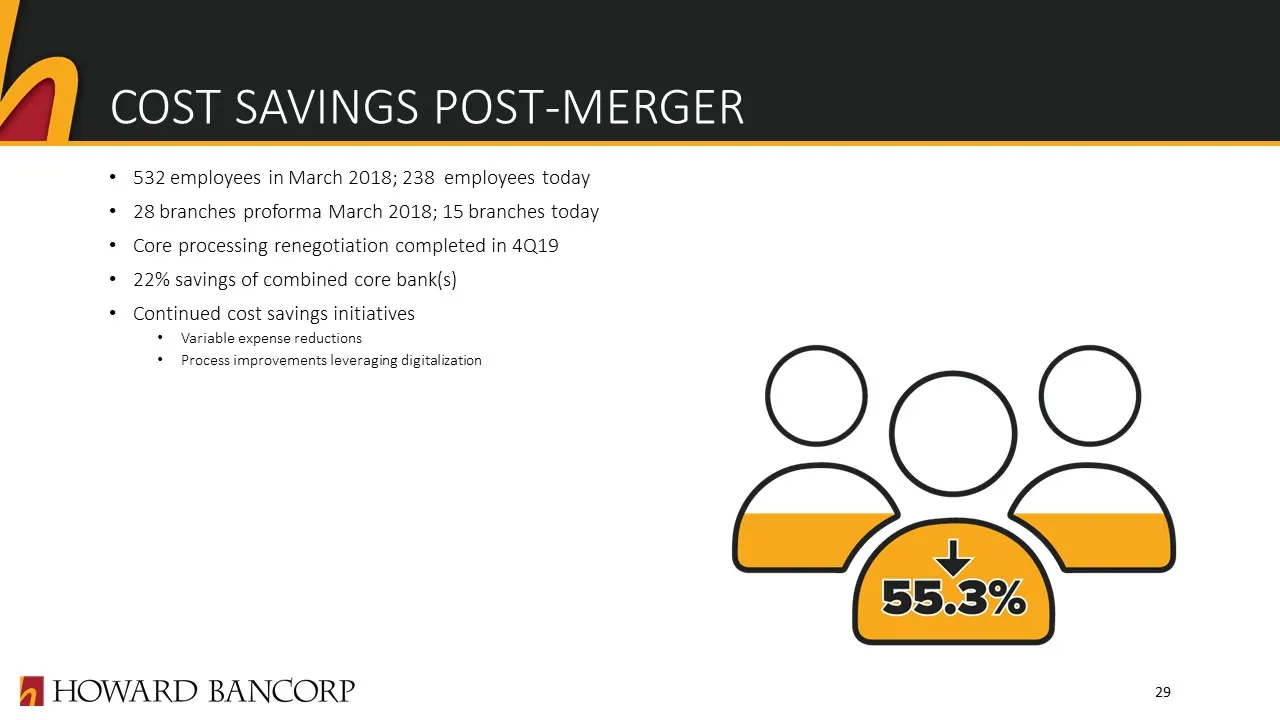
COST SAVINGS POST-MERGER 532 employees in March 2018; 238 employees today 28 branches proforma March 2018; 15 branches today Core processing renegotiation completed in 4Q1922% savings of combined core bank(s)Continued cost savings initiativesVariable expense reductionsProcess improvements leveraging
Slide 30: Quarterly Highlights
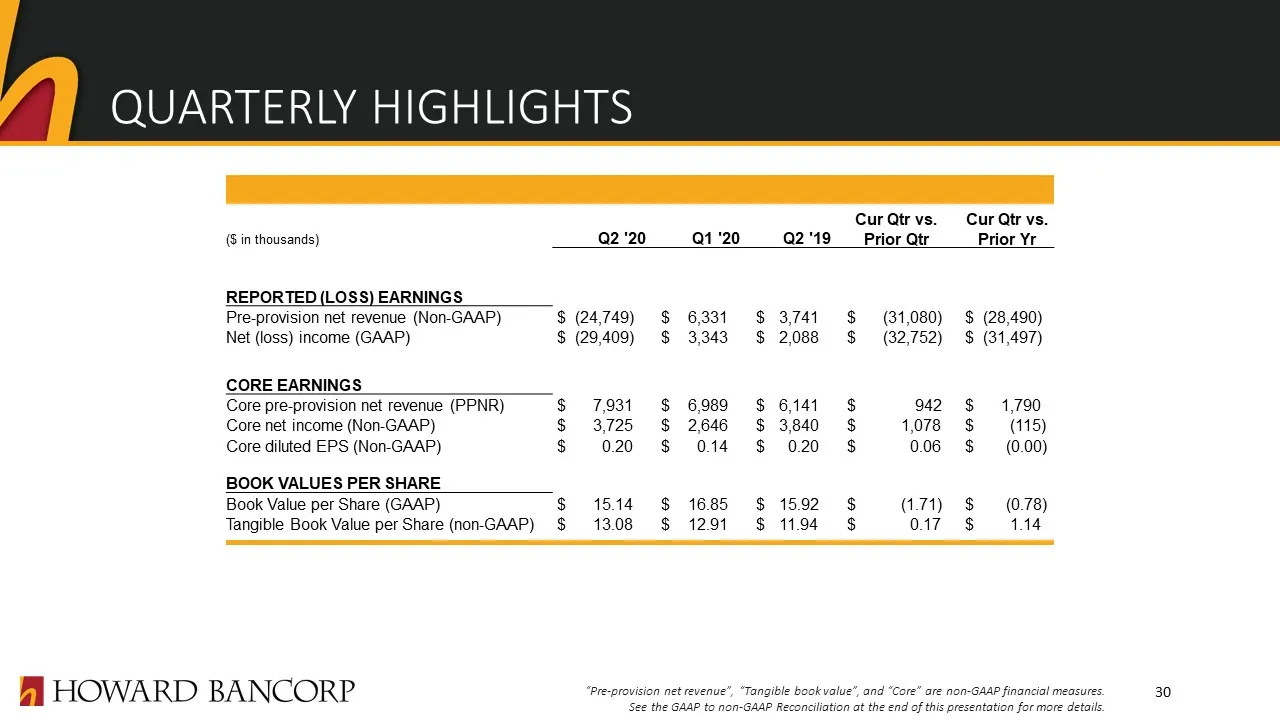
QUARTERLY HIGHLIGHTS “Pre-provision net revenue”, “Tangible book value”, and “Core” are non-GAAP financial measures.See the GAAP to non-GAAP Reconciliation at the end of this presentation for more details. ($ in thousands) Q2 '20 Q1 '20 Q2 '19 Cur Qtr vs. Prior Qtr Cur Qtr vs. Prior Yr REPORTED (LOS
Slide 31: Earnings Snapshot
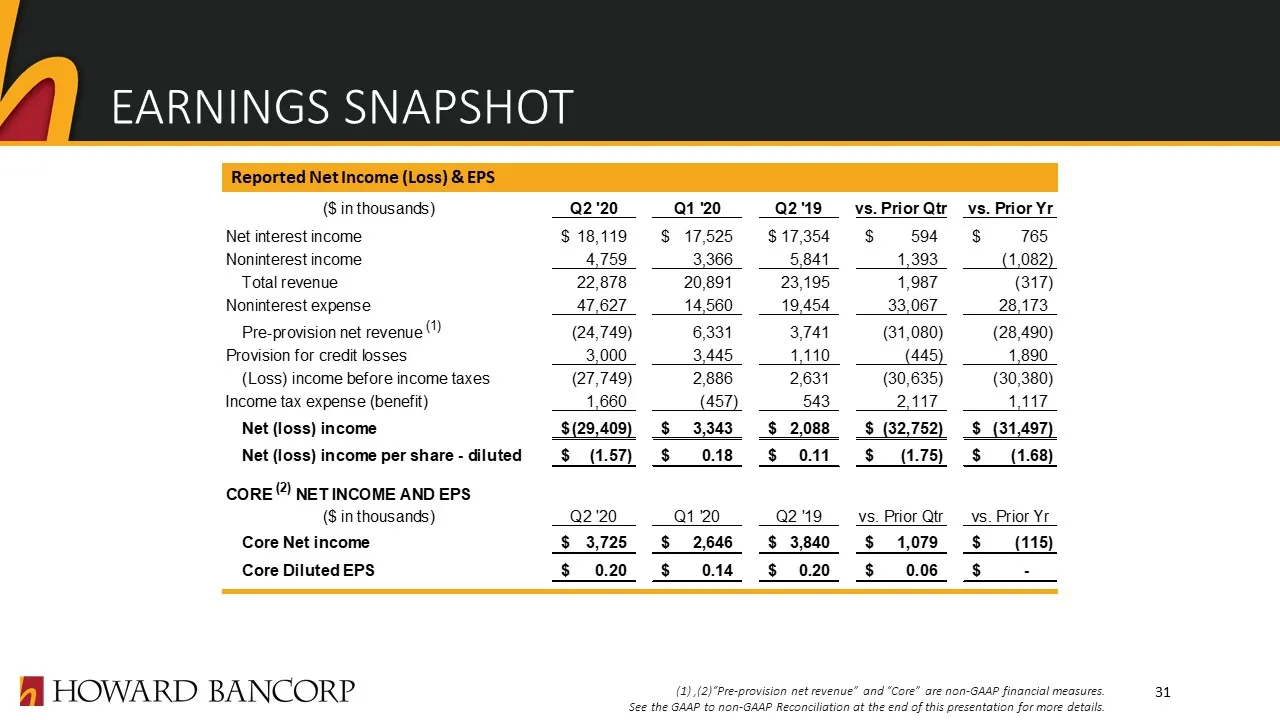
EARNINGS SNAPSHOT (1) ,(2)“Pre-provision net revenue” and “Core” are non-GAAP financial measures.See the GAAP to non-GAAP Reconciliation at the end of this presentation for more details. Reported Net Income (Loss) & EPS 31
Slide 32: Profitability Measures
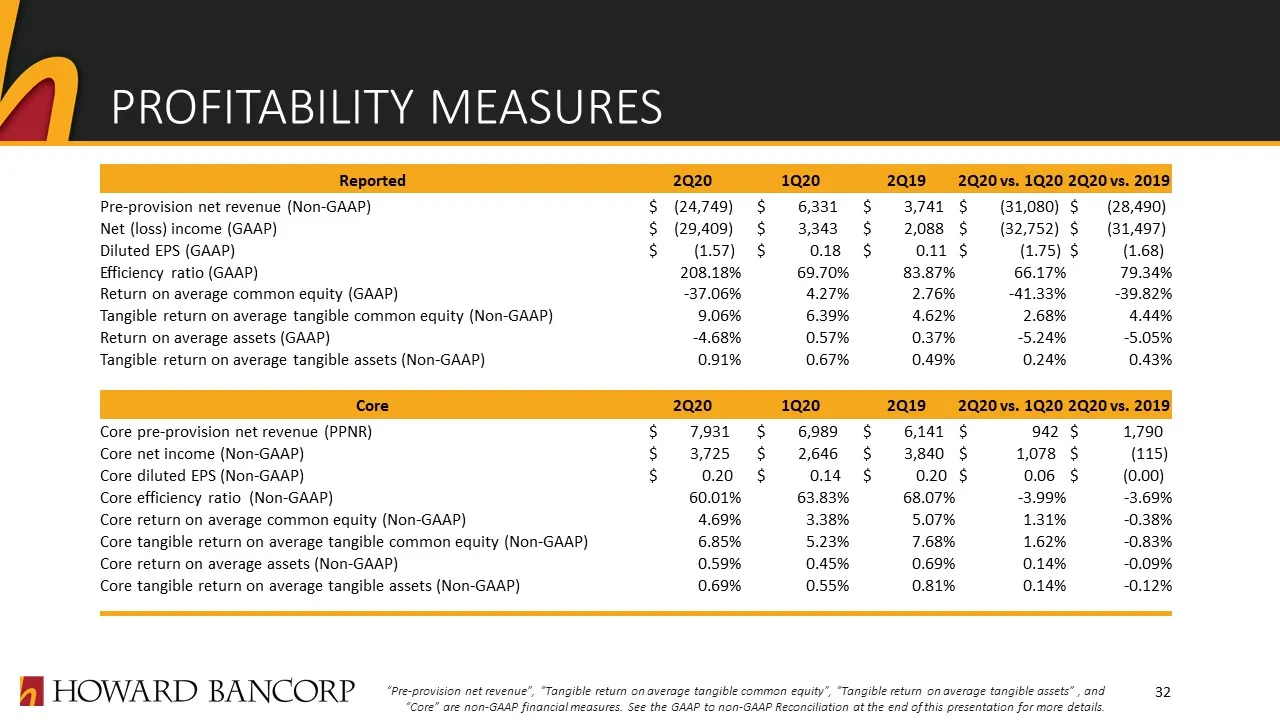
PROFITABILITY MEASURES “Pre-provision net revenue”, “Tangible return on average tangible common equity”, “Tangible return on average tangible assets” , and “Core” are non-GAAP financial measures. See the GAAP to non-GAAP Reconciliation at the end of this presentation for more details. 32 Reported 2Q
Slide 33: Value Proposition Recap
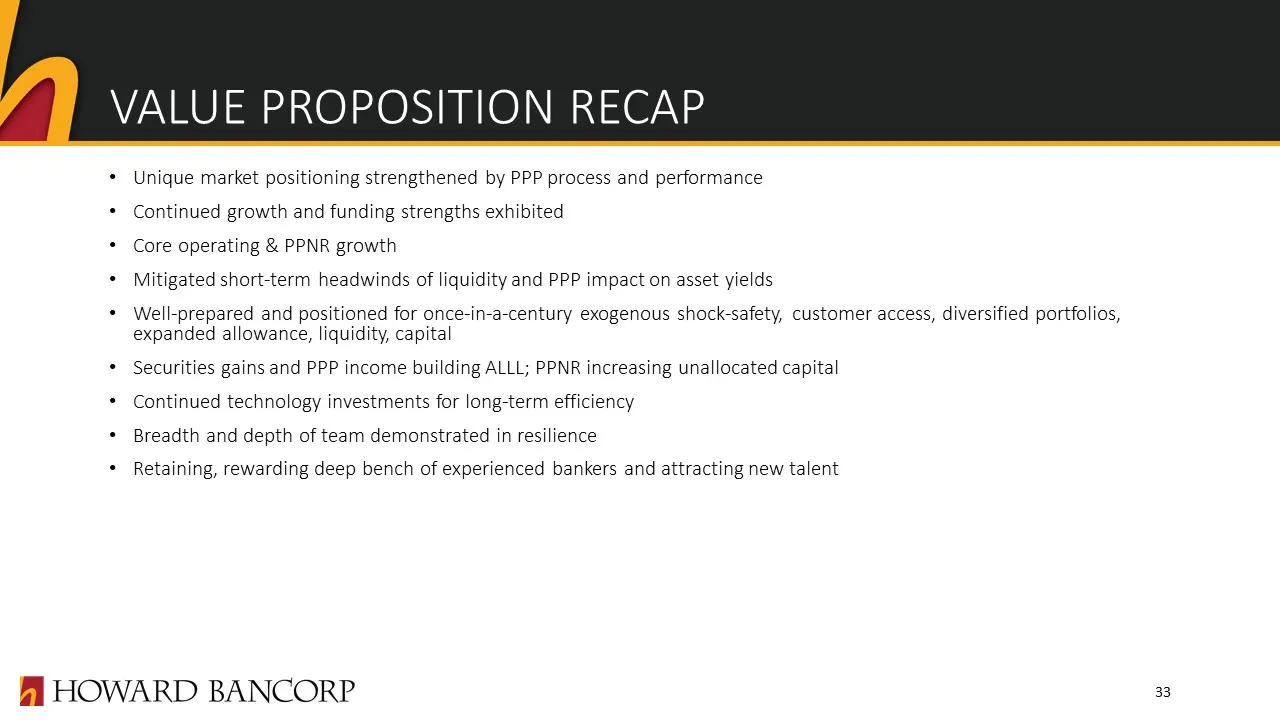
VALUE PROPOSITION RECAP Unique market positioning strengthened by PPP process and performanceContinued growth and funding strengths exhibitedCore operating & PPNR growthMitigated short-term headwinds of liquidity and PPP impact on asset yieldsWell-prepared and positioned for once-in-a-century exogen

Slide 34: Appendix
HOWARD BANCORP APPENDIX
Slide 35: Quarterly Financial Performance
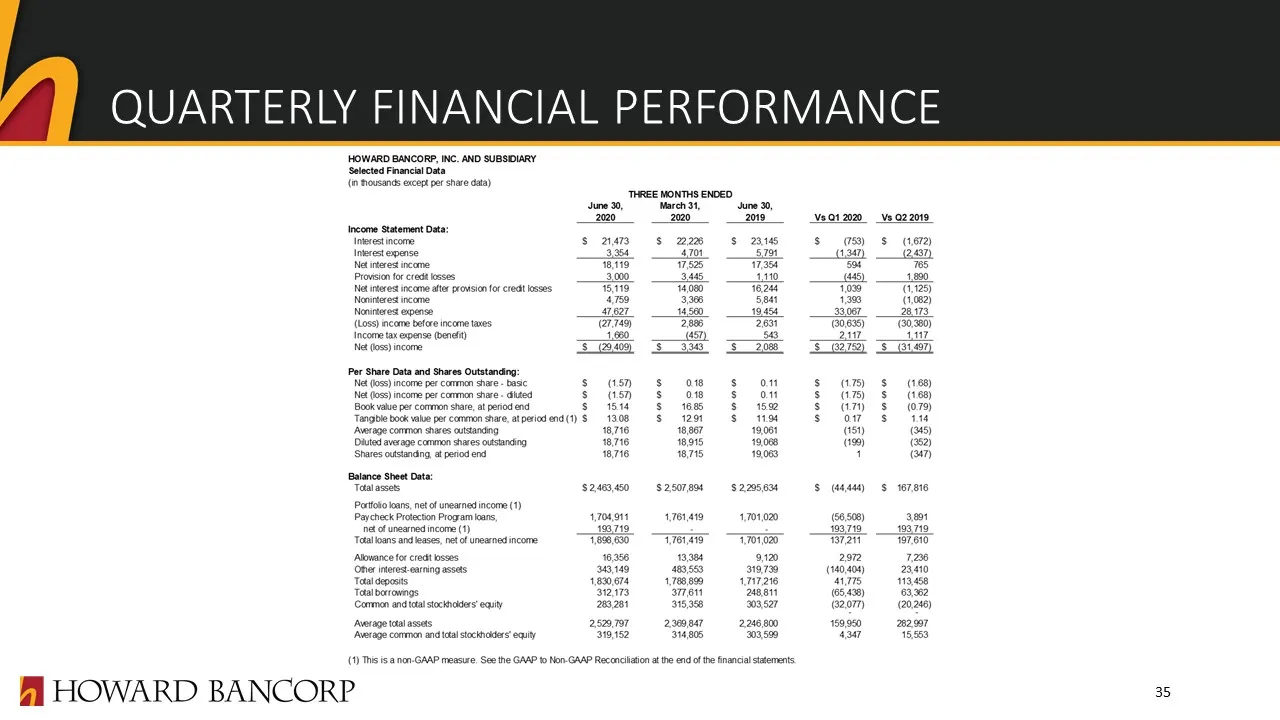
QUARTERLY FINANCIAL PERFORMANCE 35
Slide 36: Quarterly Financial Performance (continued)
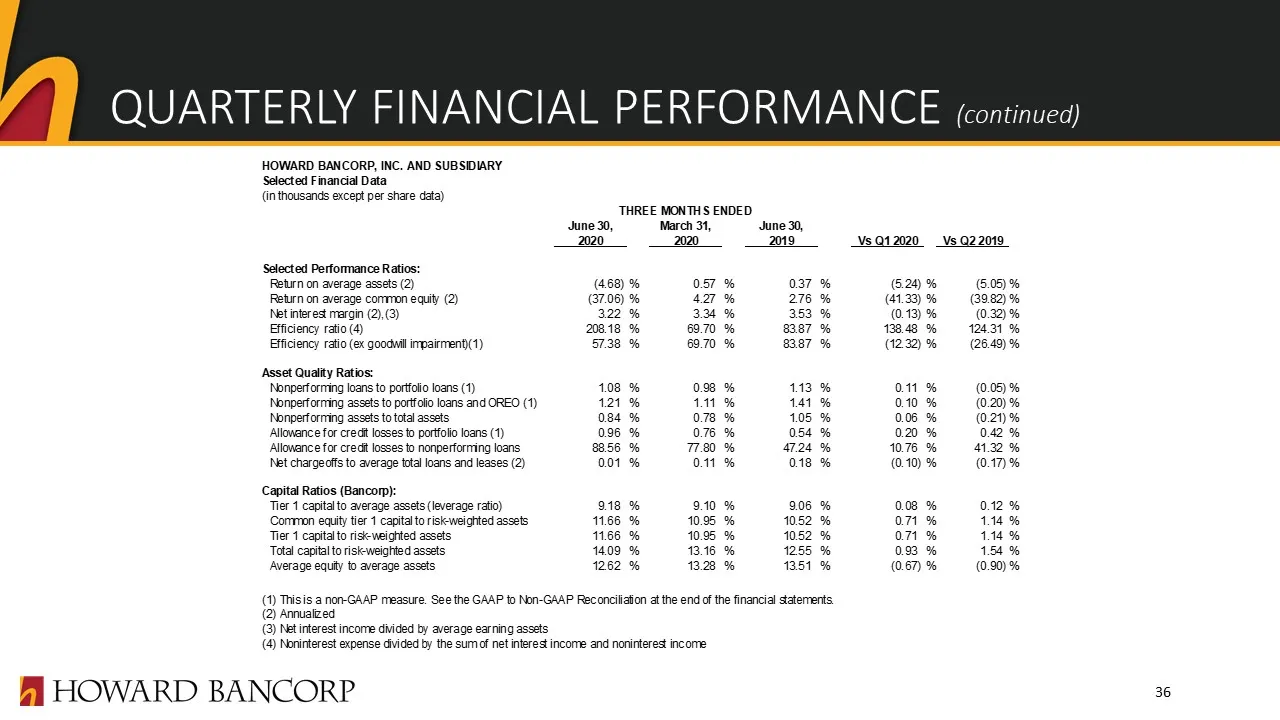
QUARTERLY FINANCIAL PERFORMANCE (continued) 36
Slide 37: Earning Asset Yields
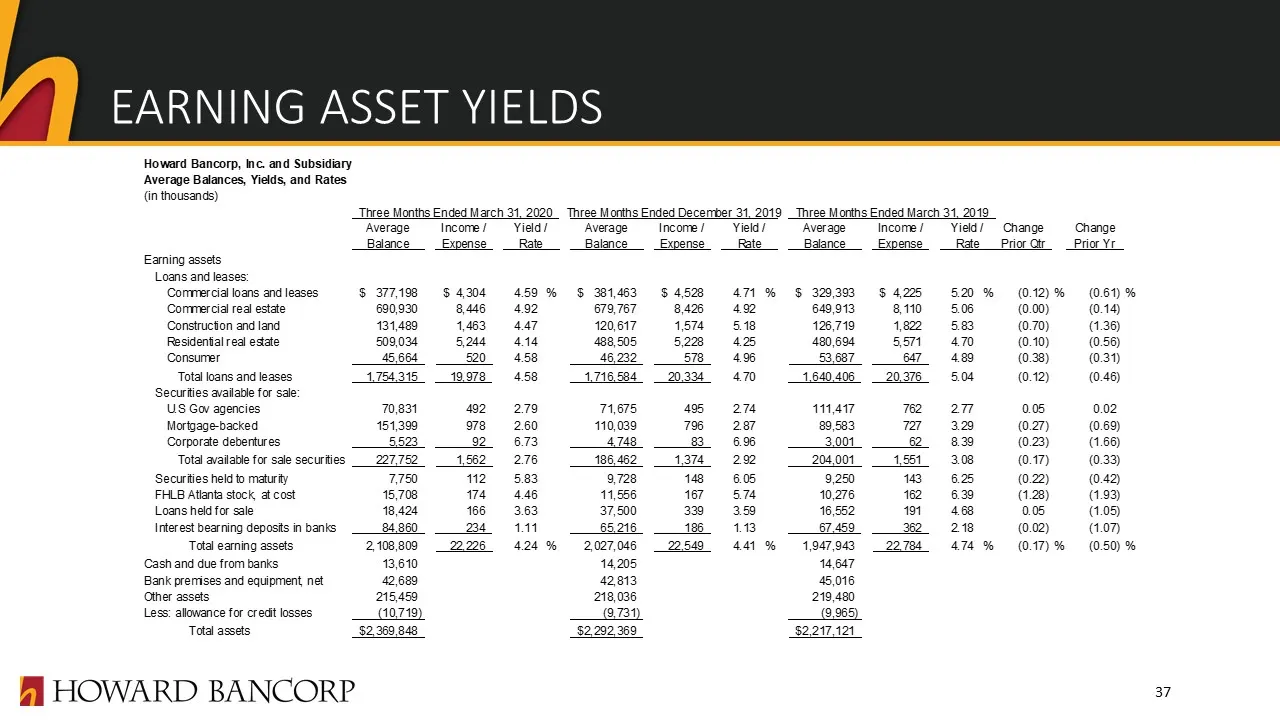
EARNING ASSET YIELDS Howard Bancorp, Inc. and Subsidiary Average Balances, Yields, and Rates (in thousands) ‘Thee Months Ended March 31, 2020 Three Monihs Ended Decerrber 31, 2019 _Three Months Ended March 31, 2019 Average Income/ Yield/ «Average ~—sIncome/—Yield/ ~——sAverage = Income/— ‘Yield ~—<Ch
Slide 38: Funding Rates & NIM
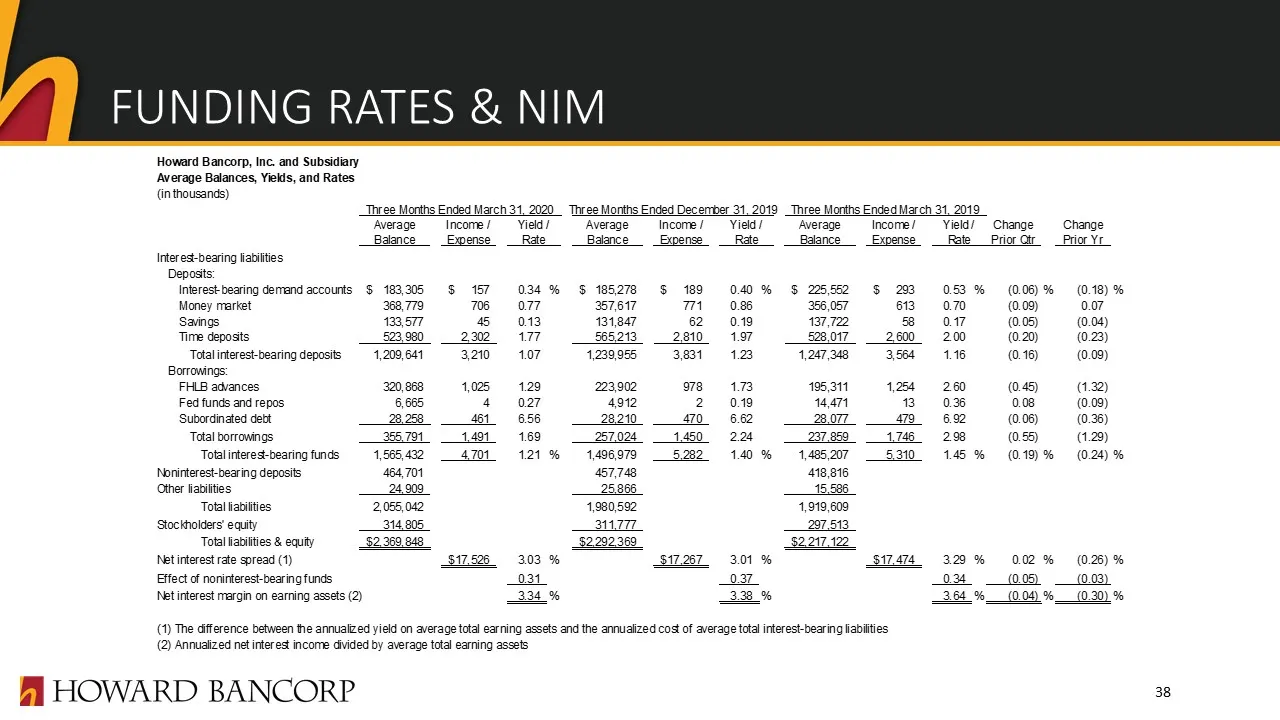
FUNDING RATES & NIM Howard Bancorp, Inc. and Subsidiary Average Balances, Yields, and Rates. (inthousands) ‘Three Months Ended March 31, 2020 Three Months Ended Decerrber 31, 2019 Three Months Ended March 31, 2019. ‘Average — ‘Income/ —Yield/ «Average ~—=«sIncome/ —Yield/ © Average ~—=Income/ Yield
Slide 39: GAAP to Non-GAAP Reconciliation
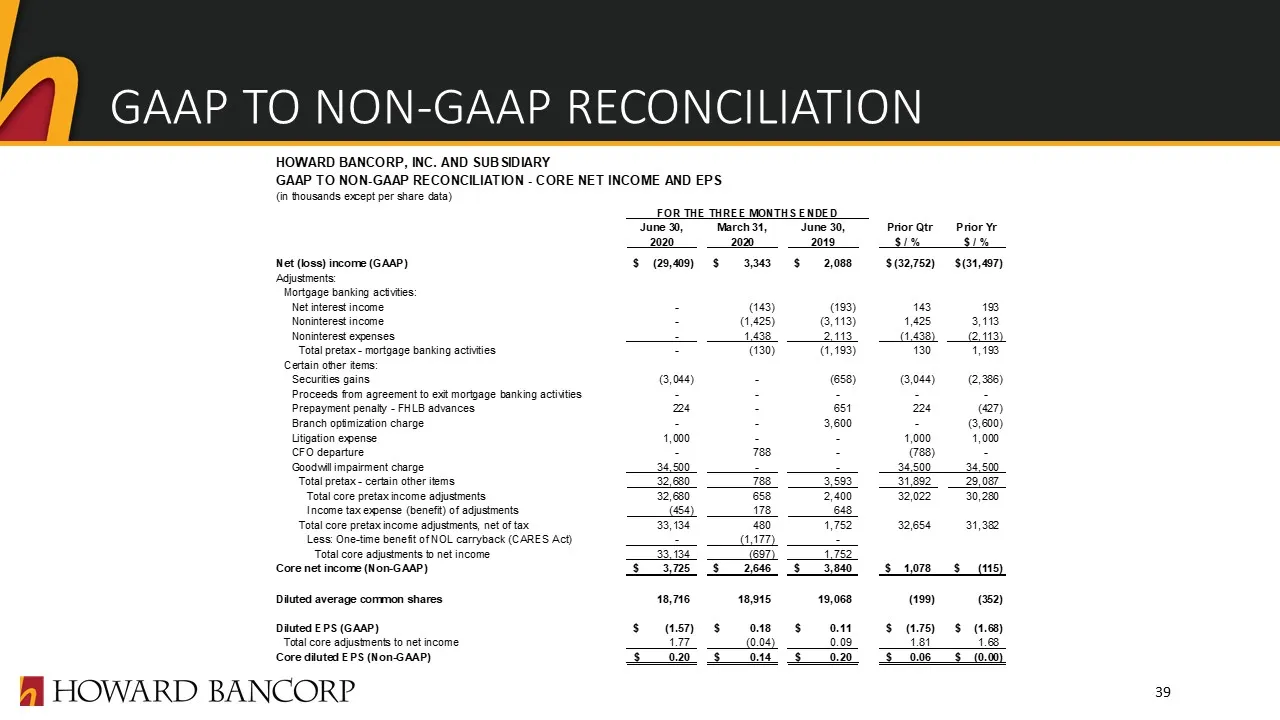
GAAP TO NON-GAAP RECONCILIATION 39
Slide 40: GAAP to Non-GAAP Reconciliation
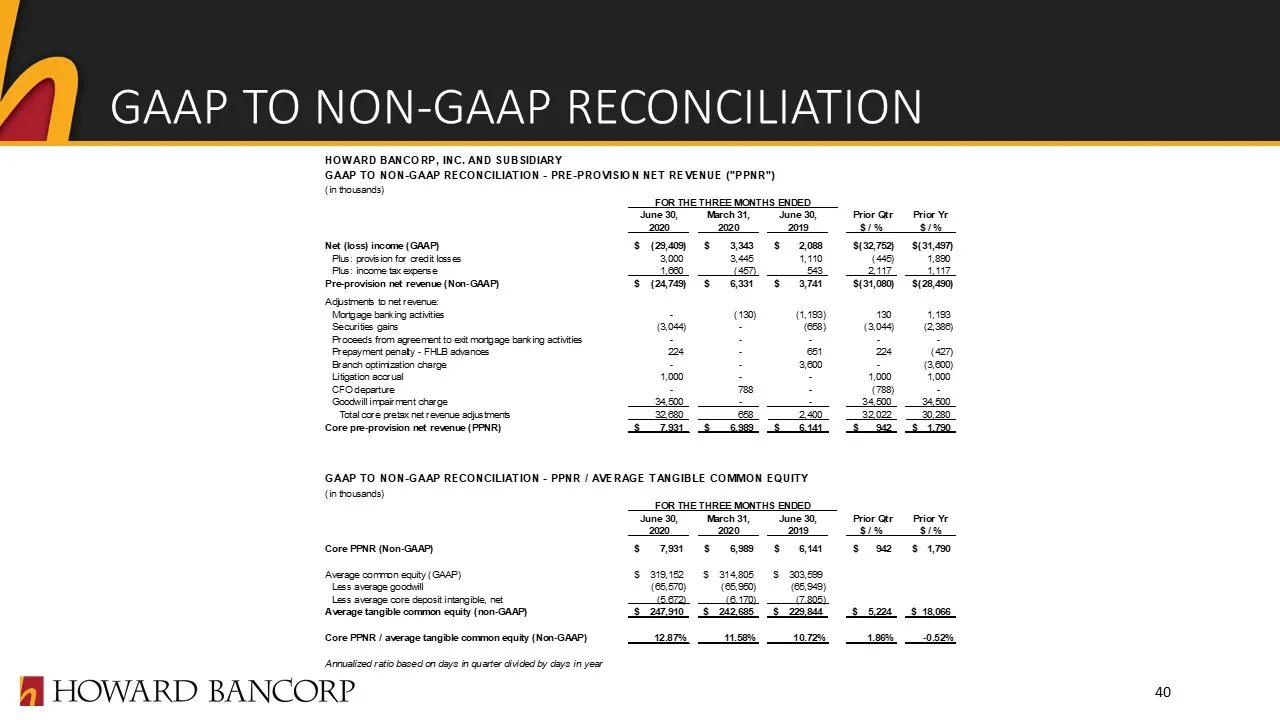
GAAP TO NON-GAAP RECONCILIATION 40
Slide 41: GAAP to Non-GAAP Reconciliation
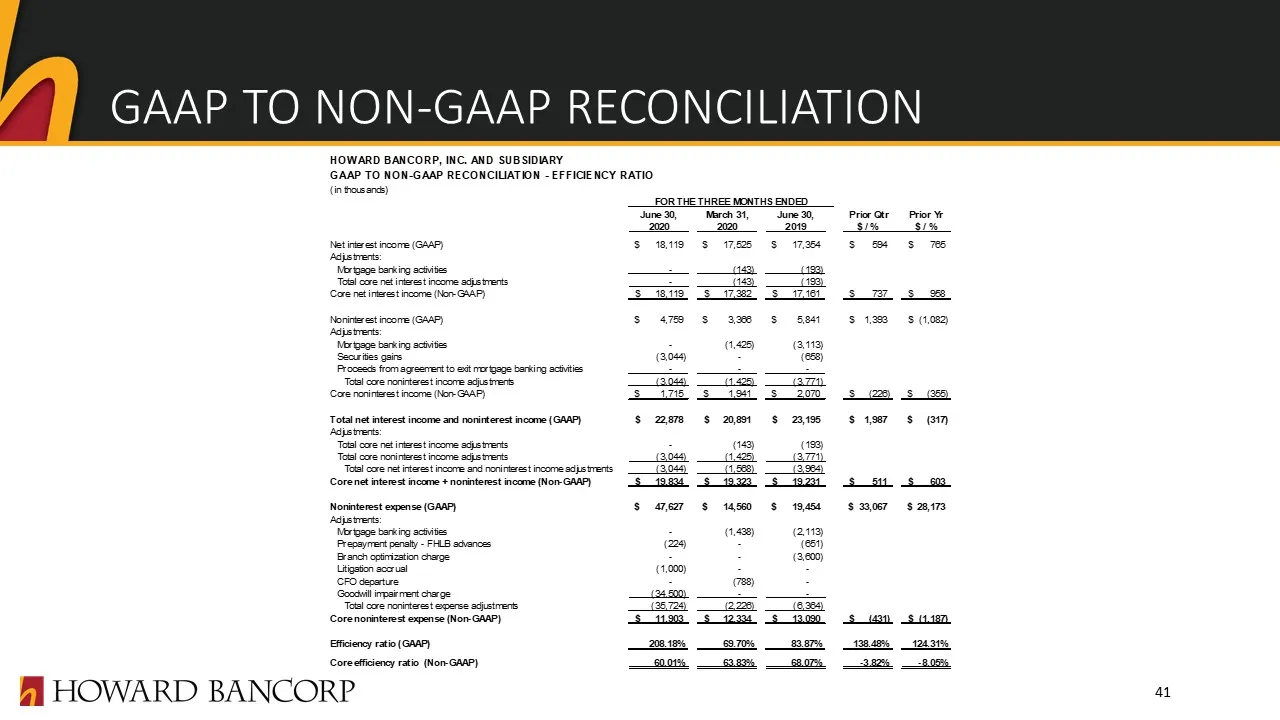
GAAP TO NON-GAAP RECONCILIATION 41
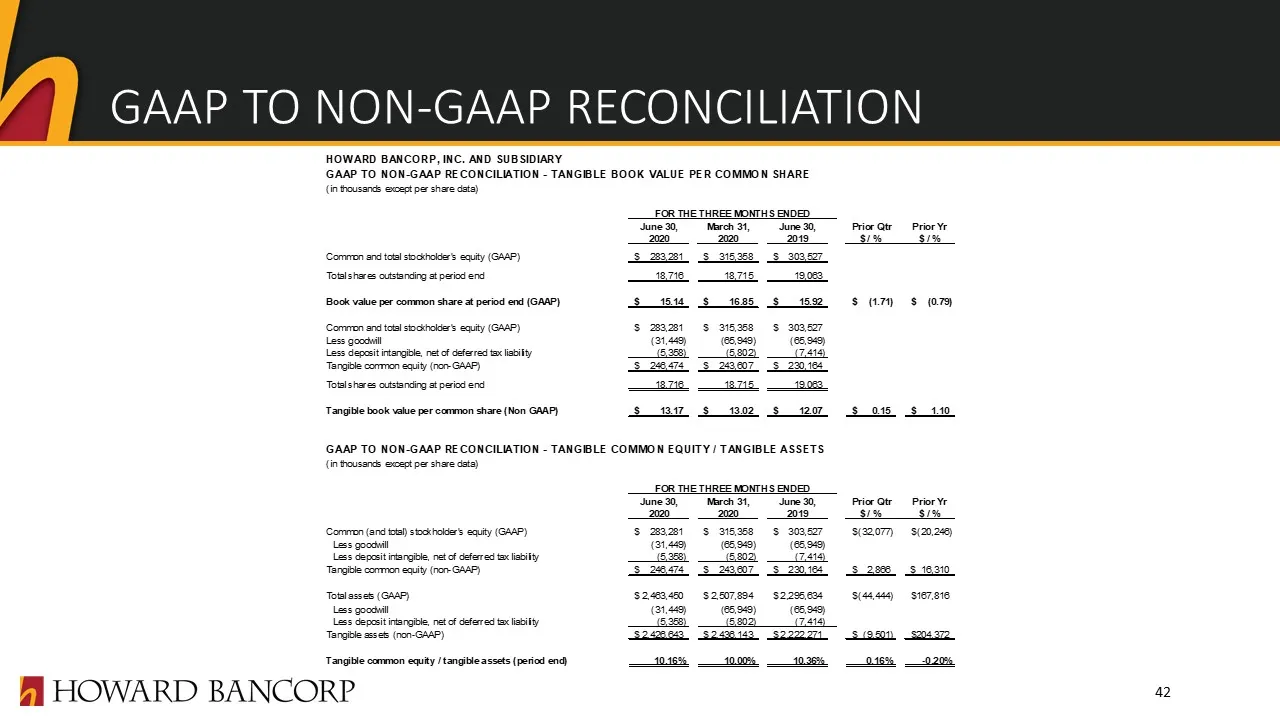
Slide 42: GAAP to Non-GAAP Reconciliation
GAAP TO NON-GAAP RECONCILIATION 42
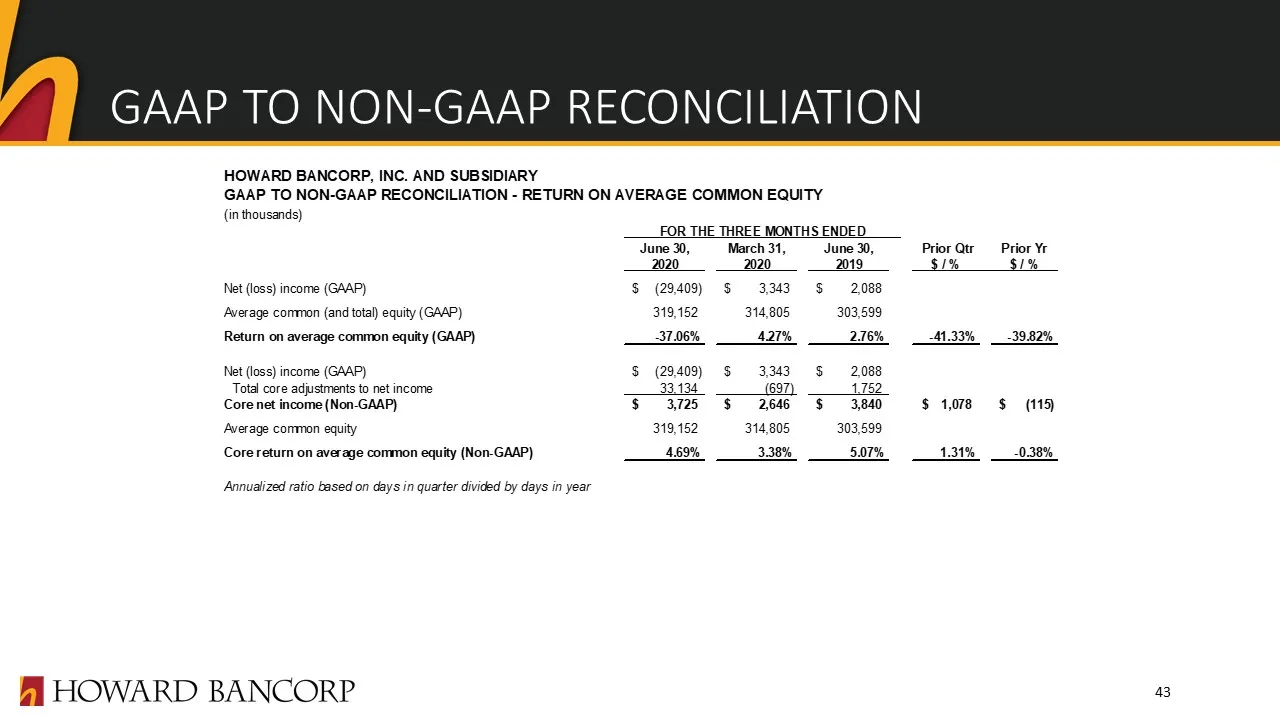
Slide 43: GAAP to Non-GAAP Reconciliation
GAAP TO NON-GAAP RECONCILIATION 43
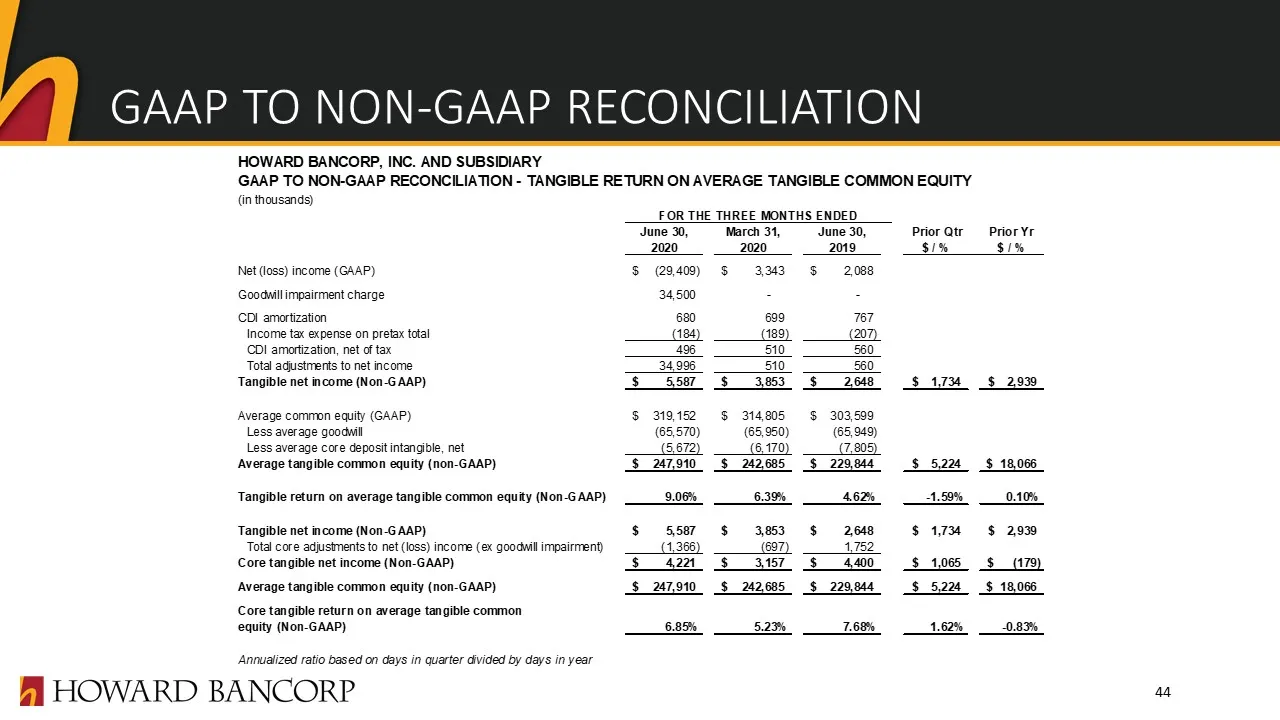
Slide 44: GAAP to Non-GAAP Reconciliation
GAAP TO NON-GAAP RECONCILIATION 44
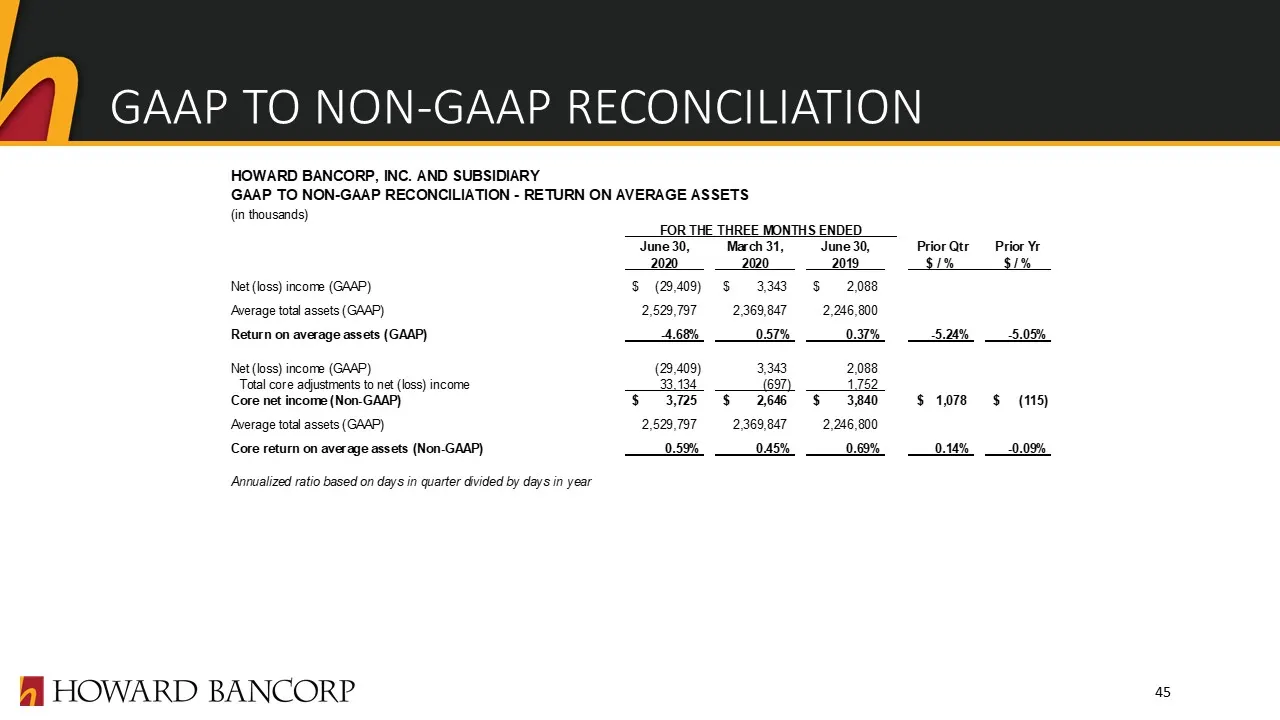
Slide 45: GAAP to Non-GAAP Reconciliation
GAAP TO NON-GAAP RECONCILIATION 45
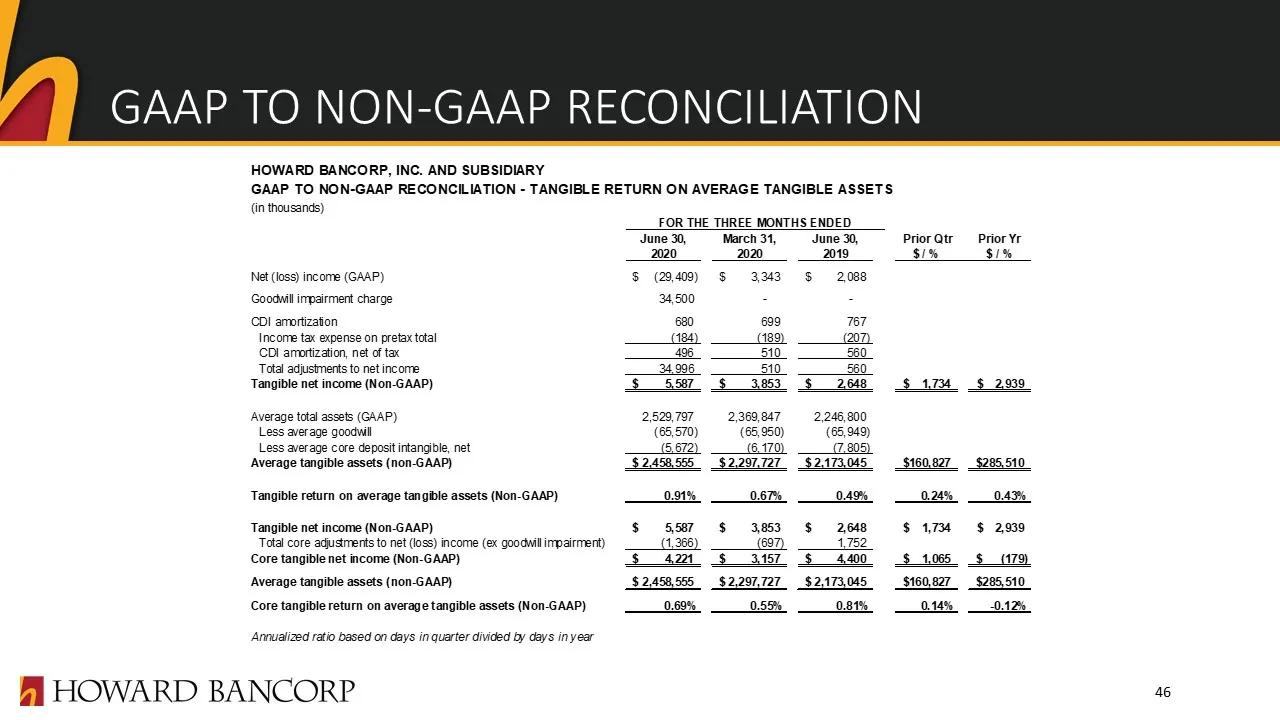
Slide 46: GAAP to Non-GAAP Reconciliation
GAAP TO NON-GAAP RECONCILIATION 46
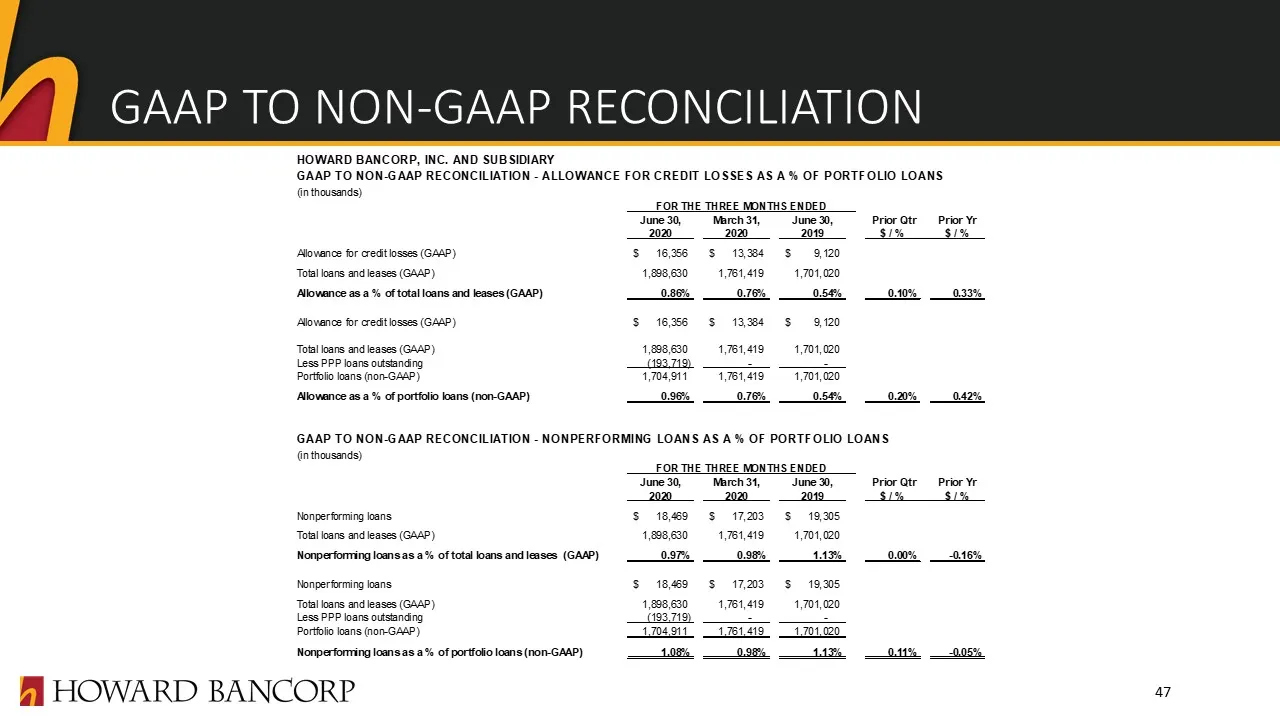
Slide 47: GAAP to Non-GAAP Reconciliation
GAAP TO NON-GAAP RECONCILIATION 47
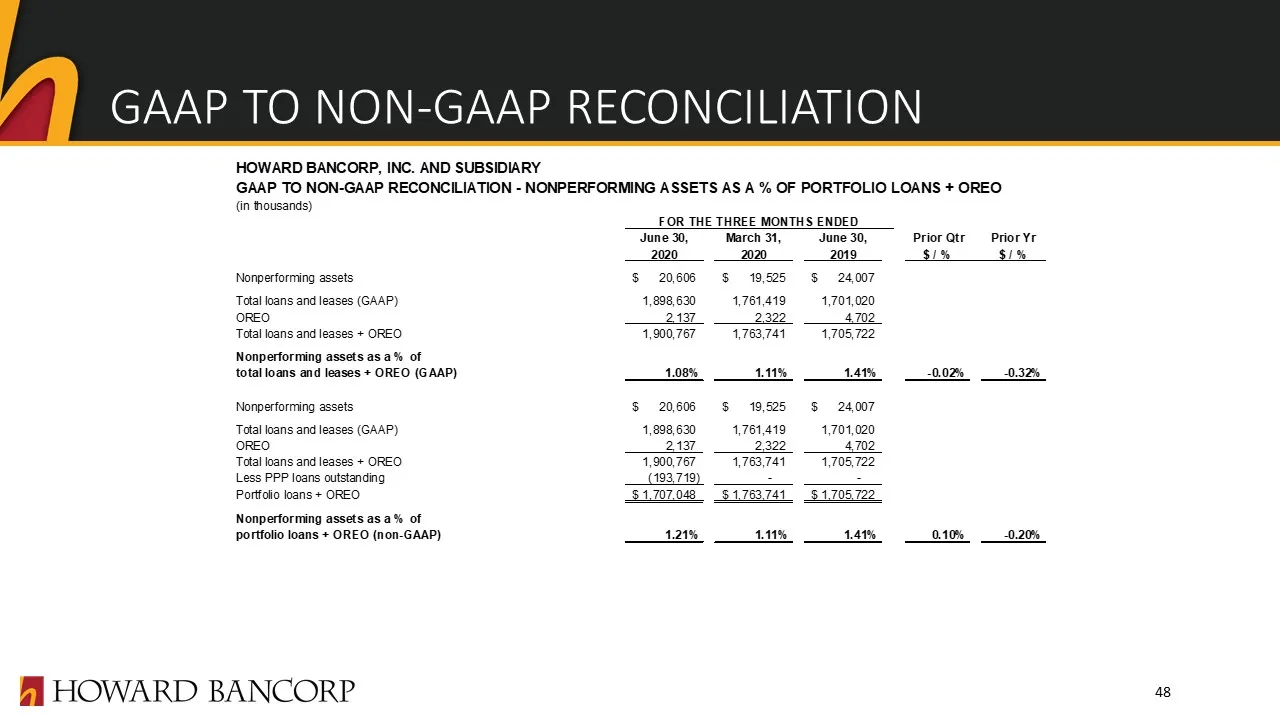
Slide 48: GAAP to Non-GAAP Reconciliation
GAAP TO NON-GAAP RECONCILIATION 48
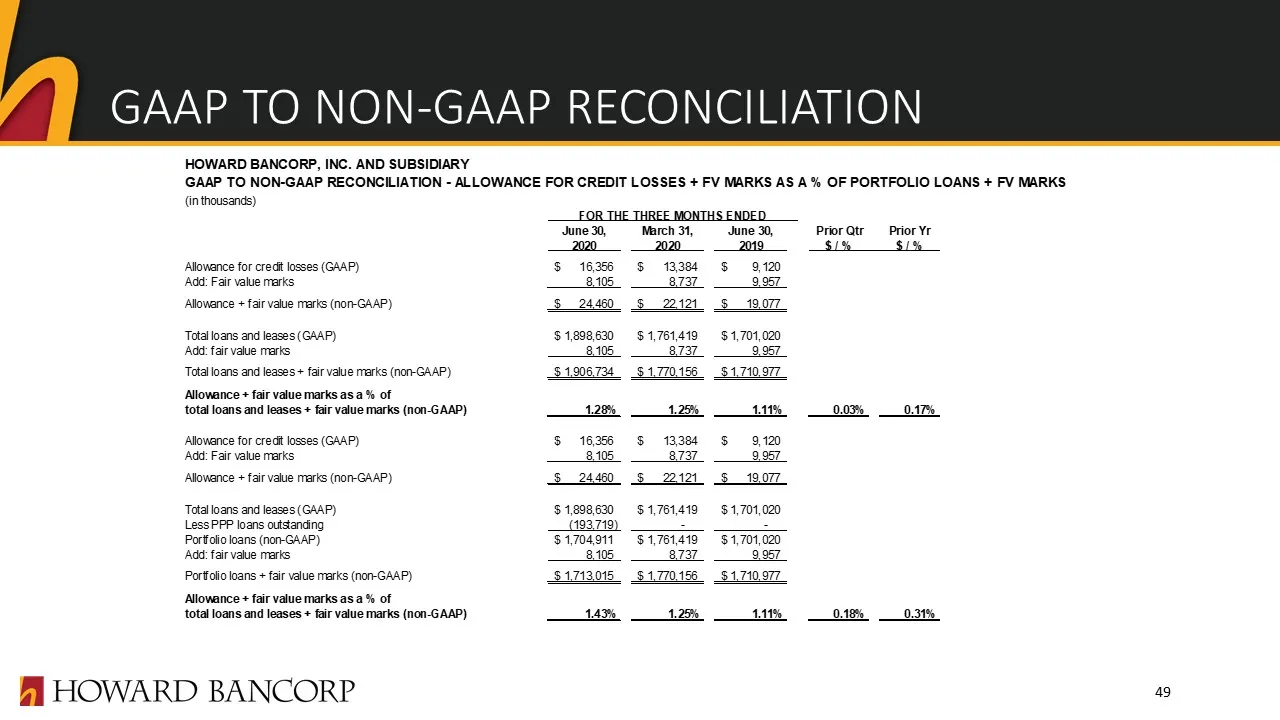
Slide 49: GAAP to Non-GAAP Reconciliation
GAAP TO NON-GAAP RECONCILIATION 49
Source: SEC EDGAR · 8-K filed Sep 9, 2020
More decks from Howard Bancorp Inc
 Merger or Acquisition (July 2021)9 slides · Jul 13, 2021
 Merger or Acquisition (July 2021)11 slides · Jul 13, 2021
 Merger or Acquisition (July 2021)10 slides · Jul 13, 2021
 Q1 2021 Earnings Presentation41 slides · Apr 21, 2021
 Q4 2020 Earnings Presentation46 slides · Jan 27, 2021
 Q3 2020 Earnings Presentation44 slides · Oct 28, 2020