Silver Bay Realty Trust — Q4 2013 Earnings Presentation
15 slides from Silver Bay Realty Trust's earnings presentation, Mar 5, 2014

Slide 1: Fourth Quarter 2013 Earnings Presentation
SILVER BAY REALTY TRUST CORP. F o u r t h Q u a r t e r 2 0 1 3 E a r n i n g s P r e s e n t a t i o n
Slide 2: Safe Harbor Statement / Forward-Looking Statements
2 S A F E H A R B O R S T A T E M E N T F O R W A R D - L O O K I N G S T A T E M E N T S This presentation includes “forward-looking statements” within the meaning of the safe harbor provisions of the United States Private Securities Litigation Reform Act of 1995. Actual results may differ from exp
Slide 3: Fourth Quarter and Full-Year 2013 Highlights
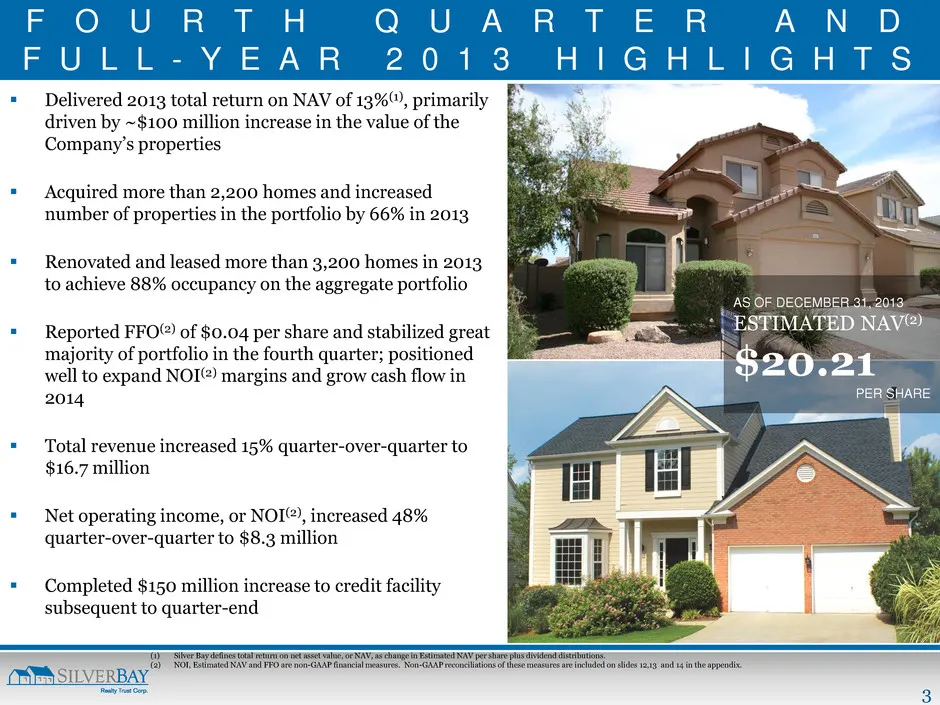
3 F O U R T H Q U A R T E R A N D F U L L - Y E A R 2 0 1 3 H I G H L I G H T S Delivered 2013 total return on NAV of 13%(1), primarily driven by ~$100 million increase in the value of the Company’s properties Acquired more than 2,200 homes and increased number of properties in the portfolio by
Slide 4: Portfolio Overview
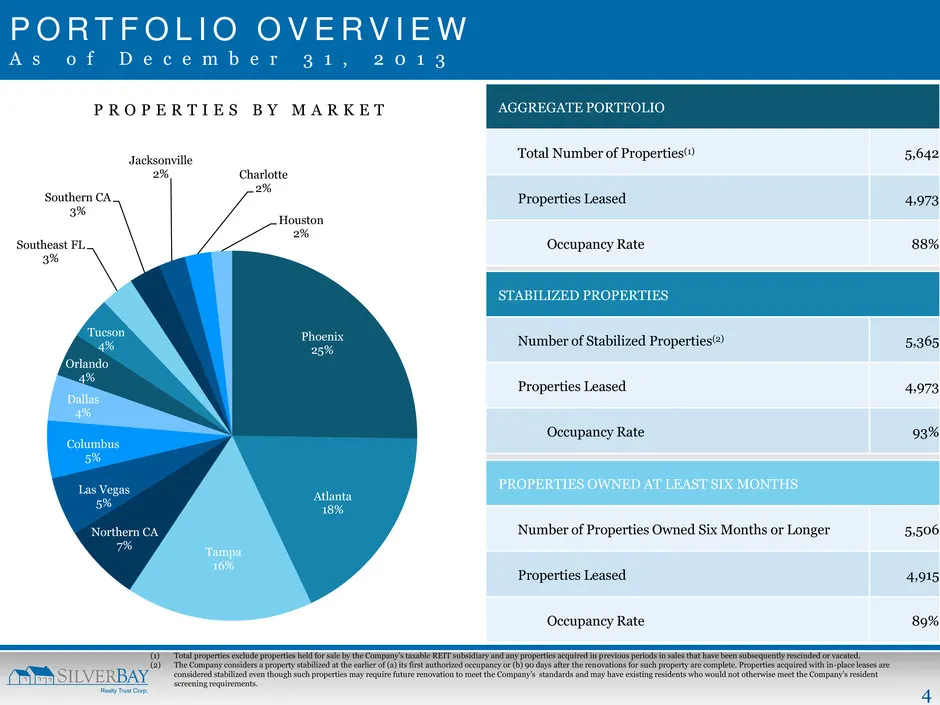
4 P O R T F O L I O O V E R V I E W A s o f D e c e m b e r 3 1 , 2 0 1 3 AGGREGATE PORTFOLIO Total Number of Properties(1) 5,642 Properties Leased 4,973 Occupancy Rate 88% STABILIZED PROPERTIES Number of Stabilized Properties(2) 5,365 Properties Leased 4,973 Occupancy Rate 93% PROPERTIES OWNED AT L
Slide 5: Current Housing Market Environment
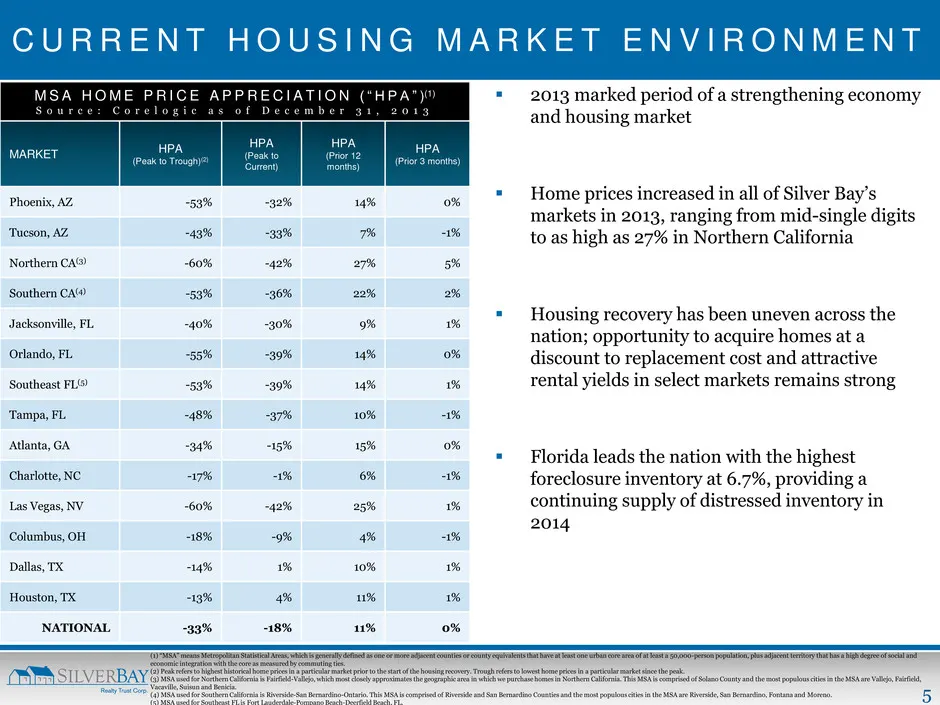
5 C U R R E N T H O U S I N G M A R K E T E N V I R O N M E N T 2013 marked period of a strengthening economy and housing market Home prices increased in all of Silver Bay’s markets in 2013, ranging from mid-single digits to as high as 27% in Northern California Housing recovery has been uneve
Slide 6: Expansion in Renovation and Leasing Drove Increases in Aggregate Occupancy
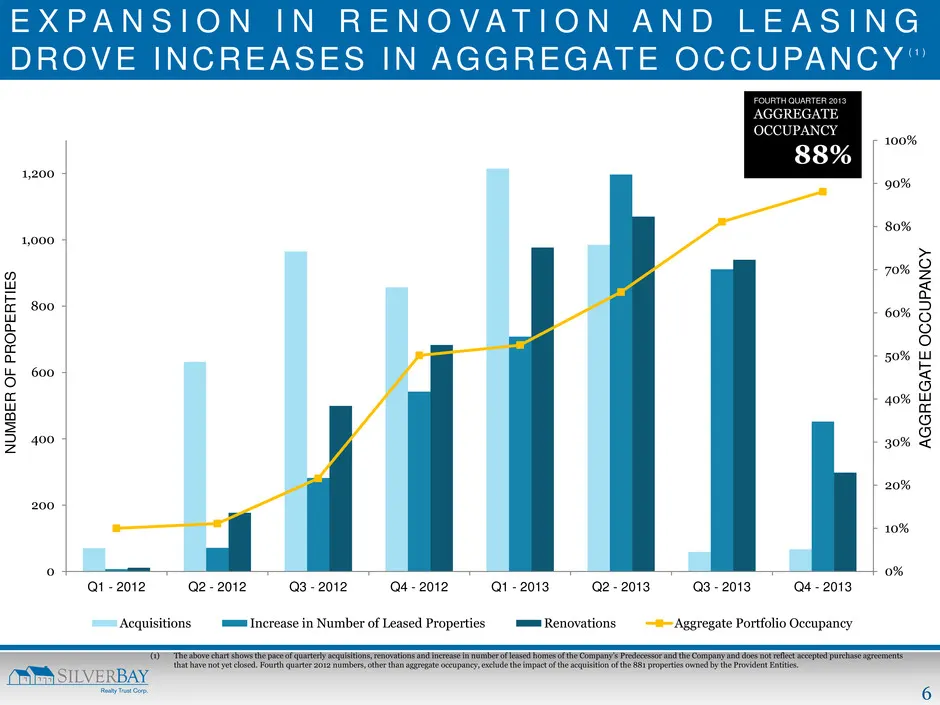
6 0% 10% 20% 30% 40% 50% 60% 70% 80% 90% 100% 0 200 400 600 800 1,000 1,200 Q1 - 2012 Q2 - 2012 Q3 - 2012 Q4 - 2012 Q1 - 2013 Q2 - 2013 Q3 - 2013 Q4 - 2013 AG G RE G AT E OCC UP AN CY NU M BE R O F PR O PE RT IE S Acquisitions Increase in Number of Leased Properties Renovations Aggregate Portfolio O
Slide 7: Operational Update
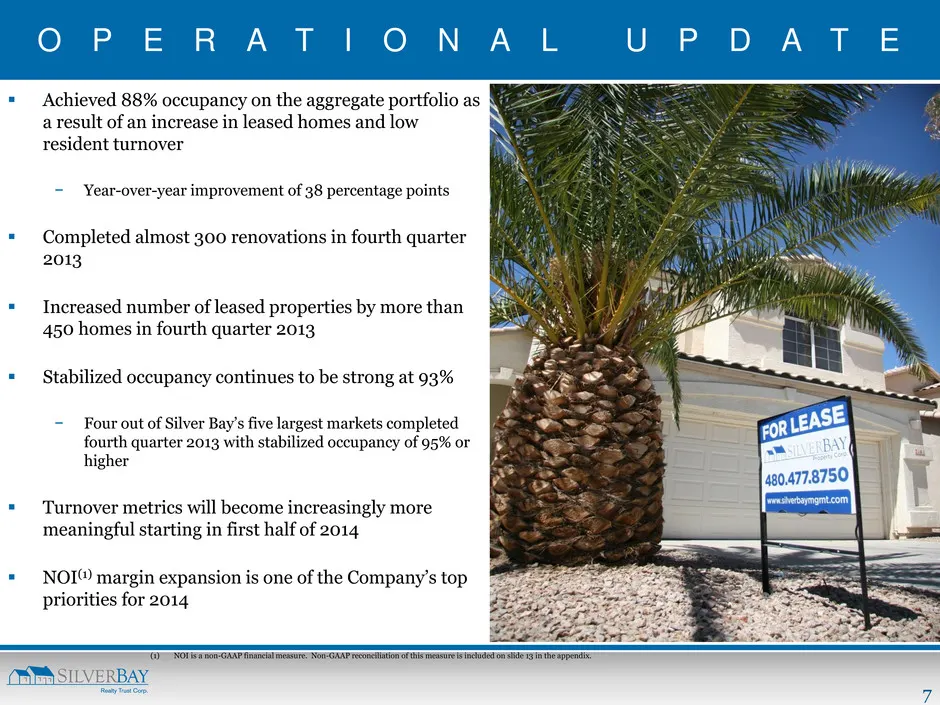
7 O P E R A T I O N A L U P D A T E Achieved 88% occupancy on the aggregate portfolio as a result of an increase in leased homes and low resident turnover − Year-over-year improvement of 38 percentage points Completed almost 300 renovations in fourth quarter 2013 Increased number of leased pro
Slide 8: Q4-2013 Financial Summary
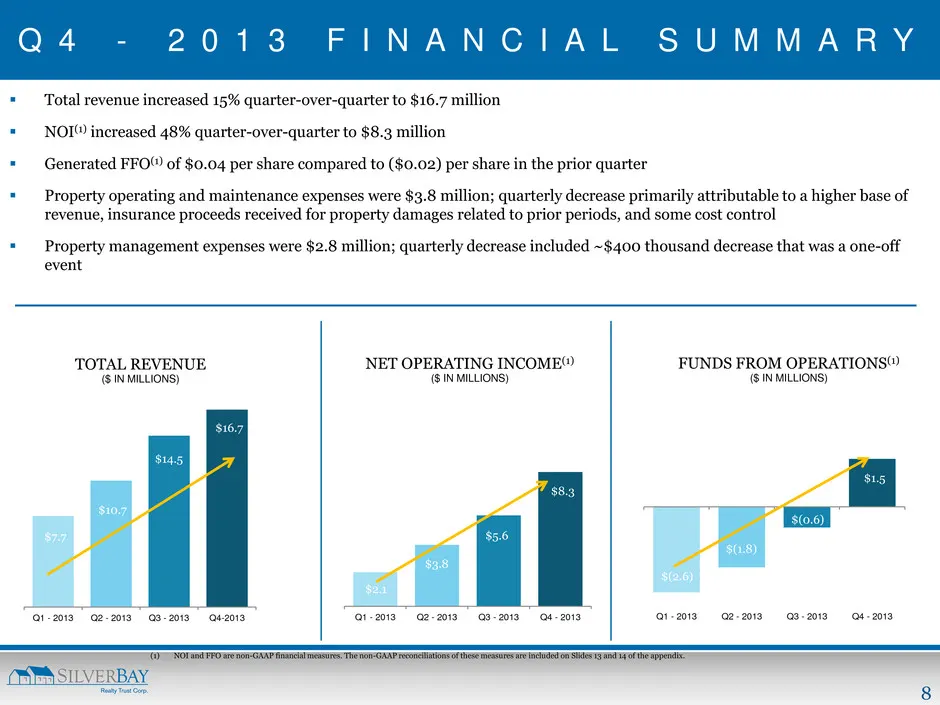
8 $7.7 $10.7 $14.5 $16.7 Q1 - 2013 Q2 - 2013 Q3 - 2013 Q4-2013 TOTAL REVENUE ($ IN MILLIONS) Q 4 - 2 0 1 3 F I N A N C I A L S U M M A R Y Total revenue increased 15% quarter-over-quarter to $16.7 million NOI(1) increased 48% quarter-over-quarter to $8.3 million Generated FFO(1) of $0.04 per s
Slide 9: Appendix
9 A P P E N D I X
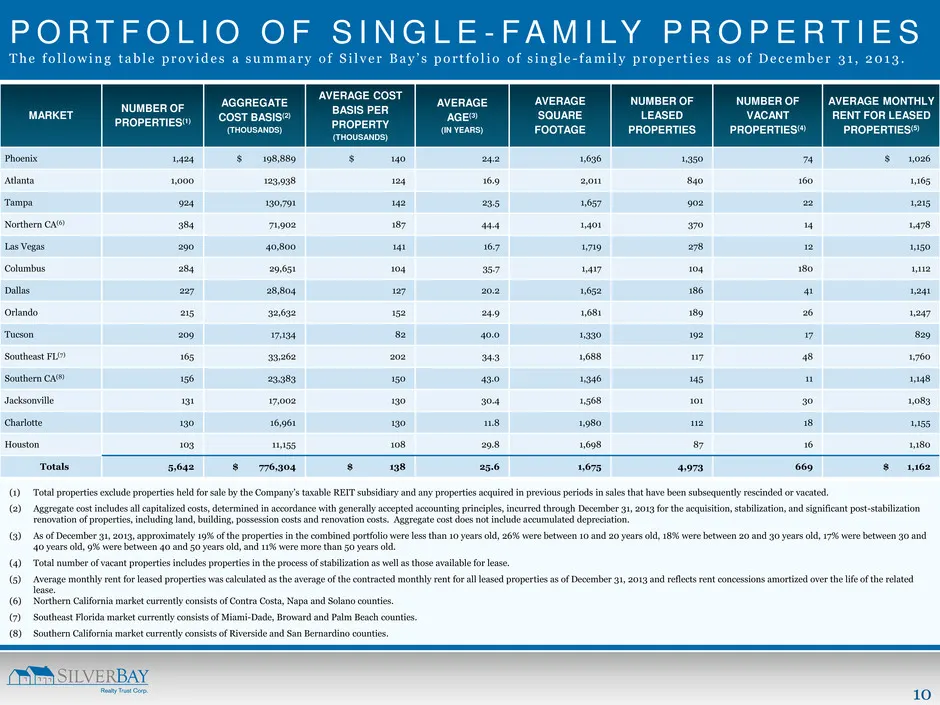
Slide 10: Portfolio of Single-Family Properties
10 P O R T F O L I O O F S I N G L E - F A M I LY P R O P E R T I E S T h e f o l l o w i n g t a b l e p r o v i d e s a s u m m a r y o f S i l v e r Bay ’ s po r t f o l i o o f s i n g l e - f a m i l y p r o p e r t i e s a s o f D e c e m b e r 3 1 , 2 0 1 3 . (1) Total properties exclude prop
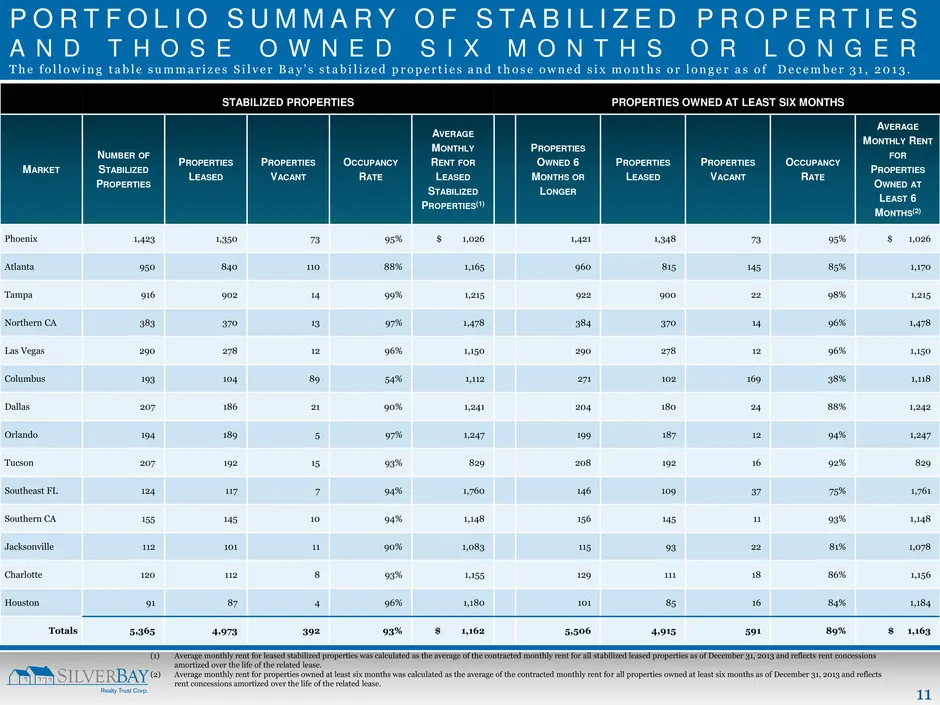
Slide 11: Stabilized Properties and Properties Owned at Least Six Months by Market
11 STABILIZED PROPERTIES PROPERTIES OWNED AT LEAST SIX MONTHS MARKET NUMBER OF STABILIZED PROPERTIES PROPERTIES LEASED PROPERTIES VACANT OCCUPANCY RATE AVERAGE MONTHLY RENT FOR LEASED STABILIZED PROPERTIES(1) PROPERTIES OWNED 6 MONTHS OR LONGER PROPERTIES LEASED PROPERTIES VACANT OCCUPANCY RATE AVER
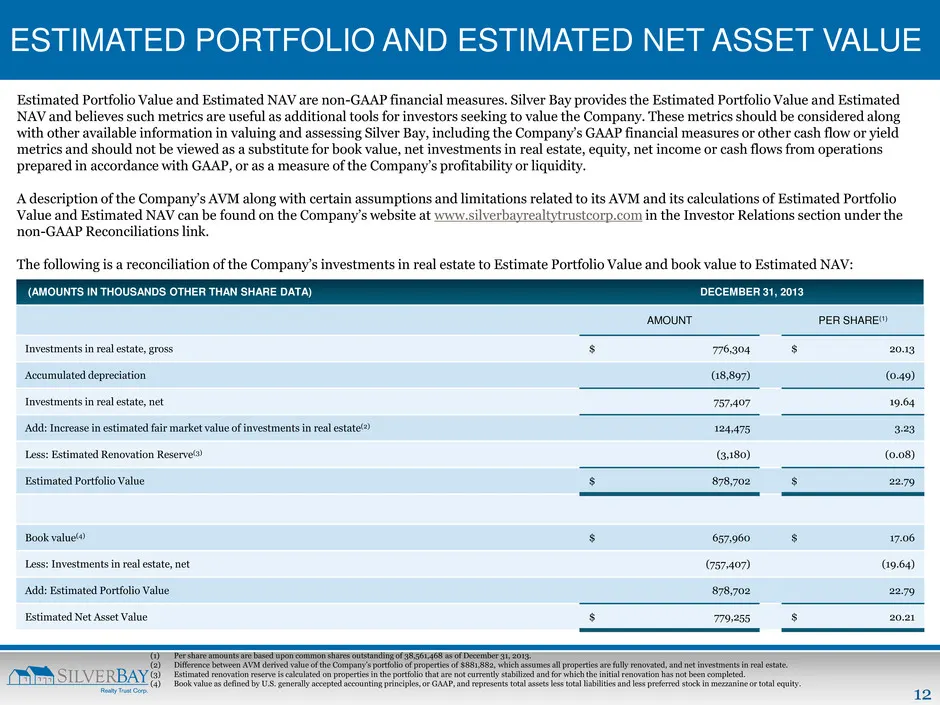
Slide 12: Estimated Portfolio and Estimated Net Asset Value
12 ESTIMATED PORTFOLIO AND ESTIMATED NET ASSET VALUE Estimated Portfolio Value and Estimated NAV are non-GAAP financial measures. Silver Bay provides the Estimated Portfolio Value and Estimated NAV and believes such metrics are useful as additional tools for investors seeking to value the Company. T
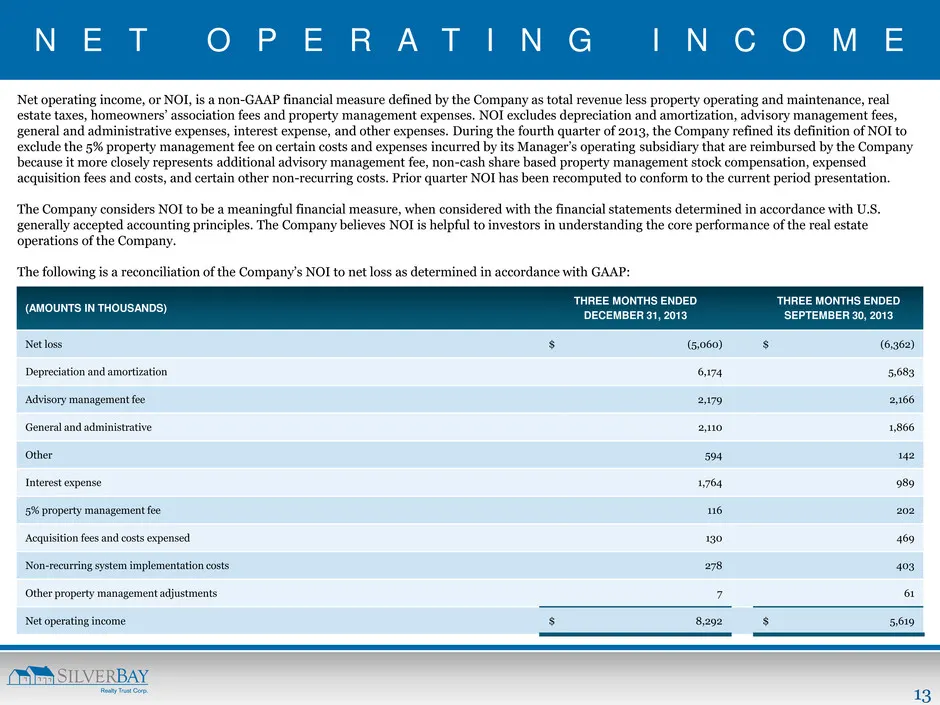
Slide 13: Net Operating Income
13 N E T O P E R A T I N G I N C O M E Net operating income, or NOI, is a non-GAAP financial measure defined by the Company as total revenue less property operating and maintenance, real estate taxes, homeowners’ association fees and property management expenses. NOI excludes depreciation and amorti
Slide 14: Funds From Operations
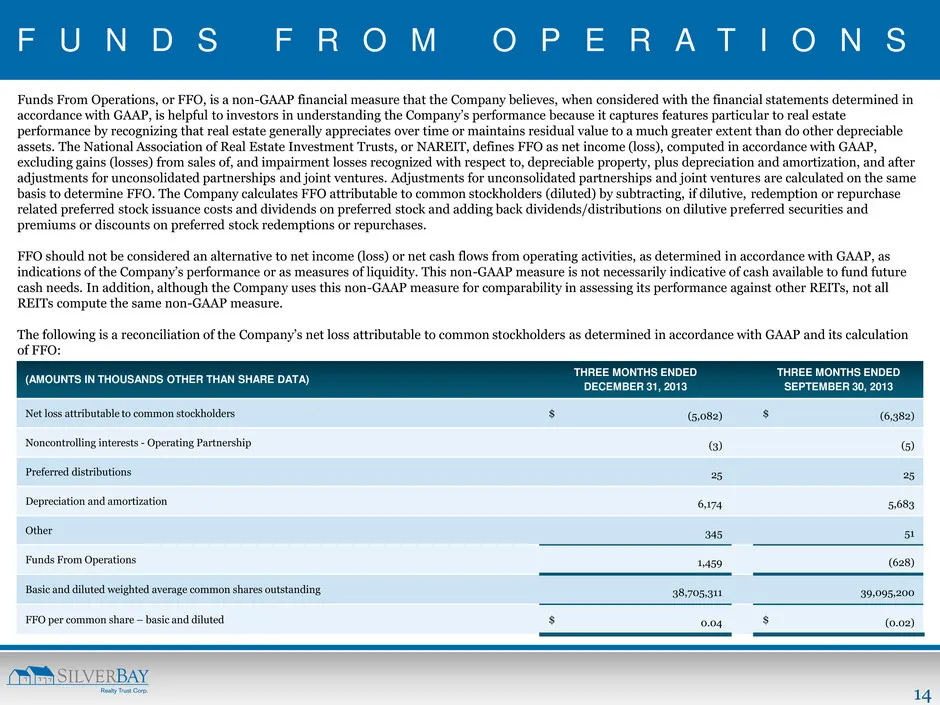
14 F U N D S F R O M O P E R A T I O N S Funds From Operations, or FFO, is a non-GAAP financial measure that the Company believes, when considered with the financial statements determined in accordance with GAAP, is helpful to investors in understanding the Company’s performance because it captures
Slide 15: CARLSON PARKWAY | SUITE | MINNETONKA | MN | 55305 P: 952.358.4400 | E:
601 CARLSON PARKWAY | SUITE 250 | MINNETONKA | MN | 55305 P: 952.358.4400 | E: INVES TO RS@ SILVERBAYMGMT .C OM
Source: SEC EDGAR · 8-K filed Mar 5, 2014
More decks from Silver Bay Realty Trust Corp
 Merger or Acquisition (February 2017)12 slides · Feb 28, 2017
 Investor Presentation (September 2016)32 slides · Sep 22, 2016
 Q4 2015 Earnings Presentation13 slides · Feb 24, 2016
 Q3 2015 Earnings Presentation33 slides · Nov 24, 2015
 Q3 2015 Earnings Presentation10 slides · Nov 4, 2015
 Q2 2015 Earnings Presentation34 slides · Sep 8, 2015