Flutter Entertainment plc · NYSE:FLUT
Flutter Entertainment — Betfair Group — FY2011 Earnings Presentation
66 slides from Flutter Entertainment's earnings presentation, June 2011

Slide 1: Full Year Results
FULL YEAR RESULTS June 2011 ay betfair The World's Biggest Betting Com
Slide 2: Disclaimer
DISCLAIMER This presentation and its contents may not be reproduced, redistributed or passed on, directly or indirectly, to any other person or published, in whole or in part for any purpose without the consent of Betfair Group plc ("Betfair"). This presentation does not constitute or form part of a
Slide 3: Introduction
INTRODUCTION David Yu – Chief Executive Officer
Slide 4: Financial Highlights
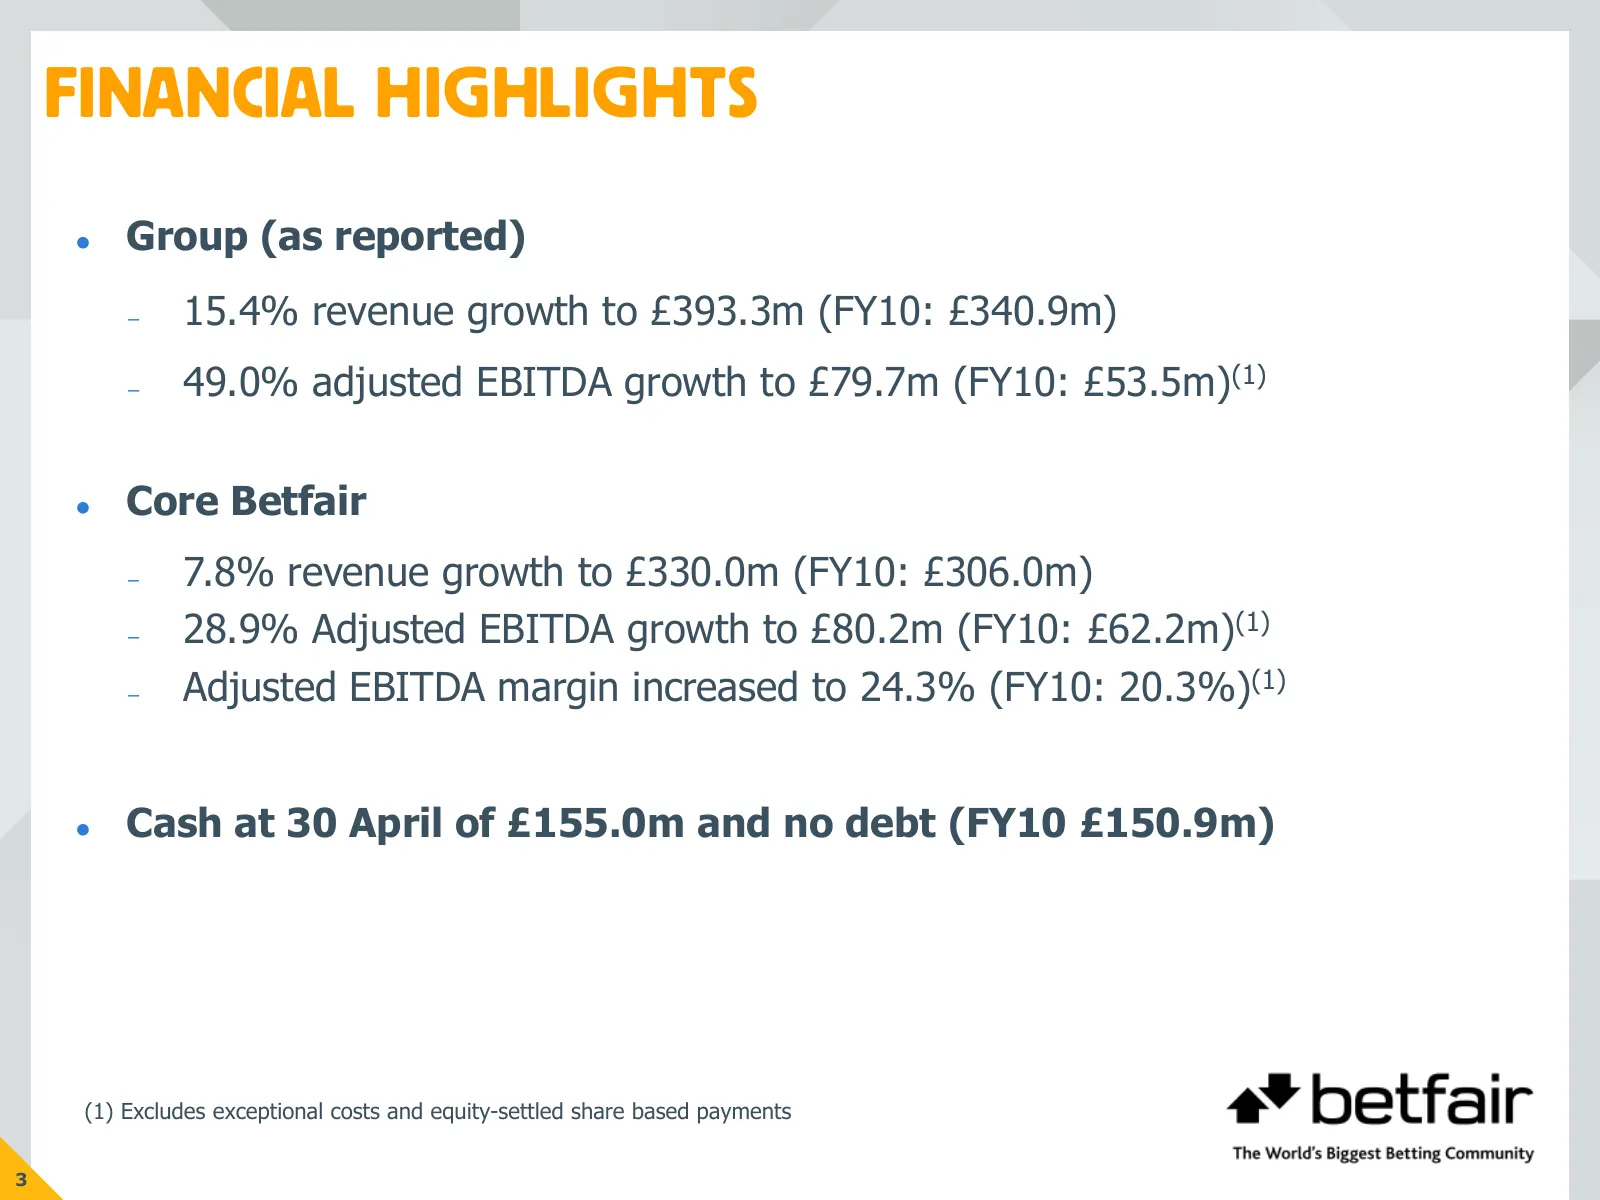
FINANCIAL HIGHLIGHTS Group (as reported) – 15.4% revenue growth to £393.3m (FY10: £340.9m) – 49.0% adjusted EBITDA growth to £79.7m (FY10: £53.5m)(1) Core Betfair – 7.8% revenue growth to £330.0m (FY10: £306.0m) – 28.9% Adjusted EBITDA growth to £80.2m (FY10: £62.2m)(1) – Adjusted EBITDA margin
Slide 5: Operational Highlights
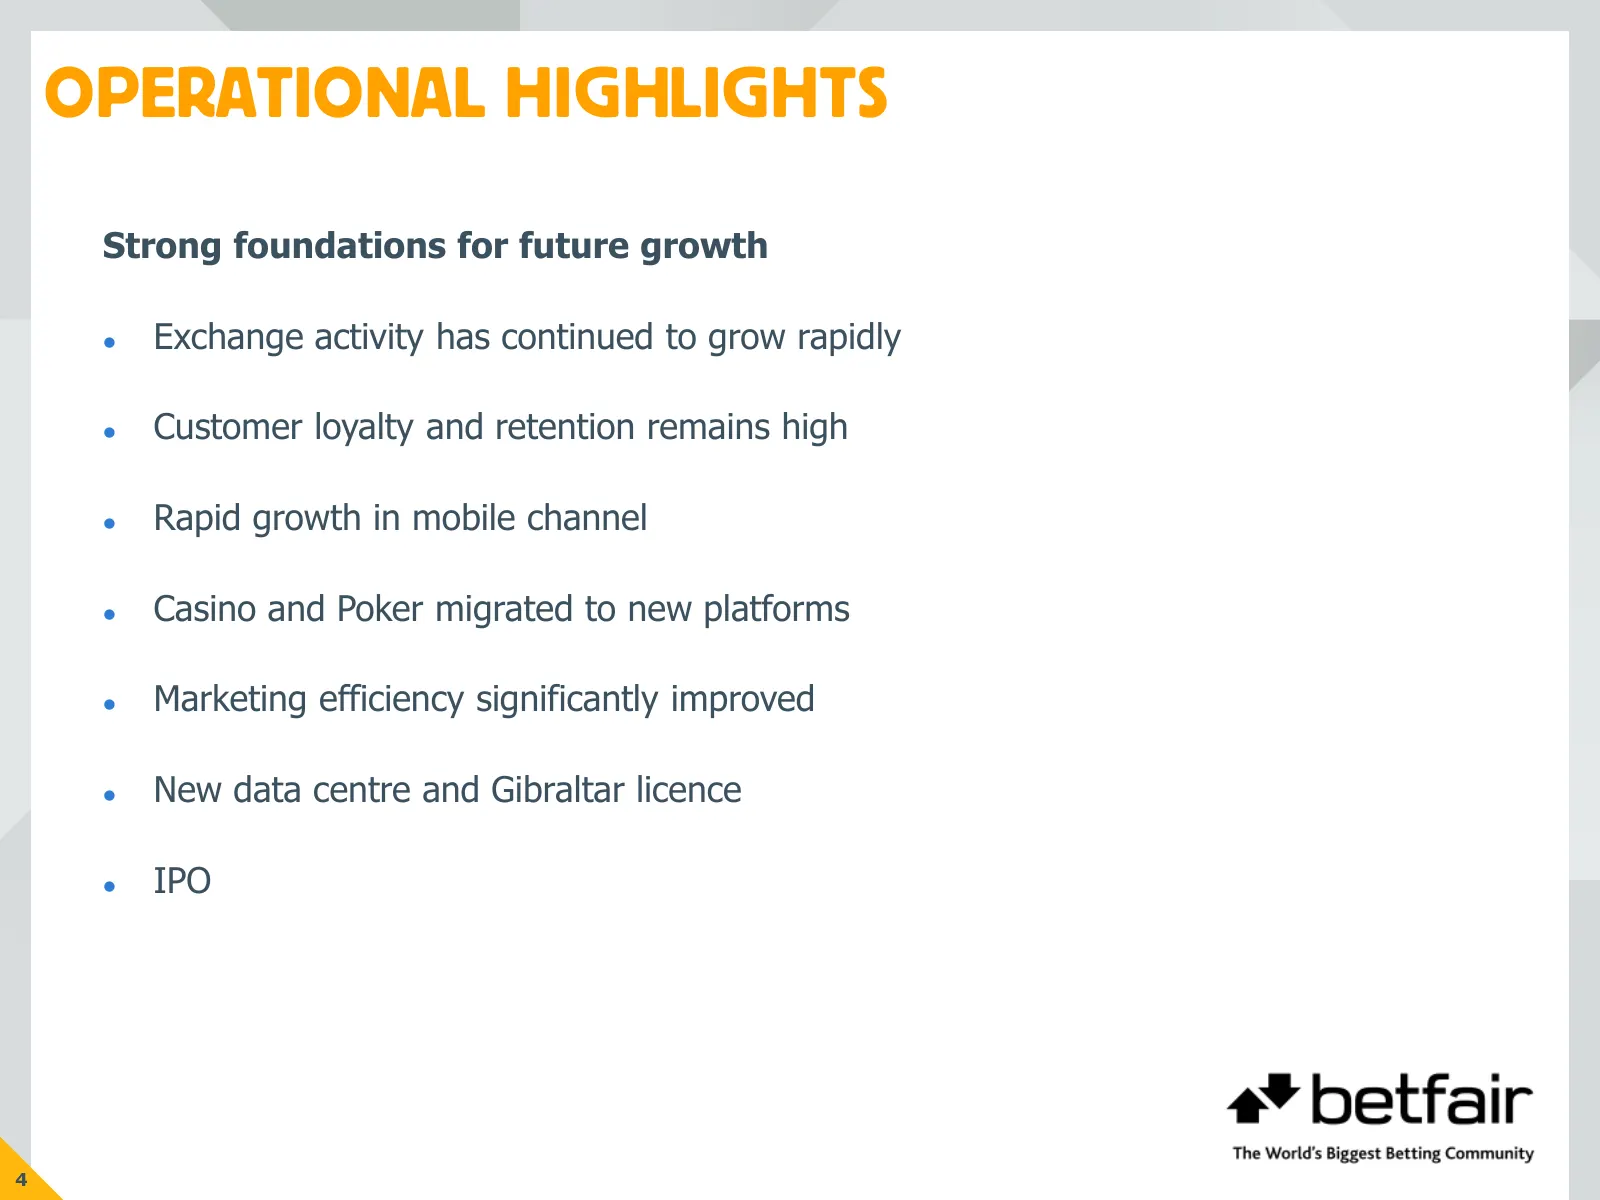
OPERATIONAL HIGHLIGHTS Strong foundations for future growth Exchange activity has continued to grow rapidly Customer loyalty and retention remains high Rapid growth in mobile channel Casino and Poker migrated to new platforms Marketing efficiency significantly improved New data centre an
Slide 6: FY11 Challenges
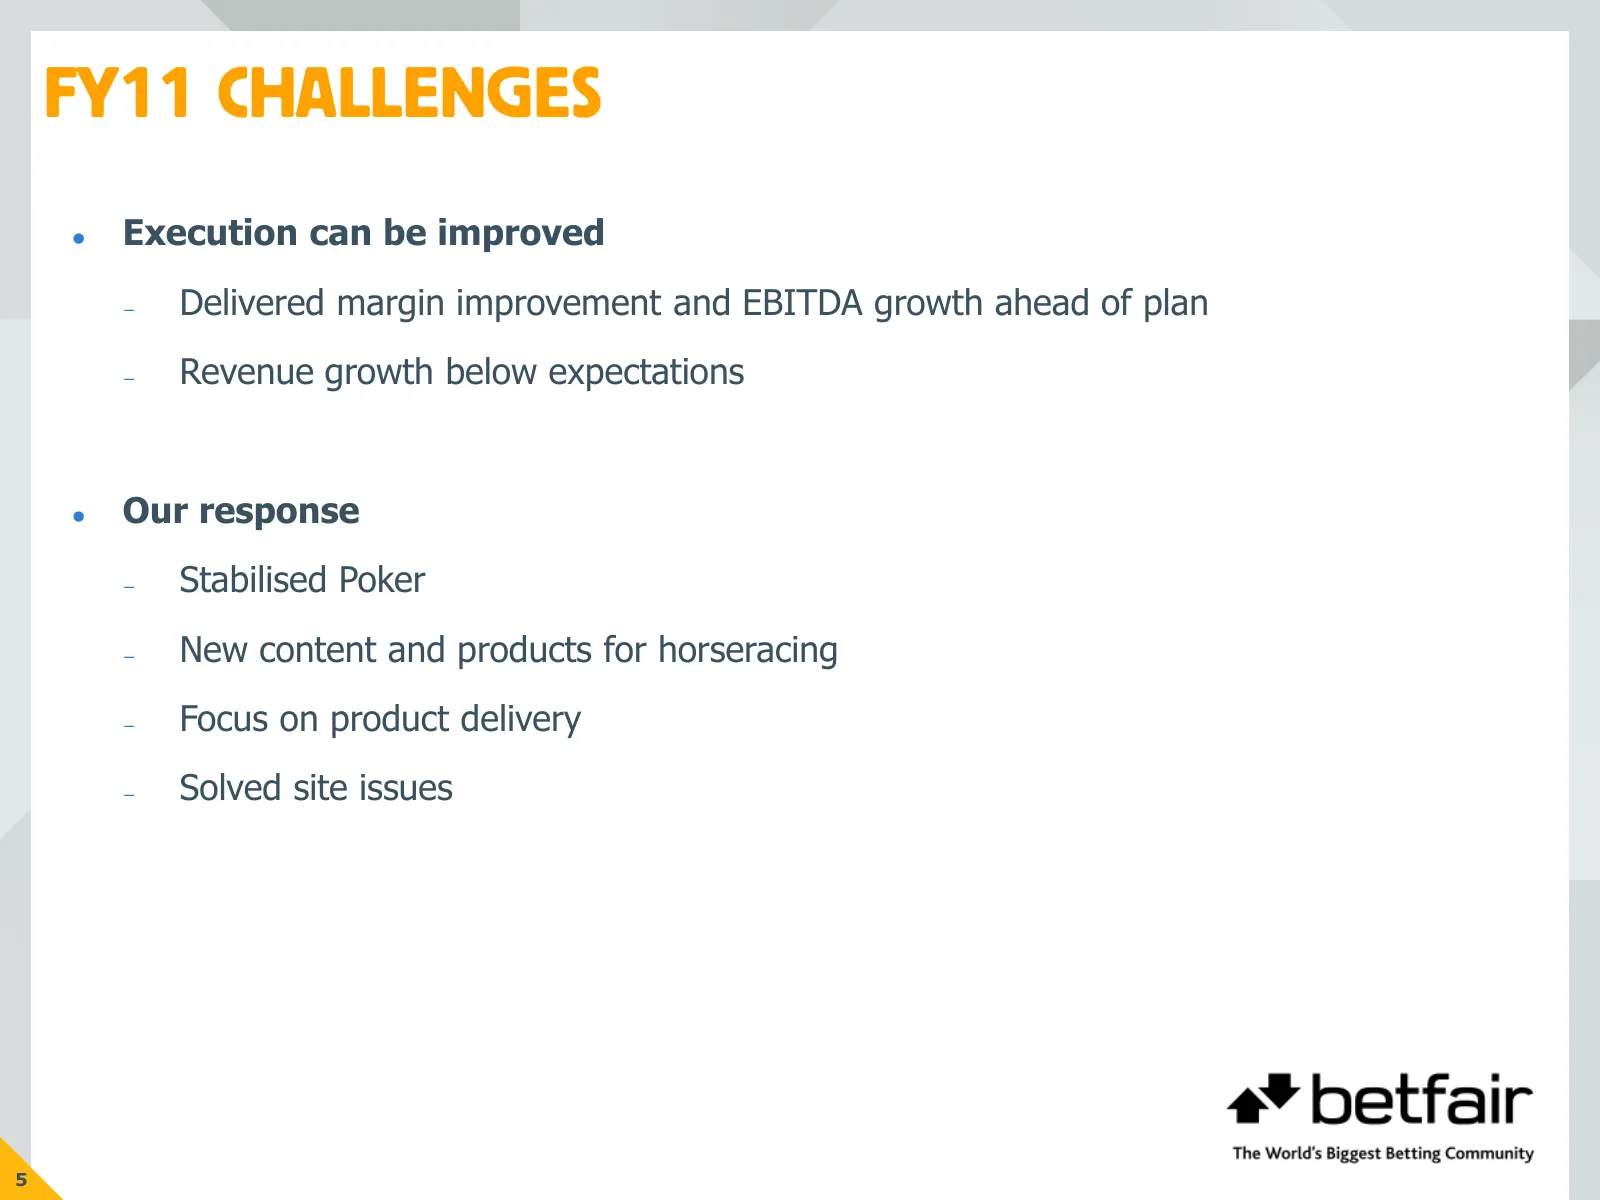
FY11 CHALLENGES Execution can be improved – Delivered margin improvement and EBITDA growth ahead of plan – Revenue growth below expectations Our response – Stabilised Poker – New content and products for horseracing – Focus on product delivery – Solved site issues 5
Slide 7: Plan to Deliver Shareholder Value
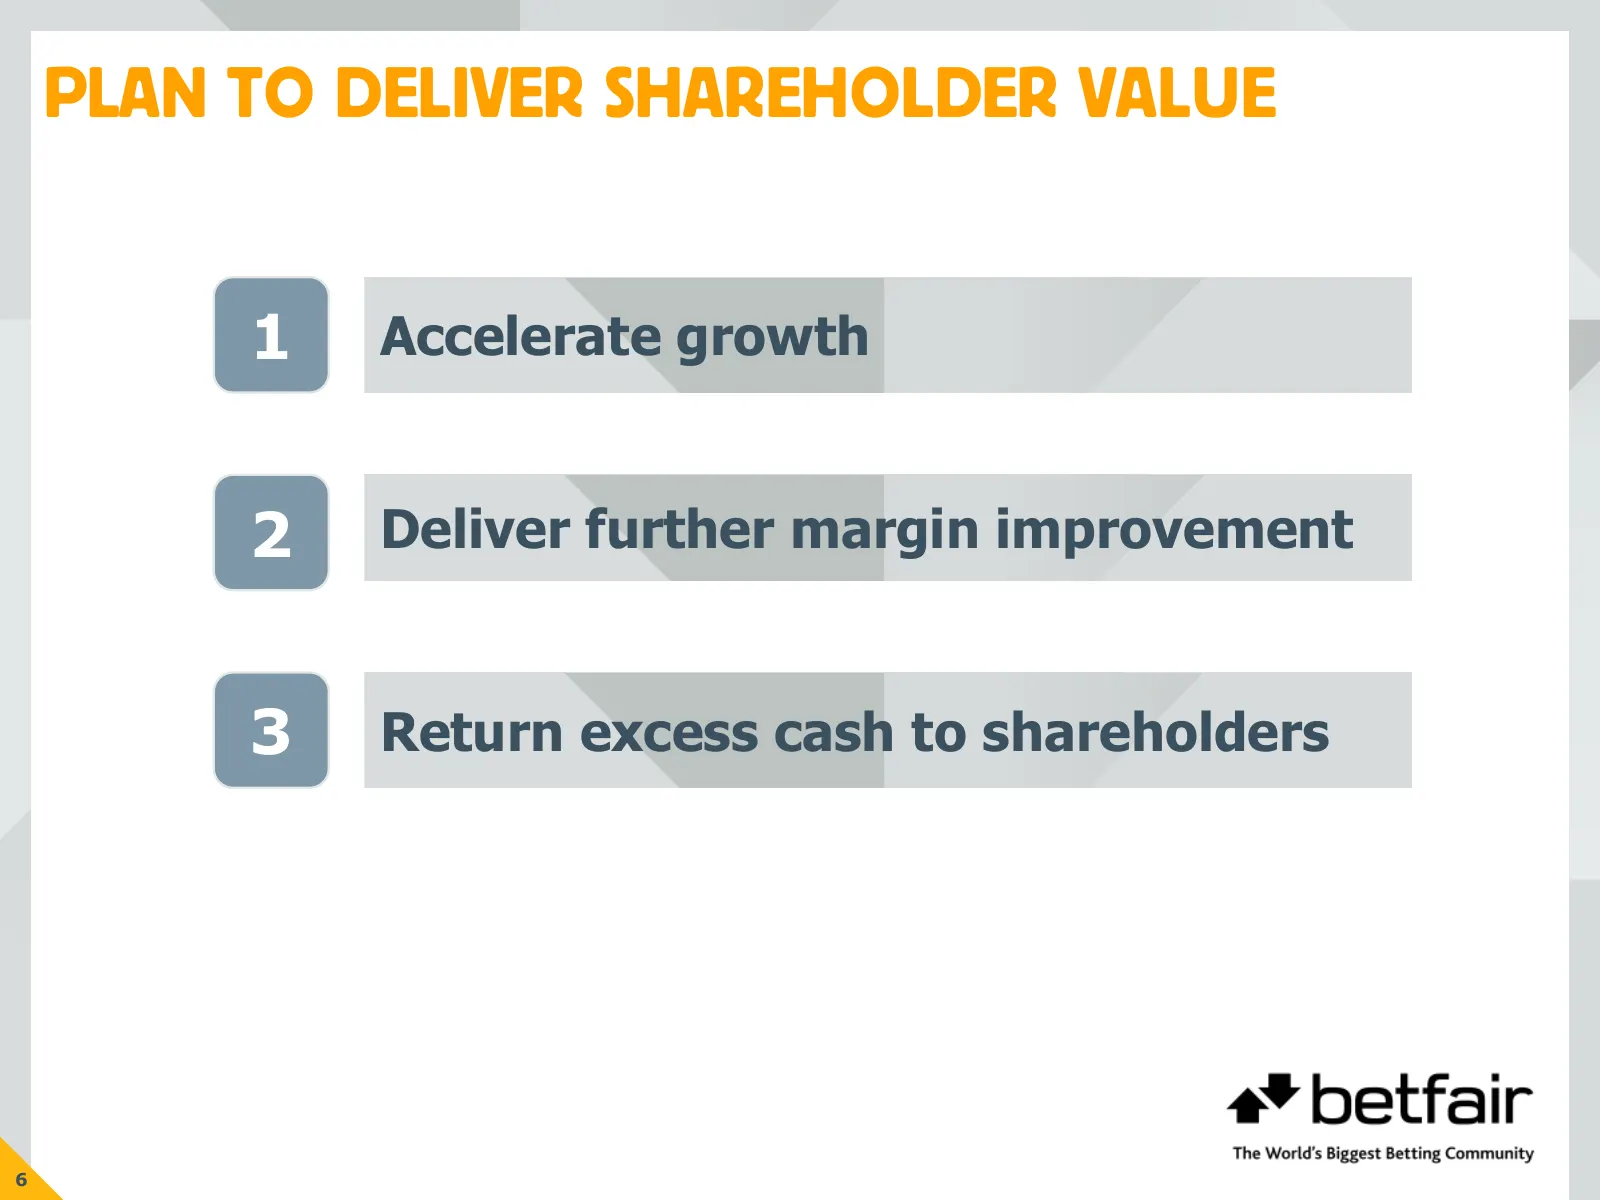
PLAN TO DELIVER SHAREHOLDER VALUE 1 Accelerate growth 2 Deliver further margin improvement 3 Return excess cash to shareholders 6
Slide 8: Financial Results
FINANCIAL RESULTS Stephen Morana – Chief Financial Officer
Slide 9: Group Income Statement: Underlying
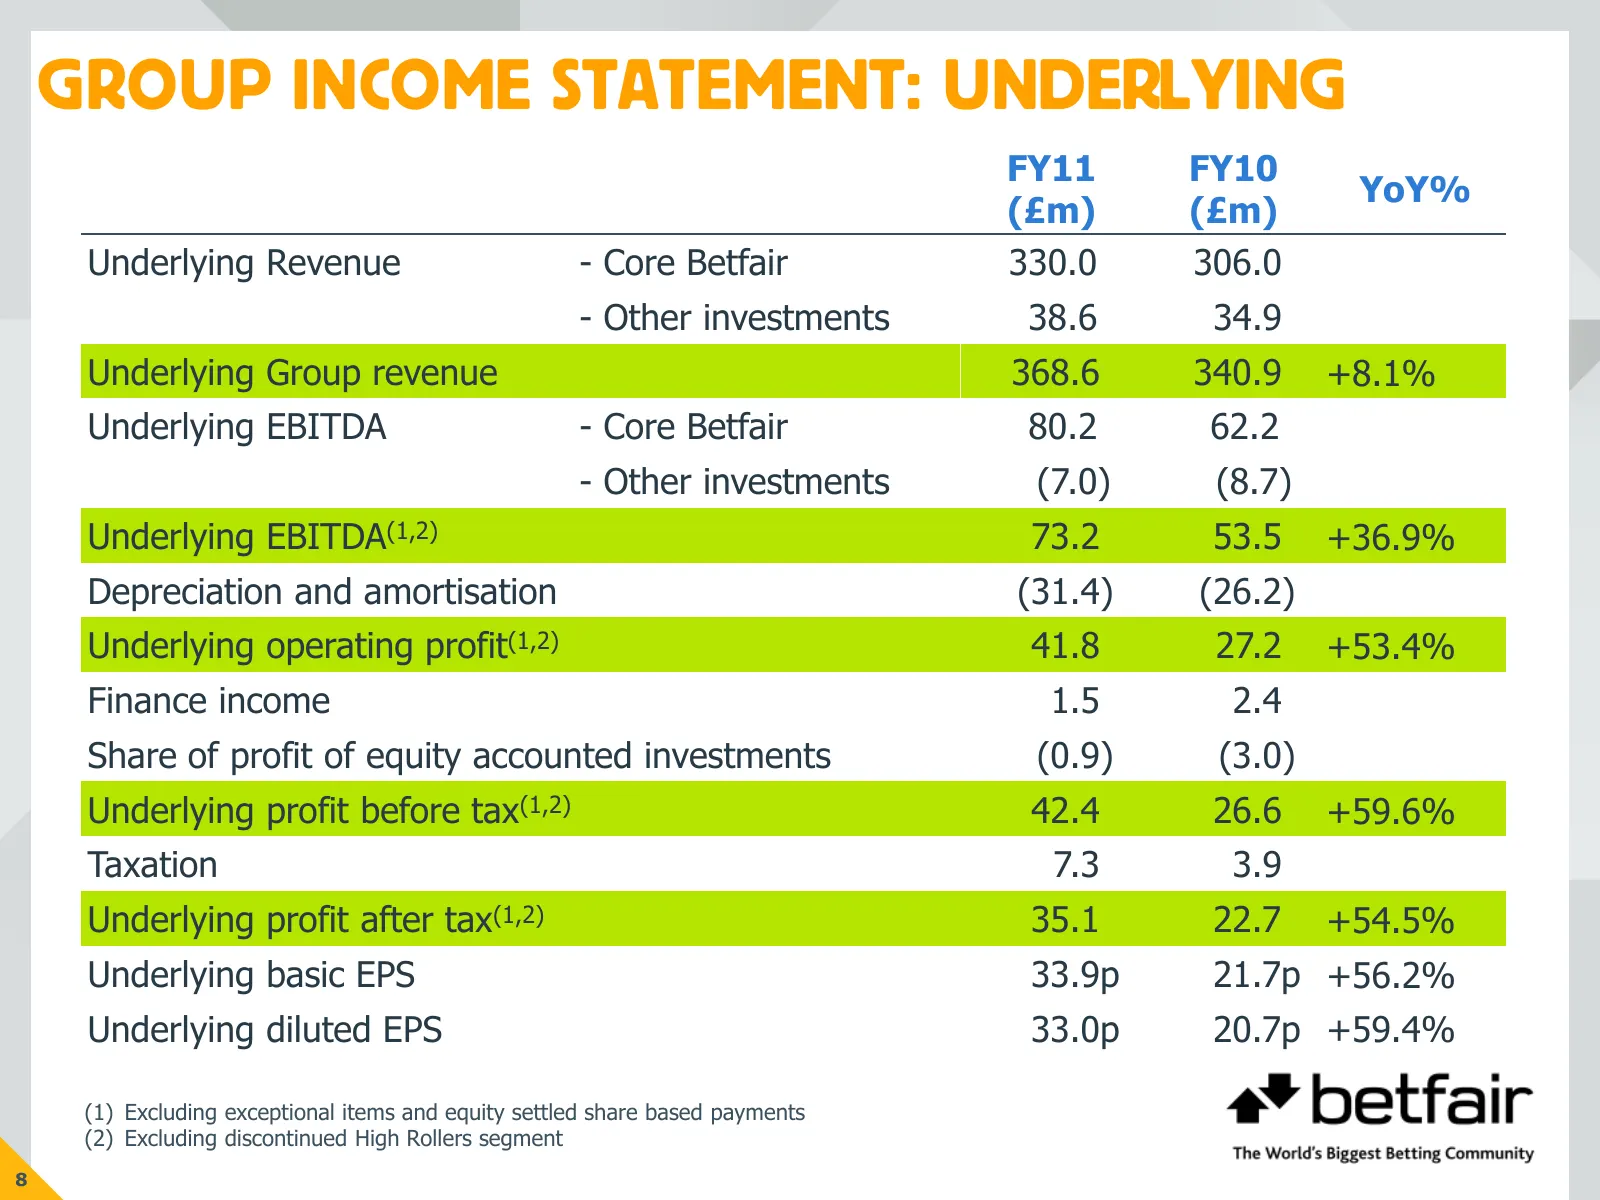
GROUP INCOME STATEMENT: UNDERLYING FY11 FY10 YoY% (£m) (£m) Underlying Revenue - Core Betfair 330.0 306.0 - Other investments 38.6 34.9 Underlying Group revenue 368.6 340.9 +8.1% Underlying EBITDA - Core Betfair 80.2 62.2 - Other investments (7.0) (8.7) Underlying EBITDA(1,2) 73.2 53.5 +36.9% Deprec
Slide 10: Core Betfair: Revenue Growth
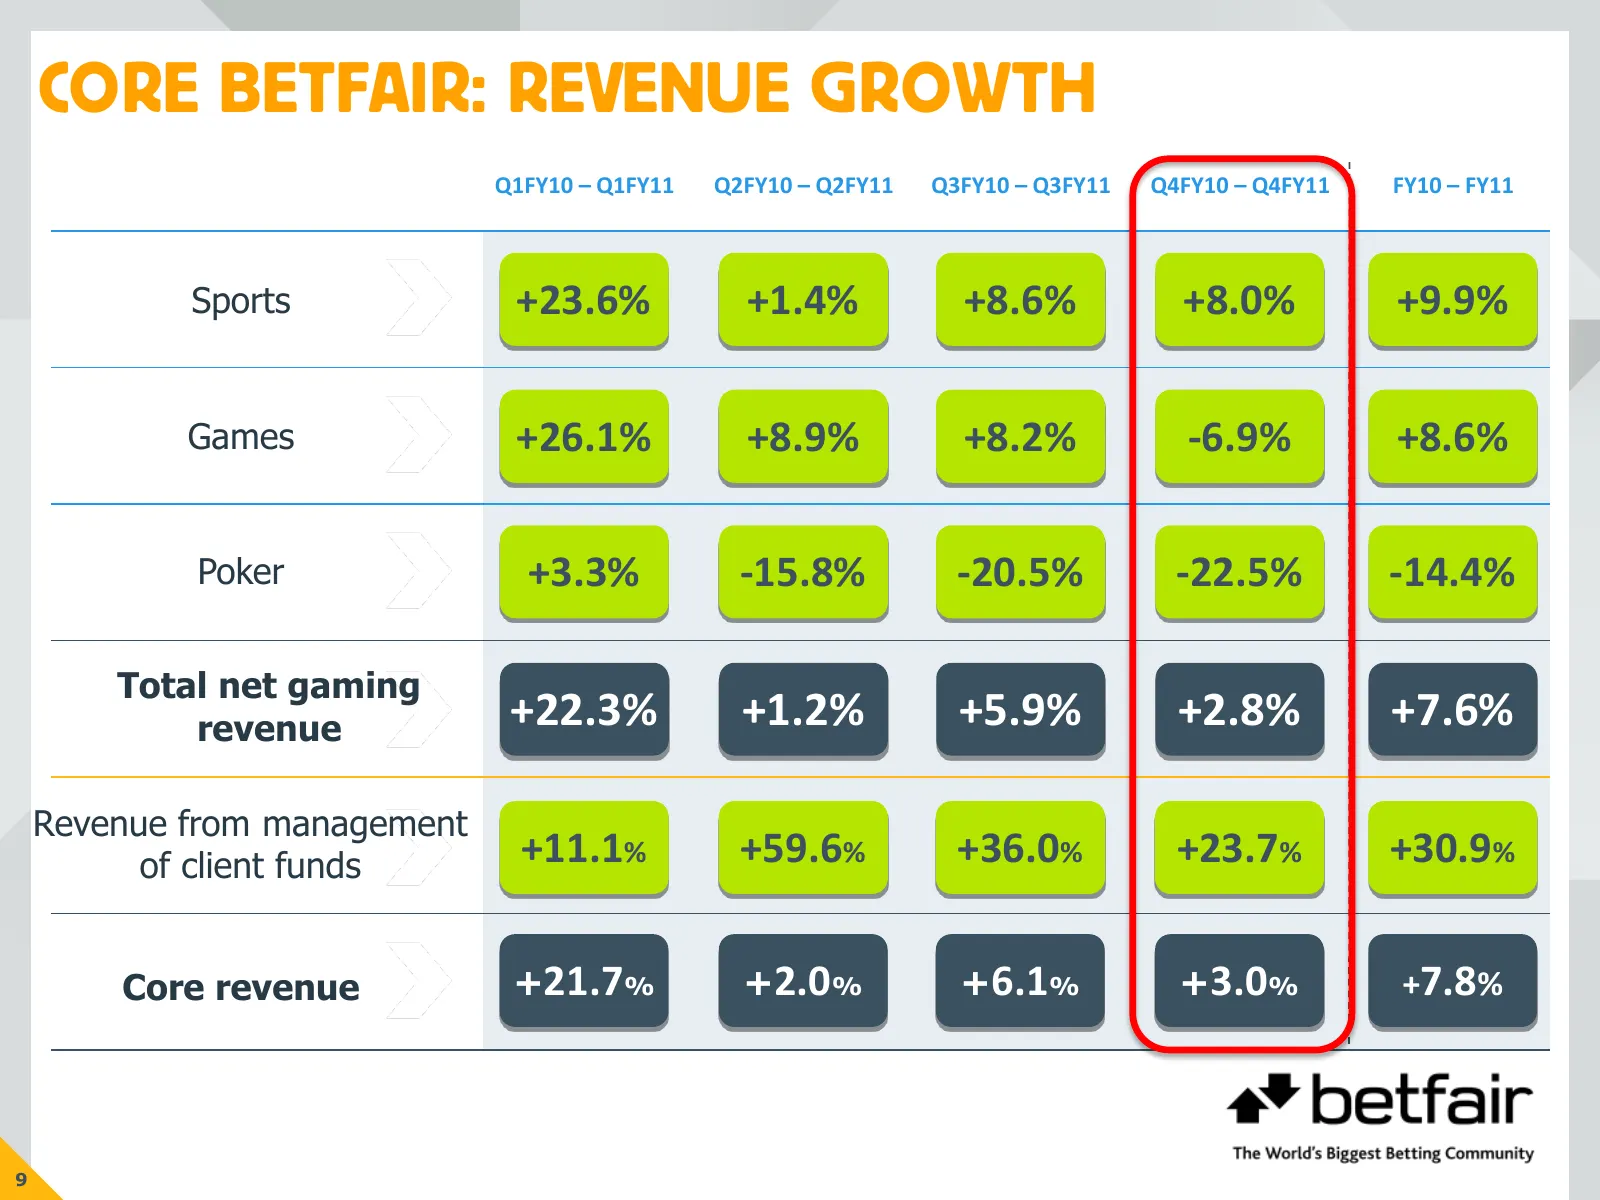
CORE BETFAIR: REVENUE GROWTH Q1FY10 – Q1FY11 Q2FY10 – Q2FY11 Q3FY10 – Q3FY11 Q4FY10 – Q4FY11 FY10 – FY11 Sports +23.6% +1.4% +8.6% +8.0% +9.9% Games +26.1% +8.9% +8.2% -6.9% +8.6% Poker +3.3% -15.8% -20.5% -22.5% -14.4% Total net gaming revenue +22.3% +1.2% +5.9% +2.8% +7.6% Revenue from management
Slide 11: Core Betfair: Sports
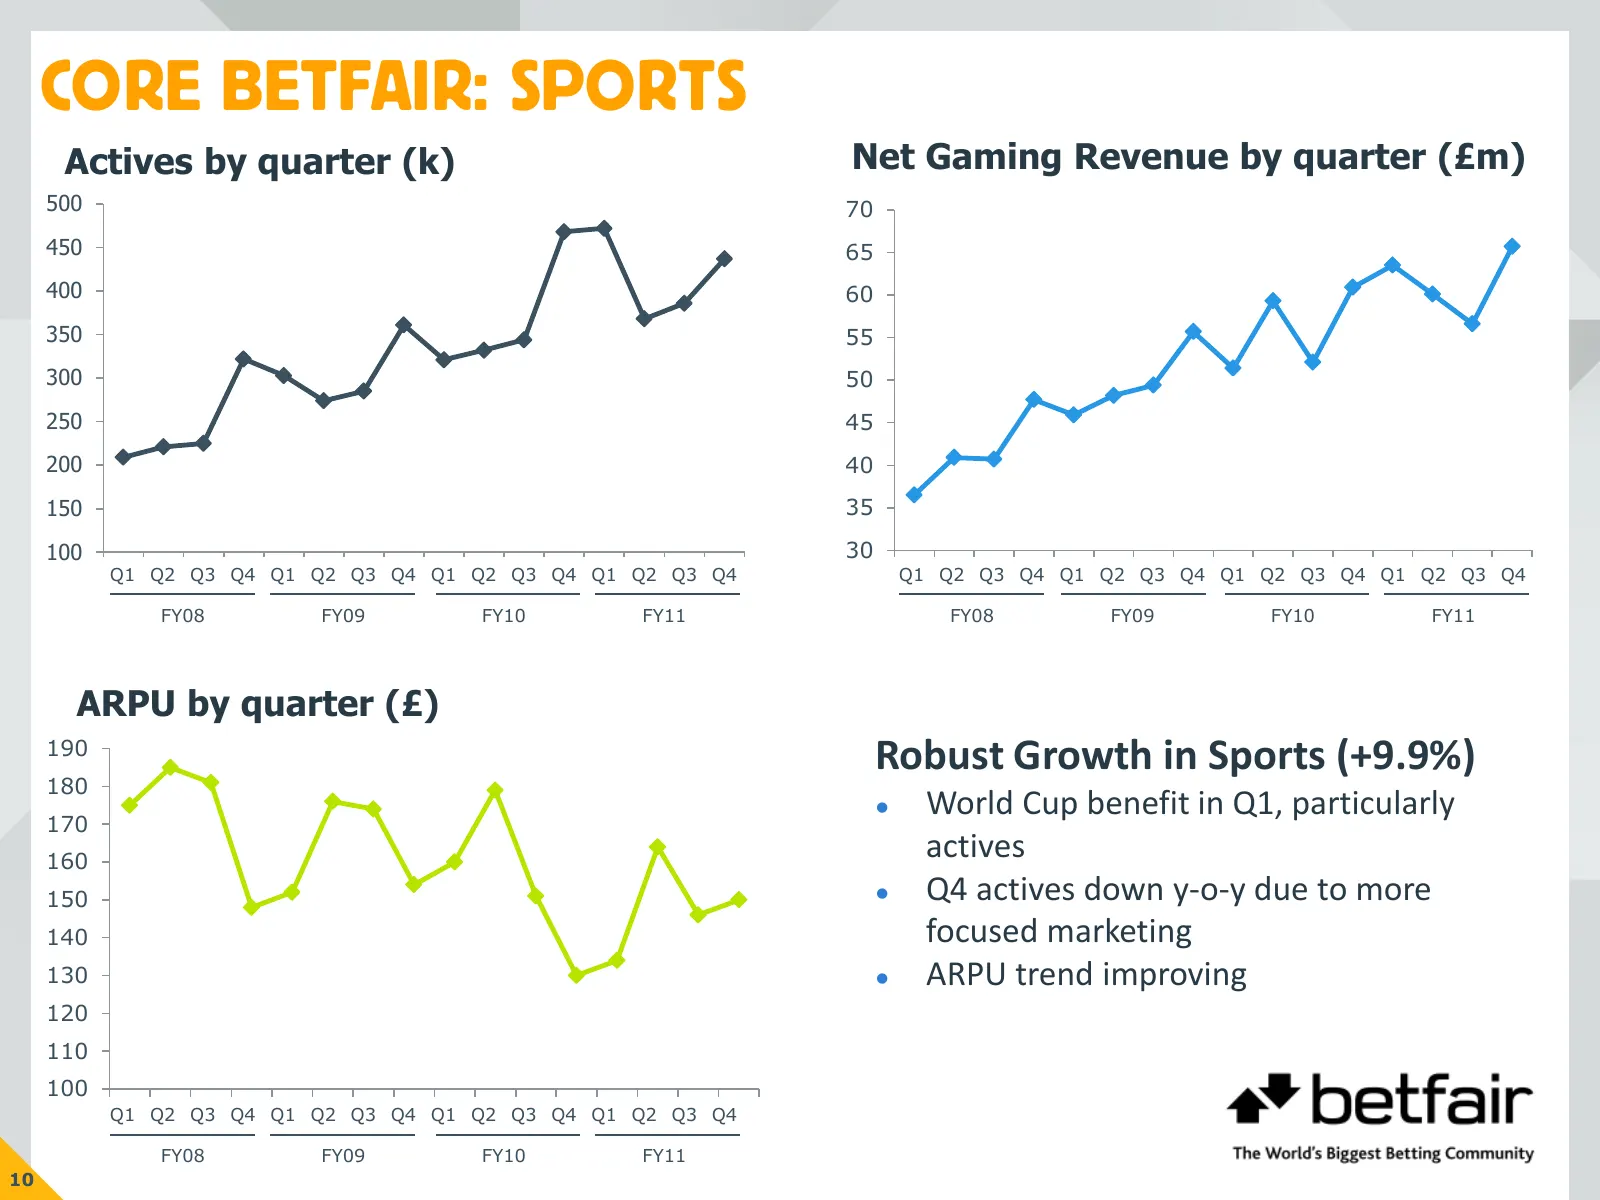
CORE BETFAIR: SPORTS Actives by quarter (k) Net Gaming Revenue by quarter (£m) 500 70 450 65 400 60 350 55 300 50 250 45 200 40 150 35 100 30 Q1 Q2 Q3 Q4 Q1 Q2 Q3 Q4 Q1 Q2 Q3 Q4 Q1 Q2 Q3 Q4 Q1 Q2 Q3 Q4 Q1 Q2 Q3 Q4 Q1 Q2 Q3 Q4 Q1 Q2 Q3 Q4 FY08 FY09 FY10 FY11 FY08 FY09 FY10 FY11 ARPU by quarter (£) 19
Slide 12: Core Betfair: Sports
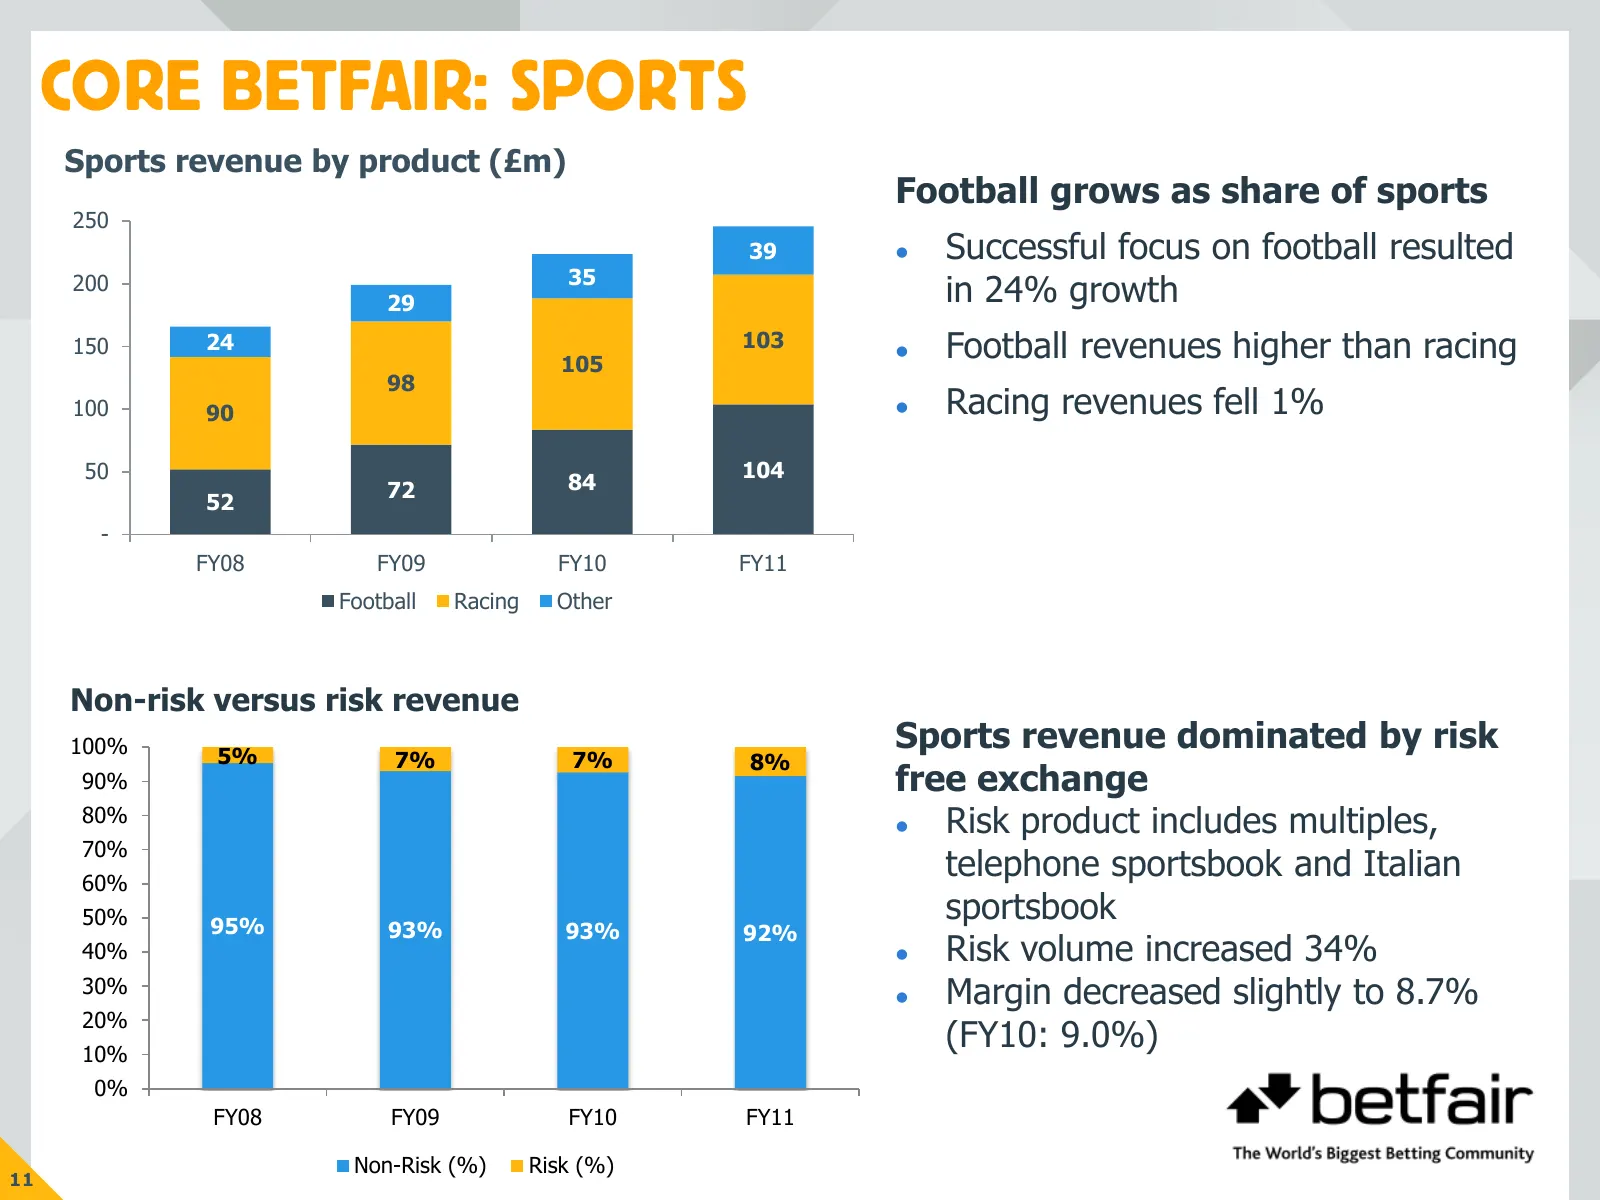
CORE BETFAIR: SPORTS Sports revenue by product (£m) Football grows as share of sports 250 39 Successful focus on football resulted 35 200 29 in 24% growth 150 24 105 103 Football revenues higher than racing 98 100 90 Racing revenues fell 1% 50 104 72 84 52 - FY08 FY09 FY10 FY11 Football Racing
Slide 13: Core Betfair: Risk vs Non-Risk Performance
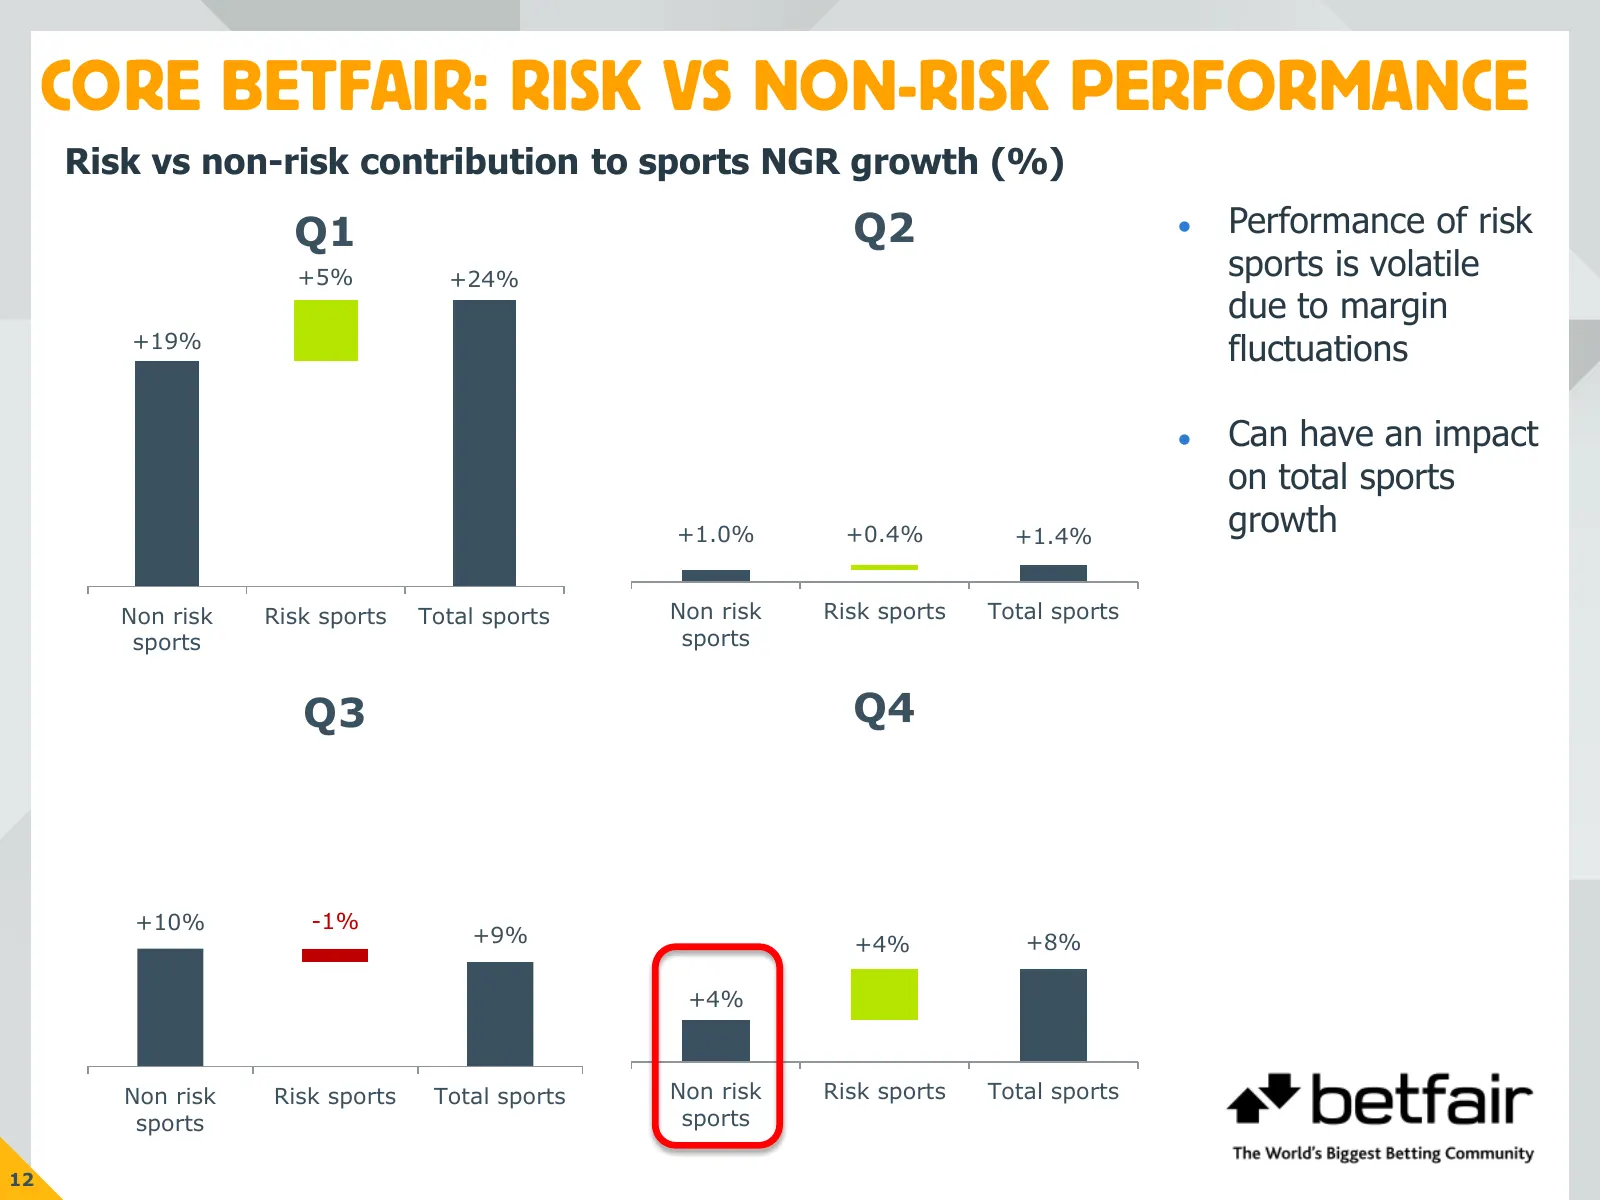
CORE BETFAIR: RISK VS NON-RISK PERFORMANCE Risk vs non-risk contribution to sports NGR growth (%) Q1 Q2 Performance of risk +5% +24% sports is volatile due to margin +19% fluctuations Can have an impact on total sports +1.0% +0.4% +1.4% growth Non risk Risk sports Total sports Non risk Risk spor
Slide 14: Core Betfair: Q4 Sports Performance
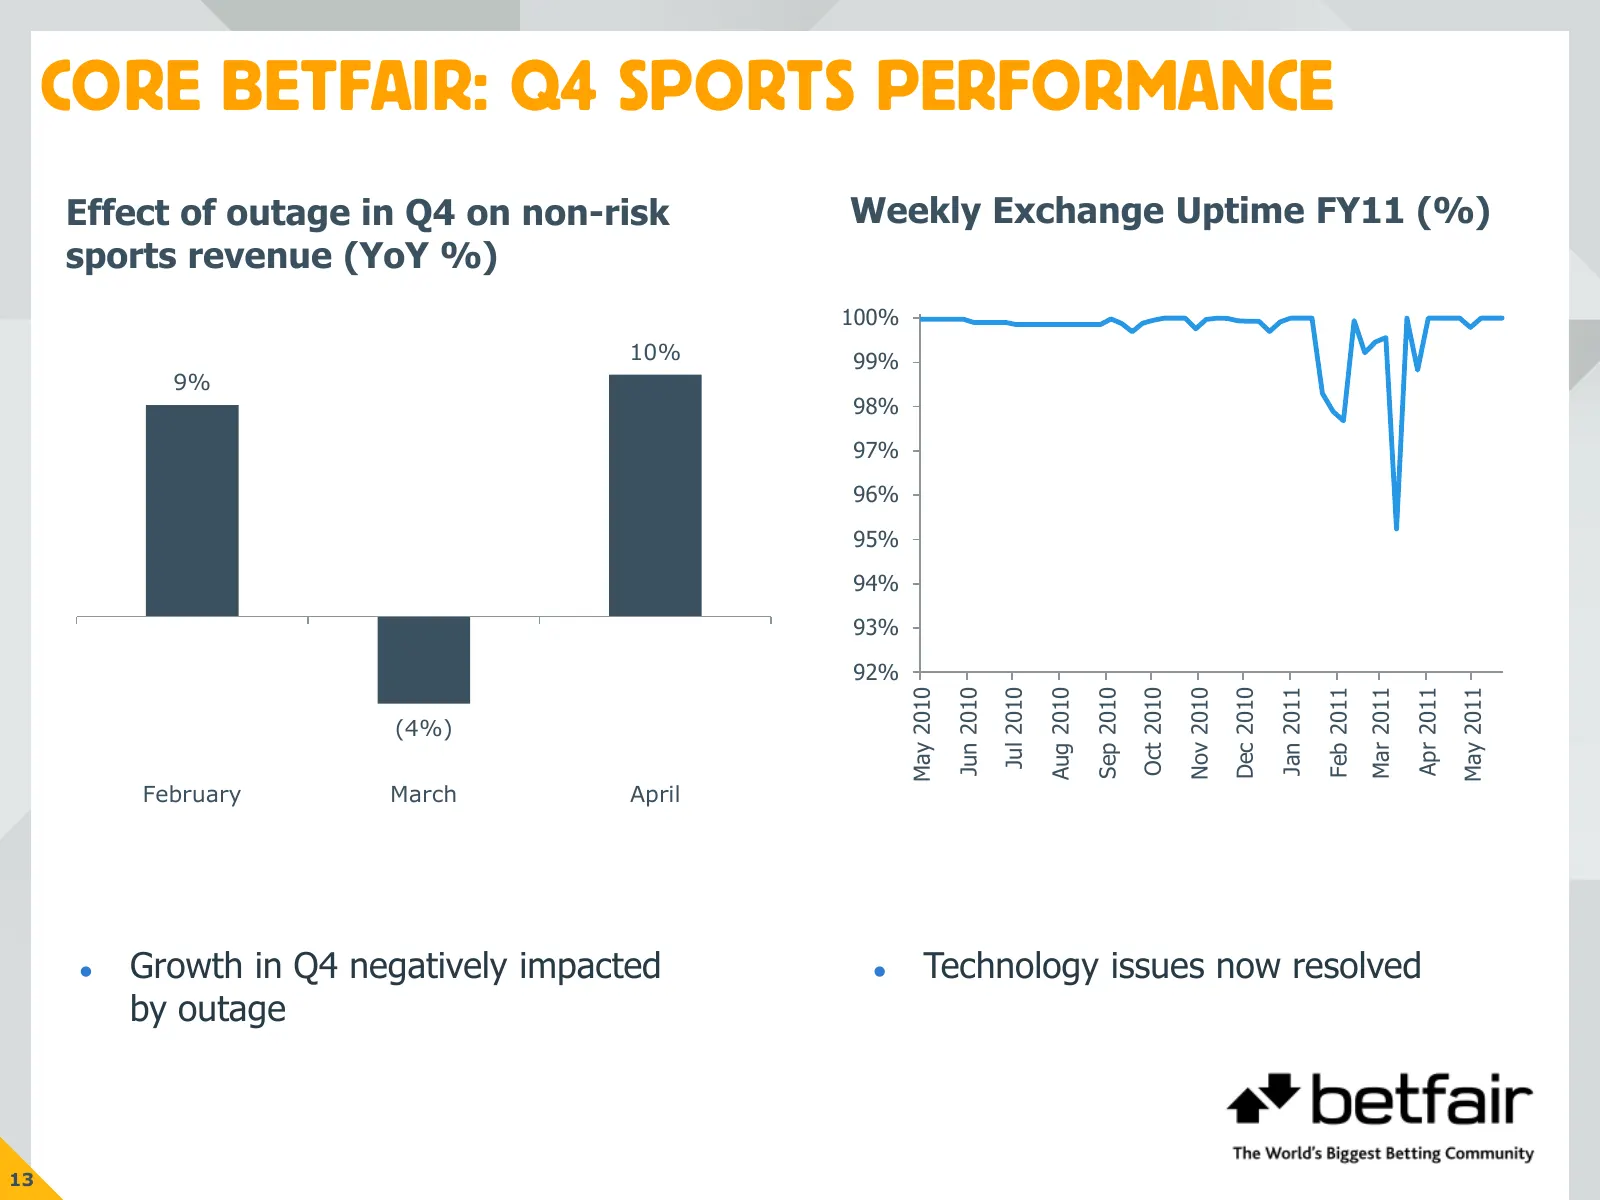
CORE BETFAIR: Q4 SPORTS PERFORMANCE Effect of outage in Q4 on non-risk Weekly Exchange Uptime FY11 (%) sports revenue (YoY %) 101% 100% 10% 99% 9% 98% 97% 96% 95% 94% 93% 92% Jun 2010 Mar 2011 Jul 2010 Apr 2011 Sep 2010 Feb 2011 Oct 2010 Nov 2010 Aug 2010 May 2010 May 2011 Dec 2010 Jan 2011 (4%) Feb
Slide 15: Core Betfair: Games
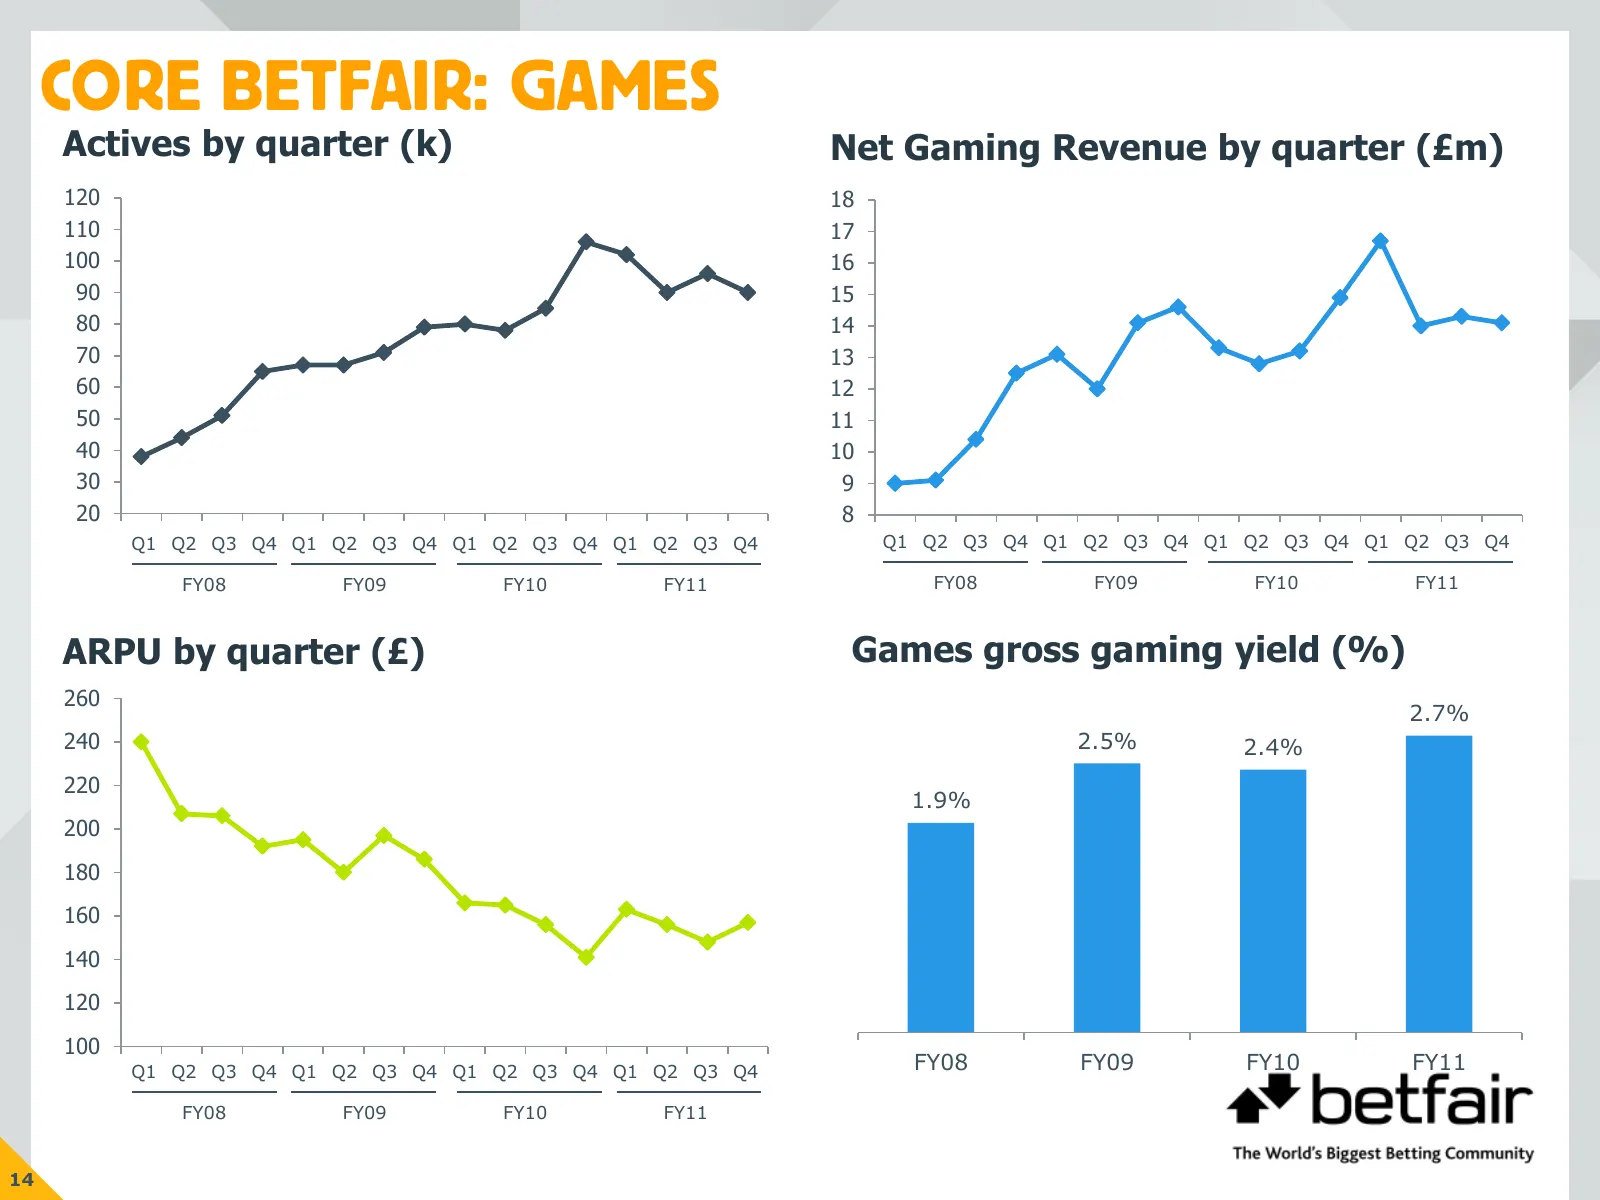
CORE BETFAIR: GAMES Actives by quarter (k) Net Gaming Revenue by quarter (£m) 120 18 110 17 100 16 90 15 80 14 70 13 60 12 50 11 40 10 30 9 20 8 Q1 Q2 Q3 Q4 Q1 Q2 Q3 Q4 Q1 Q2 Q3 Q4 Q1 Q2 Q3 Q4 Q1 Q2 Q3 Q4 Q1 Q2 Q3 Q4 Q1 Q2 Q3 Q4 Q1 Q2 Q3 Q4 FY08 FY09 FY10 FY11 FY08 FY09 FY10 FY11 ARPU by quarter (£)
Slide 16: Core Betfair: Poker
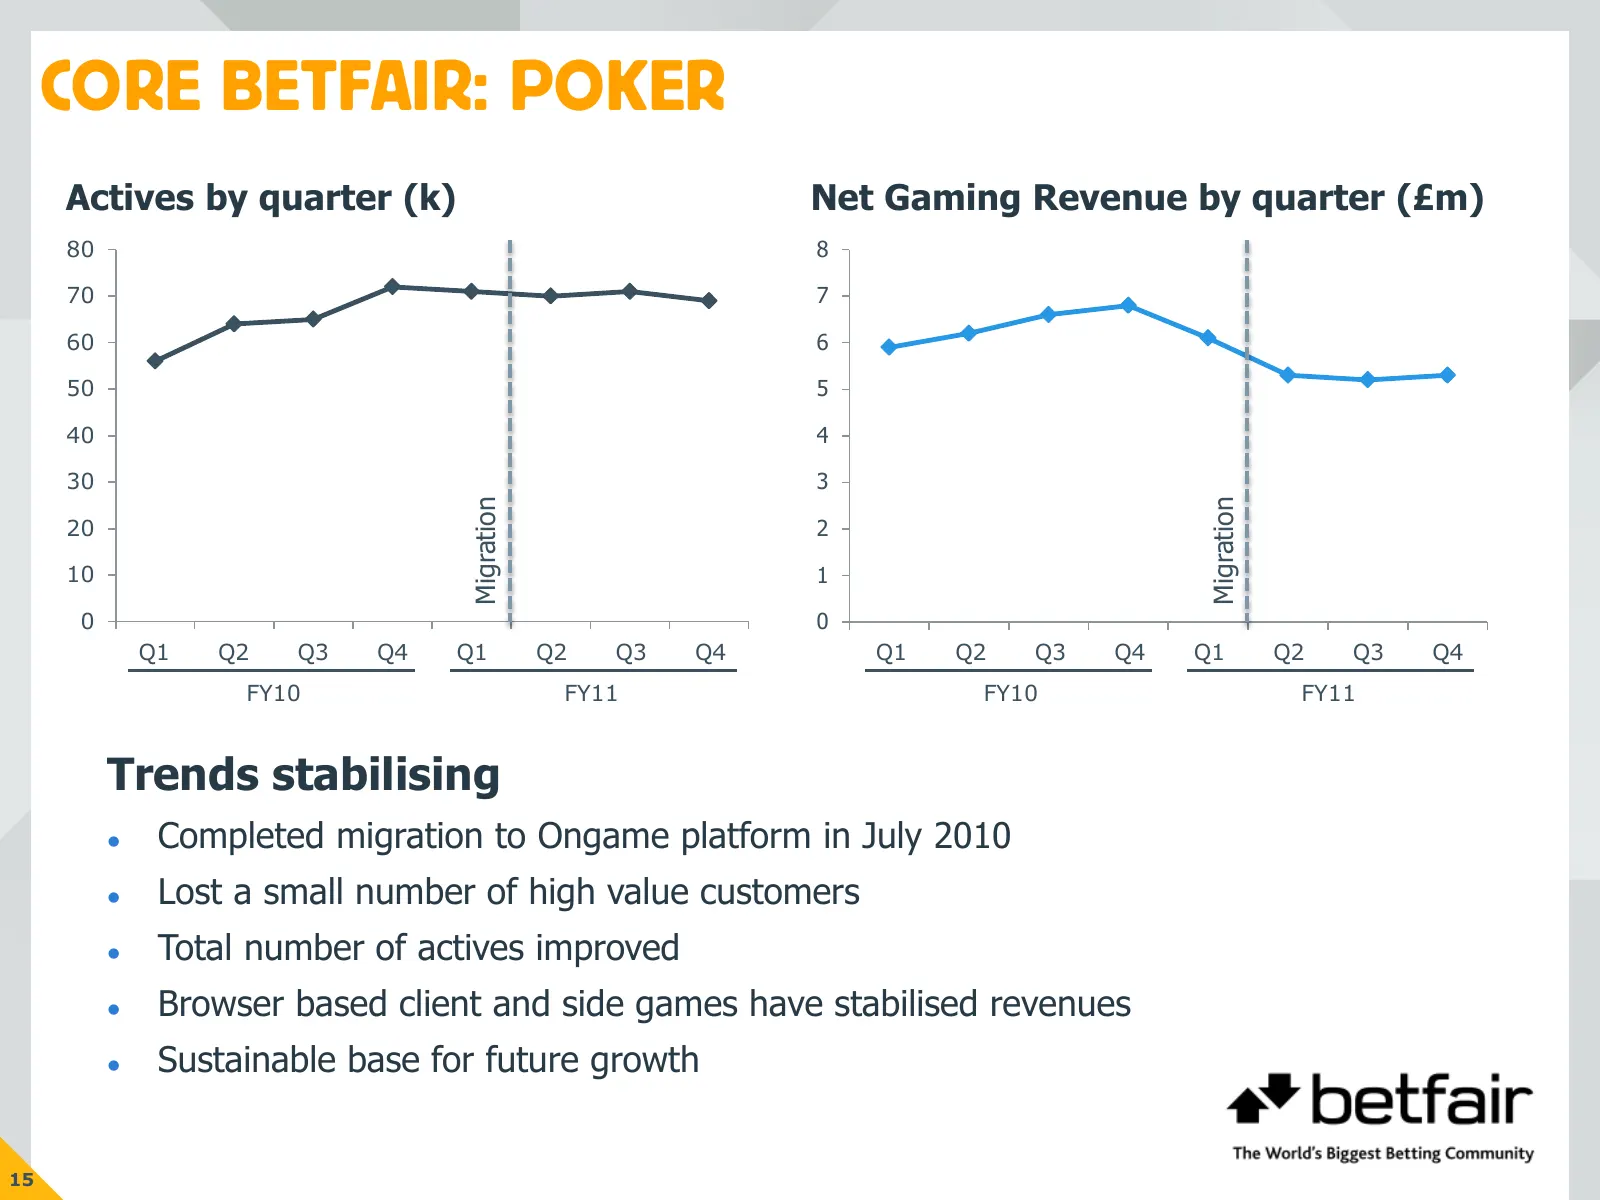
CORE BETFAIR: POKER Actives by quarter (k) Net Gaming Revenue by quarter (£m) 80 8 70 7 60 6 50 5 40 4 30 Migration 3 Migration 20 2 10 1 0 0 Q1 Q2 Q3 Q4 Q1 Q2 Q3 Q4 Q1 Q1 Q2 Q2 Q3 Q3 Q4 Q4 Q1 Q1 Q2 Q2 Q3 Q3 Q4 FY10 FY10 FY10 FY10 FY11 FY11 FY11 FY11 FY10 FY10 FY10 FY10 FY11 FY11 FY11 FY11 FY10 FY11
Slide 17: Core Betfair: EBITDA Development
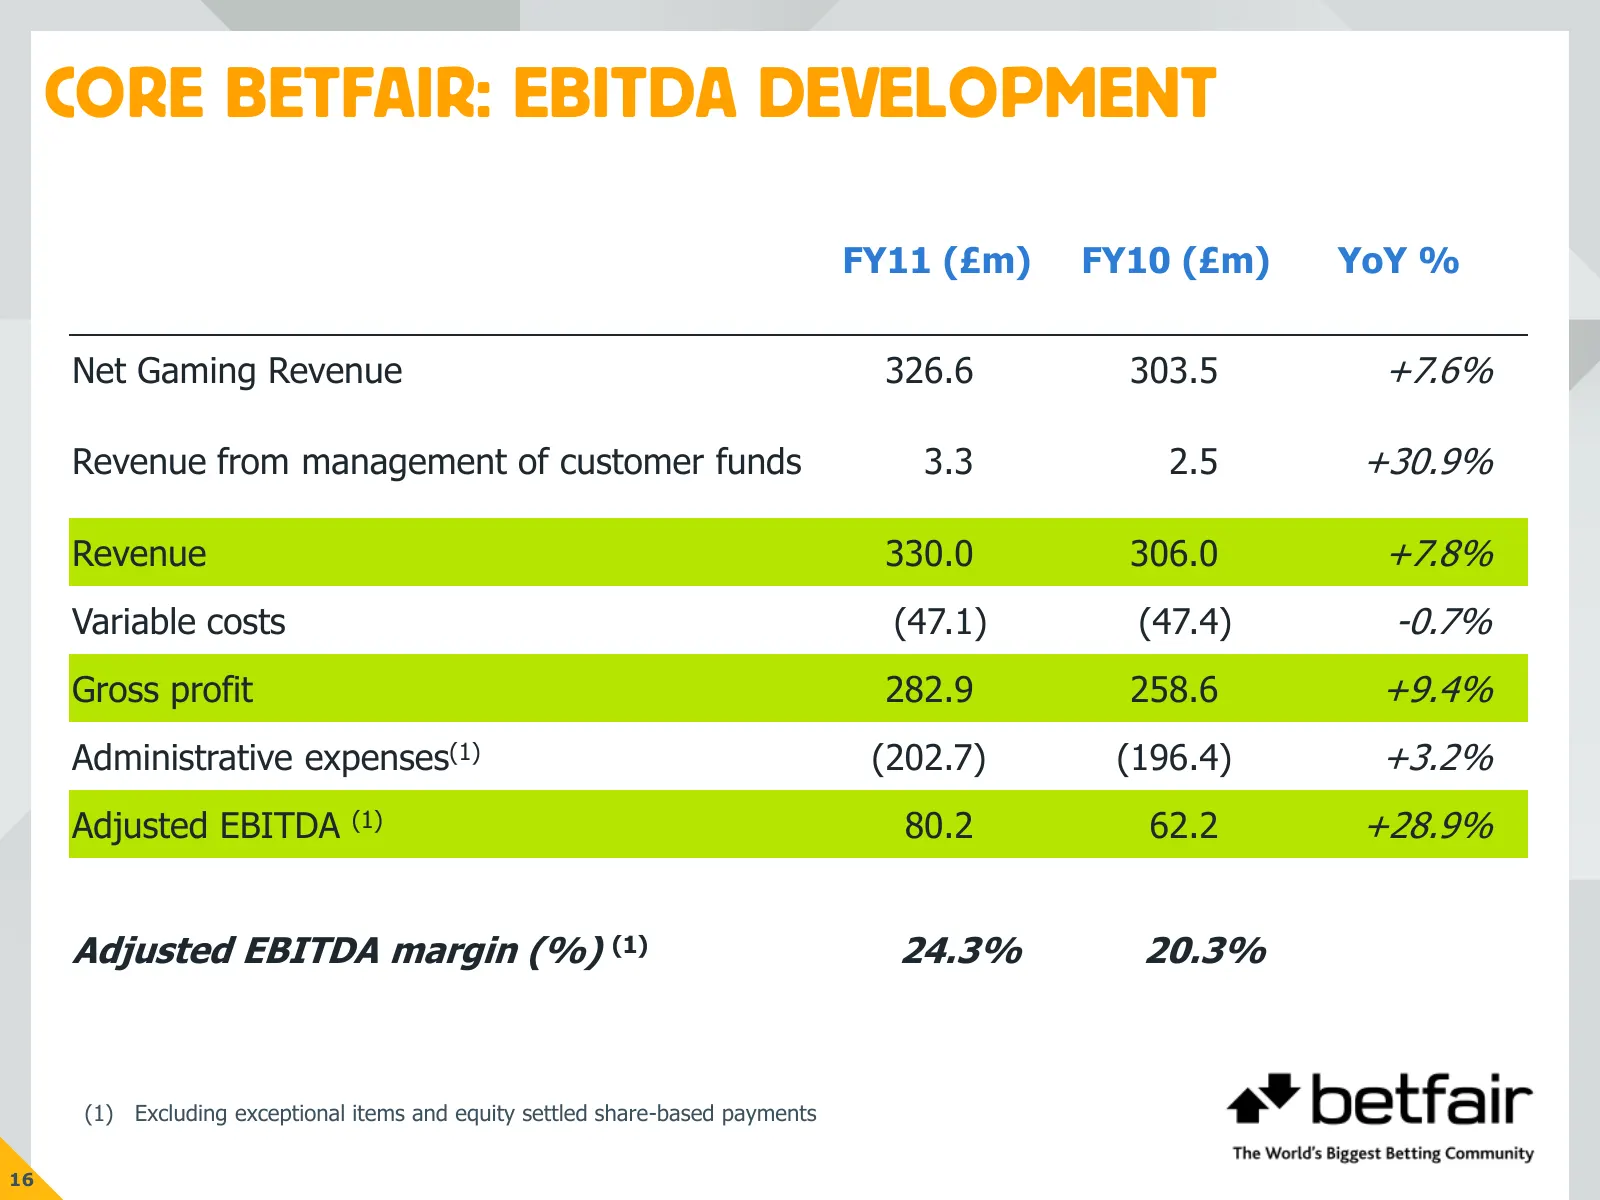
CORE BETFAIR: EBITDA DEVELOPMENT FY11 (£m) FY10 (£m) YoY % Net Gaming Revenue 326.6 303.5 +7.6% Revenue from management of customer funds 3.3 2.5 +30.9% Revenue 330.0 306.0 +7.8% Variable costs (47.1) (47.4) -0.7% Gross profit 282.9 258.6 +9.4% Administrative expenses(1) (202.7) (196.4) +3.2% Adjust
Slide 18: Core Betfair: Administrative Expenses
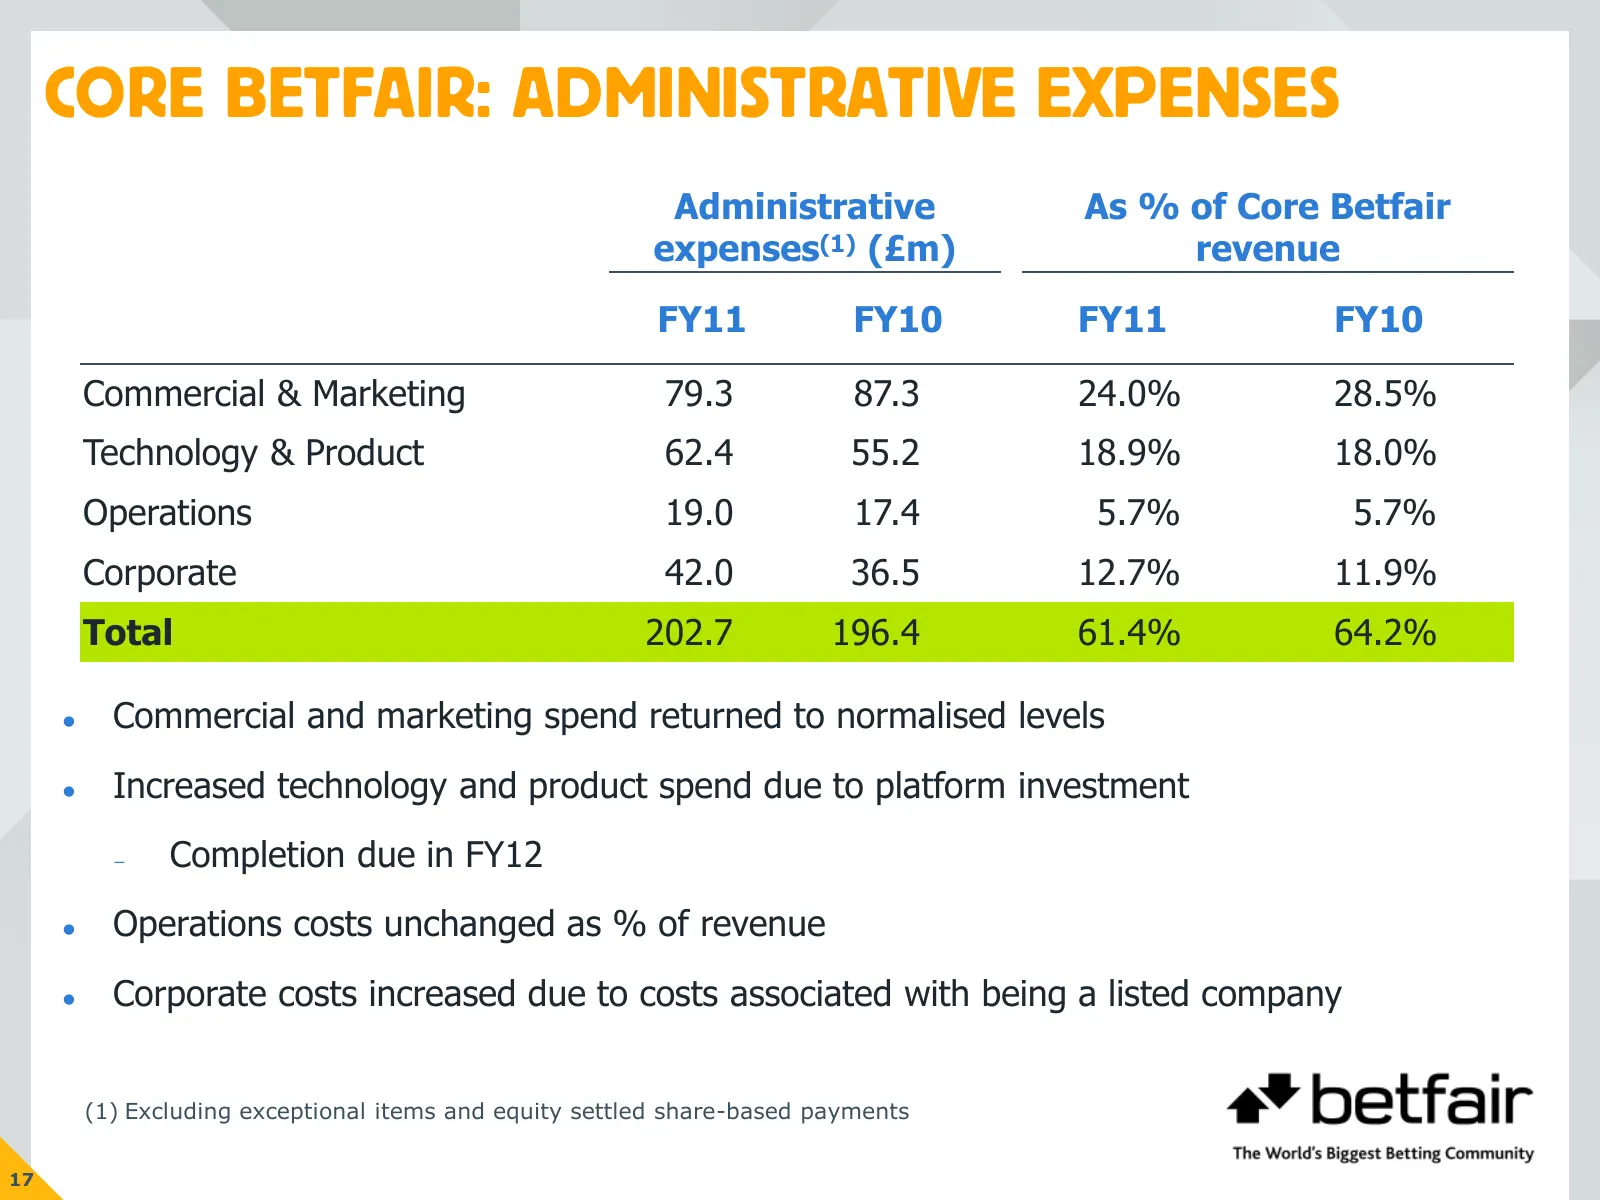
CORE BETFAIR: ADMINISTRATIVE EXPENSES Administrative As % of Core Betfair expenses(1) (£m) revenue FY11 FY10 FY11 FY10 Commercial & Marketing 79.3 87.3 24.0% 28.5% Technology & Product 62.4 55.2 18.9% 18.0% Operations 19.0 17.4 5.7% 5.7% Corporate 42.0 36.5 12.7% 11.9% Total 202.7 196.4 61.4% 64.2%
Slide 19: Other Investments: Betfair US
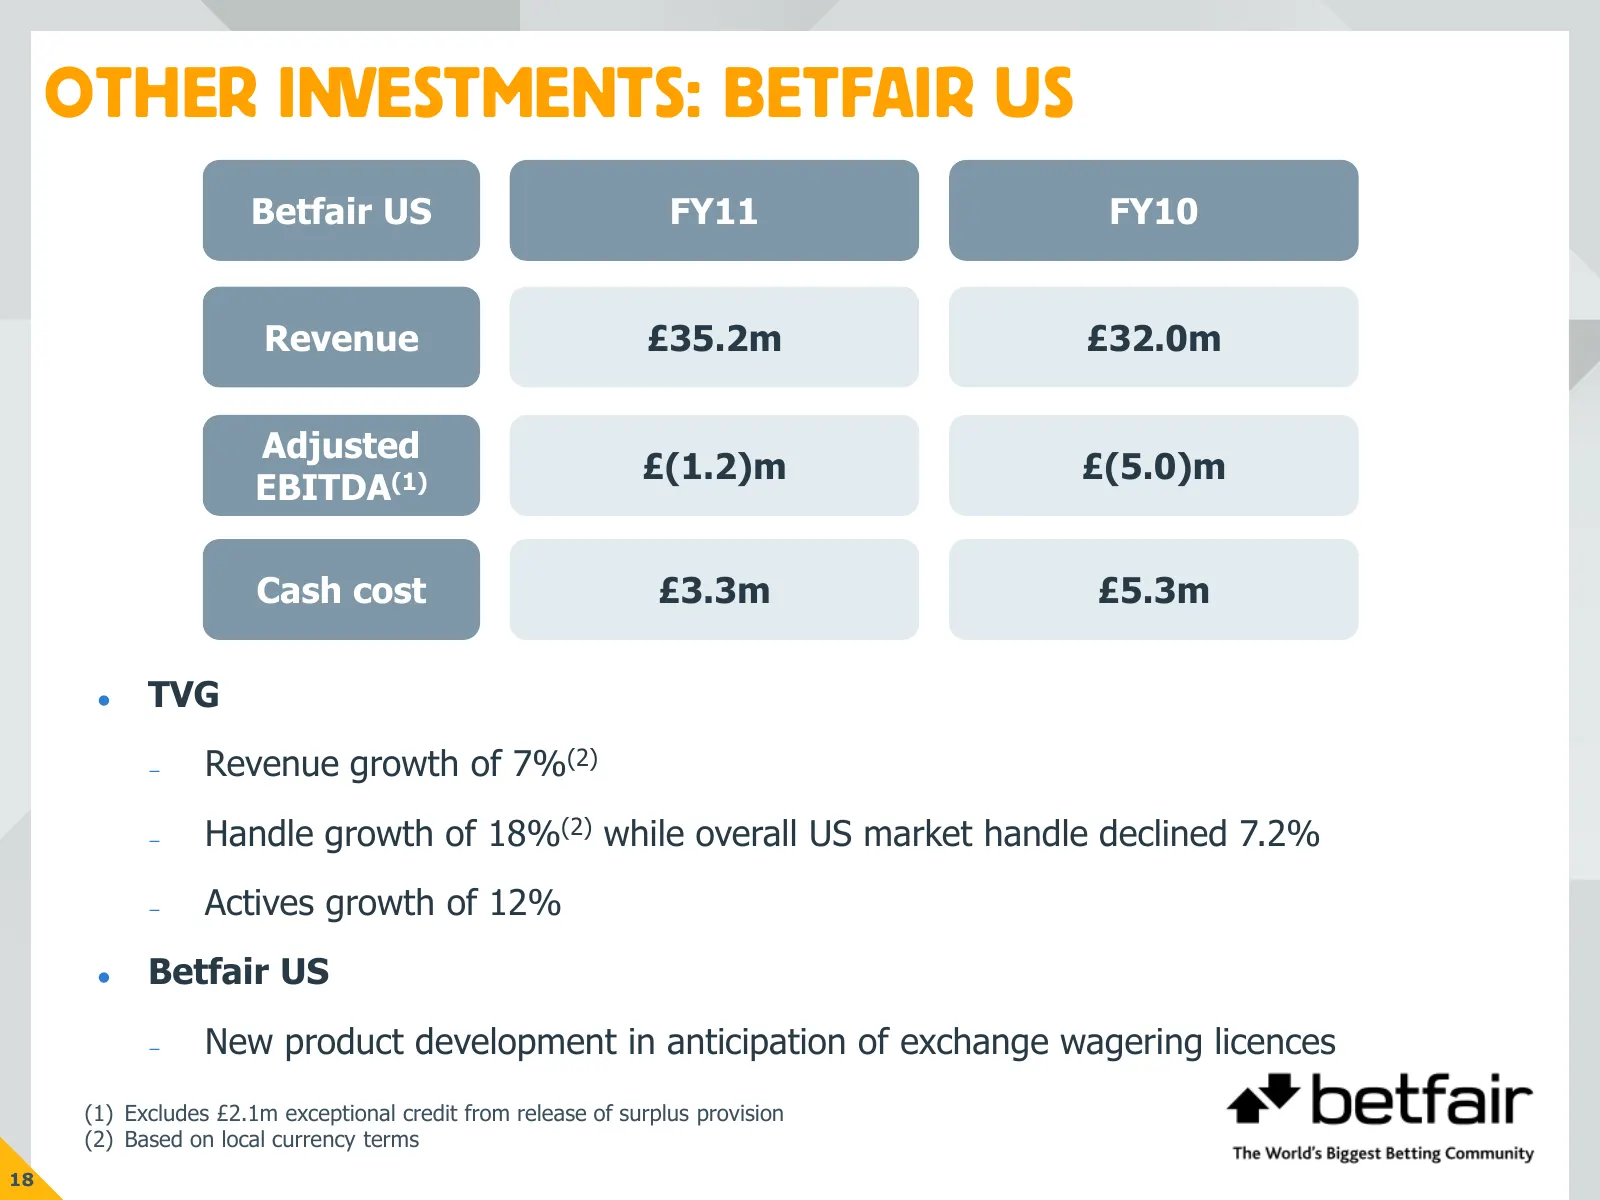
OTHER INVESTMENTS: BETFAIR US Betfair US FY11 FY10 Revenue £35.2m £32.0m Adjusted £(1.2)m £(5.0)m EBITDA(1) Cash cost £3.3m £5.3m TVG – Revenue growth of 7%(2) – Handle growth of 18%(2) while overall US market handle declined 7.2% – Actives growth of 12% Betfair US – New product development in a
Slide 20: Other Investments: LMAX
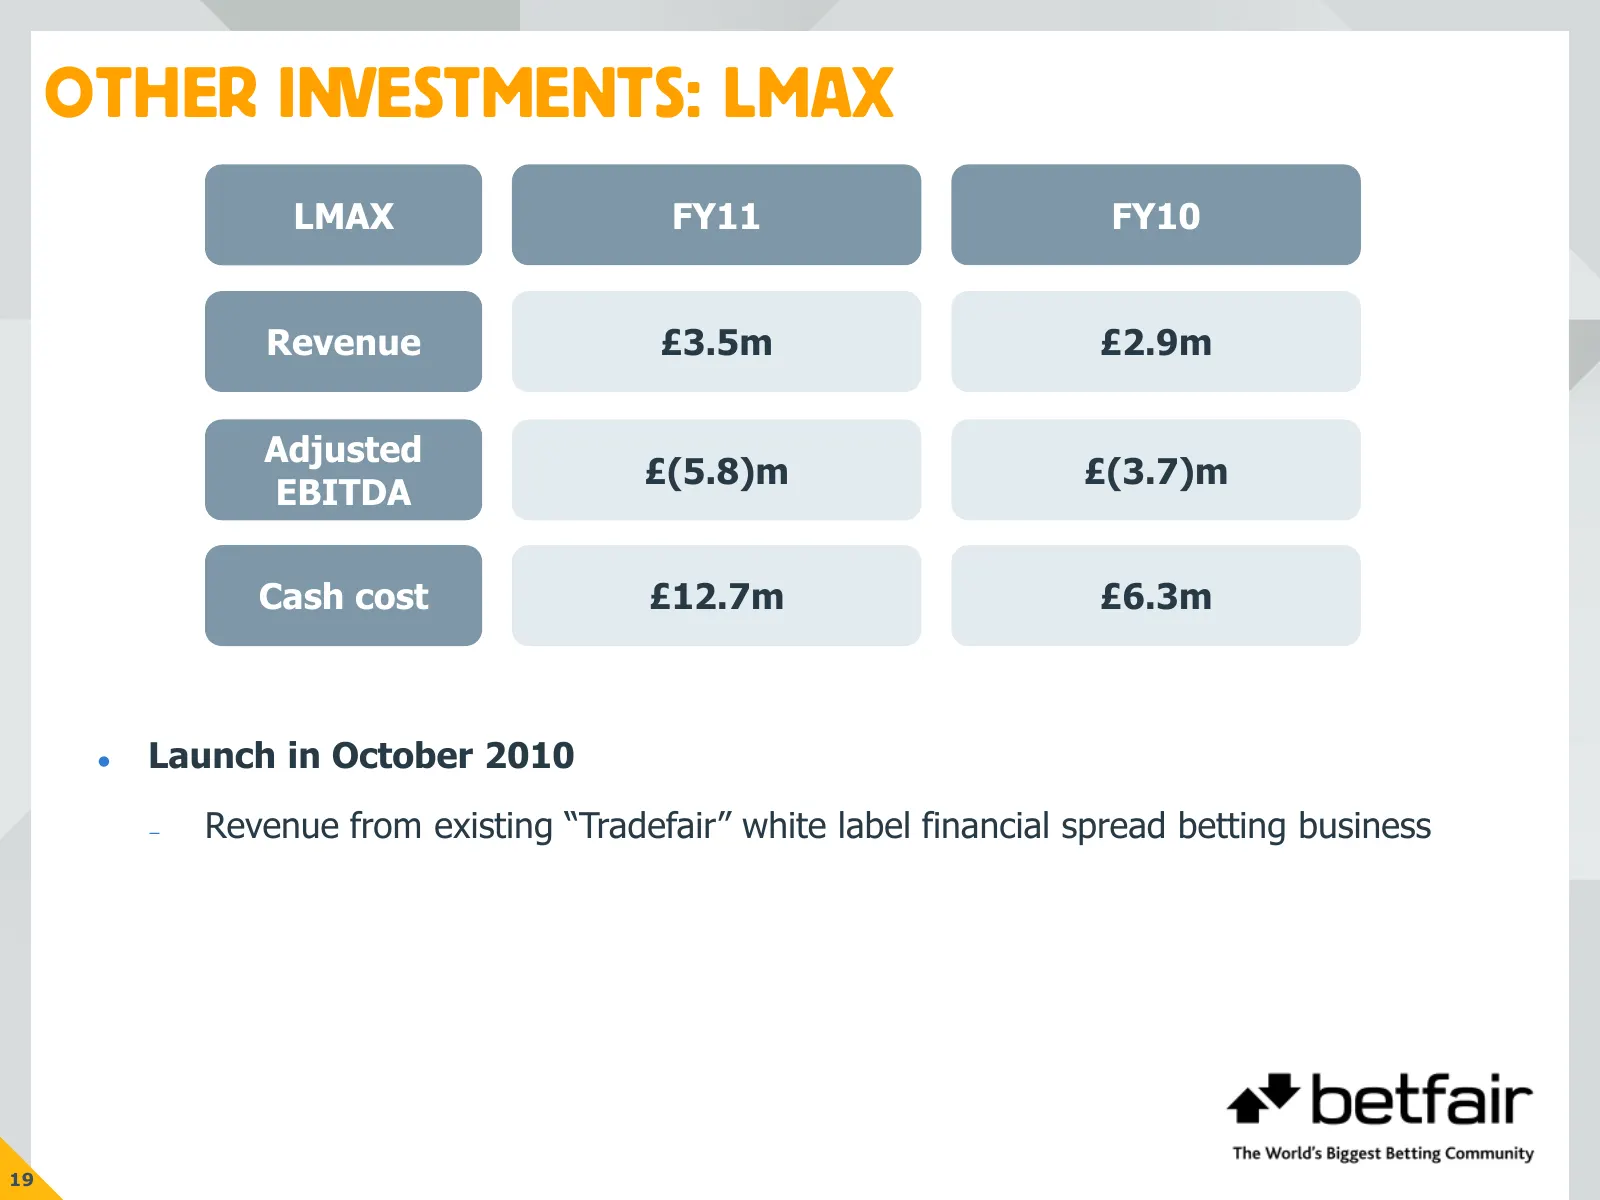
OTHER INVESTMENTS: LMAX LMAX FY11 FY10 Revenue £3.5m £2.9m Adjusted £(5.8)m £(3.7)m EBITDA Cash cost £12.7m £6.3m Launch in October 2010 – Revenue from existing “Tradefair” white label financial spread betting business 19
Slide 21: Group Income Statement: Underlying
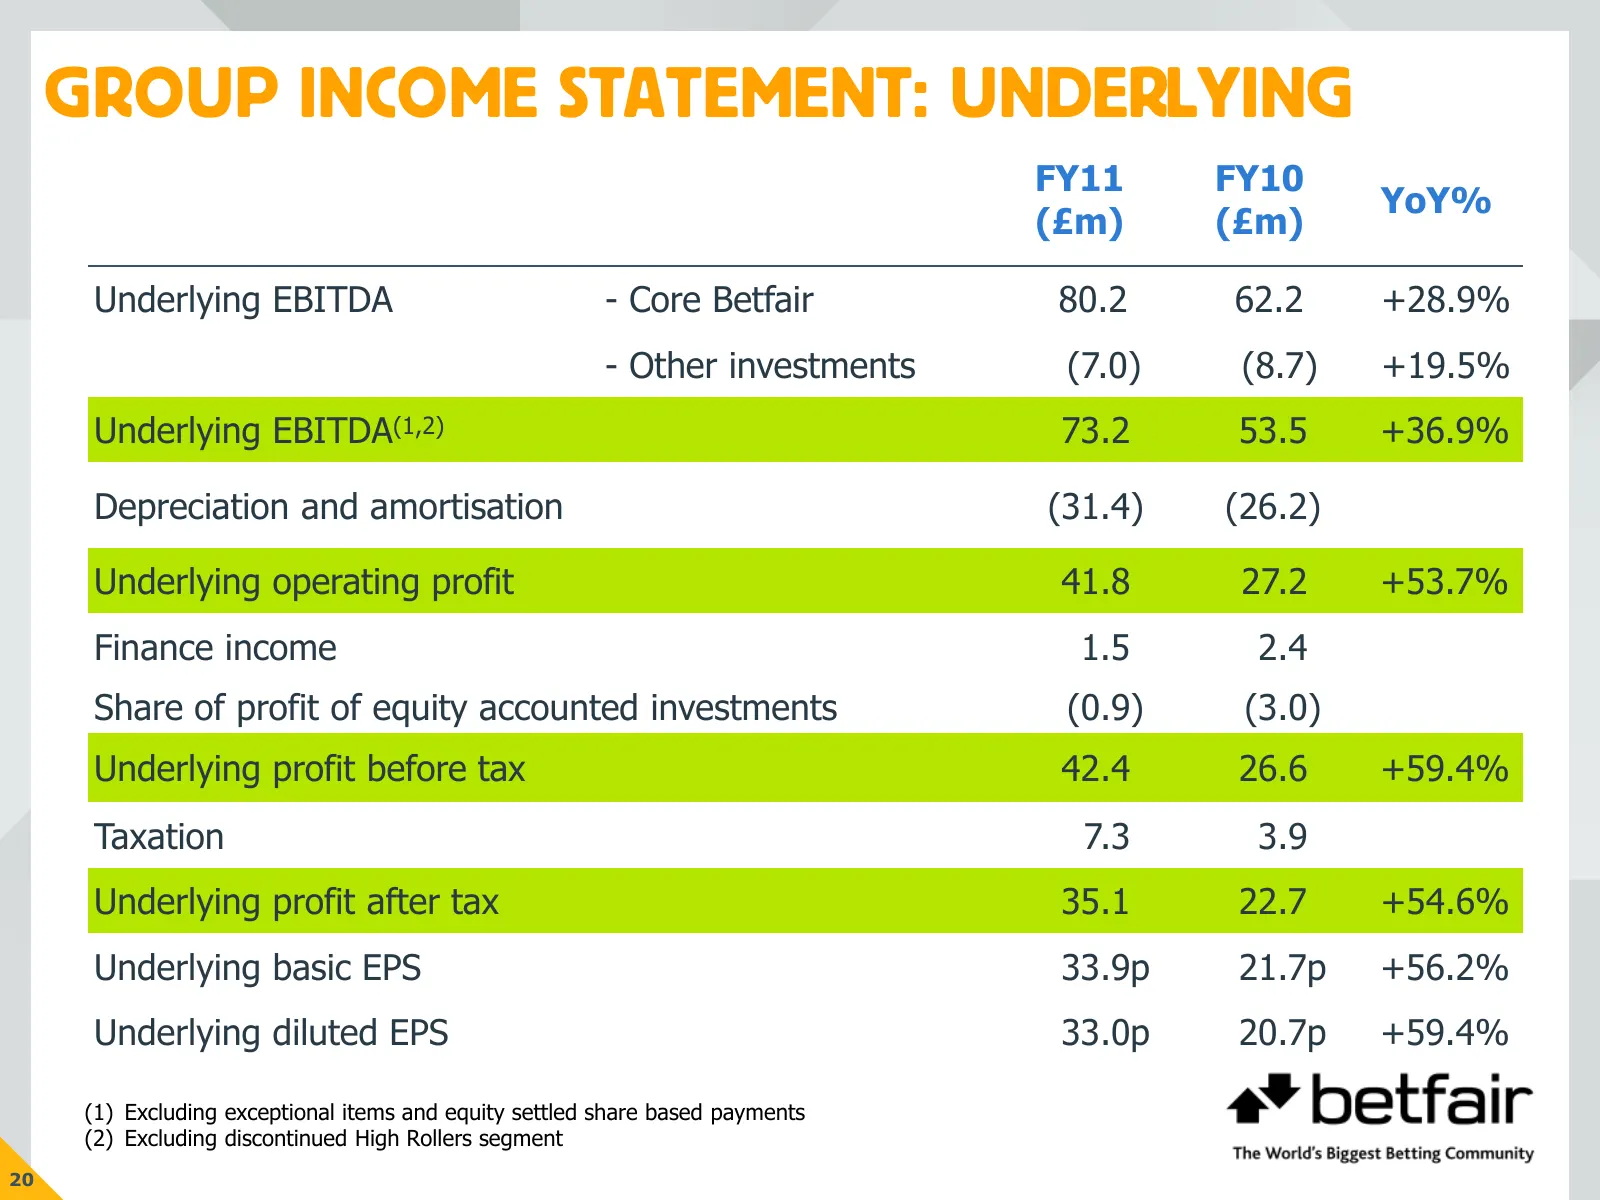
GROUP INCOME STATEMENT: UNDERLYING FY11 FY10 YoY% (£m) (£m) Underlying EBITDA - Core Betfair 80.2 62.2 +28.9% - Other investments (7.0) (8.7) +19.5% Underlying EBITDA(1,2) 73.2 53.5 +36.9% Depreciation and amortisation (31.4) (26.2) Underlying operating profit 41.8 27.2 +53.7% Finance income 1.5 2.4
Slide 22: Capex and Capitalised Development Expenditure
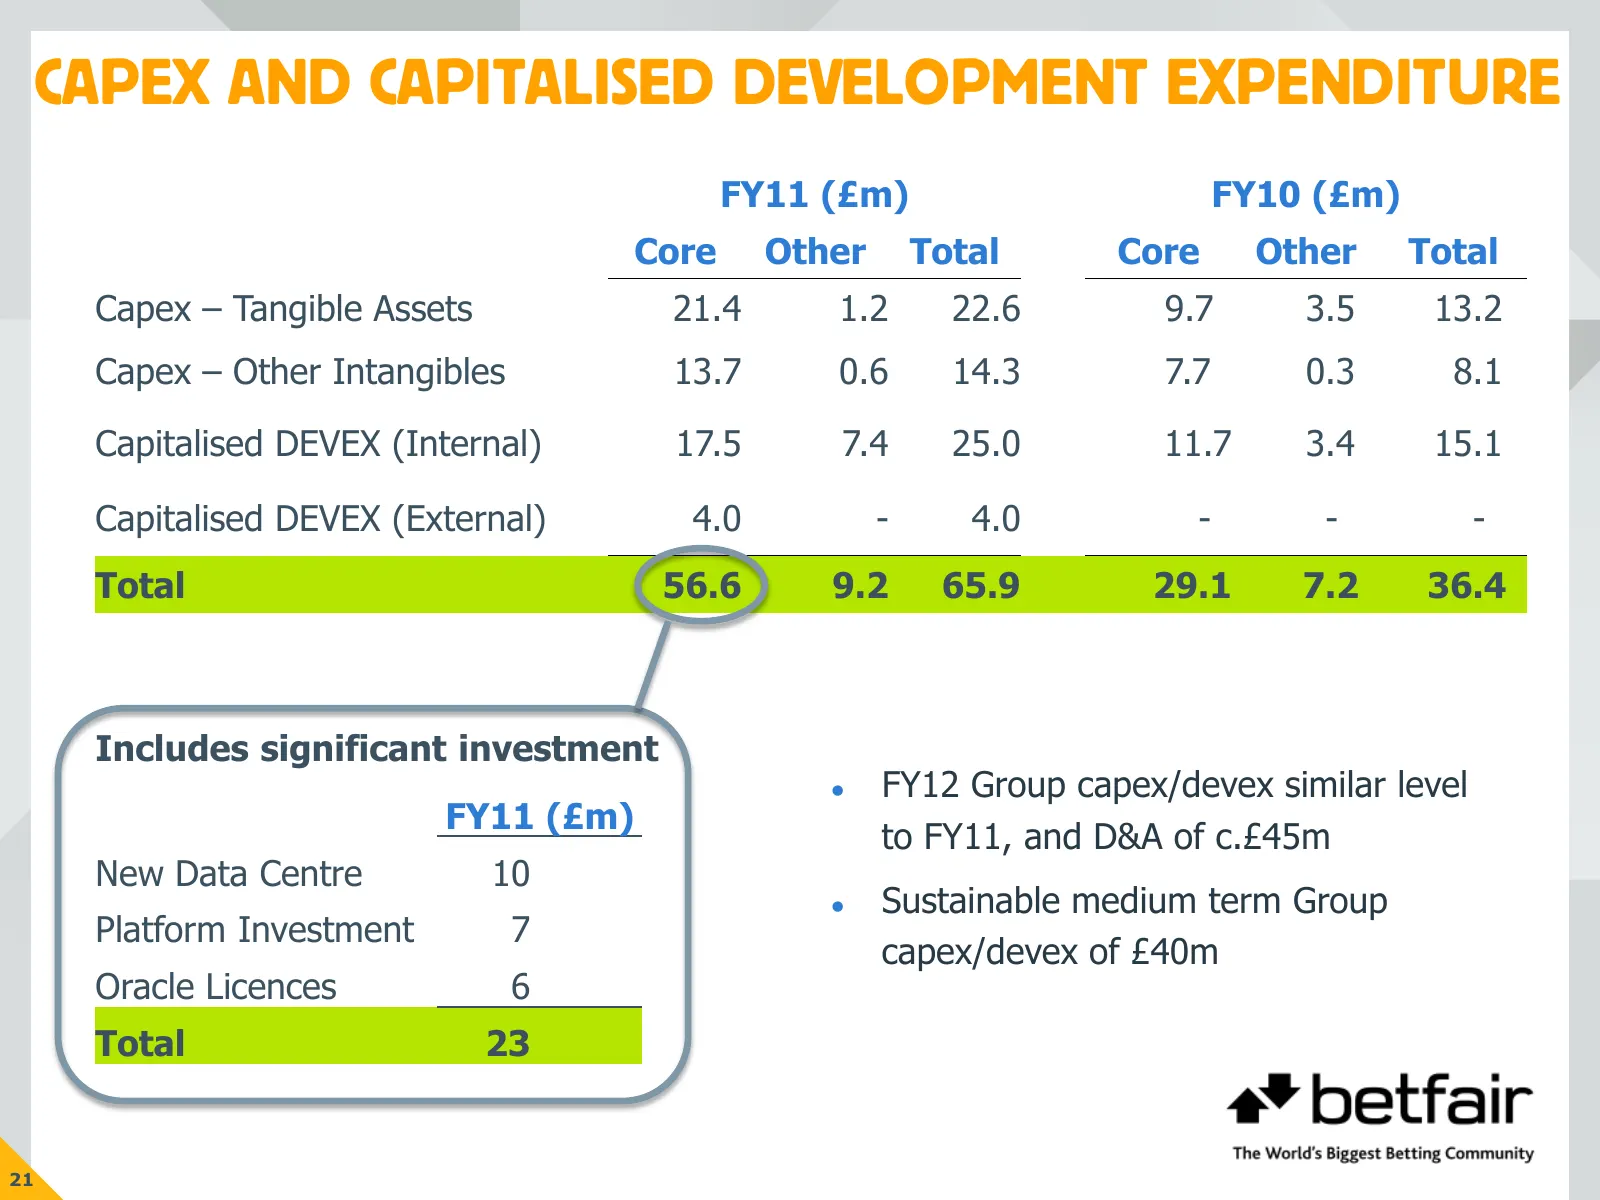
CAPEX AND CAPITALISED DEVELOPMENT EXPENDITURE FY11 (£m) FY10 (£m) Core Other Total Core Other Total Capex – Tangible Assets 21.4 1.2 22.6 9.7 3.5 13.2 Capex – Other Intangibles 13.7 0.6 14.3 7.7 0.3 8.1 Capitalised DEVEX (Internal) 17.5 7.4 25.0 11.7 3.4 15.1 Capitalised DEVEX (External) 4.0 - 4.0 -
Slide 23: Cash Flow
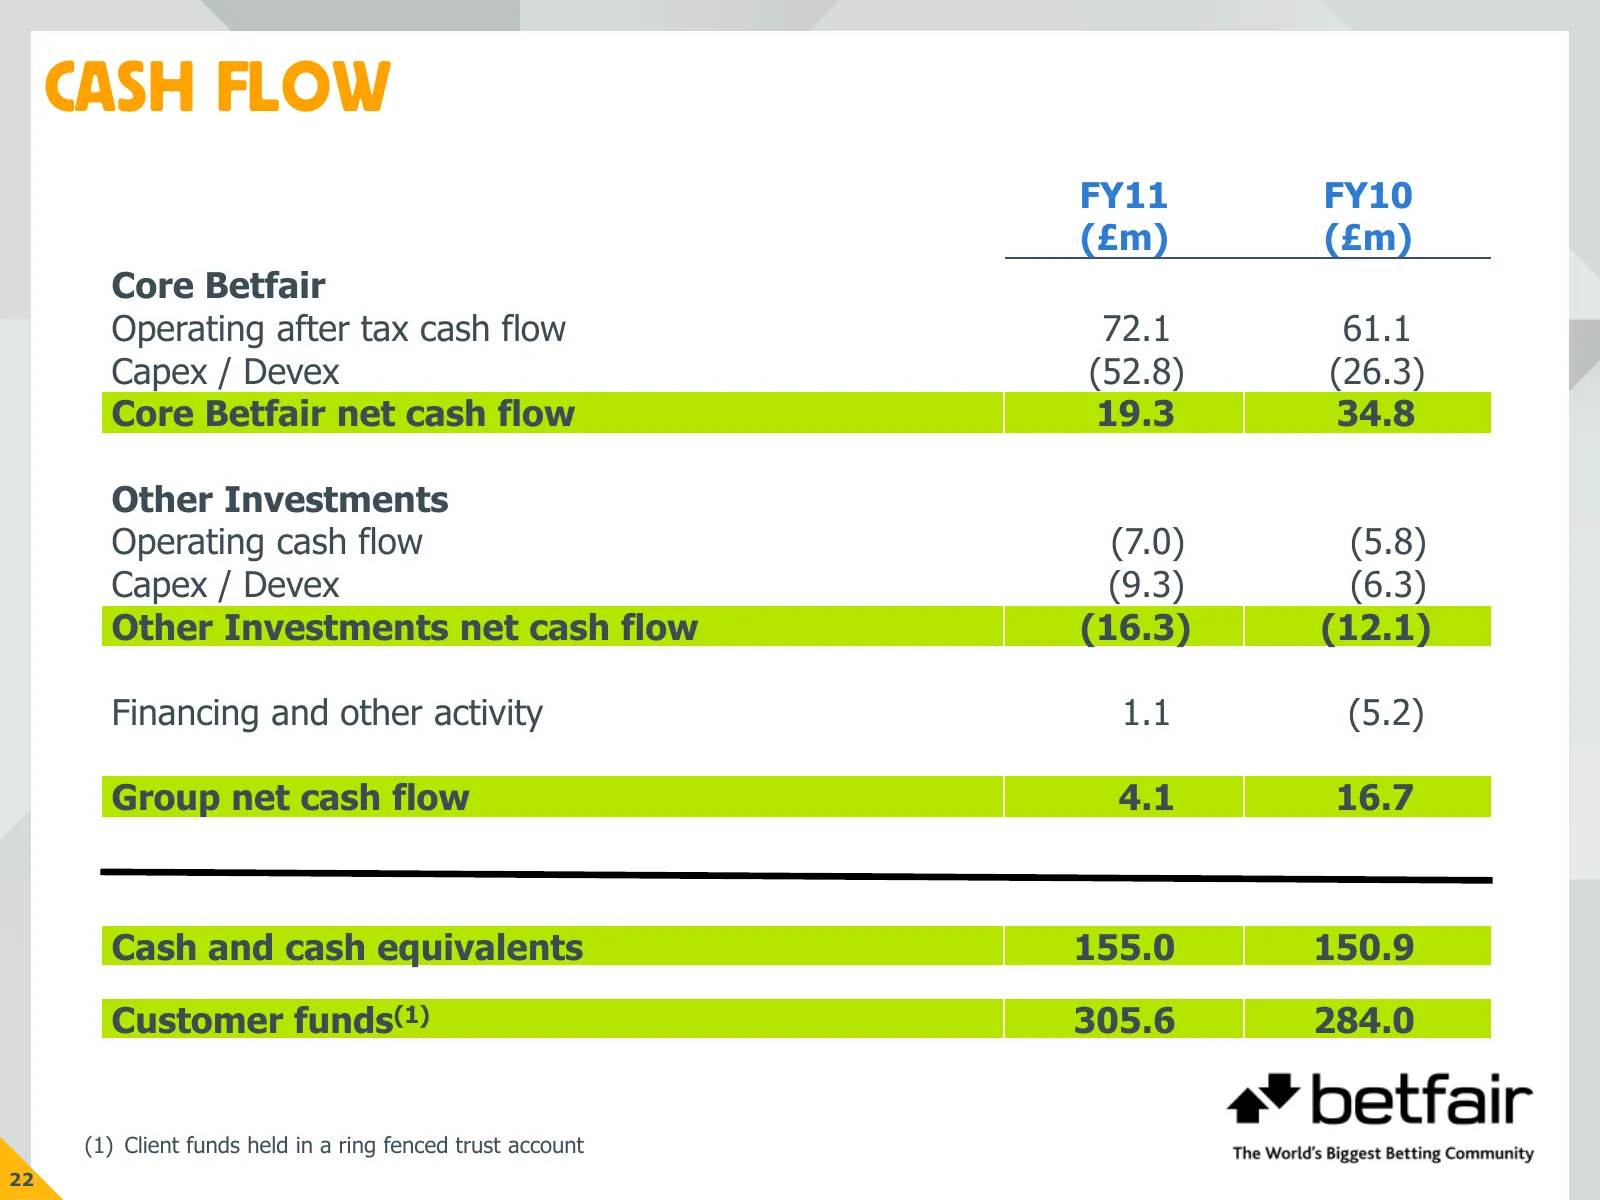
CASH FLOW FY11 FY10 (£m) (£m) Core Betfair Operating after tax cash flow 72.1 61.1 Capex / Devex (52.8) (26.3) Core Betfair net cash flow 19.3 34.8 Other Investments Operating cash flow (7.0) (5.8) Capex / Devex (9.3) (6.3) Other Investments net cash flow (16.3) (12.1) Financing and other activity 1
Slide 24: Return of Excess Cash
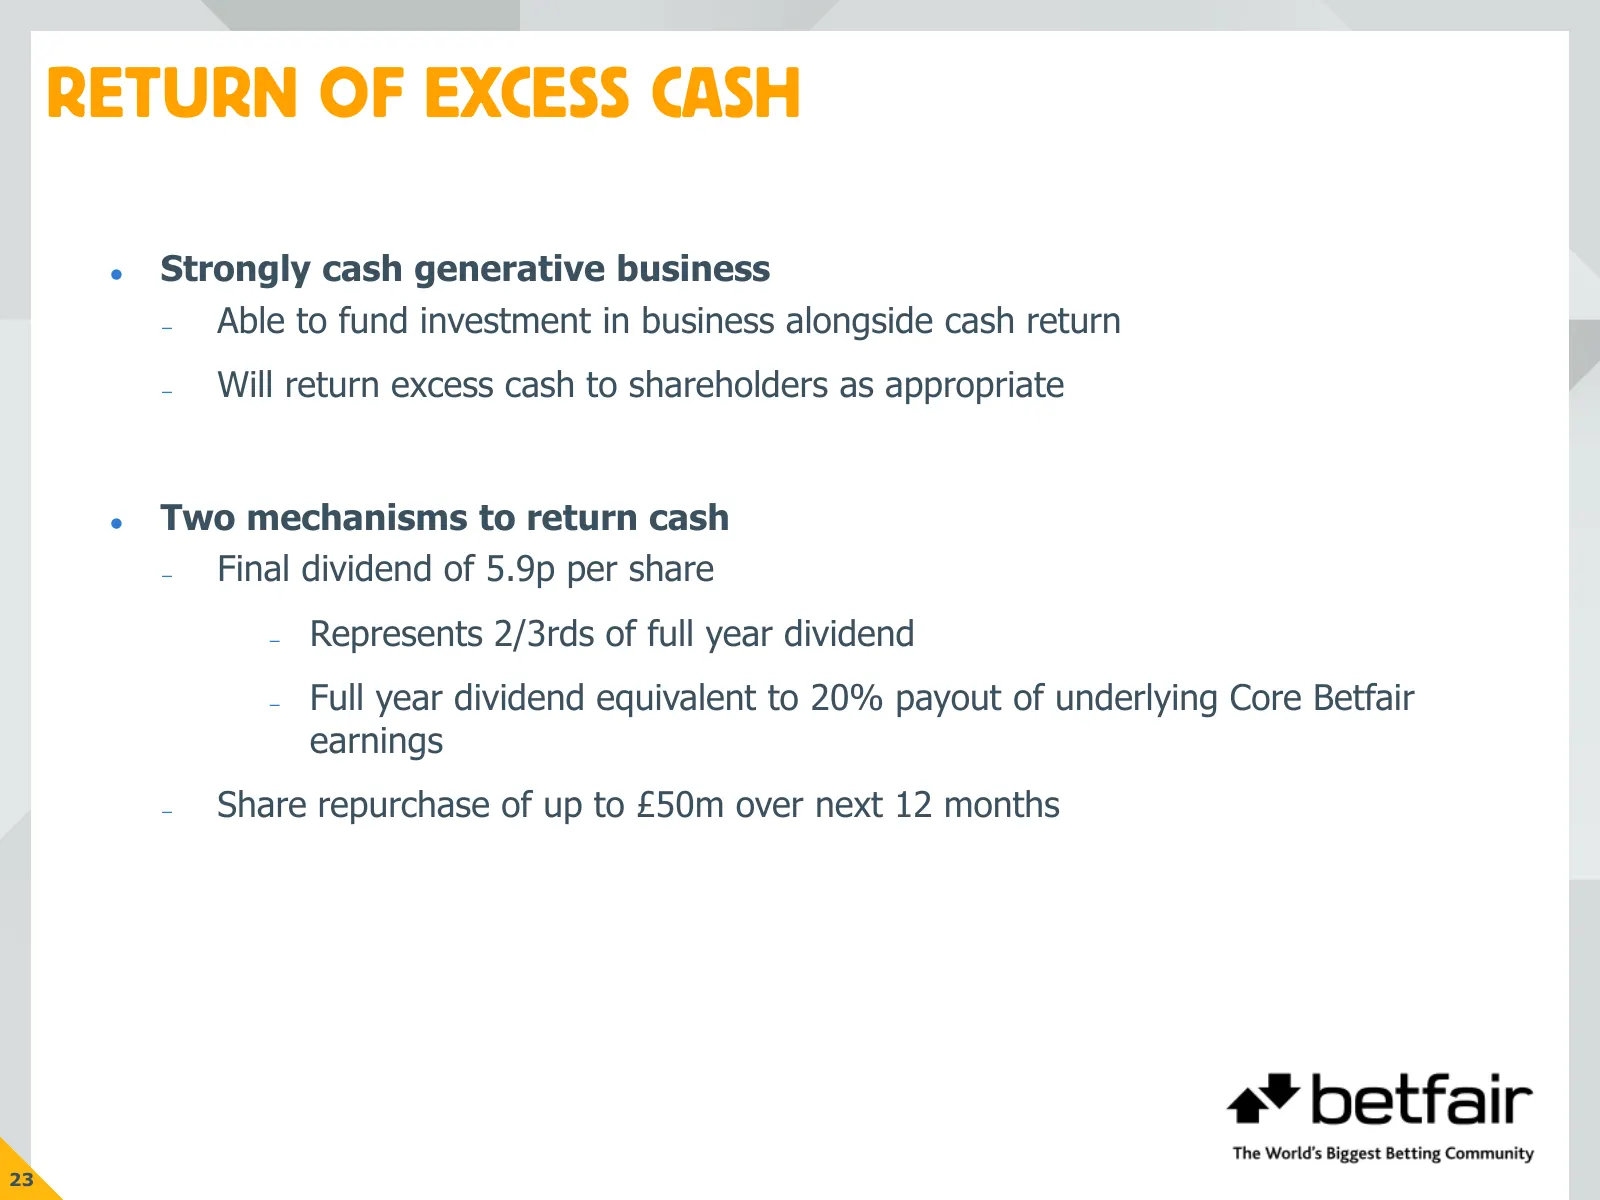
RETURN OF EXCESS CASH Strongly cash generative business – Able to fund investment in business alongside cash return – Will return excess cash to shareholders as appropriate Two mechanisms to return cash – Final dividend of 5.9p per share – Represents 2/3rds of full year dividend – Full year divi
Slide 25: Full Year Financial Summary
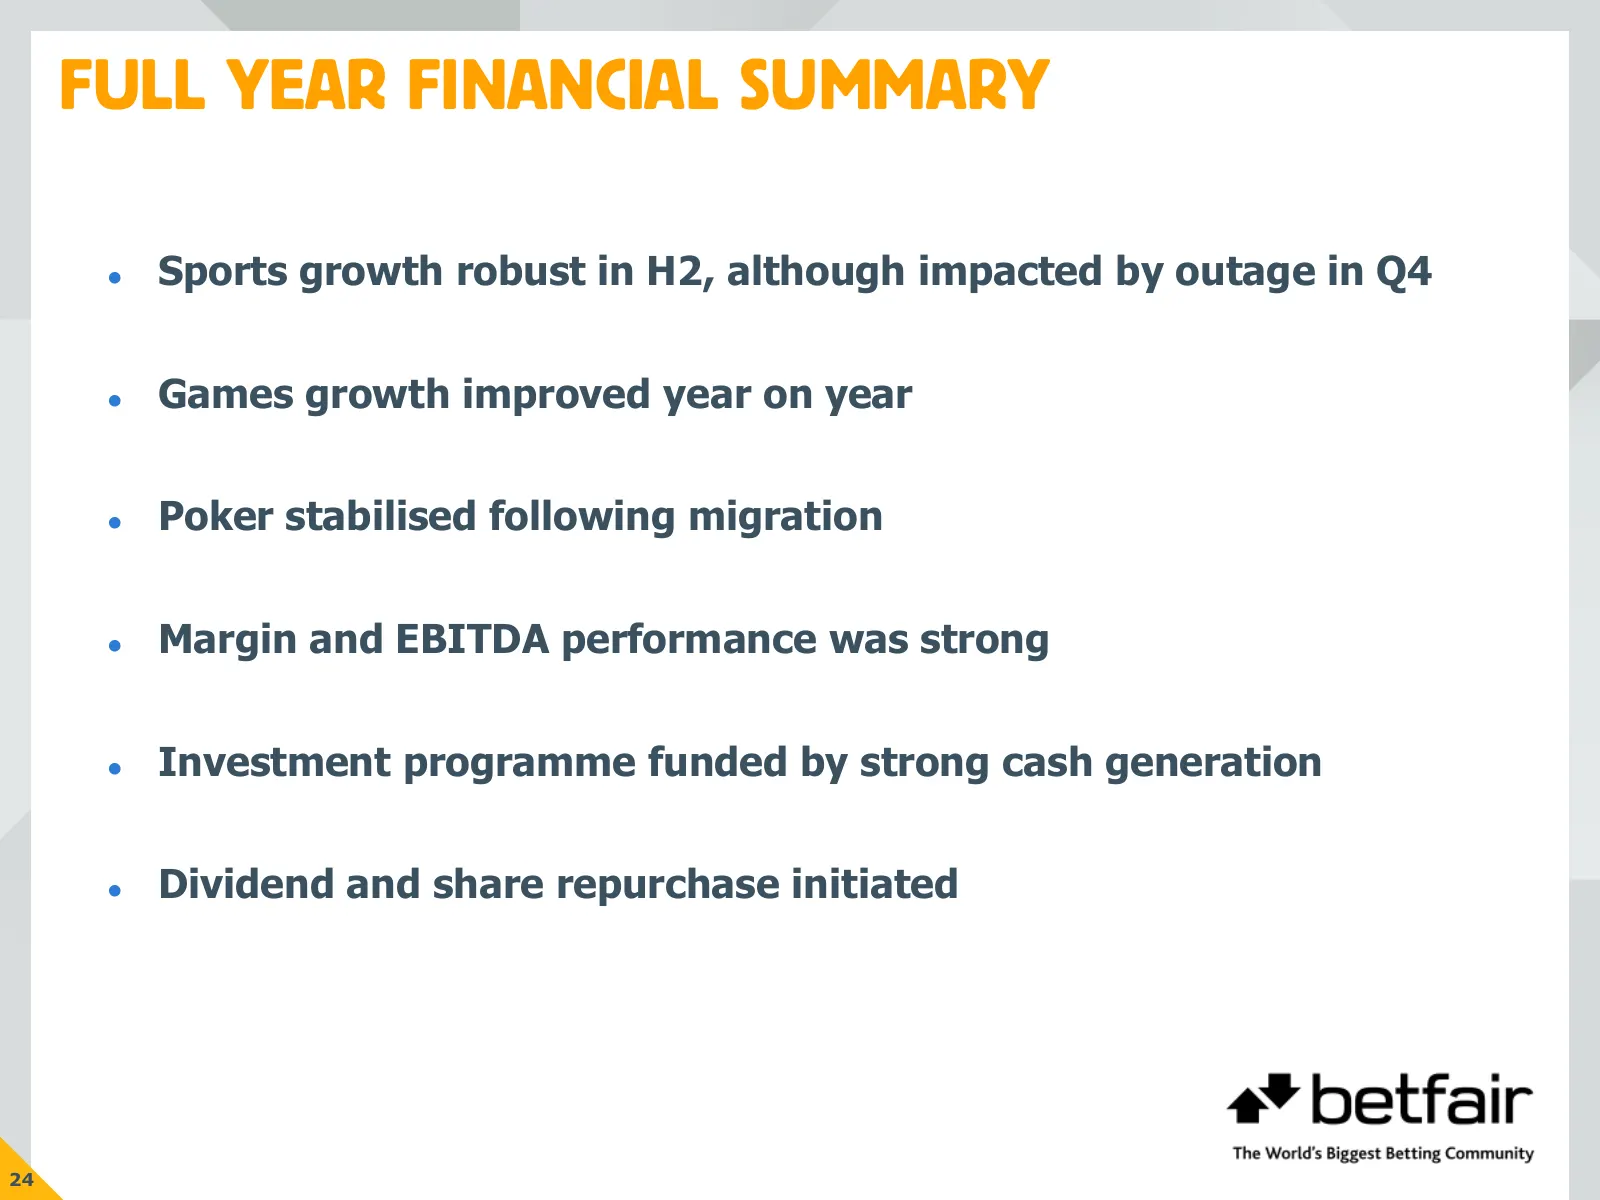
FULL YEAR FINANCIAL SUMMARY Sports growth robust in H2, although impacted by outage in Q4 Games growth improved year on year Poker stabilised following migration Margin and EBITDA performance was strong Investment programme funded by strong cash generation Dividend and share repurchase i
Slide 26: Delivering Shareholder Value
DELIVERING SHAREHOLDER VALUE David Yu – Chief Executive Officer
Slide 27: The Exchange Model Is Better
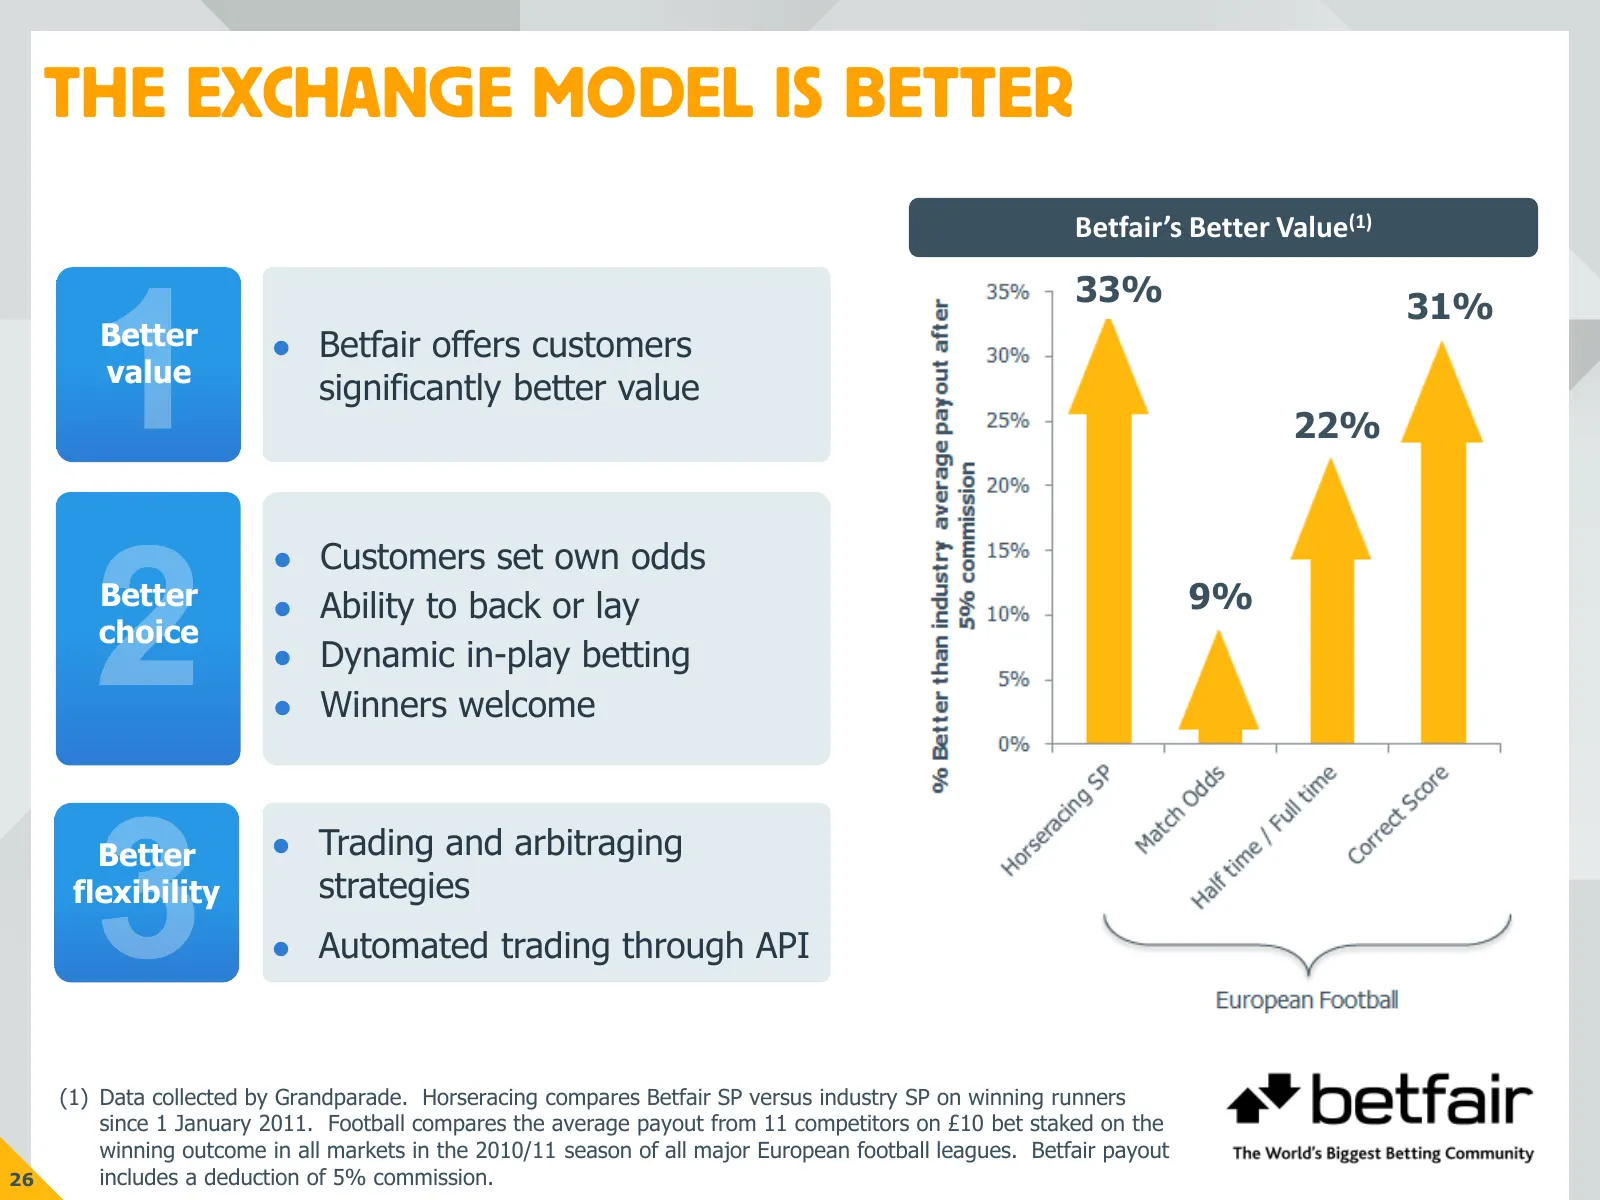
THE EXCHANGE MODEL IS BETTER Betfair’s Better Value(1) 33% 31% Better Betfair offers customers value significantly better value 22% Customers set own odds Better Ability to back or lay 9% choice Dynamic in-play betting Winners welcome Better Trading and arbitraging flexibility strategies
Slide 28: Betfair Customers Remain Very Loyal
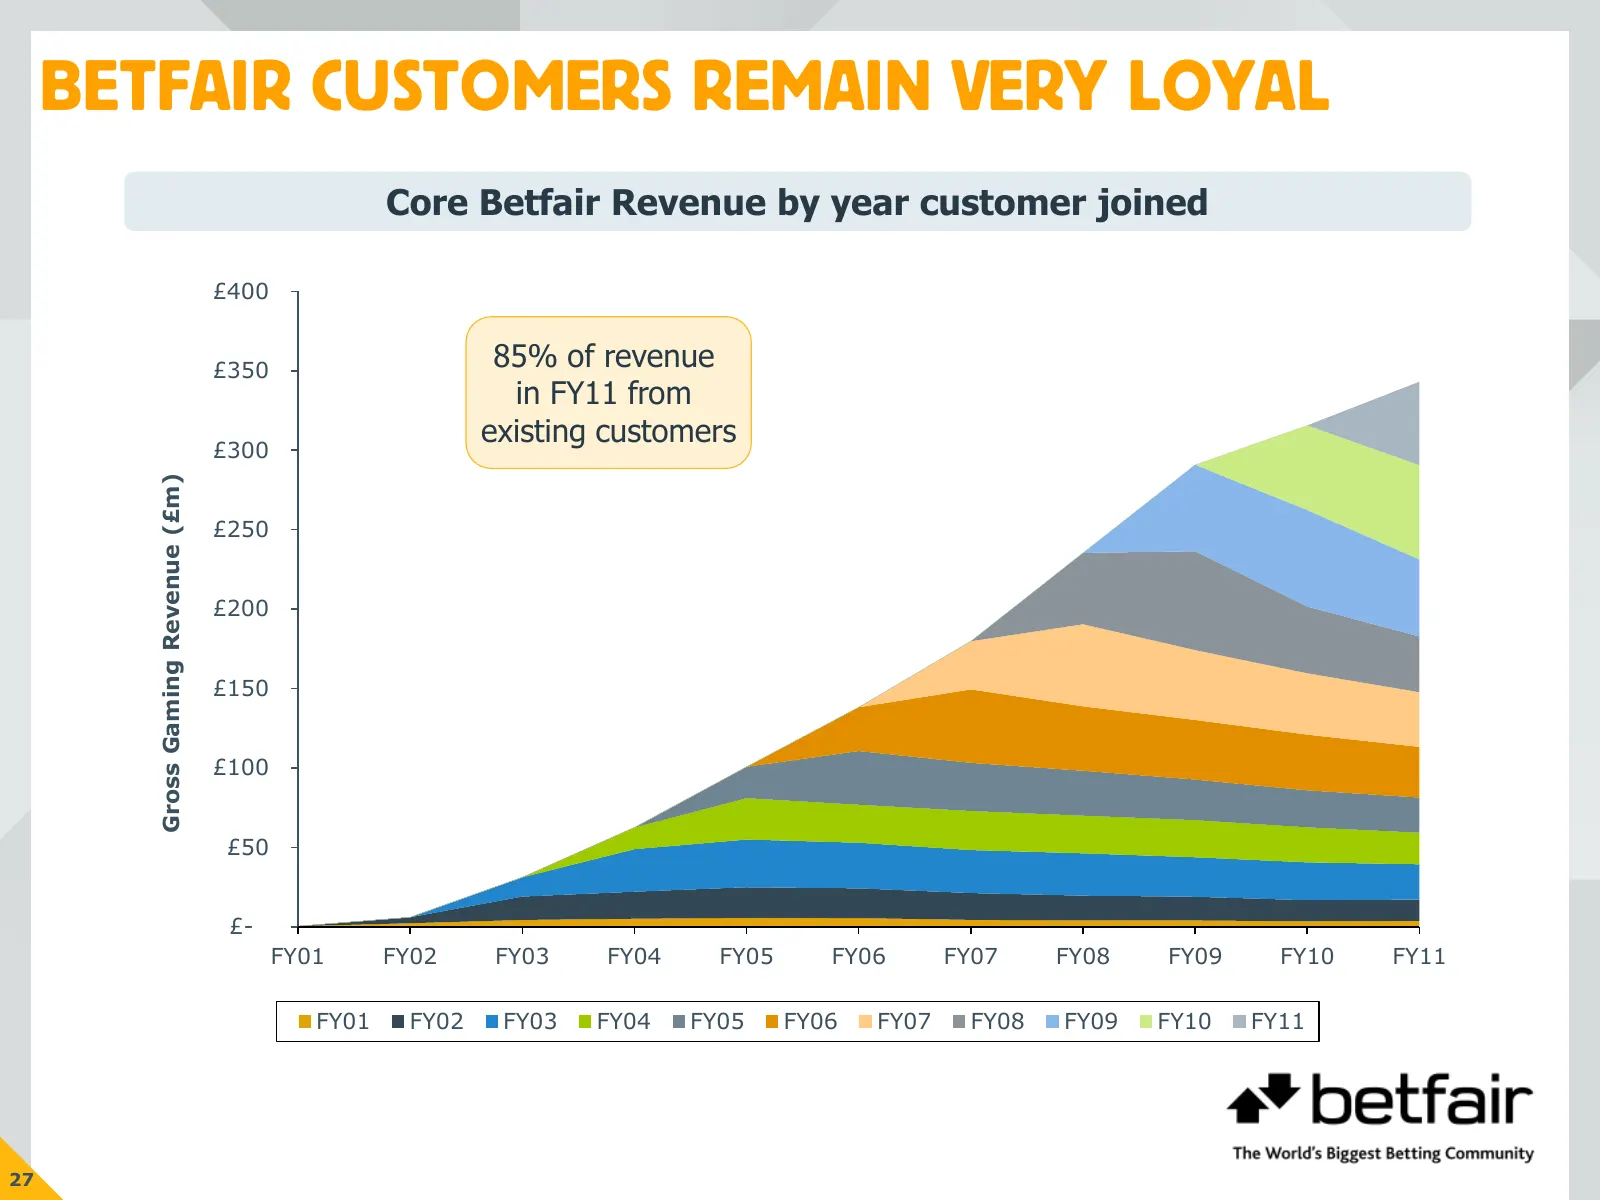
BETFAIR CUSTOMERS REMAIN VERY LOYAL Core Betfair Revenue by year customer joined £400 £350 85% of revenue in FY11 from existing customers £300 Gross Gaming Revenue (£m) £250 £200 £150 £100 £50 £- FY01 FY02 FY03 FY04 FY05 FY06 FY07 FY08 FY09 FY10 FY11 FY01 FY02 FY03 FY04 FY05 FY06 FY07 FY08 FY09 FY10
Slide 29: The Exchange Ecosystem Is Vibrant
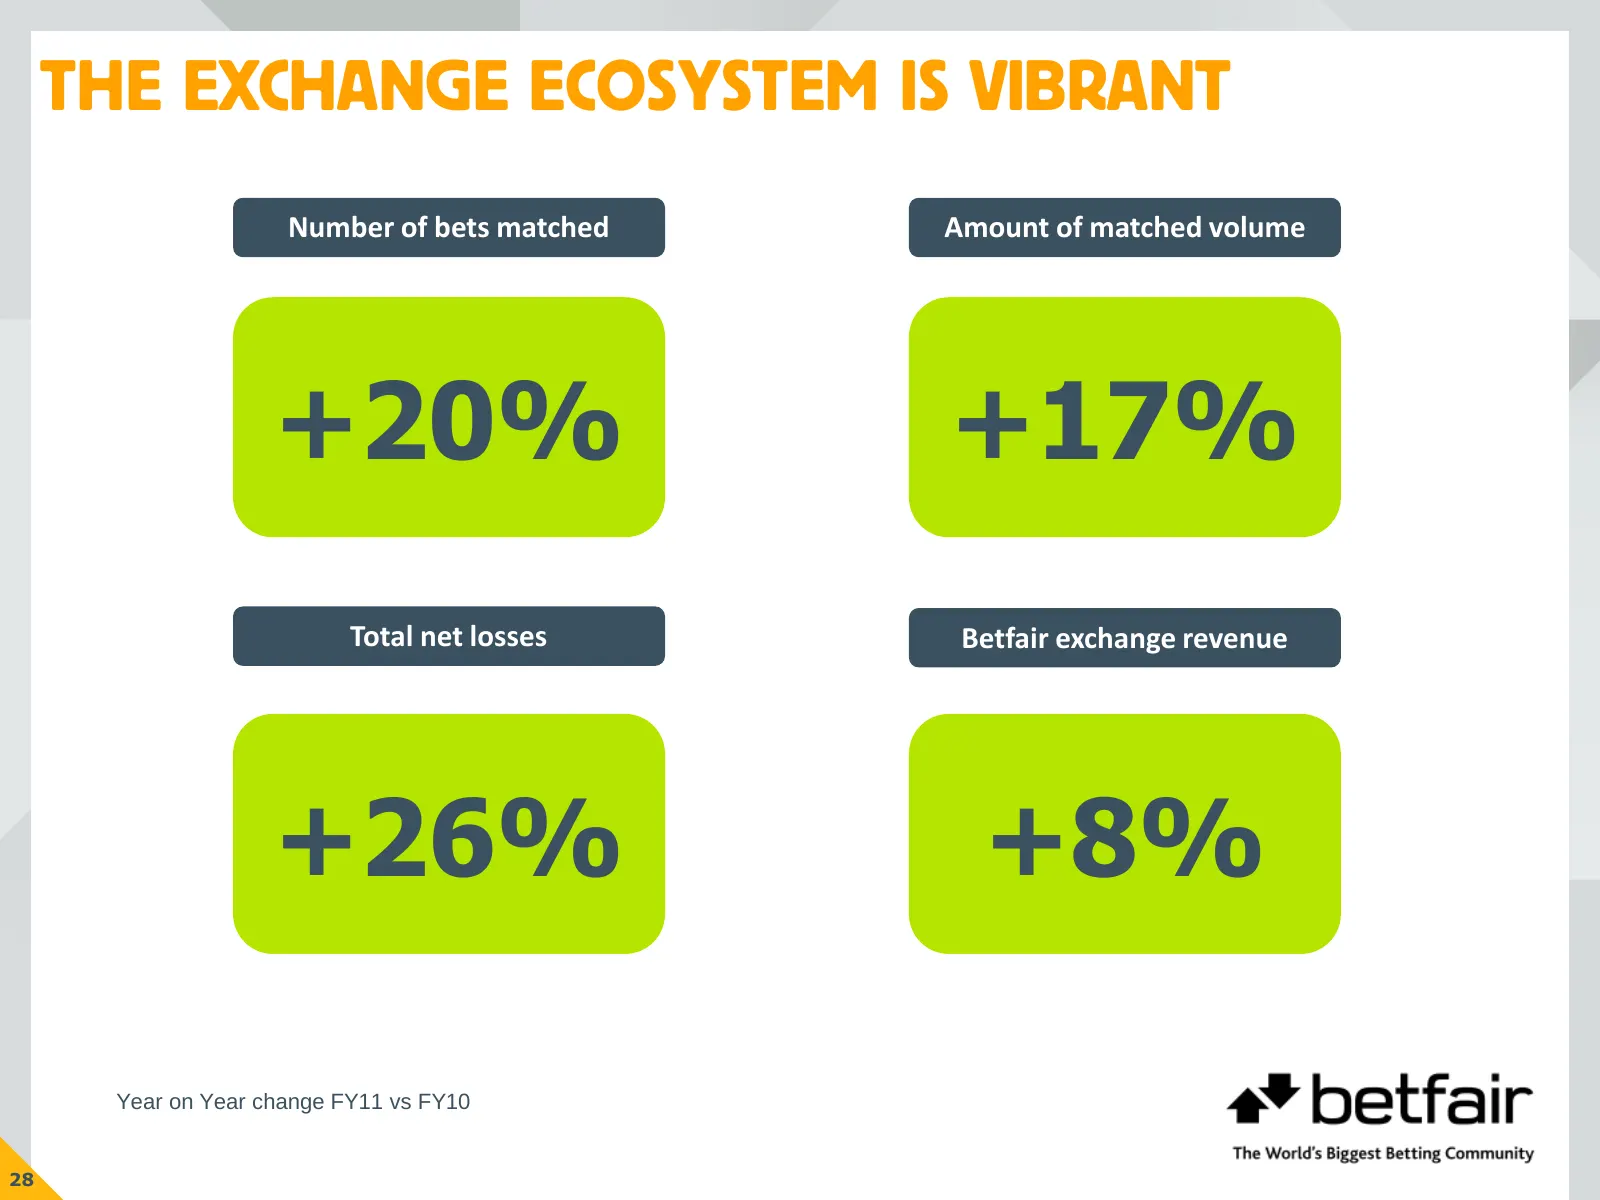
THE EXCHANGE ECOSYSTEM IS VIBRANT Number of bets matched Amount of matched volume +20% +17% Total net losses Betfair exchange revenue +26% +8% Year on Year change FY11 vs FY10 28
Slide 30: Delivering Shareholder Value
DELIVERING SHAREHOLDER VALUE 1 Accelerate growth 2 Deliver further margin improvement 3 Return excess cash to shareholders 29
Slide 31: Accelerating Growth
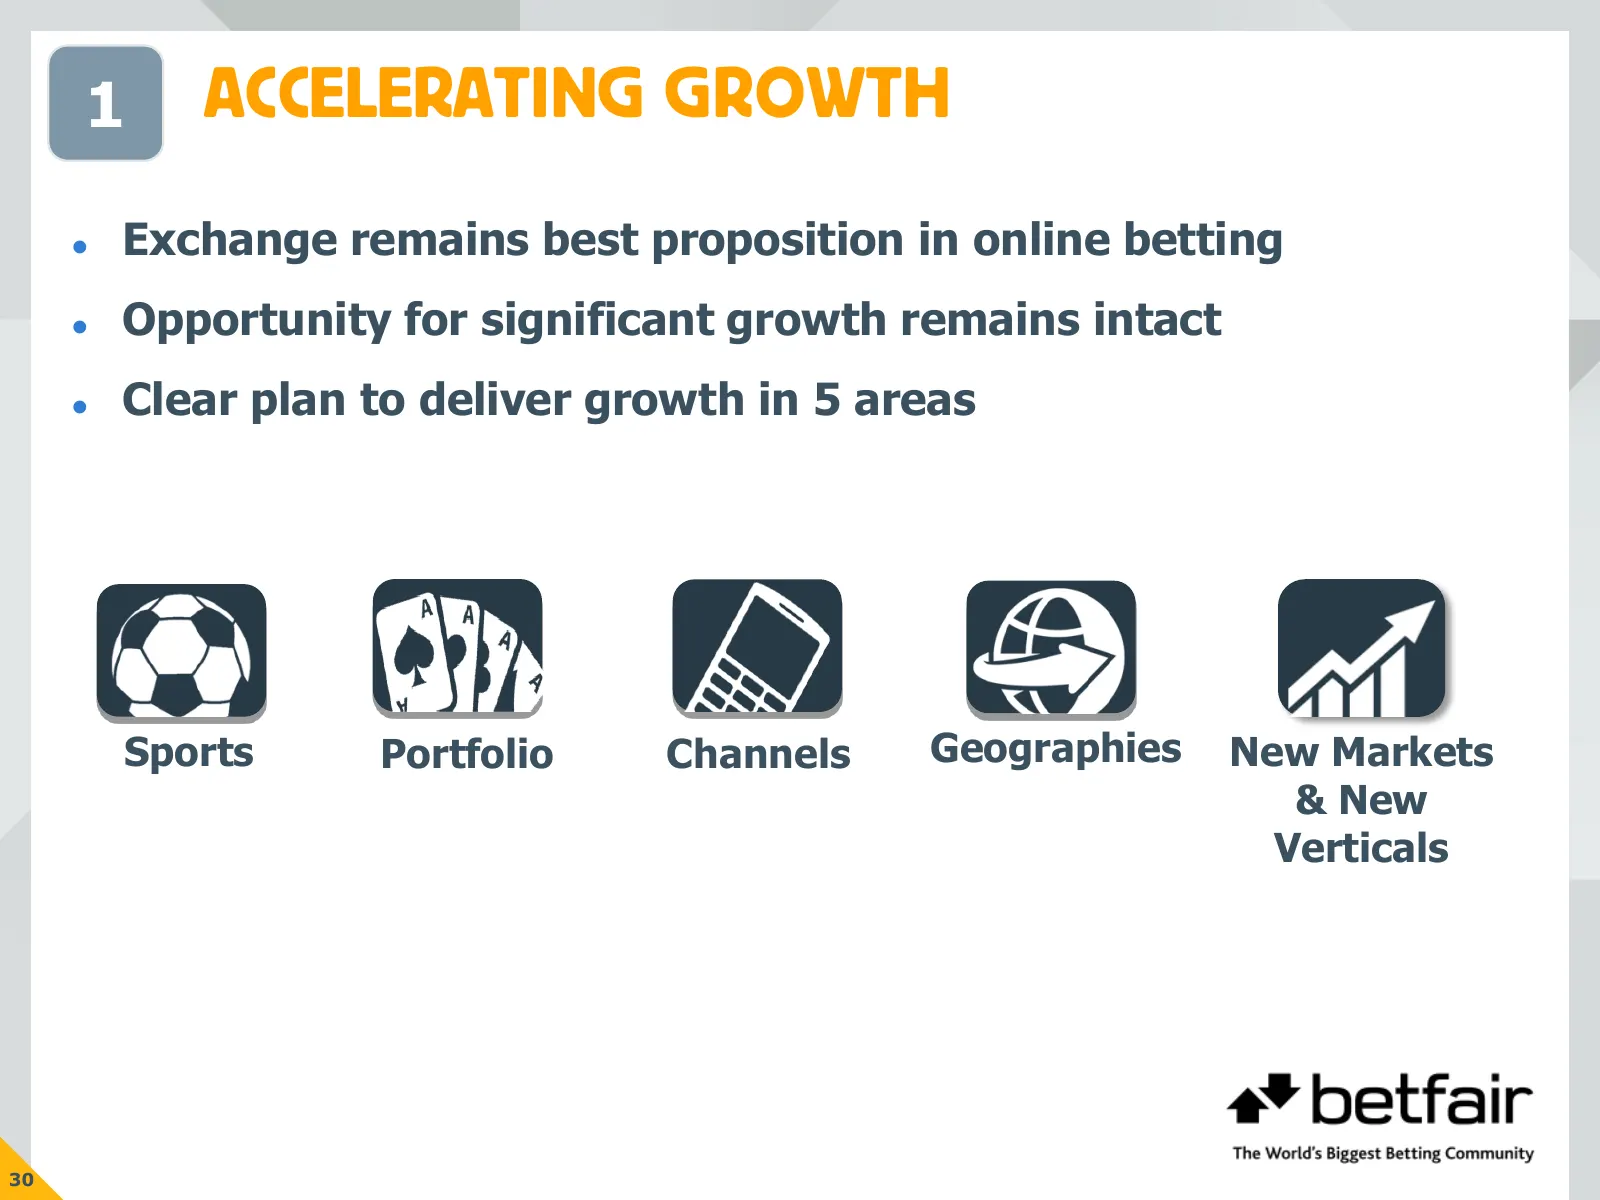
1 ACCELERATING GROWTH Exchange remains best proposition in online betting Opportunity for significant growth remains intact Clear plan to deliver growth in 5 areas Sports Portfolio Channels Geographies New Markets & New Verticals 30
Slide 32: Sports: Growth
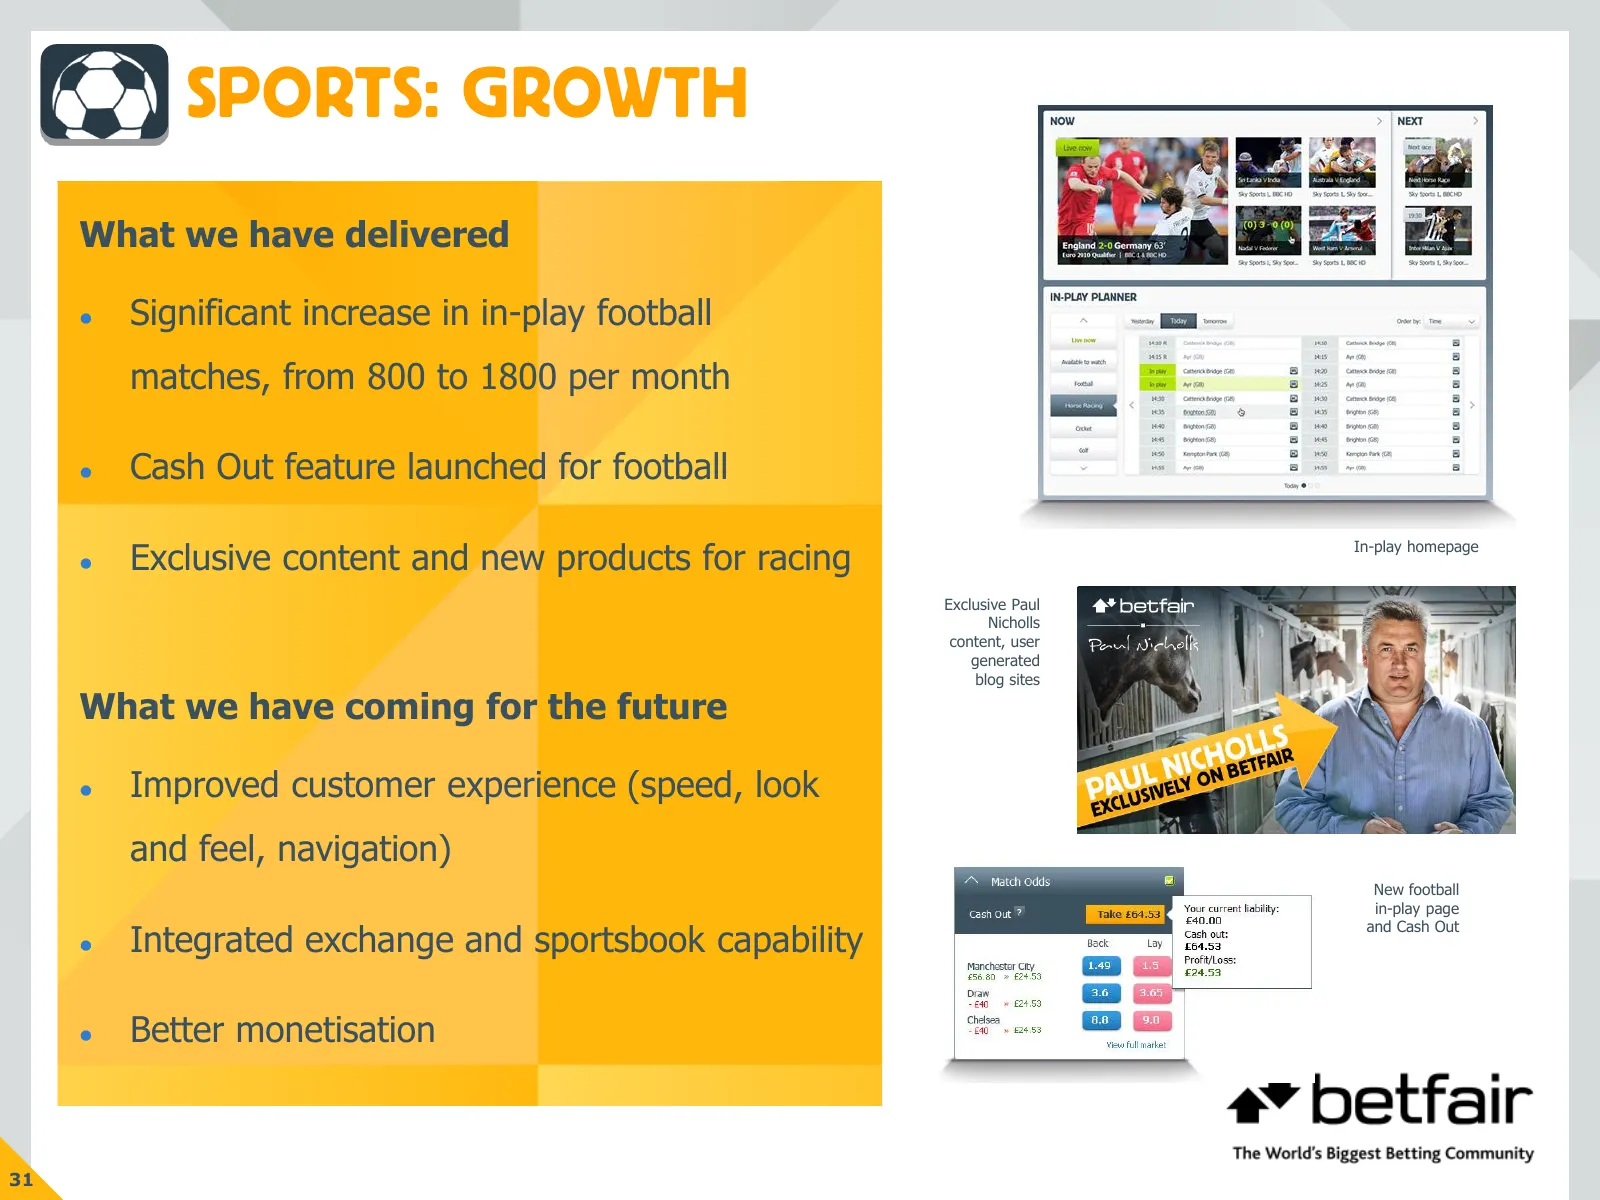
SPORTS: GROWTH What we have delivered Significant increase in in-play football matches, from 800 to 1800 per month Cash Out feature launched for football Exclusive content and new products for racing In-play homepage Exclusive Paul Nicholls content, user generated blog sites What we have comin
Slide 33: Sports: Improved Customer Experience
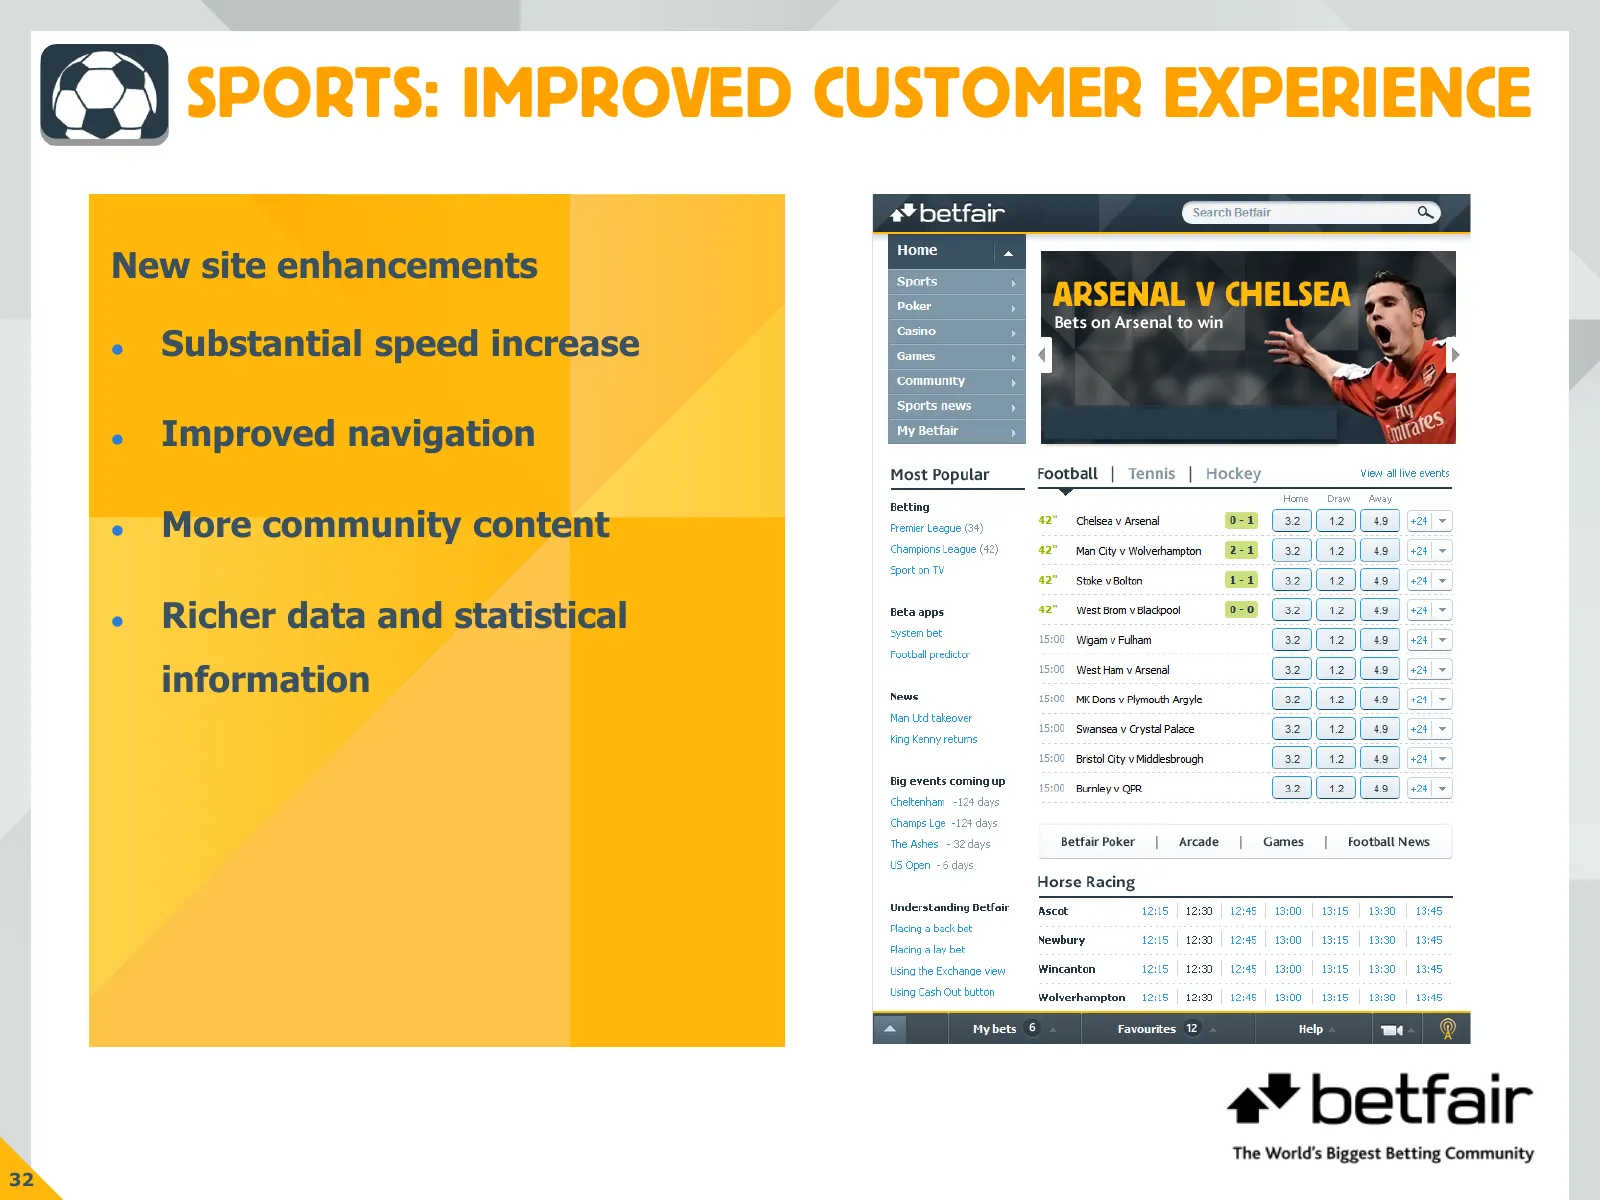
SPORTS: IMPROVED CUSTOMER EXPERIENCE New site enhancements Substantial speed increase Improved navigation More community content Richer data and statistical information 32
Slide 34: Sports: Integrated Exchange & Sportsbook
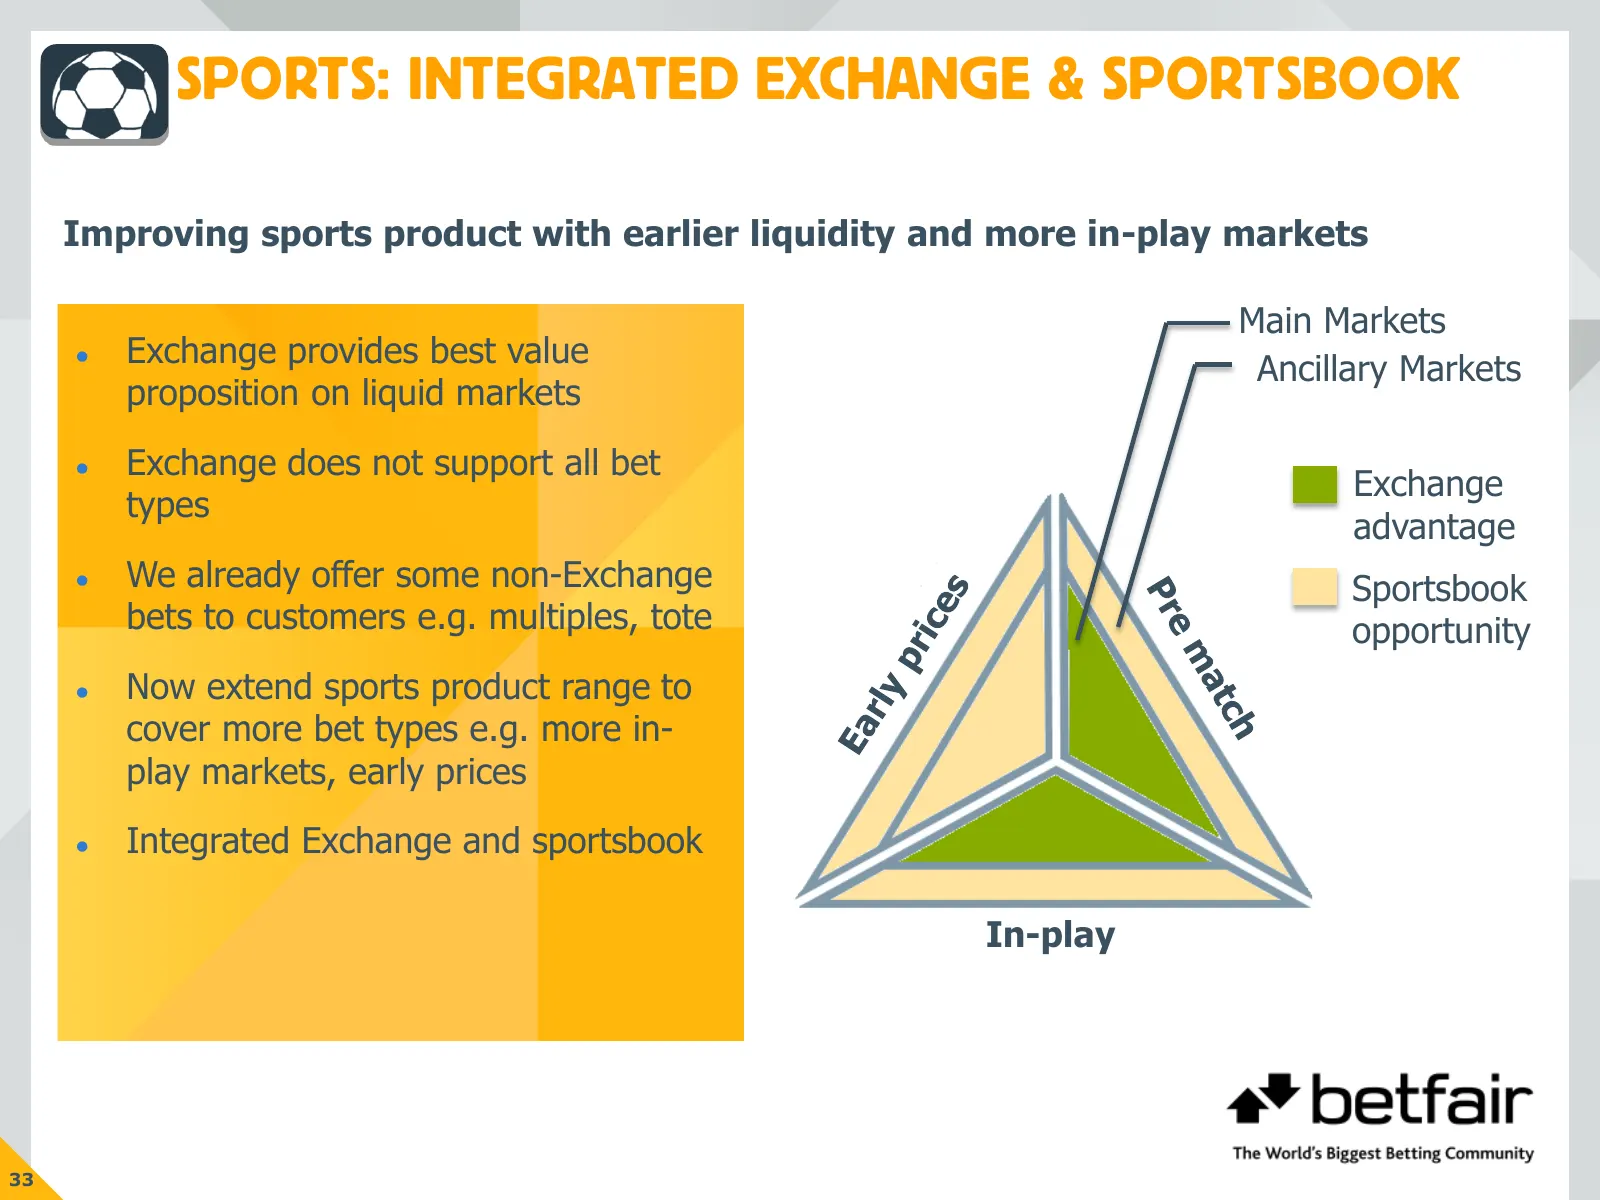
SPORTS: INTEGRATED EXCHANGE & SPORTSBOOK Improving sports product with earlier liquidity and more in-play markets Main Markets Exchange provides best value Ancillary Markets proposition on liquid markets Exchange does not support all bet Exchange types advantage We already offer some non-Excha
Slide 35: Sports: Improving Monetisation
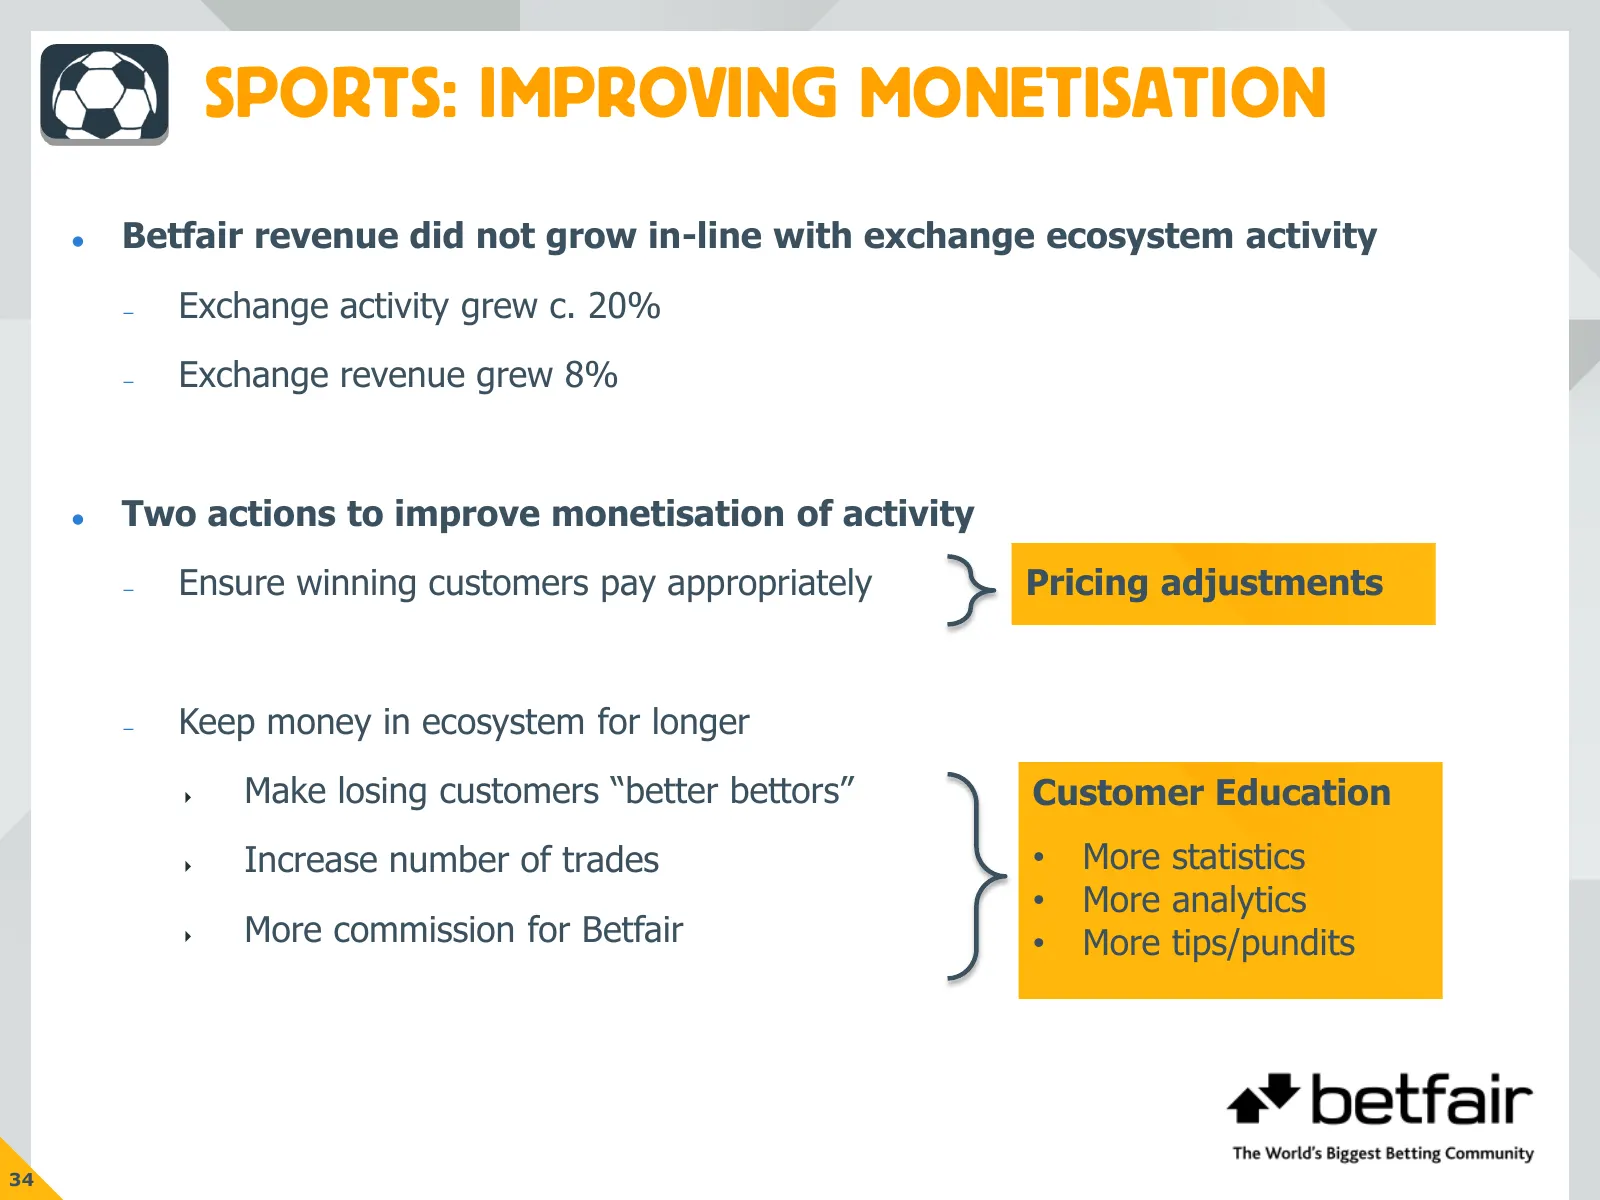
SPORTS: IMPROVING MONETISATION Betfair revenue did not grow in-line with exchange ecosystem activity – Exchange activity grew c. 20% – Exchange revenue grew 8% Two actions to improve monetisation of activity – Ensure winning customers pay appropriately Pricing adjustments – Keep money in ecosyst
Slide 36: Portfolio Growth
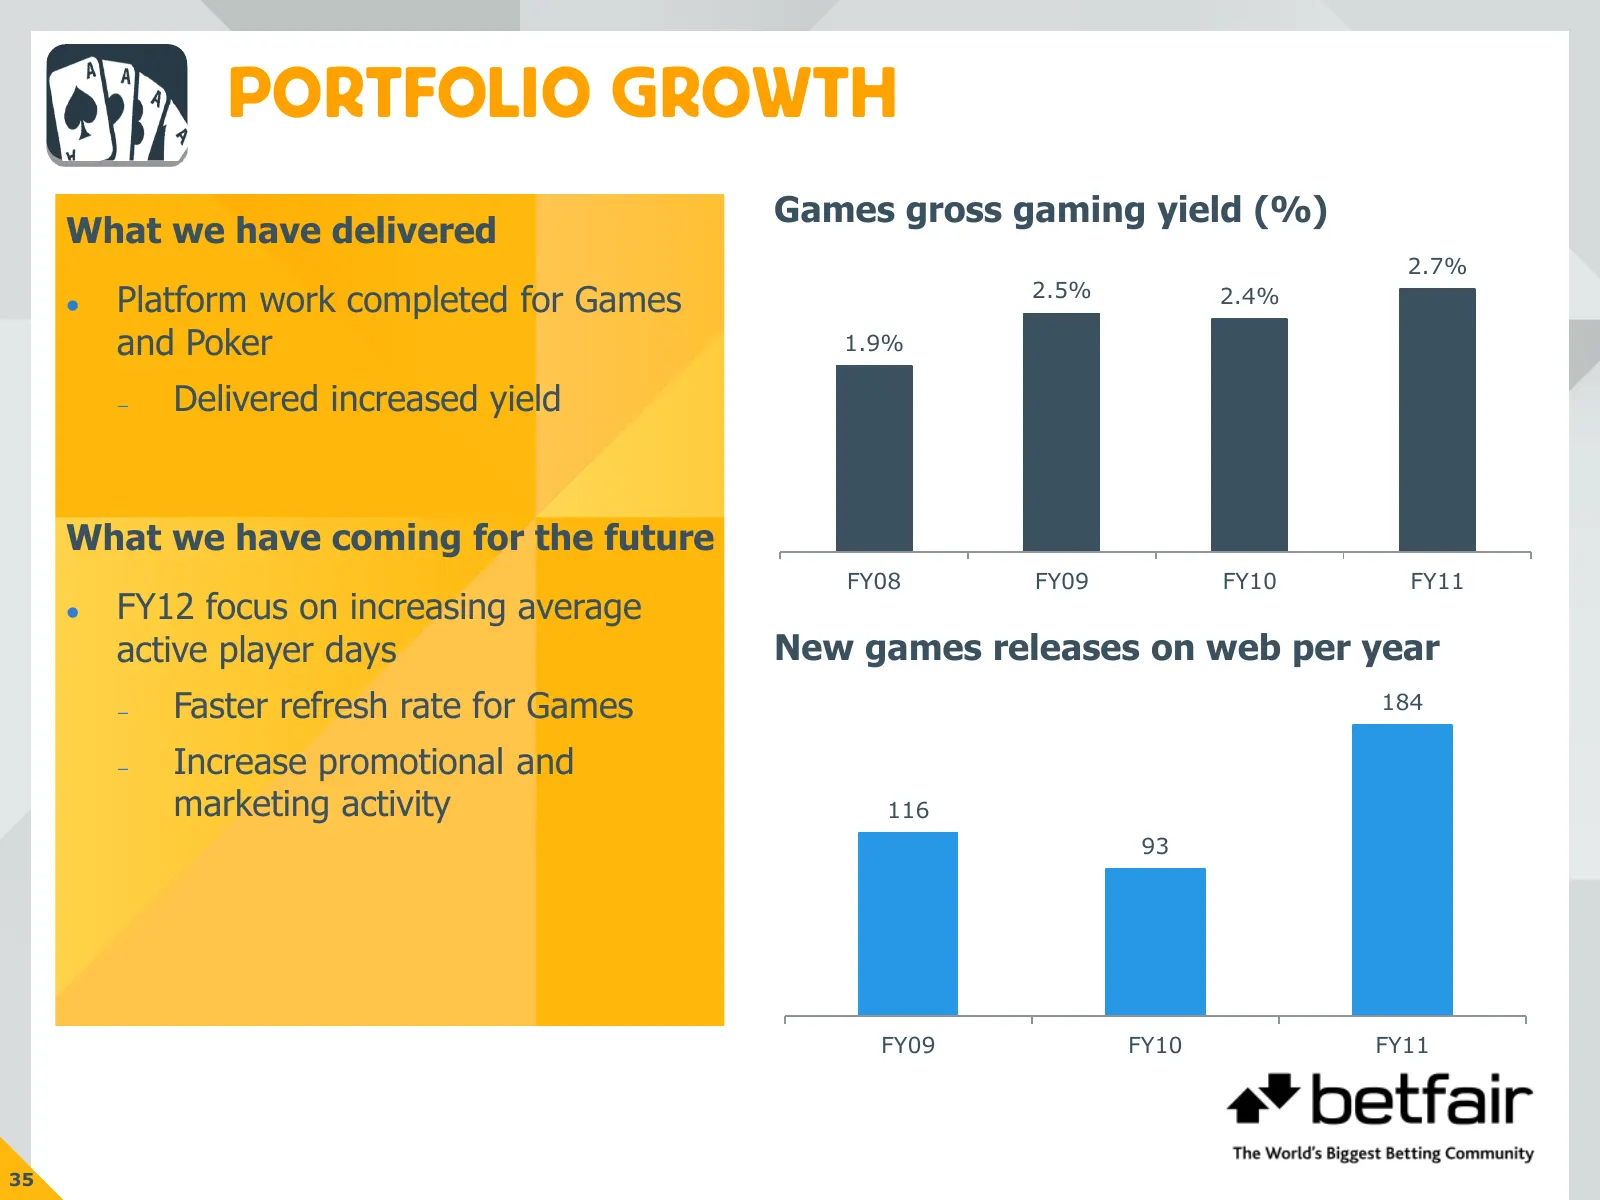
PORTFOLIO GROWTH Games gross gaming yield (%) What we have delivered 2.7% 2.5% Platform work completed for Games 2.4% and Poker 1.9% – Delivered increased yield What we have coming for the future FY08 FY09 FY10 FY11 FY12 focus on increasing average active player days New games releases on web pe
Slide 37: Channels Growth
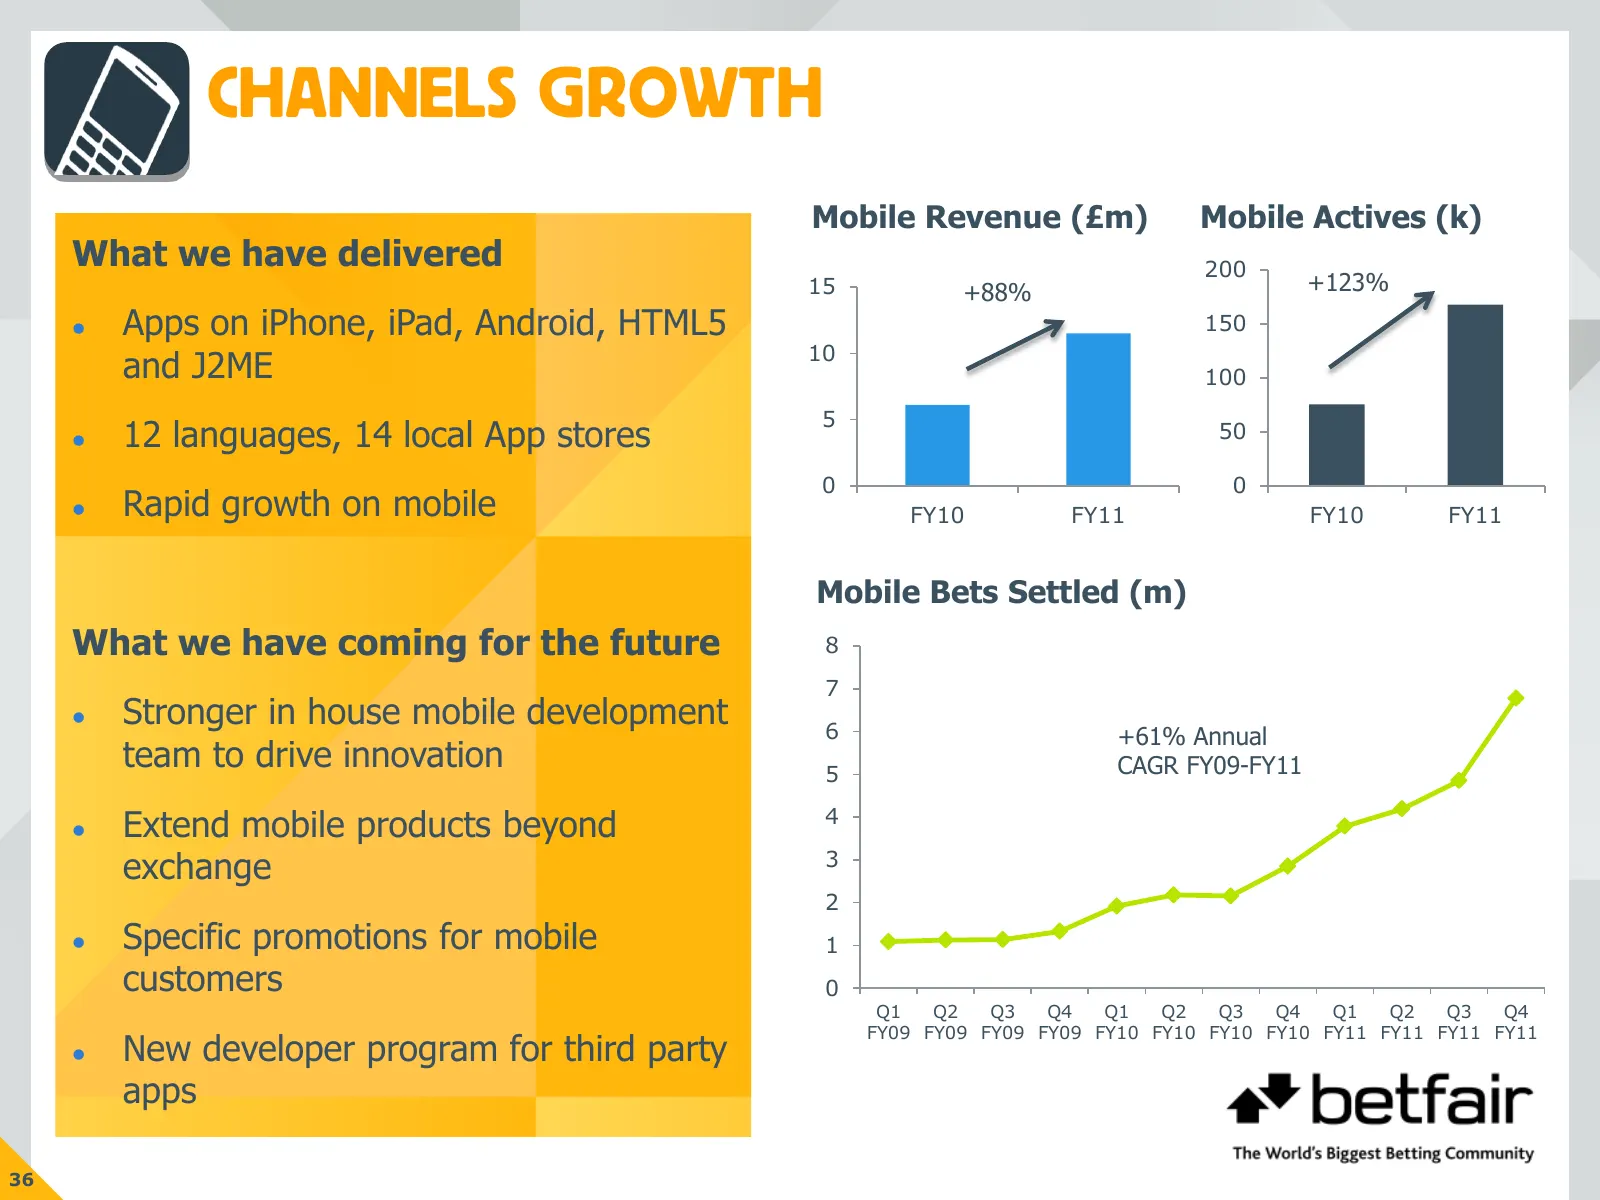
CHANNELS GROWTH Mobile Revenue (£m) Mobile Actives (k) What we have delivered 200 15 +88% +123% Apps on iPhone, iPad, Android, HTML5 150 10 and J2ME 100 5 12 languages, 14 local App stores 50 0 0 Rapid growth on mobile FY10 FY11 FY10 FY11 Mobile Bets Settled (m) What we have coming for the fut
Slide 38: Geographies
GEOGRAPHIES Betfair offers the best products for customers with international appeal Momentum towards regulated environment in Europe Presents risks to business in near-term – Adaptability of exchange enables response to regulatory developments – Additional flexibility through integrated Excha
Slide 39: New Markets: Betfair US
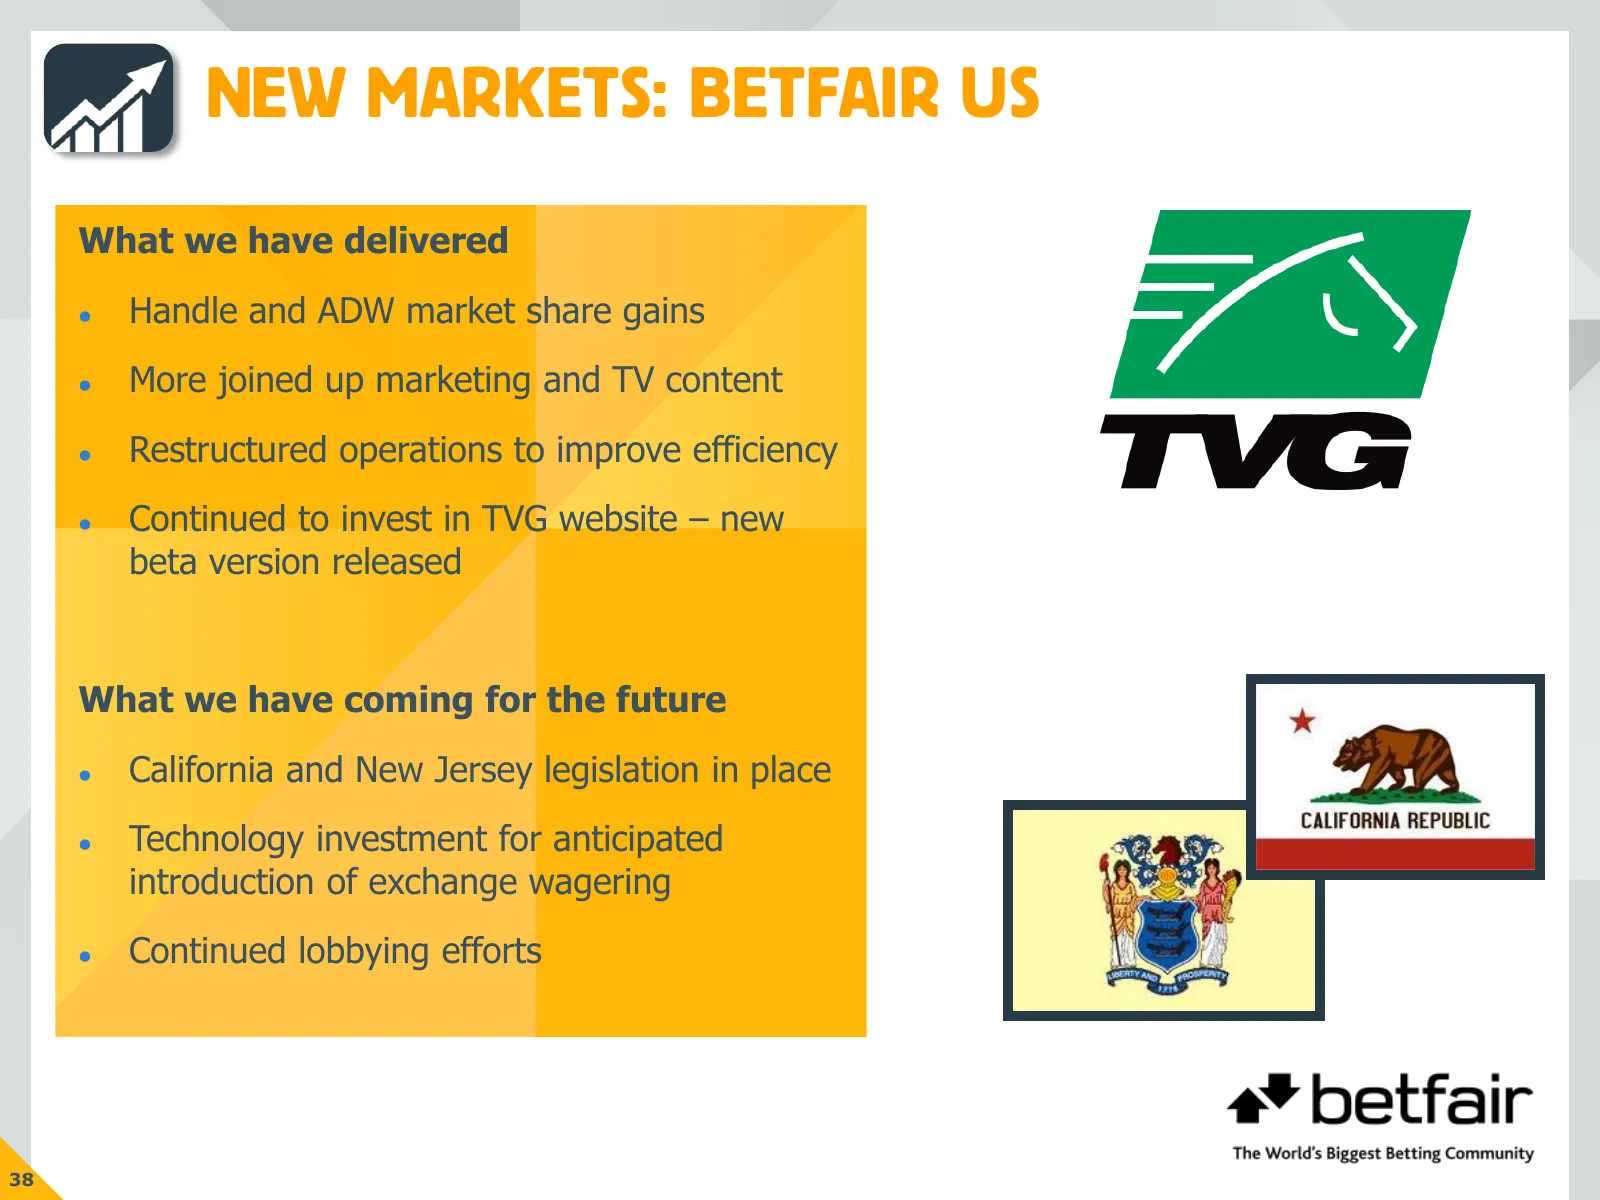
NEW MARKETS: BETFAIR US What we have delivered Handle and ADW market share gains More joined up marketing and TV content Restructured operations to improve efficiency Continued to invest in TVG website – new beta version released What we have coming for the future California and New Jersey
Slide 40: New Verticals: LMAX
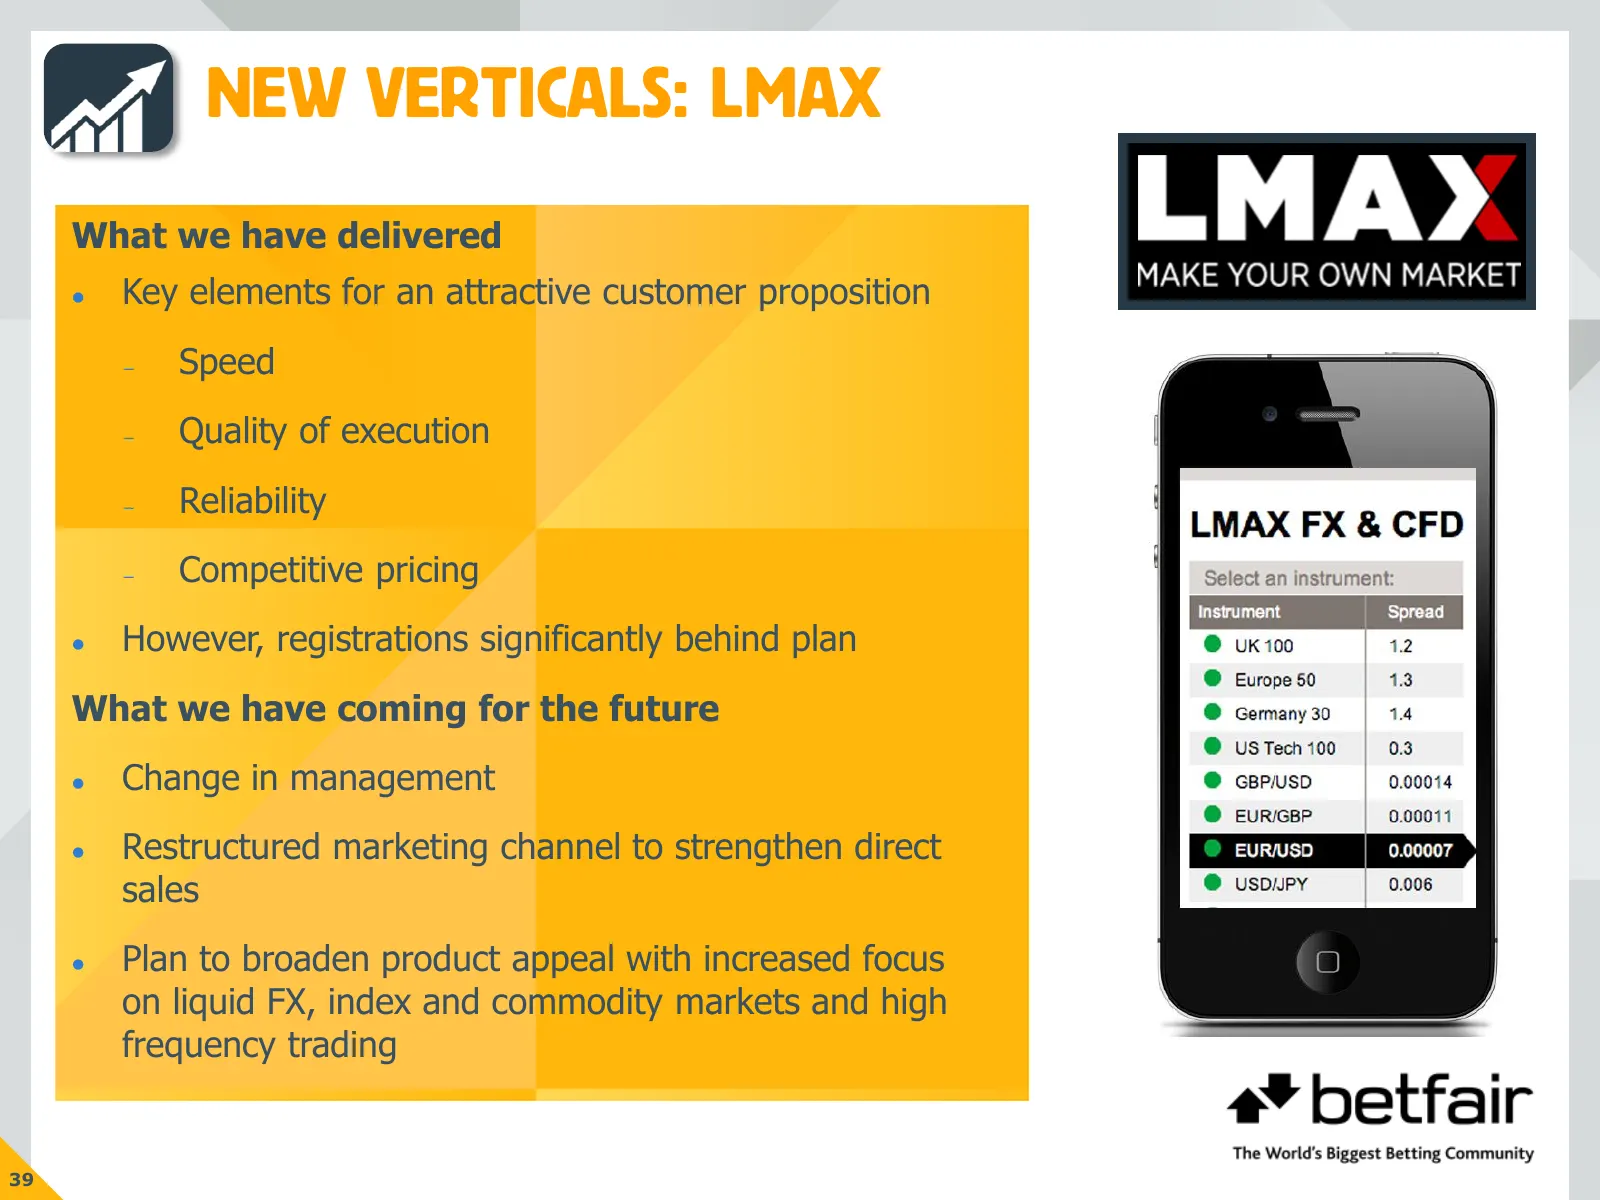
NEW VERTICALS: LMAX What we have delivered Key elements for an attractive customer proposition – Speed – Quality of execution – Reliability – Competitive pricing However, registrations significantly behind plan What we have coming for the future Change in management Restructured marketing ch
Slide 41: Margin Improvements
2 MARGIN IMPROVEMENTS Significant margin improvement in FY11 – Adjusted EBITDA in Core Betfair of increased to 24.3% (FY10: 20.3%) Focused programmes to deliver further margin improvement – High value customer focus – Pricing adjustments – Marketing and operations efficiencies – Technology re-ar
Slide 42: Management Team
MANAGEMENT TEAM Taken steps to strengthen the management team Senior appointments in key areas of the business: – Technology – Marketing – Mobile Ian Chuter joined the executive board as Group Operations Director – 30 years of industry experience 41
Slide 43: Current Trading and Outlook
CURRENT TRADING AND OUTLOOK Current Trading (first 8 weeks) – Non-risk Sport, Games, Poker in line with our expectations – Risk Sport below expectation due to adverse margin in May – As anticipated, year to date revenue is lower than the prior year due to the strong comparable period (World Cup, p
Slide 44: Delivering Shareholder Value
DELIVERING SHAREHOLDER VALUE 1 Accelerate growth Clear plan to deliver growth in five areas 2 Deliver further margin improvement Specific programmes to drive efficiency 3 Return excess cash to shareholders Dividend and share repurchase 43

Slide 45: Betfair: The World's Biggest Betting Community
a* betfair The World's Biggest Betting Community

Slide 46: Appendices
APPENDICES a* betfair The World's Biggest Betting Community
Slide 47: Appendices
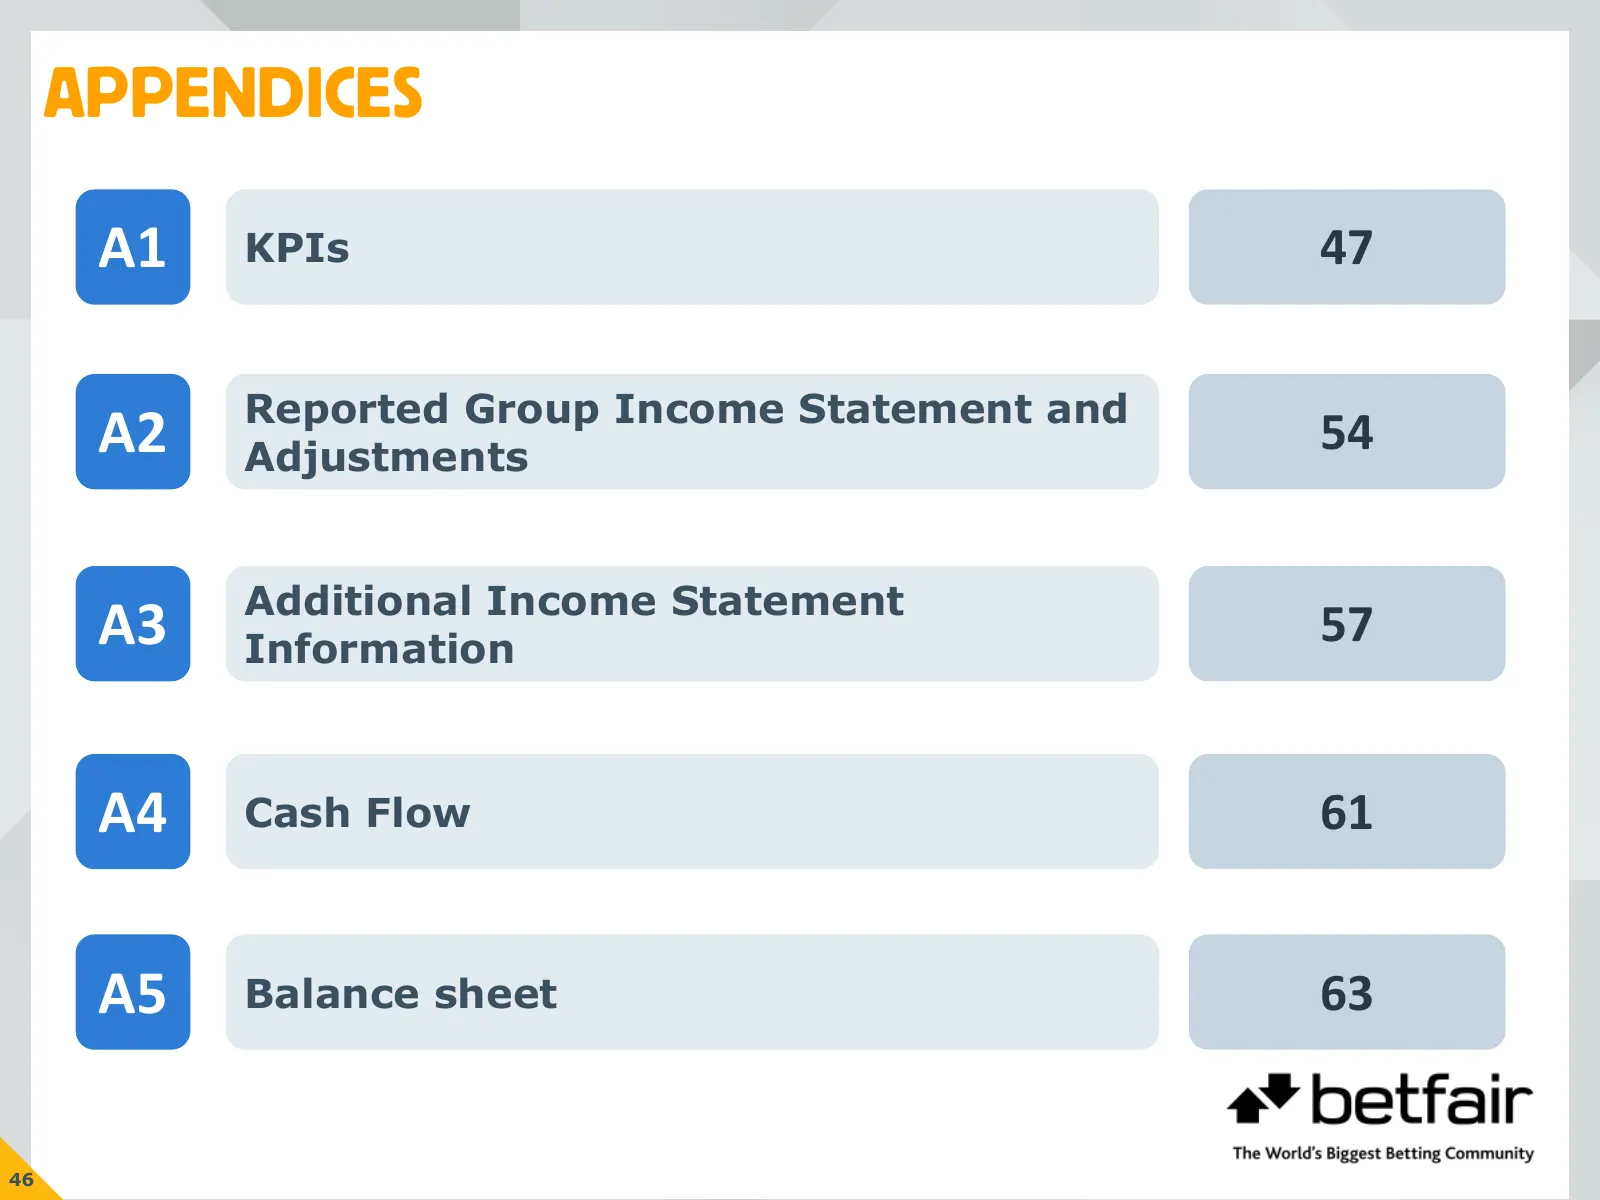
APPENDICES A1 KPIs 47 Reported Group Income Statement and A2 Adjustments 54 Additional Income Statement A3 Information 57 A4 Cash Flow 61 A5 Balance sheet 63 46

Slide 48: A1: KPIs
A1: KPls a* betfair The World's Biggest Betting Community
Slide 49: A1: KPIs – By Product, By Year
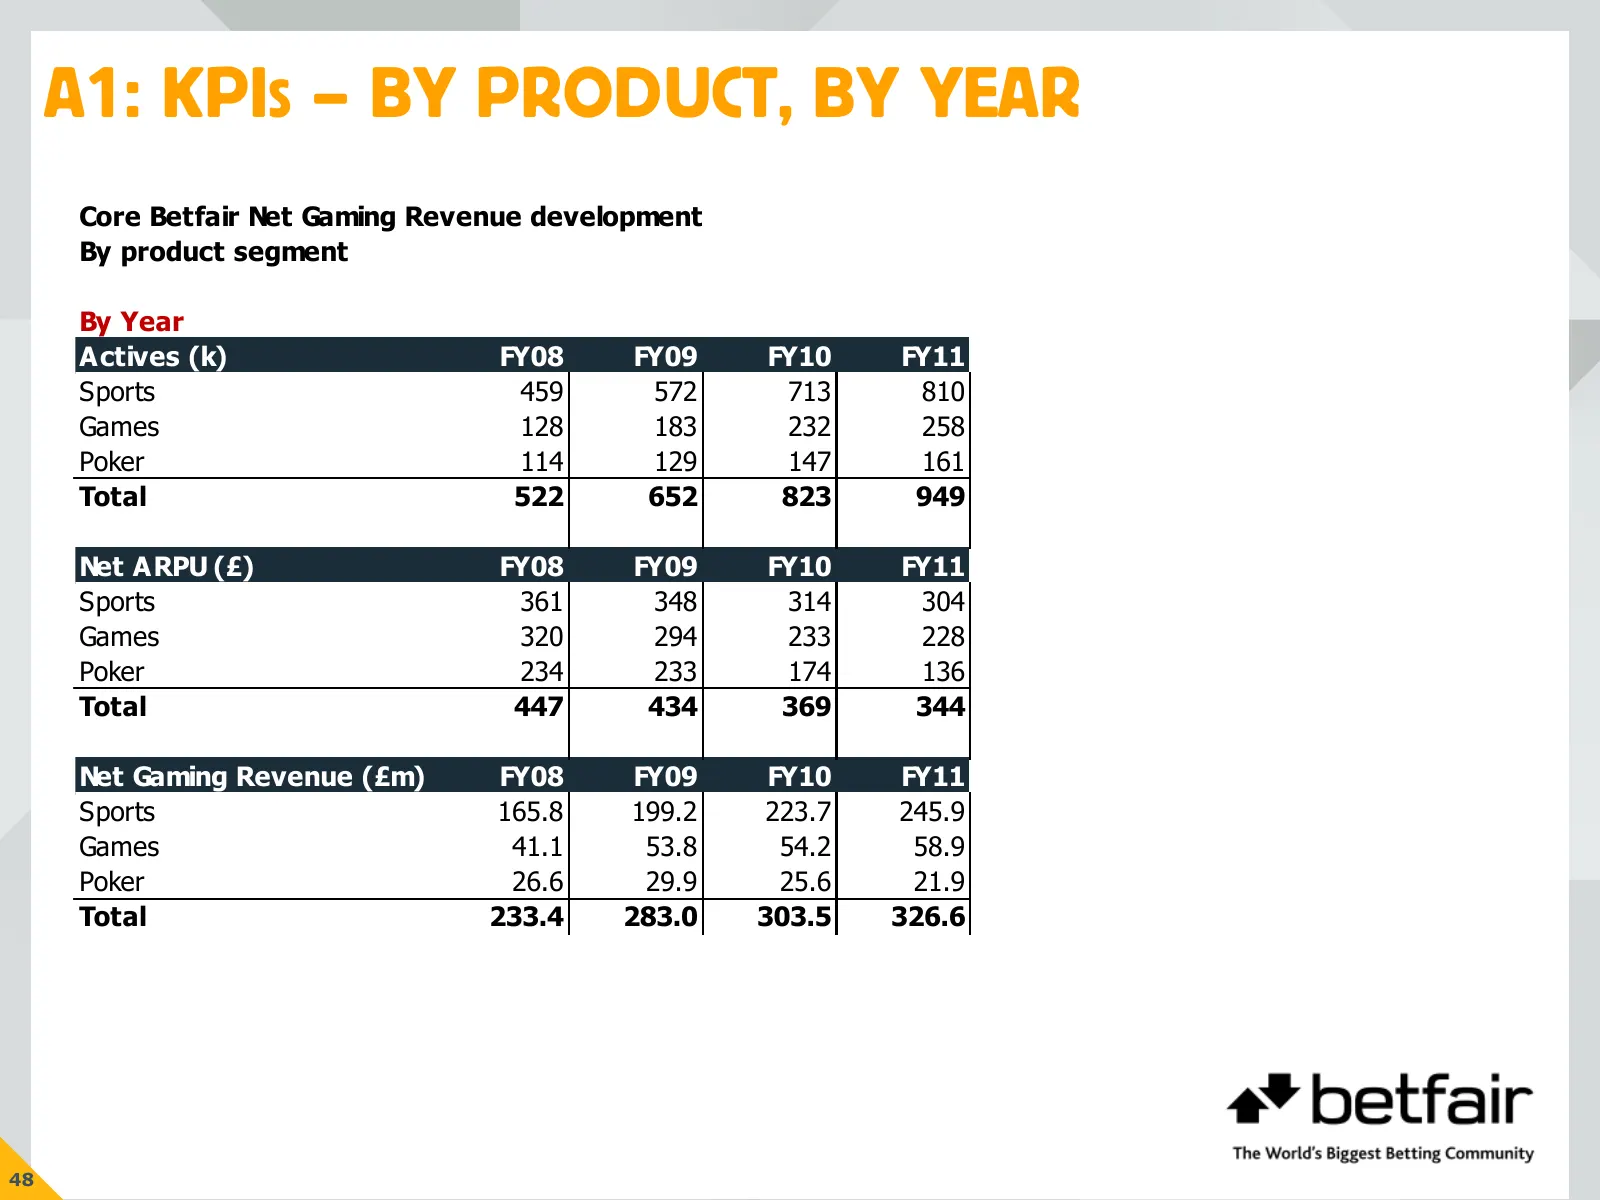
A1: KPIS – BY PRODUCT, BY YEAR Core Betfair Net Gaming Revenue development By product segment By Year Actives (k) FY08 FY09 FY10 FY11 Sports 459 572 713 810 Games 128 183 232 258 Poker 114 129 147 161 Total 522 652 823 949 Net ARPU (£) FY08 FY09 FY10 FY11 Sports 361 348 314 304 Games 320 294 233 228
Slide 50: A1: KPIs – By Product, By Half Year
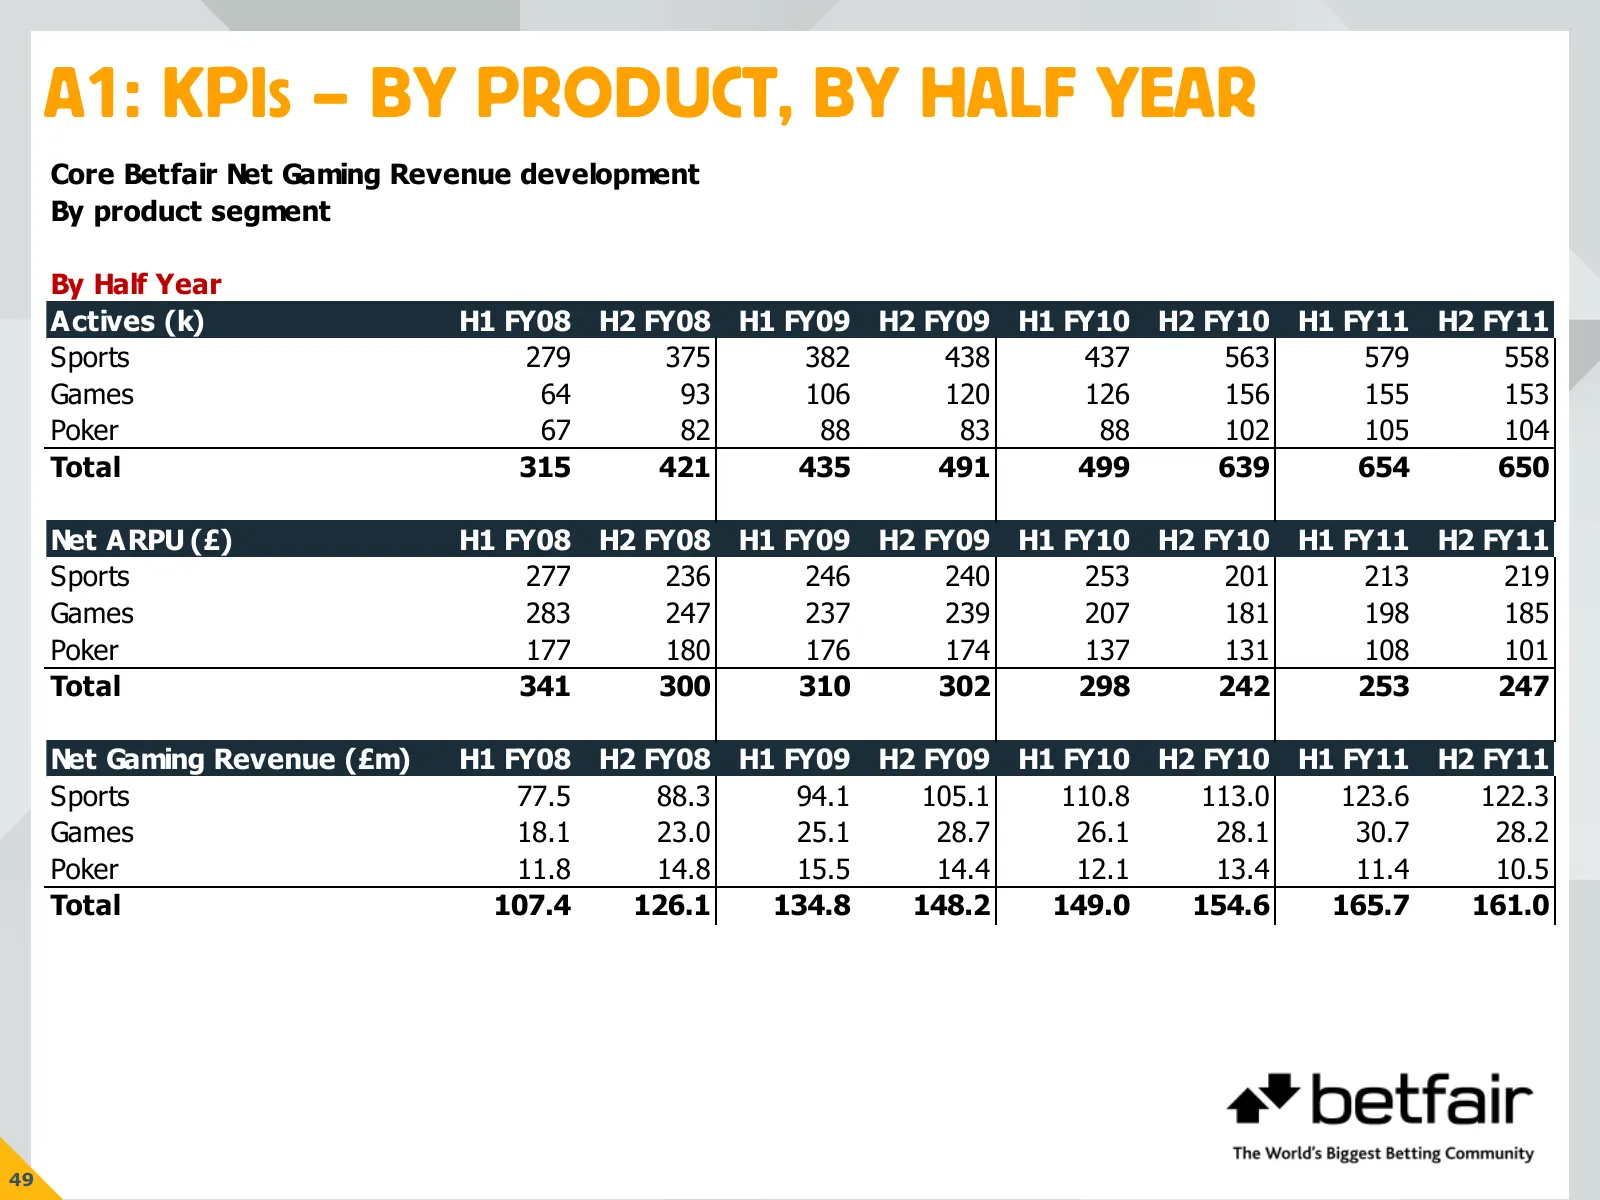
A1: KPIS – BY PRODUCT, BY HALF YEAR Core Betfair Net Gaming Revenue development By product segment By Half Year Actives (k) H1 FY08 H2 FY08 H1 FY09 H2 FY09 H1 FY10 H2 FY10 H1 FY11 H2 FY11 Sports 279 375 382 438 437 563 579 558 Games 64 93 106 120 126 156 155 153 Poker 67 82 88 83 88 102 105 104 Tota
Slide 51: A1: KPIs – By Product, By Quarter
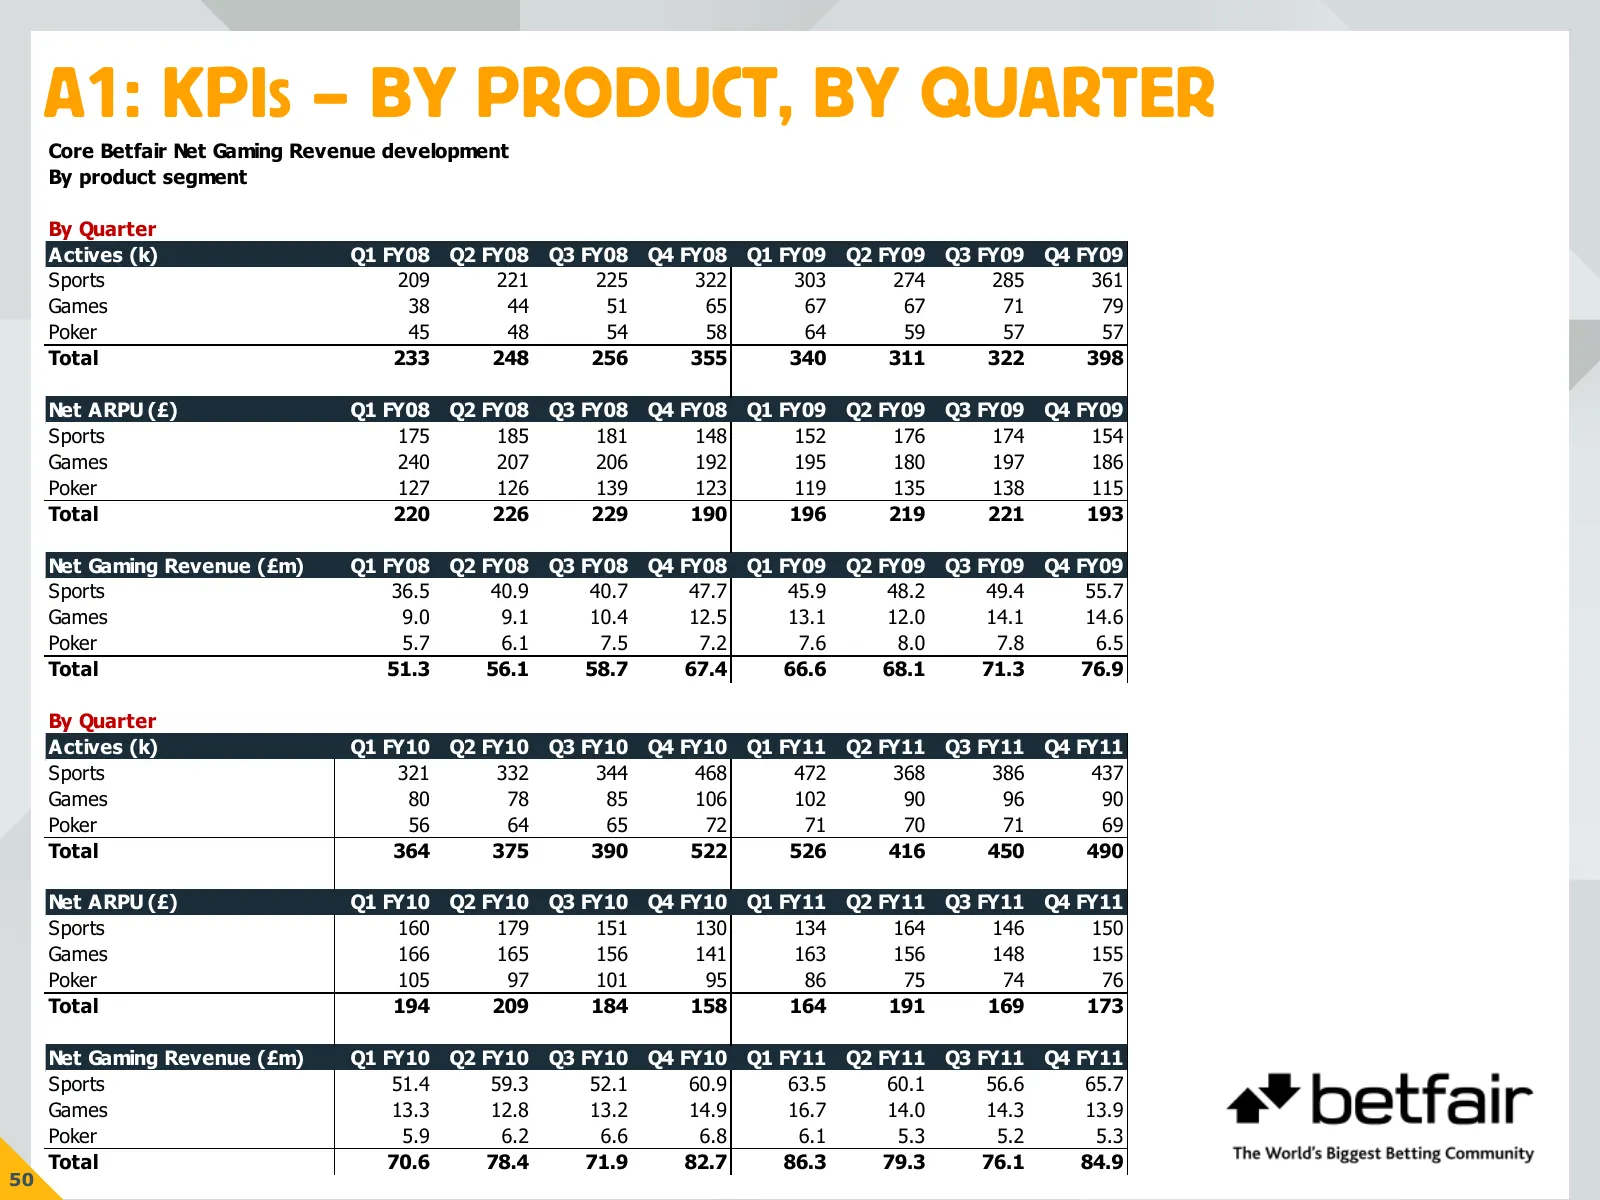
A1: KPIS – BY PRODUCT, BY QUARTER Core Betfair Net Gaming Revenue development By product segment By Quarter Actives (k) Q1 FY08 Q2 FY08 Q3 FY08 Q4 FY08 Q1 FY09 Q2 FY09 Q3 FY09 Q4 FY09 Sports 209 221 225 322 303 274 285 361 Games 38 44 51 65 67 67 71 79 Poker 45 48 54 58 64 59 57 57 Total 233 248 256
Slide 52: A1: KPIs – By Geography, By Year
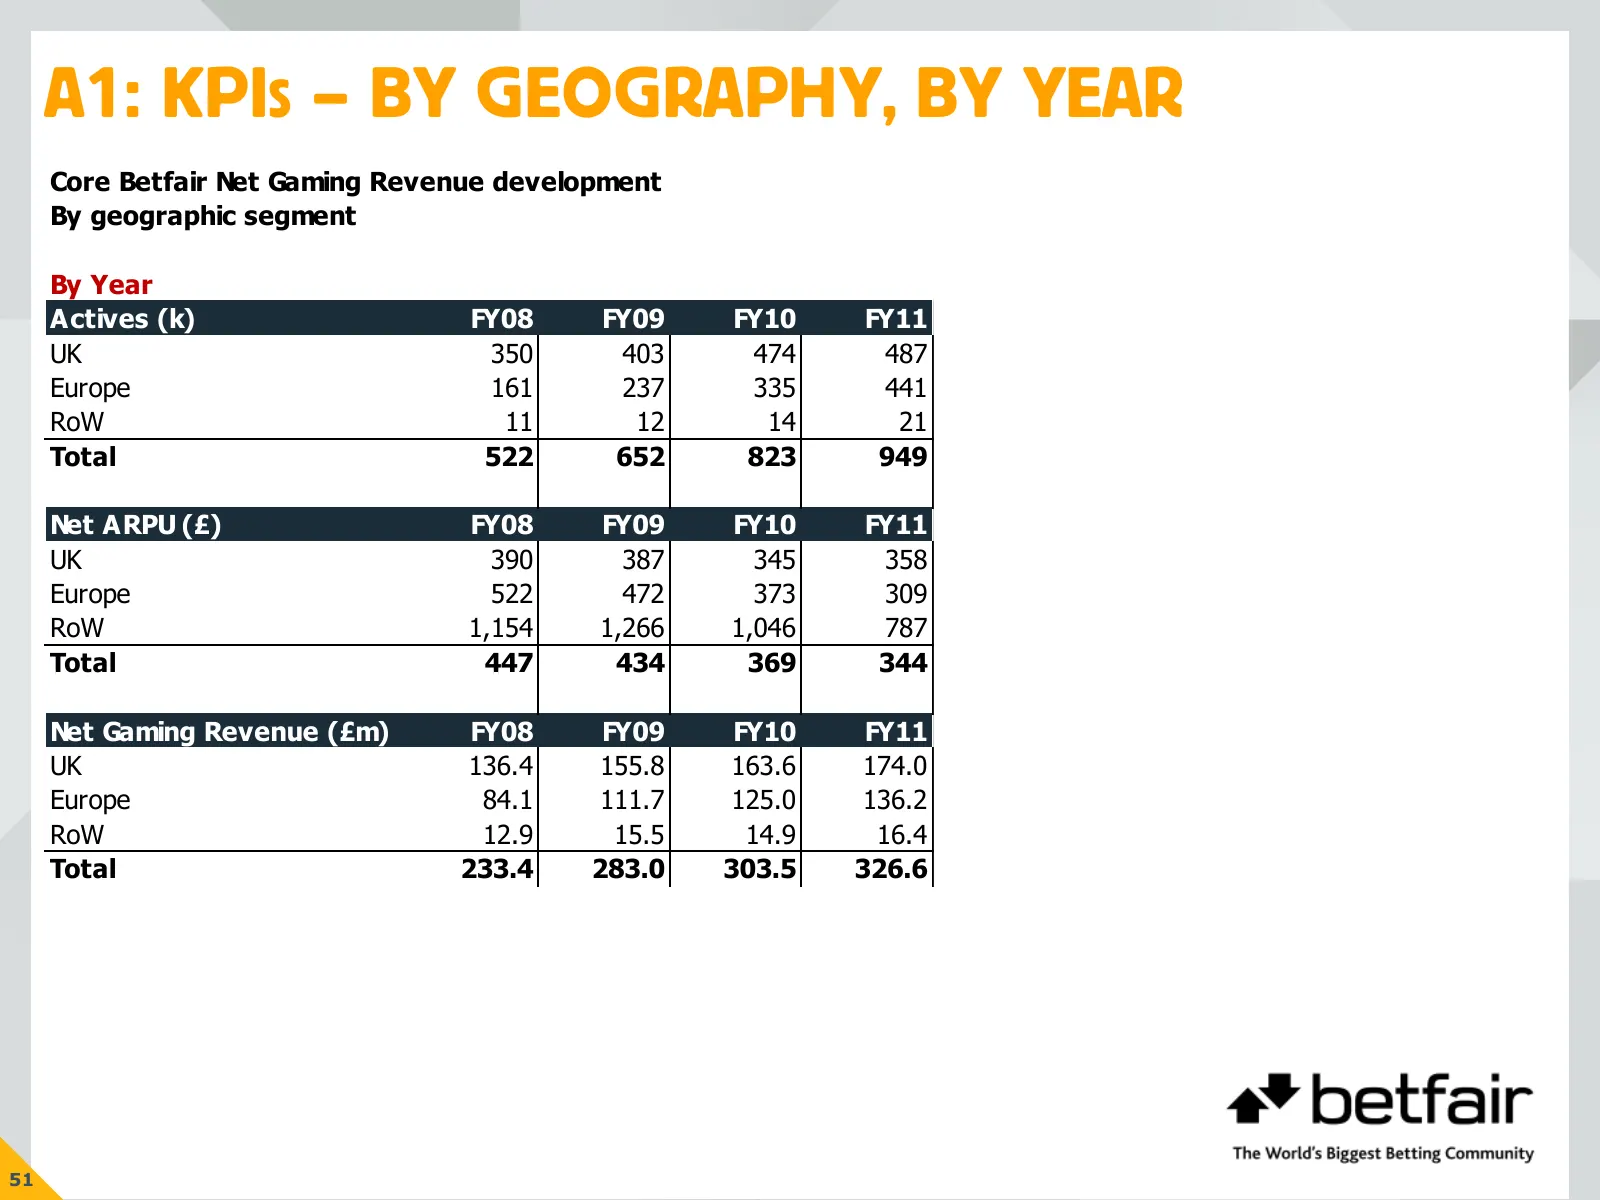
A1: KPIS – BY GEOGRAPHY, BY YEAR Core Betfair Net Gaming Revenue development By geographic segment By Year Actives (k) FY08 FY09 FY10 FY11 UK 350 403 474 487 Europe 161 237 335 441 RoW 11 12 14 21 Total 522 652 823 949 Net ARPU (£) FY08 FY09 FY10 FY11 UK 390 387 345 358 Europe 522 472 373 309 RoW 1,
Slide 53: A1: KPIs – By Geography, By Half Year
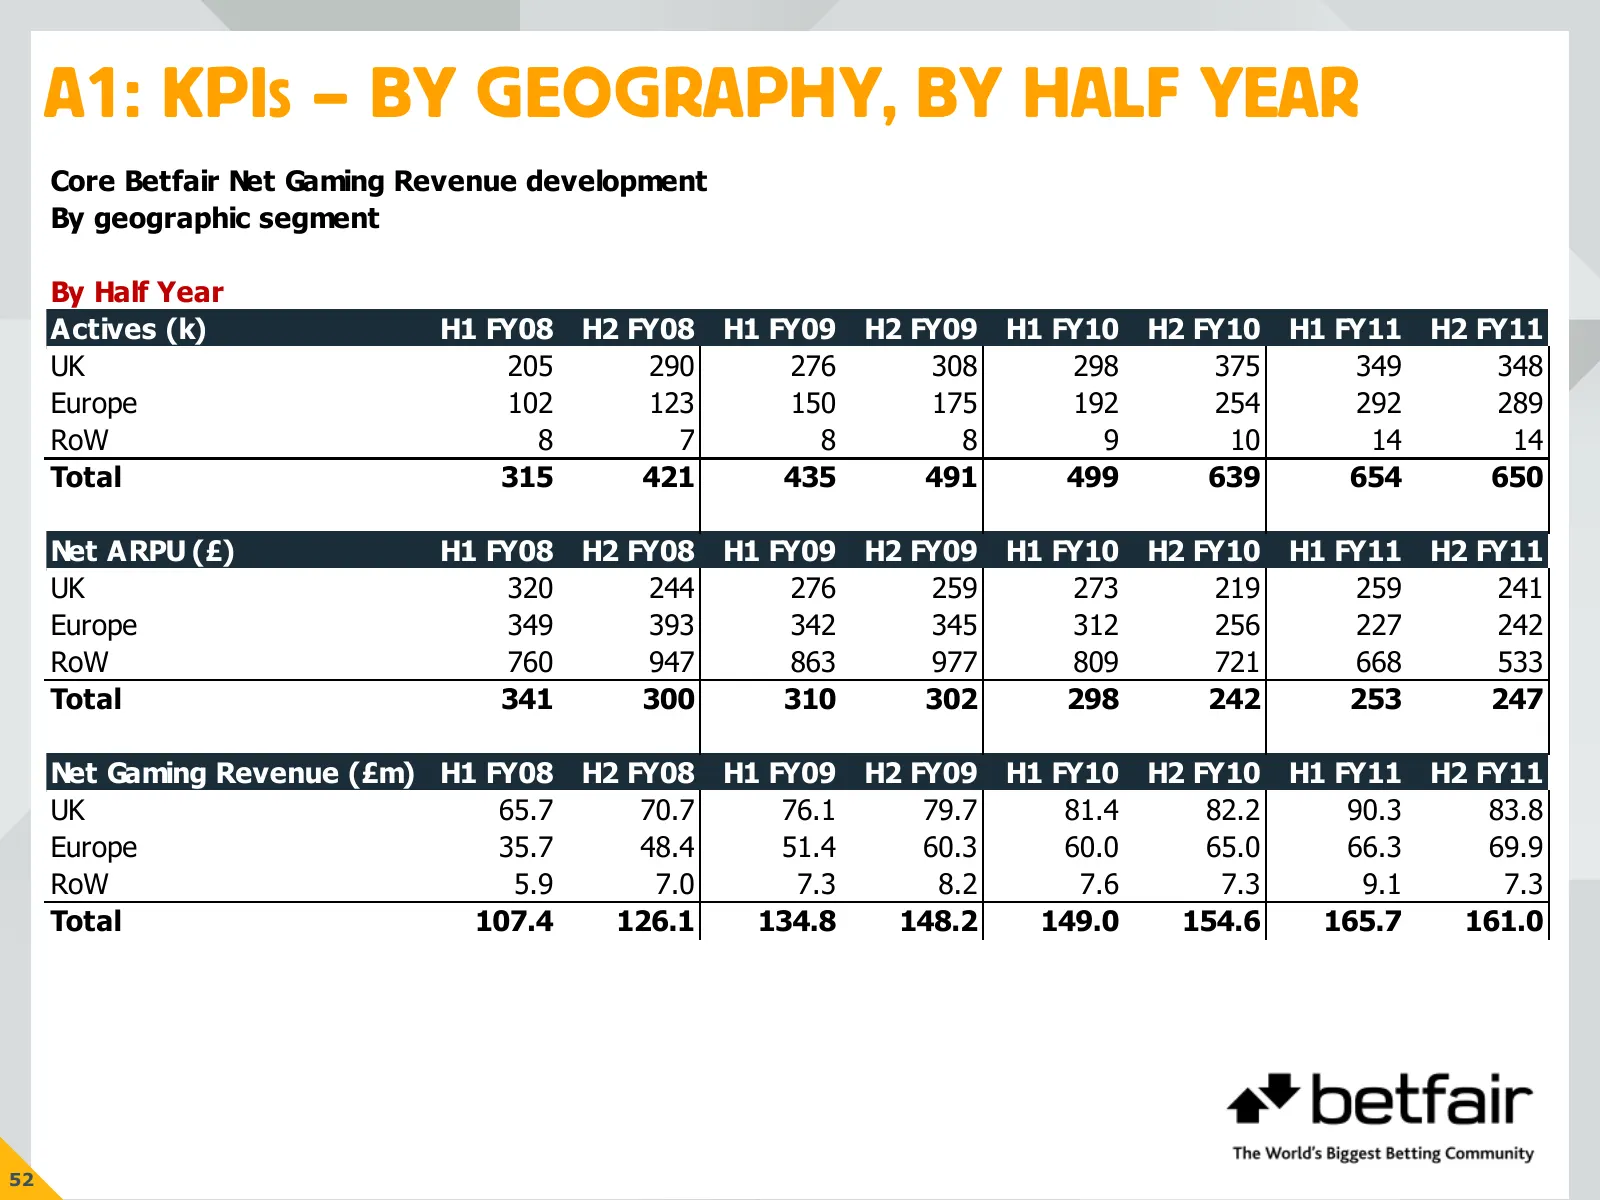
A1: KPIS – BY GEOGRAPHY, BY HALF YEAR Core Betfair Net Gaming Revenue development By geographic segment By Half Year Actives (k) H1 FY08 H2 FY08 H1 FY09 H2 FY09 H1 FY10 H2 FY10 H1 FY11 H2 FY11 UK 205 290 276 308 298 375 349 348 Europe 102 123 150 175 192 254 292 289 RoW 8 7 8 8 9 10 14 14 Total 315
Slide 54: A1: KPIs – By Geography, By Quarter
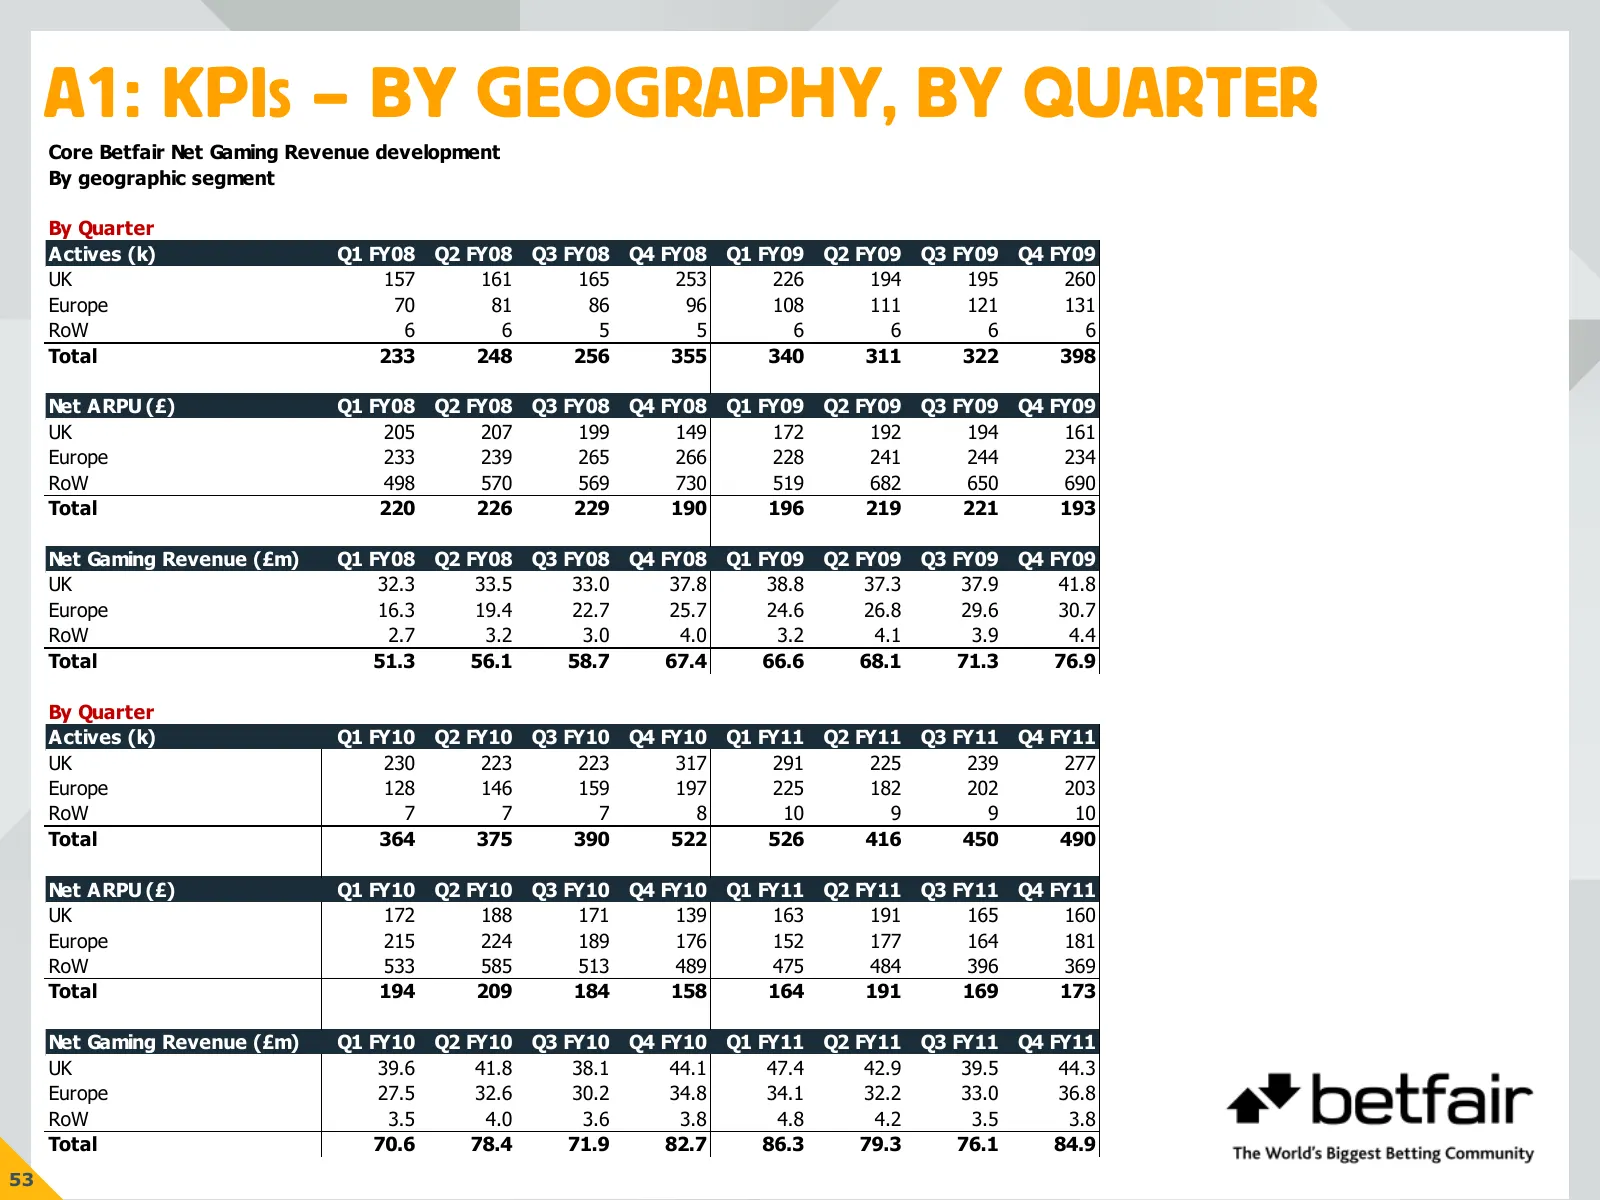
A1: KPIS – BY GEOGRAPHY, BY QUARTER Core Betfair Net Gaming Revenue development By geographic segment By Quarter Actives (k) Q1 FY08 Q2 FY08 Q3 FY08 Q4 FY08 Q1 FY09 Q2 FY09 Q3 FY09 Q4 FY09 UK 157 161 165 253 226 194 195 260 Europe 70 81 86 96 108 111 121 131 RoW 6 6 5 5 6 6 6 6 Total 233 248 256 355
Slide 55: A2: Reported Group Income Statement and Adjustments
A2: REPORTED GROUP INCOME STATEMENT AND ADJUSTMENTS
Slide 56: A2: As Reported Group Income Statement
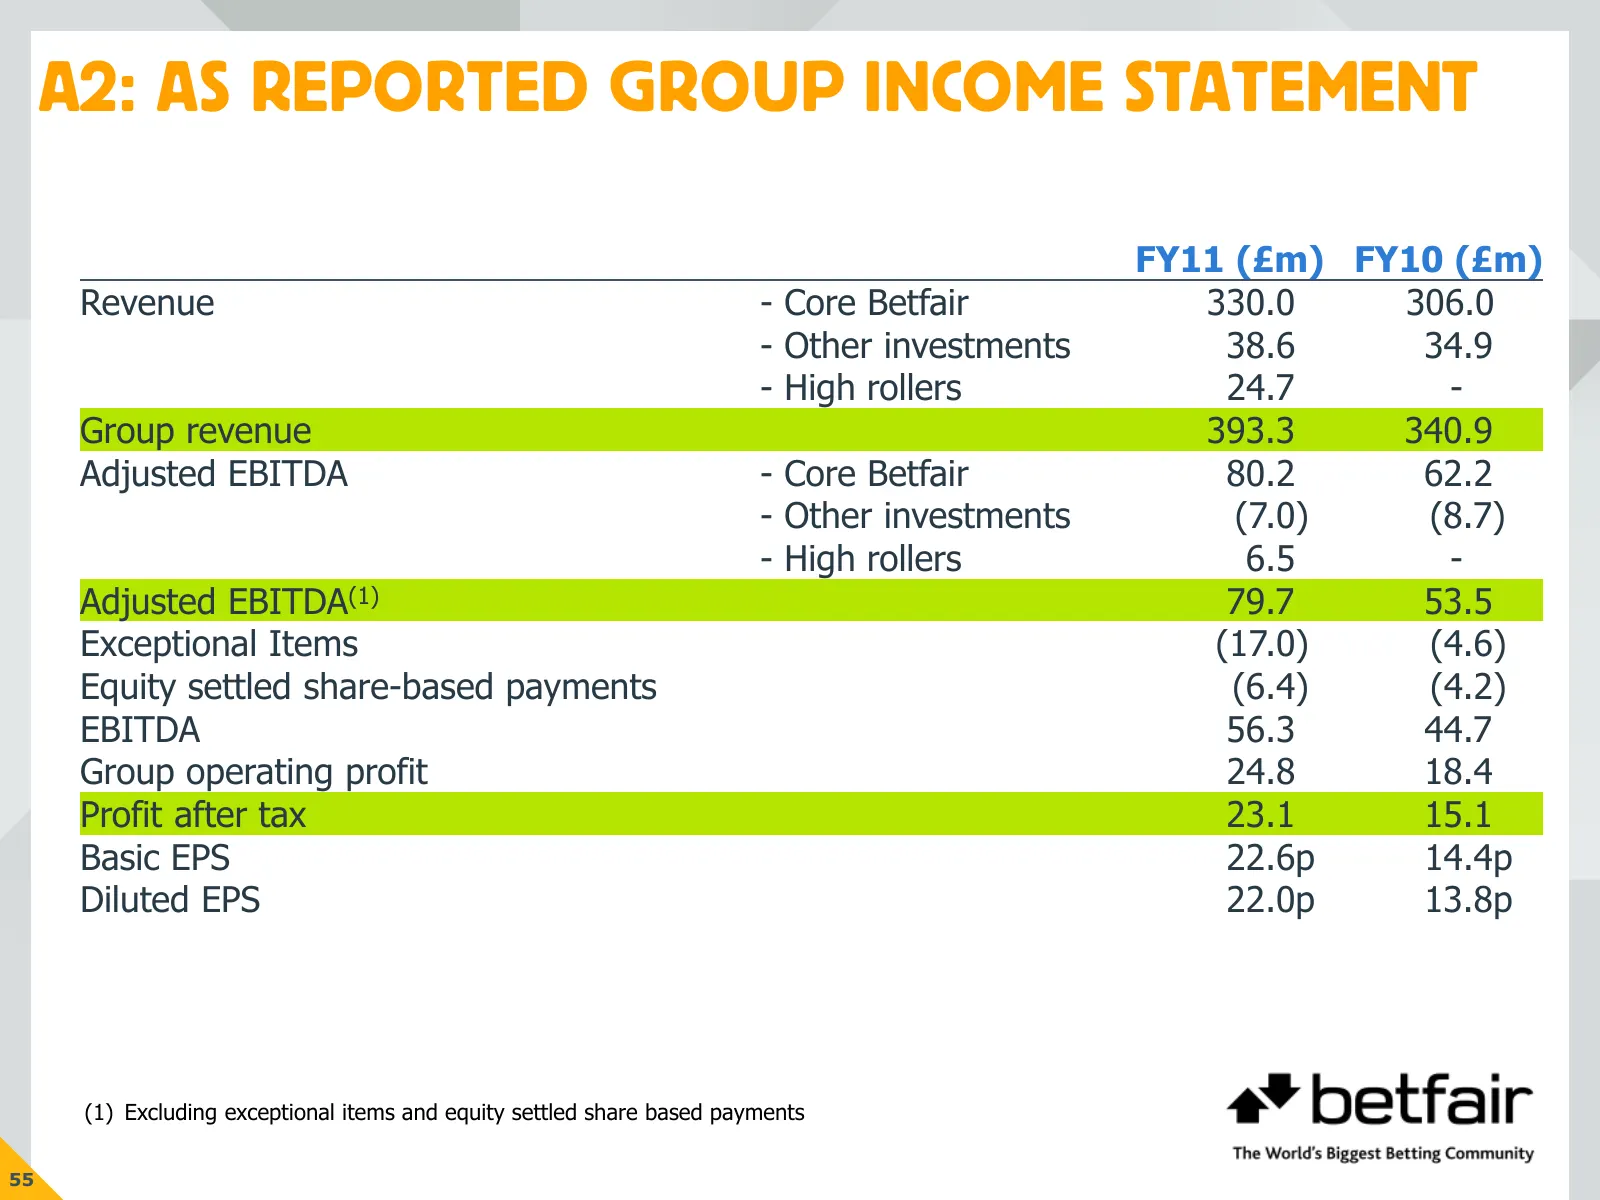
A2: AS REPORTED GROUP INCOME STATEMENT FY11 (£m) FY10 (£m) Revenue - Core Betfair 330.0 306.0 - Other investments 38.6 34.9 - High rollers 24.7 - Group revenue 393.3 340.9 Adjusted EBITDA - Core Betfair 80.2 62.2 - Other investments (7.0) (8.7) - High rollers 6.5 - Adjusted EBITDA(1) 79.7 53.5 Excep
Slide 57: A2: Adjustments
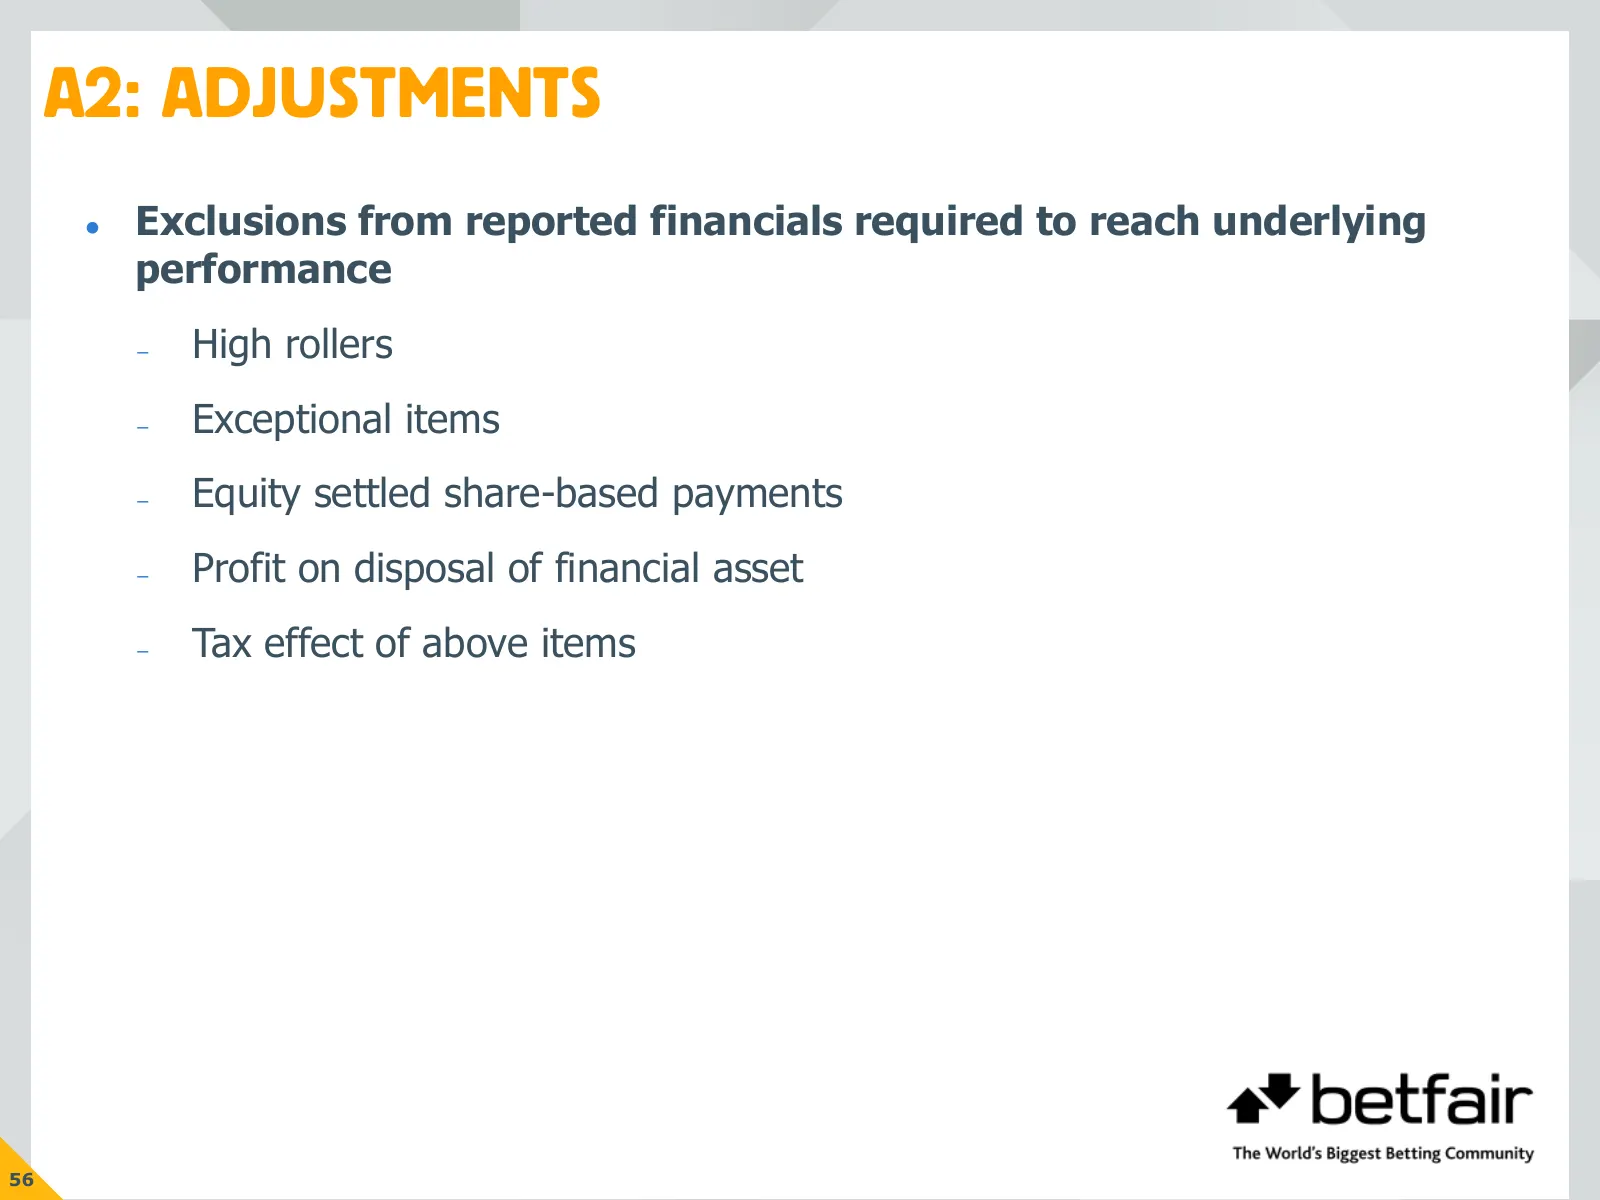
A2: ADJUSTMENTS Exclusions from reported financials required to reach underlying performance – High rollers – Exceptional items – Equity settled share-based payments – Profit on disposal of financial asset – Tax effect of above items 56
Slide 58: A2: Reconciliation of Adjustments
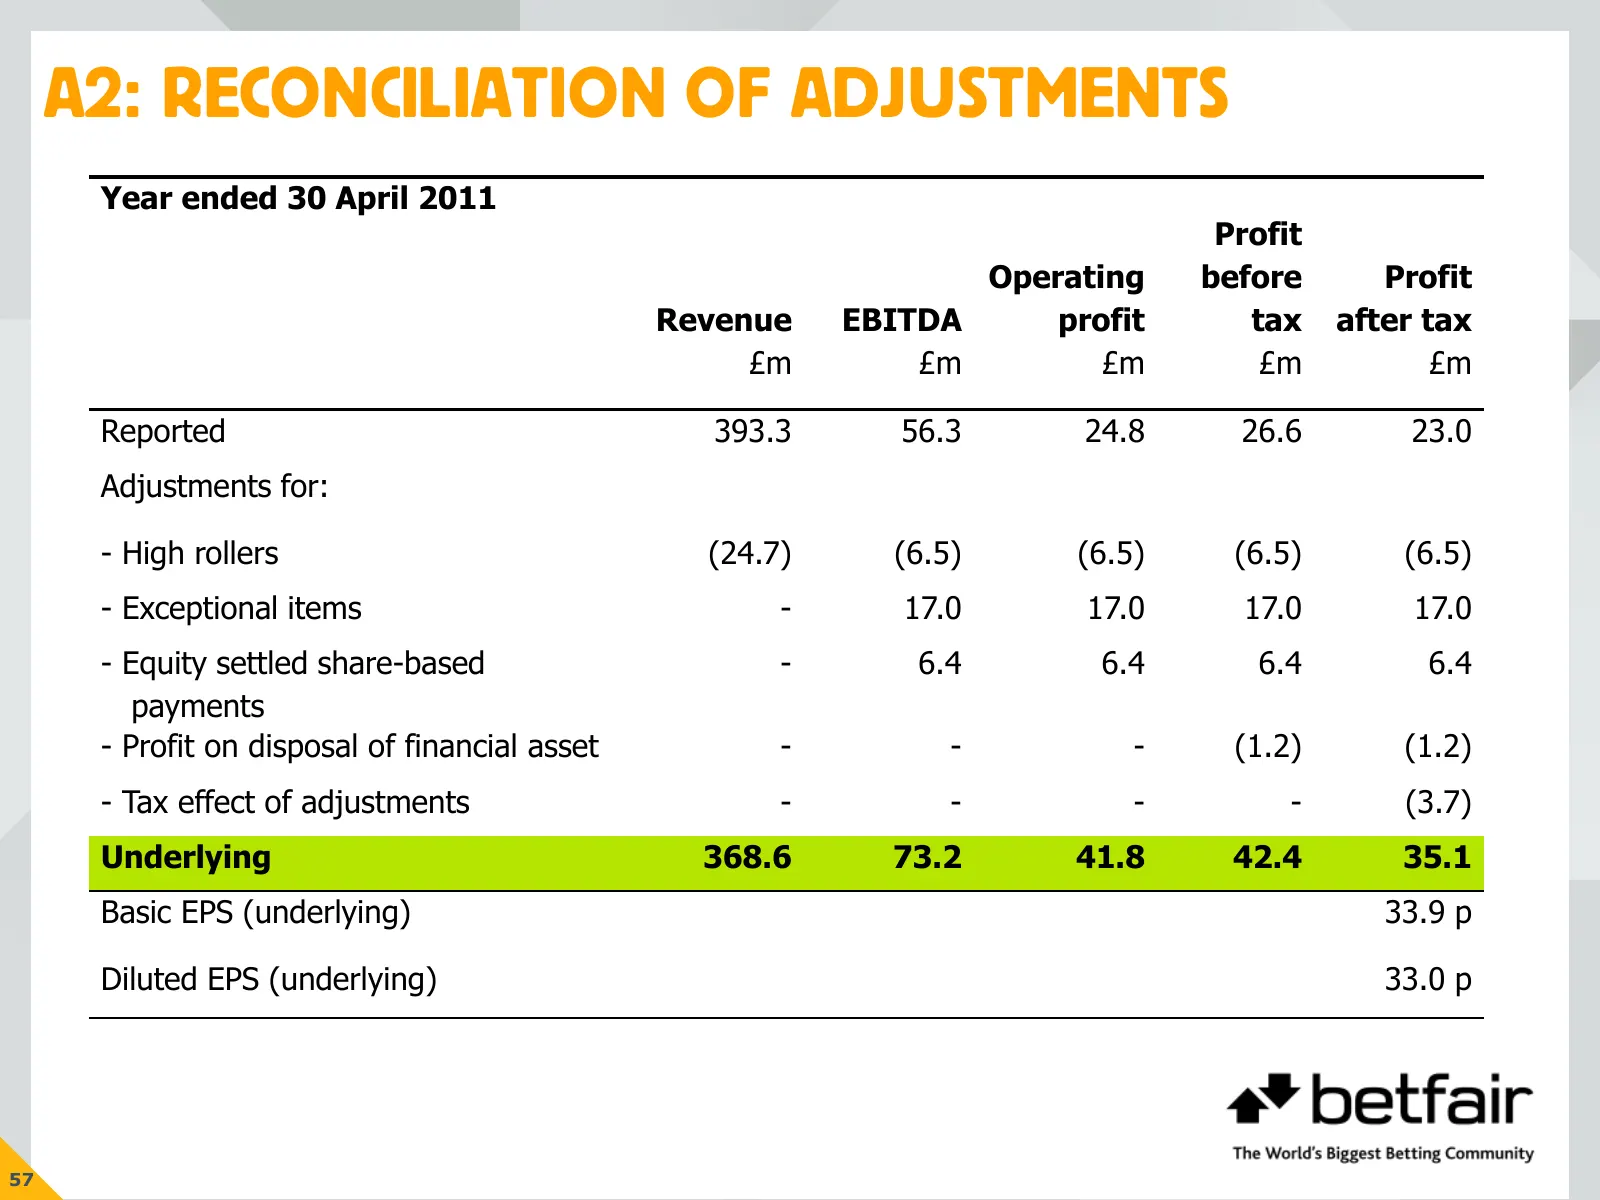
A2: RECONCILIATION OF ADJUSTMENTS Year ended 30 April 2011 Profit Operating before Profit Revenue EBITDA profit tax after tax £m £m £m £m £m Reported 393.3 56.3 24.8 26.6 23.0 Adjustments for: - High rollers (24.7) (6.5) (6.5) (6.5) (6.5) - Exceptional items - 17.0 17.0 17.0 17.0 - Equity settled sh

Slide 59: A3: Additional Income Statement Information
A3: ADDITIONAL INCOME STATEMENT INFORMATION
Slide 60: A3: Underlying Group Income Statement
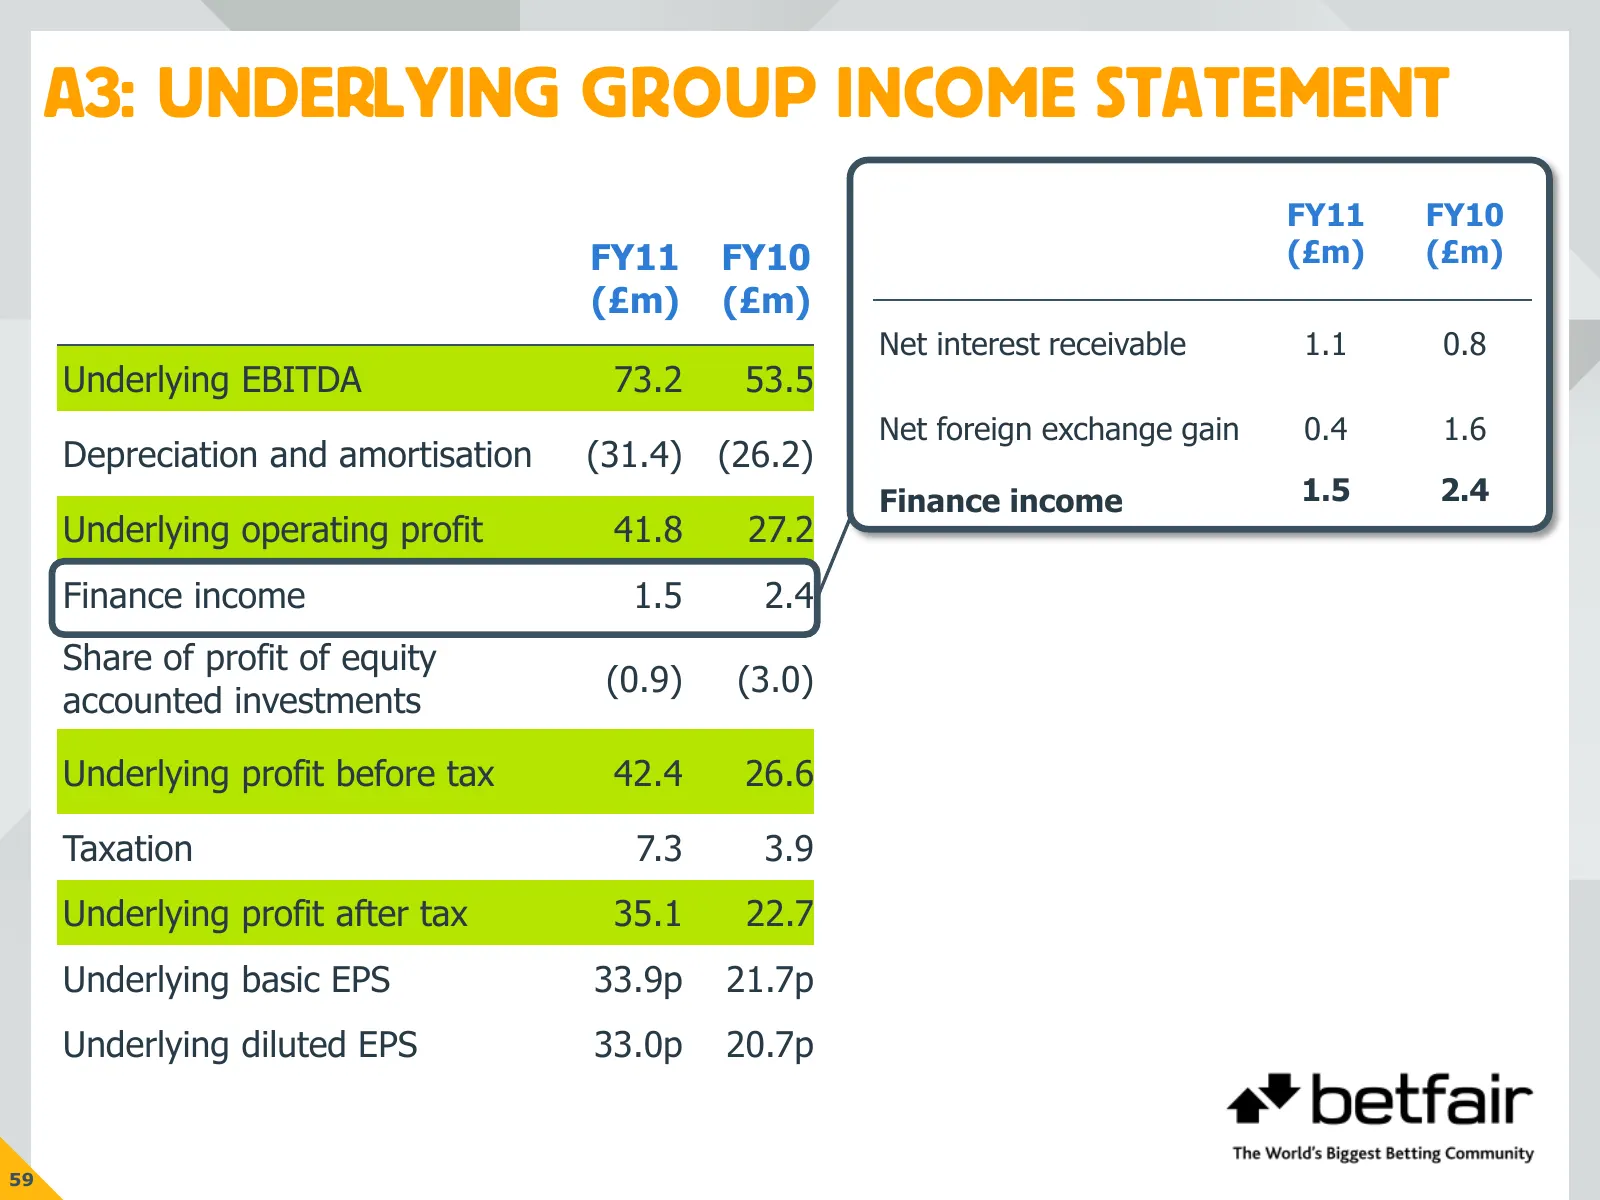
A3: UNDERLYING GROUP INCOME STATEMENT FY11 FY10 FY11 FY10 (£m) (£m) (£m) (£m) Net interest receivable 1.1 0.8 Underlying EBITDA 73.2 53.5 Net foreign exchange gain 0.4 1.6 Depreciation and amortisation (31.4) (26.2) Finance income 1.5 2.4 Underlying operating profit 41.8 27.2 Finance income 1.5 2.4
Slide 61: A3: Underlying Group Income Statement
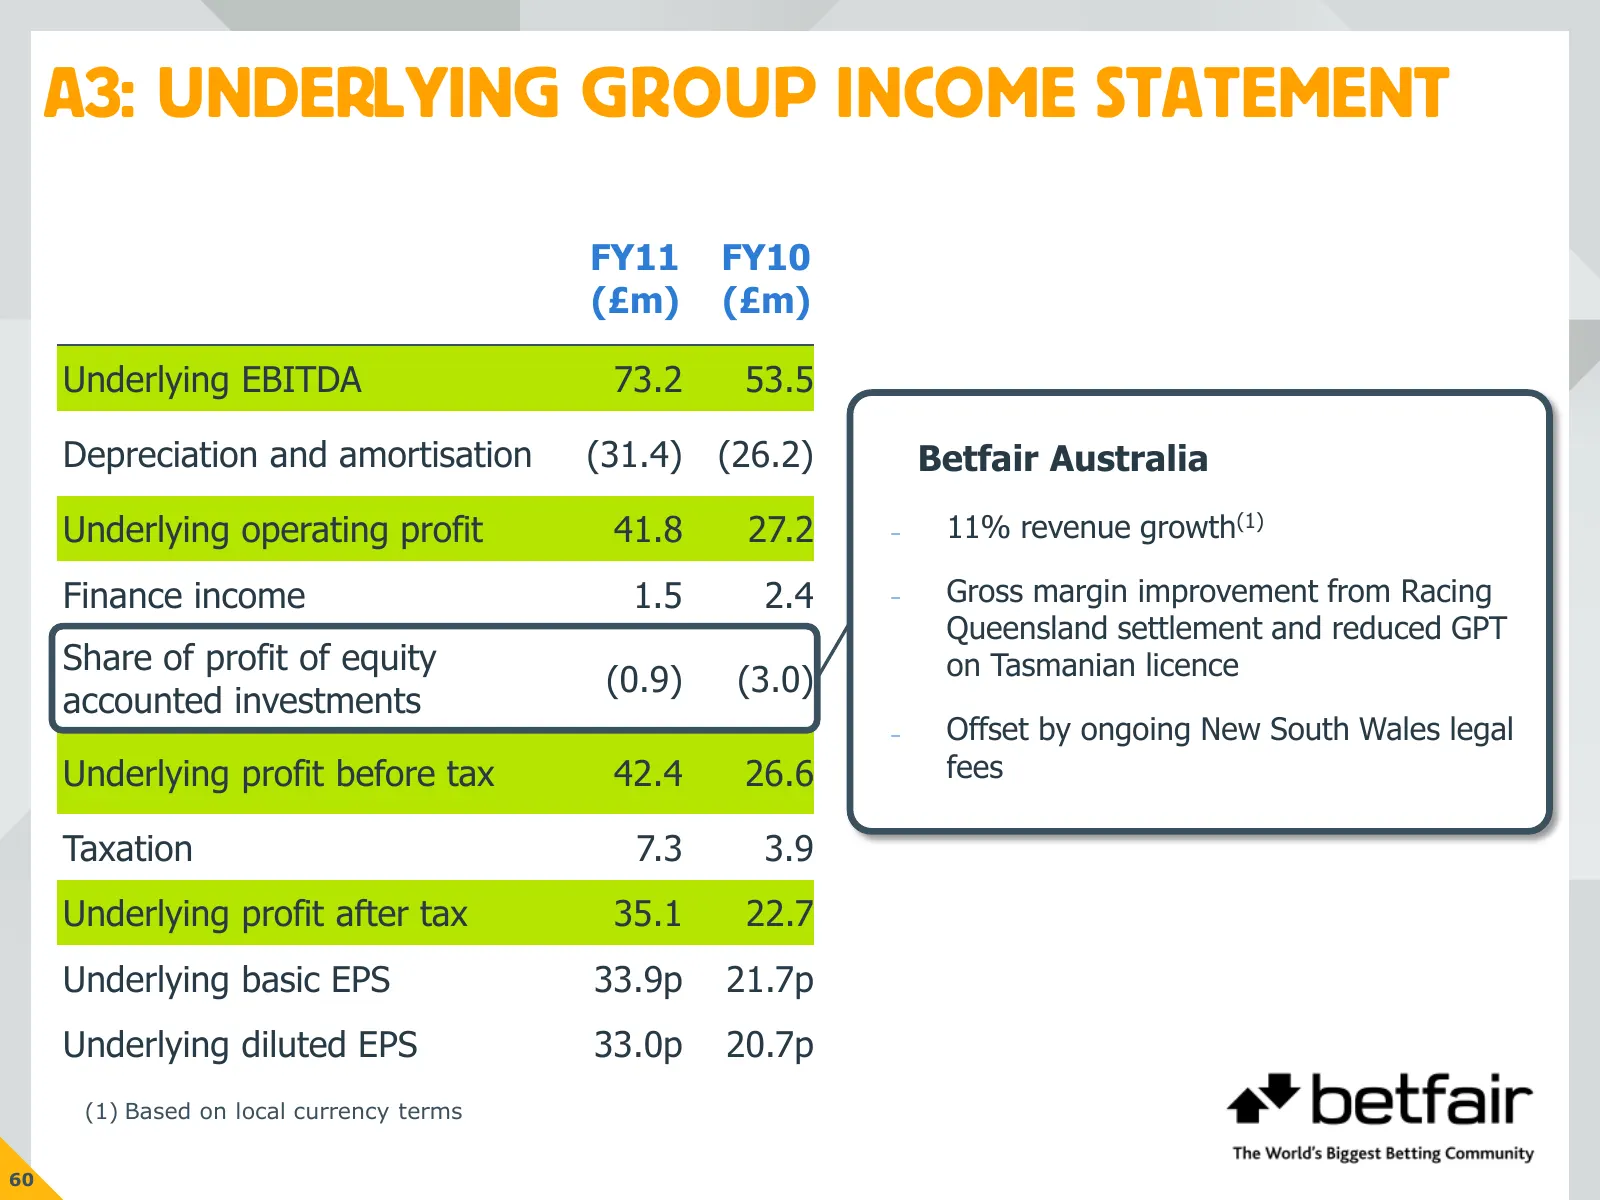
A3: UNDERLYING GROUP INCOME STATEMENT FY11 FY10 (£m) (£m) Underlying EBITDA 73.2 53.5 Depreciation and amortisation (31.4) (26.2) Betfair Australia Underlying operating profit 41.8 27.2 – 11% revenue growth(1) Finance income 1.5 2.4 – Gross margin improvement from Racing Queensland settlement and re
Slide 62: A3: Underlying Group Income Statement
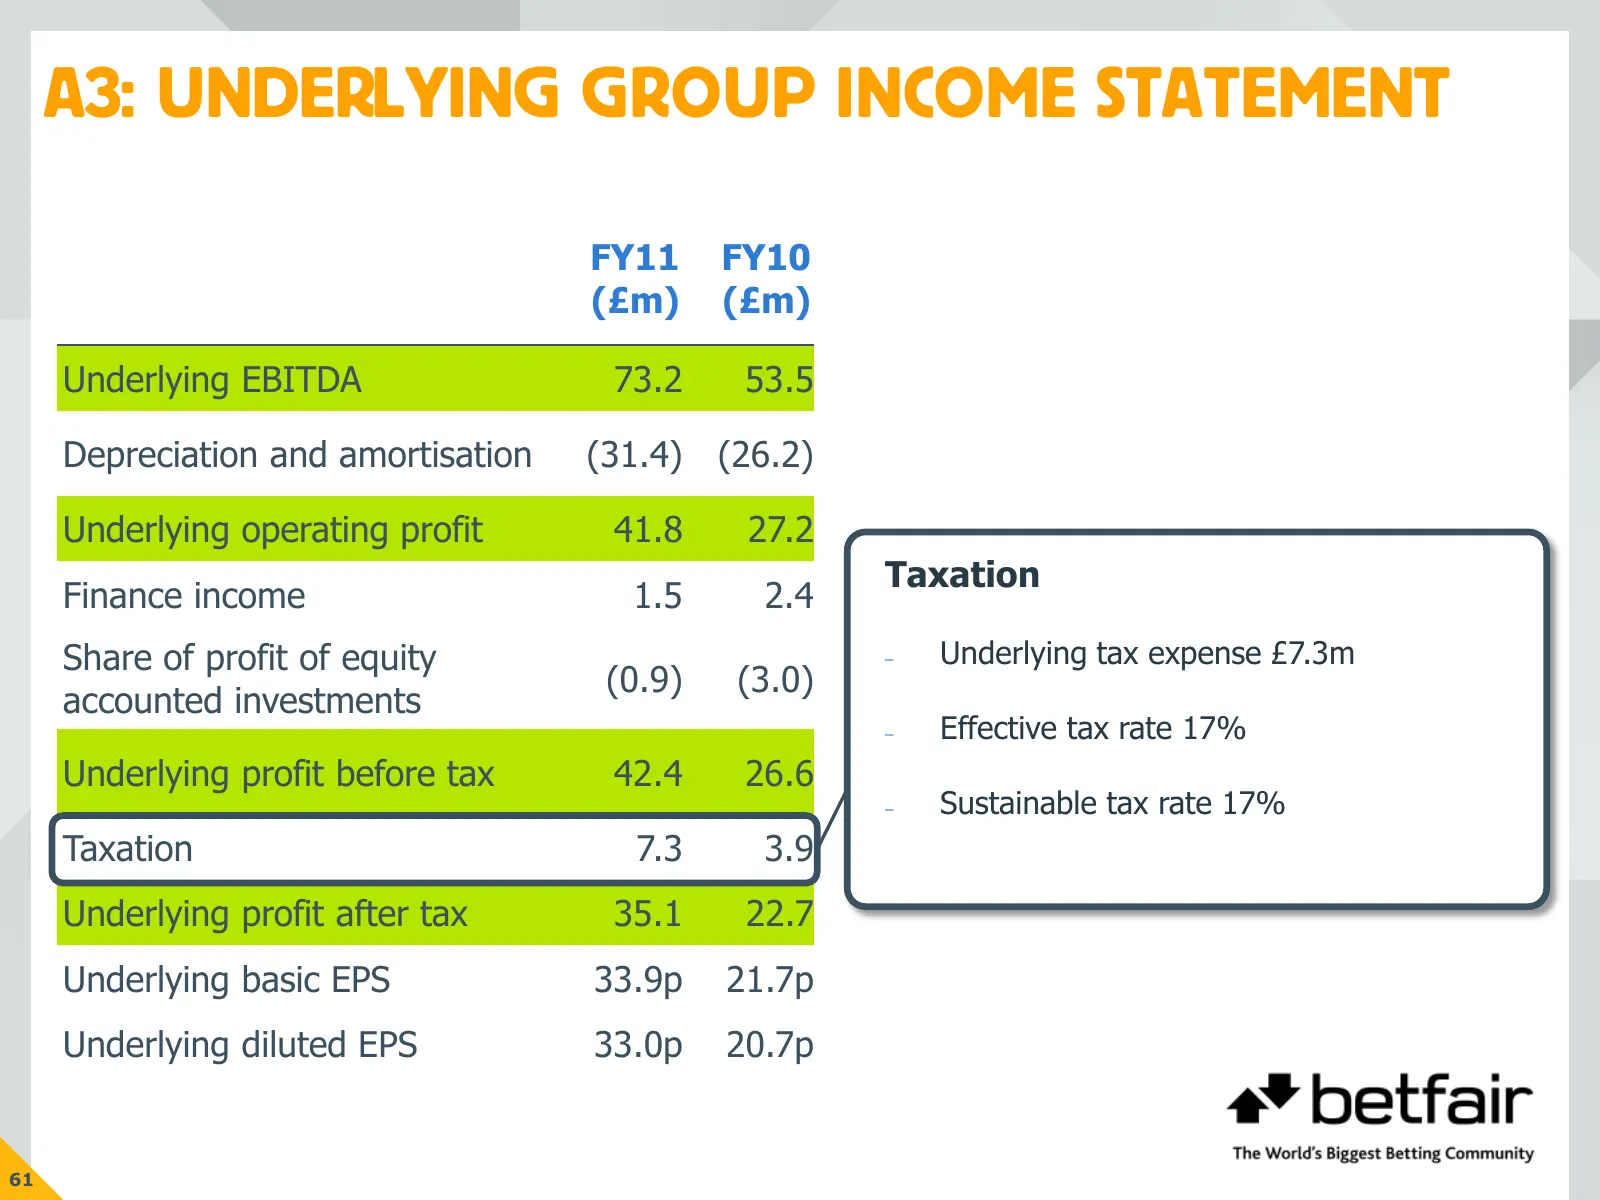
A3: UNDERLYING GROUP INCOME STATEMENT FY11 FY10 (£m) (£m) Underlying EBITDA 73.2 53.5 Depreciation and amortisation (31.4) (26.2) Underlying operating profit 41.8 27.2 Taxation Finance income 1.5 2.4 Share of profit of equity – Underlying tax expense £7.3m (0.9) (3.0) accounted investments – Effecti

Slide 63: A4: Cash Flow
A4: CASH FLOW ay betfair The World's Biggest Betting Com
Slide 64: A4: Cash Flow
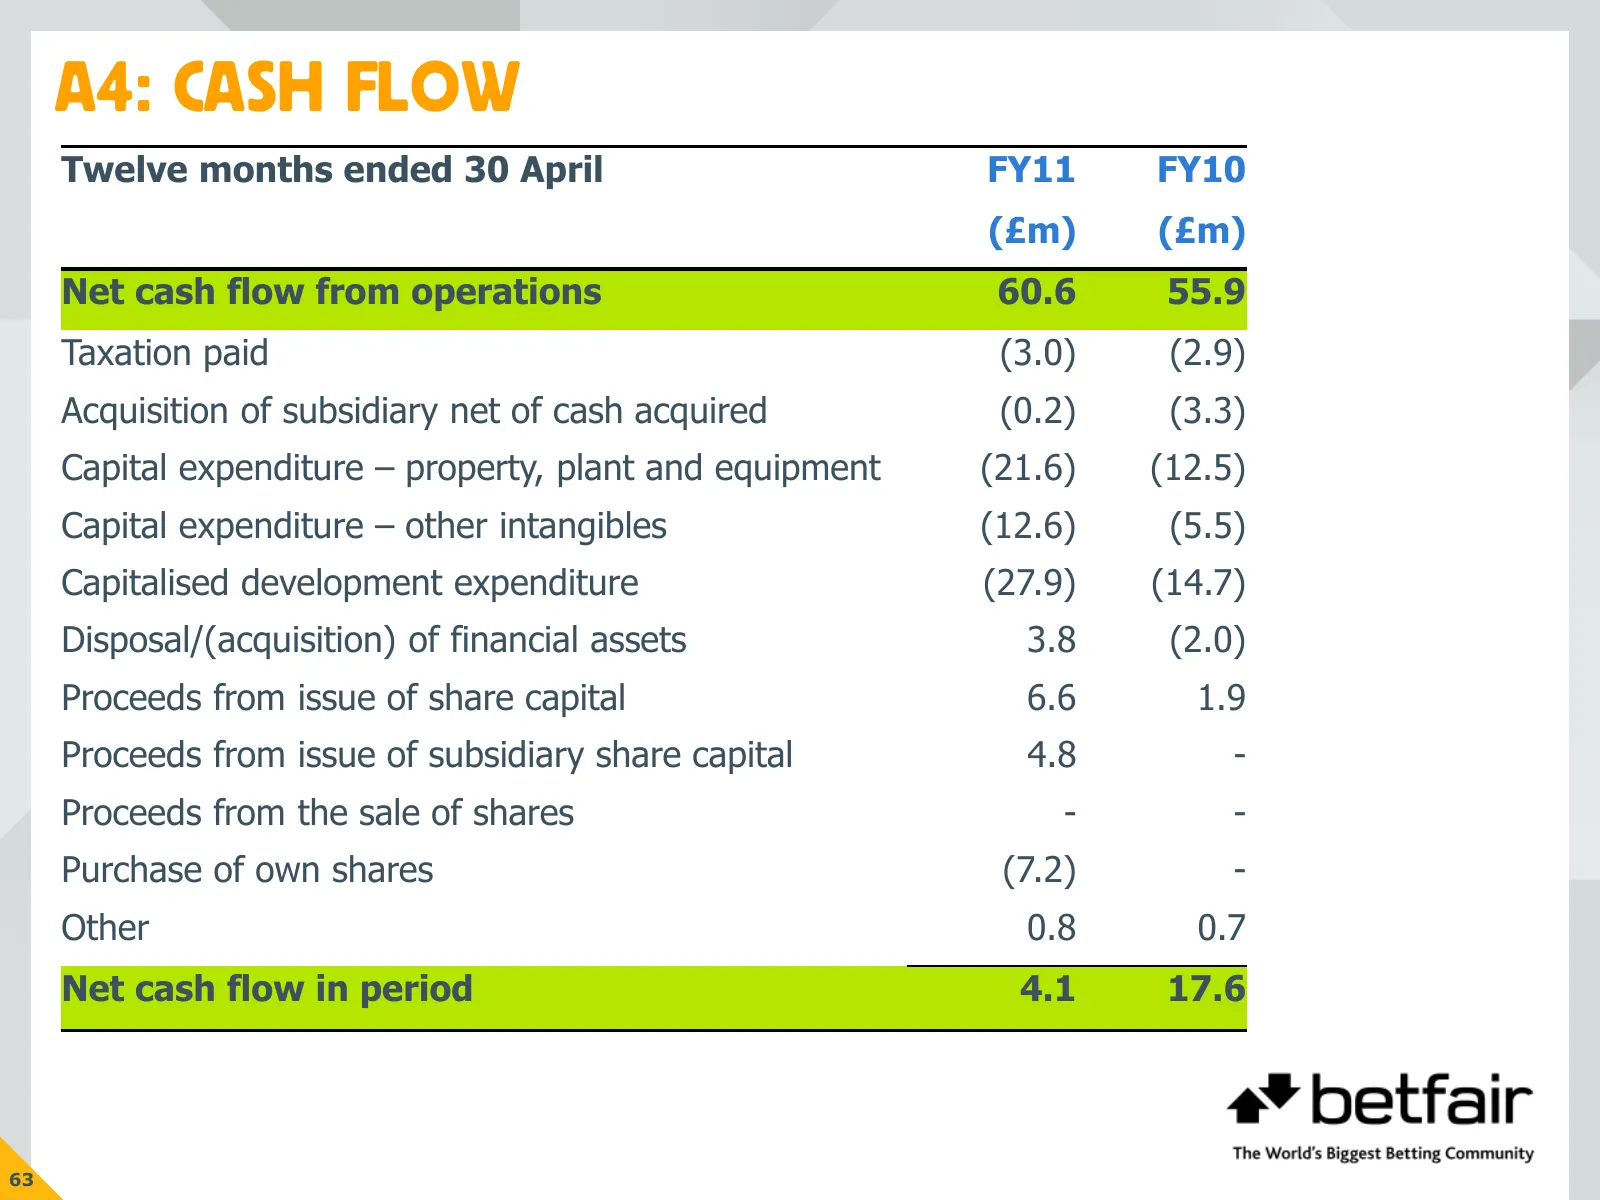
A4: CASH FLOW Twelve months ended 30 April FY11 FY10 (£m) (£m) Net cash flow from operations 60.6 55.9 Taxation paid (3.0) (2.9) Acquisition of subsidiary net of cash acquired (0.2) (3.3) Capital expenditure – property, plant and equipment (21.6) (12.5) Capital expenditure – other intangibles (12.6)

Slide 65: A5: Balance Sheet
AS: BALANCE SHEET ay betfair The World's Biggest Betting Com
Slide 66: A5: Balance Sheet
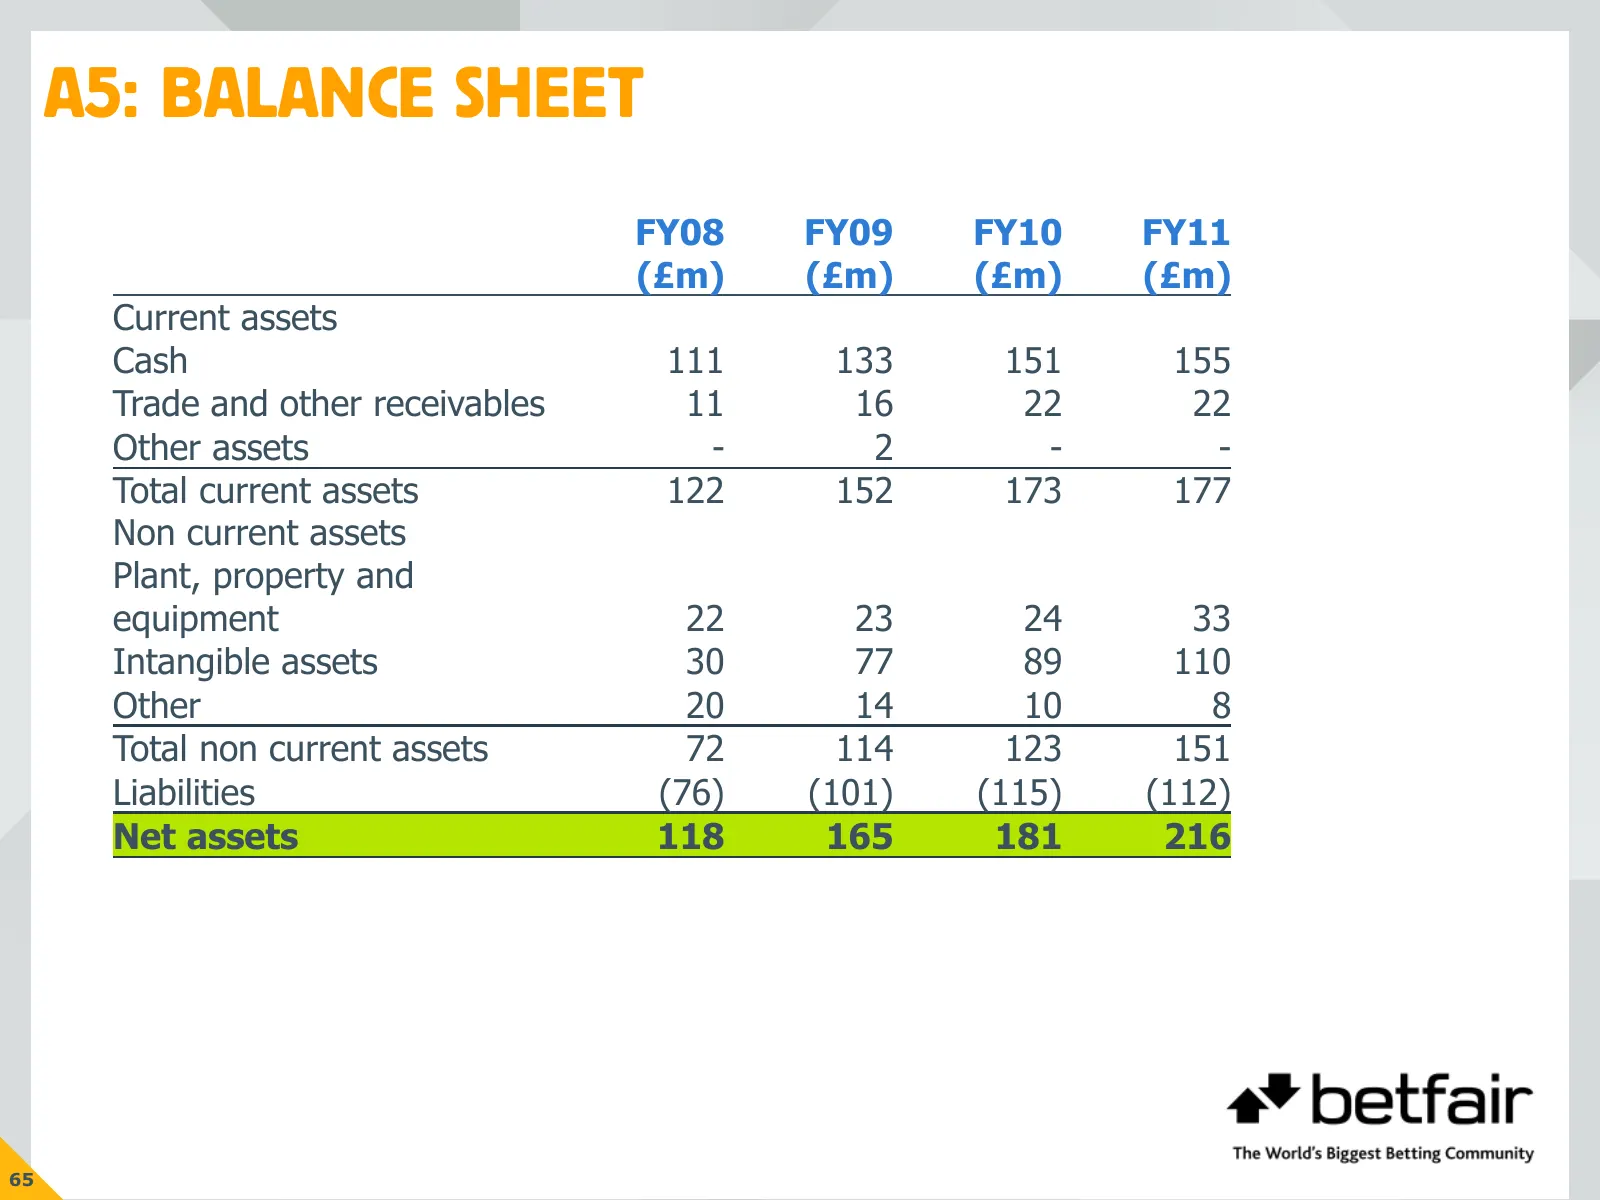
A5: BALANCE SHEET FY08 FY09 FY10 FY11 (£m) (£m) (£m) (£m) Current assets Cash 111 133 151 155 Trade and other receivables 11 16 22 22 Other assets - 2 - - Total current assets 122 152 173 177 Non current assets Plant, property and equipment 22 23 24 33 Intangible assets 30 77 89 110 Other 20 14 10 8
Source: Internet Archive copy of flutter.com
More decks from Flutter Entertainment plc
 Q3 2026 Earnings Presentation15 slides · Nov 4, 2026
 Q2 2026 Earnings Presentation14 slides · Aug 5, 2026
 Investor Day (September 2024)152 slides · Sep 25, 2024
 Q2 2024 Earnings Presentation20 slides · Aug 13, 2024
 Q1 2024 Earnings Presentation20 slides · May 14, 2024
 FY2023 Earnings Presentation36 slides · Mar 26, 2024