Southern Union — Non-Deal Roadshow (April 2008)
53 slides from Southern Union's roadshow presentation, Apr 28, 2008
Slide 1: Investor Meetings
Investor Meetings April 29 – May 1 www.sug.com
Slide 2: Forward-Looking Statements
Forward-Looking Statements Statements contained in this presentation that include company expectations or predictions of the future are forward-looking statements intended to be covered by the safe harbor provisions of the Securities Act of 1933 and the Securities Exchange Act of 1934. It is importa
Slide 3: Agenda
Agenda • Southern Union Company Overview • Creating Shareholder Value • 2007 Accomplishments/Recent Announcements • Segment Information & Growth Drivers • 2008 Financial Outlook • Conclusion • Appendix 3

Slide 4: Southern Union Company Overview
Southern Union Company Overview
Slide 5: Southern Union Transformation
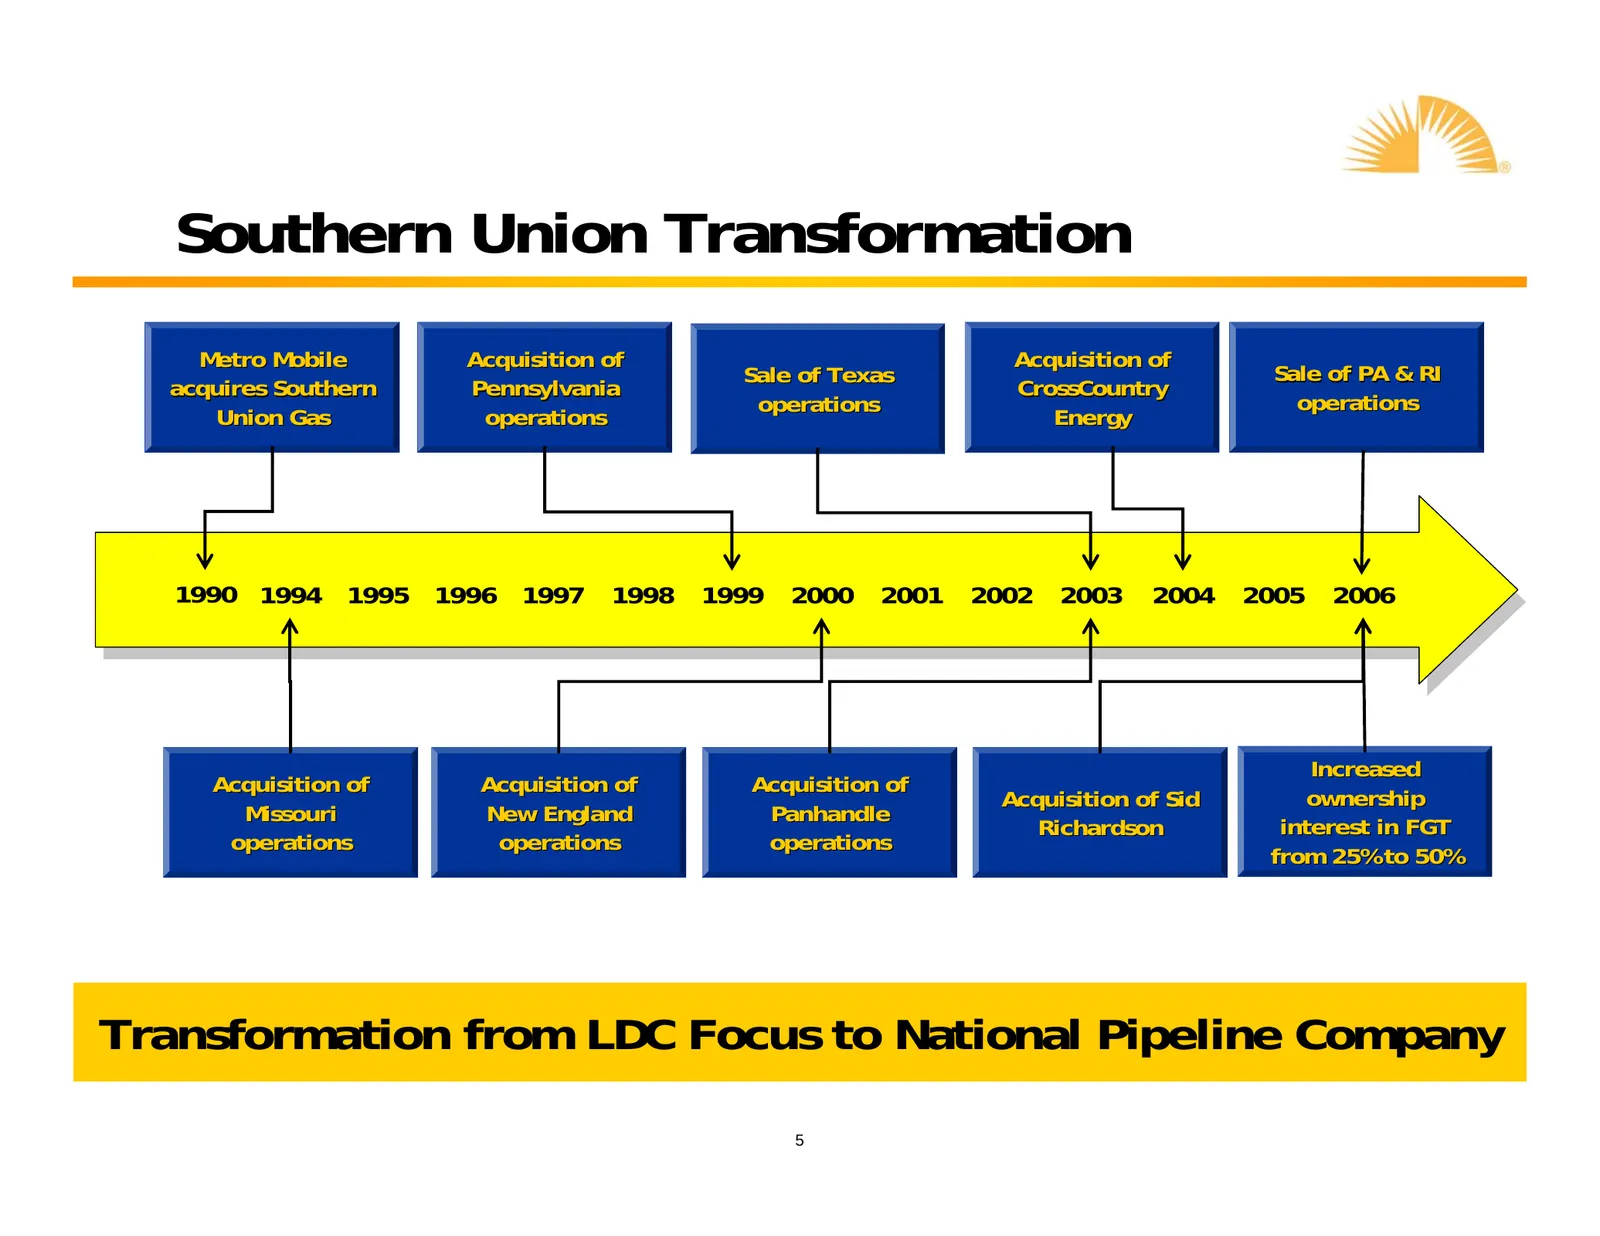
Southern Union Transformation Metro Mobile Acquisition of Acquisition of Sale of Texas Sale of PA & RI acquires Southern Pennsylvania CrossCountry operations operations Union Gas operations Energy 1990 1994 1995 1996 1997 1998 1999 2000 2001 2002 2003 2004 2005 2006 Increased Acquisition of Acquisit
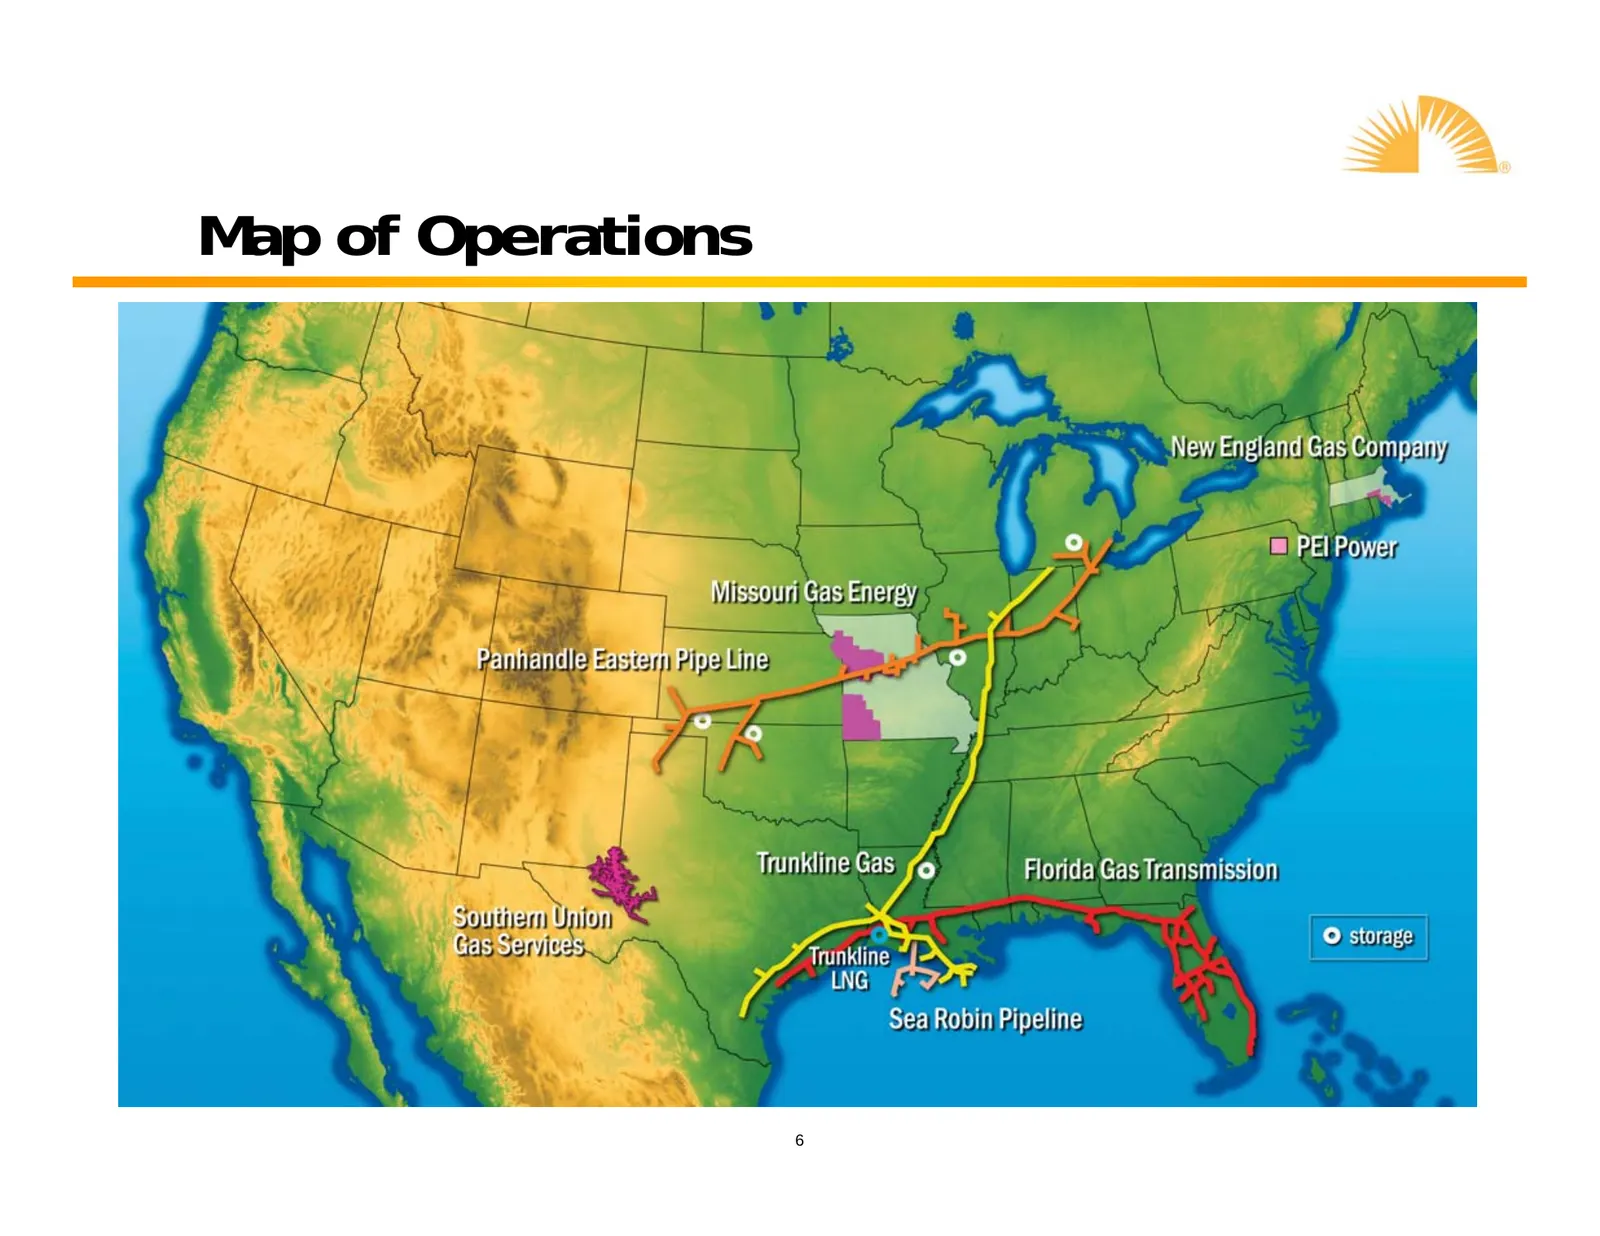
Slide 6: Map of Operations
Map of Operations a ay New Endetticestomelly ym Yer... er 7m) PEI Power a id ot eo \ DONUT ONION » CS Servius © storage Séa Robin Pipeline

Slide 7: Business Segments
Business Segments yl”,
Slide 8: Transportation & Storage
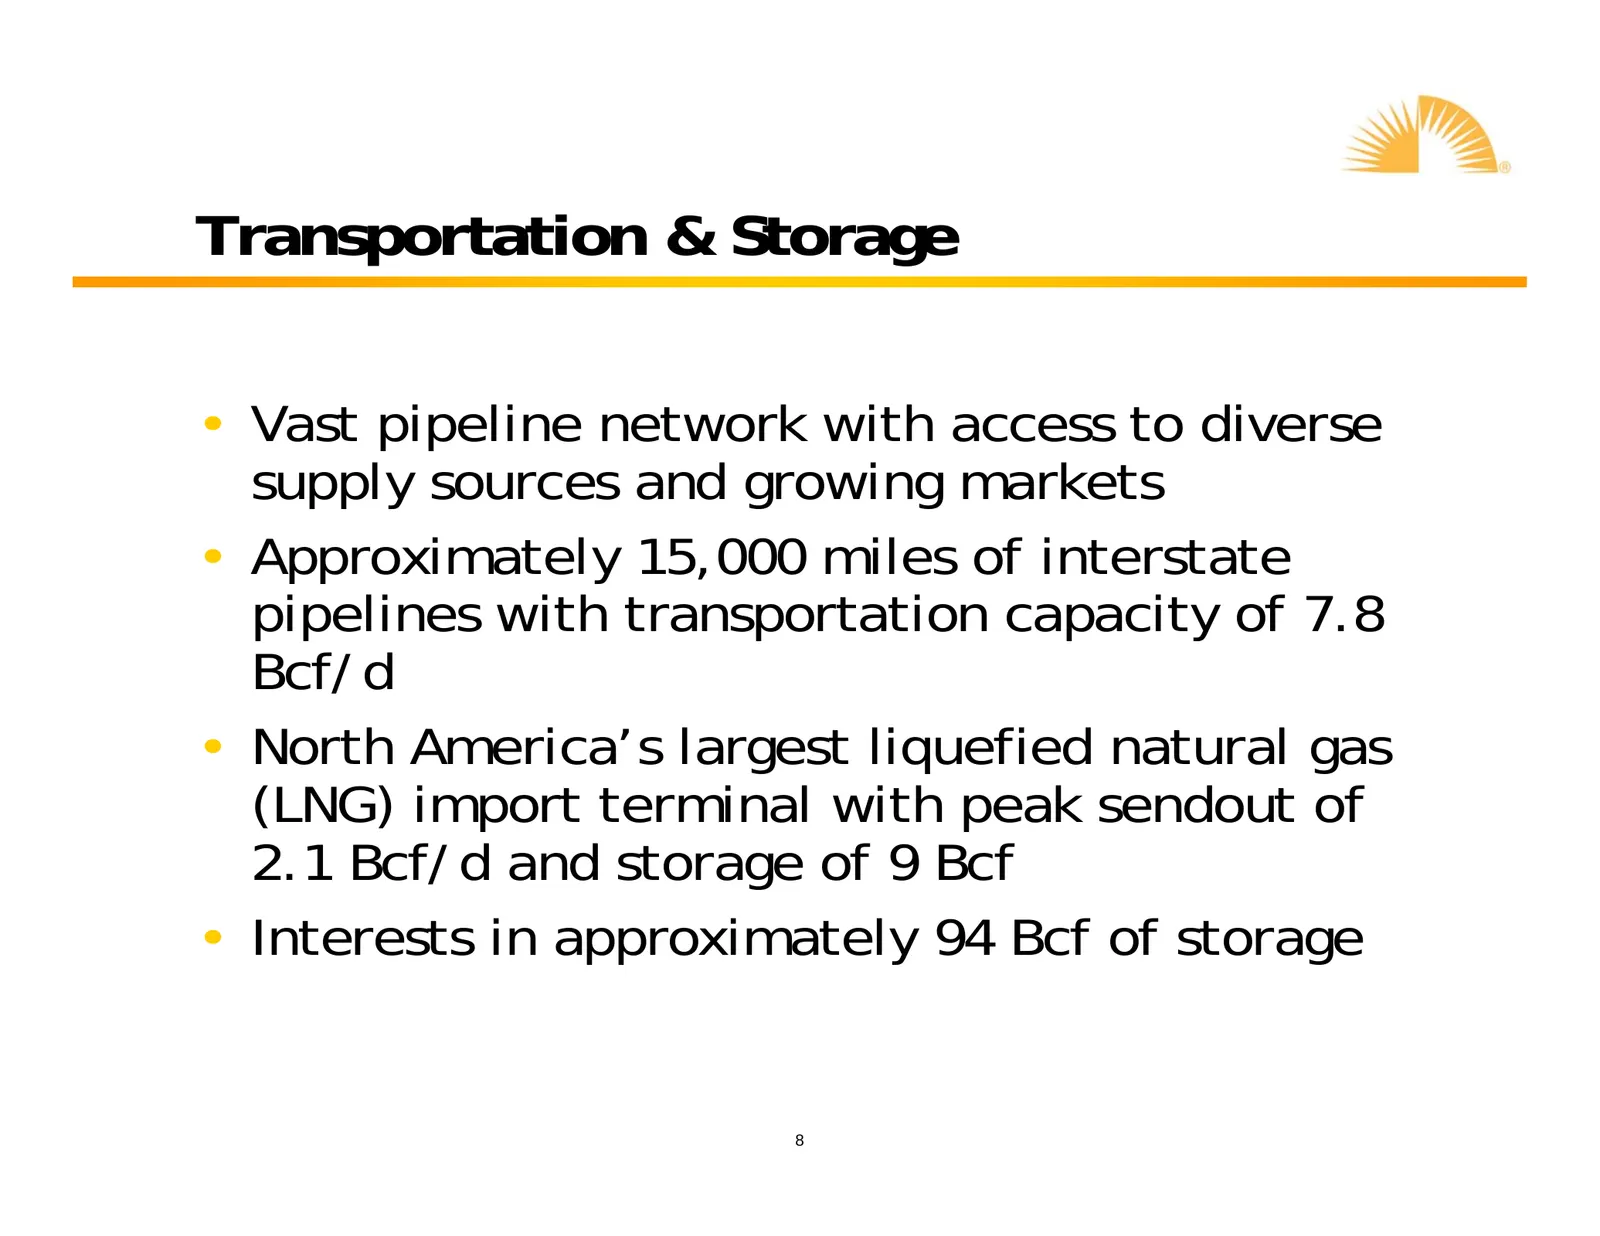
Transportation & Storage • Vast pipeline network with access to diverse supply sources and growing markets • Approximately 15,000 miles of interstate pipelines with transportation capacity of 7.8 Bcf/d • North America’s largest liquefied natural gas (LNG) import terminal with peak sendout of 2.1 Bcf
Slide 9: Gathering & Processing
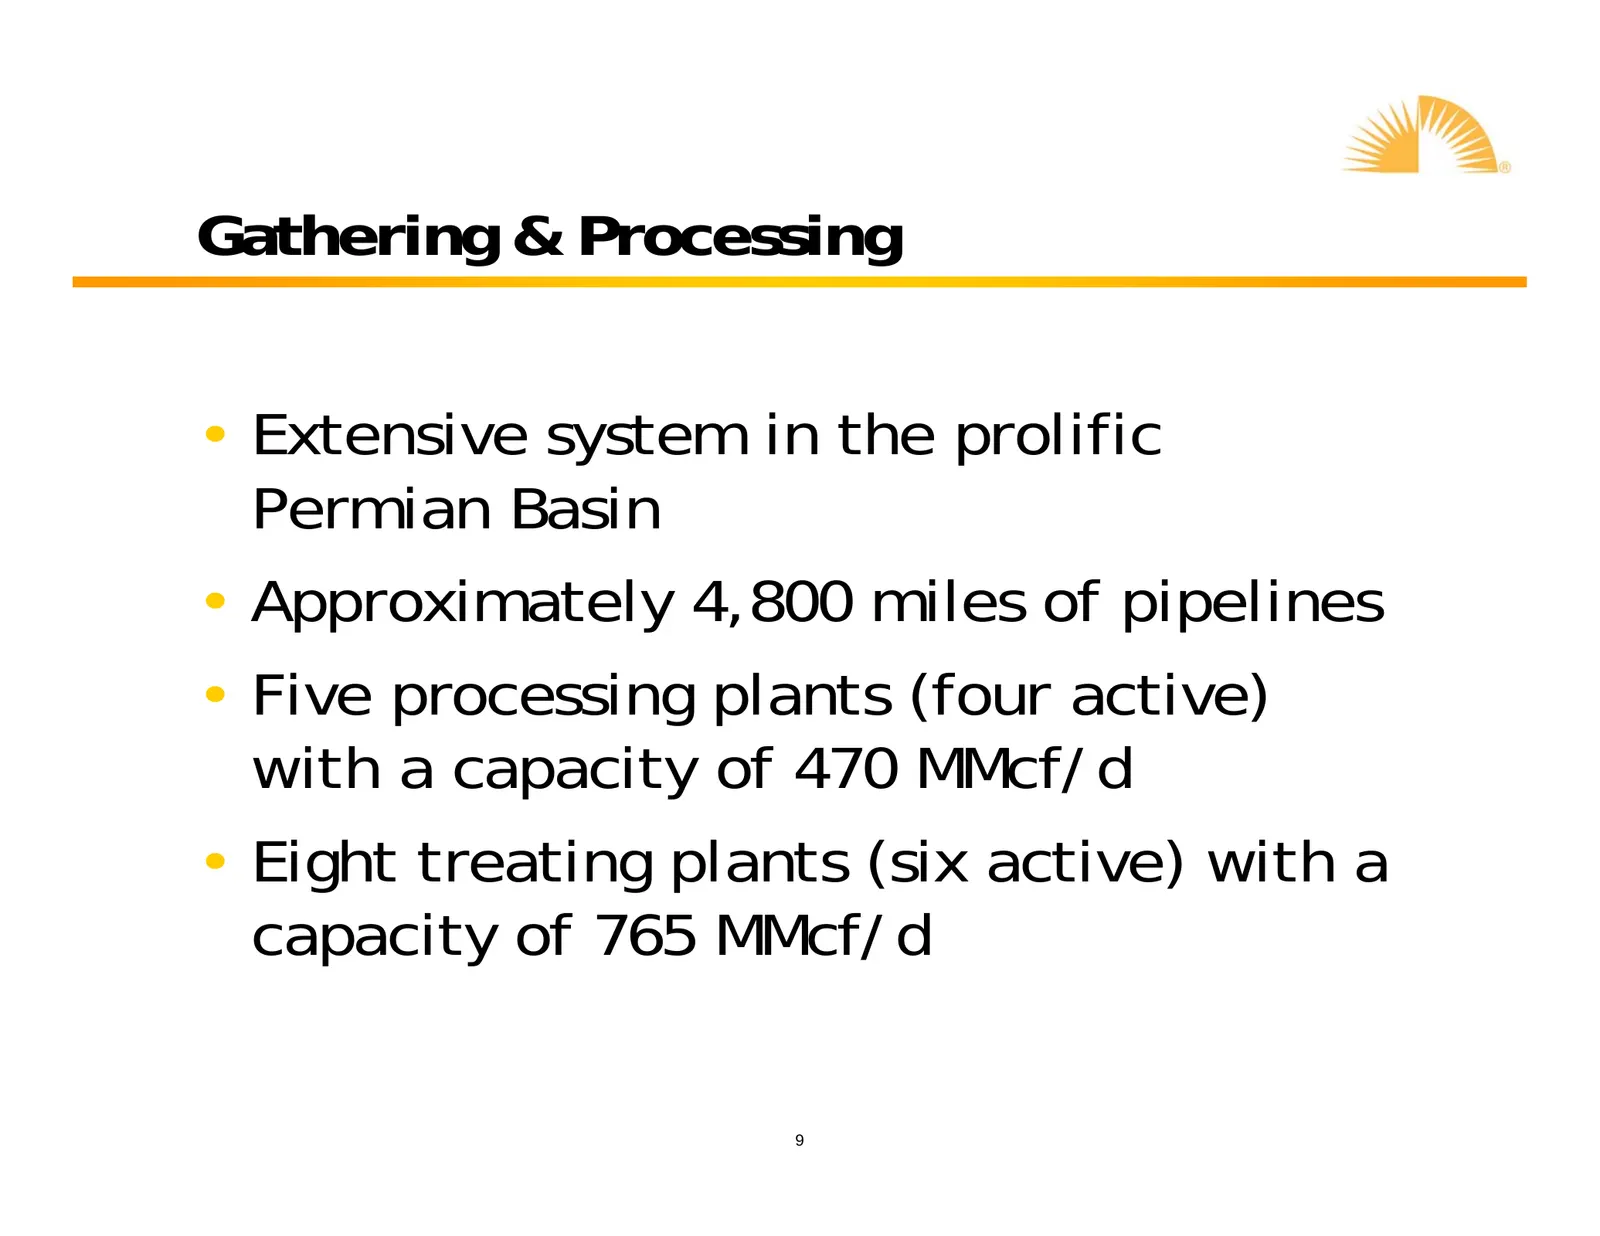
Gathering & Processing • Extensive system in the prolific Permian Basin • Approximately 4,800 miles of pipelines • Five processing plants (four active) with a capacity of 470 MMcf/d • Eight treating plants (six active) with a capacity of 765 MMcf/d 9
Slide 10: Distribution & Other
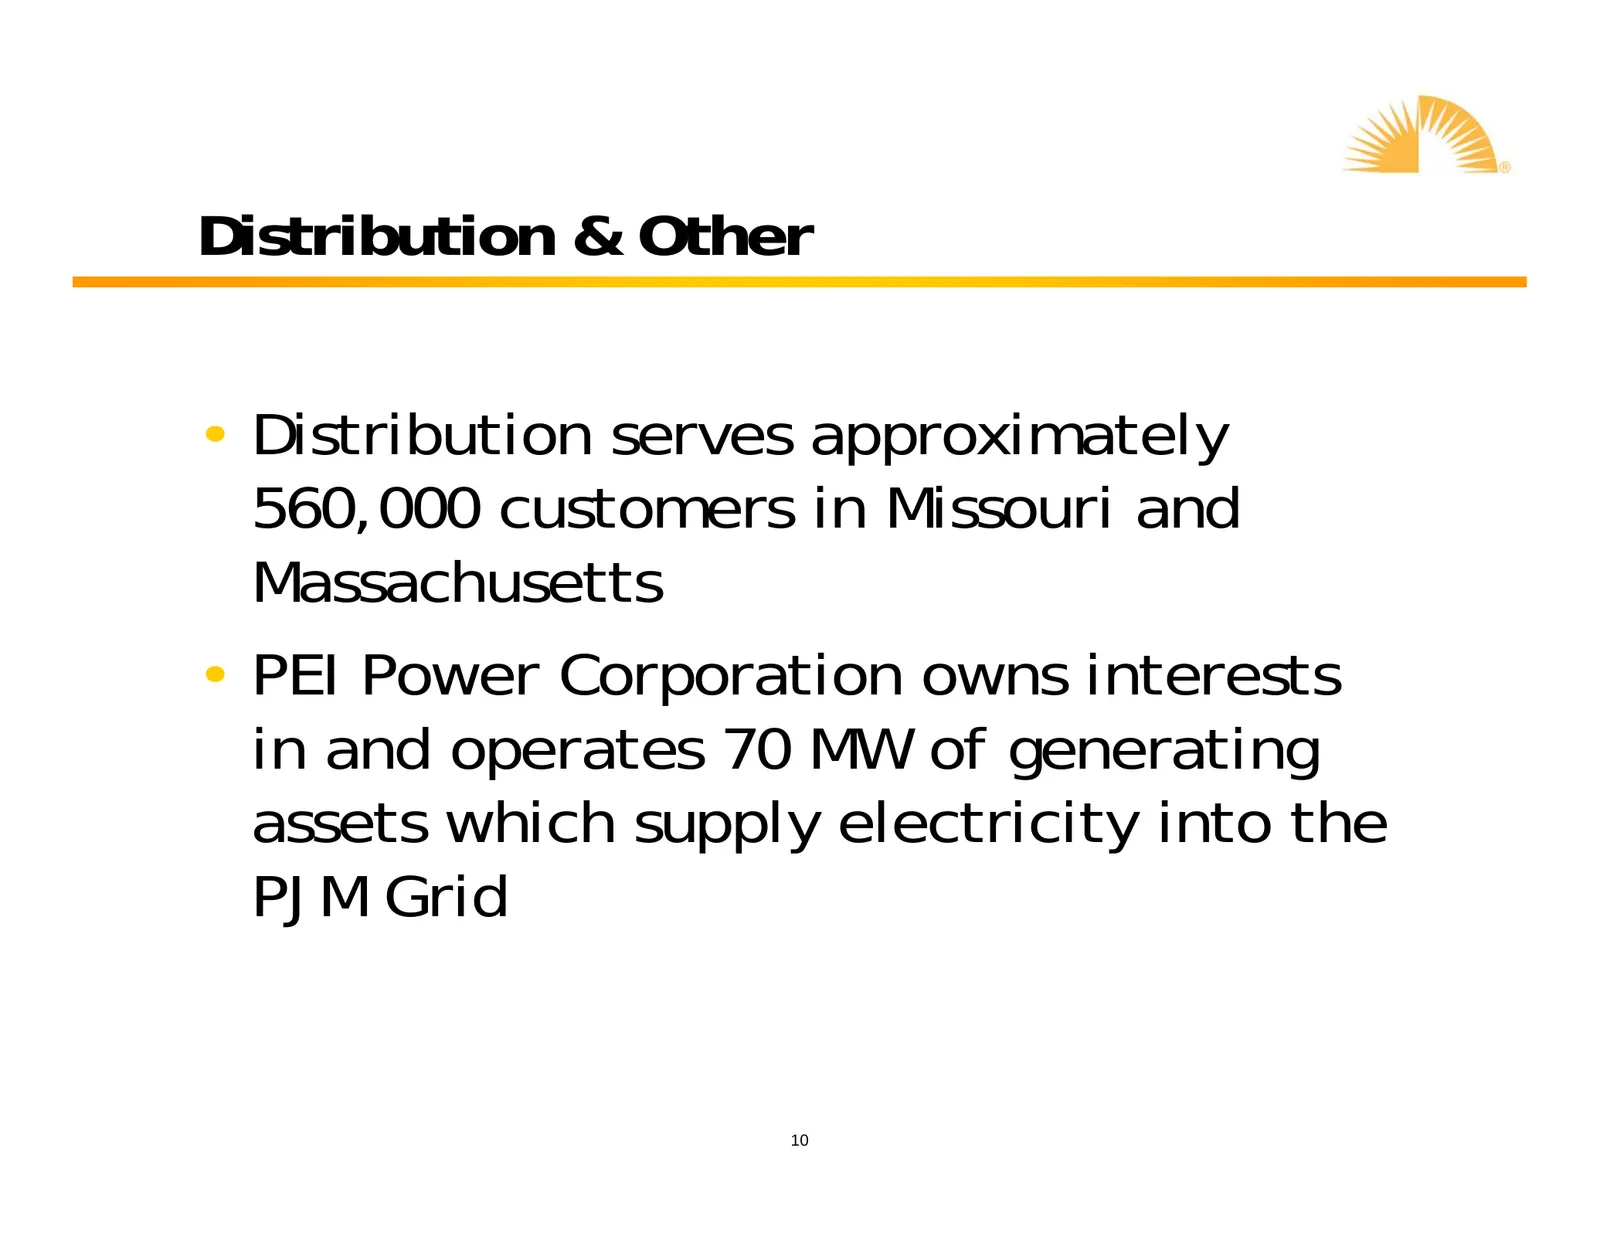
Distribution & Other • Distribution serves approximately 560,000 customers in Missouri and Massachusetts • PEI Power Corporation owns interests in and operates 70 MW of generating assets which supply electricity into the PJM Grid 10
Slide 11: Creating Shareholder Value
Creating Shareholder Value yl”,
Slide 12: Value Creation
Value Creation • Value creation will come from: –Organic growth projects –Strategic initiatives –Prudent financial management Enhancing Shareholder Value 12
Slide 13: Organic Growth Projects
Organic Growth Projects • Vast pipeline network with access to multiple supply sources and diverse markets will help fuel organic growth • Analyze trends in the natural gas industry to identify opportunities • Recent open seasons: – FGT Phase VIII expansion – FGT Pascagoula lateral to serve GulfLNG
Slide 14: Strategic Initiatives
Strategic Initiatives • Evaluate and pursue market opportunities – Strategic acquisitions – Partnership or joint venture opportunities • Continue to evaluate market conditions for creating an MLP for gathering and processing assets Focus on Value Creation Opportunities 14
Slide 15: Prudent Financial Management
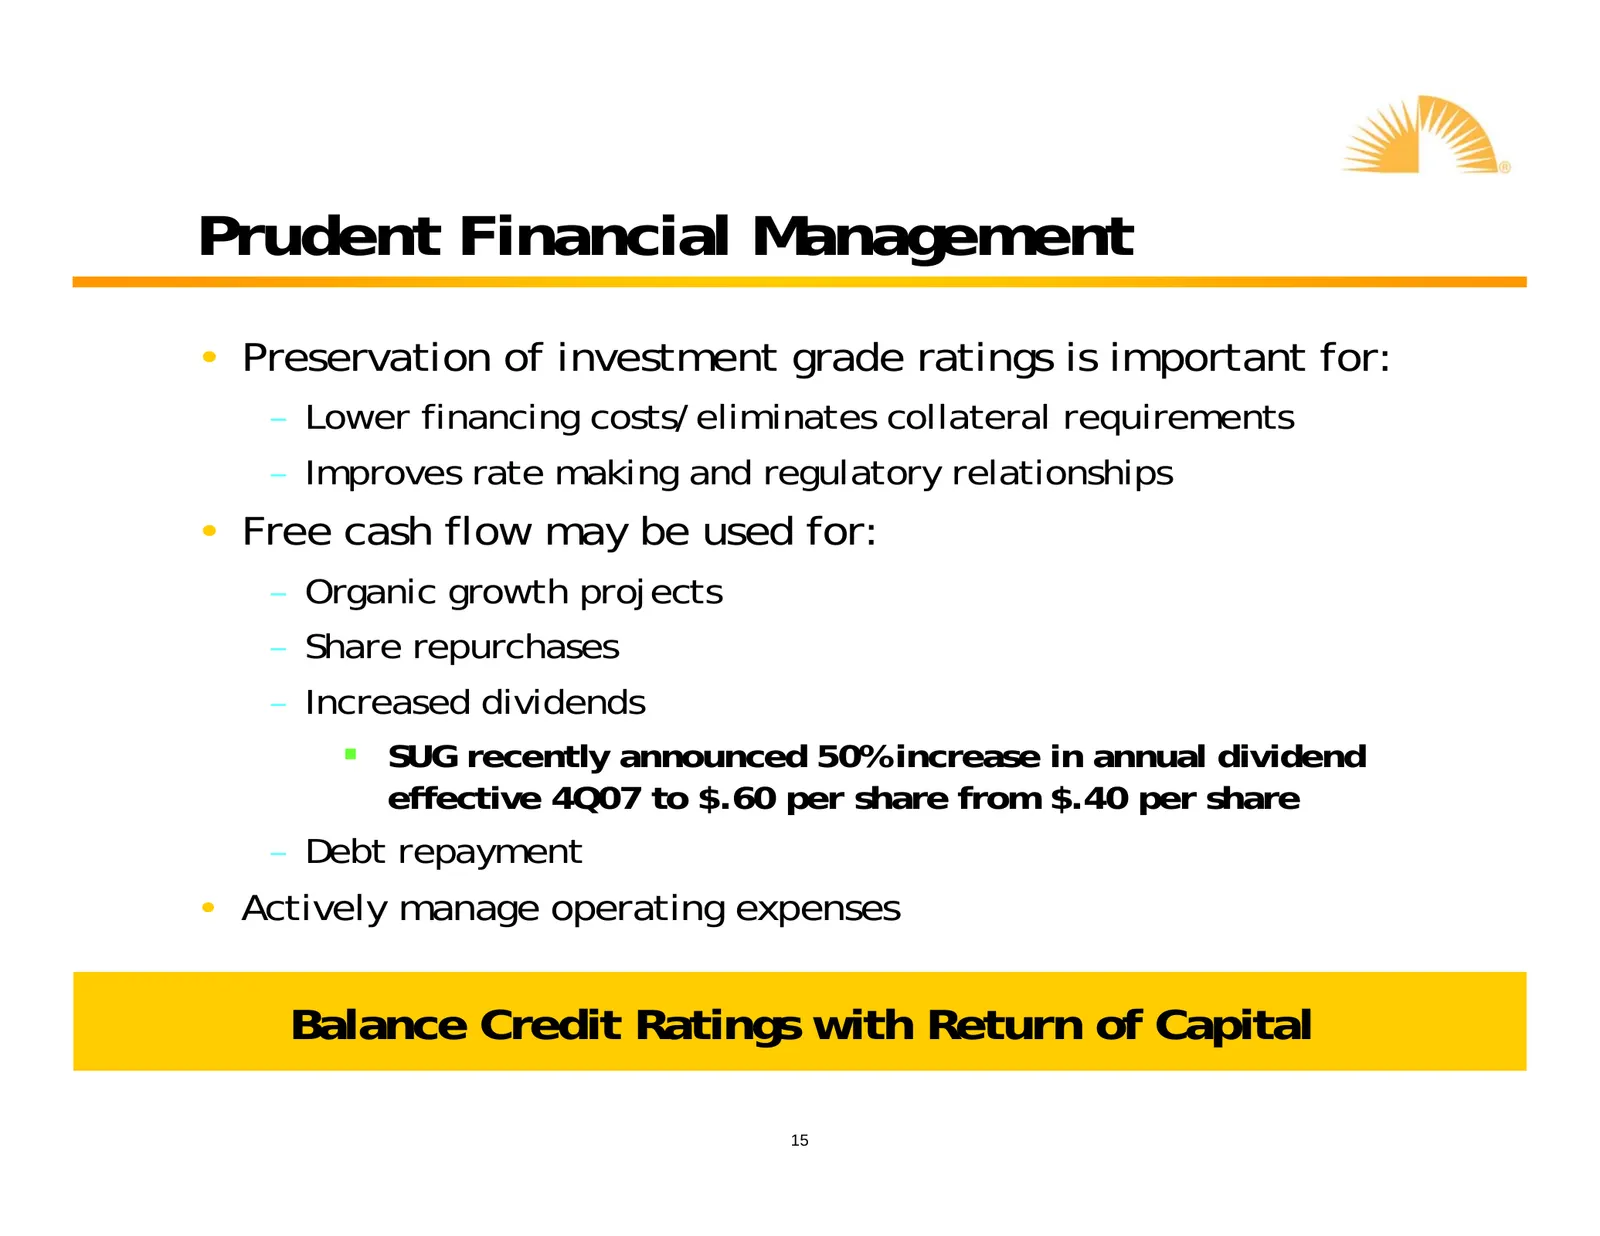
Prudent Financial Management • Preservation of investment grade ratings is important for: – Lower financing costs/eliminates collateral requirements – Improves rate making and regulatory relationships • Free cash flow may be used for: – Organic growth projects – Share repurchases – Increased dividen

Slide 16: 2007 Accomplishments & Recent Announcements
2007 Accomplishments & Recent Announcements
Slide 17: Significant Events - 2007
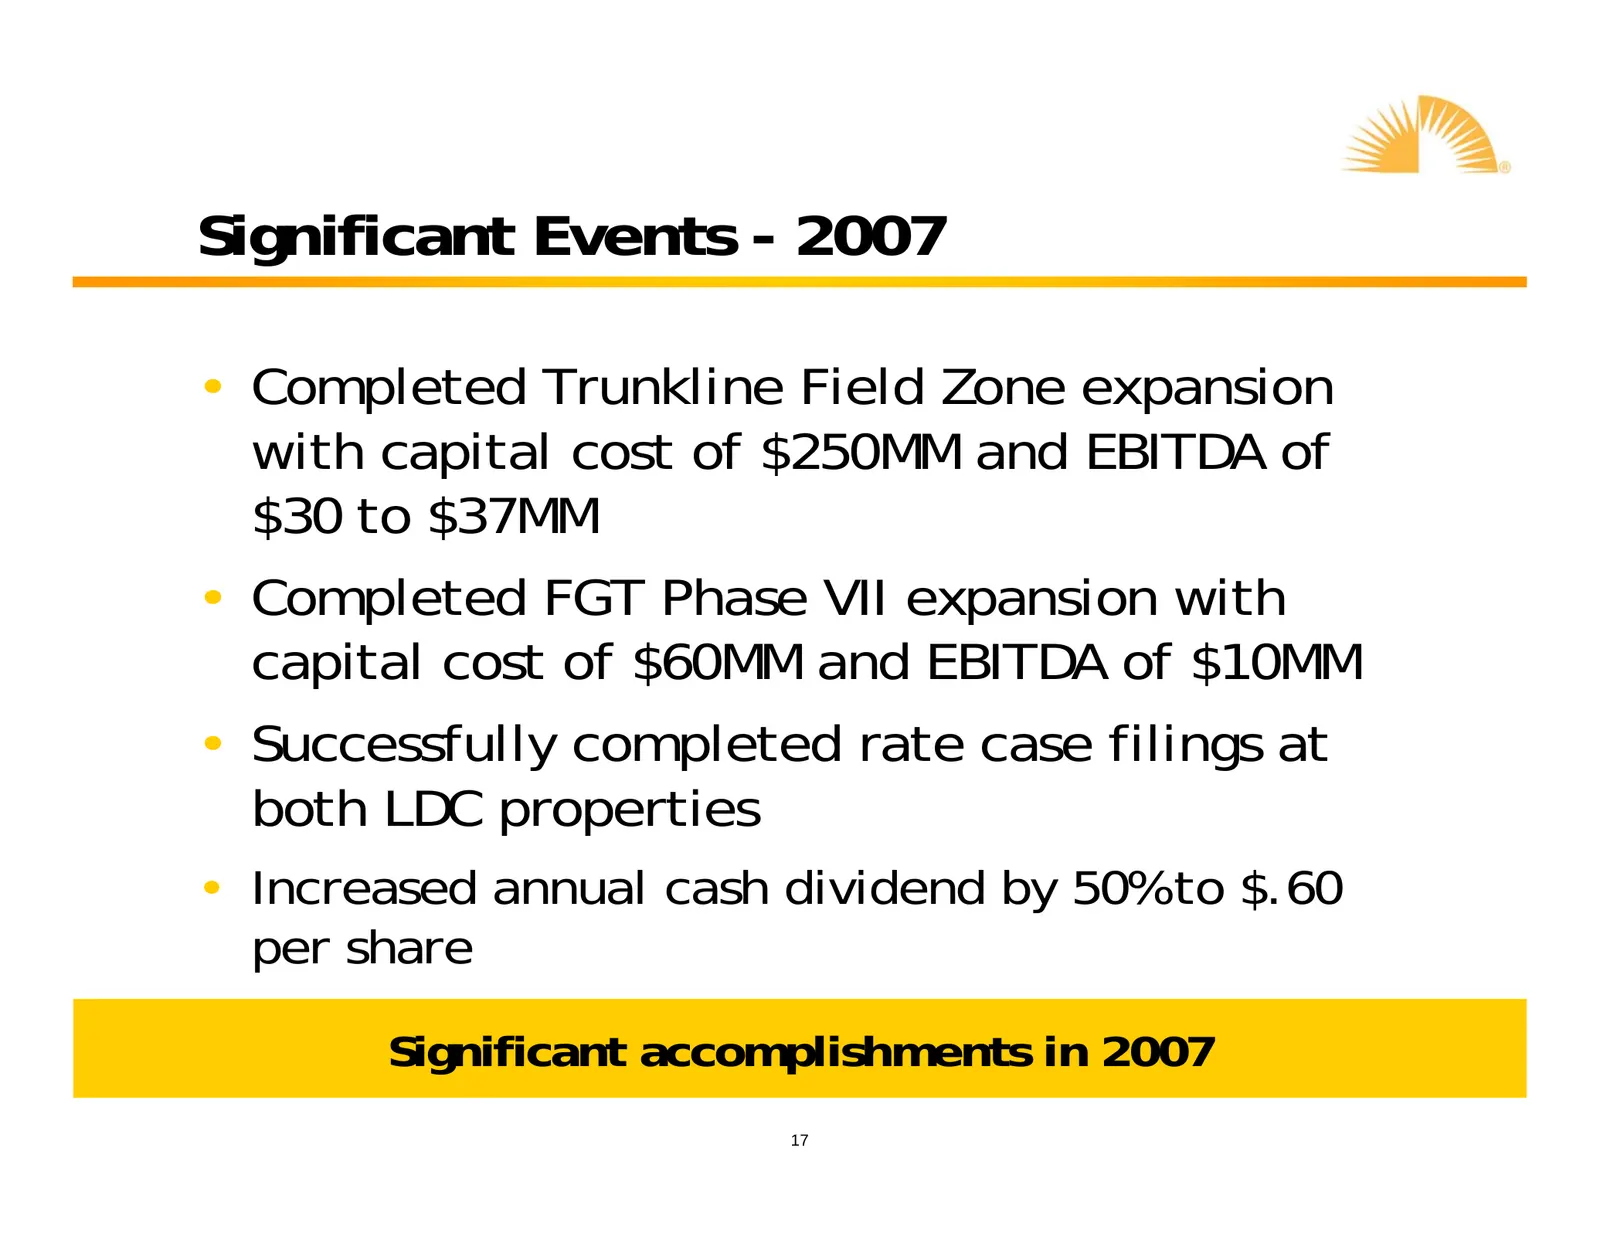
Significant Events - 2007 • Completed Trunkline Field Zone expansion with capital cost of $250MM and EBITDA of $30 to $37MM • Completed FGT Phase VII expansion with capital cost of $60MM and EBITDA of $10MM • Successfully completed rate case filings at both LDC properties • Increased annual cash div
Slide 18: Recent Announcements
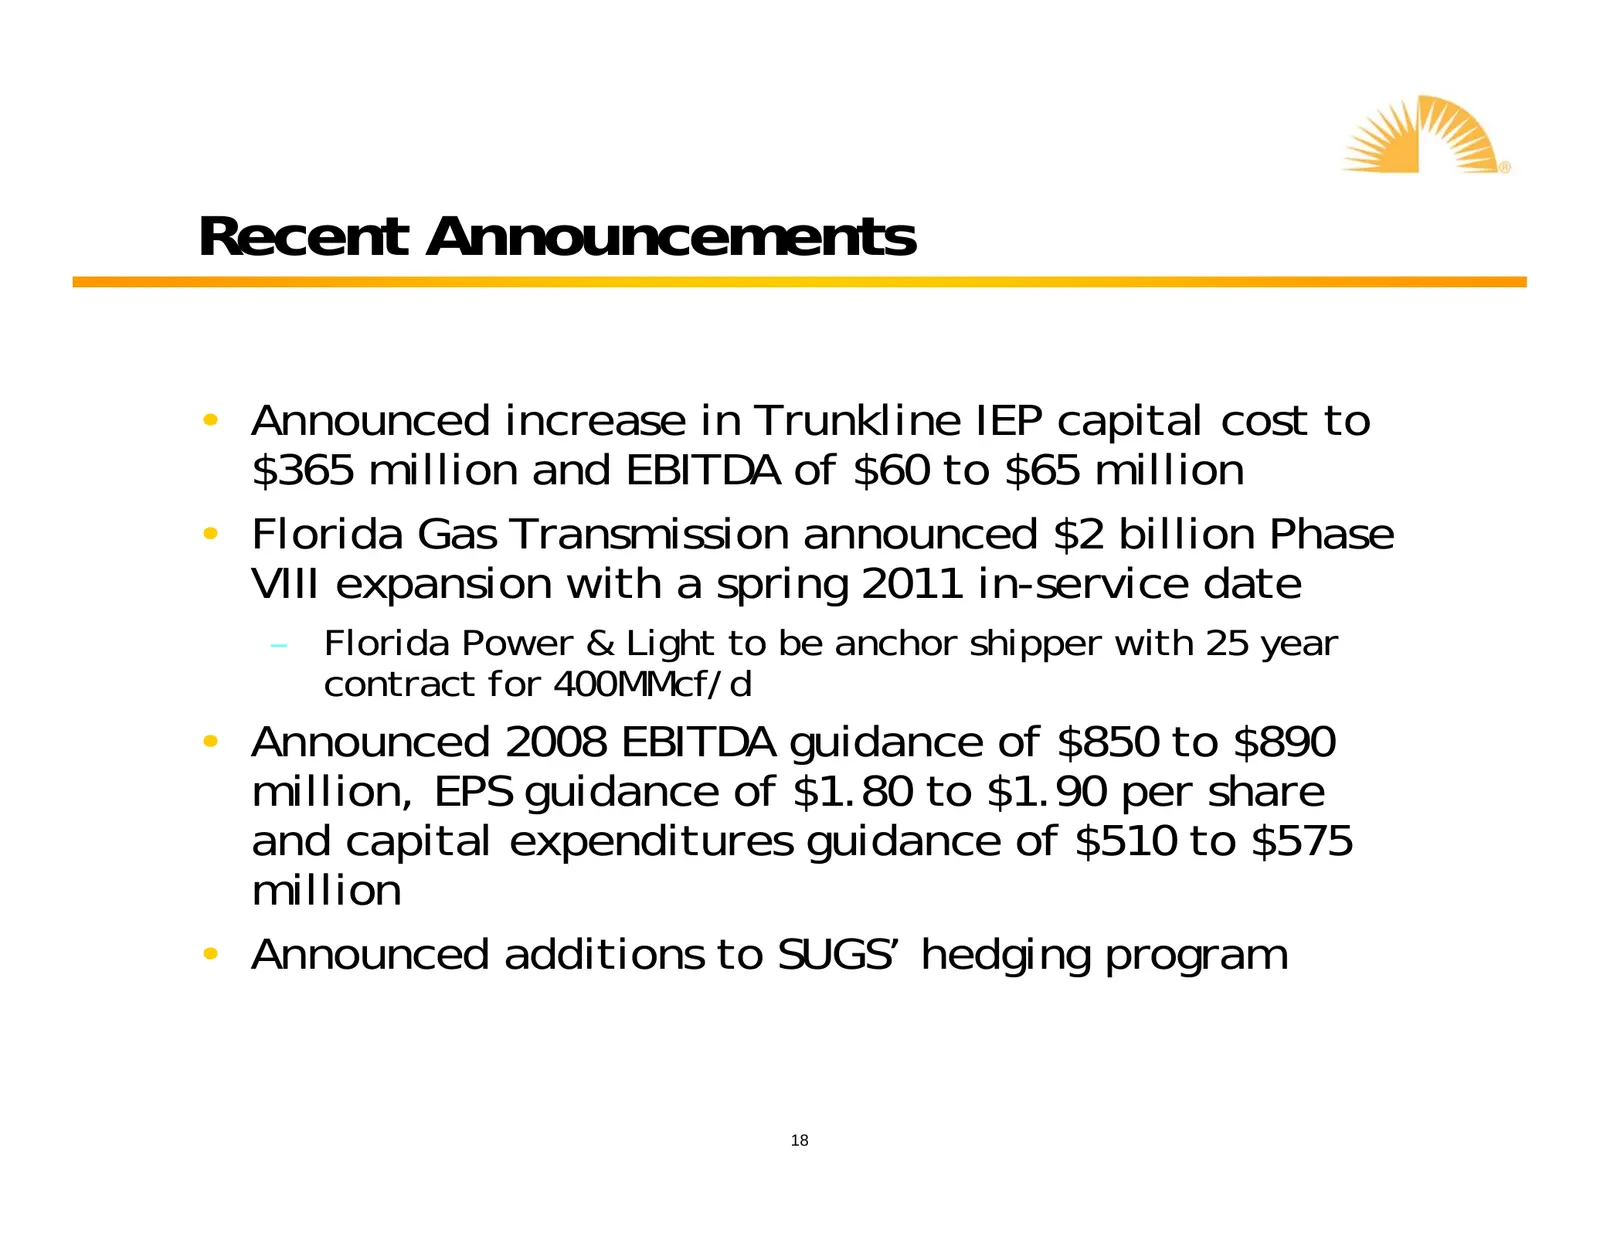
Recent Announcements • Announced increase in Trunkline IEP capital cost to $365 million and EBITDA of $60 to $65 million • Florida Gas Transmission announced $2 billion Phase VIII expansion with a spring 2011 in-service date – Florida Power & Light to be anchor shipper with 25 year contract for 400M

Slide 19: Transportation & Storage
Transportation & Storage yl”,
Slide 20: Transportation & Storage Assets
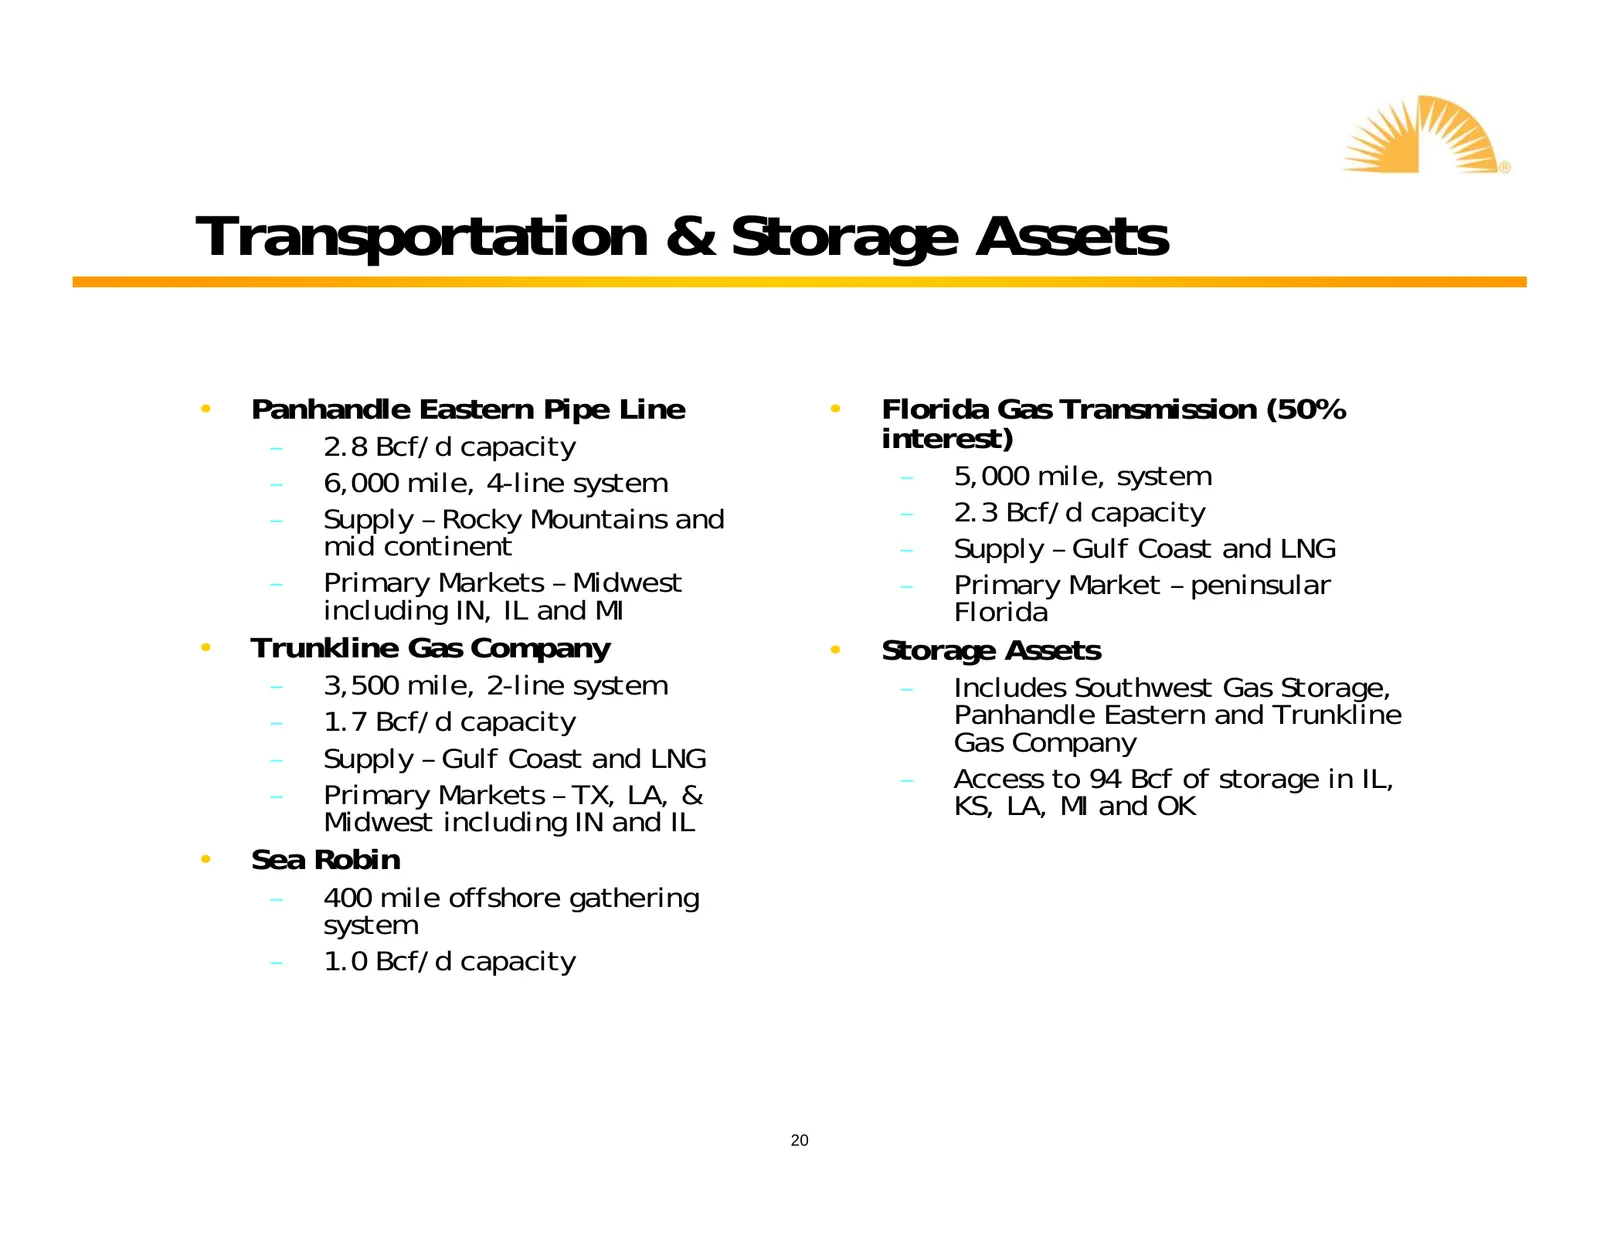
Transportation & Storage Assets • Panhandle Eastern Pipe Line • Florida Gas Transmission (50% – 2.8 Bcf/d capacity interest) – 6,000 mile, 4-line system – 5,000 mile, system – Supply – Rocky Mountains and – 2.3 Bcf/d capacity mid continent – Supply – Gulf Coast and LNG – Primary Markets – Midwest –
Slide 21: Trunkline LNG Company
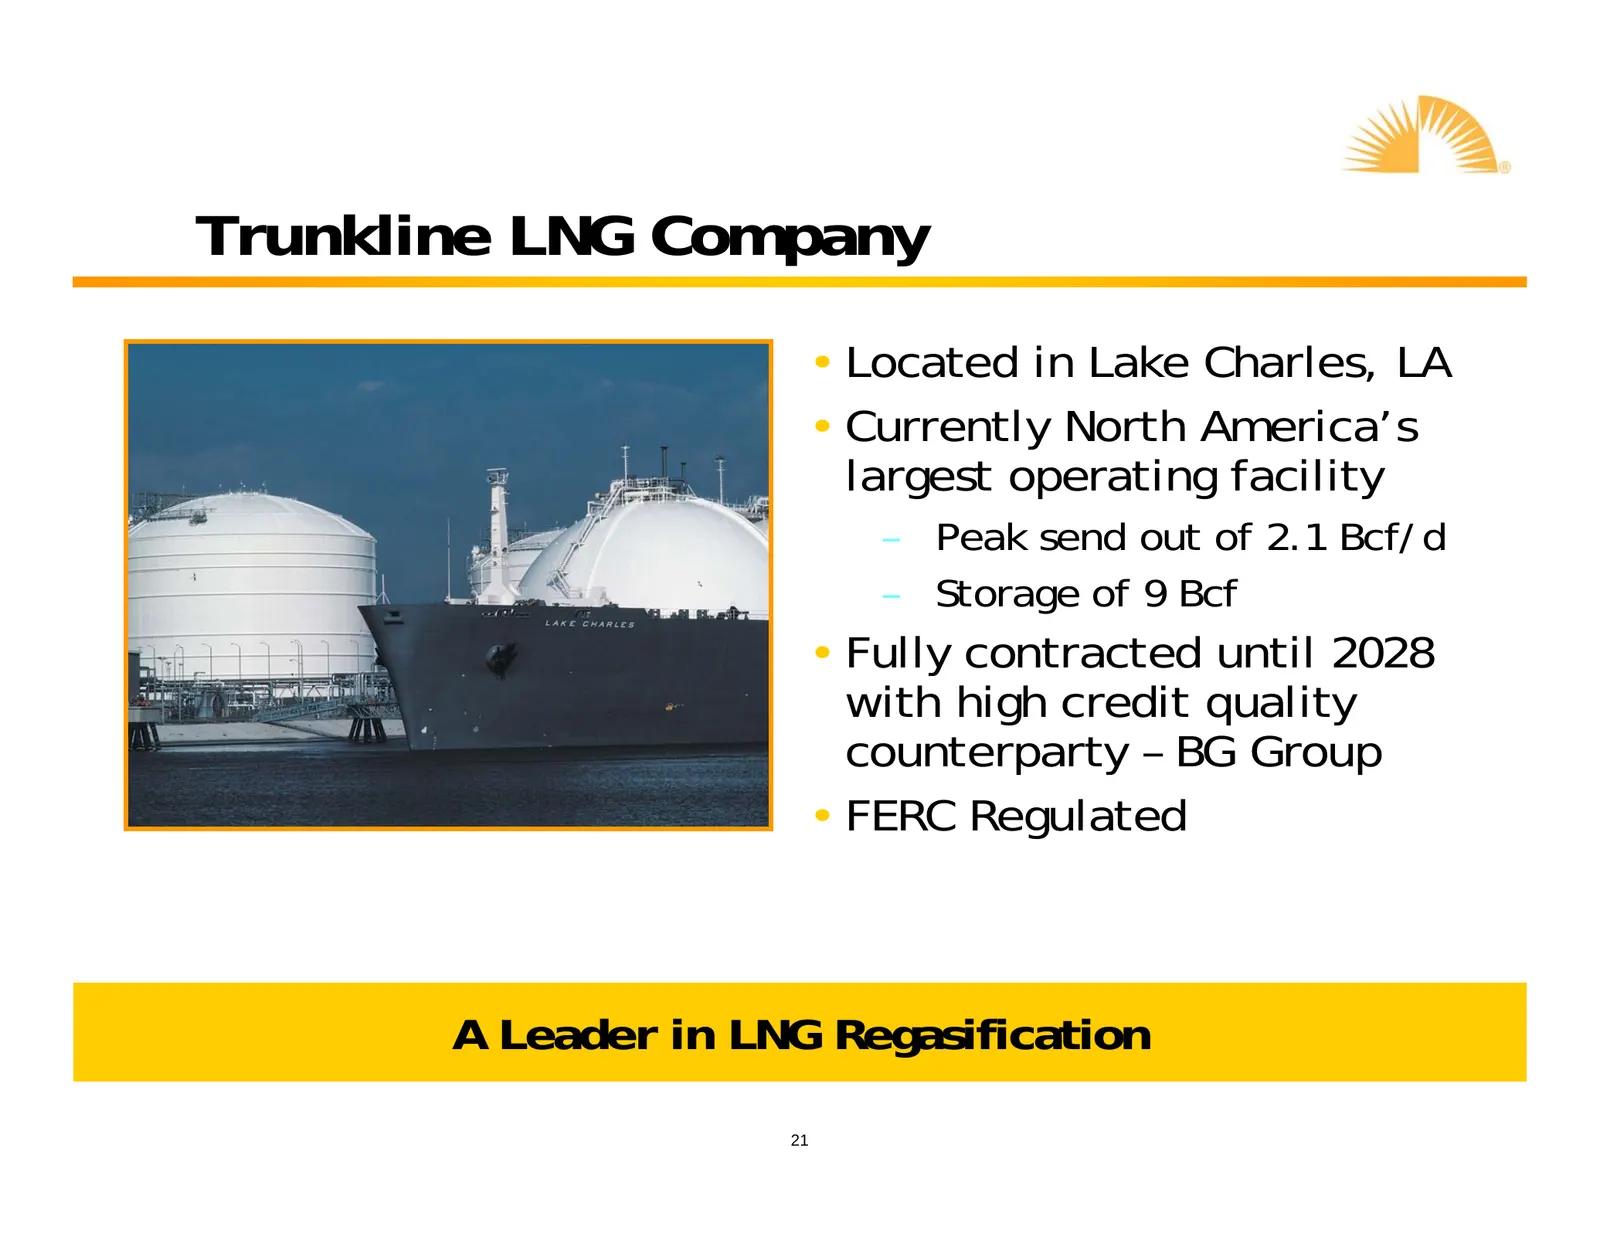
Trunkline LNG Company • Located in Lake Charles, LA • Currently North America’s largest operating facility – Peak send out of 2.1 Bcf/d – Storage of 9 Bcf • Fully contracted until 2028 with high credit quality counterparty – BG Group • FERC Regulated A Leader in LNG Regasification 21

Slide 22: T&S Growth Drivers
T&S Growth Drivers yl”,
Slide 23: Trunkline Field Zone Expansion
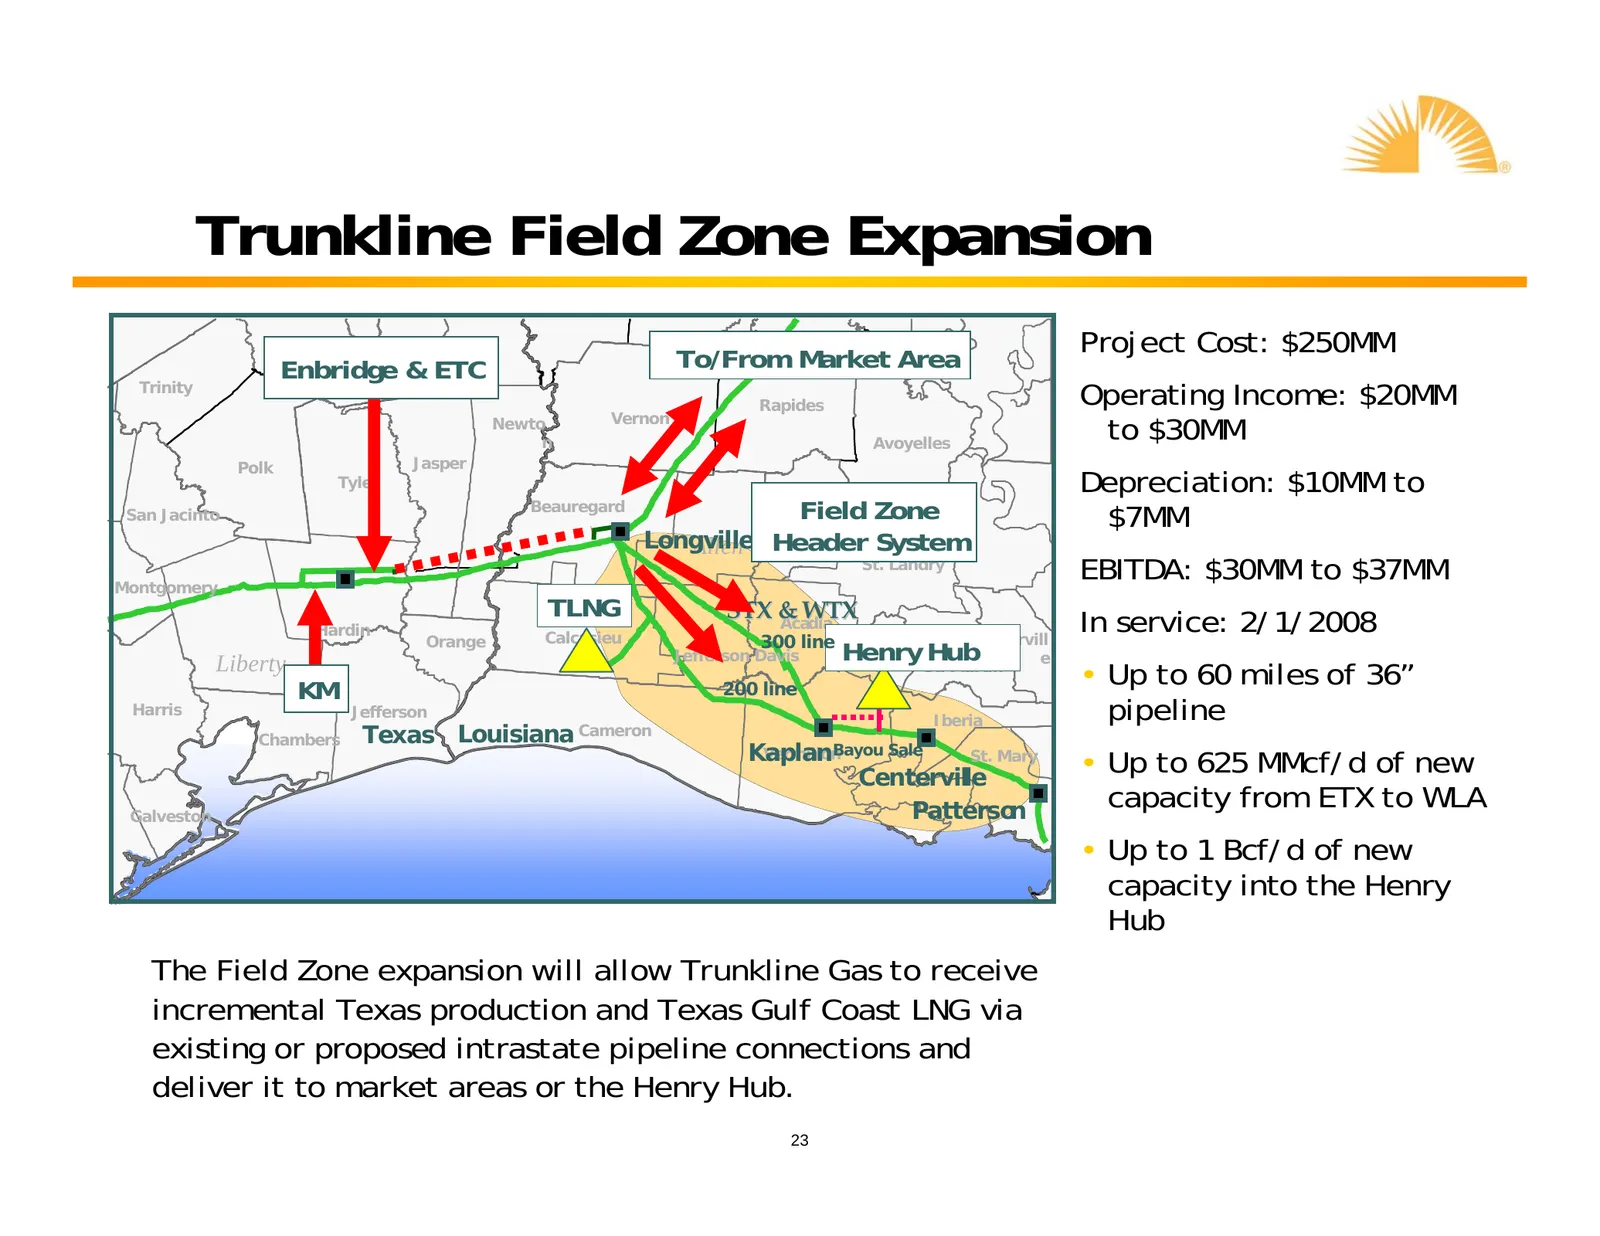
Trunkline Field Zone Expansion To/From Market Area Project Cost: $250MM Enbridge Angelina & ETC Trinity Rapides Operating Income: $20MM Vernon Newto n Avoyelles to $30MM Polk Jasper Tyler Depreciation: $10MM to San Jacinto Beauregard Field Zone Evangeline $7MM Allen Header System Longville Montgomer
Slide 24: Trunkline LNG: Infrastructure Enhancement Project
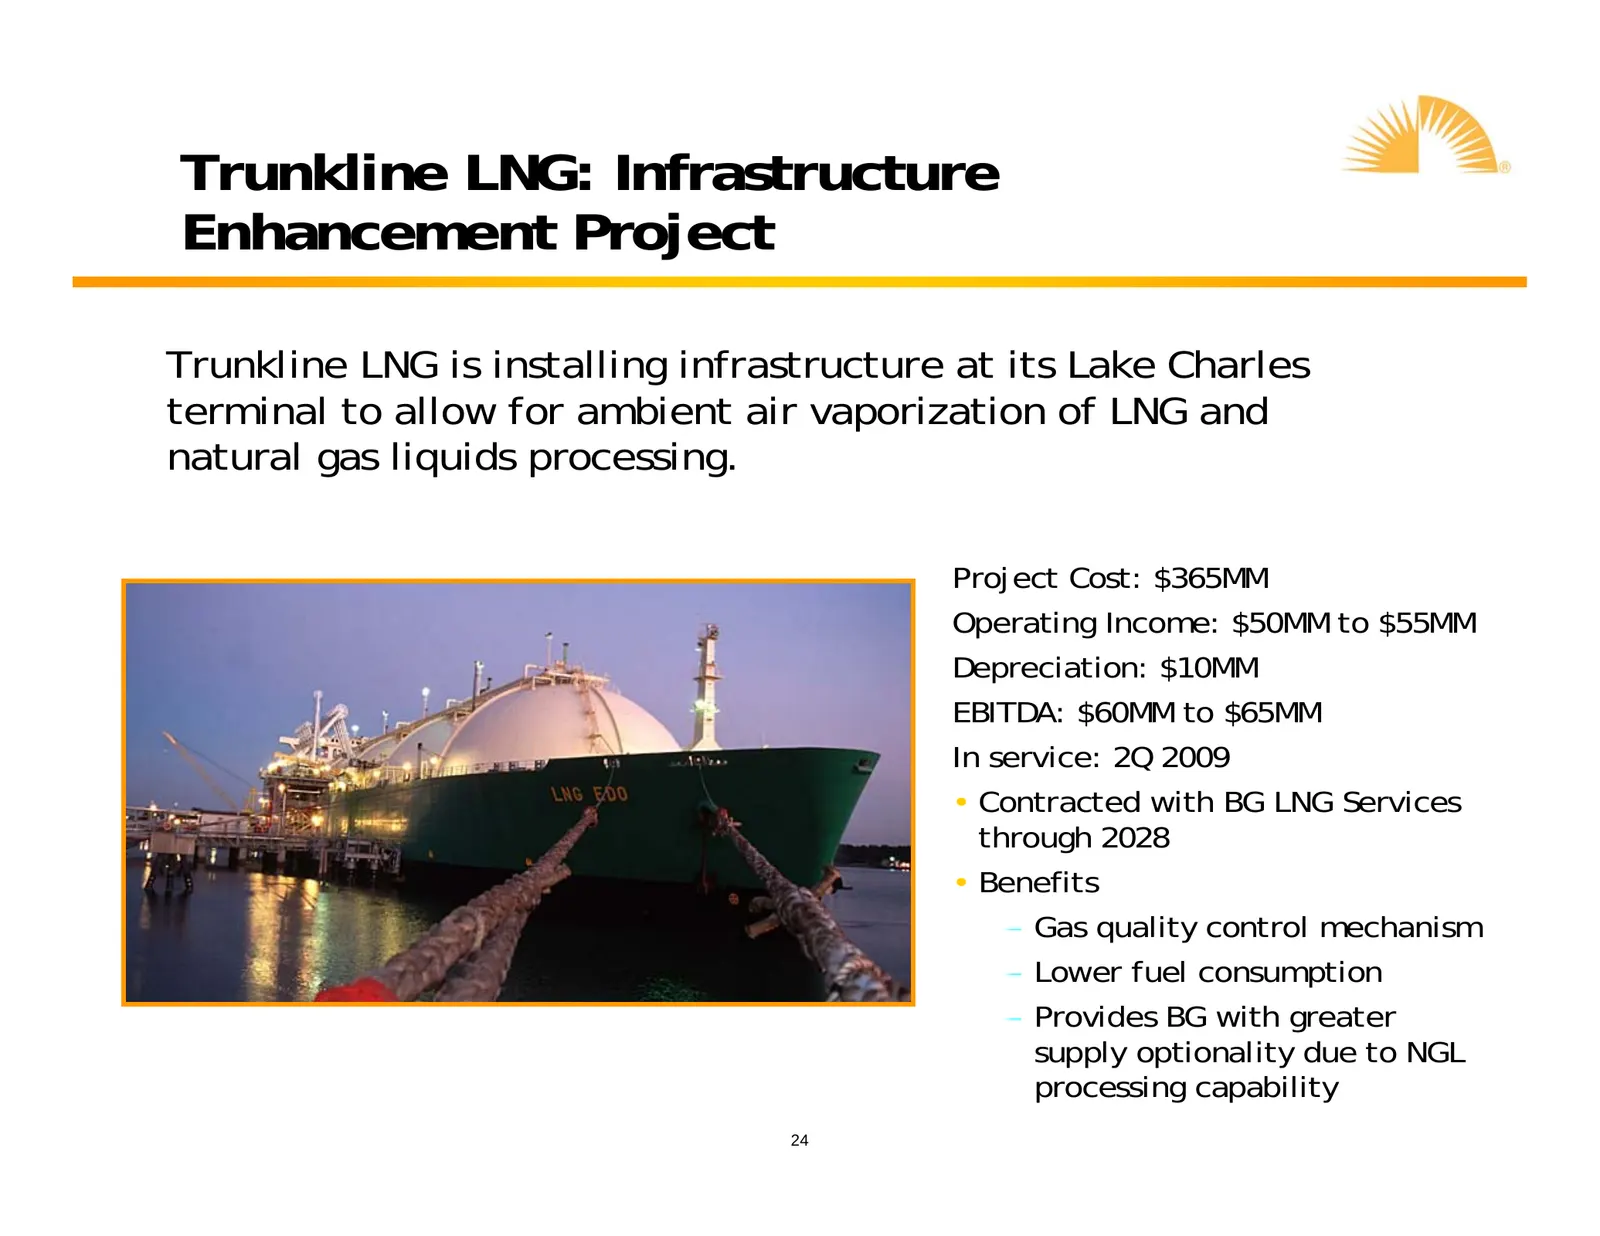
Trunkline LNG: Infrastructure Enhancement Project Trunkline LNG is installing infrastructure at its Lake Charles terminal to allow for ambient air vaporization of LNG and natural gas liquids processing. Project Cost: $365MM Operating Income: $50MM to $55MM Depreciation: $10MM EBITDA: $60MM to $65MM
Slide 25: FGT Phase VIII Expansion
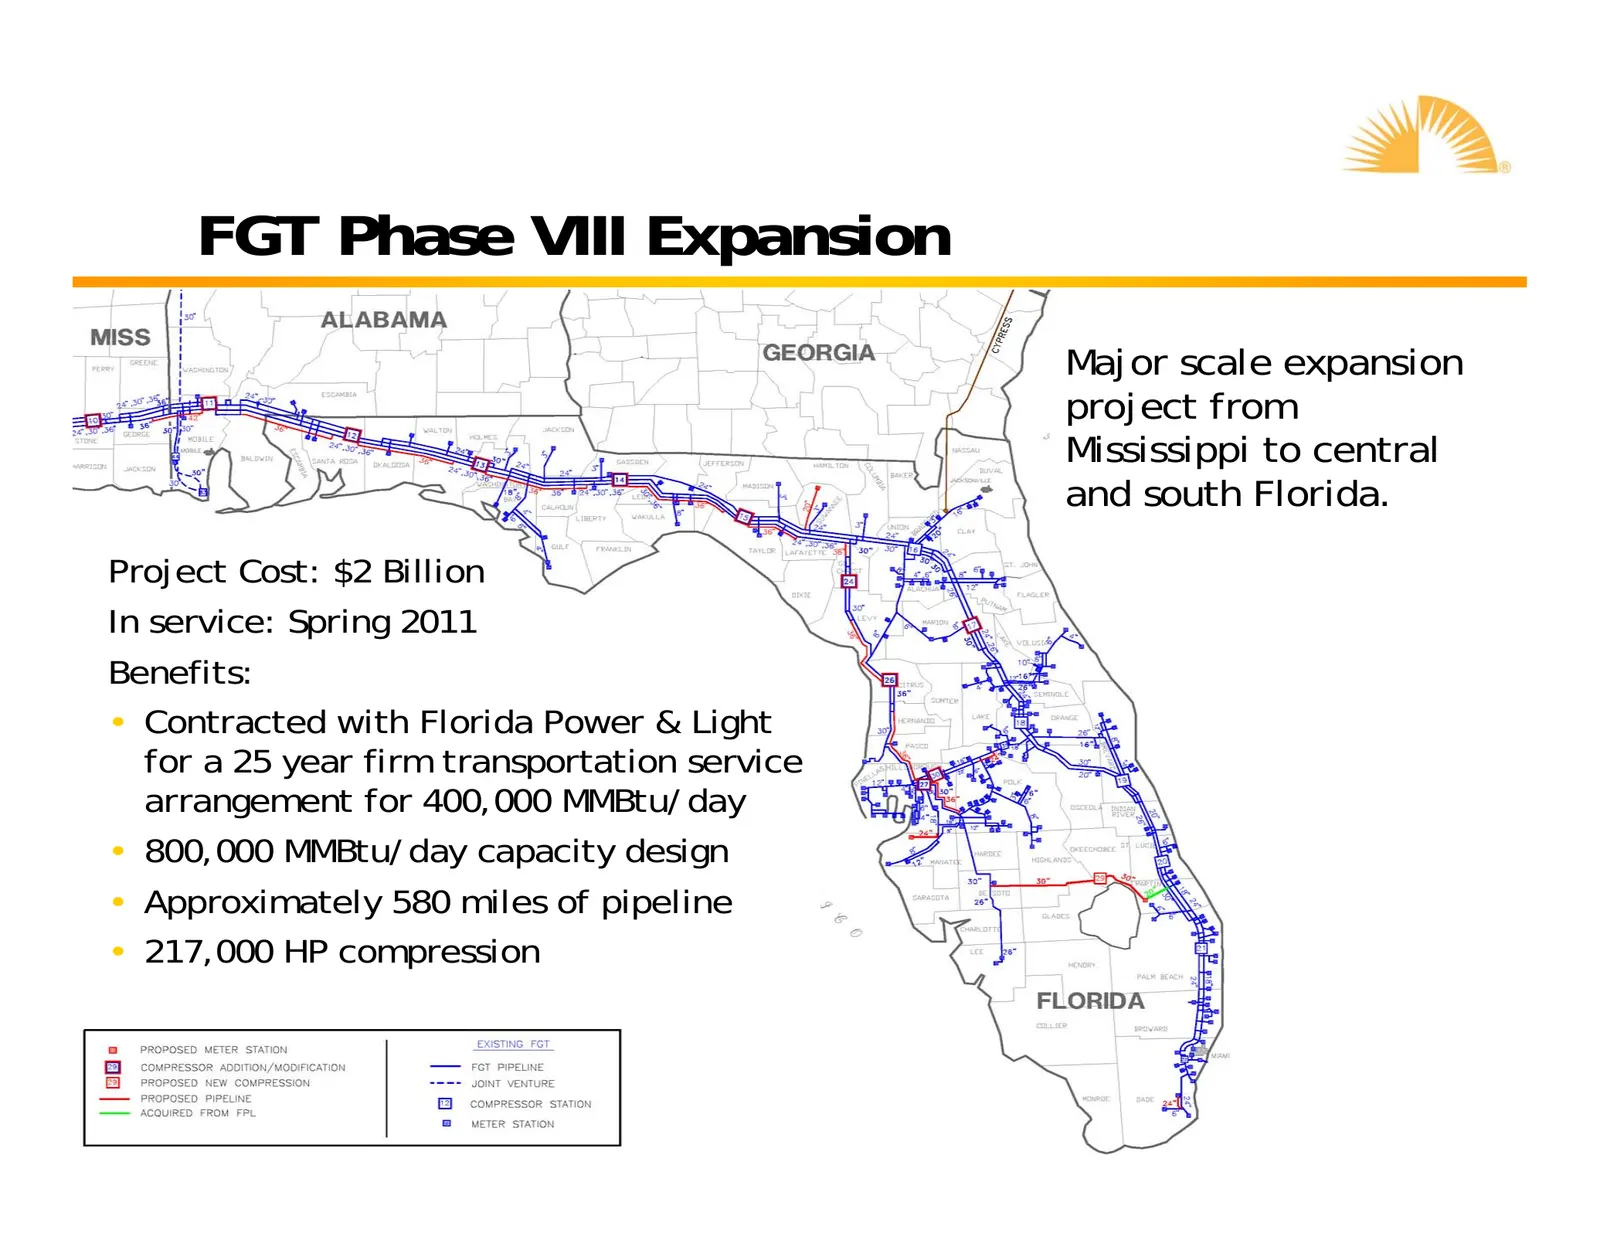
FGT Phase VIII Expansion Major scale expansion project from Mississippi to central and south Florida. Project Cost: $2 Billion In service: Spring 2011 Benefits: • Contracted with Florida Power & Light for a 25 year firm transportation service arrangement for 400,000 MMBtu/day • 800,000 MMBtu/day cap
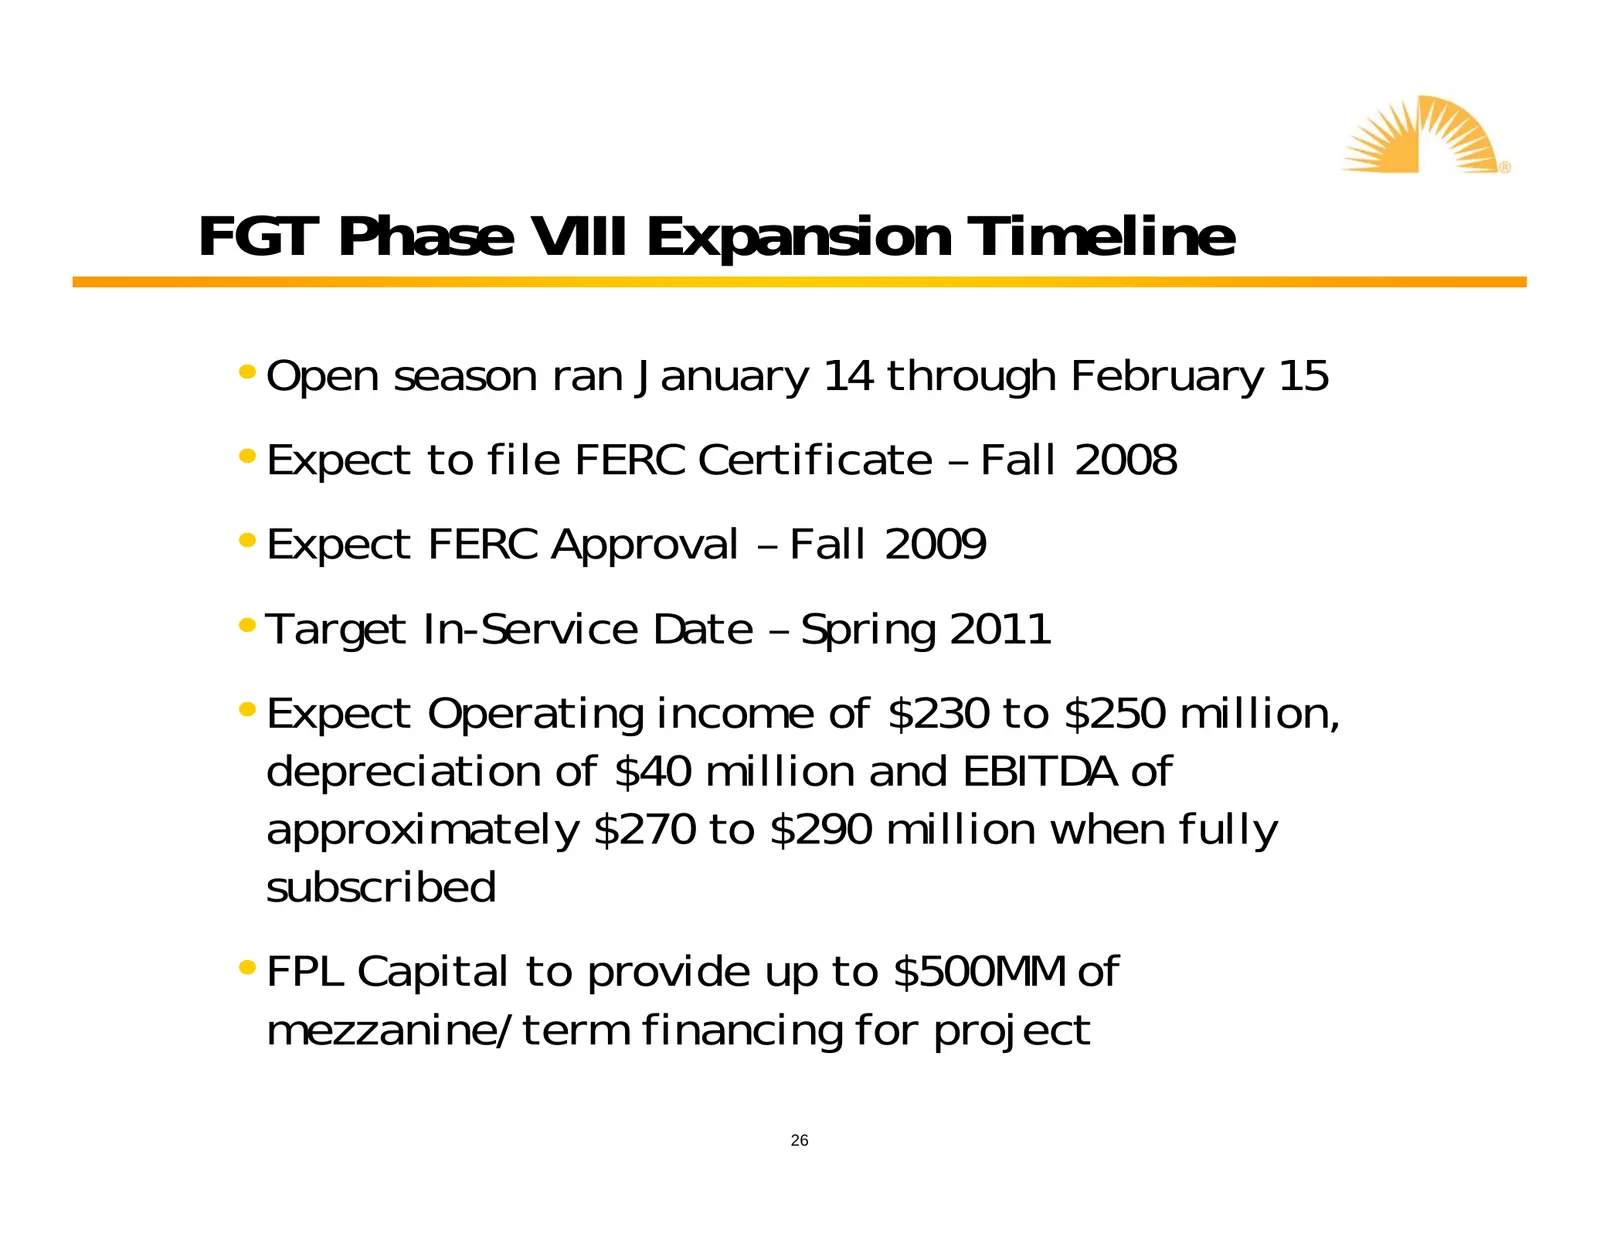
Slide 26: FGT Phase VIII Expansion Timeline
FGT Phase VIII Expansion Timeline • Open season ran January 14 through February 15 • Expect to file FERC Certificate – Fall 2008 • Expect FERC Approval – Fall 2009 • Target In-Service Date – Spring 2011 • Expect Operating income of $230 to $250 million, depreciation of $40 million and EBITDA of appr
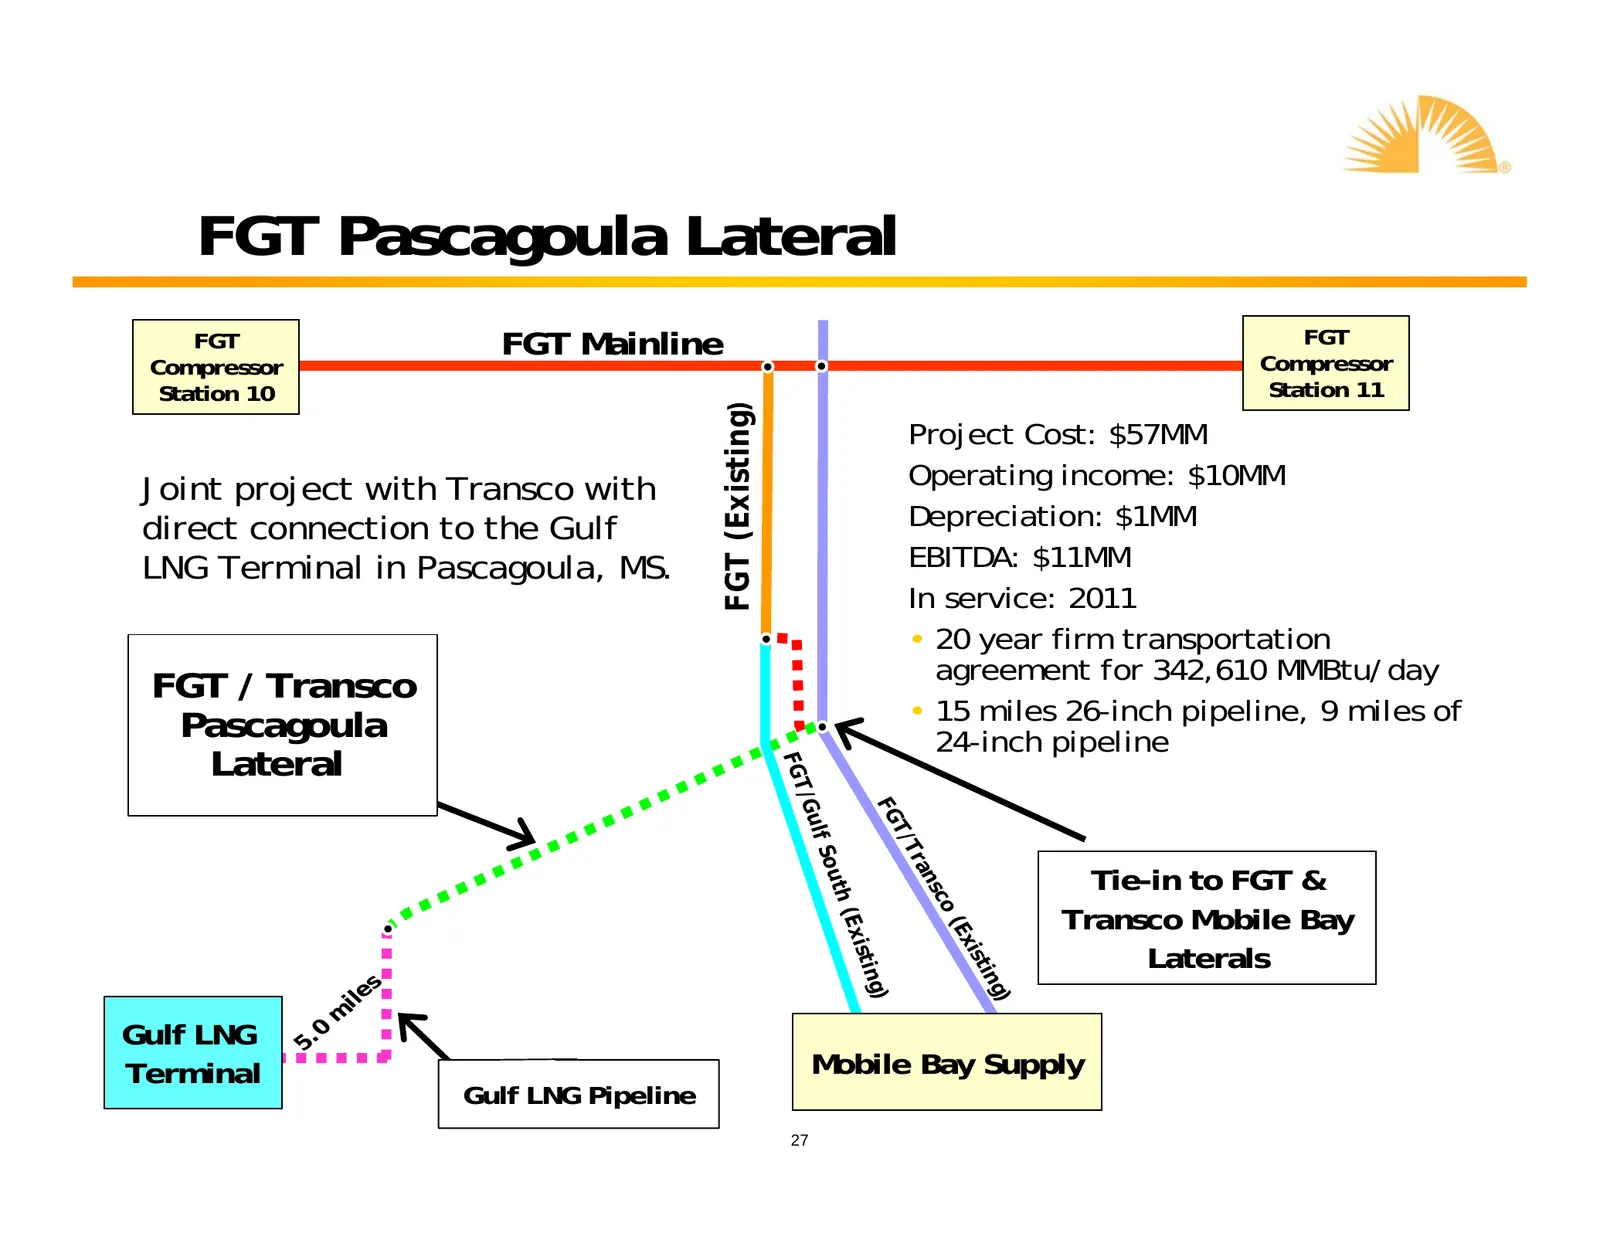
Slide 27: FGT Pascagoula Lateral
FGT Pascagoula Lateral FGT FGT Mainline FGT Compressor Compressor Station 10 Station 11 FGT (Existing) Project Cost: $57MM Joint project with Transco with Operating income: $10MM direct connection to the Gulf Depreciation: $1MM LNG Terminal in Pascagoula, MS. EBITDA: $11MM In service: 2011 • 20 year

Slide 28: Gathering & Processing
Gathering & Processing yl”,
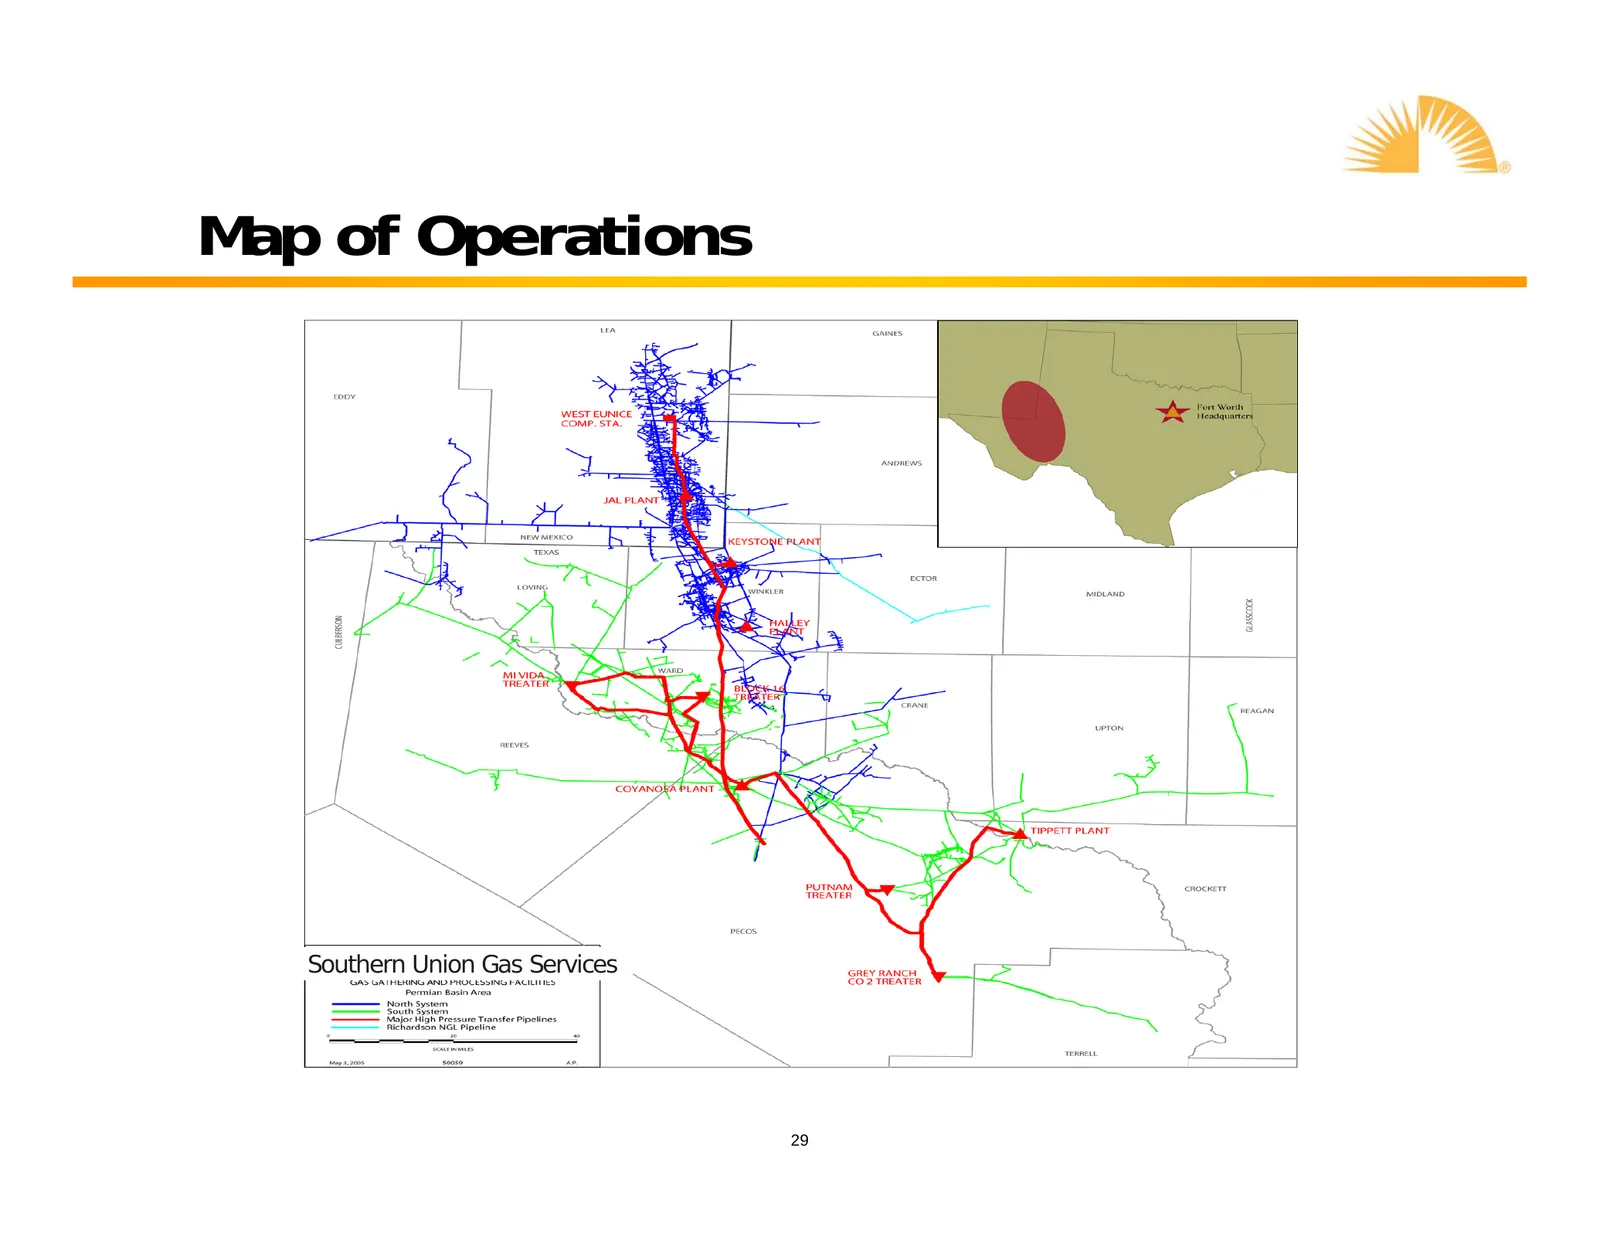
Slide 29: Map of Operations
Map of Operations •Southern Union Gas Services 29
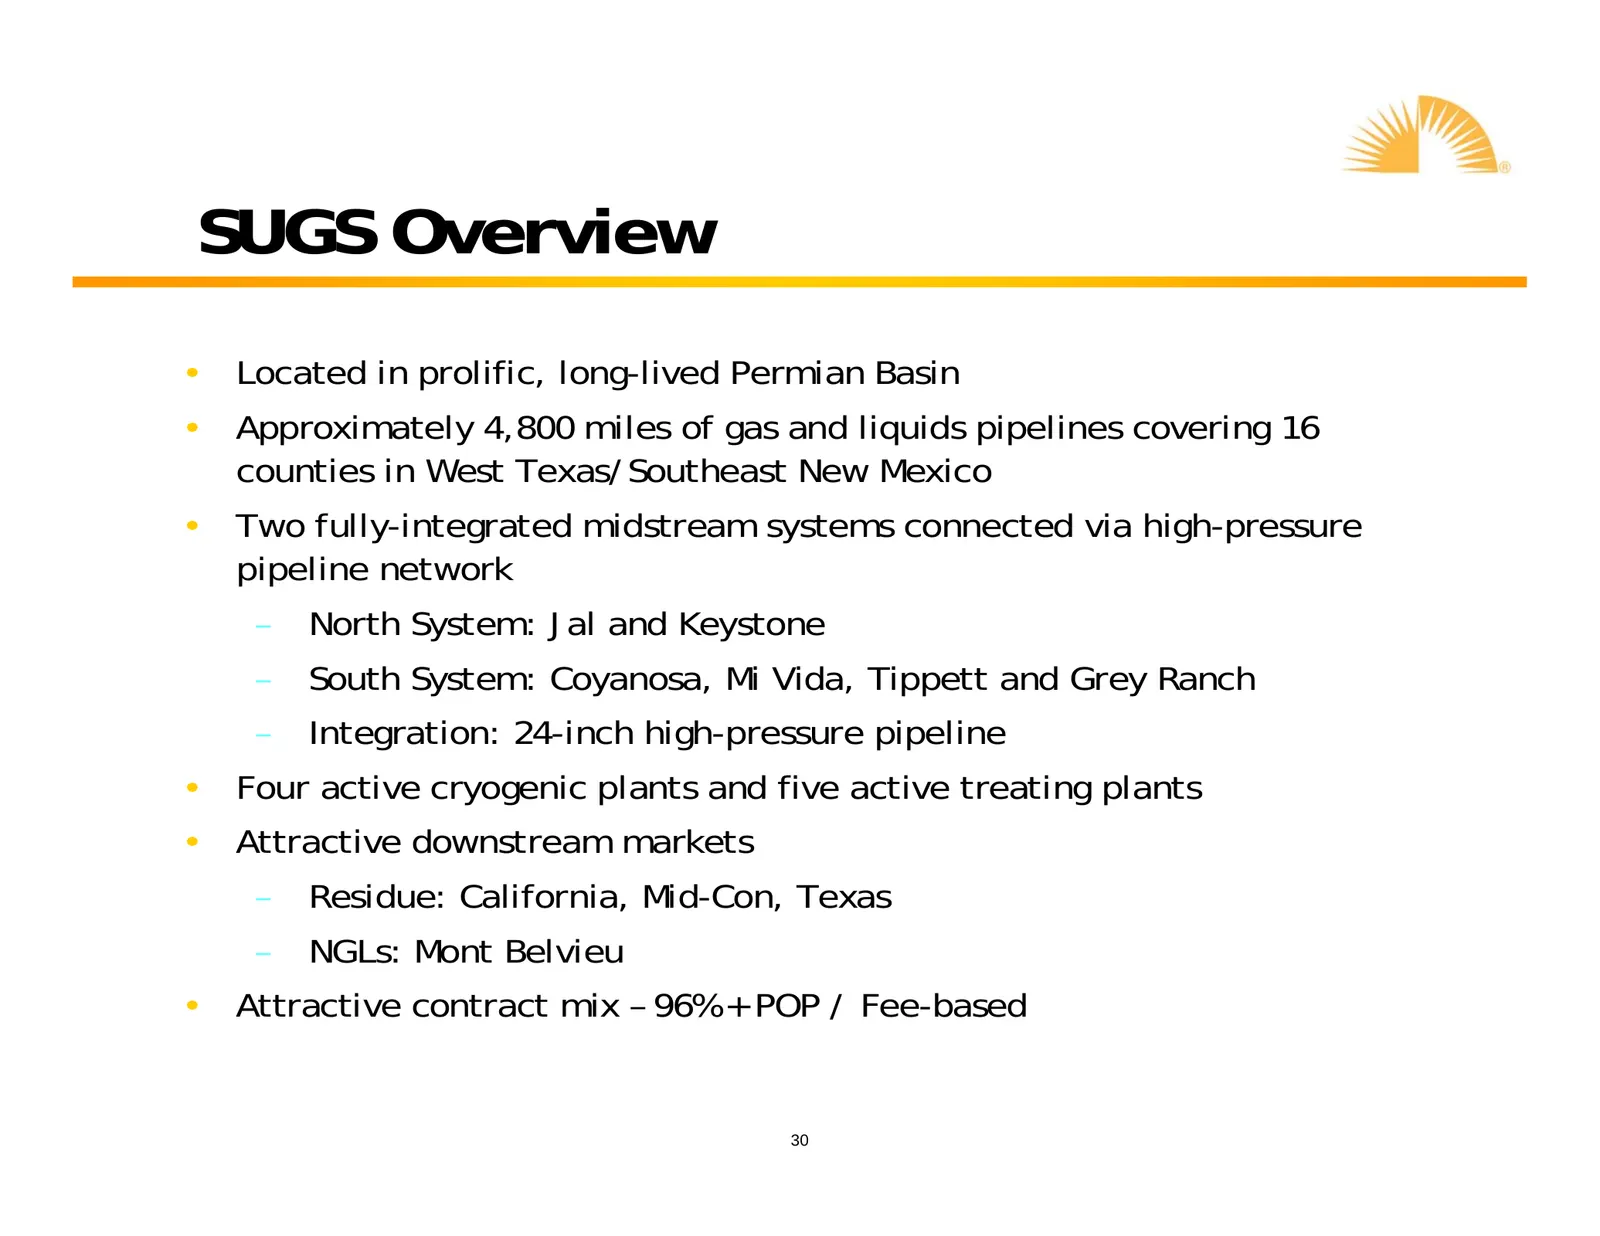
Slide 30: SUGS Overview
SUGS Overview • Located in prolific, long-lived Permian Basin • Approximately 4,800 miles of gas and liquids pipelines covering 16 counties in West Texas/Southeast New Mexico • Two fully-integrated midstream systems connected via high-pressure pipeline network – North System: Jal and Keystone – Sout
Slide 31: North System
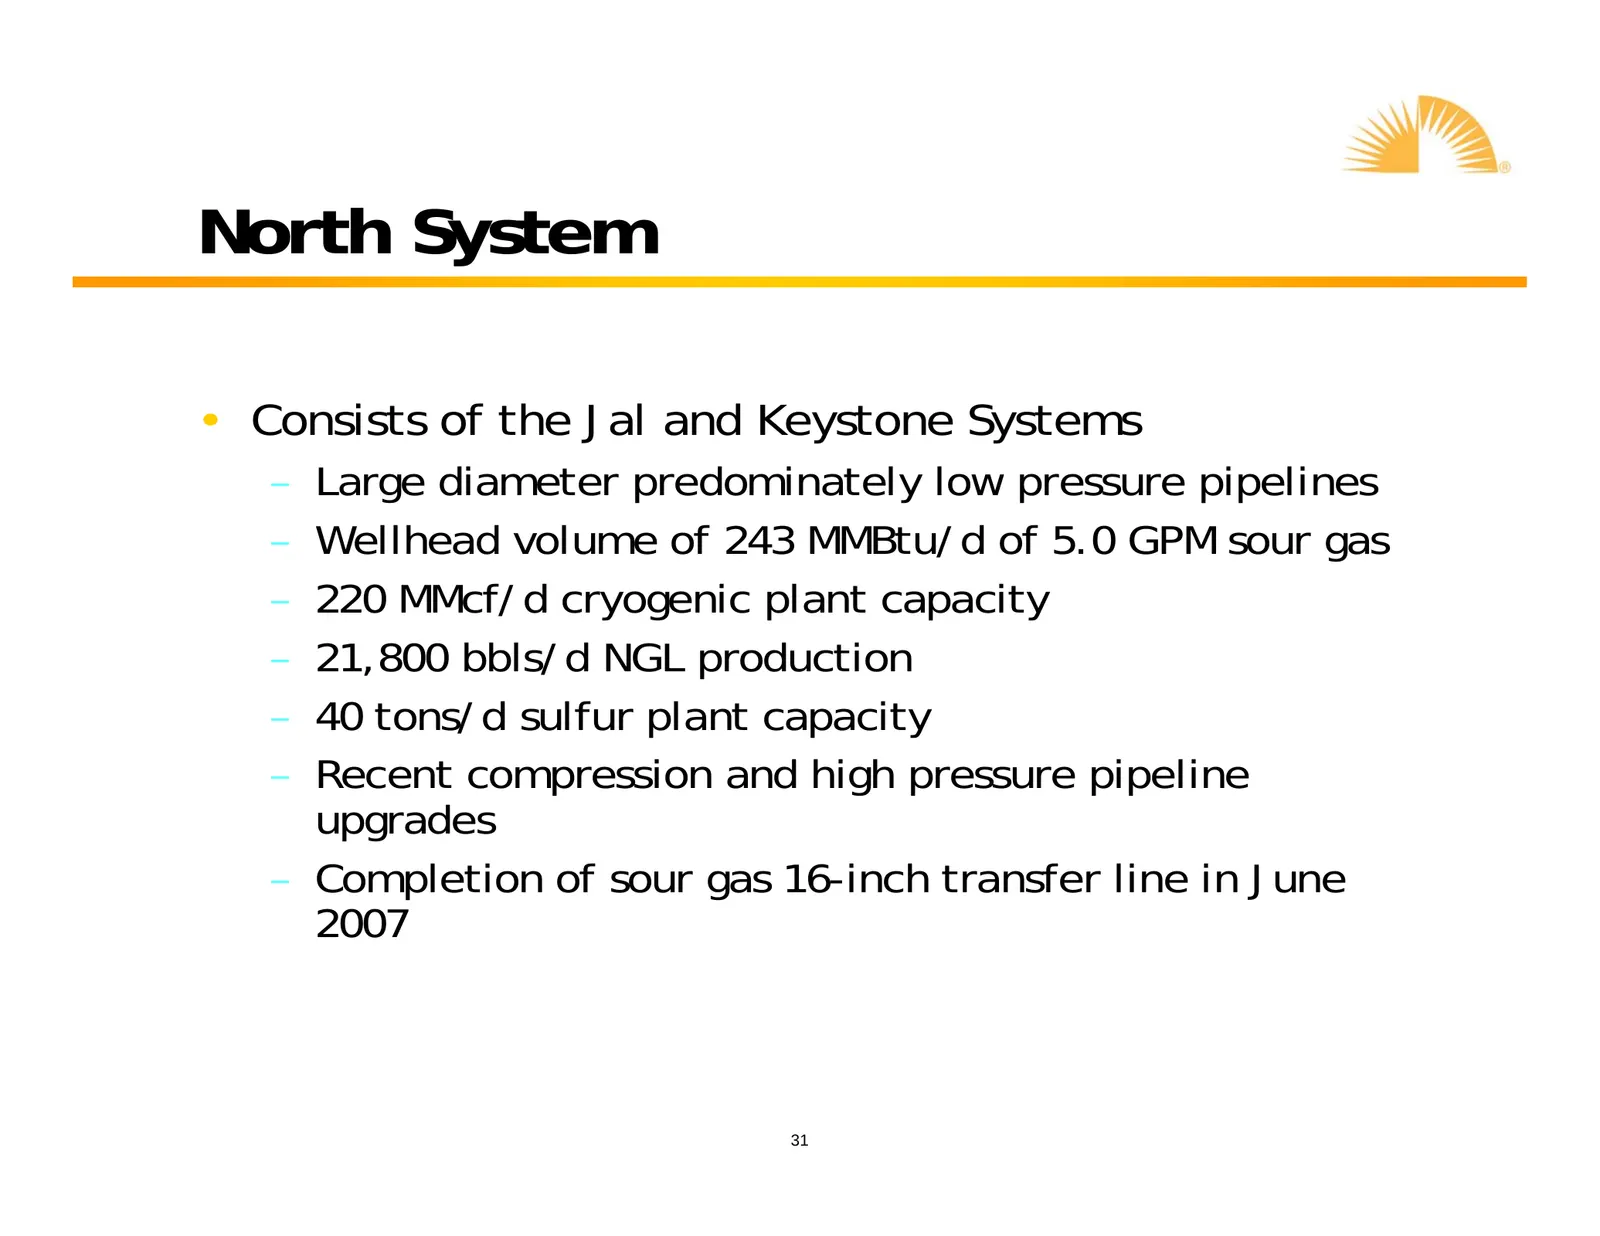
North System • Consists of the Jal and Keystone Systems – Large diameter predominately low pressure pipelines – Wellhead volume of 243 MMBtu/d of 5.0 GPM sour gas – 220 MMcf/d cryogenic plant capacity – 21,800 bbls/d NGL production – 40 tons/d sulfur plant capacity – Recent compression and high pres
Slide 32: South System
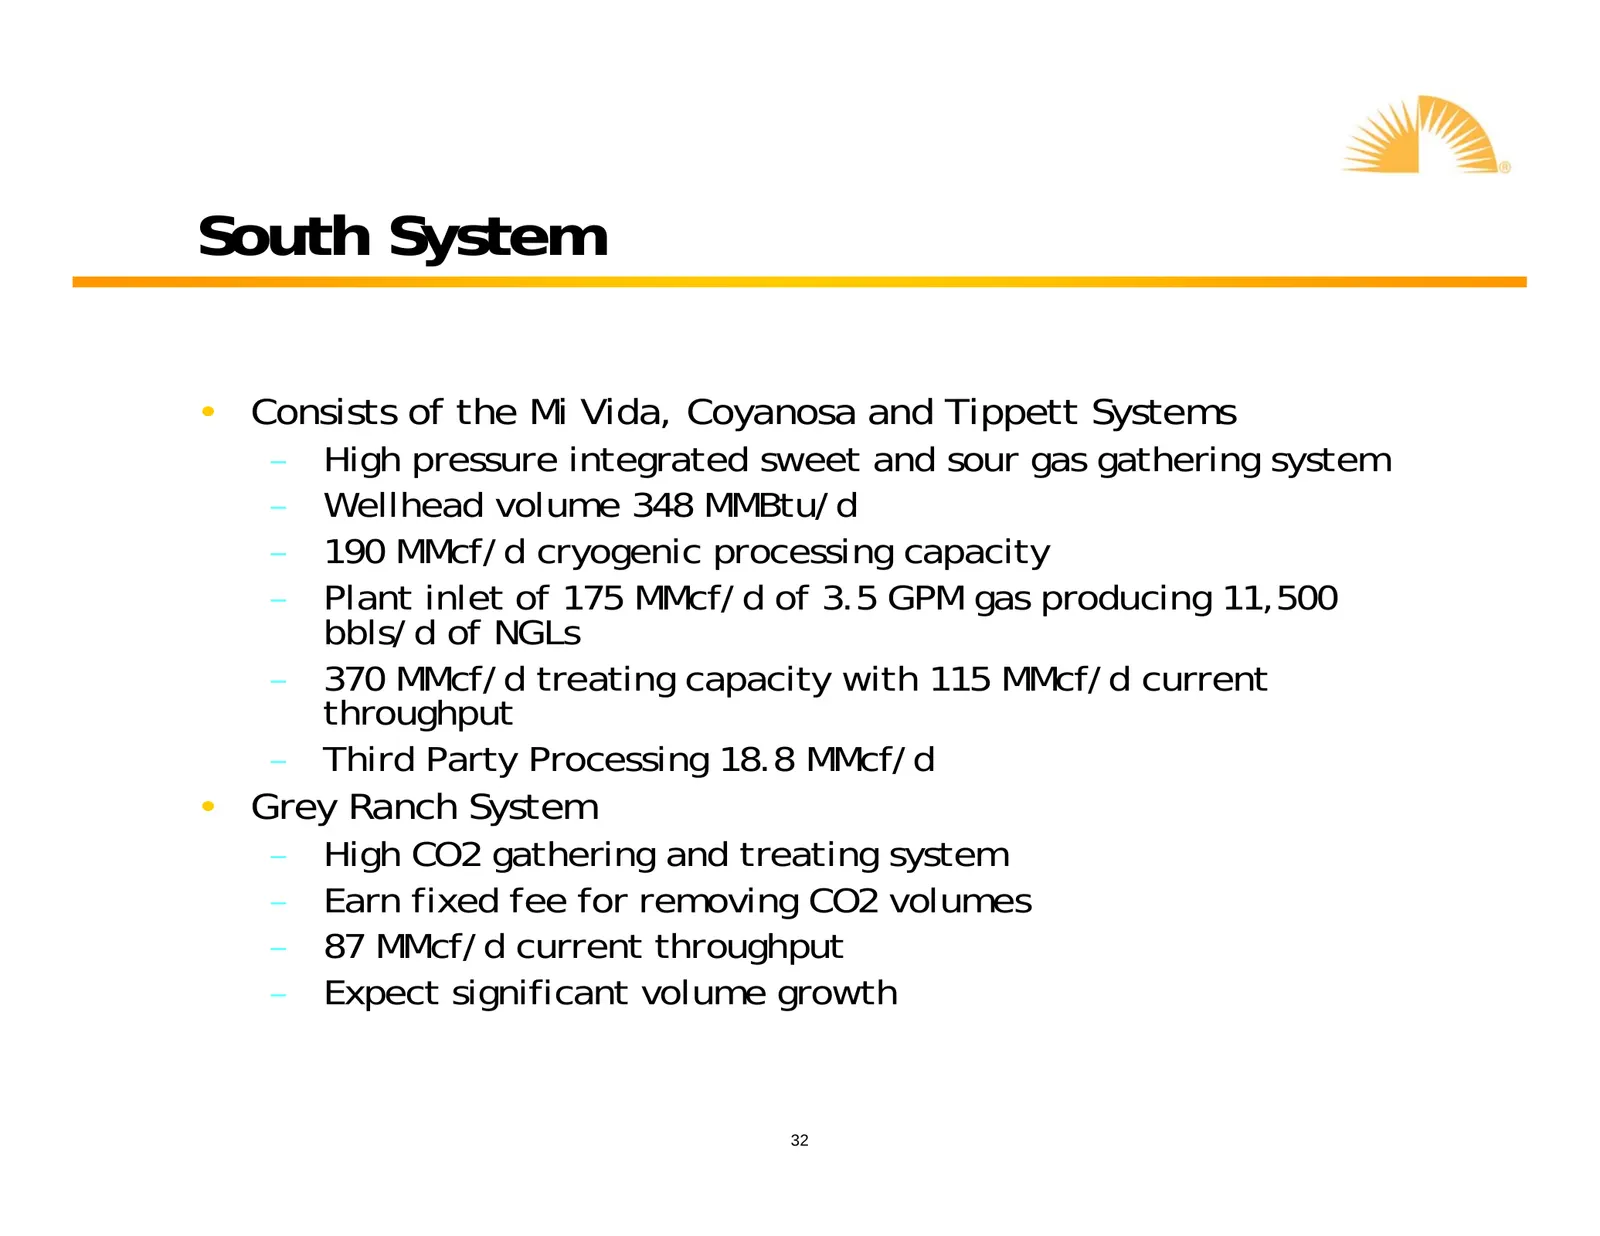
South System • Consists of the Mi Vida, Coyanosa and Tippett Systems – High pressure integrated sweet and sour gas gathering system – Wellhead volume 348 MMBtu/d – 190 MMcf/d cryogenic processing capacity – Plant inlet of 175 MMcf/d of 3.5 GPM gas producing 11,500 bbls/d of NGLs – 370 MMcf/d treatin
Slide 33: High Pressure Transfer System
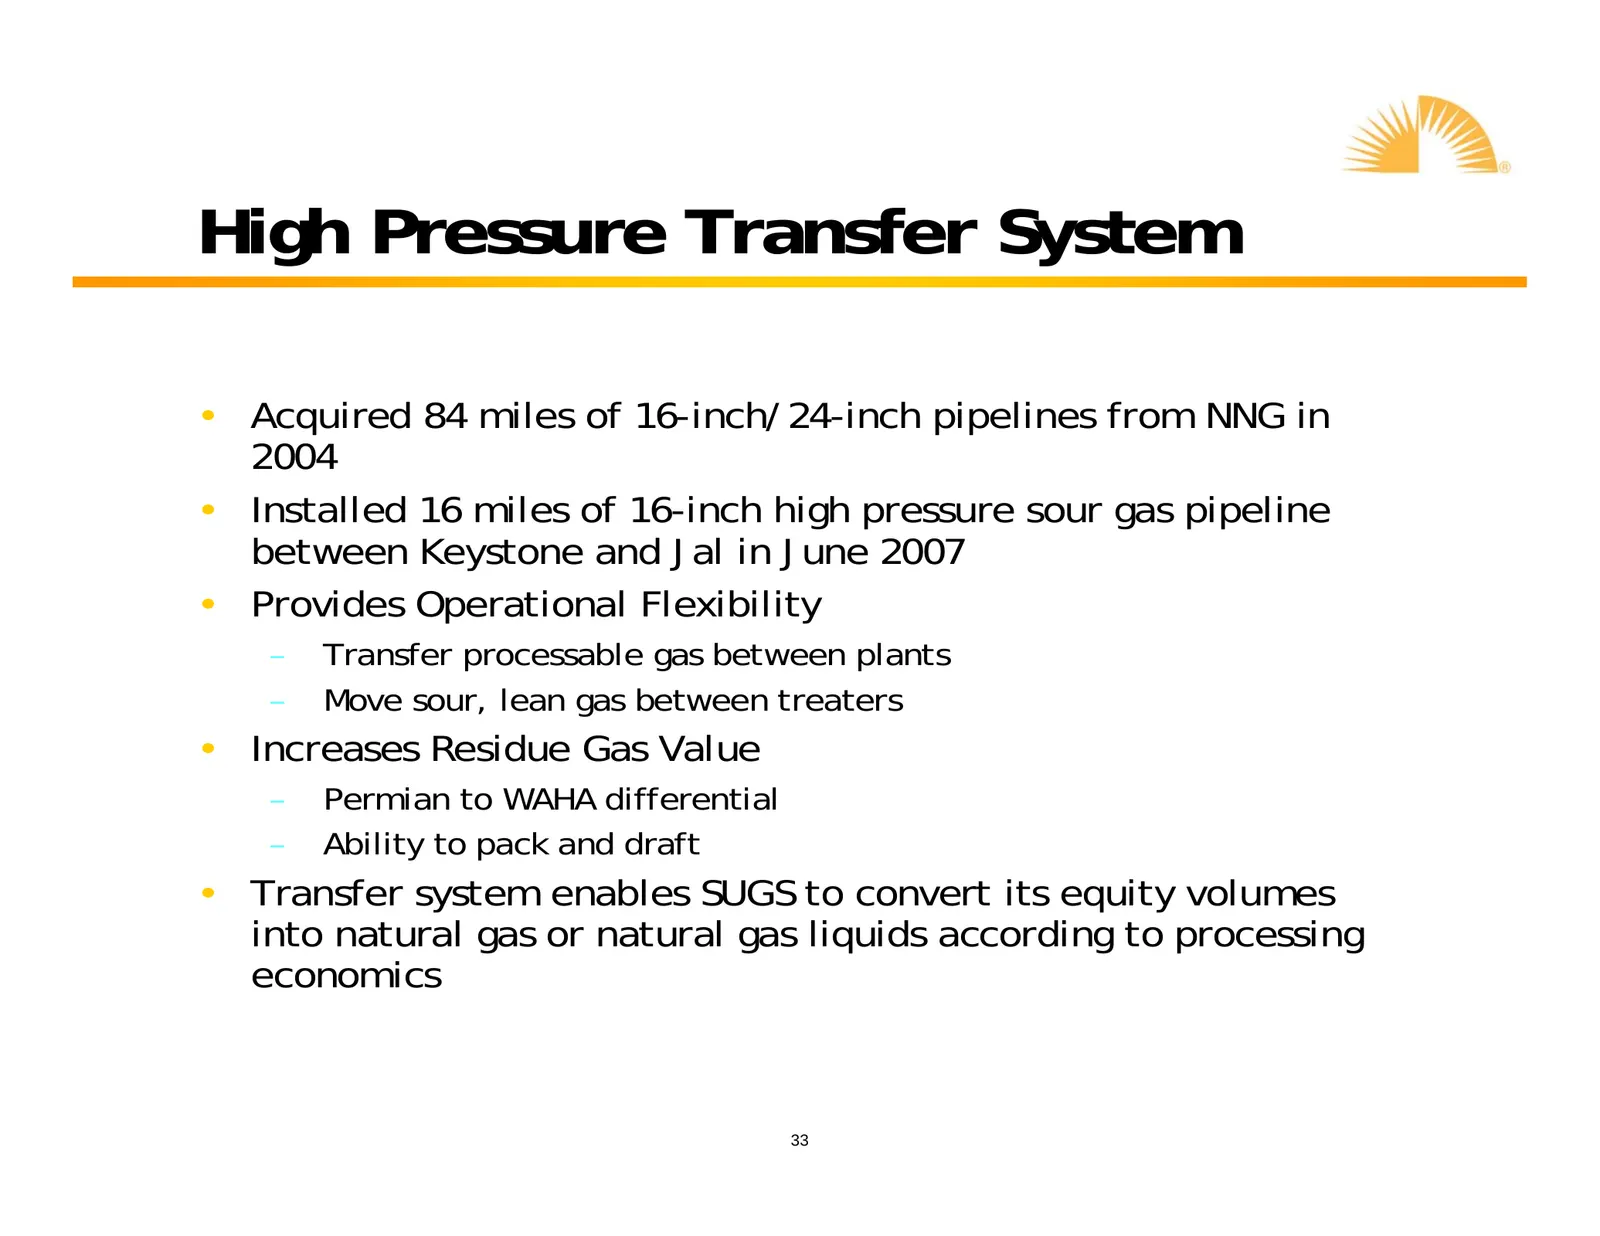
High Pressure Transfer System • Acquired 84 miles of 16-inch/24-inch pipelines from NNG in 2004 • Installed 16 miles of 16-inch high pressure sour gas pipeline between Keystone and Jal in June 2007 • Provides Operational Flexibility – Transfer processable gas between plants – Move sour, lean gas bet
Slide 34: Diversified, Active Producer Portfolio
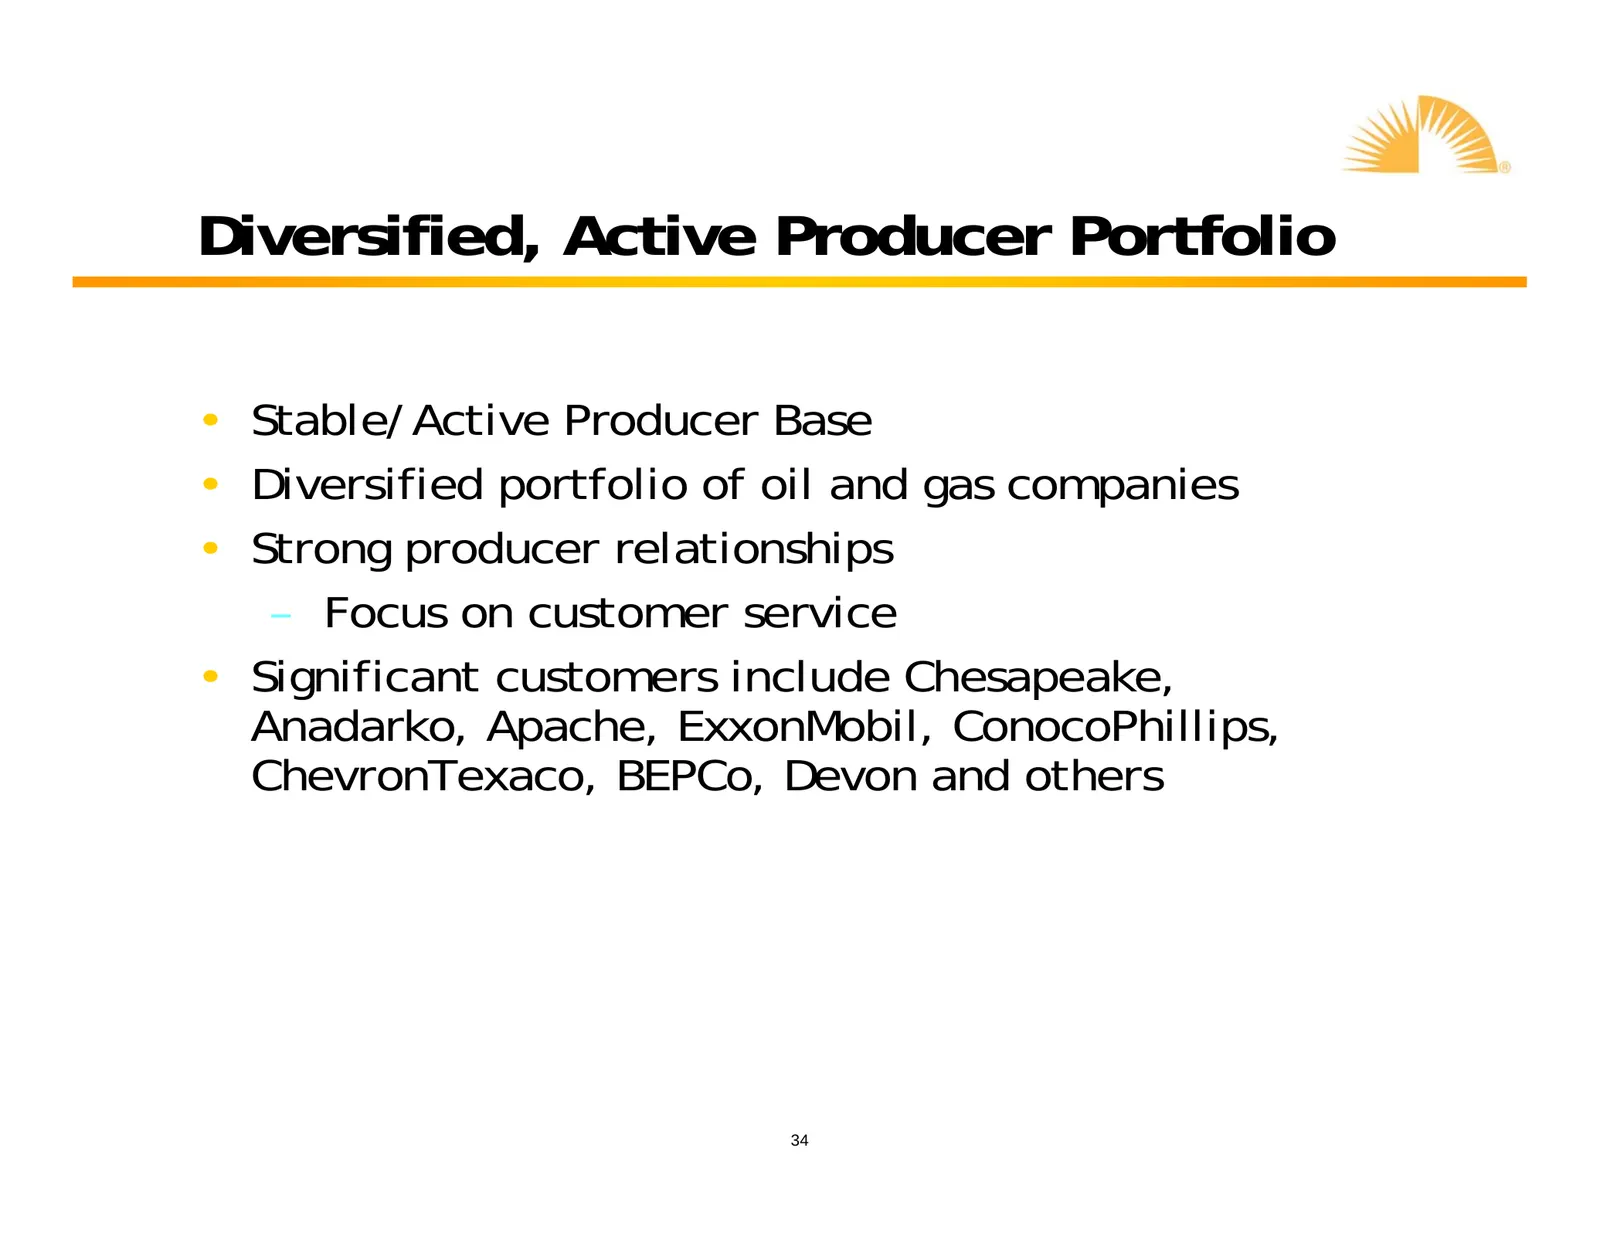
Diversified, Active Producer Portfolio • Stable/Active Producer Base • Diversified portfolio of oil and gas companies • Strong producer relationships – Focus on customer service • Significant customers include Chesapeake, Anadarko, Apache, ExxonMobil, ConocoPhillips, ChevronTexaco, BEPCo, Devon and
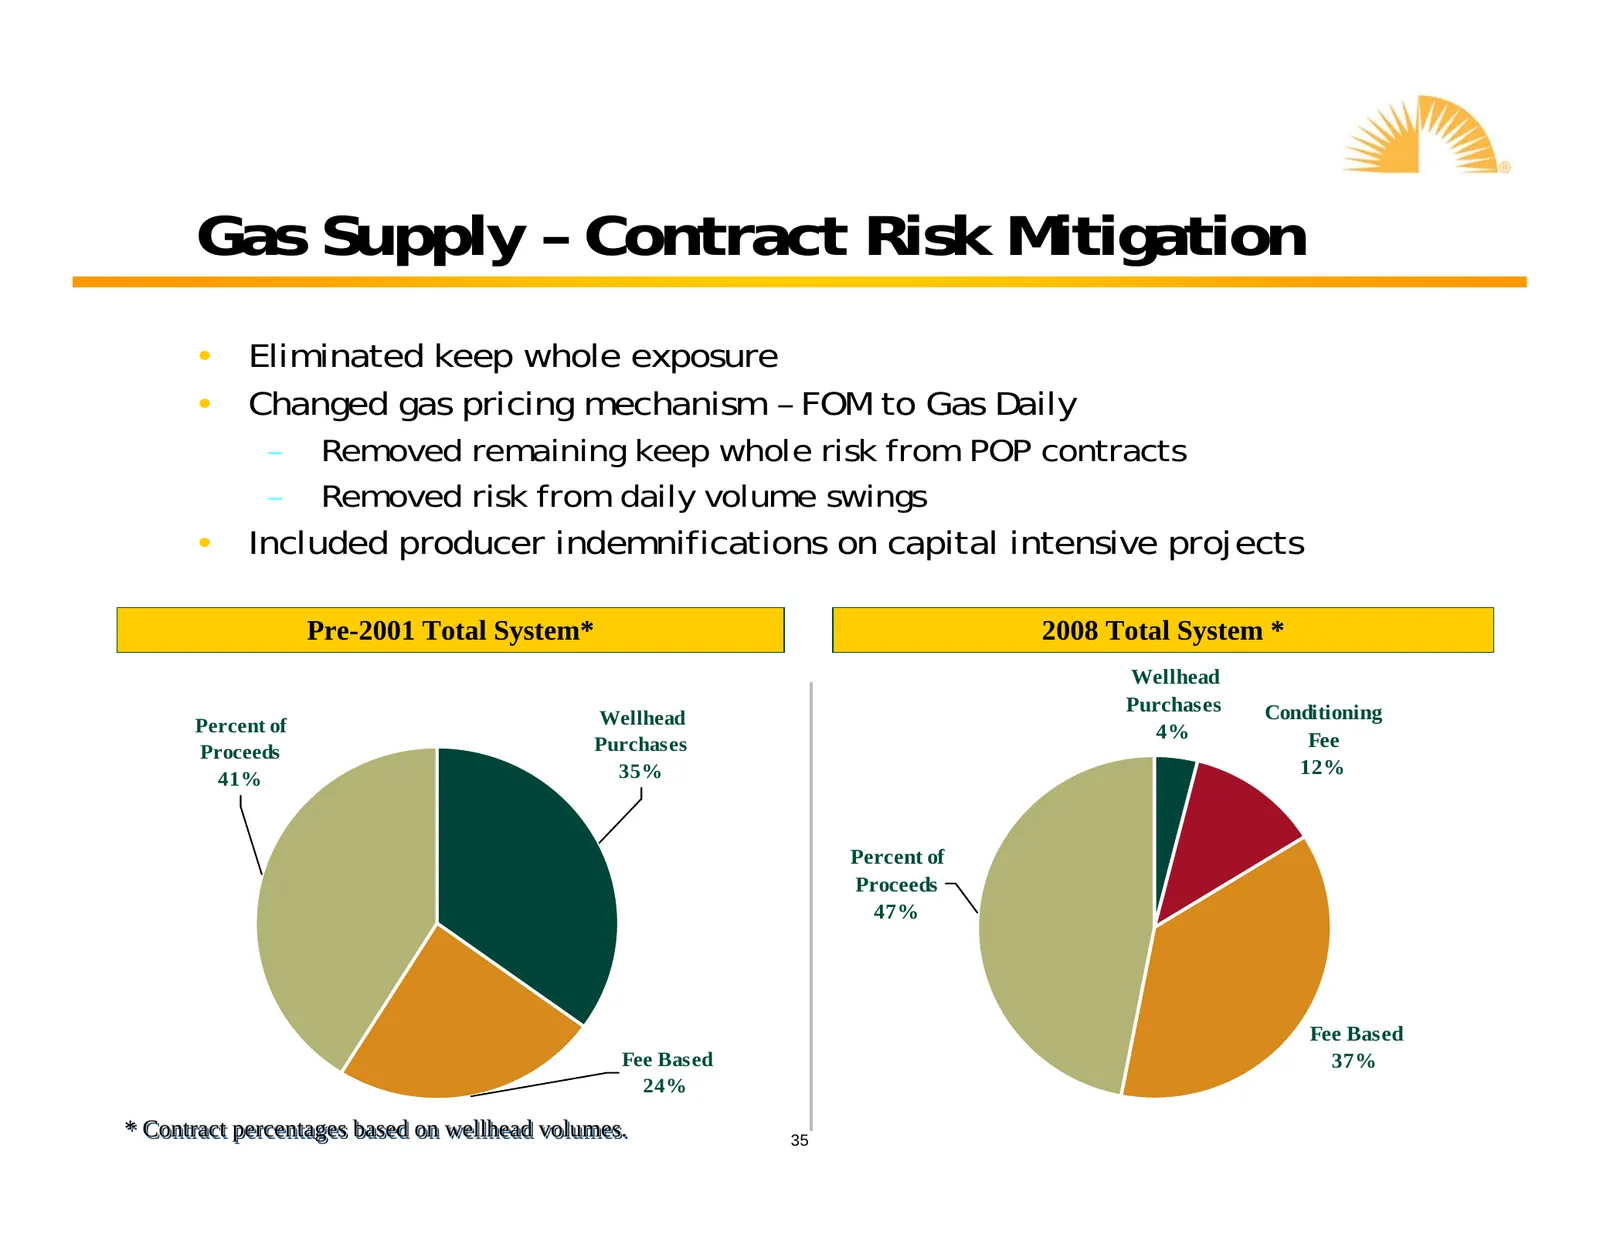
Slide 35: Gas Supply – Contract Risk Mitigation
Gas Supply – Contract Risk Mitigation • Eliminated keep whole exposure • Changed gas pricing mechanism – FOM to Gas Daily – Removed remaining keep whole risk from POP contracts – Removed risk from daily volume swings • Included producer indemnifications on capital intensive projects Pre-2001 Total S
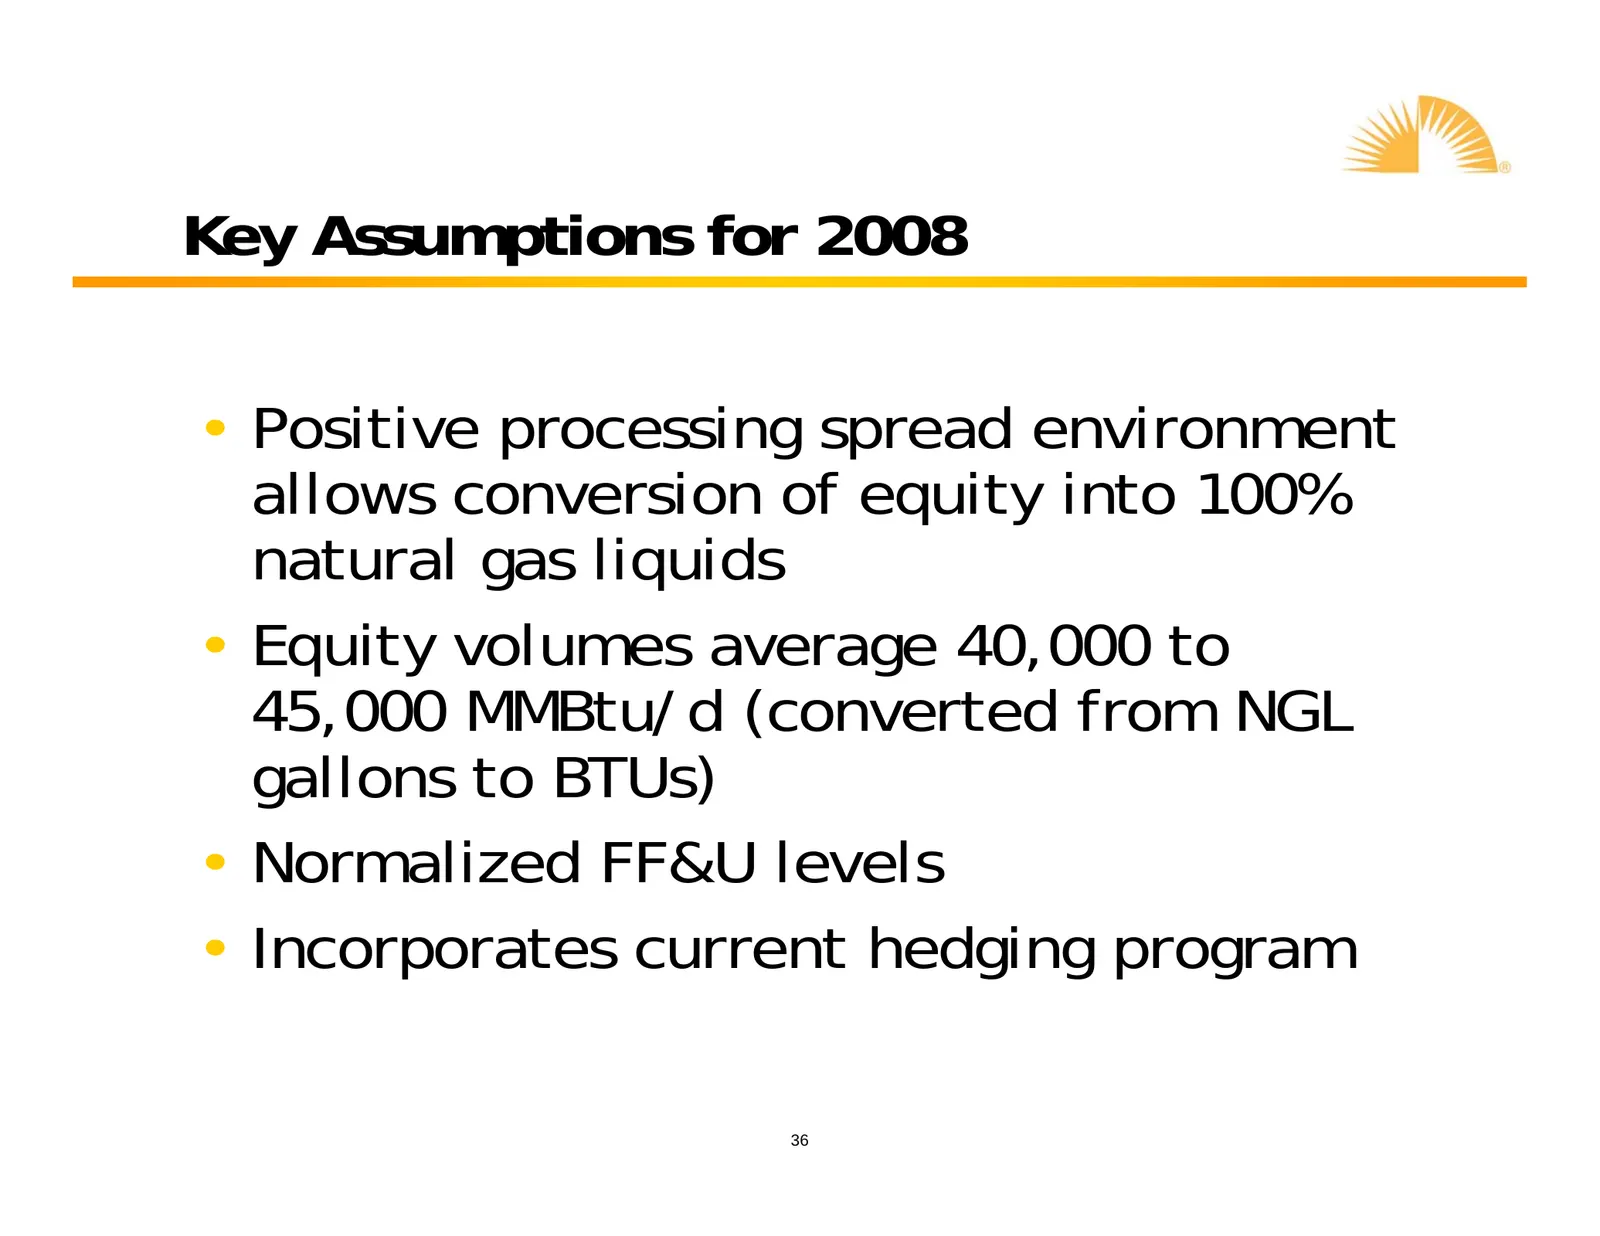
Slide 36: Key Assumptions for 2008
Key Assumptions for 2008 • Positive processing spread environment allows conversion of equity into 100% natural gas liquids • Equity volumes average 40,000 to 45,000 MMBtu/d (converted from NGL gallons to BTUs) • Normalized FF&U levels • Incorporates current hedging program 36
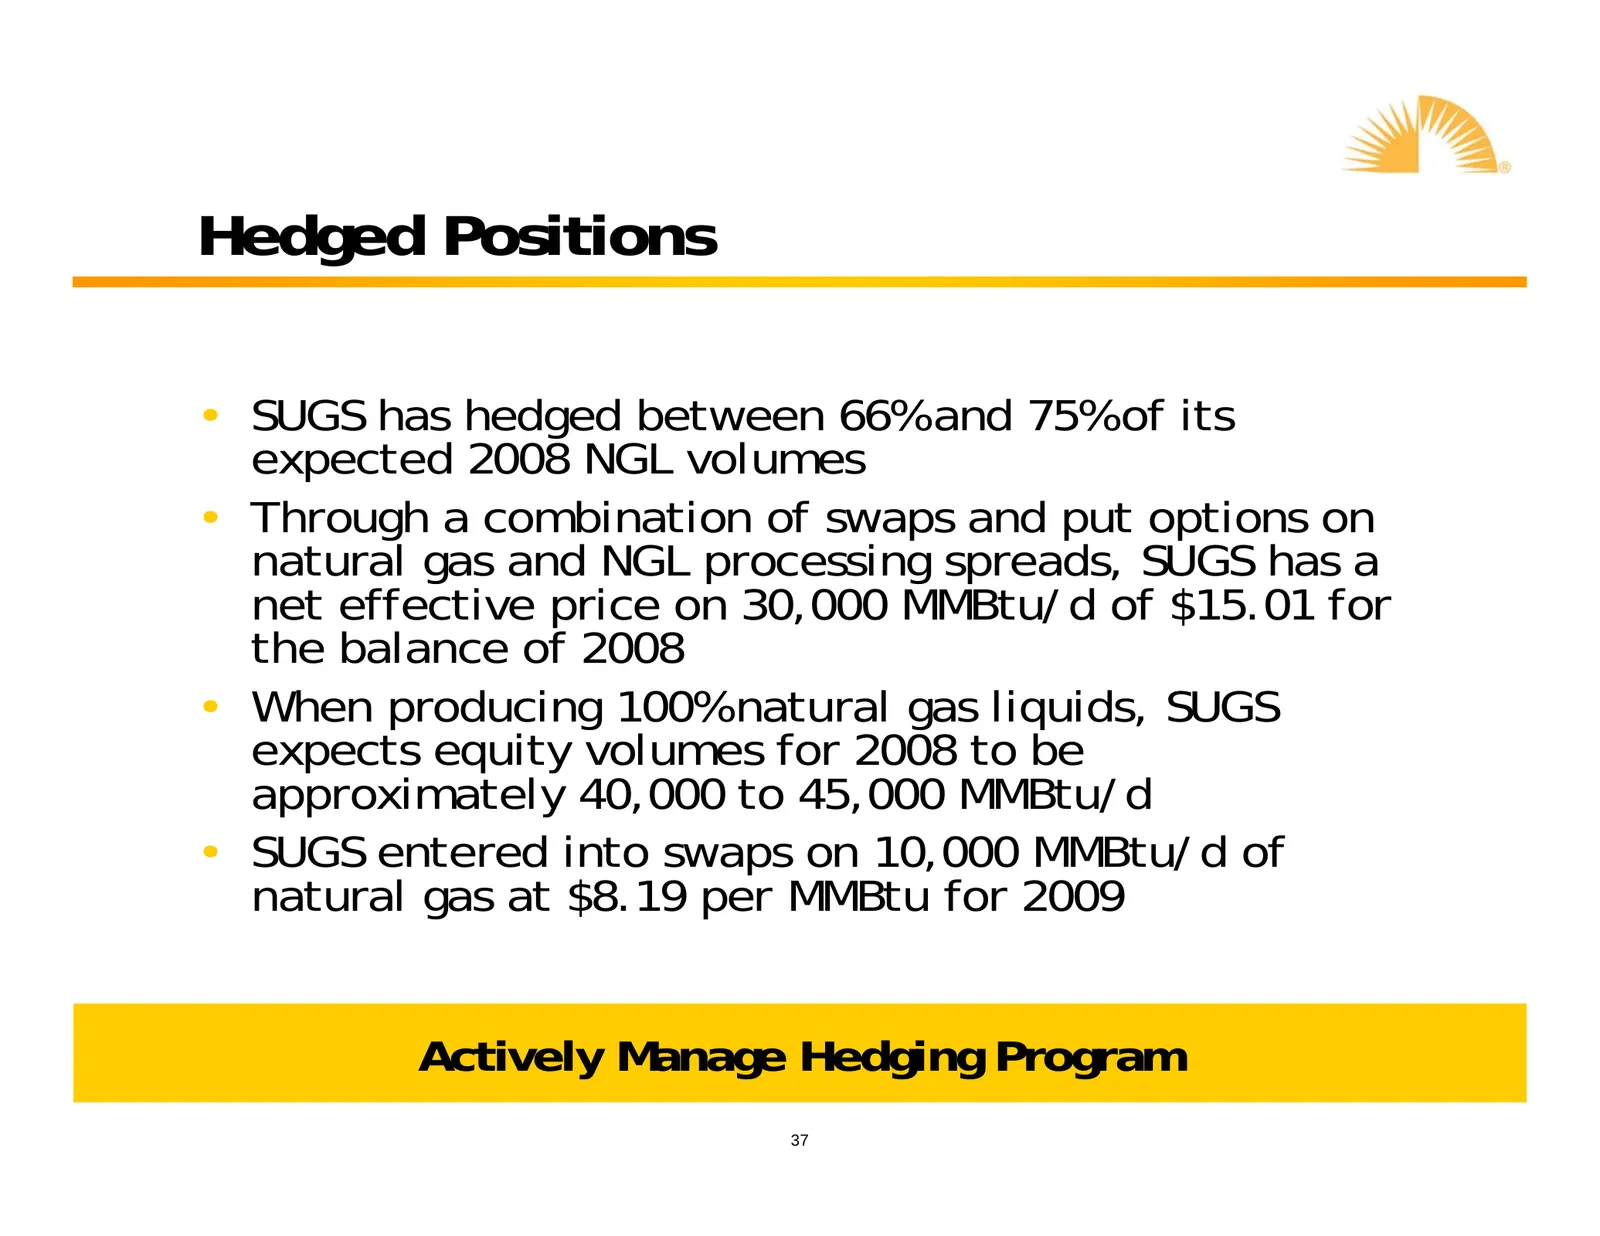
Slide 37: Hedged Positions
Hedged Positions • SUGS has hedged between 66% and 75% of its expected 2008 NGL volumes • Through a combination of swaps and put options on natural gas and NGL processing spreads, SUGS has a net effective price on 30,000 MMBtu/d of $15.01 for the balance of 2008 • When producing 100% natural gas liq

Slide 38: G&P Growth Drivers
G&P Growth Drivers yl”,
Slide 39: Growth Drivers
Growth Drivers • Aggressively pursue new business • Operating & maintenance expense management • Invest capital throughout the system to ensure efficiency • Exploit competitive advantages 39
Slide 40: SUGS Growth Projects
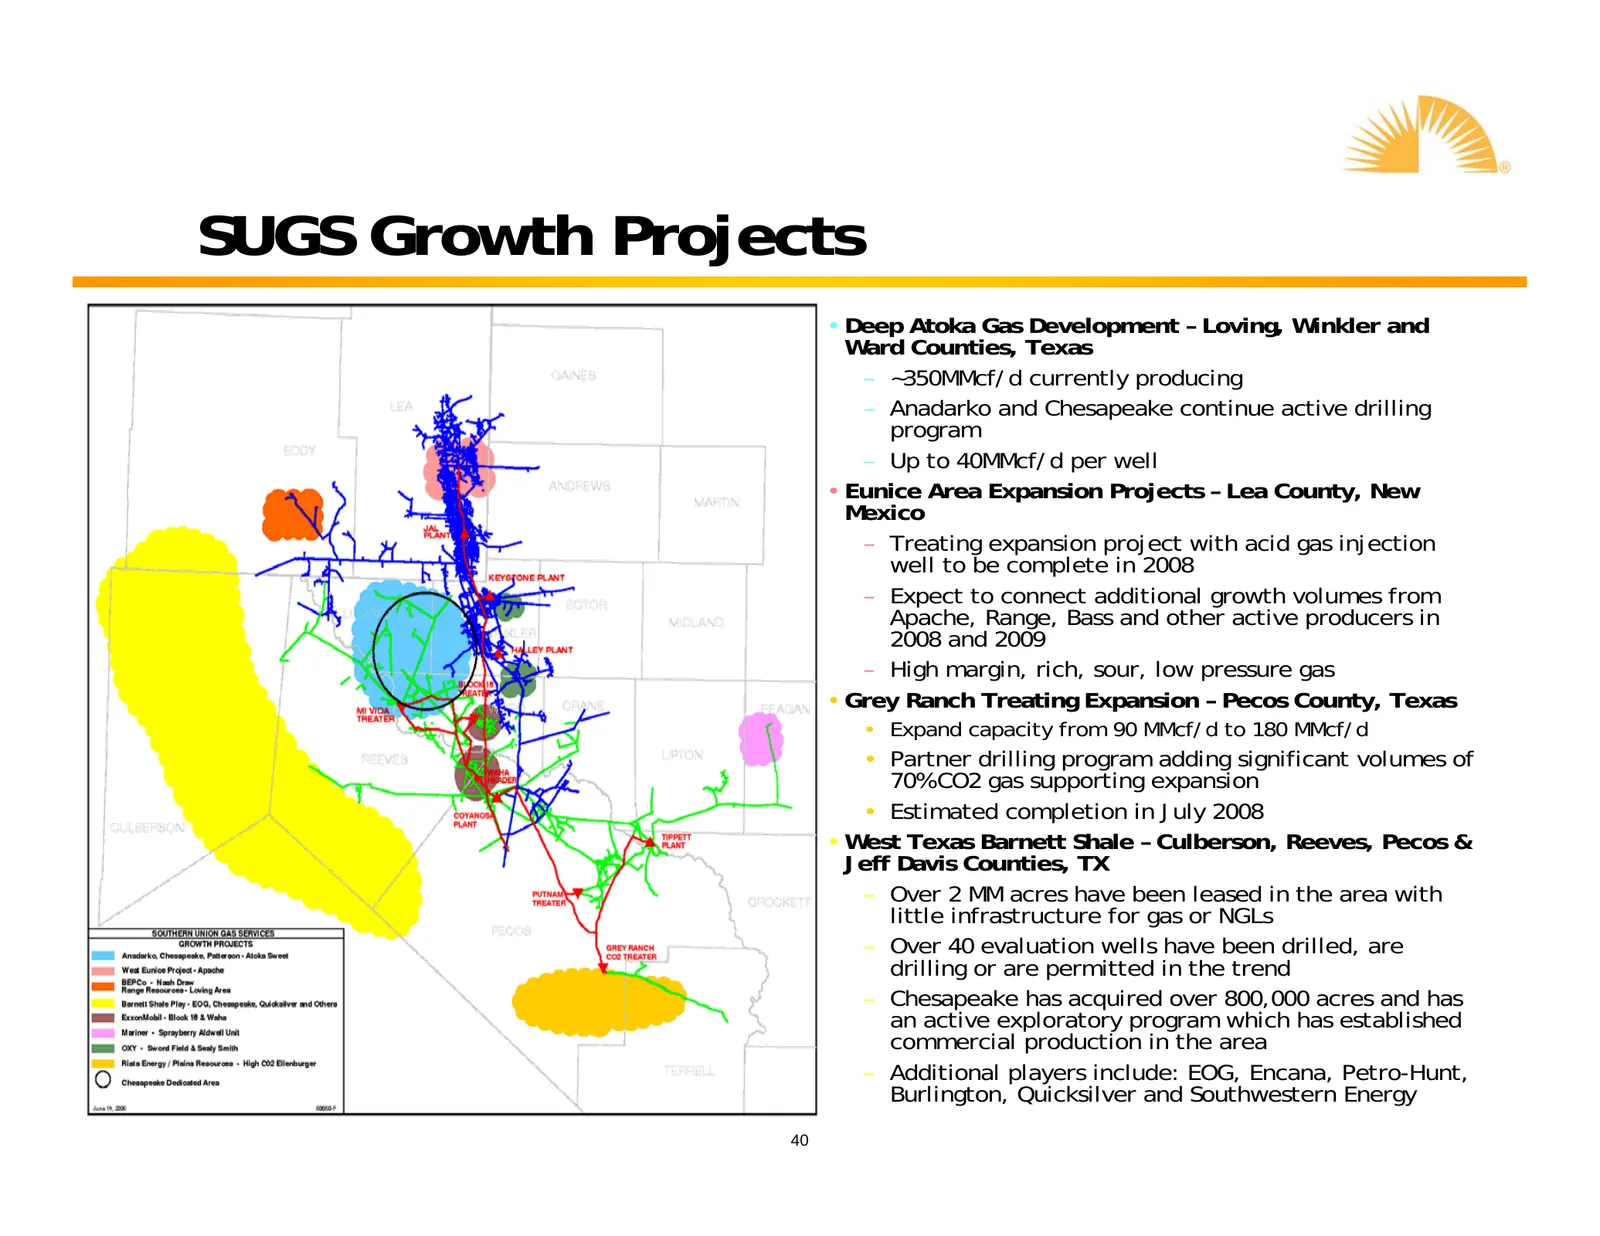
SUGS Growth Projects • Deep Atoka Gas Development – Loving, Winkler and Ward Counties, Texas – ~350MMcf/d currently producing – Anadarko and Chesapeake continue active drilling program – Up to 40MMcf/d per well • Eunice Area Expansion Projects – Lea County, New Mexico – Treating expansion project wi

Slide 41: Distribution & Other
Distribution & Other yl”,
Slide 42: Missouri Gas Energy
Missouri Gas Energy Missouri Gas Energy is a local distribution company serving central and western Missouri • Provides natural gas to over 500,000 customers • Nearly 13,000 miles of main and service lines • MGE received a $27.2MM annual revenue increase in 2007 – MGE received a straight fixed-varia
Slide 43: New England Gas Company
New England Gas Company New England Gas Company is a local distribution company serving North Attleboro and Fall River, MA • Provides natural gas to 50,000 customers • Nearly 2,000 miles of main and service lines • NEGCO received a $4.6MM annual revenue increase in 2007 – Settlement includes mechani

Slide 44: 2008 Outlook
2008 Outlook yl”,
Slide 45: Guidance and EBITDA Outlook
Guidance and EBITDA Outlook • 2008 earnings guidance – SUG’s earnings guidance range is $1.80 to $1.90 per share – Guidance range is driven by: 9 Commodity price impact on unhedged gathering & processing volumes and operating efficiency 9 Operating and maintenance expense containment 9 Timing and am
Slide 46: Pro forma EBITDA Guidance
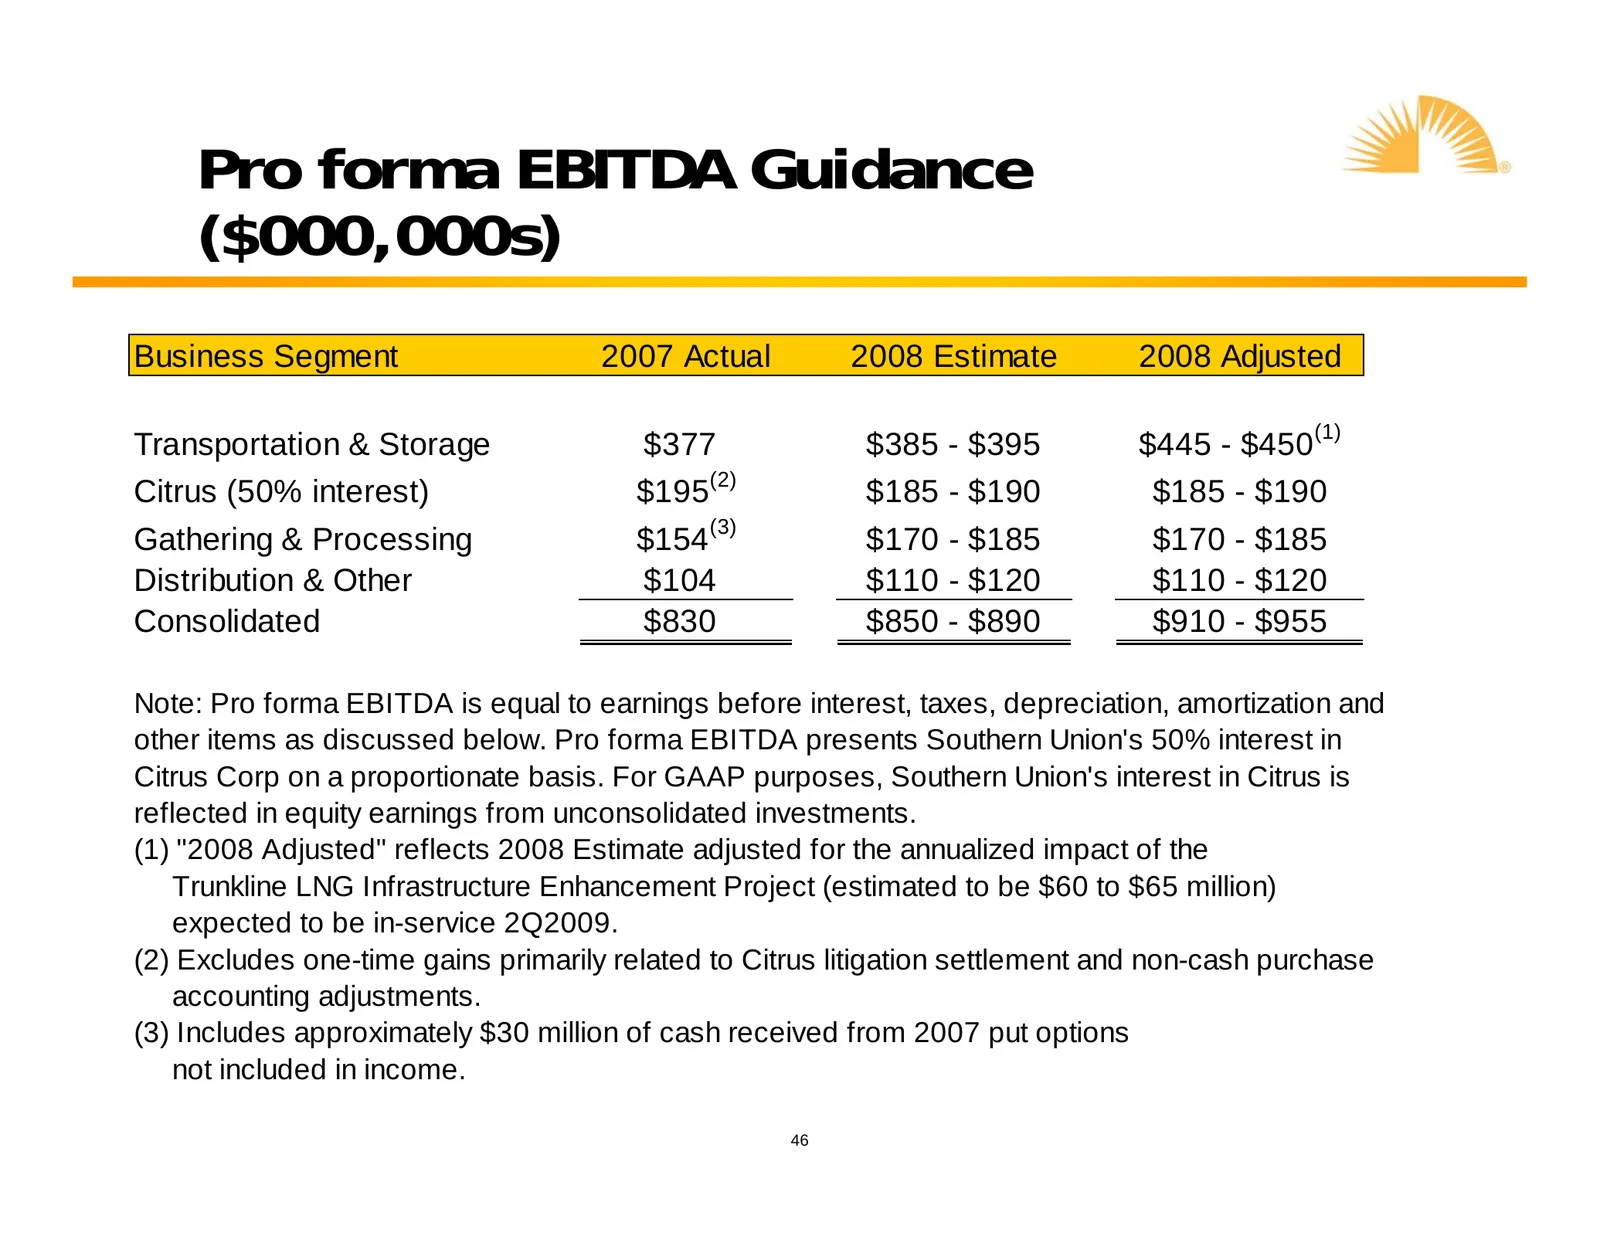
Pro forma EBITDA Guidance ($000,000s) Business Segment 2007 Actual 2008 Estimate 2008 Adjusted Transportation & Storage $377 $385 - $395 $445 - $450(1) Citrus (50% interest) $195(2) $185 - $190 $185 - $190 Gathering & Processing $154(3) $170 - $185 $170 - $185 Distribution & Other $104 $110 - $120 $
Slide 47: 2008 Capital Expenditure Guidance
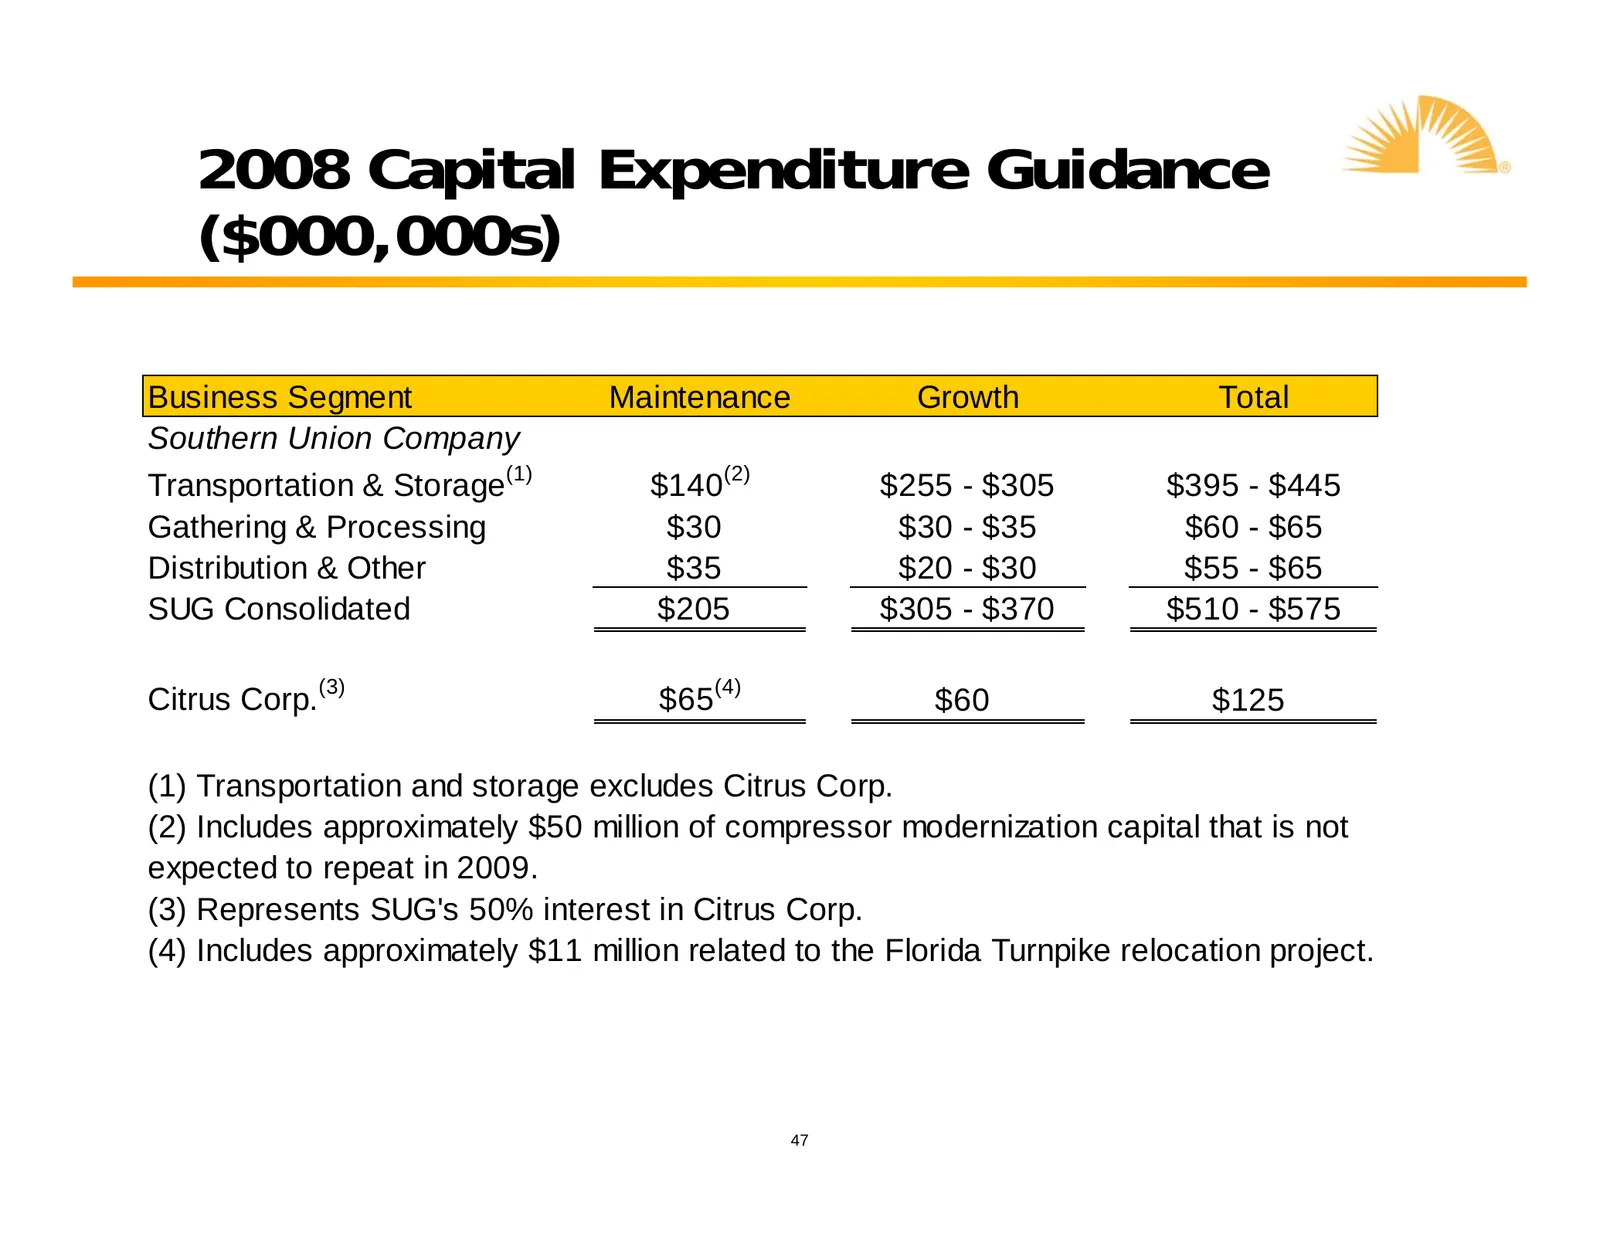
2008 Capital Expenditure Guidance ($000,000s) Business Segment Maintenance Growth Total Southern Union Company Transportation & Storage(1) $140(2) $255 - $305 $395 - $445 Gathering & Processing $30 $30 - $35 $60 - $65 Distribution & Other $35 $20 - $30 $55 - $65 SUG Consolidated $205 $305 - $370 $51
Slide 48: 2008 EBITDA by Segment
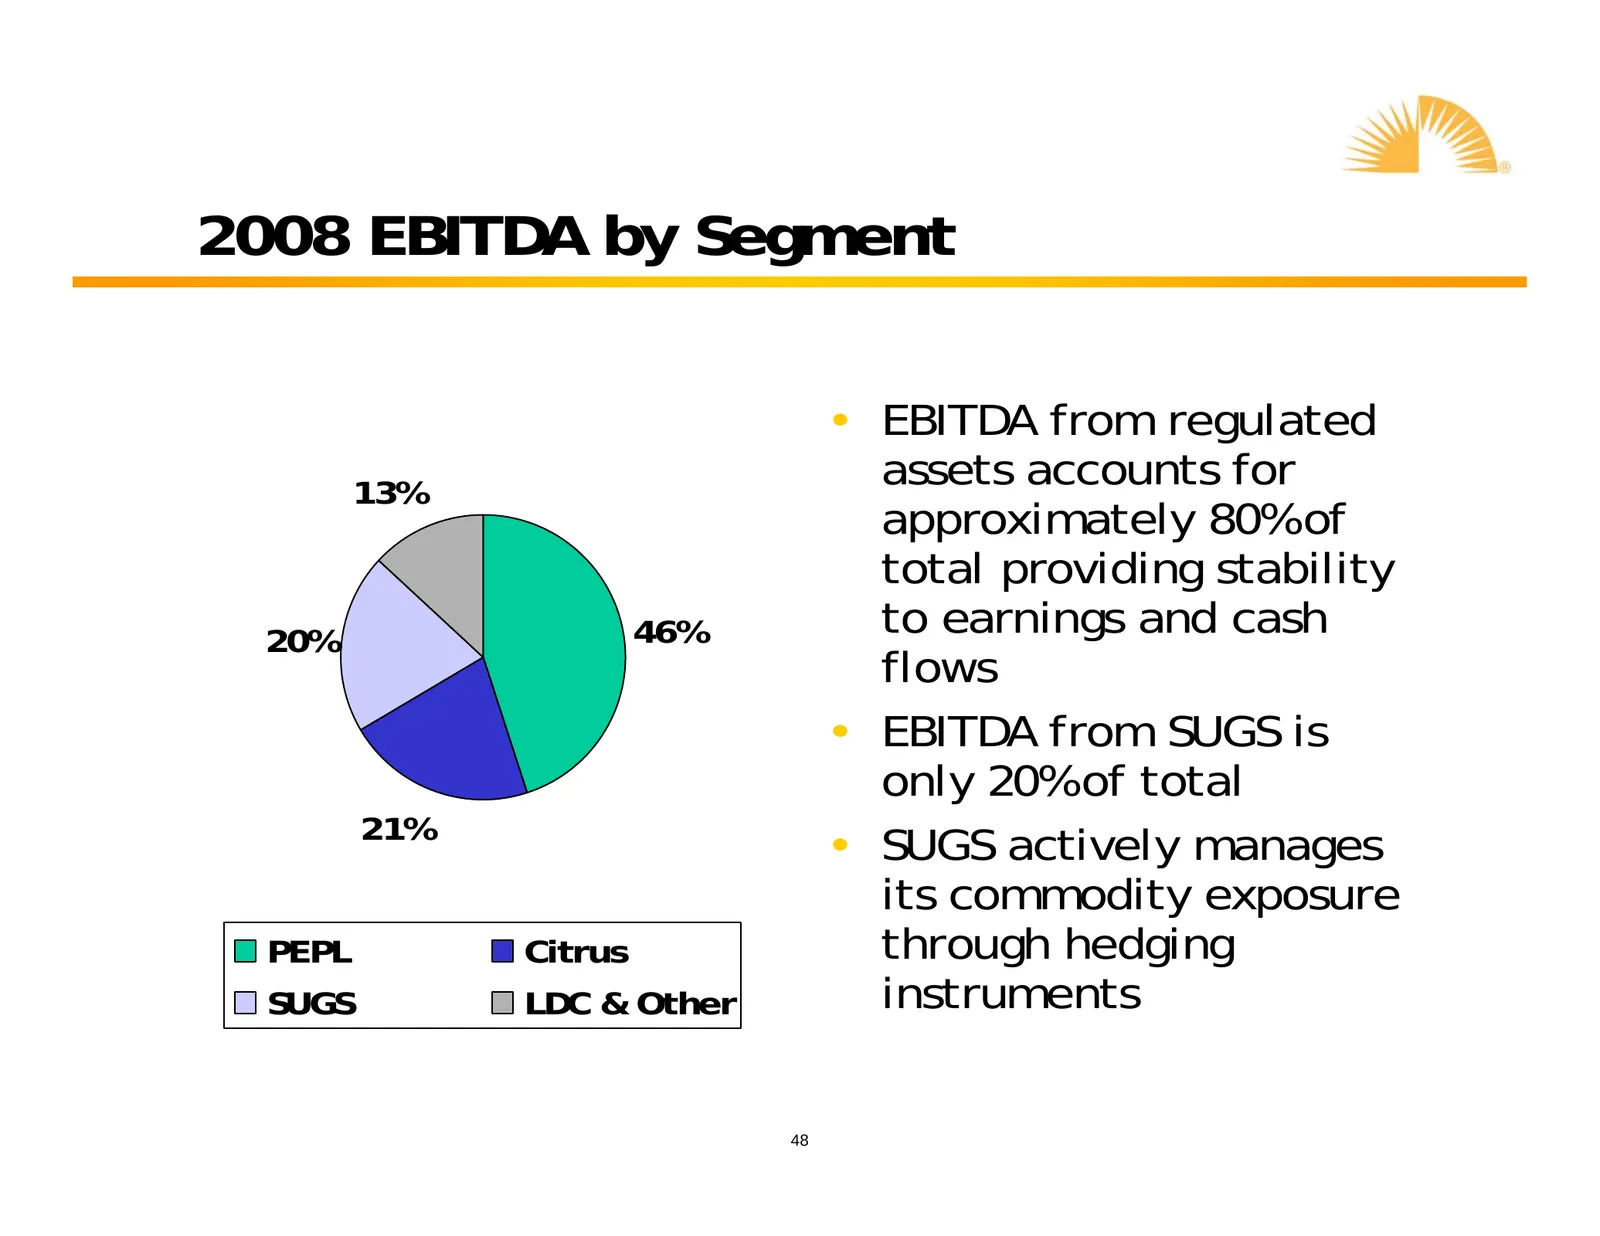
2008 EBITDA by Segment • EBITDA from regulated 13% assets accounts for approximately 80% of total providing stability 20% 46% to earnings and cash flows • EBITDA from SUGS is only 20% of total 21% • SUGS actively manages its commodity exposure PEPL Citrus through hedging SUGS LDC & Other instruments

Slide 49: Conclusion
Conclusion yl”,
Slide 50: Summary
Summary • Compelling vision and clear strategic plan going forward – Strategic transformation and value creation achieved – Well advanced organic growth projects with clear visibility towards value creation – MLP structure as a potential growth vehicle providing a lower cost of capital and strategic

Slide 51: Appendix
Appendix yl”,
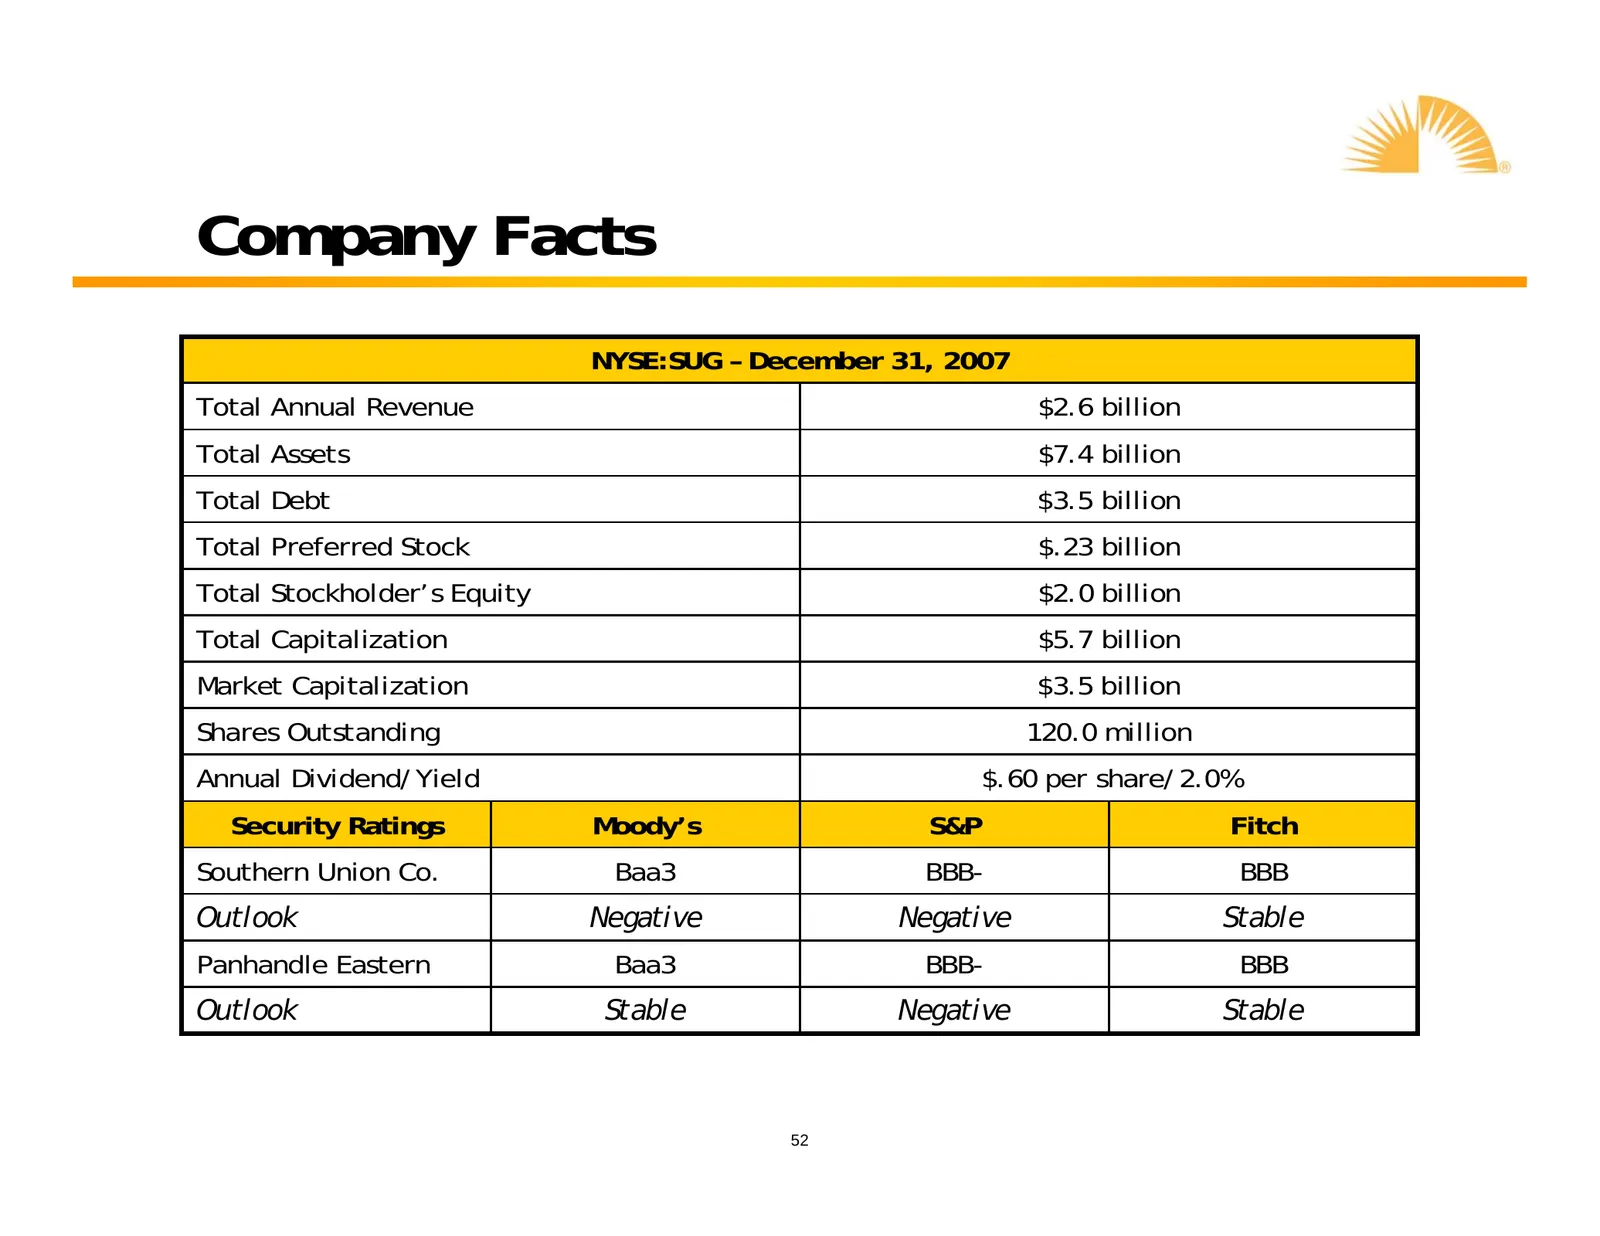
Slide 52: Company Facts
Company Facts NYSE:SUG – December 31, 2007 Total Annual Revenue $2.6 billion Total Assets $7.4 billion Total Debt $3.5 billion Total Preferred Stock $.23 billion Total Stockholder’s Equity $2.0 billion Total Capitalization $5.7 billion Market Capitalization $3.5 billion Shares Outstanding 120.0 mill
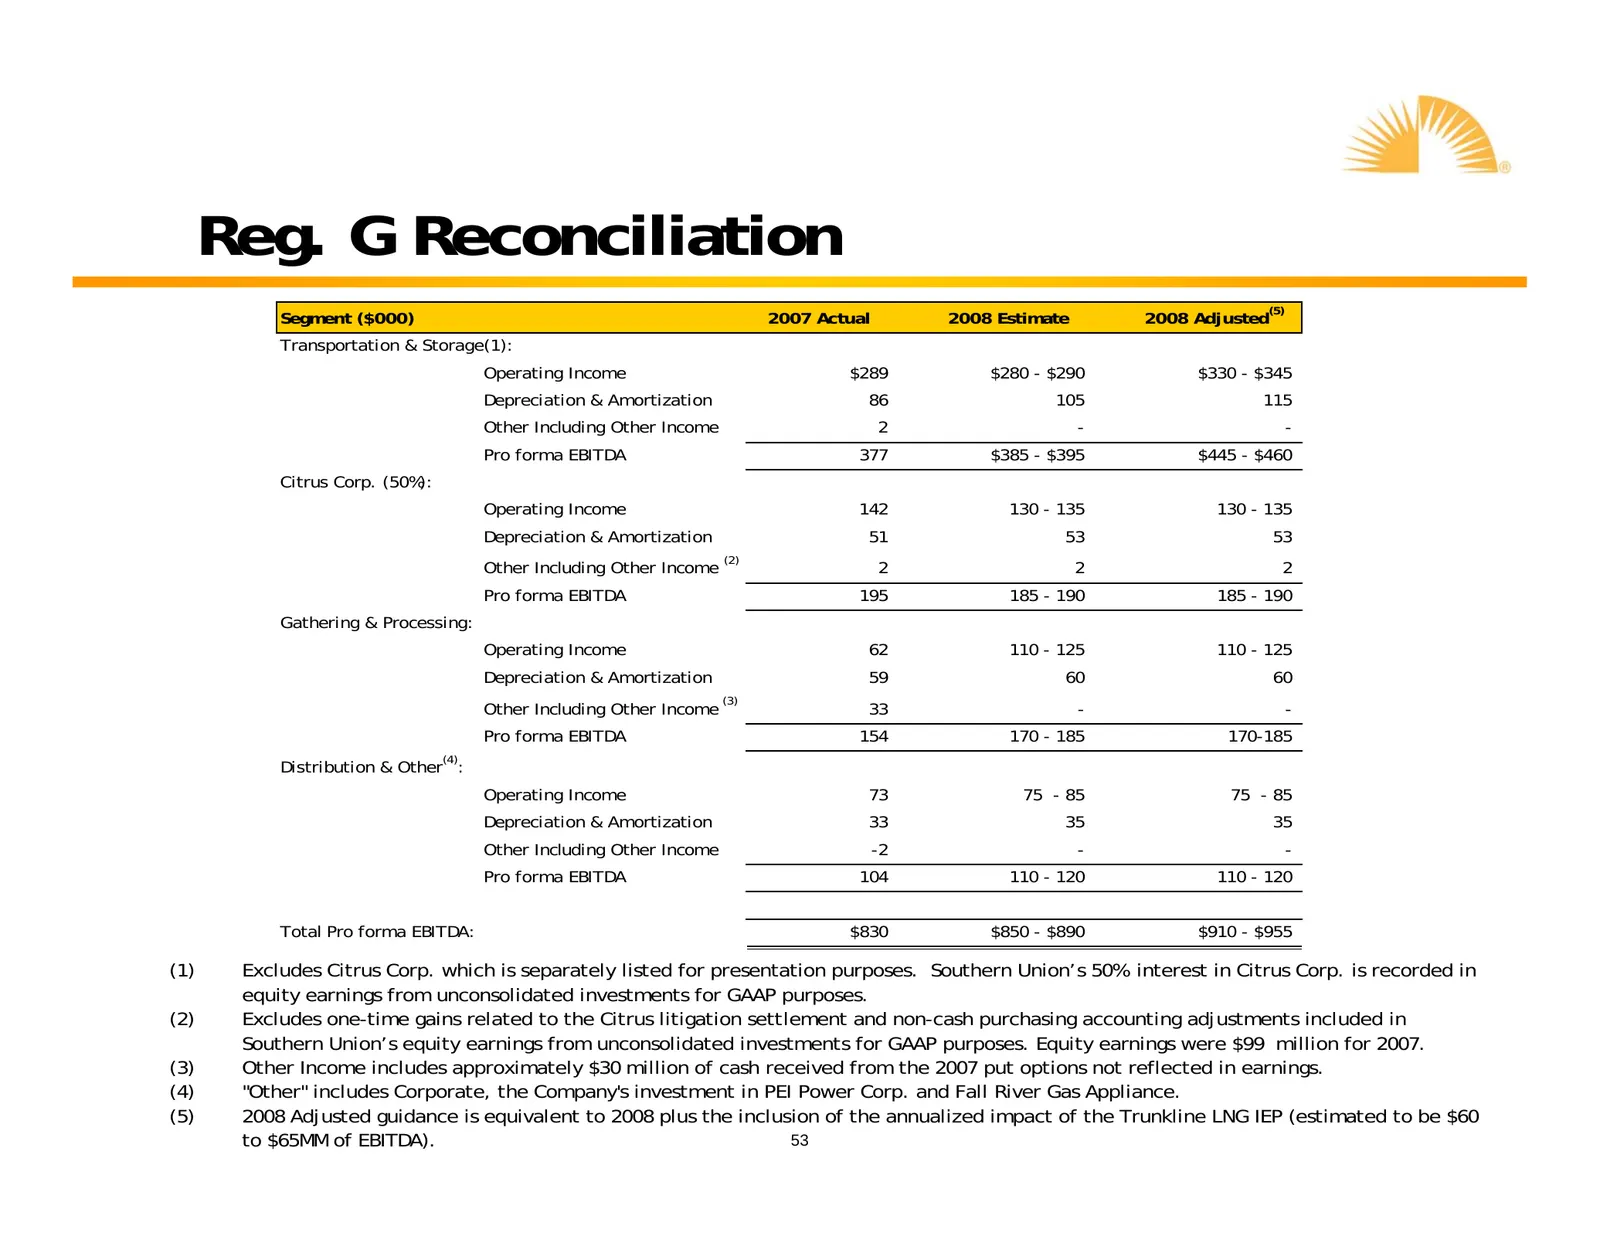
Slide 53: Reg. G Reconciliation
Reg. G Reconciliation (5) Segment ($000) 2007 Actual 2008 Estimate 2008 Adjusted Transportation & Storage(1): Operating Income $289 $280 - $290 $330 - $345 Depreciation & Amortization 86 105 115 Other Including Other Income 2 - - Pro forma EBITDA 377 $385 - $395 $445 - $460 Citrus Corp. (50%): Opera
Source: SEC EDGAR · 8-K filed Apr 28, 2008
More decks from Southern Union Co
 Barclays Capital Investment Grade Energy and Pipeline Conference 201232 slides · Mar 8, 2012
 Debt Investor Presentation (February 2012)33 slides · Feb 22, 2012
 Merger or Acquisition (July 2011)11 slides · Jul 5, 2011
 Merger or Acquisition (June 2011)22 slides · Jun 16, 2011
 Investor Presentation (February 2011)37 slides · Feb 25, 2011
 BMO Capital Markets 2010 Utilities and Pipelines Day23 slides · Nov 30, 2010