Bravura Solutions Limited · ASX:BVS
Bravura Solutions — H1 FY2012 Earnings Presentation
18 slides from Bravura Solutions's earnings presentation, February 2012
Slide 1: Investor presentation: Results for half year ended 31 December 2011
Investor presentation Results for half year ended 31 December 2011 Tony Klim – Chief Executive Officer Rebecca Norton – Chief Financial Officer February 2012
Slide 2: Agenda
Agenda Highlights 1HFY12 financial results Strategic outlook Question & answers 2 2

Slide 3: Highlights
Highlights
Slide 4: Financial services environment
Financial services environment Operating environment in financial markets remained challenging Ongoing difficulties in European financial markets impacted growth and certainty Delays and deferrals continued to impact business in short term Strong Australian dollar impacted revenue and profit
Slide 5: Key points
Key points Stabilised financials – well positioned for long-term future growth NPAT improved by 25% to $2.2m Cash flow continued to improve with operating inflow of $12.5m compared to $8.1m in prior corresponding period EBITDA profit of $9.4m continued to be impacted by decline in GBP Cont
Slide 6: 1HFY12 financial results
1HFY12 financial results
Slide 7: 1H12 financial performance
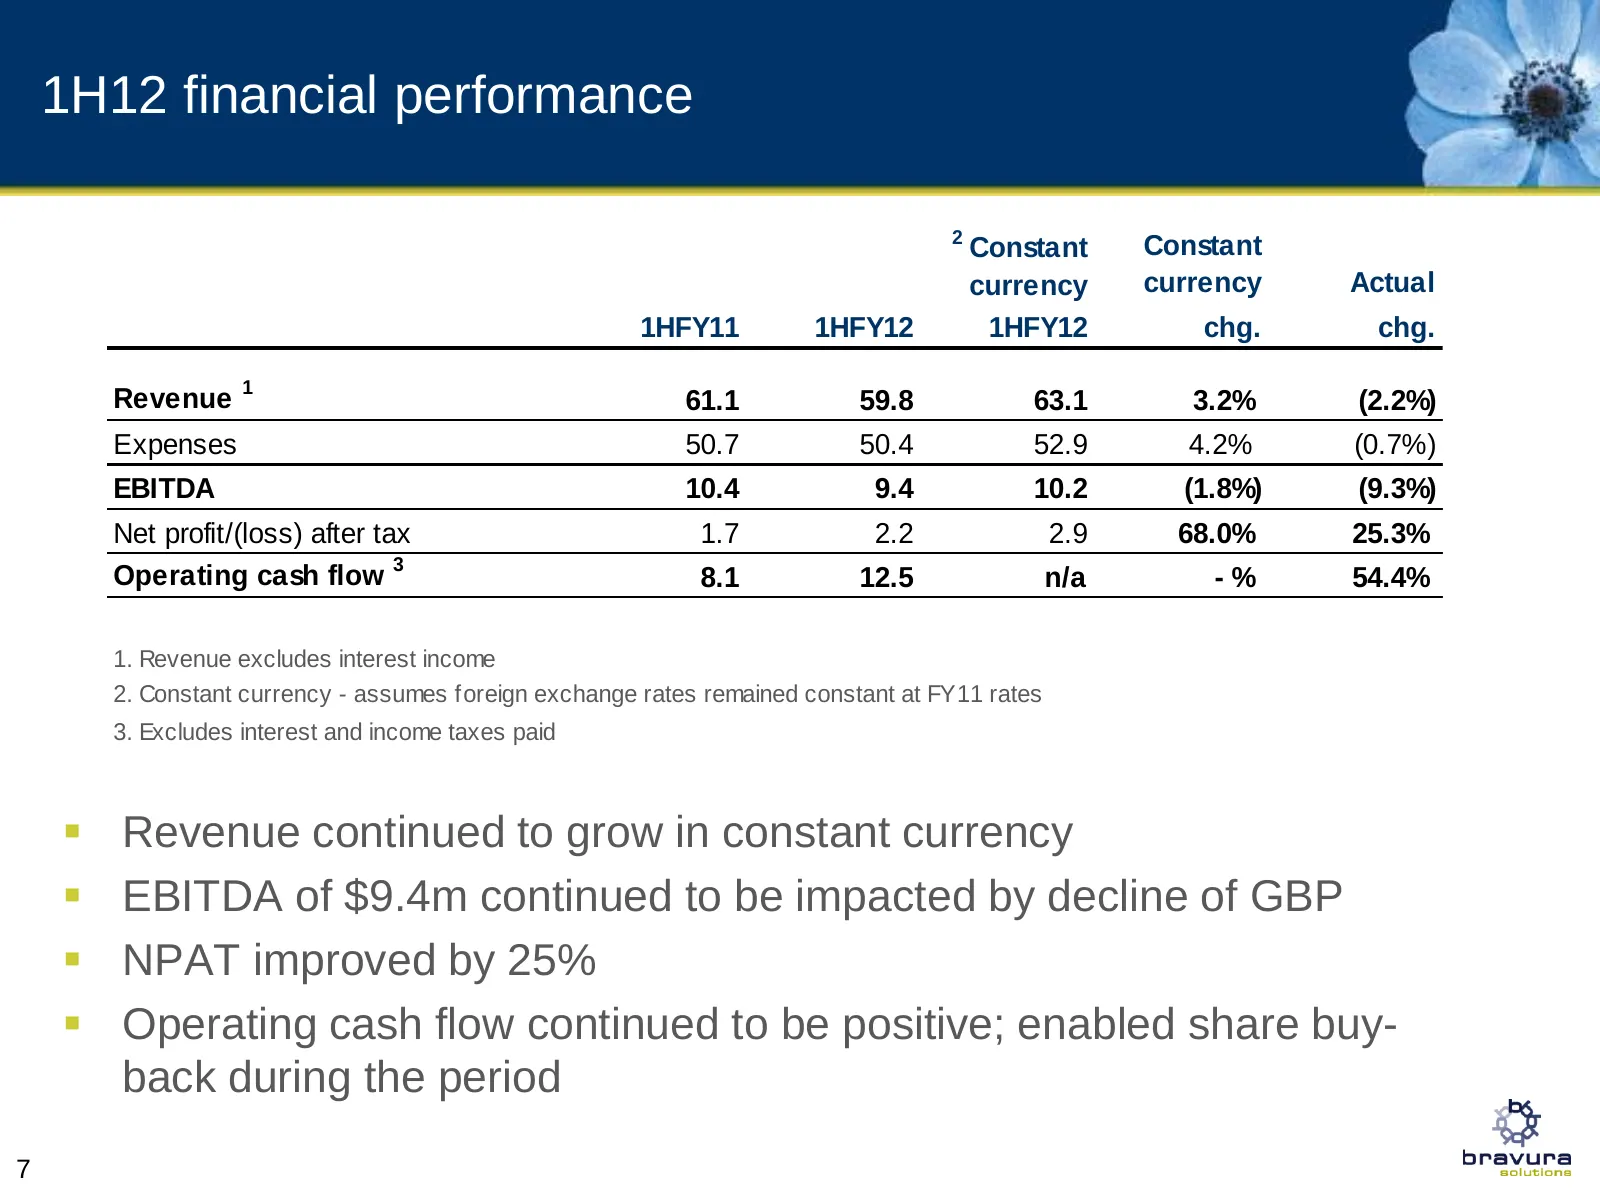
1H12 financial performance 2 Constant Constant currency currency Actual 1HFY11 1HFY12 1HFY12 chg. chg. Revenue 1 61.1 59.8 63.1 3.2% (2.2%) Expenses 50.7 50.4 52.9 4.2% (0.7%) EBITDA 10.4 9.4 10.2 (1.8%) (9.3%) Net profit/(loss) after tax 1.7 2.2 2.9 68.0% 25.3% Operating cash flow 3 8.1 12.5 n/a -%
Slide 8: 1H12 financial performance: EBITDA and NPAT
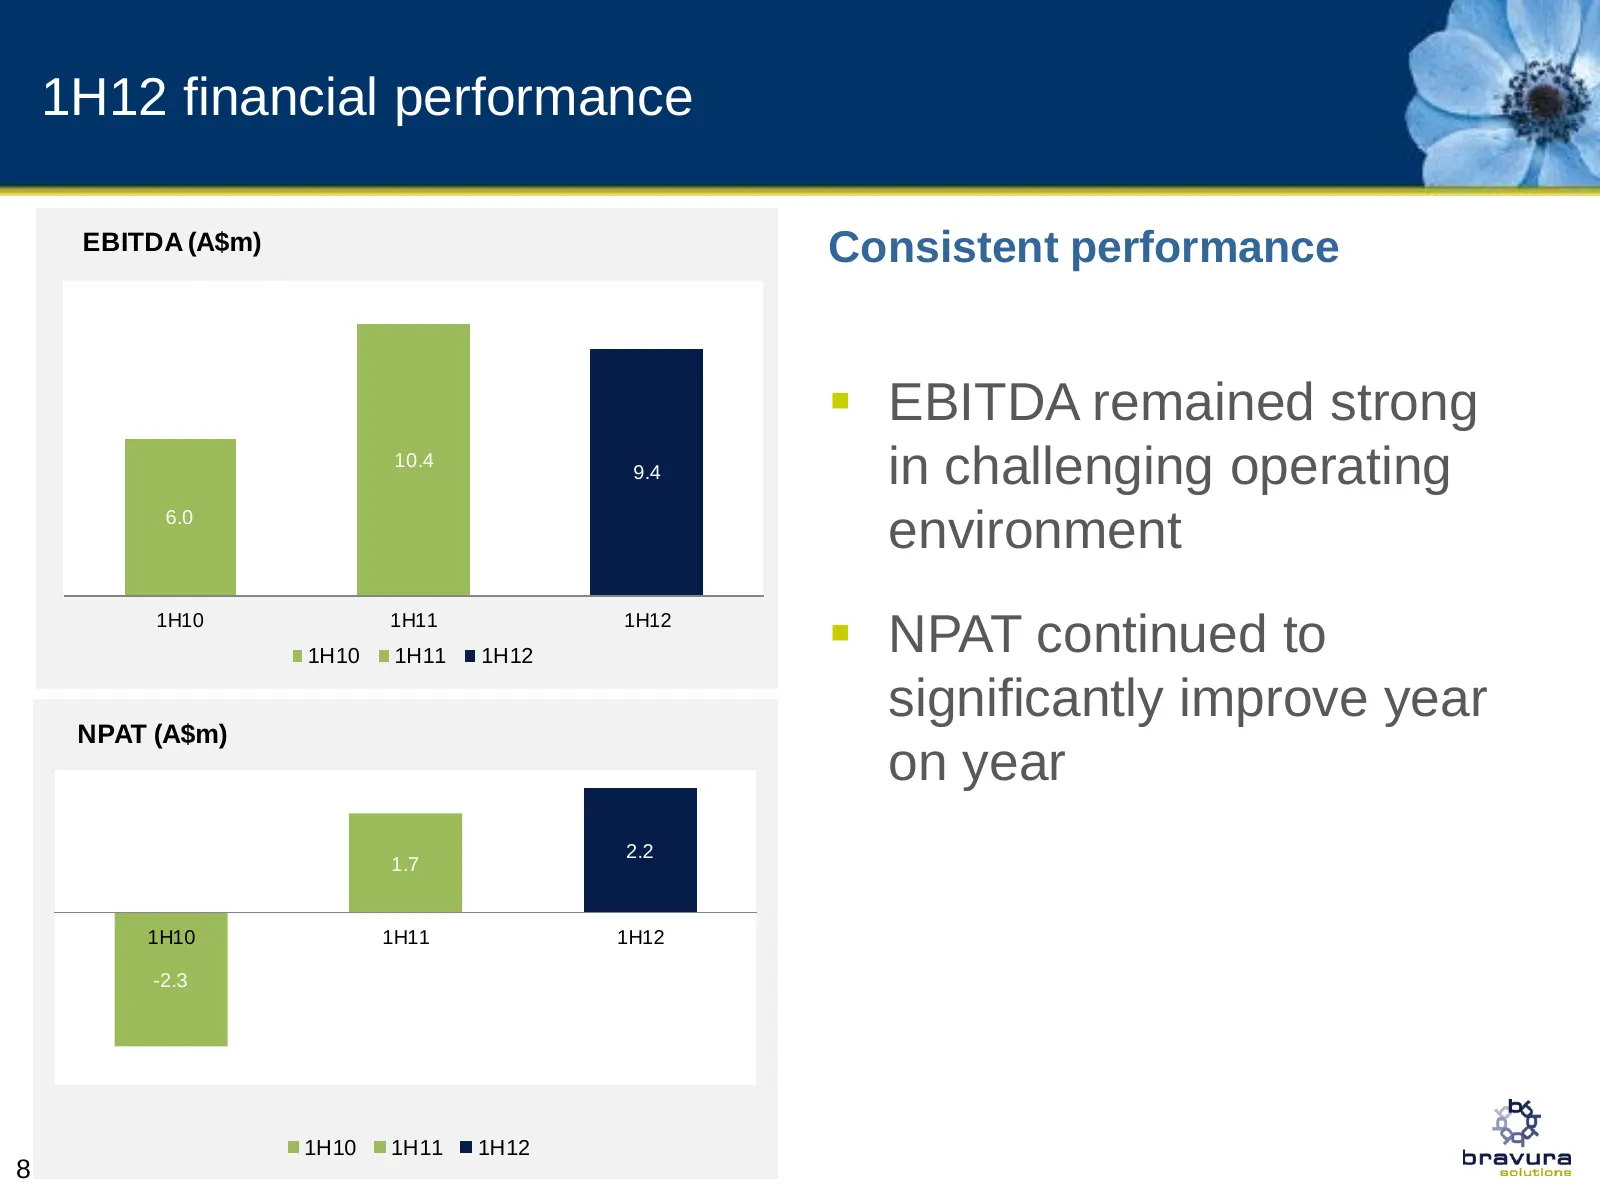
1H12 financial performance EBITDA (A$m) Consistent performance EBITDA remained strong 10.4 9.4 in challenging operating 6.0 environment 1H10 1H10 1H11 1H11 1H12 1H12 NPAT continued to NPAT (A$m) significantly improve year on year 2.2 1.7 1H10 1H11 1H12 -2.3 1H10 1H11 1H12 8
Slide 9: 1H12 revenue summary
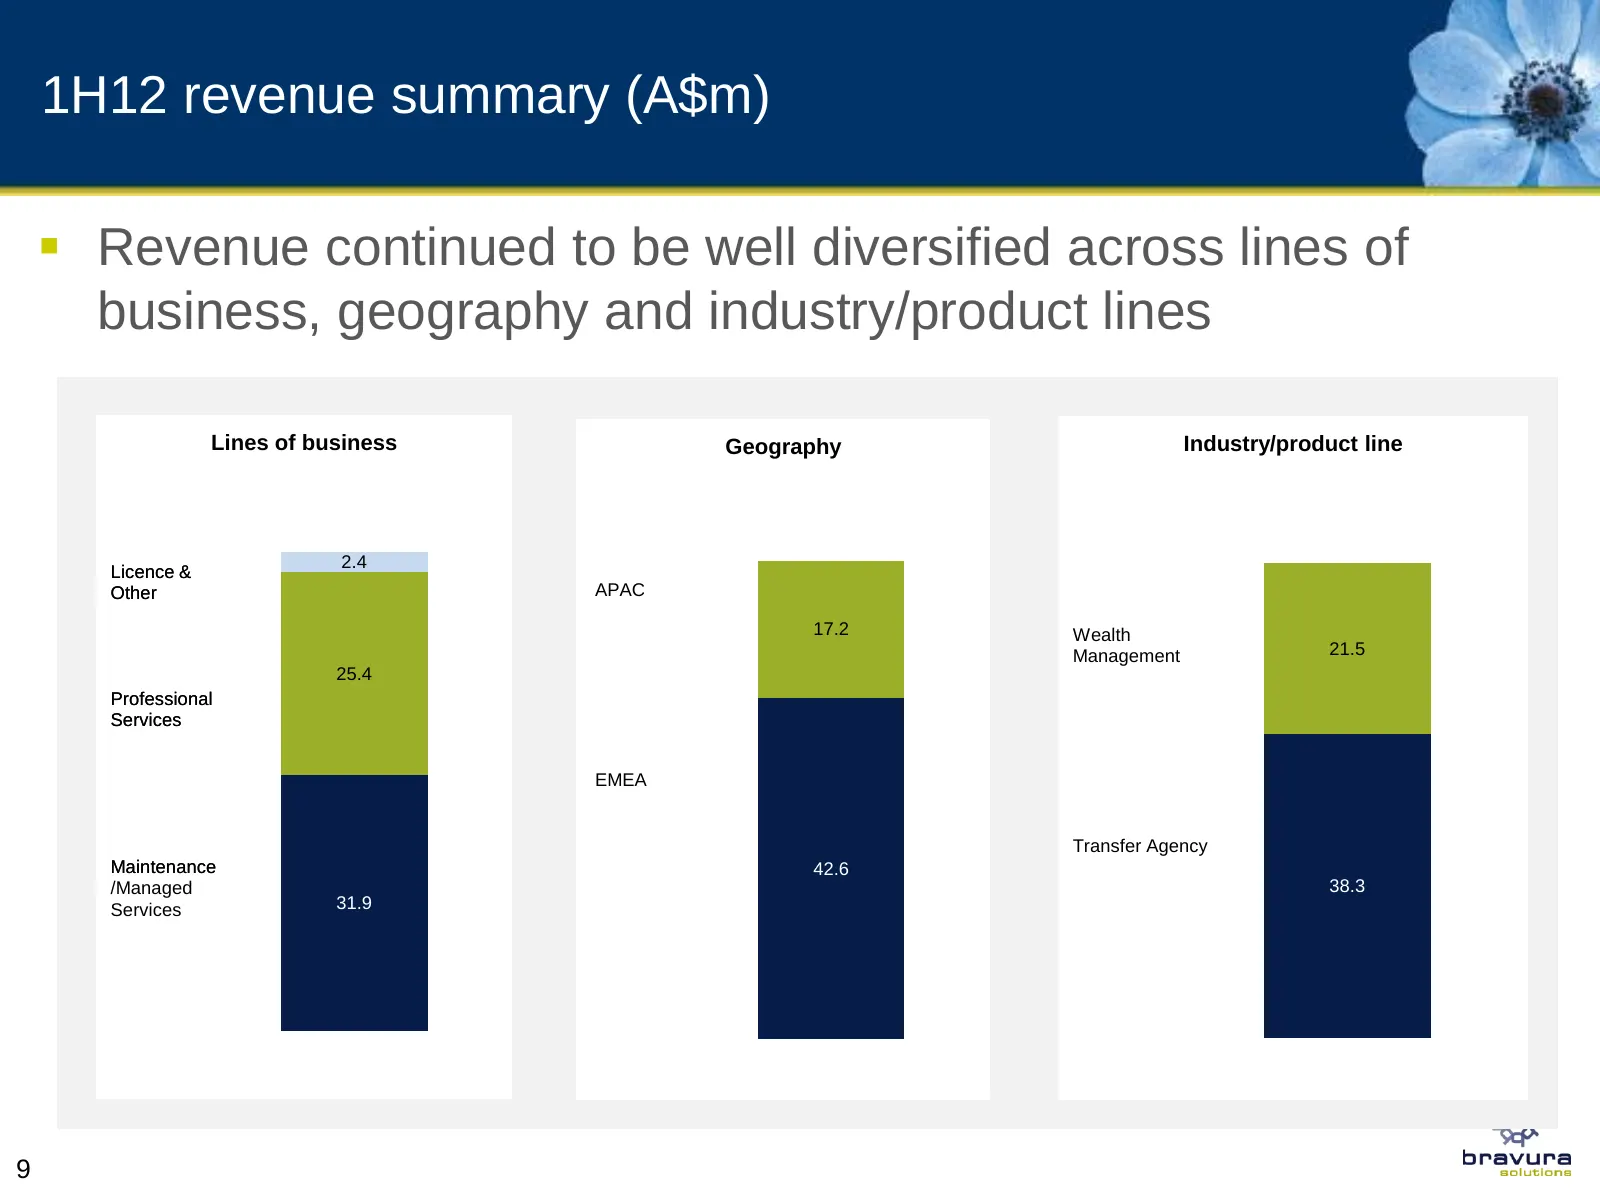
1H12 revenue summary (A$m) Revenue continued to be well diversified across lines of business, geography and industry/product lines Lines of business Geography Industry/product line 2.4 Licence & Other APAC 17.2 Wealth Management 21.5 25.4 Professional Services EMEA Transfer Agency Maintenance 42.6
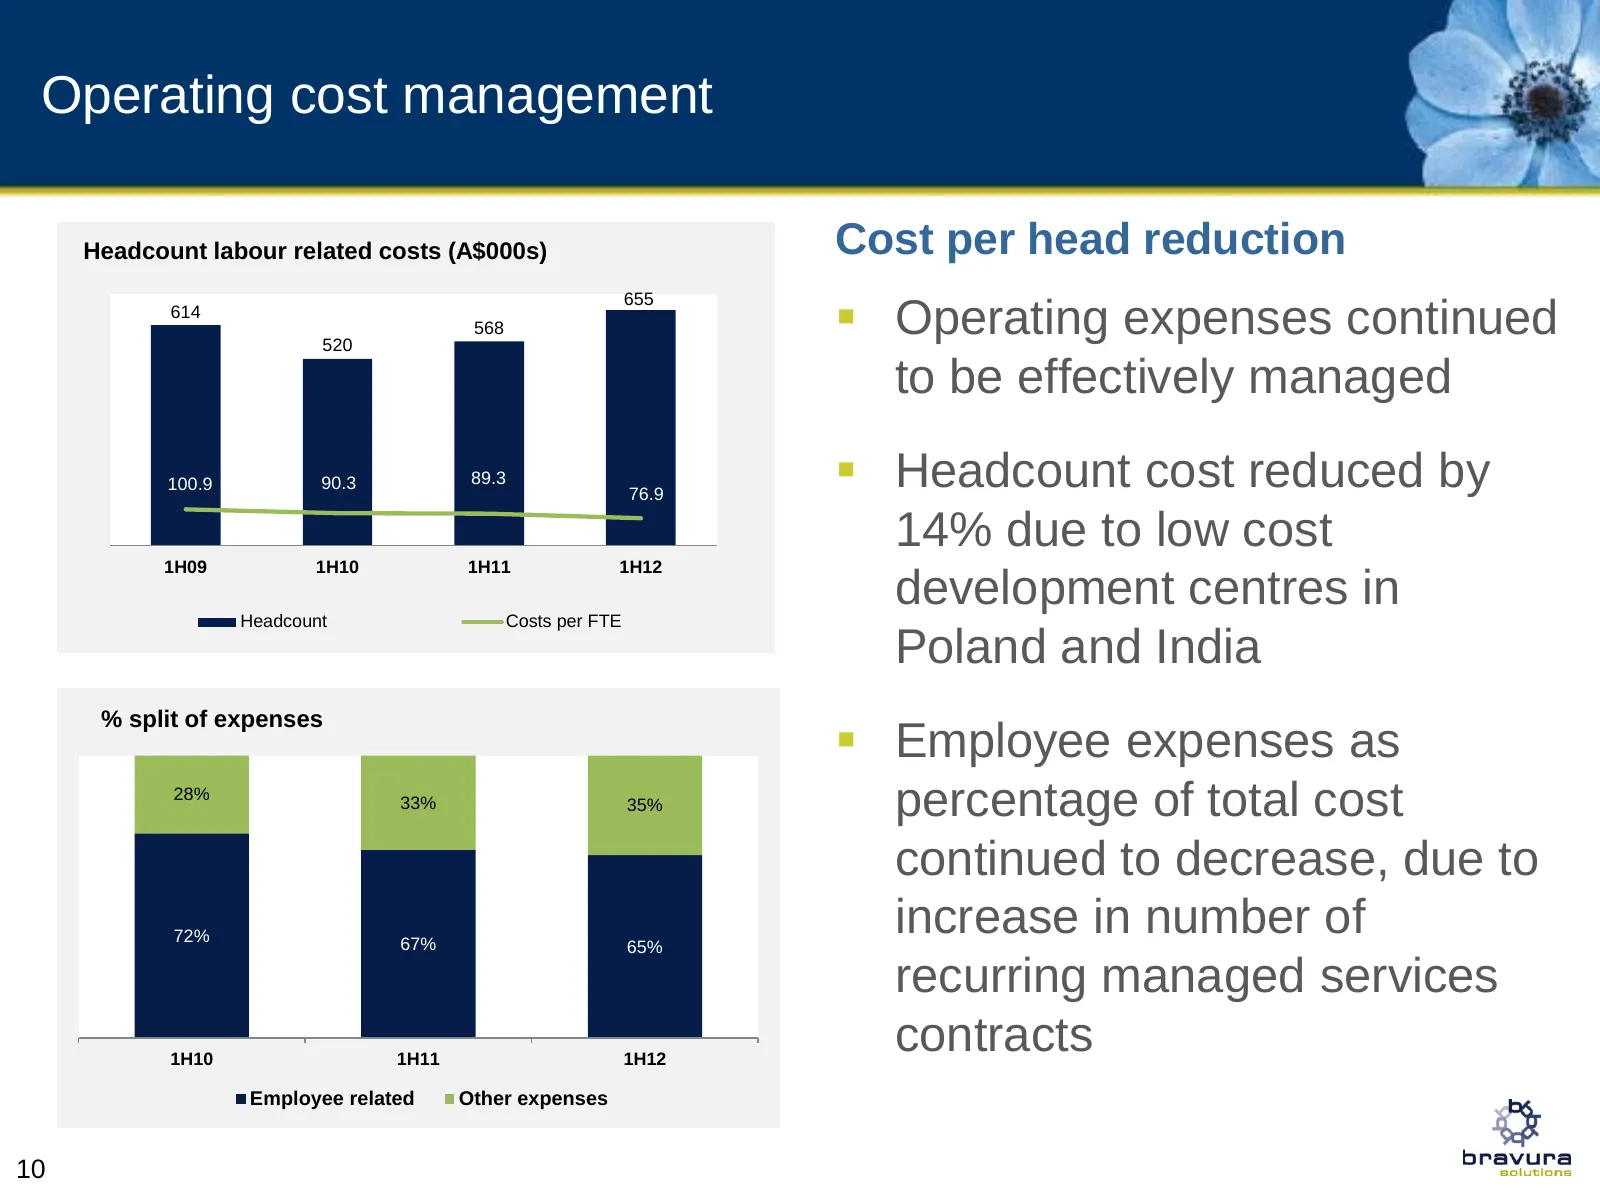
Slide 10: Operating cost management
Operating cost management Headcount labour related costs (A$000s) Cost per head reduction Operating expenses continued 655 614 568 520 to be effectively managed 100.9 90.3 89.3 76.9 Headcount cost reduced by 14% due to low cost 1H09 1H10 1H11 1H12 Headcount Costs per FTE development centres in P
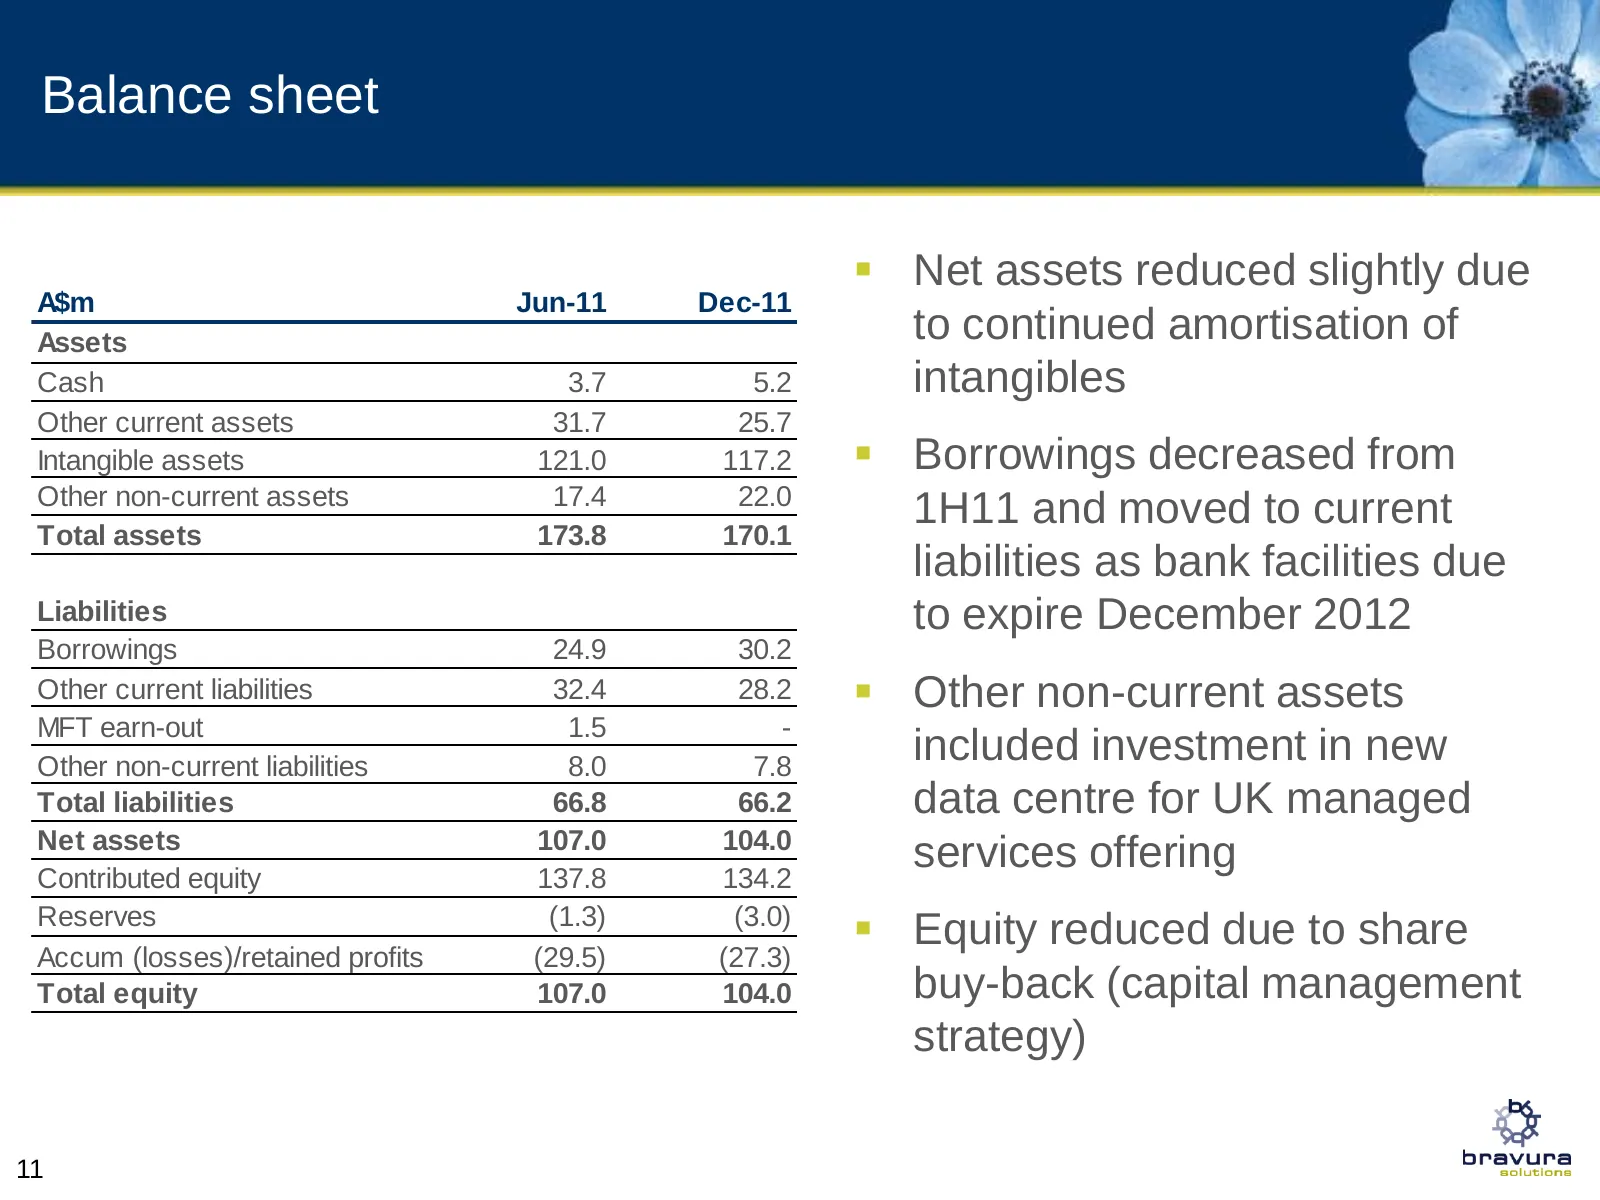
Slide 11: Balance sheet
Balance sheet Net assets reduced slightly due A$m Jun-11 Dec-11 Assets to continued amortisation of Cash 3.7 5.2 intangibles Other current assets 31.7 25.7 Intangible assets 121.0 117.2 Borrowings decreased from Other non-current assets 17.4 22.0 Total assets 173.8 170.1 1H11 and moved to curren
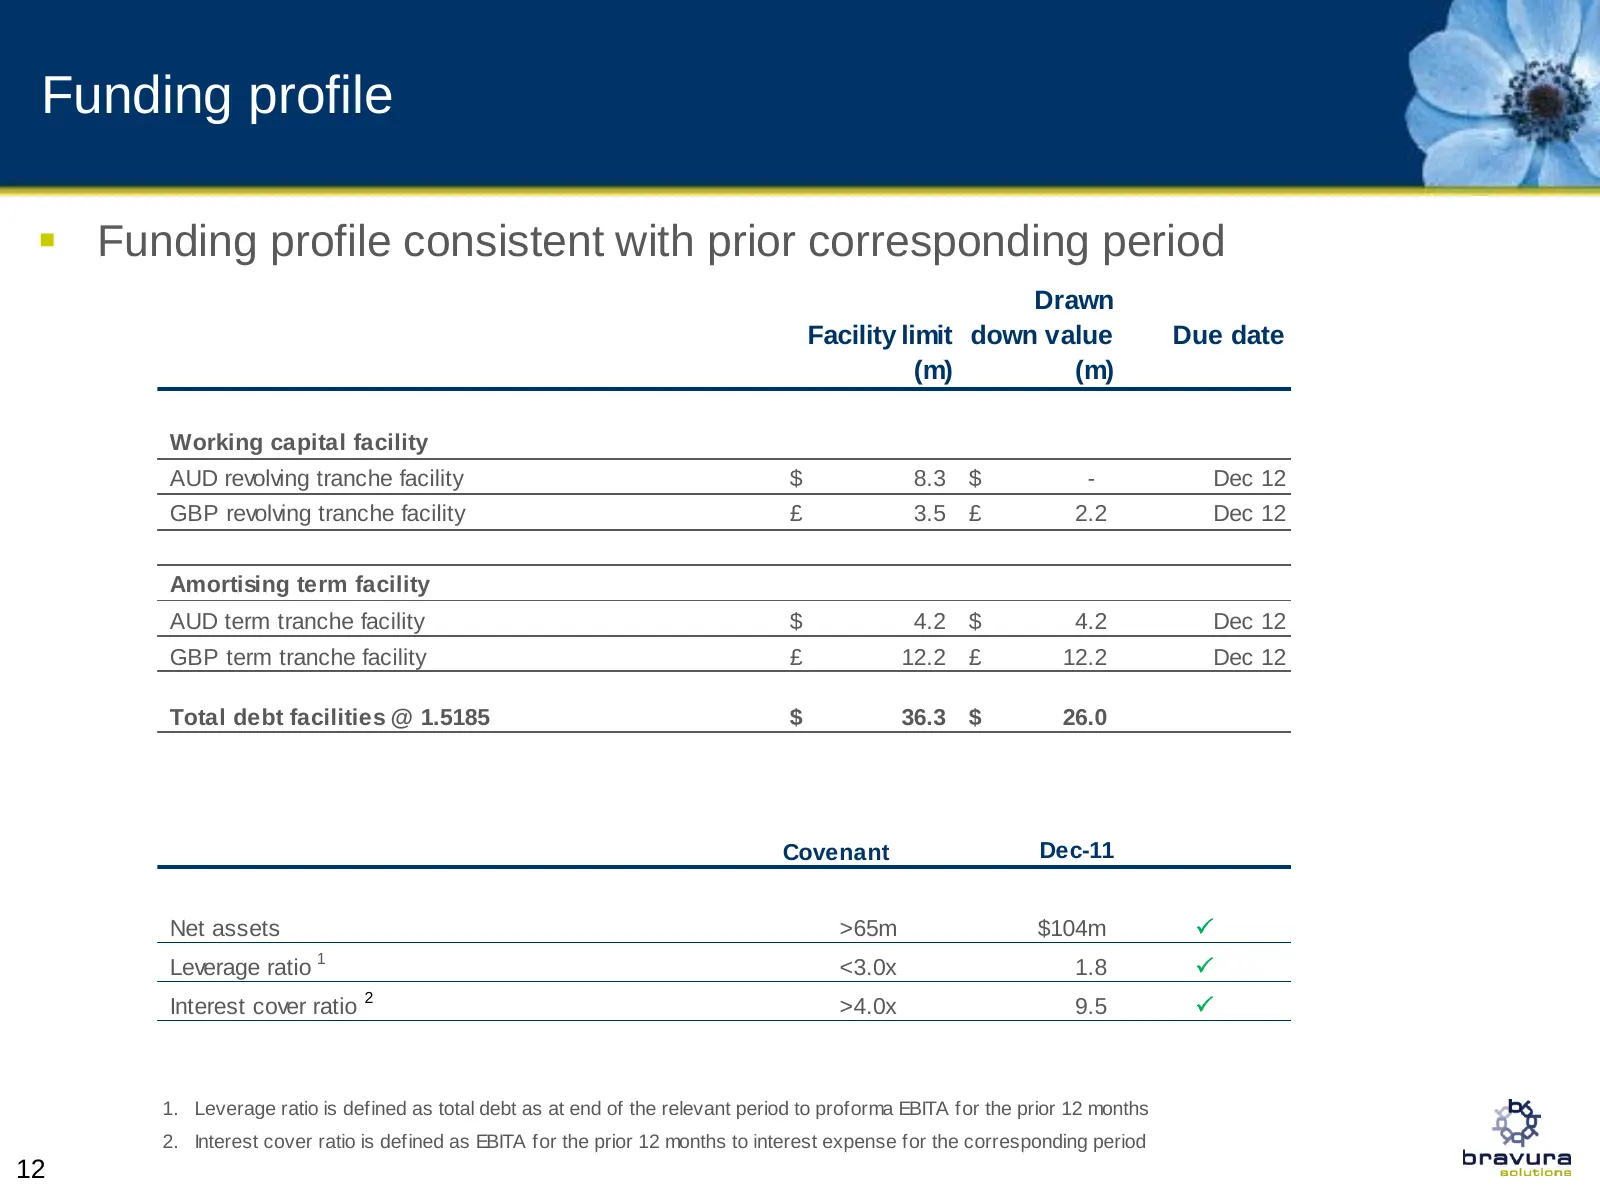
Slide 12: Funding profile
Funding profile Funding profile consistent with prior corresponding period Drawn Facility limit down value Due date (m) (m) Working capital facility AUD revolving tranche facility $ 8.3 $ - Dec 12 GBP revolving tranche facility £ 3.5 £ 2.2 Dec 12 Amortising term facility AUD term tranche facility

Slide 13: Strategic outlook
Strategic outlook
Slide 14: Wealth Management
Wealth Management Market interest in Sonata platform evident from increasing number of product demonstrations and industry consultant attention Implementation of Sonata platform commenced for market leading Australian superannuation TPA, Russell Investments Garradin v12.0 has extended tax opti
Slide 15: Transfer Agency
Transfer Agency Continued focus on development projects for TA Web, Operational Data Store (ODS) and Retail Distribution Review (RDR), as well as improvements to Babel’s processing capabilities Clients reviewed extensions to scope and terms of contracts Healthy business partnerships with exist
Slide 16: Key summary points
Key summary points Maintained revenue in a difficult economic climate Consistent and stable financial position Increased net profit and improved cash flow Continued cost management focus Maintained focus on specialisation in transfer agency and wealth management in Asia Pacific, UK and Eur
Slide 17: Going forward
Going forward Early signs that European financial services markets are stabilising Interest in Sonata gaining traction in wealth management and life insurance markets Clarity of regulatory requirements creating increased interest in messaging solutions Continue to review acquisition opportun

Slide 18: Questions and answers
Questions and answers
Source: Internet Archive copy of bravurasolutions.com
More decks from Bravura Solutions Limited
 FY2026 Earnings Presentation25 slides · Aug 12, 2026
 H1 2026 Earnings Presentation24 slides · Feb 11, 2026
 Shareholder Meeting (October 2025)13 slides · Oct 15, 2025
 FY2025 Earnings Presentation25 slides · Aug 13, 2025
 H1 2025 Earnings Presentation28 slides · Feb 12, 2025
 Shareholder Meeting (October 2024)18 slides · Oct 30, 2024