Nan Ya Plastics Corporation · TWSE:1303
Nan Ya Plastics — H1 2015 Earnings Presentation
11 slides from Nan Ya Plastics's earnings presentation, September 2015
Slide 1: Nan Ya Plastics 2015 1H Operations & Performance
Nan Ya Plastics 2015 1H Operations & Performance Sept. 2015
Slide 2: Agenda
Agenda • Overview • Financial Highlights • Capacity Expansion Plan • Q&A
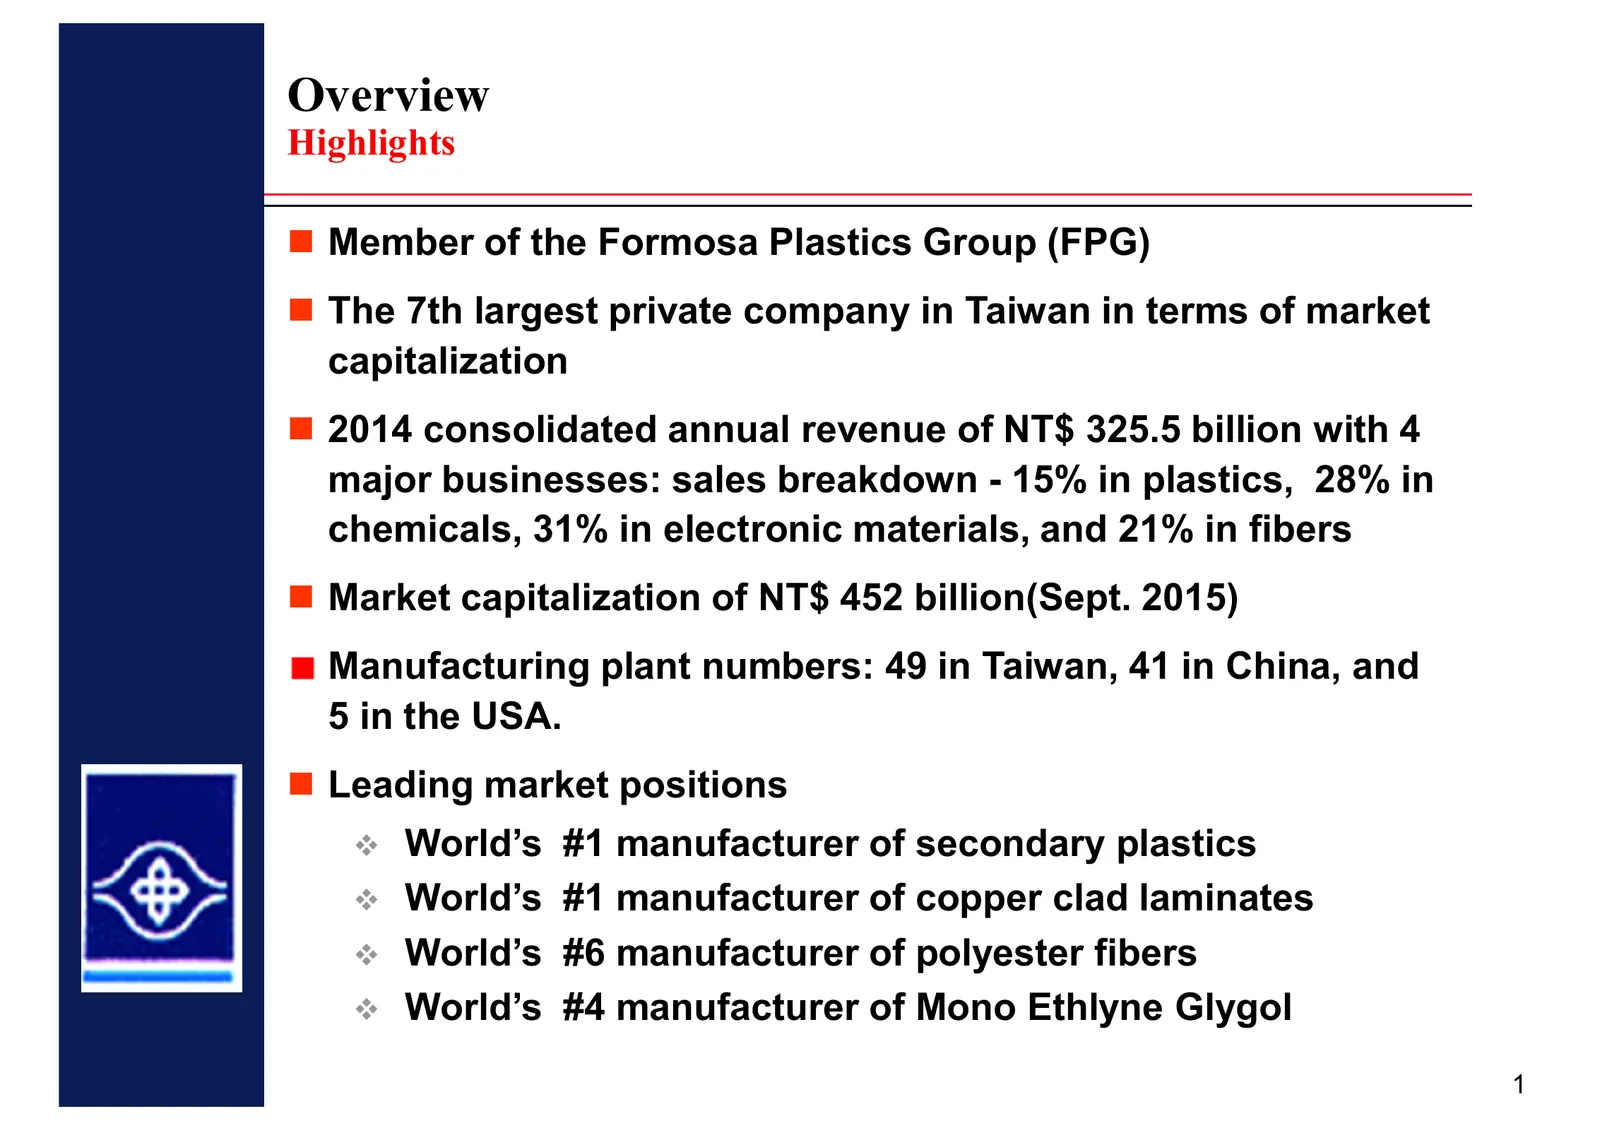
Slide 3: Overview: Highlights
Overview Highlights Member of the Formosa Plastics Group (FPG) The 7th largest private company in Taiwan in terms of market capitalization 2014 consolidated annual revenue of NT$ 325.5 billion with 4 major businesses: sales breakdown - 15% in plastics, 28% in chemicals, 31% in electronic materials,
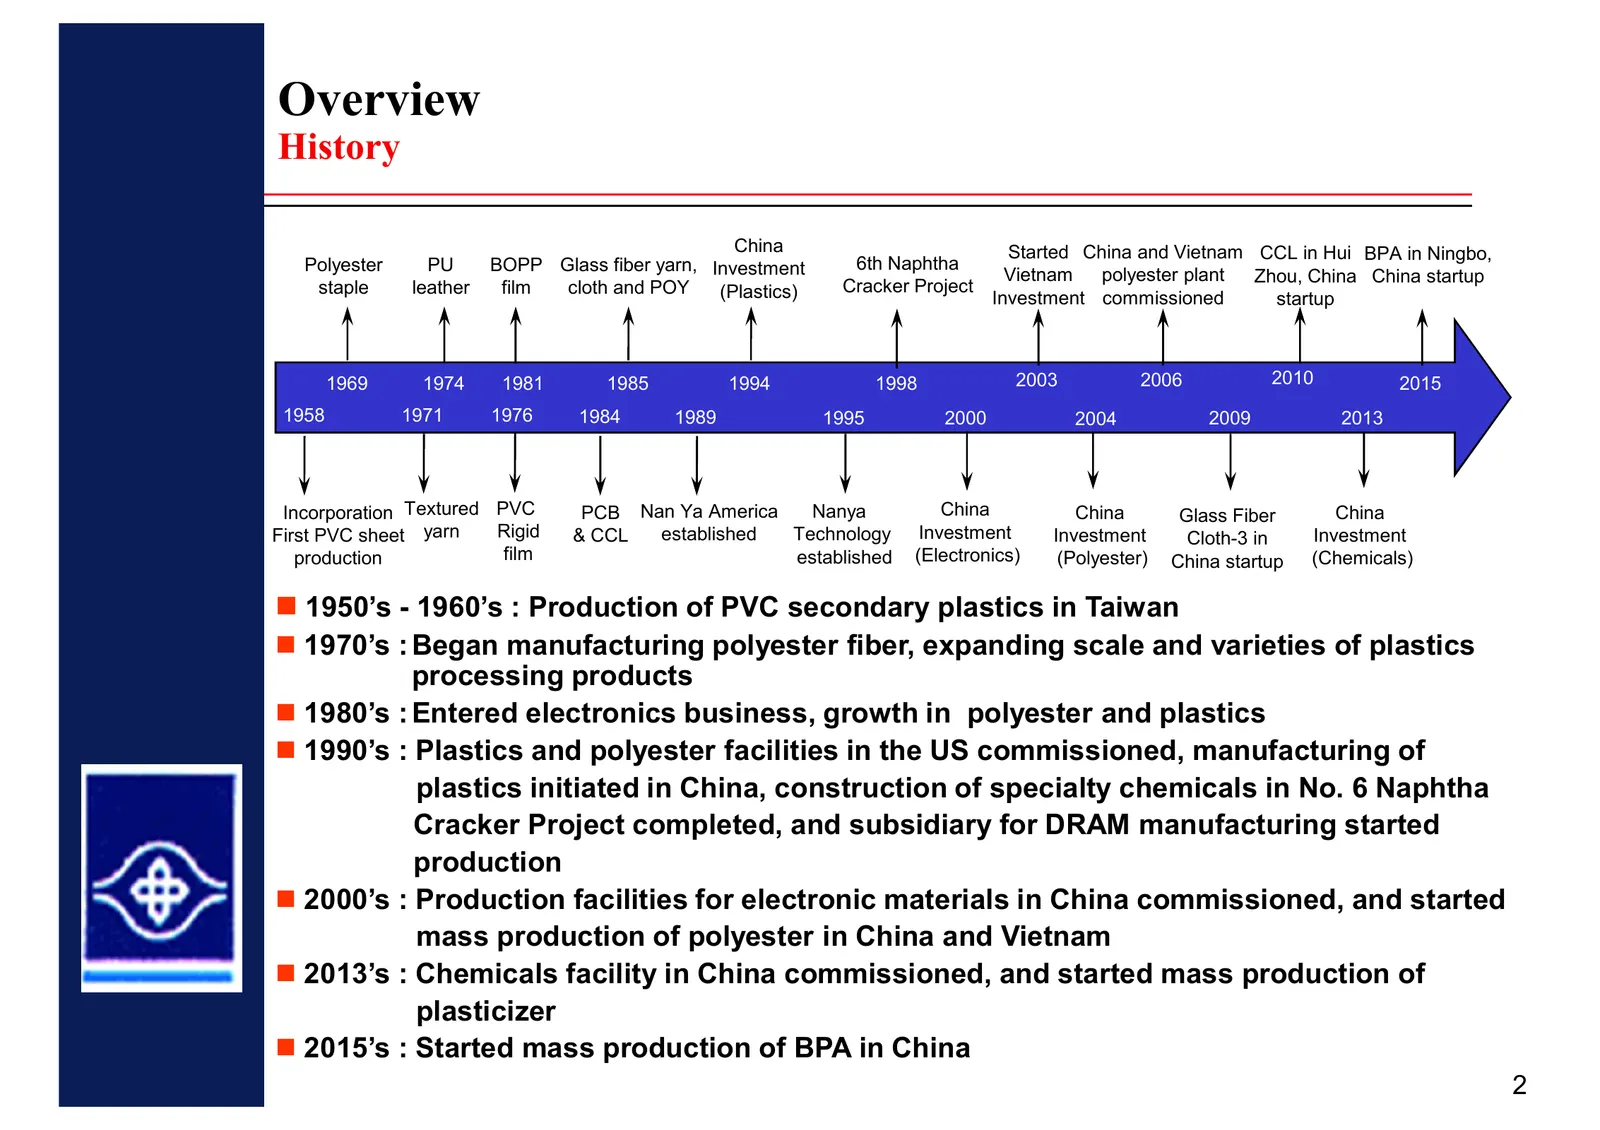
Slide 4: Overview: History
Overview History China Started China and Vietnam CCL in Hui BPA in Ningbo, Polyester PU BOPP Glass fiber yarn, Investment 6th Naphtha Vietnam polyester plant Zhou, China China startup staple leather film cloth and POY (Plastics) Cracker Project Investment commissioned startup 1969 1974 1981 1985 199
Slide 5: Financial Highlights: Consolidated Revenue (IFRS)
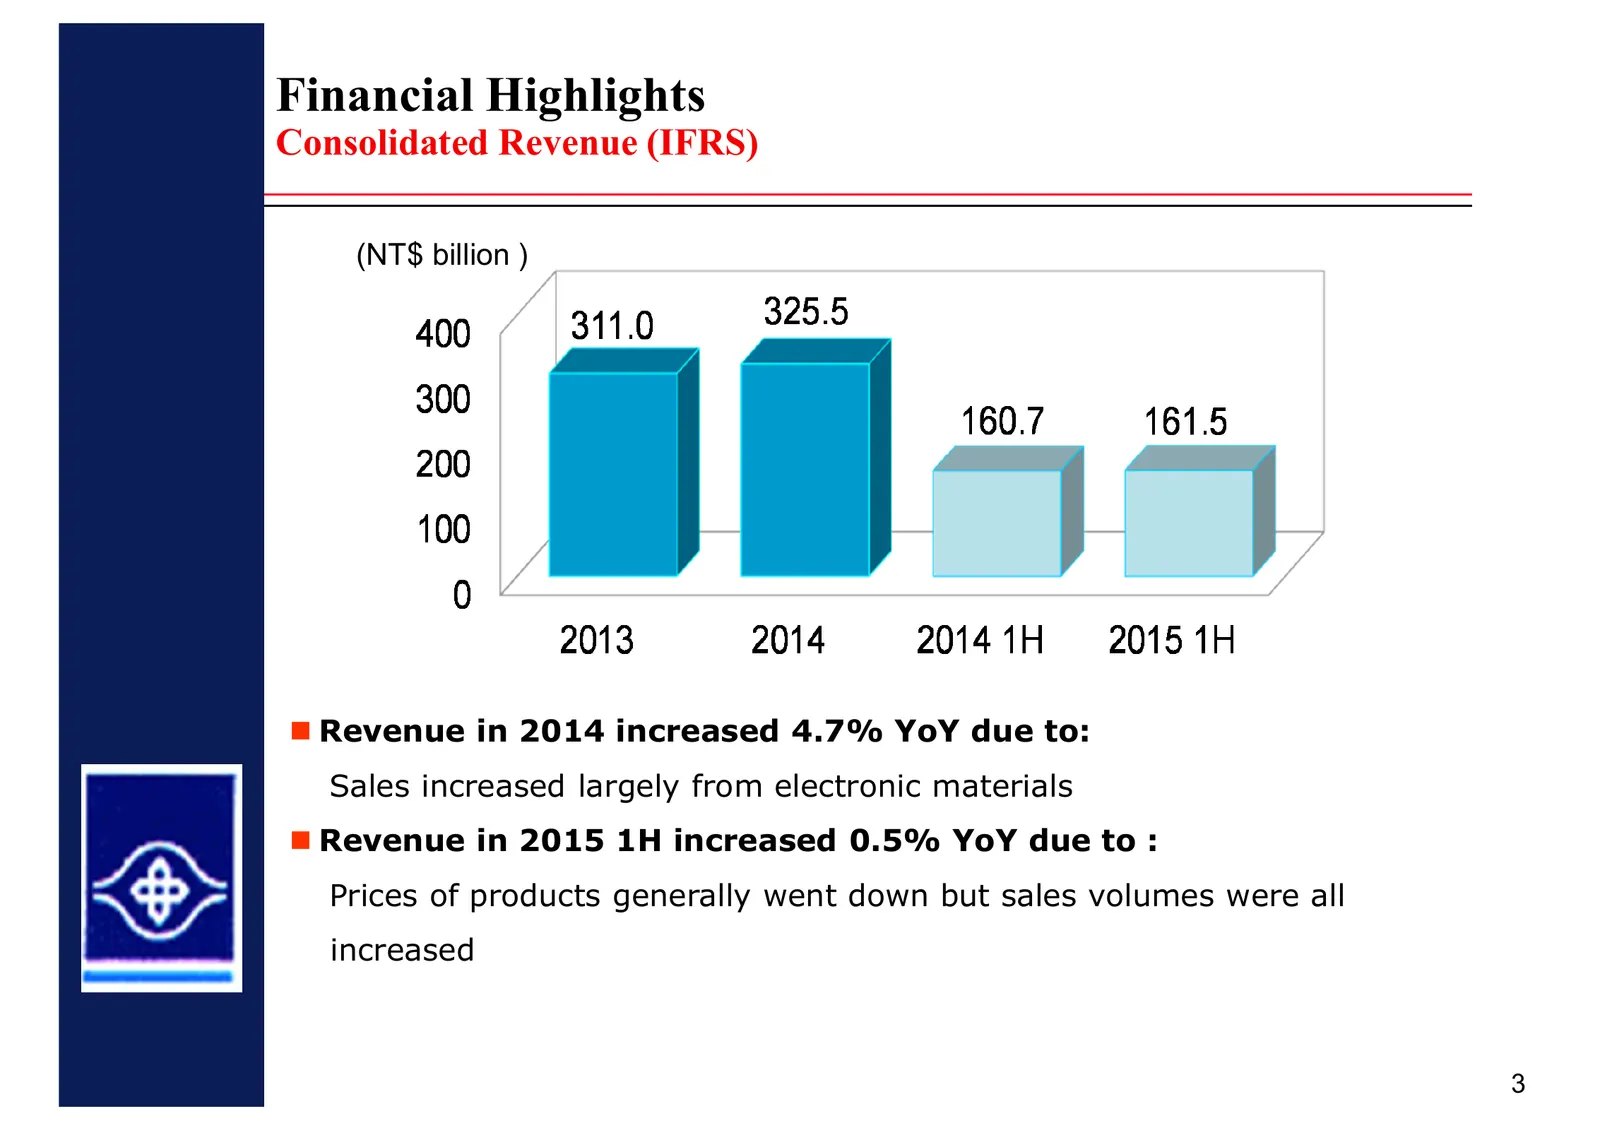
Financial Highlights Consolidated Revenue (IFRS) (NT$ billion ) Revenue in 2014 increased 4.7% YoY due to: Sales increased largely from electronic materials Revenue in 2015 1H increased 0.5% YoY due to : Prices of products generally went down but sales volumes were all increased 3
Slide 6: Financial Highlights: Pre-tax Income
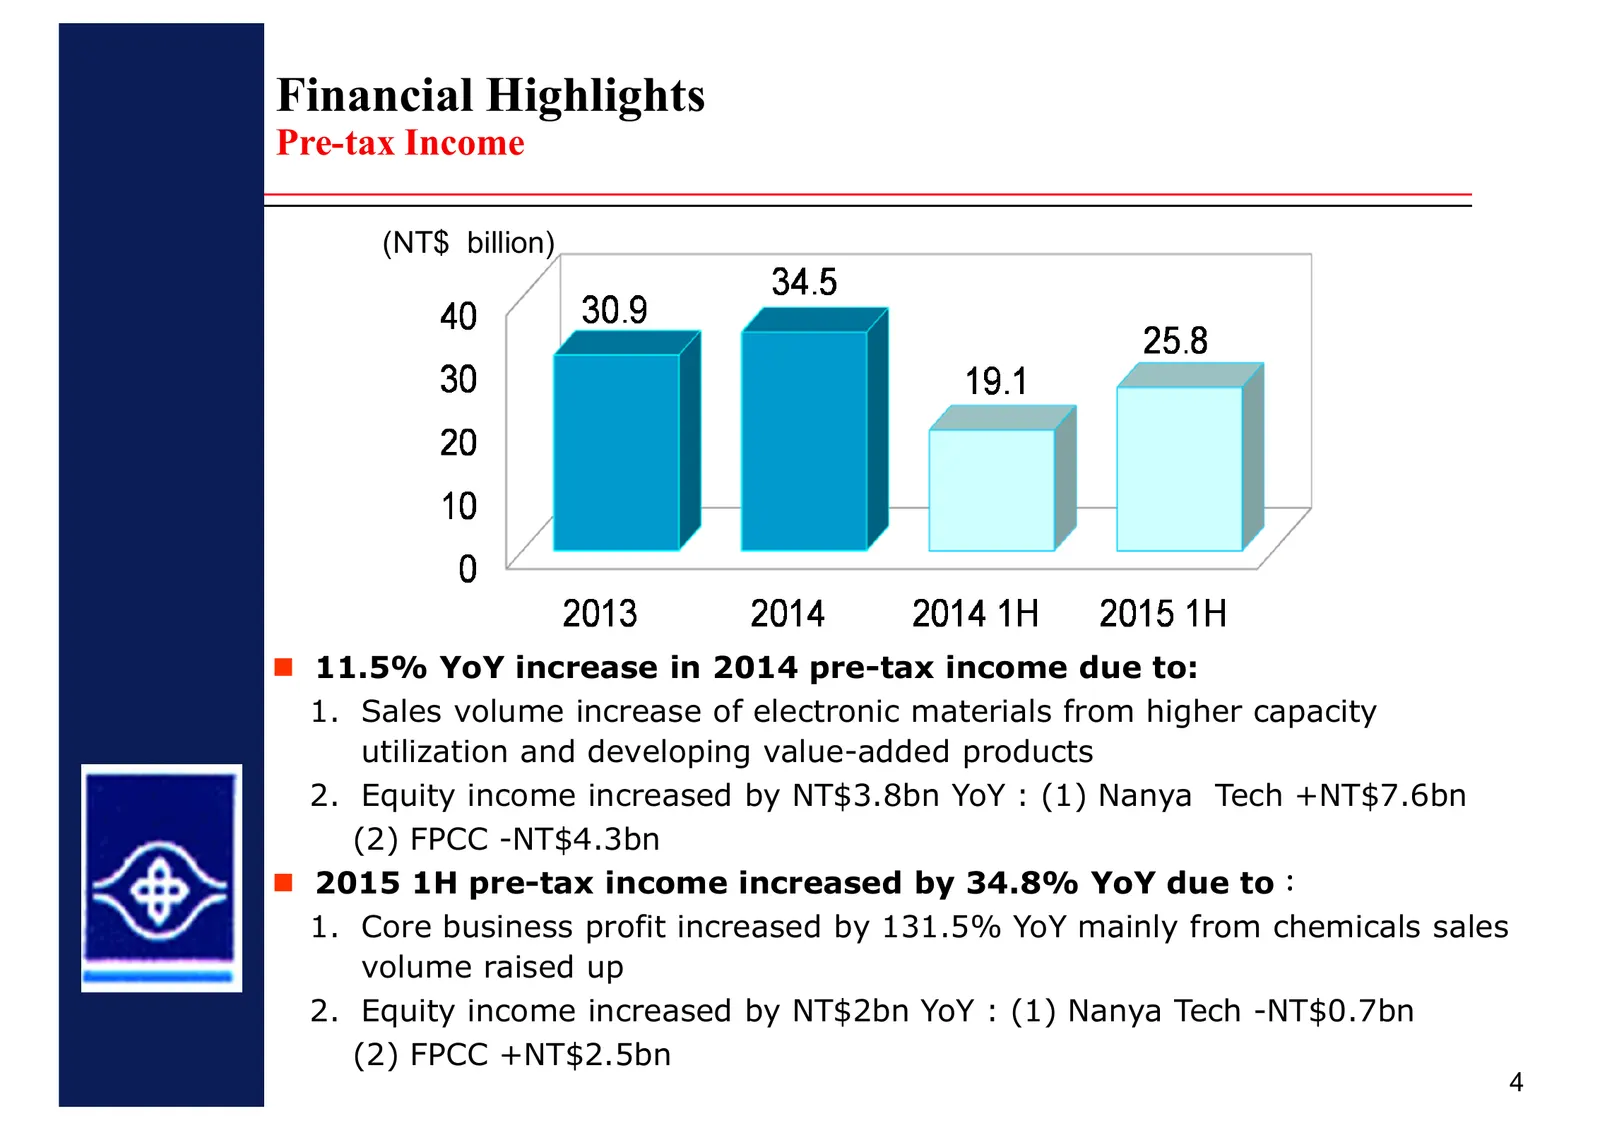
Financial Highlights Pre-tax Income (NT$ billion) 11.5% YoY increase in 2014 pre-tax income due to: 1. Sales volume increase of electronic materials from higher capacity utilization and developing value-added products 2. Equity income increased by NT$3.8bn YoY : (1) Nanya Tech +NT$7.6bn (2) FPCC -NT
Slide 7: Financial Highlights: Revenue Breakdown
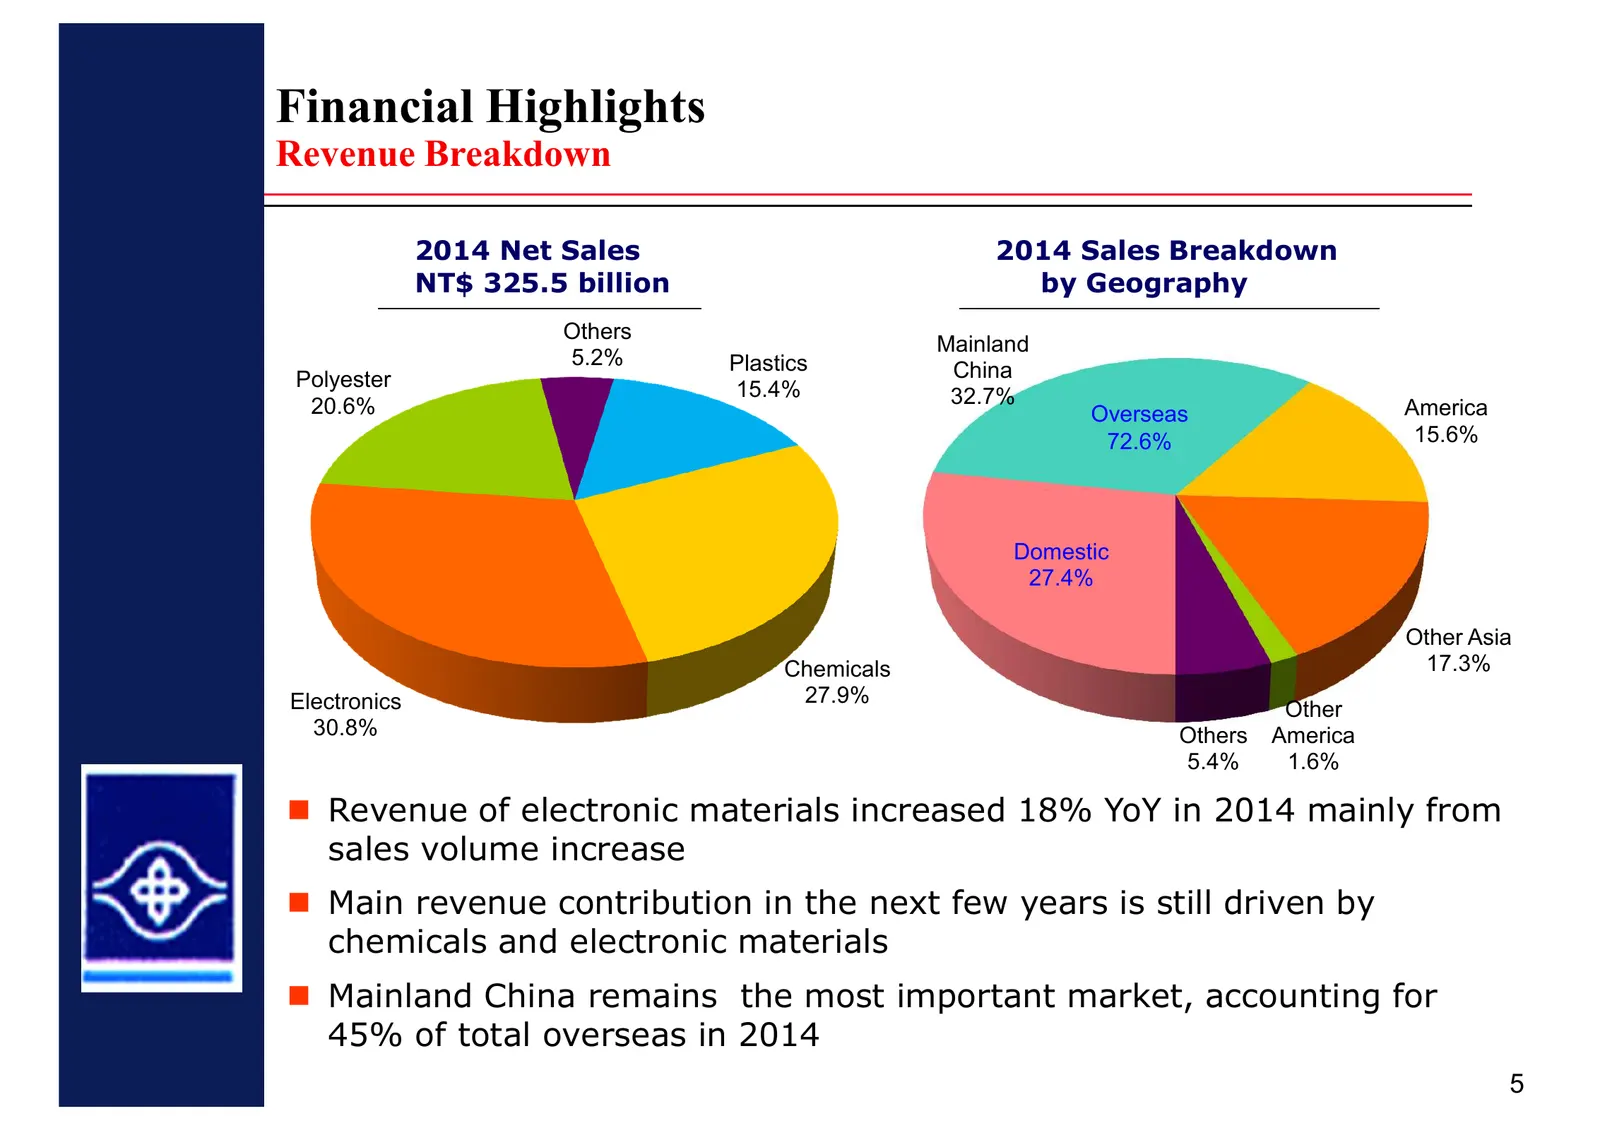
Financial Highlights Revenue Breakdown 2014 Net Sales 2014 Sales Breakdown NT$ 325.5 billion by Geography Others Mainland 5.2% Plastics Polyester China 15.4% 32.7% 20.6% Overseas America 72.6% 15.6% Domestic 27.4% Other Asia Chemicals 17.3% Electronics 27.9% Other 30.8% Others America 5.4% 1.6% Reve
Slide 8: Revenue Breakdown by Product Segment
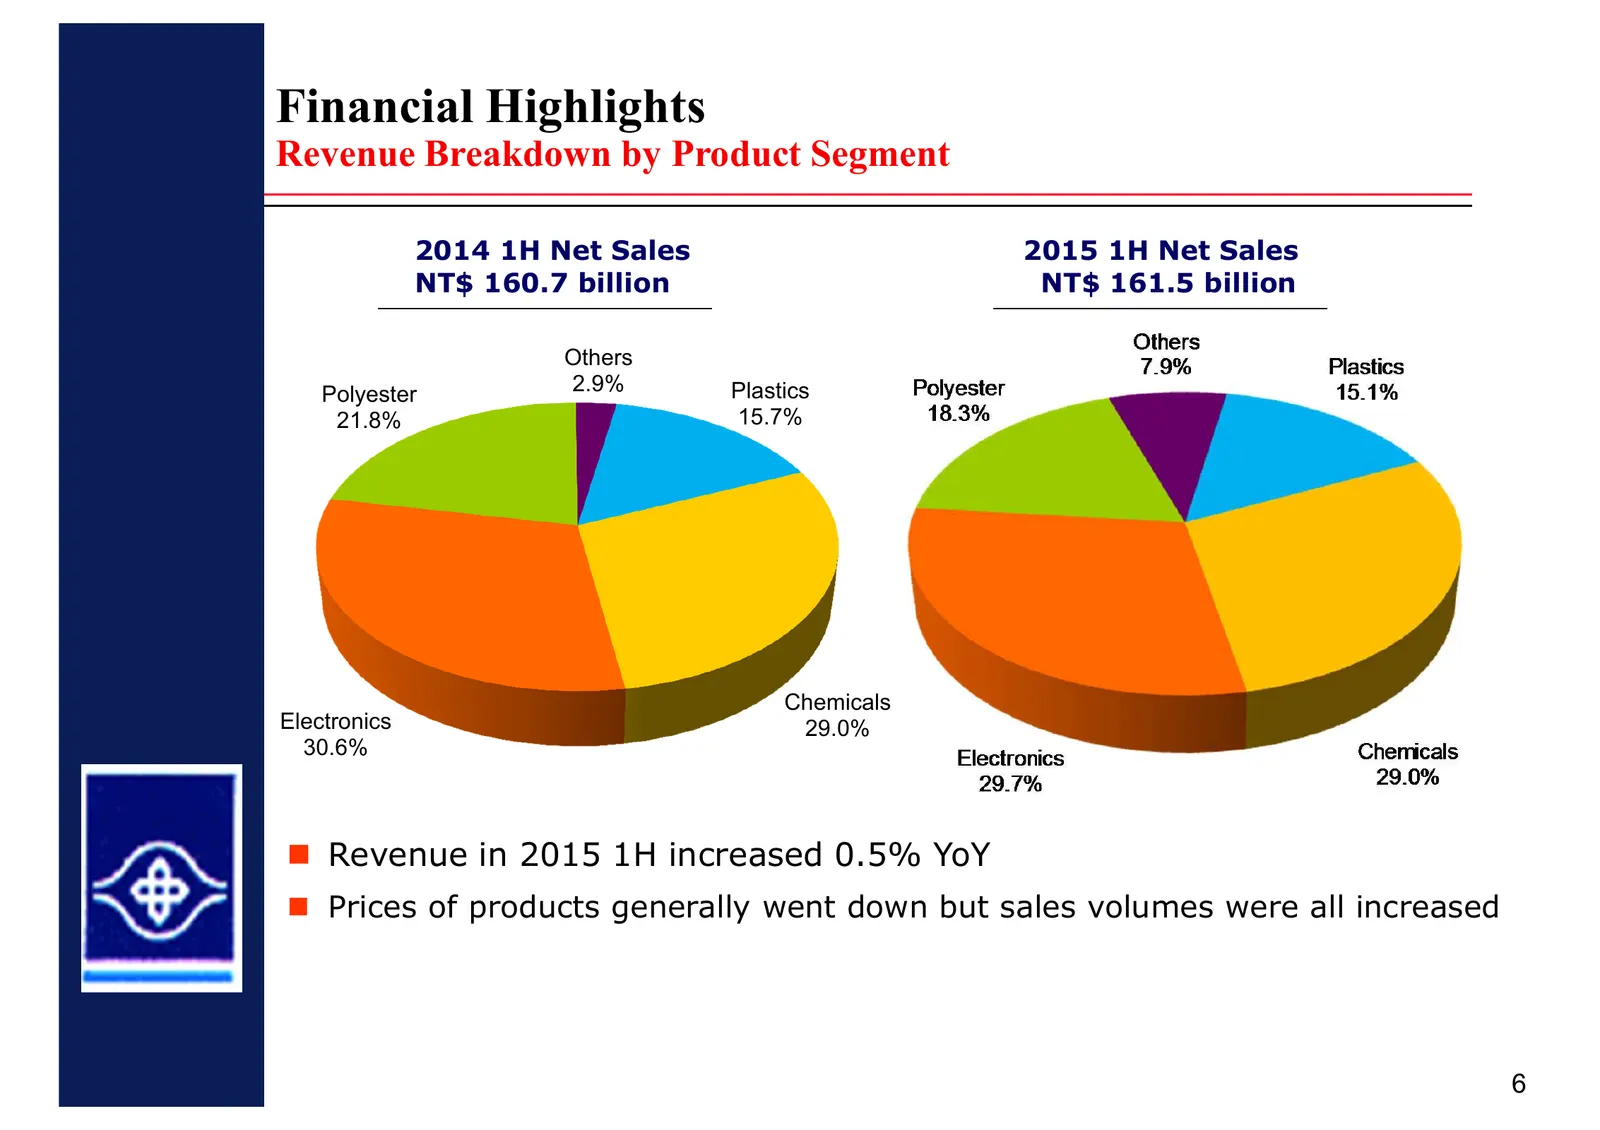
Financial Highlights Revenue Breakdown by Product Segment 2014 1H Net Sales 2015 1H Net Sales NT$ 160.7 billion NT$ 161.5 billion Others Polyester 2.9% Plastics 21.8% 15.7% Chemicals Electronics 29.0% 30.6% Revenue in 2015 1H increased 0.5% YoY Prices of products generally went down but sales volume
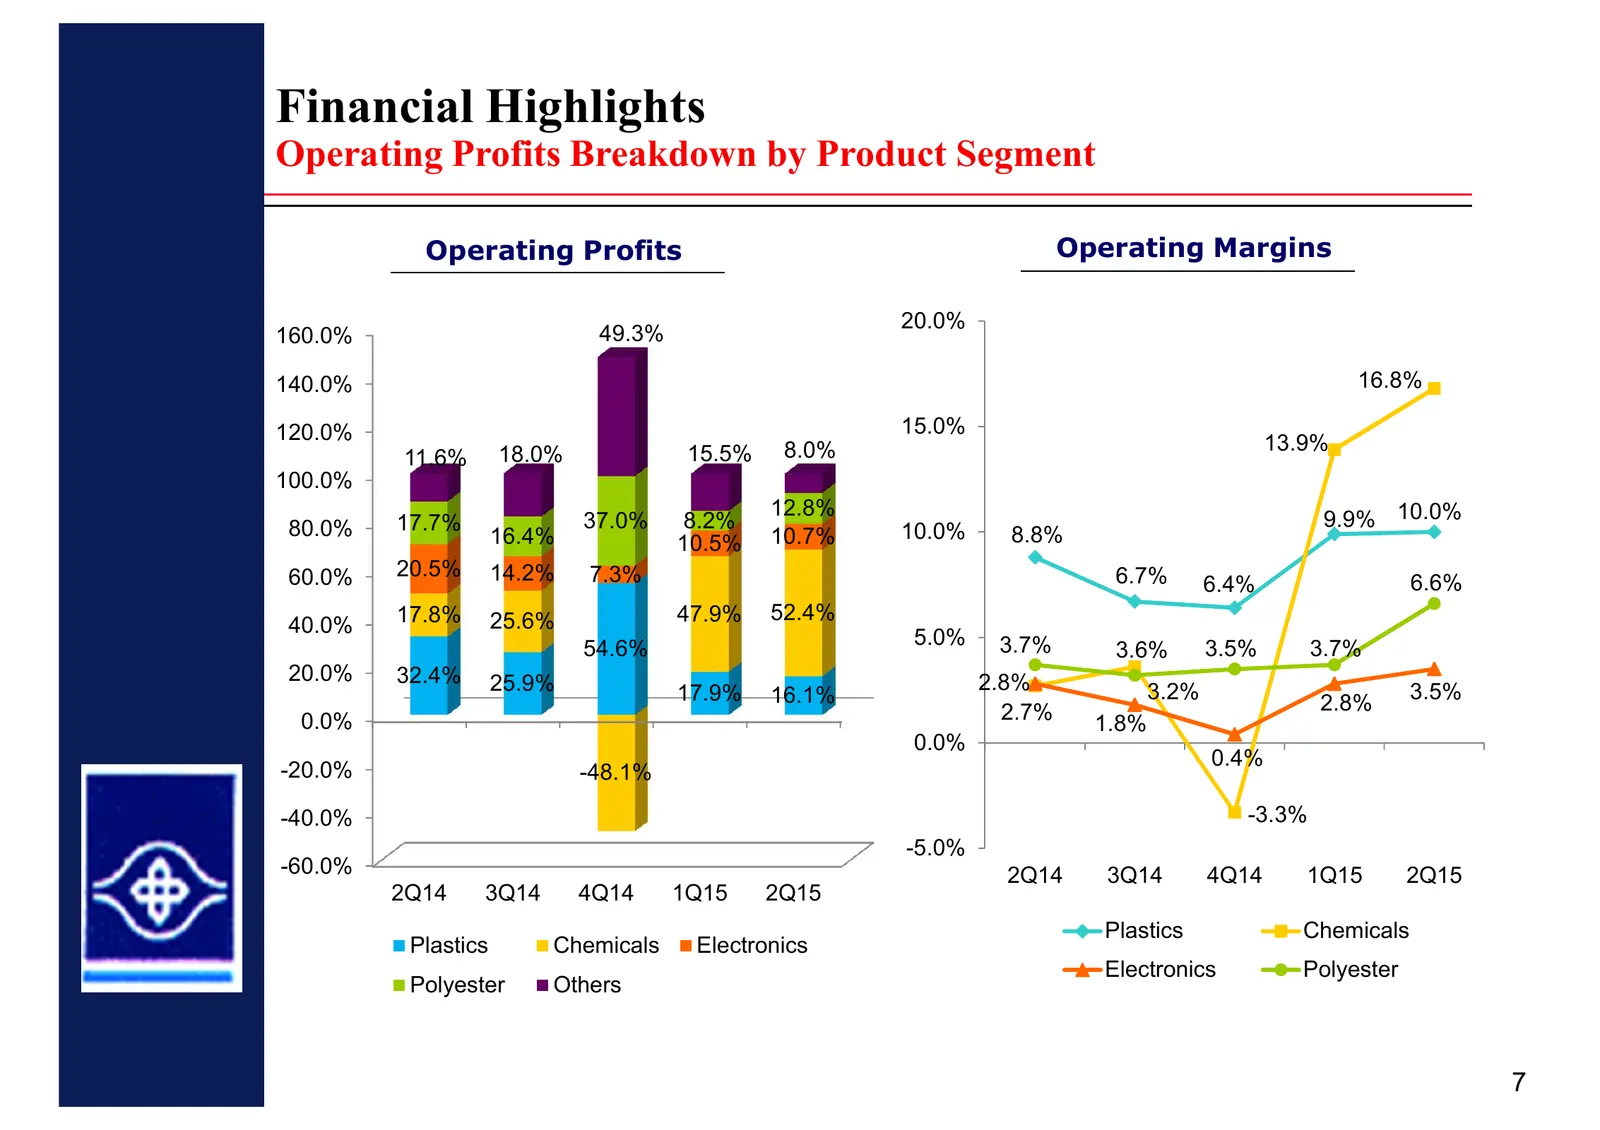
Slide 9: Operating Profits Breakdown by Product Segment
Financial Highlights Operating Profits Breakdown by Product Segment Operating Profits Operating Margins 20.0% 160.0% 49.3% 140.0% 16.8% 120.0% 15.0% 18.0% 15.5% 8.0% 13.9% 11.6% 100.0% 12.8% 9.9% 10.0% 80.0% 17.7% 37.0% 8.2% 10.0% 16.4% 10.5% 10.7% 8.8% 60.0% 20.5% 14.2% 7.3% 6.7% 6.4% 6.6% 17.8% 25
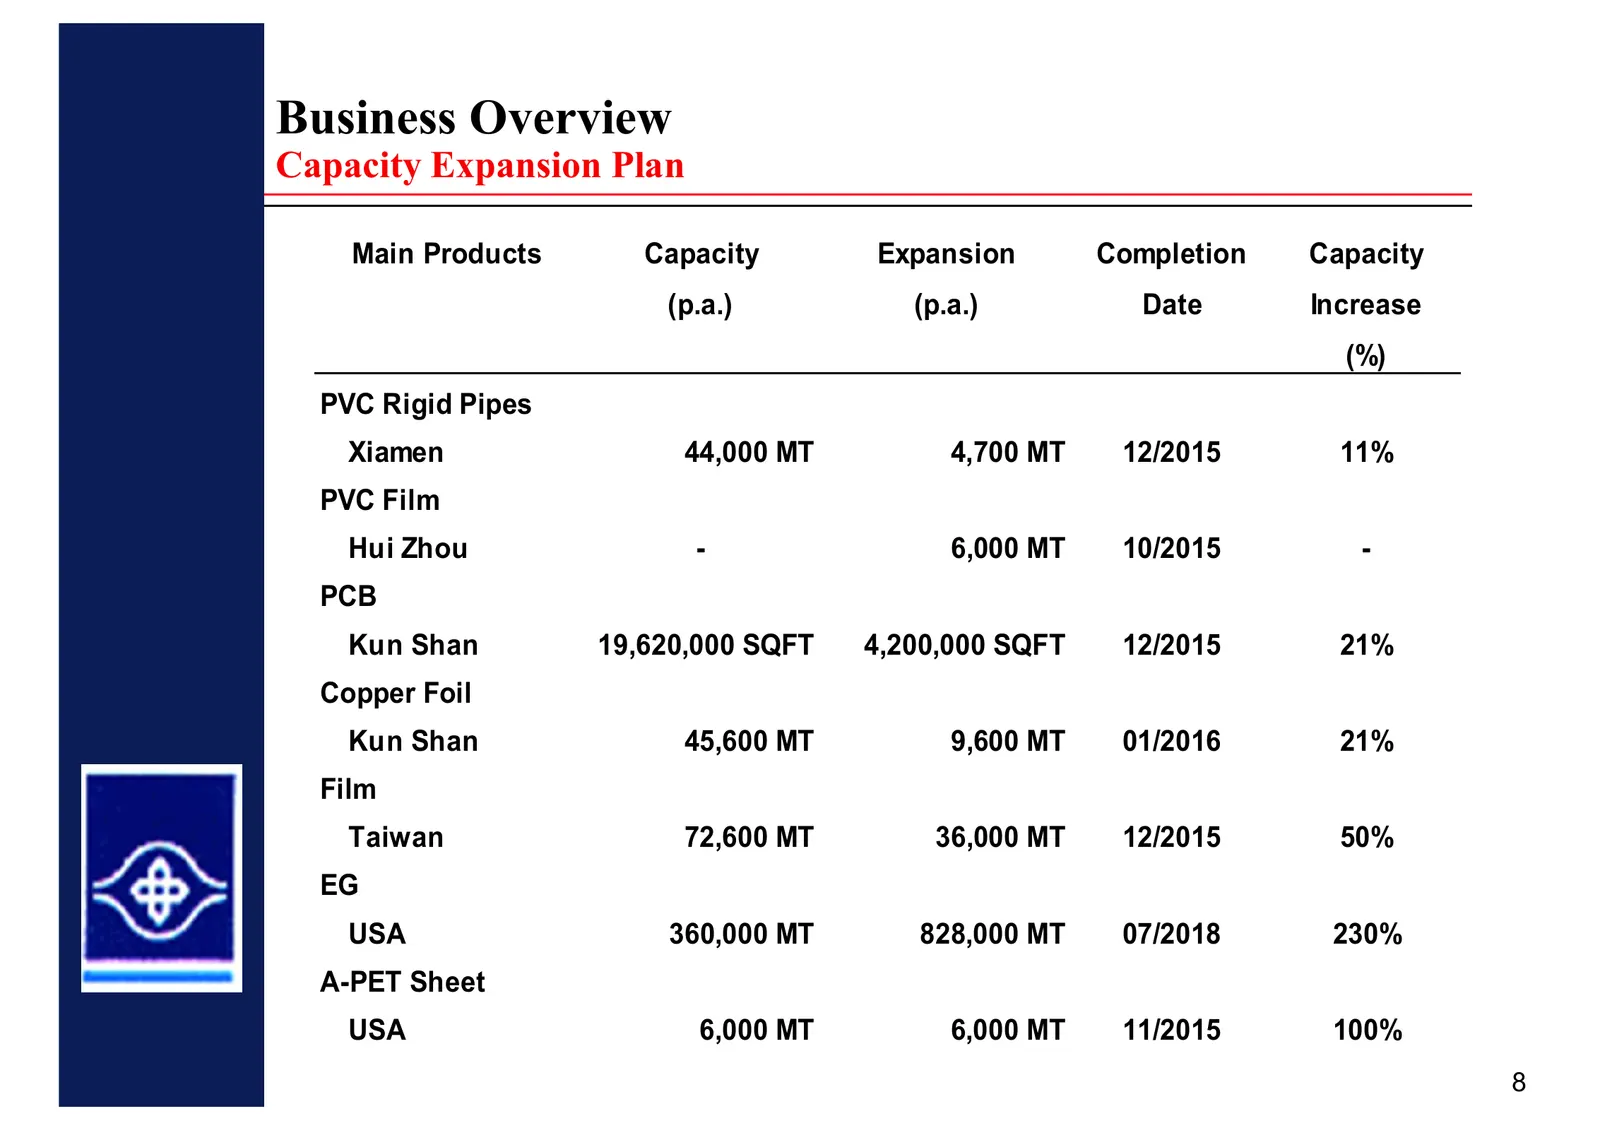
Slide 10: Capacity Expansion Plan
Business Overview Capacity Expansion Plan Main Products Capacity Expansion Completion Capacity (p.a.) (p.a.) Date Increase (%) PVC Rigid Pipes Xiamen 44,000 MT 4,700 MT 12/2015 11% PVC Film Hui Zhou - 6,000 MT 10/2015 - PCB Kun Shan 19,620,000 SQFT 4,200,000 SQFT 12/2015 21% Copper Foil Kun Shan 45,

Slide 11: THE END
THE END
Source: company website
More decks from Nan Ya Plastics Corporation
 President Securities Institutional Investors Conference (August 2026)15 slides · August 2026
 Q1 2026 Earnings Presentation15 slides · May 26, 2026
 CTBC Securities Institutional Investors Conference 202615 slides · Mar 13, 2026
 Concord Securities Institutional Investors Conference (November 2025)15 slides · Nov 19, 2025
 Taishin Securities 2025 Q3 Investment Forum15 slides · Aug 26, 2025
 Capital Securities 2025 Q2 Investment Forum14 slides · Jun 17, 2025