Sembcorp Industries Ltd. · SGX:U96
Sembcorp Industries — H1 2023 Earnings Presentation
27 slides from Sembcorp Industries's earnings presentation, Aug 4, 2023
Slide 1: 1H2023 Results Announcement
1H2023 Results Announcement August 4, 2023
Slide 2: CEO's Report
CEO’s Report Wong Kim Yin Group President & CEO © Sembcorp Industries
Slide 3: 1H2023 Group Financials
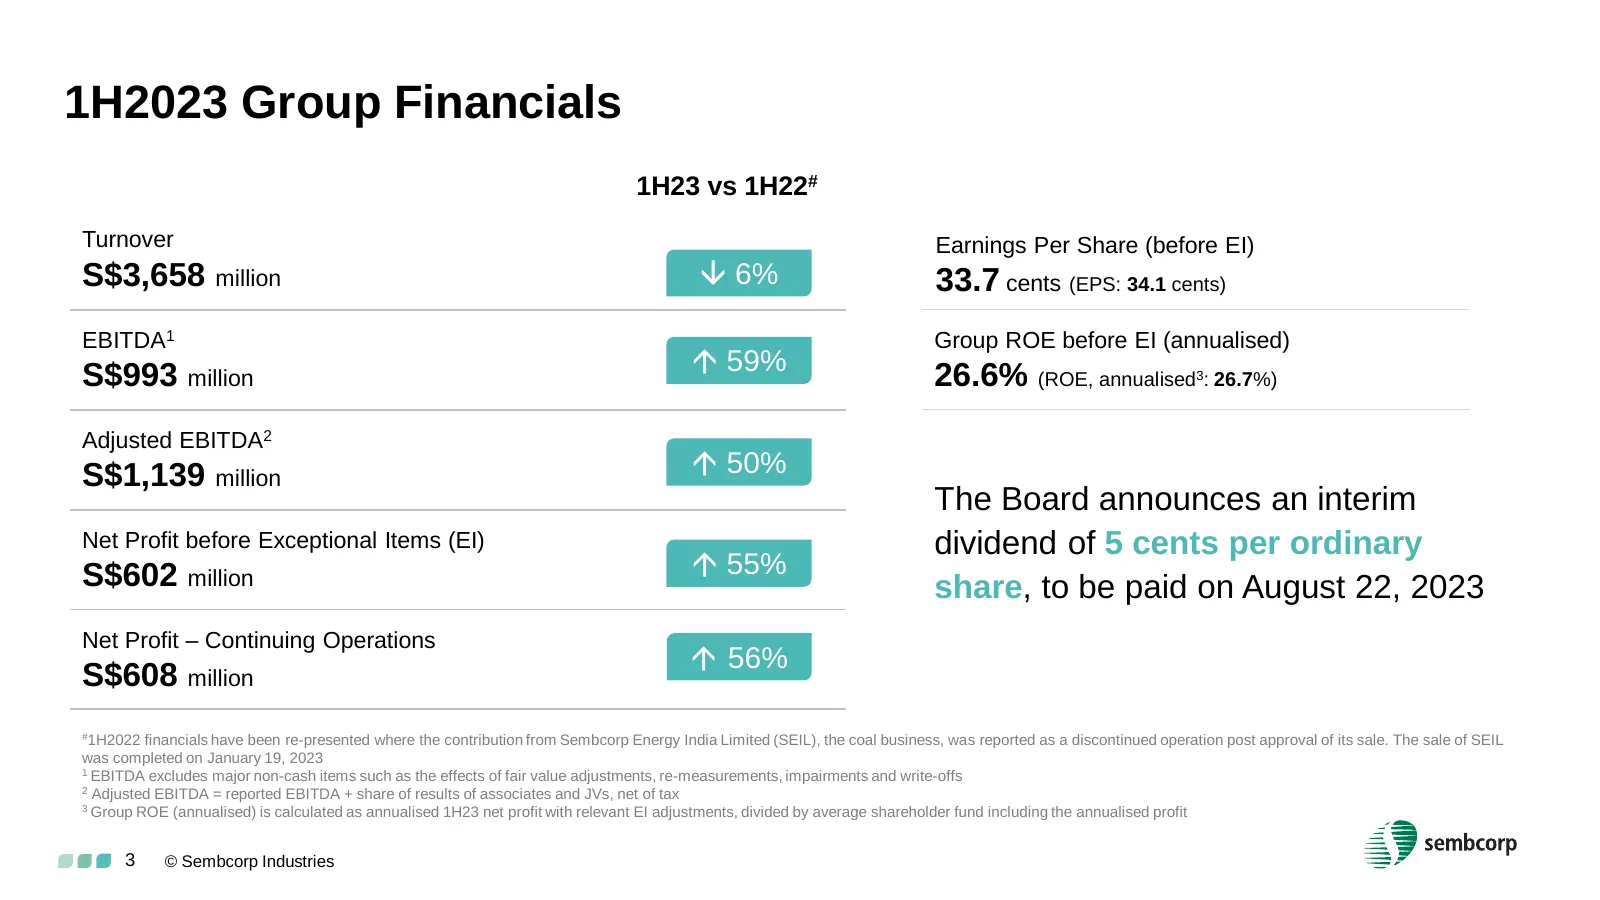
1H2023 Group Financials 1H23 vs 1H22# Turnover Earnings Per Share (before EI) S$3,658 million 6% 33.7 cents (EPS: 34.1 cents) EBITDA1 Group ROE before EI (annualised) S$993 million 59% 26.6% (ROE, annualised : 26.7%) 3 Adjusted EBITDA2 S$1,139 million 50% The Board announces an interim Net Pro
Slide 4: Renewables: Continued Growth in Capacity
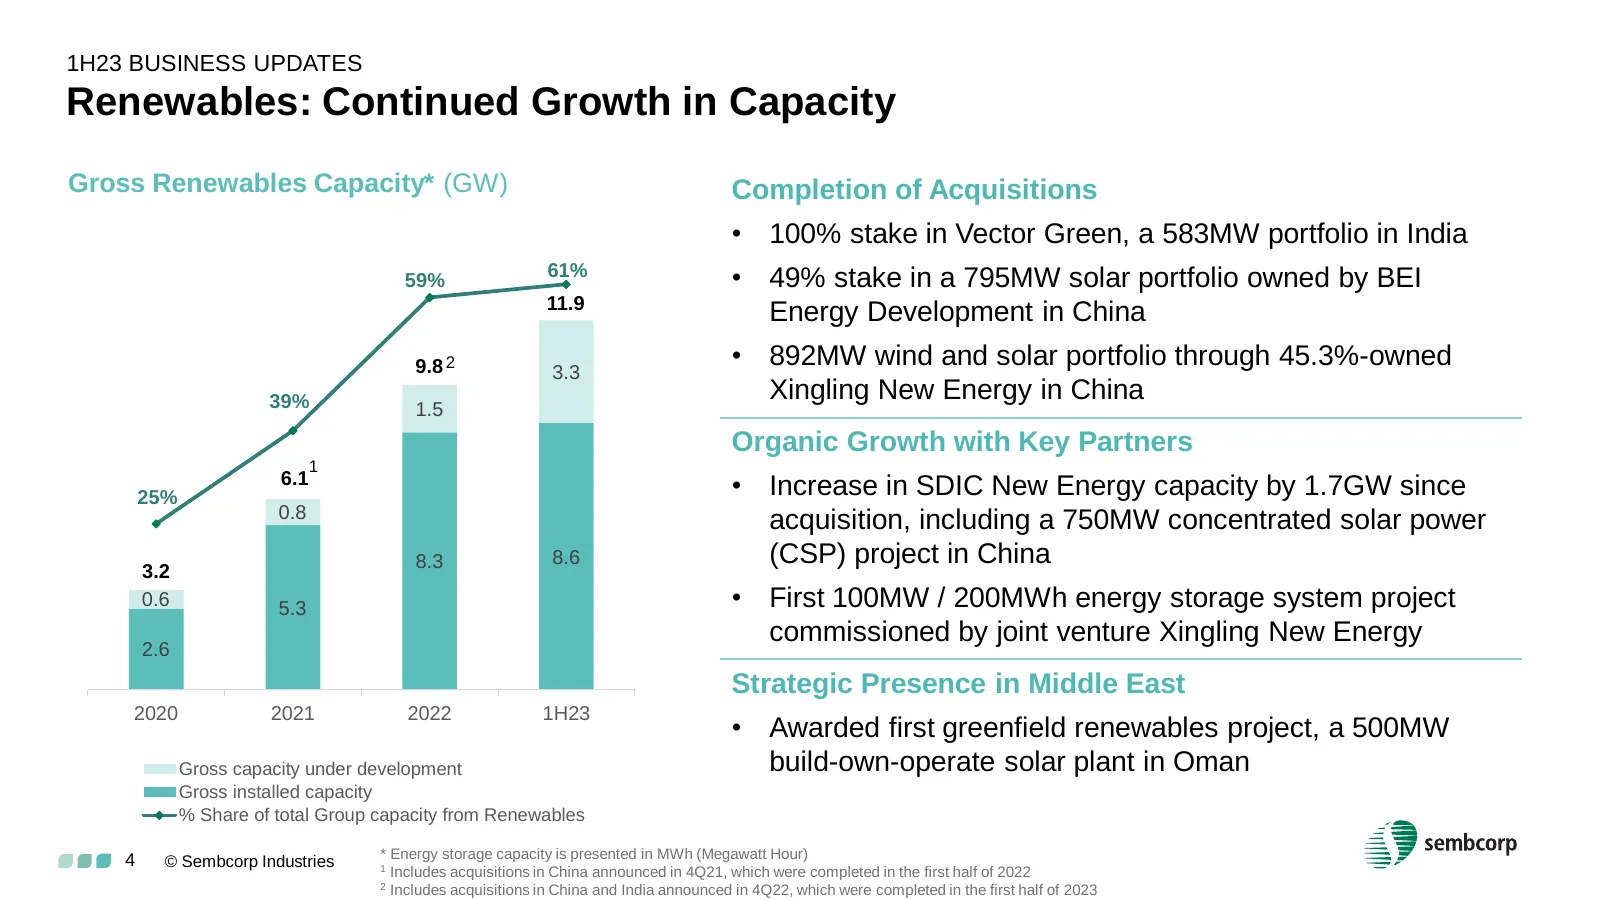
1H23 BUSINESS UPDATES Renewables: Continued Growth in Capacity Gross Renewables Capacity* (GW) Completion of Acquisitions 70% • 100% stake in Vector Green, a 583MW portfolio in India 14 59% 61% 60% • 49% stake in a 795MW solar portfolio owned by BEI 11.9 12 Energy Development in China 9.8 2 3.3 50%
Slide 5: Renewables: Expanding Capabilities in China
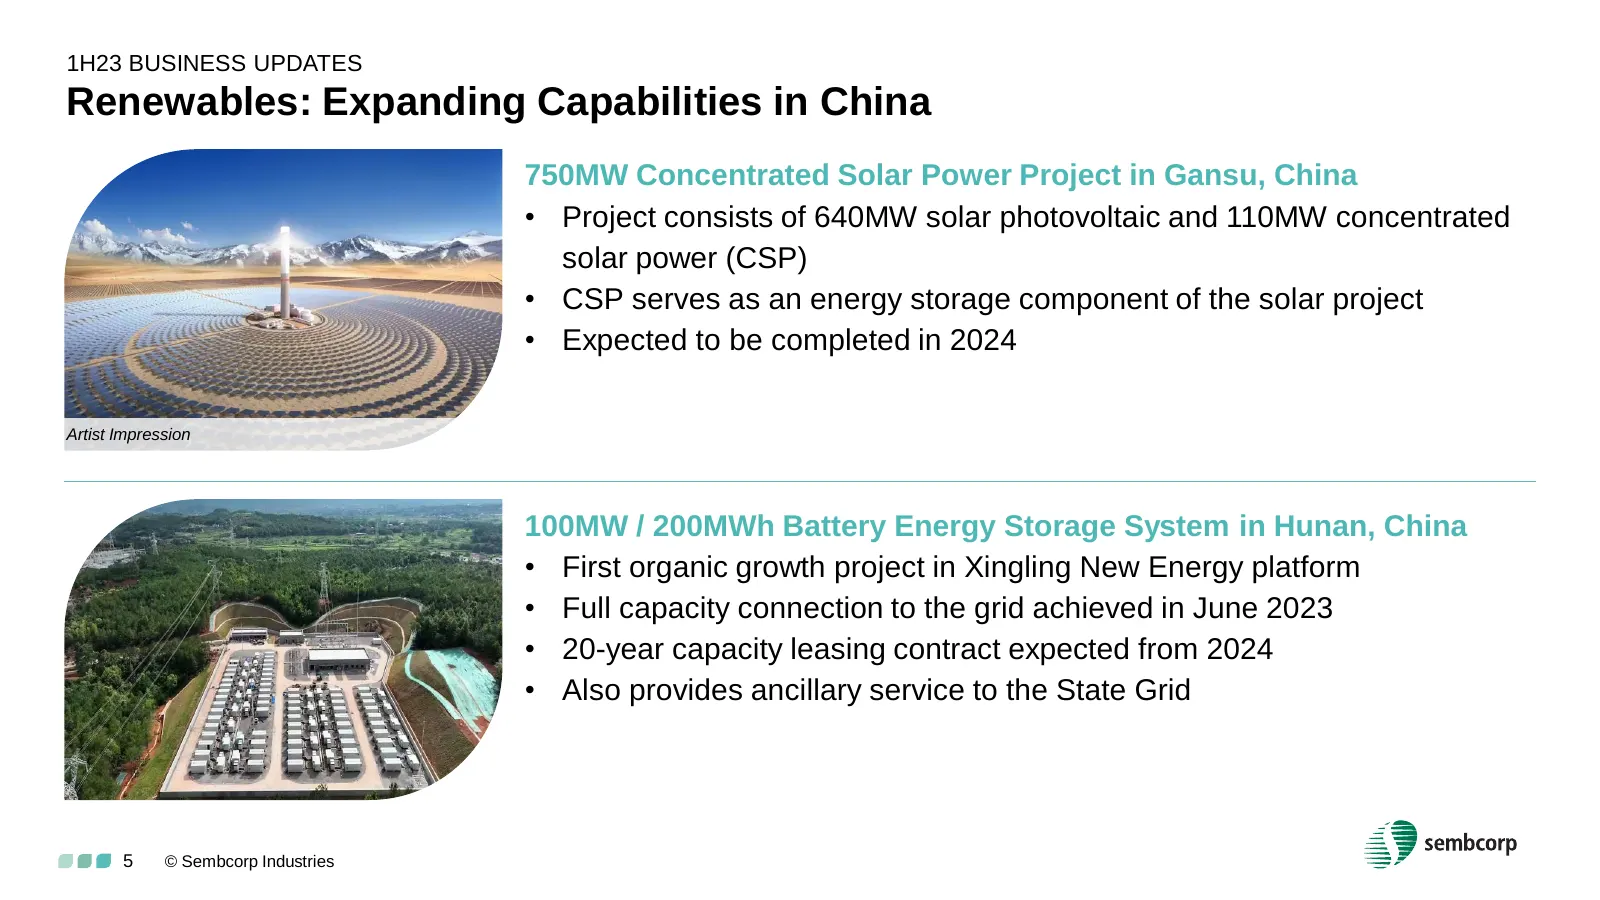
1H23 BUSINESS UPDATES Renewables: Expanding Capabilities in China 750MW Concentrated Solar Power Project in Gansu, China • Project consists of 640MW solar photovoltaic and 110MW concentrated solar power (CSP) • CSP serves as an energy storage component of the solar project • Expected to be completed
Slide 6: Integrated Urban Solutions: Increased Land Sales, Steady Orderbook
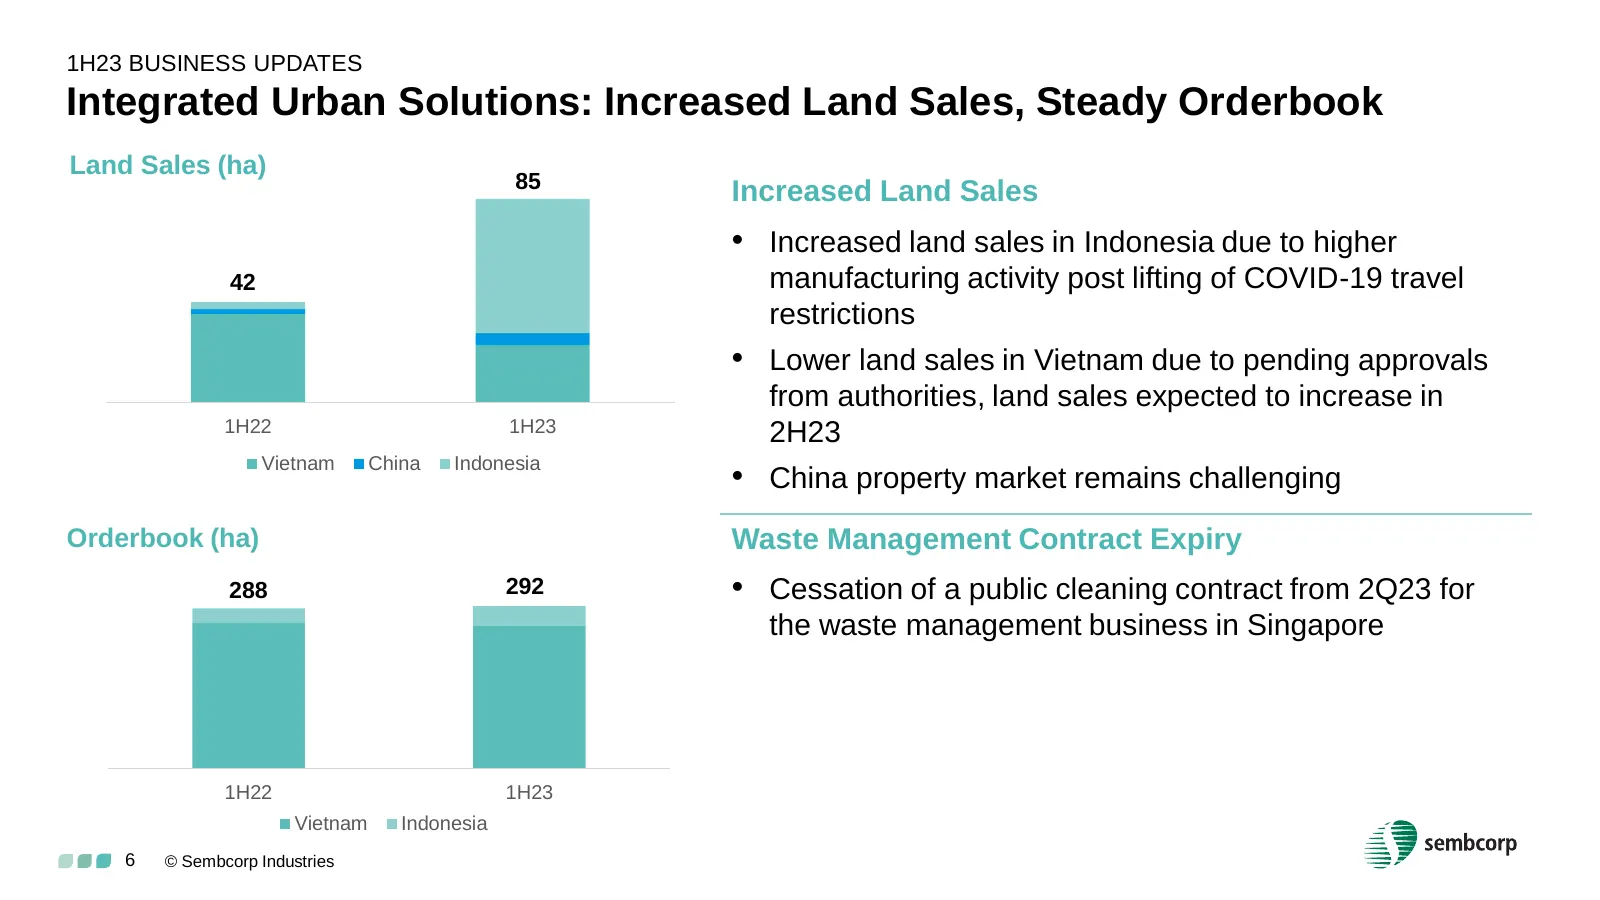
1H23 BUSINESS UPDATES Integrated Urban Solutions: Increased Land Sales, Steady Orderbook Land Sales (ha) 85 Increased Land Sales • Increased land sales in Indonesia due to higher 42 manufacturing activity post lifting of COVID-19 travel restrictions • Lower land sales in Vietnam due to pending appro
Slide 7: Conventional Energy: Improvement in Earnings Visibility
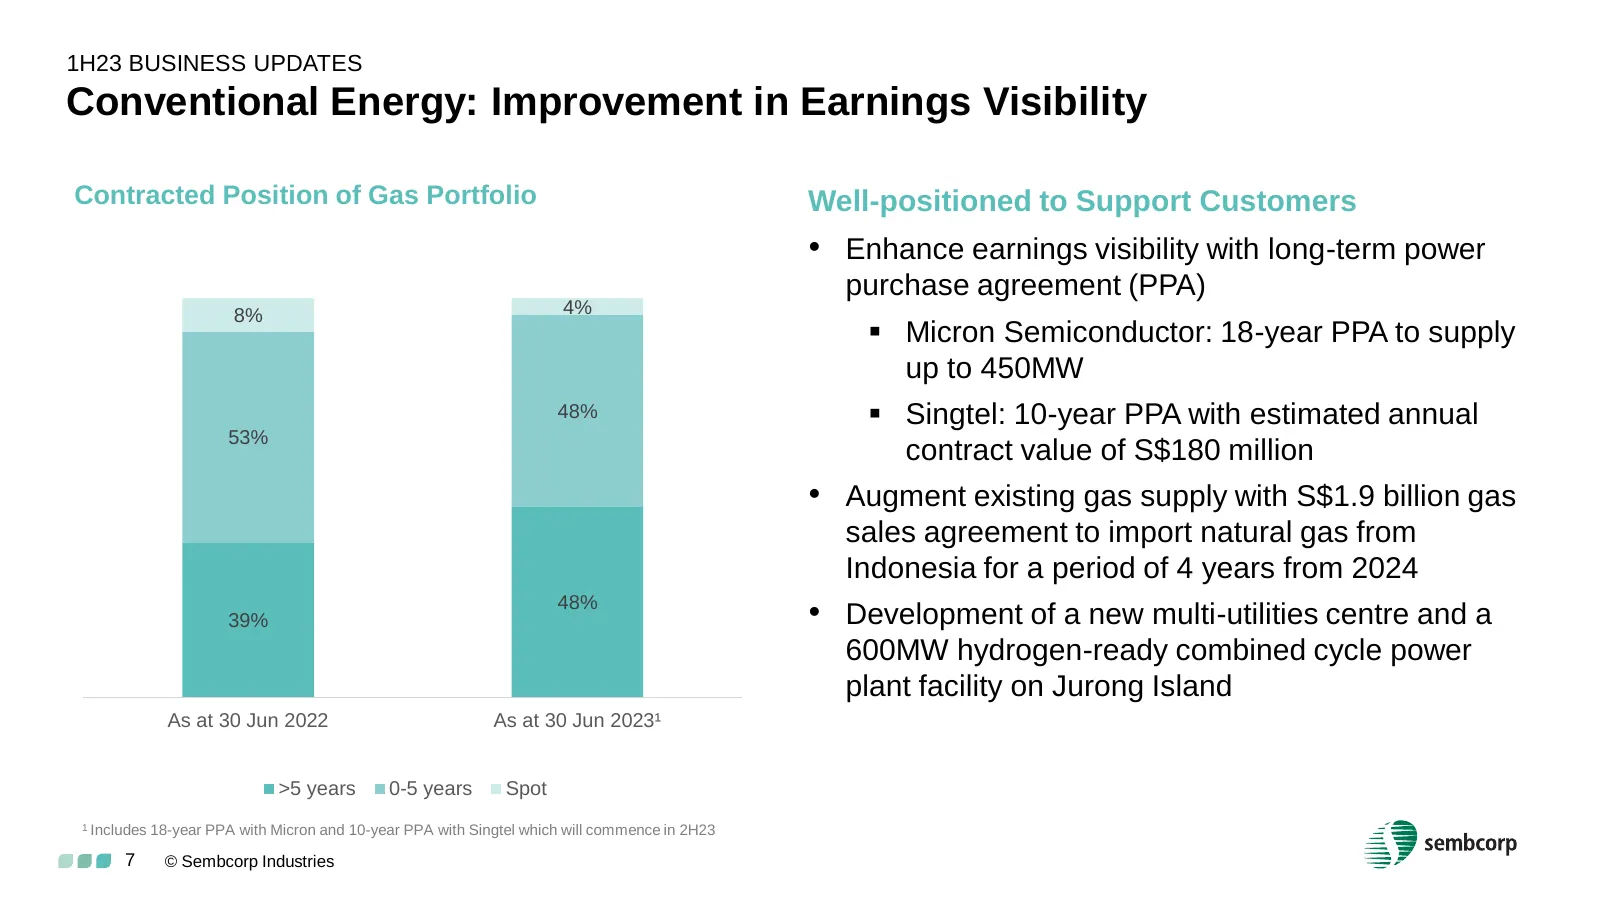
1H23 BUSINESS UPDATES Conventional Energy: Improvement in Earnings Visibility Contracted Position of Gas Portfolio Well-positioned to Support Customers • Enhance earnings visibility with long-term power purchase agreement (PPA) 8% 4% ▪ Micron Semiconductor: 18-year PPA to supply up to 450MW 48% ▪ Si
Slide 8: Transforming our Portfolio from Brown to Green
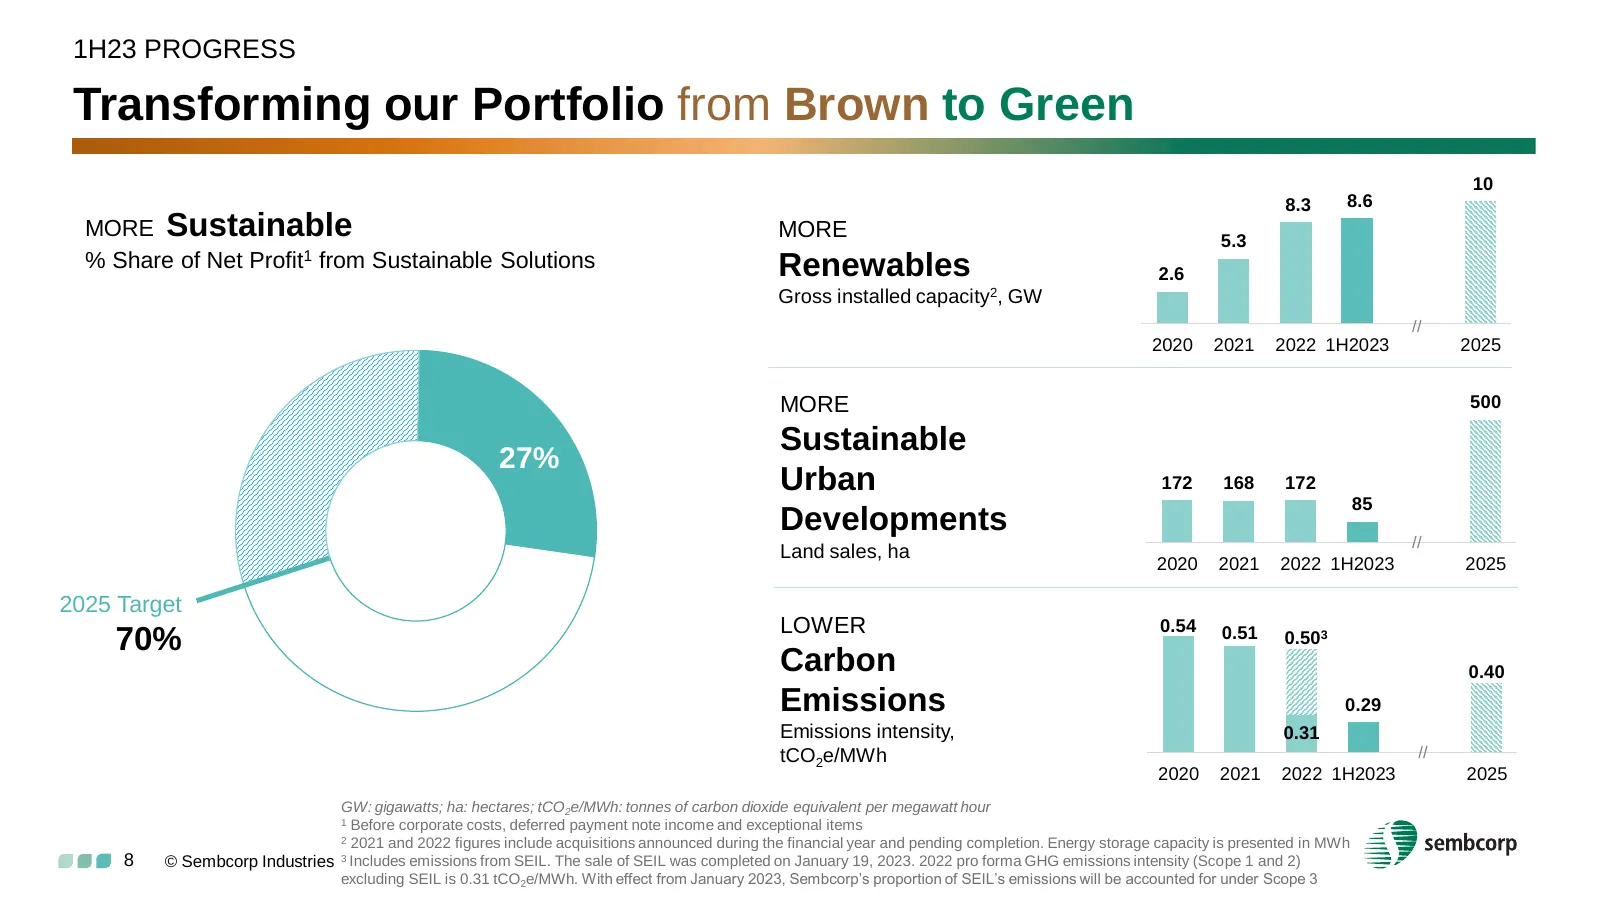
1H23 PROGRESS Transforming our Portfolio from Brown to Green 10 8.3 8.6 MORE Sustainable MORE 5.3 % Share of Net Profit1 from Sustainable Solutions Renewables 2.6 Gross installed capacity2, GW // 2020 2021 2022 1H2023 2025 MORE 500 Sustainable 27% Urban 172 168 172 85 Developments // Land sales, ha
Slide 9: Financial Review
Financial Review Eugene Cheng Group CFO © Sembcorp Industries
Slide 10: Key Financials
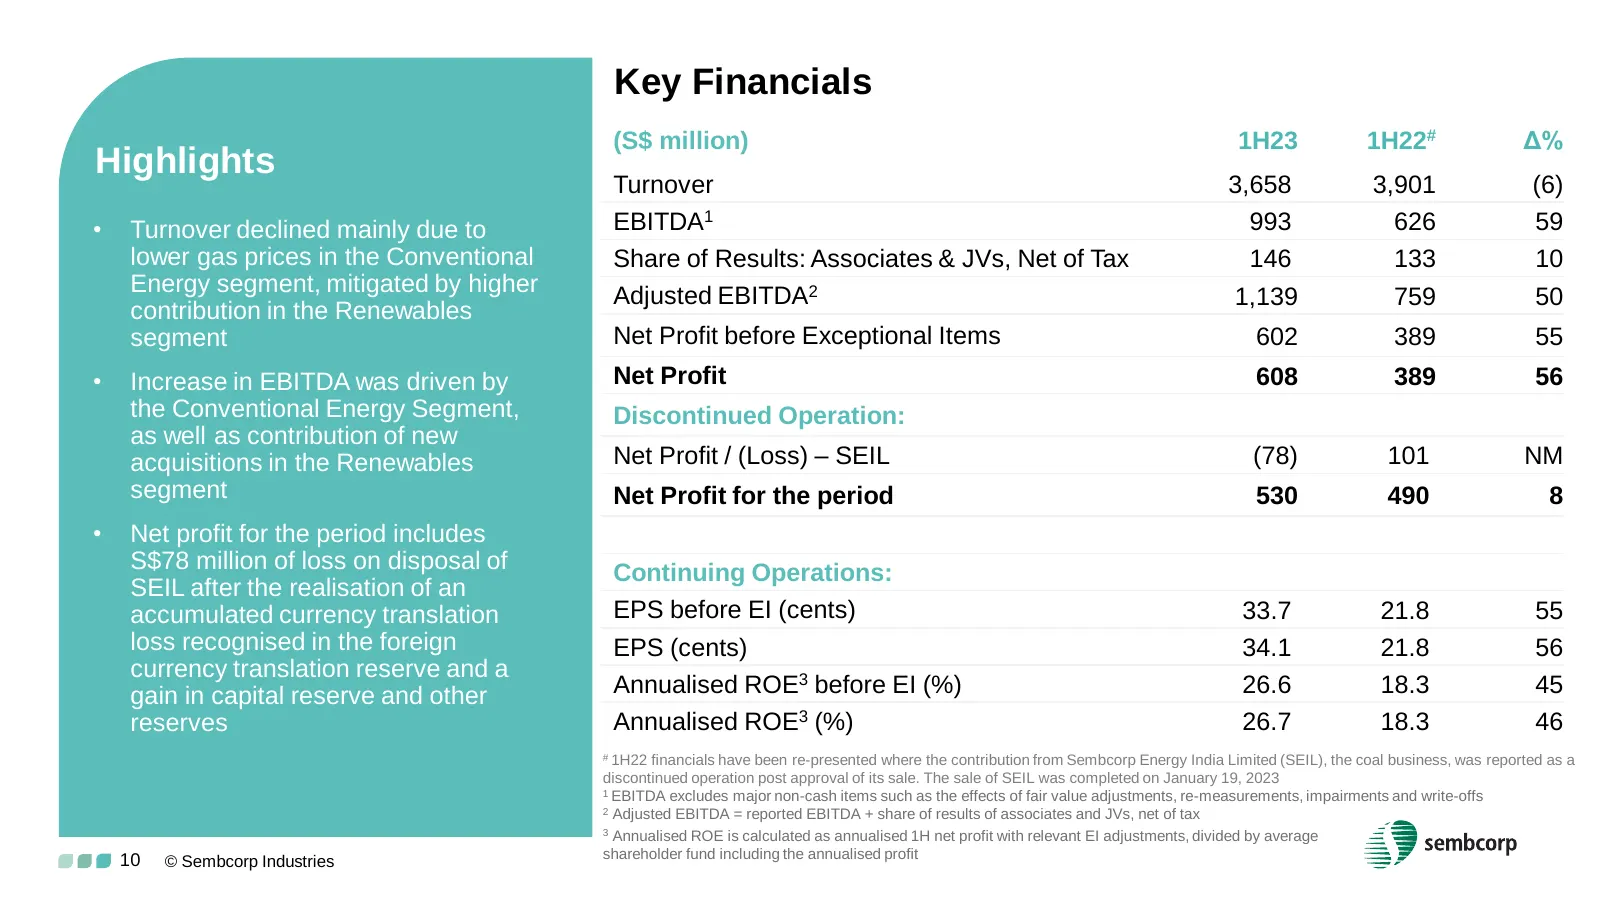
Key Financials (S$ million) 1H23 1H22# Δ% Highlights Turnover 3,658 3,901 (6) • Turnover declined mainly due to EBITDA1 993 626 59 lower gas prices in the Conventional Share of Results: Associates & JVs, Net of Tax 146 133 10 Energy segment, mitigated by higher Adjusted EBITDA2 1,139 759 50 contribu
Slide 11: Group Turnover Highlights
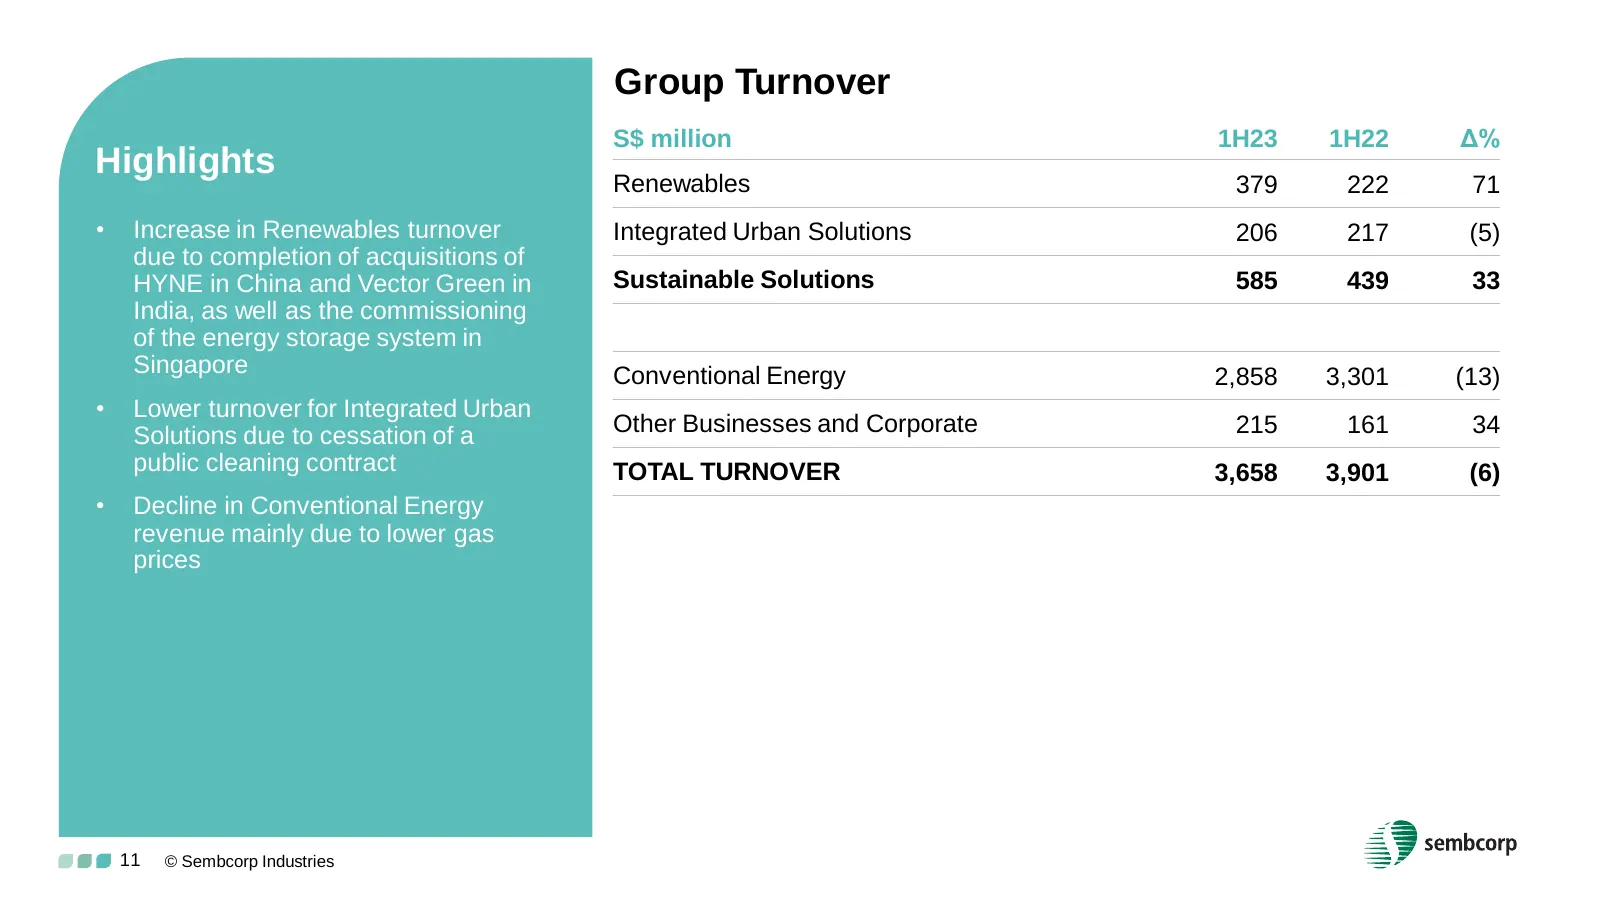
Group Turnover S$ million 1H23 1H22 Δ% Highlights Renewables 379 222 71 • Increase in Renewables turnover Integrated Urban Solutions 206 217 (5) due to completion of acquisitions of HYNE in China and Vector Green in Sustainable Solutions 585 439 33 India, as well as the commissioning of the energy s
Slide 12: Group Net Profit Highlights
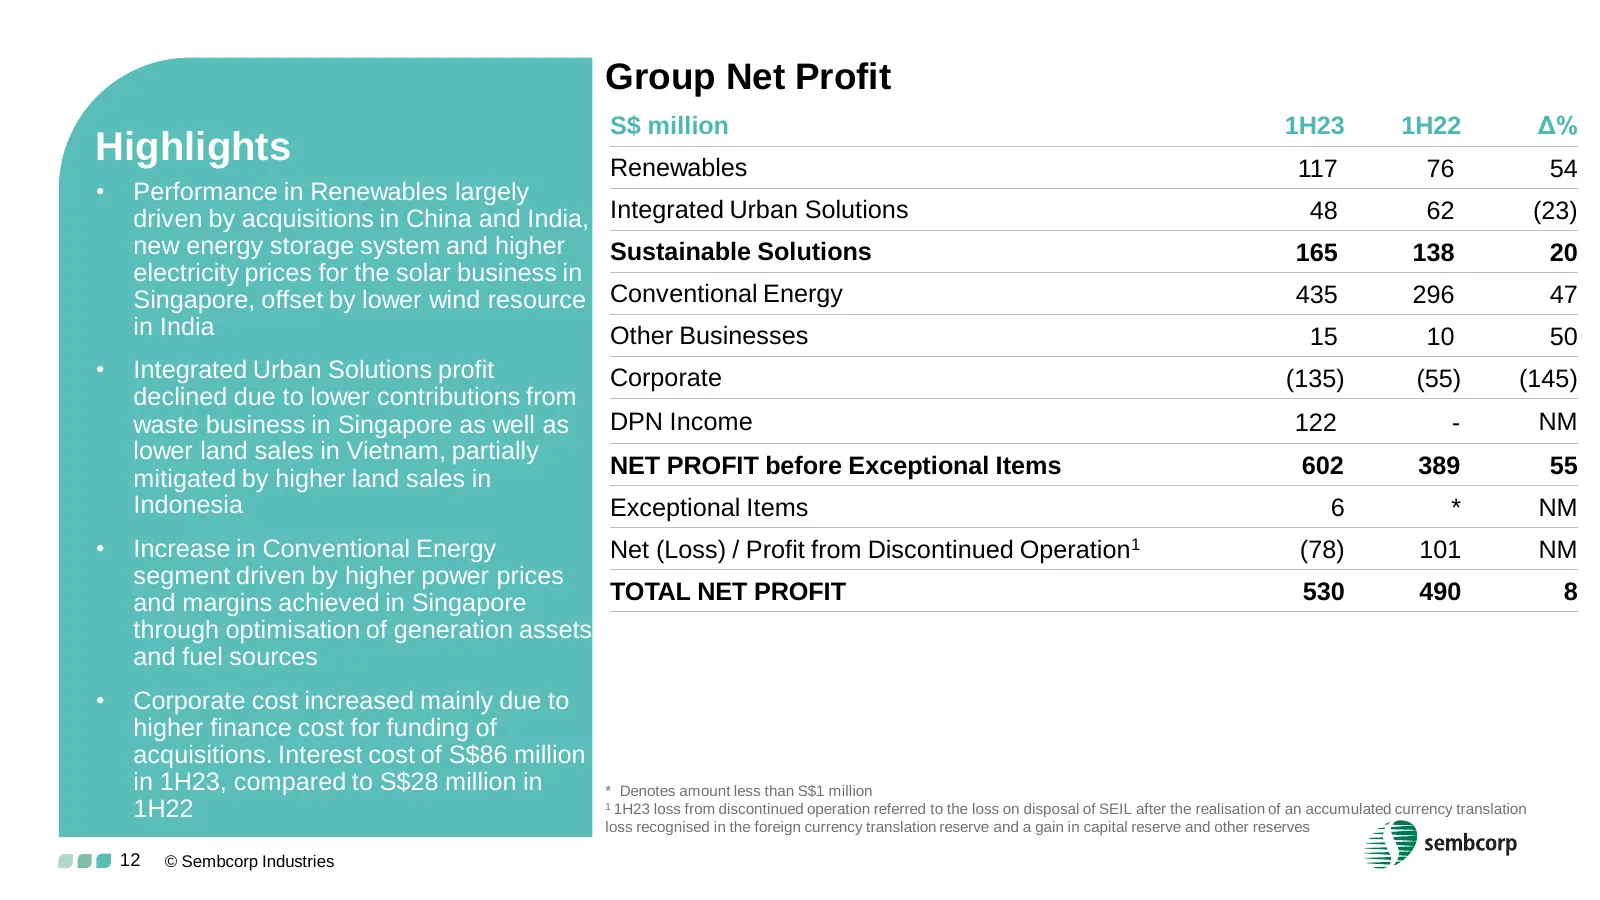
Group Net Profit S$ million 1H23 1H22 Δ% Highlights Renewables 117 76 54 • Performance in Renewables largely driven by acquisitions in China and India, Integrated Urban Solutions 48 62 (23) new energy storage system and higher Sustainable Solutions 165 138 20 electricity prices for the solar busines
Slide 13: Net Profit 1H23 vs 1H22 bridge
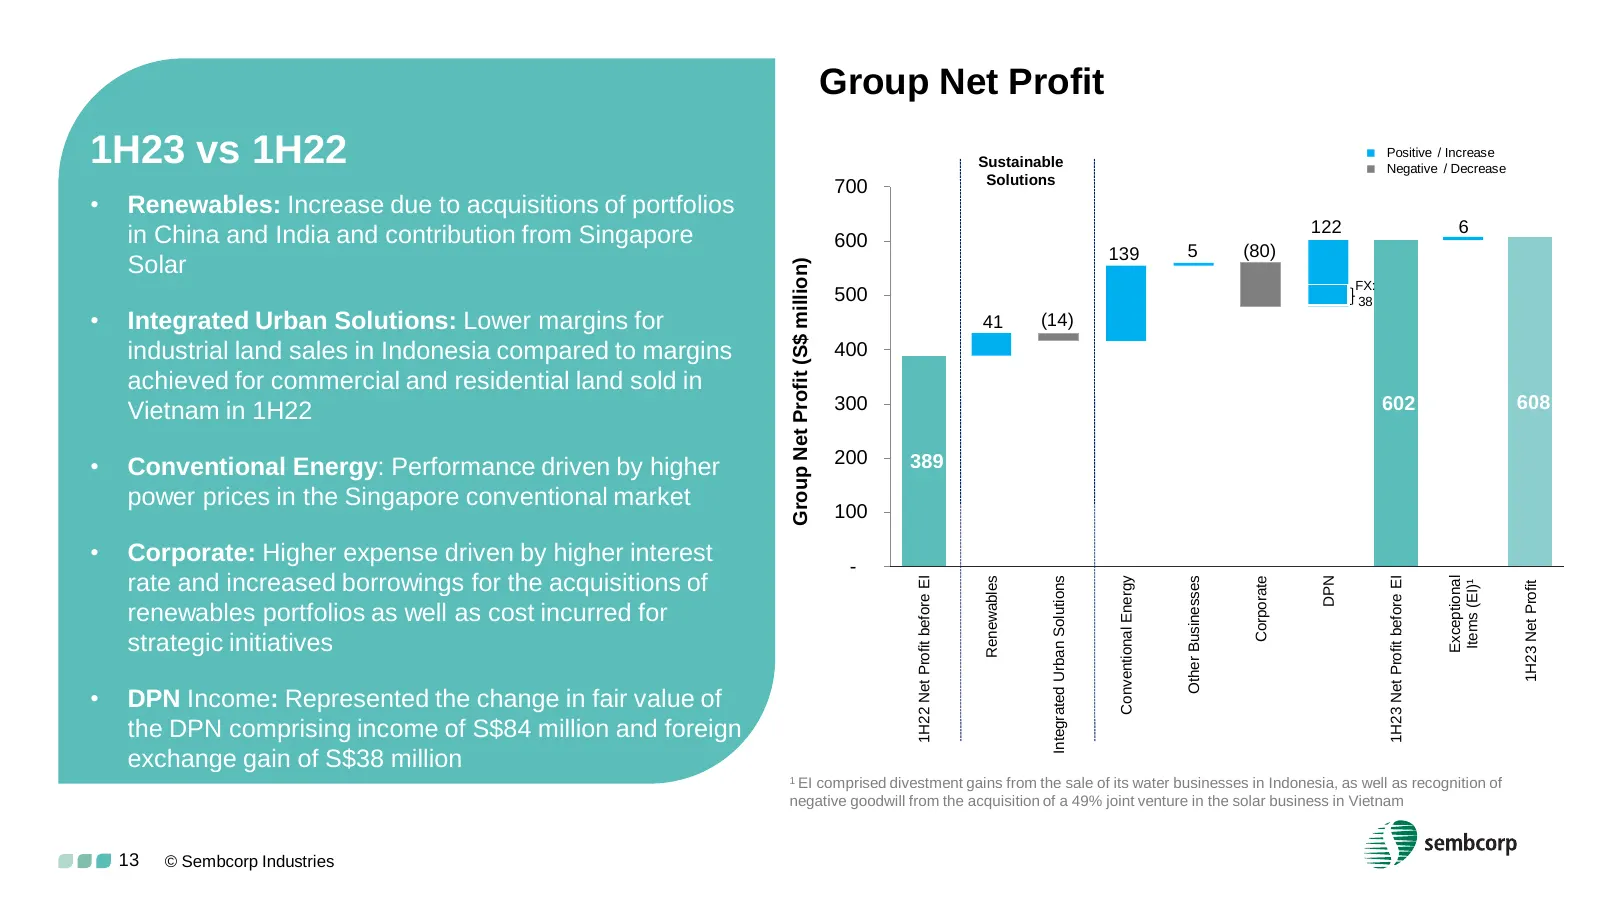
Group Net Profit 1H23 vs 1H22 Sustainable Positive / Increase Negative / Decrease Solutions 700 • Renewables: Increase due to acquisitions of portfolios 122 6 in China and India and contribution from Singapore 600 139 5 (80) Solar Group Net Profit (S$ million) FX: 500 38 • Integrated Urban Solut
Slide 14: Conventional Energy: Increased Contracted Position of Gas Portfolio
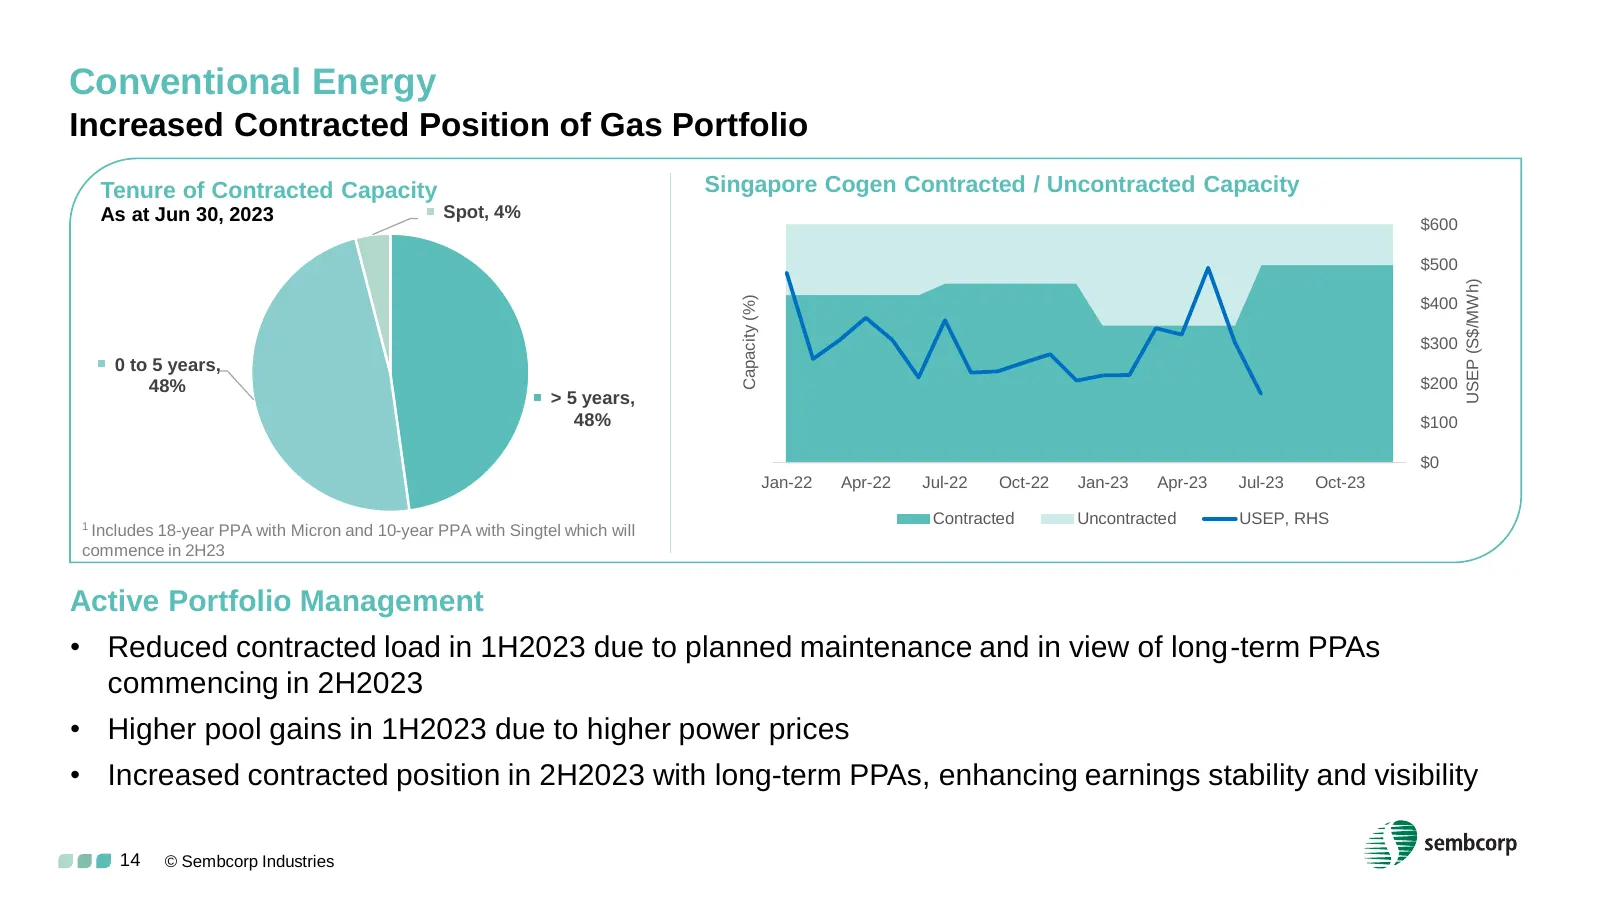
Conventional Energy Increased Contracted Position of Gas Portfolio Tenure of Contracted Capacity Singapore Cogen Contracted / Uncontracted Capacity As at Jun 30, 2023 Spot, 4% 100% $600 80% $500 USEP (S$/MWh) Capacity (%) $400 60% $300 0 to 5 years, 40% 48% $200 > 5 years, 48% 20% $100 0% $0 Jan-22
Slide 15: Capital Expenditure and Equity Investment
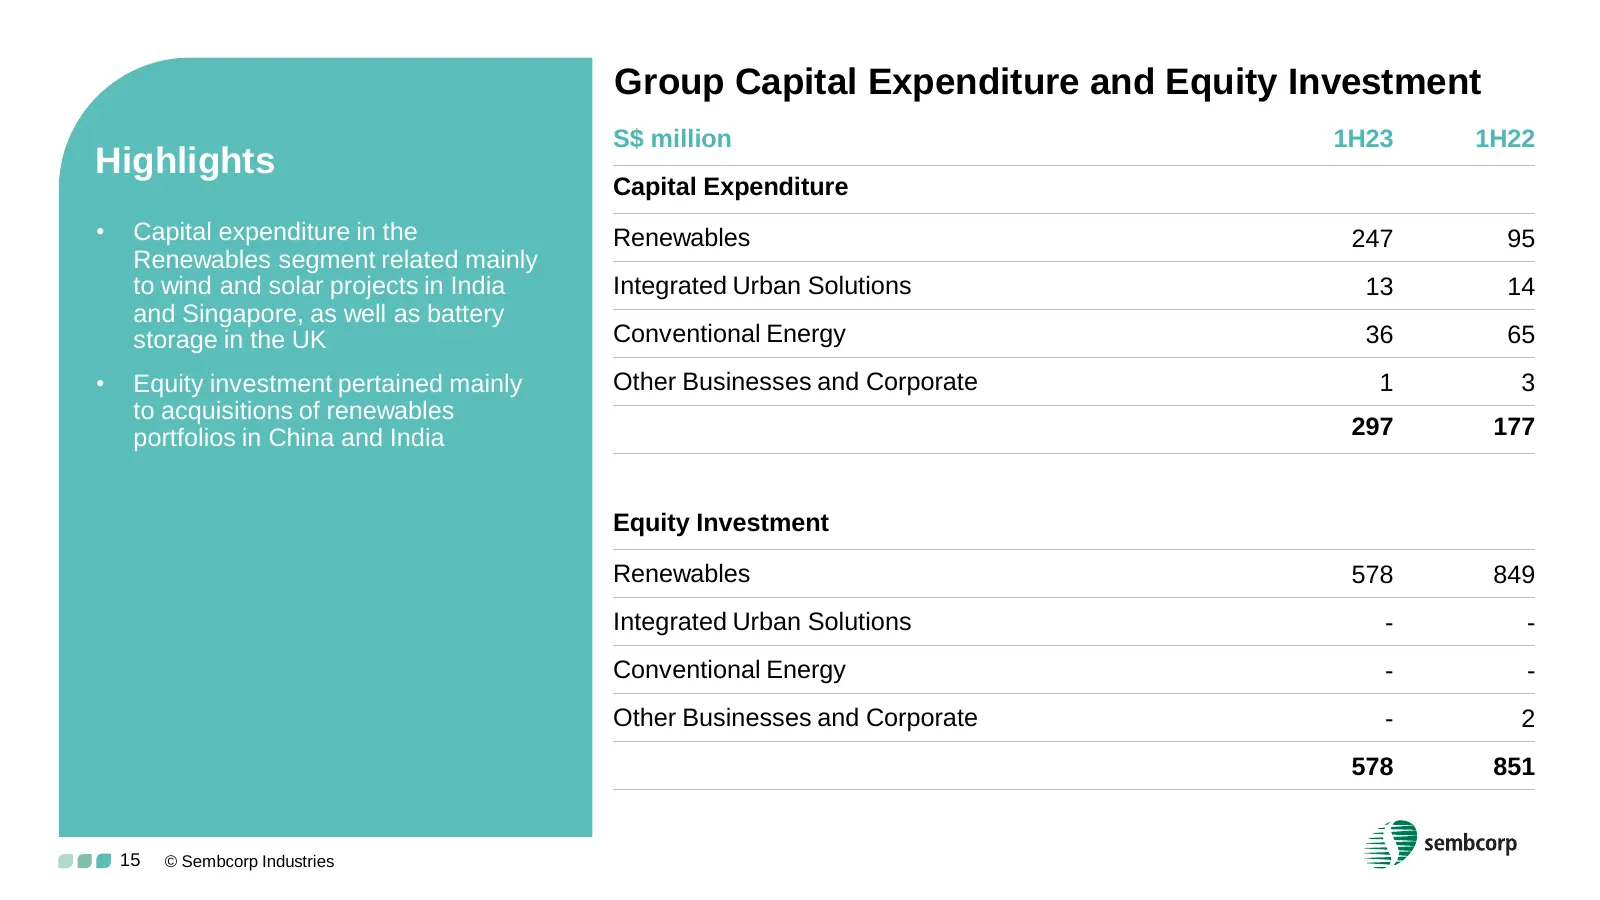
Group Capital Expenditure and Equity Investment S$ million 1H23 1H22 Highlights Capital Expenditure • Capital expenditure in the Renewables 247 95 Renewables segment related mainly to wind and solar projects in India Integrated Urban Solutions 13 14 and Singapore, as well as battery storage in the U
Slide 16: Free Cash Flow
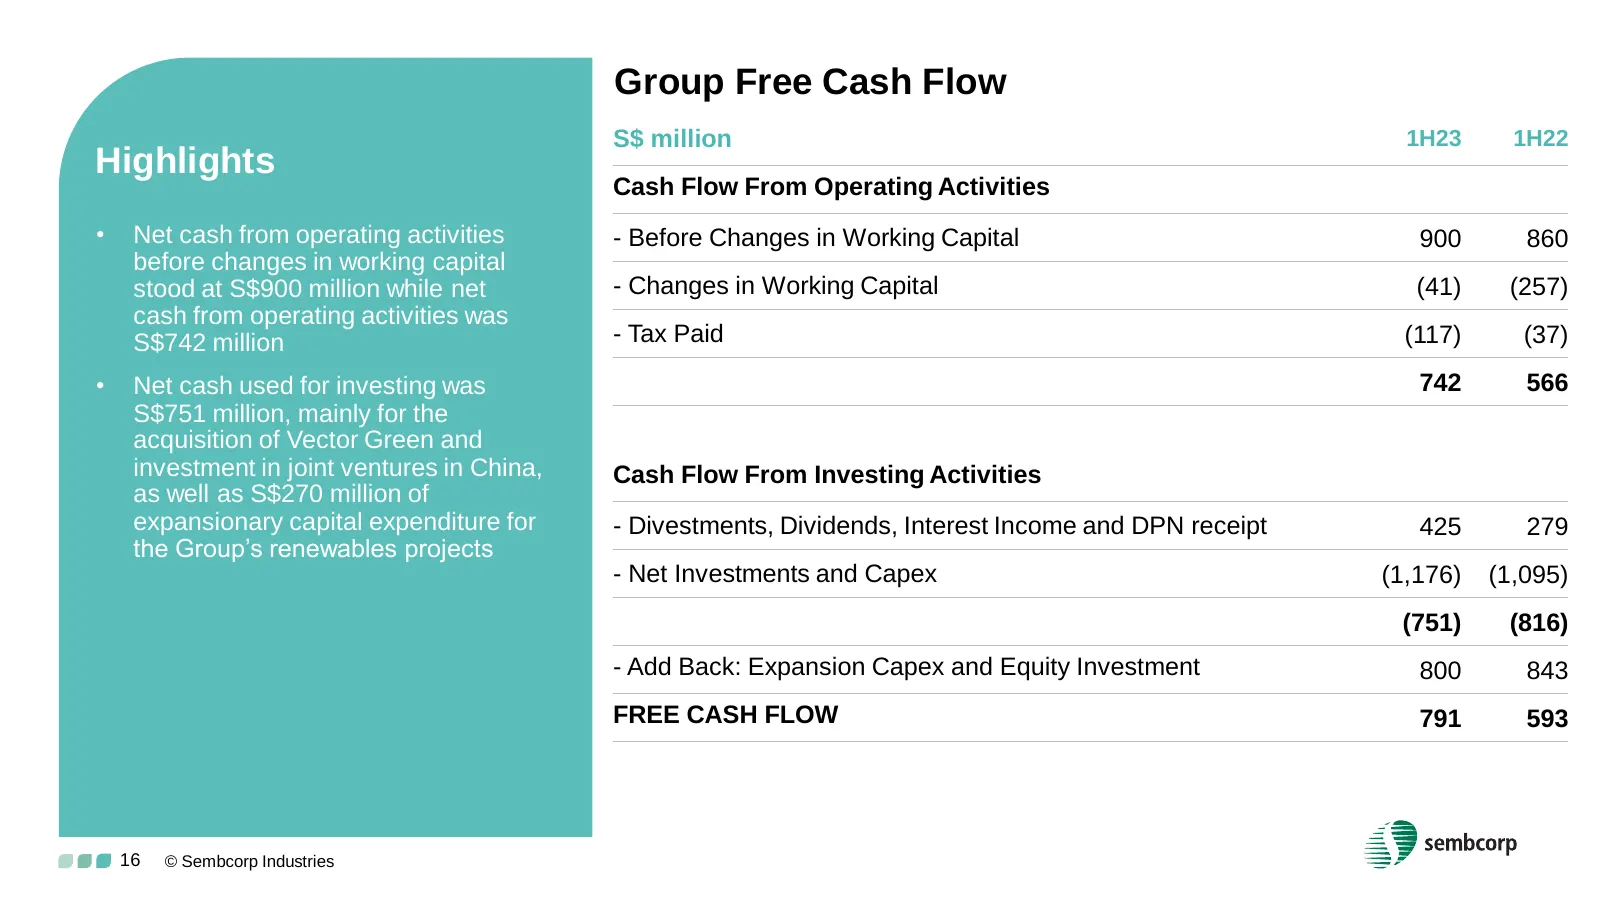
Group Free Cash Flow S$ million 1H23 1H22 Highlights Cash Flow From Operating Activities • Net cash from operating activities - Before Changes in Working Capital 900 860 before changes in working capital stood at S$900 million while net - Changes in Working Capital (41) (257) cash from operating act
Slide 17: Borrowings
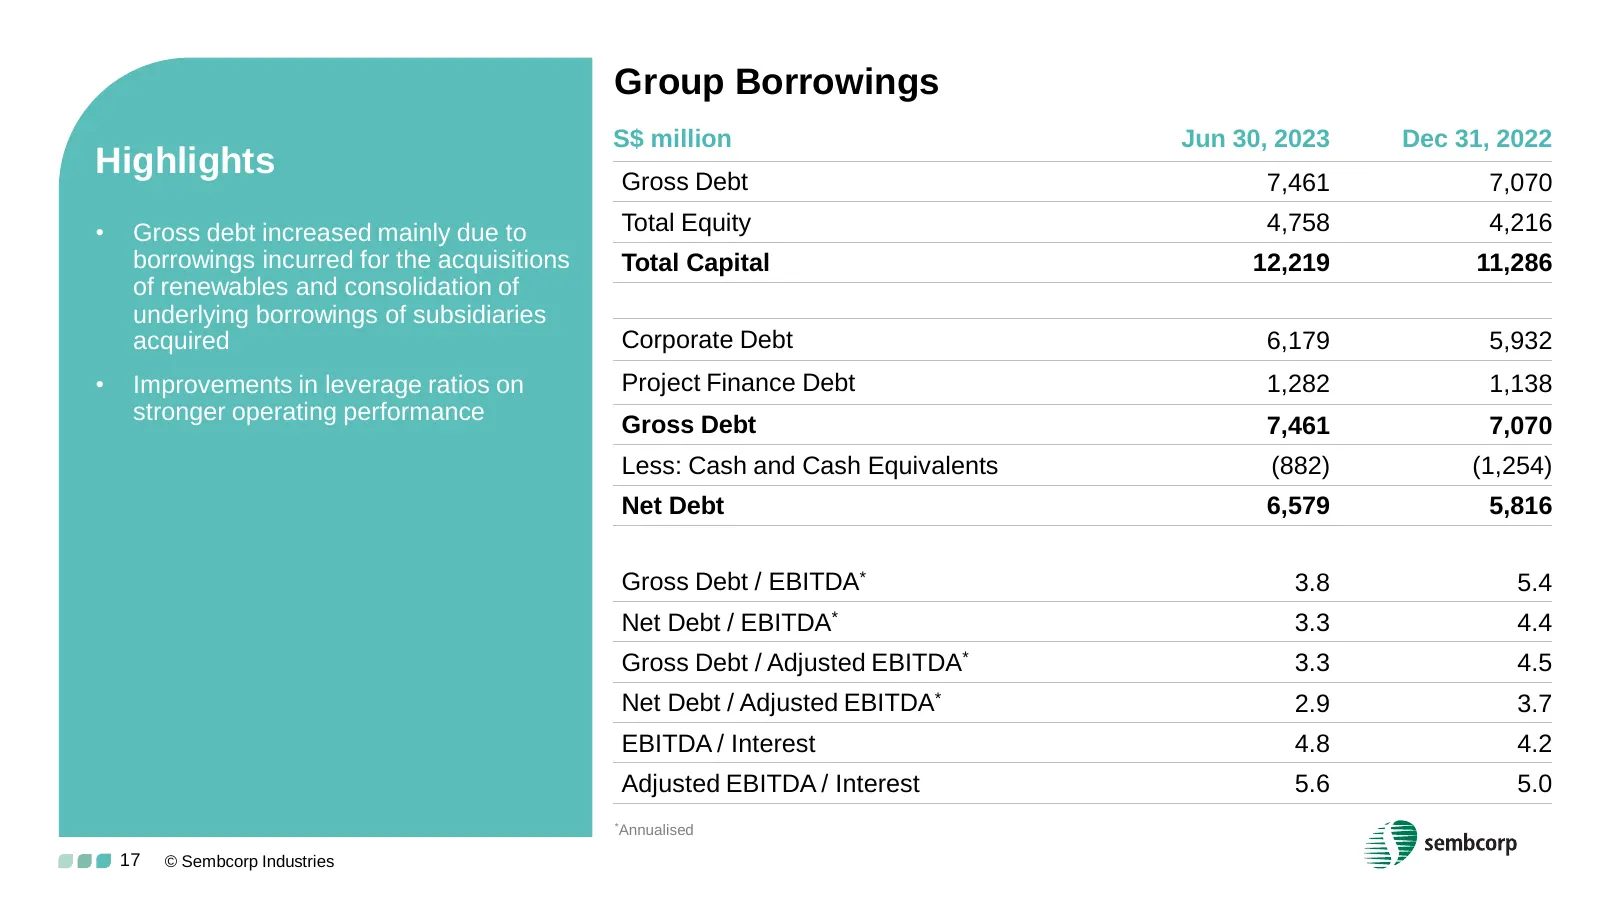
Group Borrowings S$ million Jun 30, 2023 Dec 31, 2022 Highlights Gross Debt 7,461 7,070 • Gross debt increased mainly due to Total Equity 4,758 4,216 borrowings incurred for the acquisitions Total Capital 12,219 11,286 of renewables and consolidation of underlying borrowings of subsidiaries acquired
Slide 18: Debt Profile
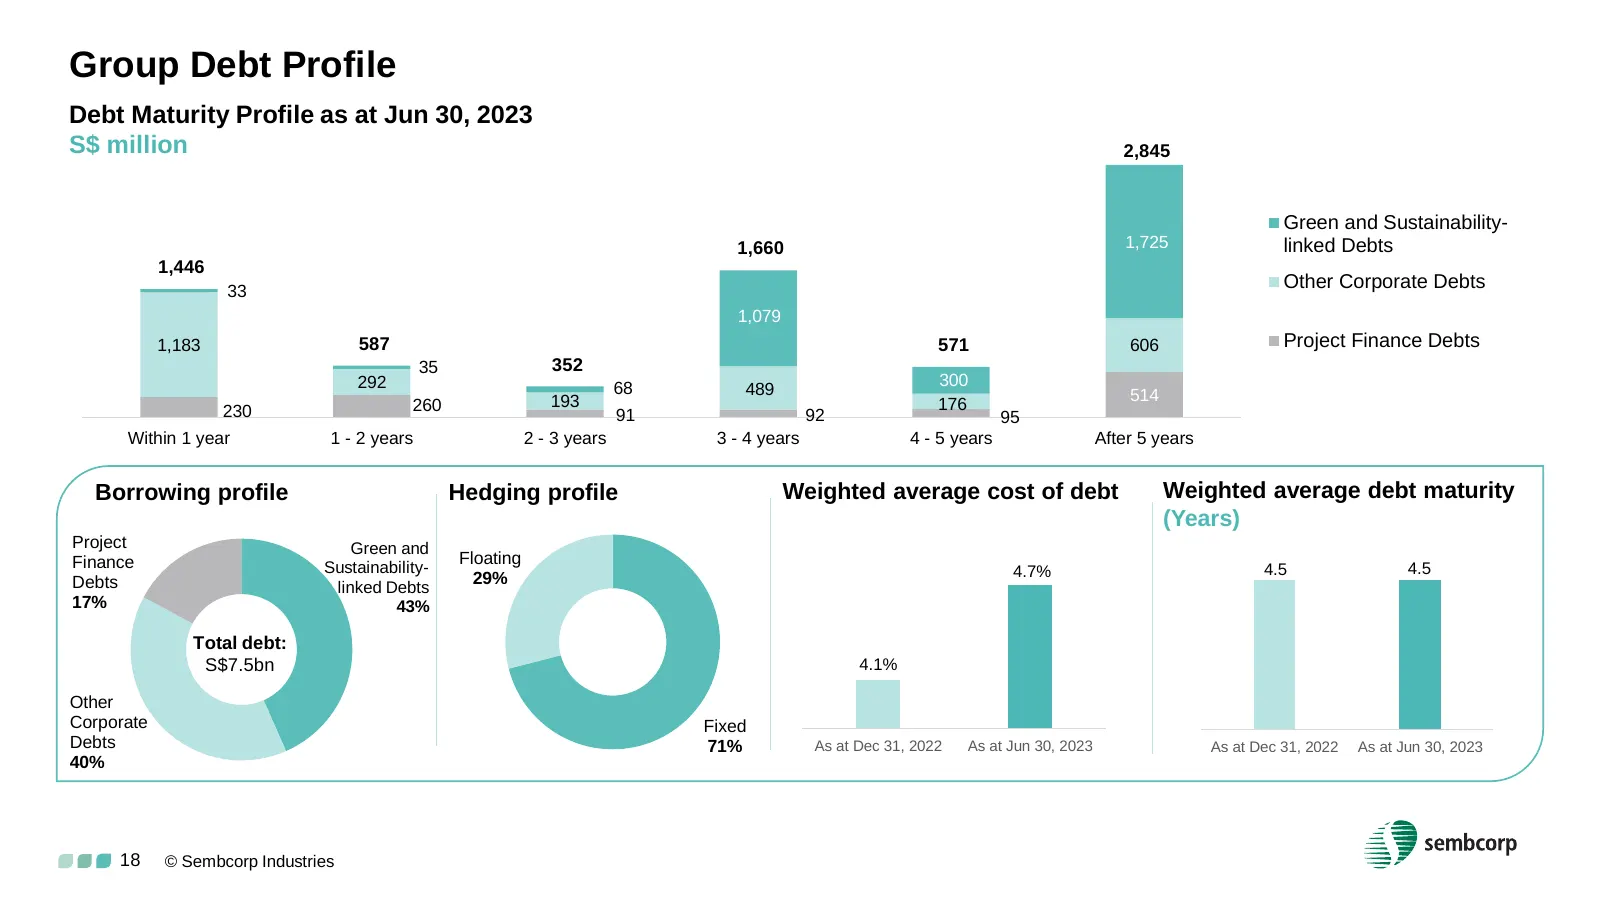
Group Debt Profile Debt Maturity Profile as at Jun 30, 2023 S$ million 2,845 Green and Sustainability- 1,660 1,725 linked Debts 1,446 33 Other Corporate Debts 1,079 1,183 587 571 606 Project Finance Debts 35 352 292 68 489 300 193 514 230 260 176 91 92 95 Within 1 year 1 - 2 years 2 - 3 years 3 - 4
Slide 19: Liquidity
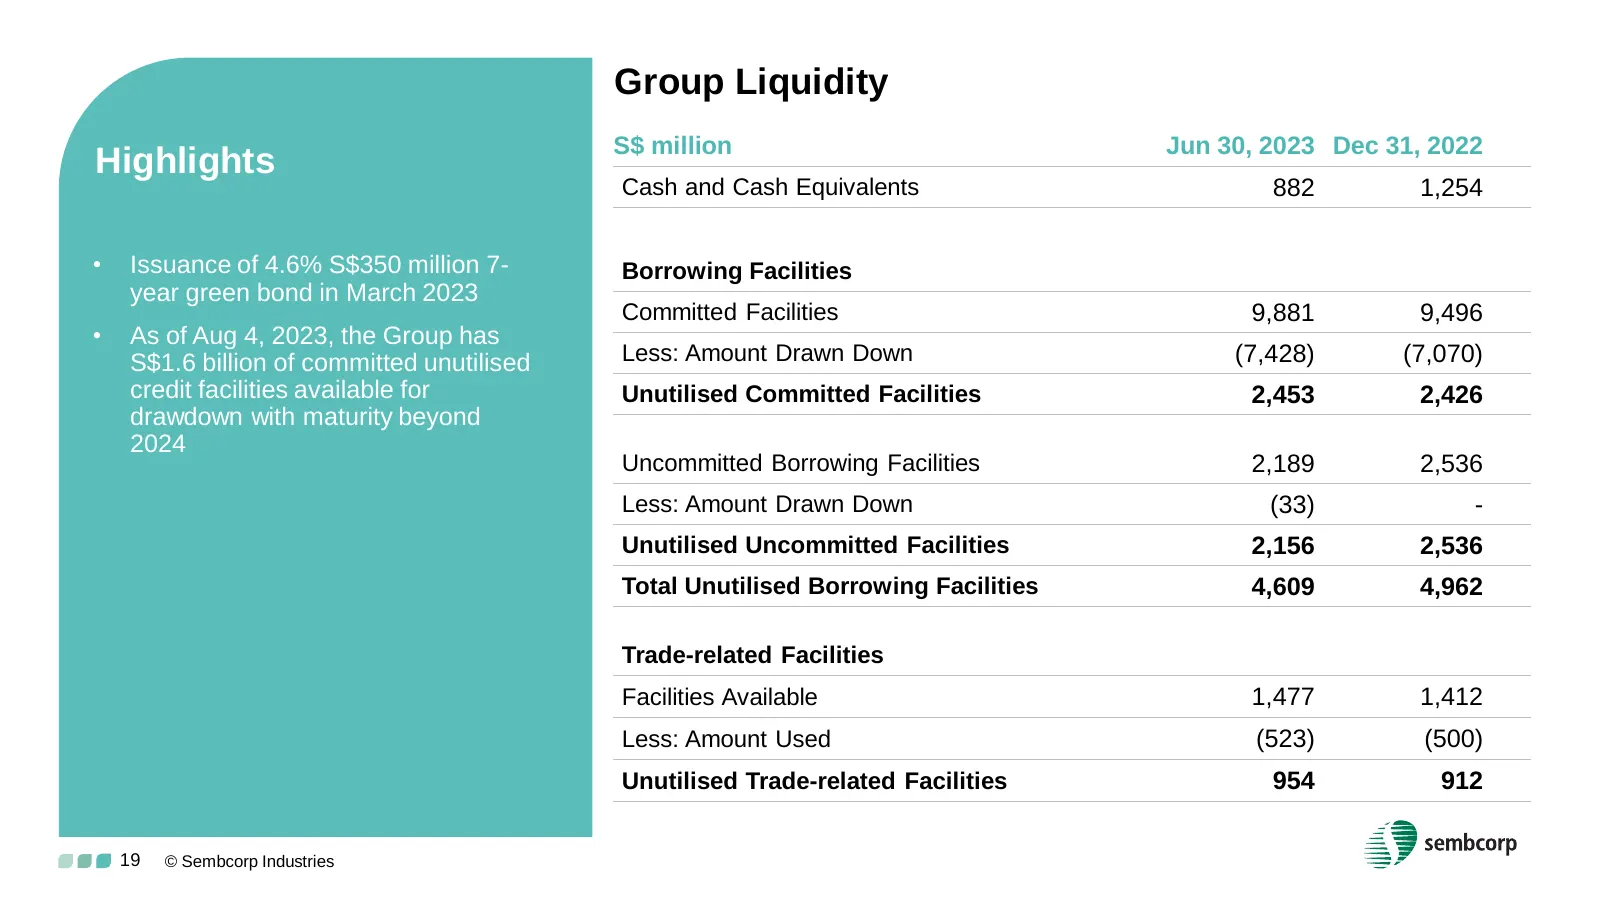
Group Liquidity S$ million Jun 30, 2023 Dec 31, 2022 Highlights Cash and Cash Equivalents 882 1,254 • Issuance of 4.6% S$350 million 7- Borrowing Facilities year green bond in March 2023 Committed Facilities 9,881 9,496 • As of Aug 4, 2023, the Group has S$1.6 billion of committed unutilised Less: A
Slide 20: Outlook
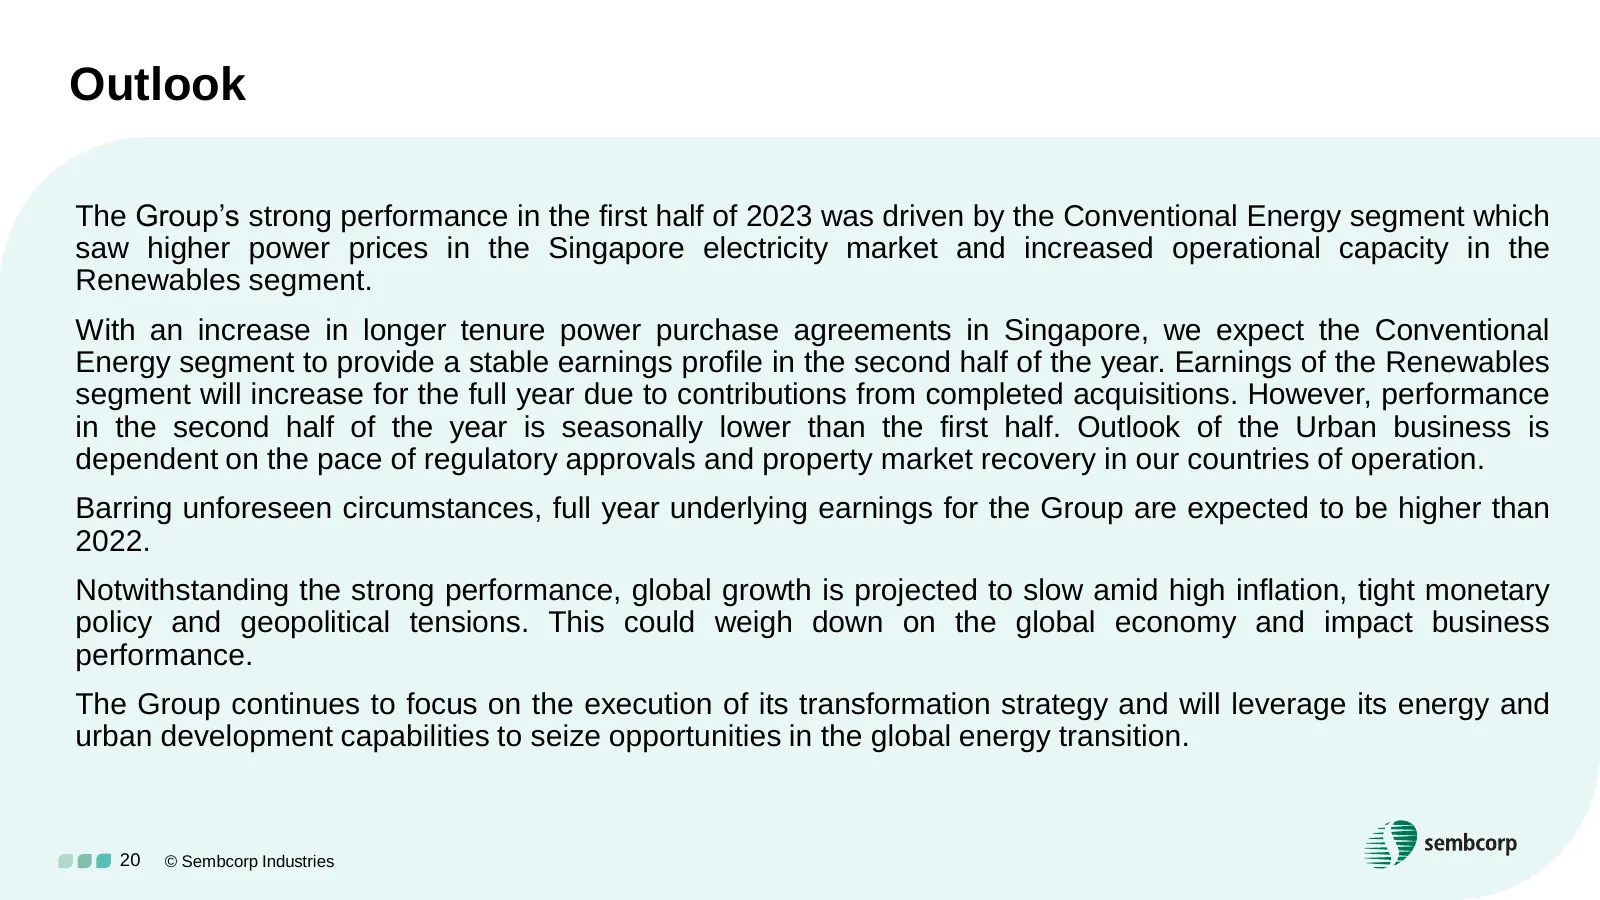
Outlook The Group’s strong performance in the first half of 2023 was driven by the Conventional Energy segment which saw higher power prices in the Singapore electricity market and increased operational capacity in the Renewables segment. With an increase in longer tenure power purchase agreements i
Slide 21: Developments to Note
Developments to Note • Planned maintenance for Phu My 3 BOT Power Plant (3 weeks) in the second half of 2023 • Phu My 3 BOT Power Plant will reach the end of its Term of Operation on 29 February 2024 21 © Sembcorp Industries
Slide 22: Save the Date! 2023 Investor Day
SAVE THE DATE! 2023 INVESTOR DAY NOVEMBER 6, 2023 (MONDAY) Details to come
Slide 23: Disclaimer
Disclaimer This presentation contains certain statements that are not statements of historical fact, i.e. forward-looking statements. These forward-looking statements are based on current expectations, estimates, projections and assumptions about future events. Although Sembcorp Industries believes
Slide 24: Appendix
Appendix © Sembcorp Industries
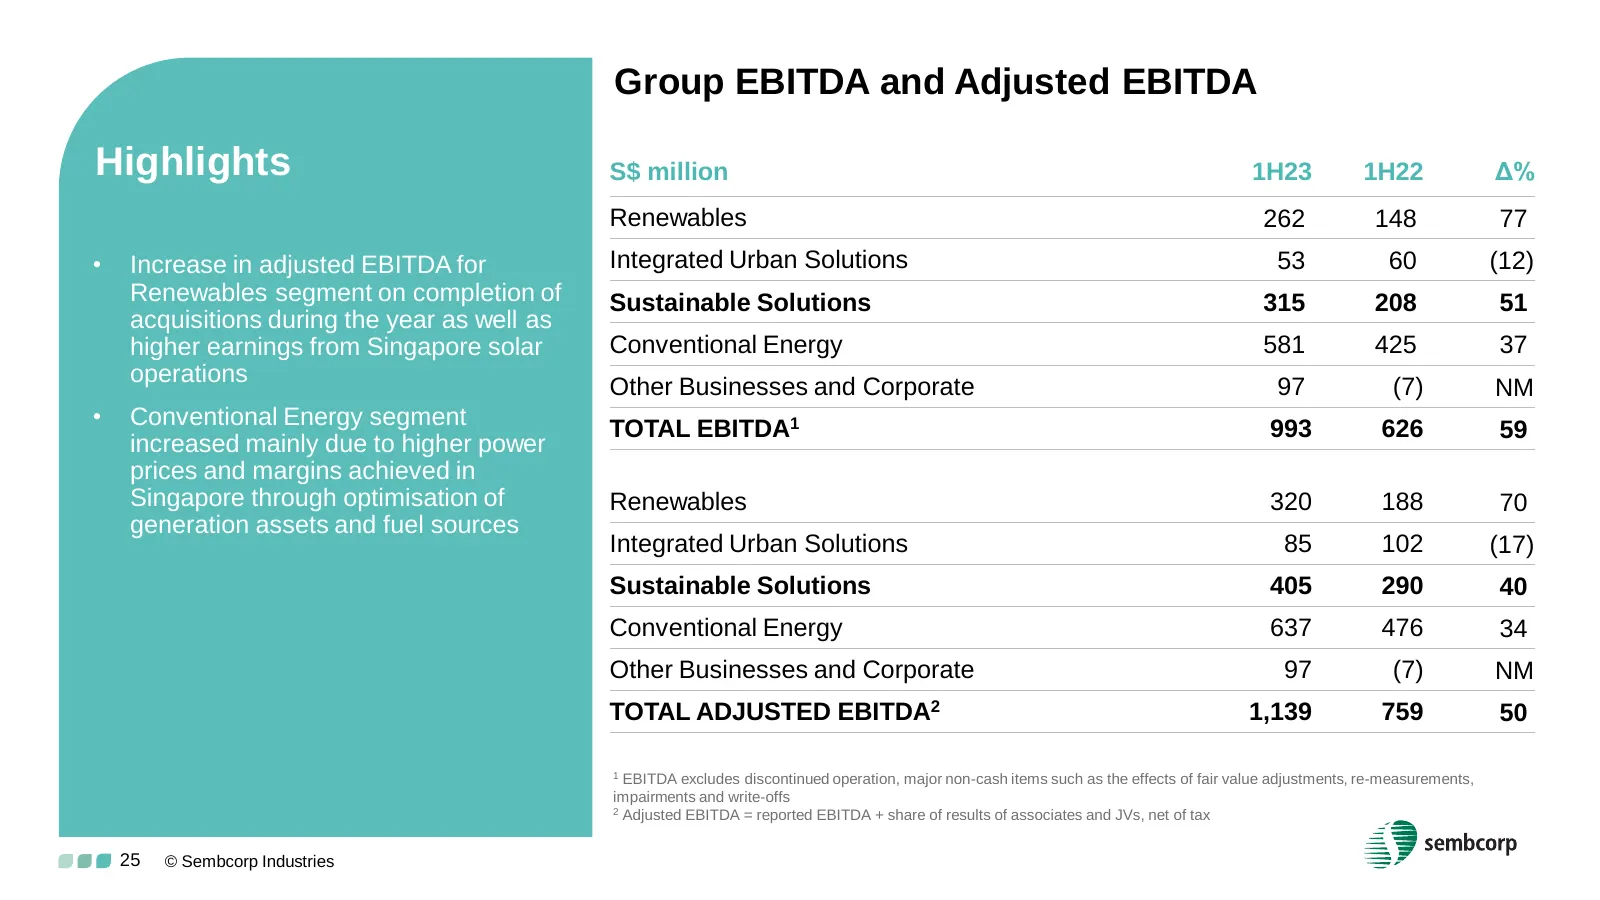
Slide 25: EBITDA and Adjusted EBITDA
Group EBITDA and Adjusted EBITDA Highlights S$ million 1H23 1H22 Δ% Renewables 262 148 77 • Increase in adjusted EBITDA for Integrated Urban Solutions 53 60 (12) Renewables segment on completion of Sustainable Solutions 315 208 51 acquisitions during the year as well as higher earnings from Singapor
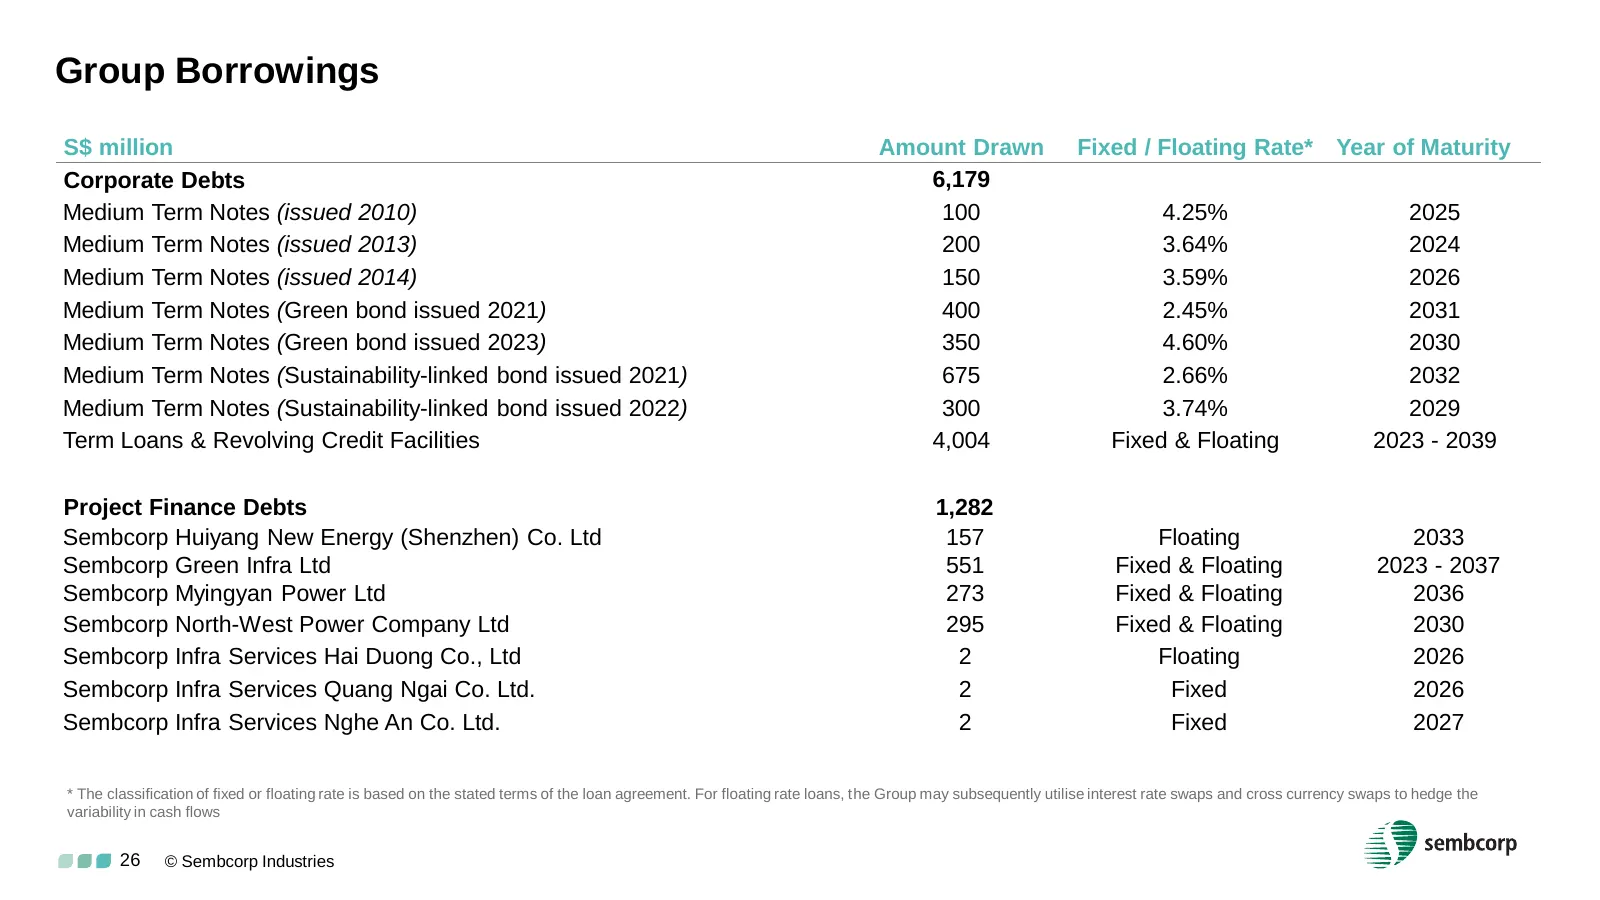
Slide 26: Borrowings
Group Borrowings S$ million Amount Drawn Fixed / Floating Rate* Year of Maturity Corporate Debts 6,179 Medium Term Notes (issued 2010) 100 4.25% 2025 Medium Term Notes (issued 2013) 200 3.64% 2024 Medium Term Notes (issued 2014) 150 3.59% 2026 Medium Term Notes (Green bond issued 2021) 400 2.45% 203
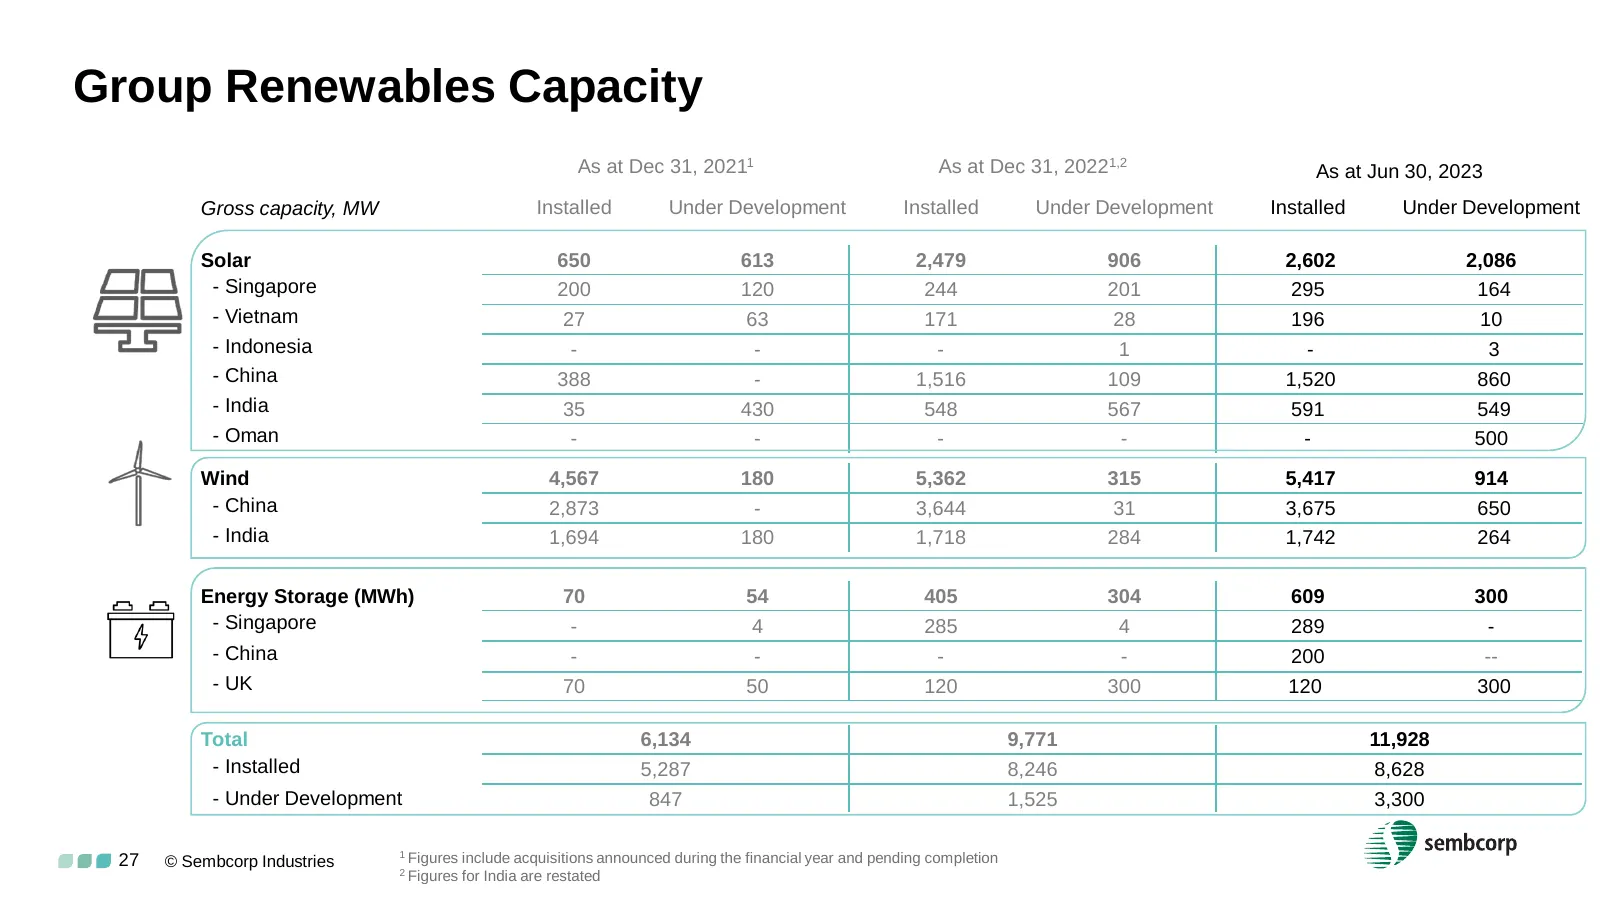
Slide 27: Renewables Capacity
Group Renewables Capacity As at Dec 31, 20211 As at Dec 31, 20221,2 As at Jun 30, 2023 Gross capacity, MW Installed Under Development Installed Under Development Installed Under Development Solar 650 613 2,479 906 2,602 2,086 - Singapore 200 120 244 201 295 164 - Vietnam 27 63 171 28 196 10 - Indone
Source: Internet Archive copy of sembcorp.com
More decks from Sembcorp Industries Ltd.
 H1 2026 Earnings Presentation26 slides · Aug 13, 2026
 Investor Presentation (June 2026)52 slides · June 2026
 Shareholder Meeting (April 2026)11 slides · Apr 29, 2026
 FY2025 Earnings Presentation35 slides · Feb 25, 2026
 Merger or Acquisition (January 2026)13 slides · Jan 30, 2026
 Merger or Acquisition (December 2025)24 slides · Dec 11, 2025