SK Telecom Co., Ltd. · KRX:017670
SK Telecom — Merger or Acquisition (April 2019)
9 slides from SK Telecom's merger presentation, Apr 30, 2019
Slide 1: Investor Briefing: SK broadband to merge with Tbroad
Investor Briefing SK broadband to merge with Tbroad SK Telecom April 30, 2019 0
Slide 2: Disclaimer
Investor Briefing Disclaimer This presentation contains forward-looking statements with respect to the financial condition, results of operations and business of SK Telecom and its subsidiaries (the “Company”, or “SKT”) and plans and objectives of the management of the Company. The aforementioned fo
Slide 3: Contents
Investor Briefing Contents Highlights 3 Merger Structure 4 Snapshot of Tbroad 6 Expected Synergies 8 2
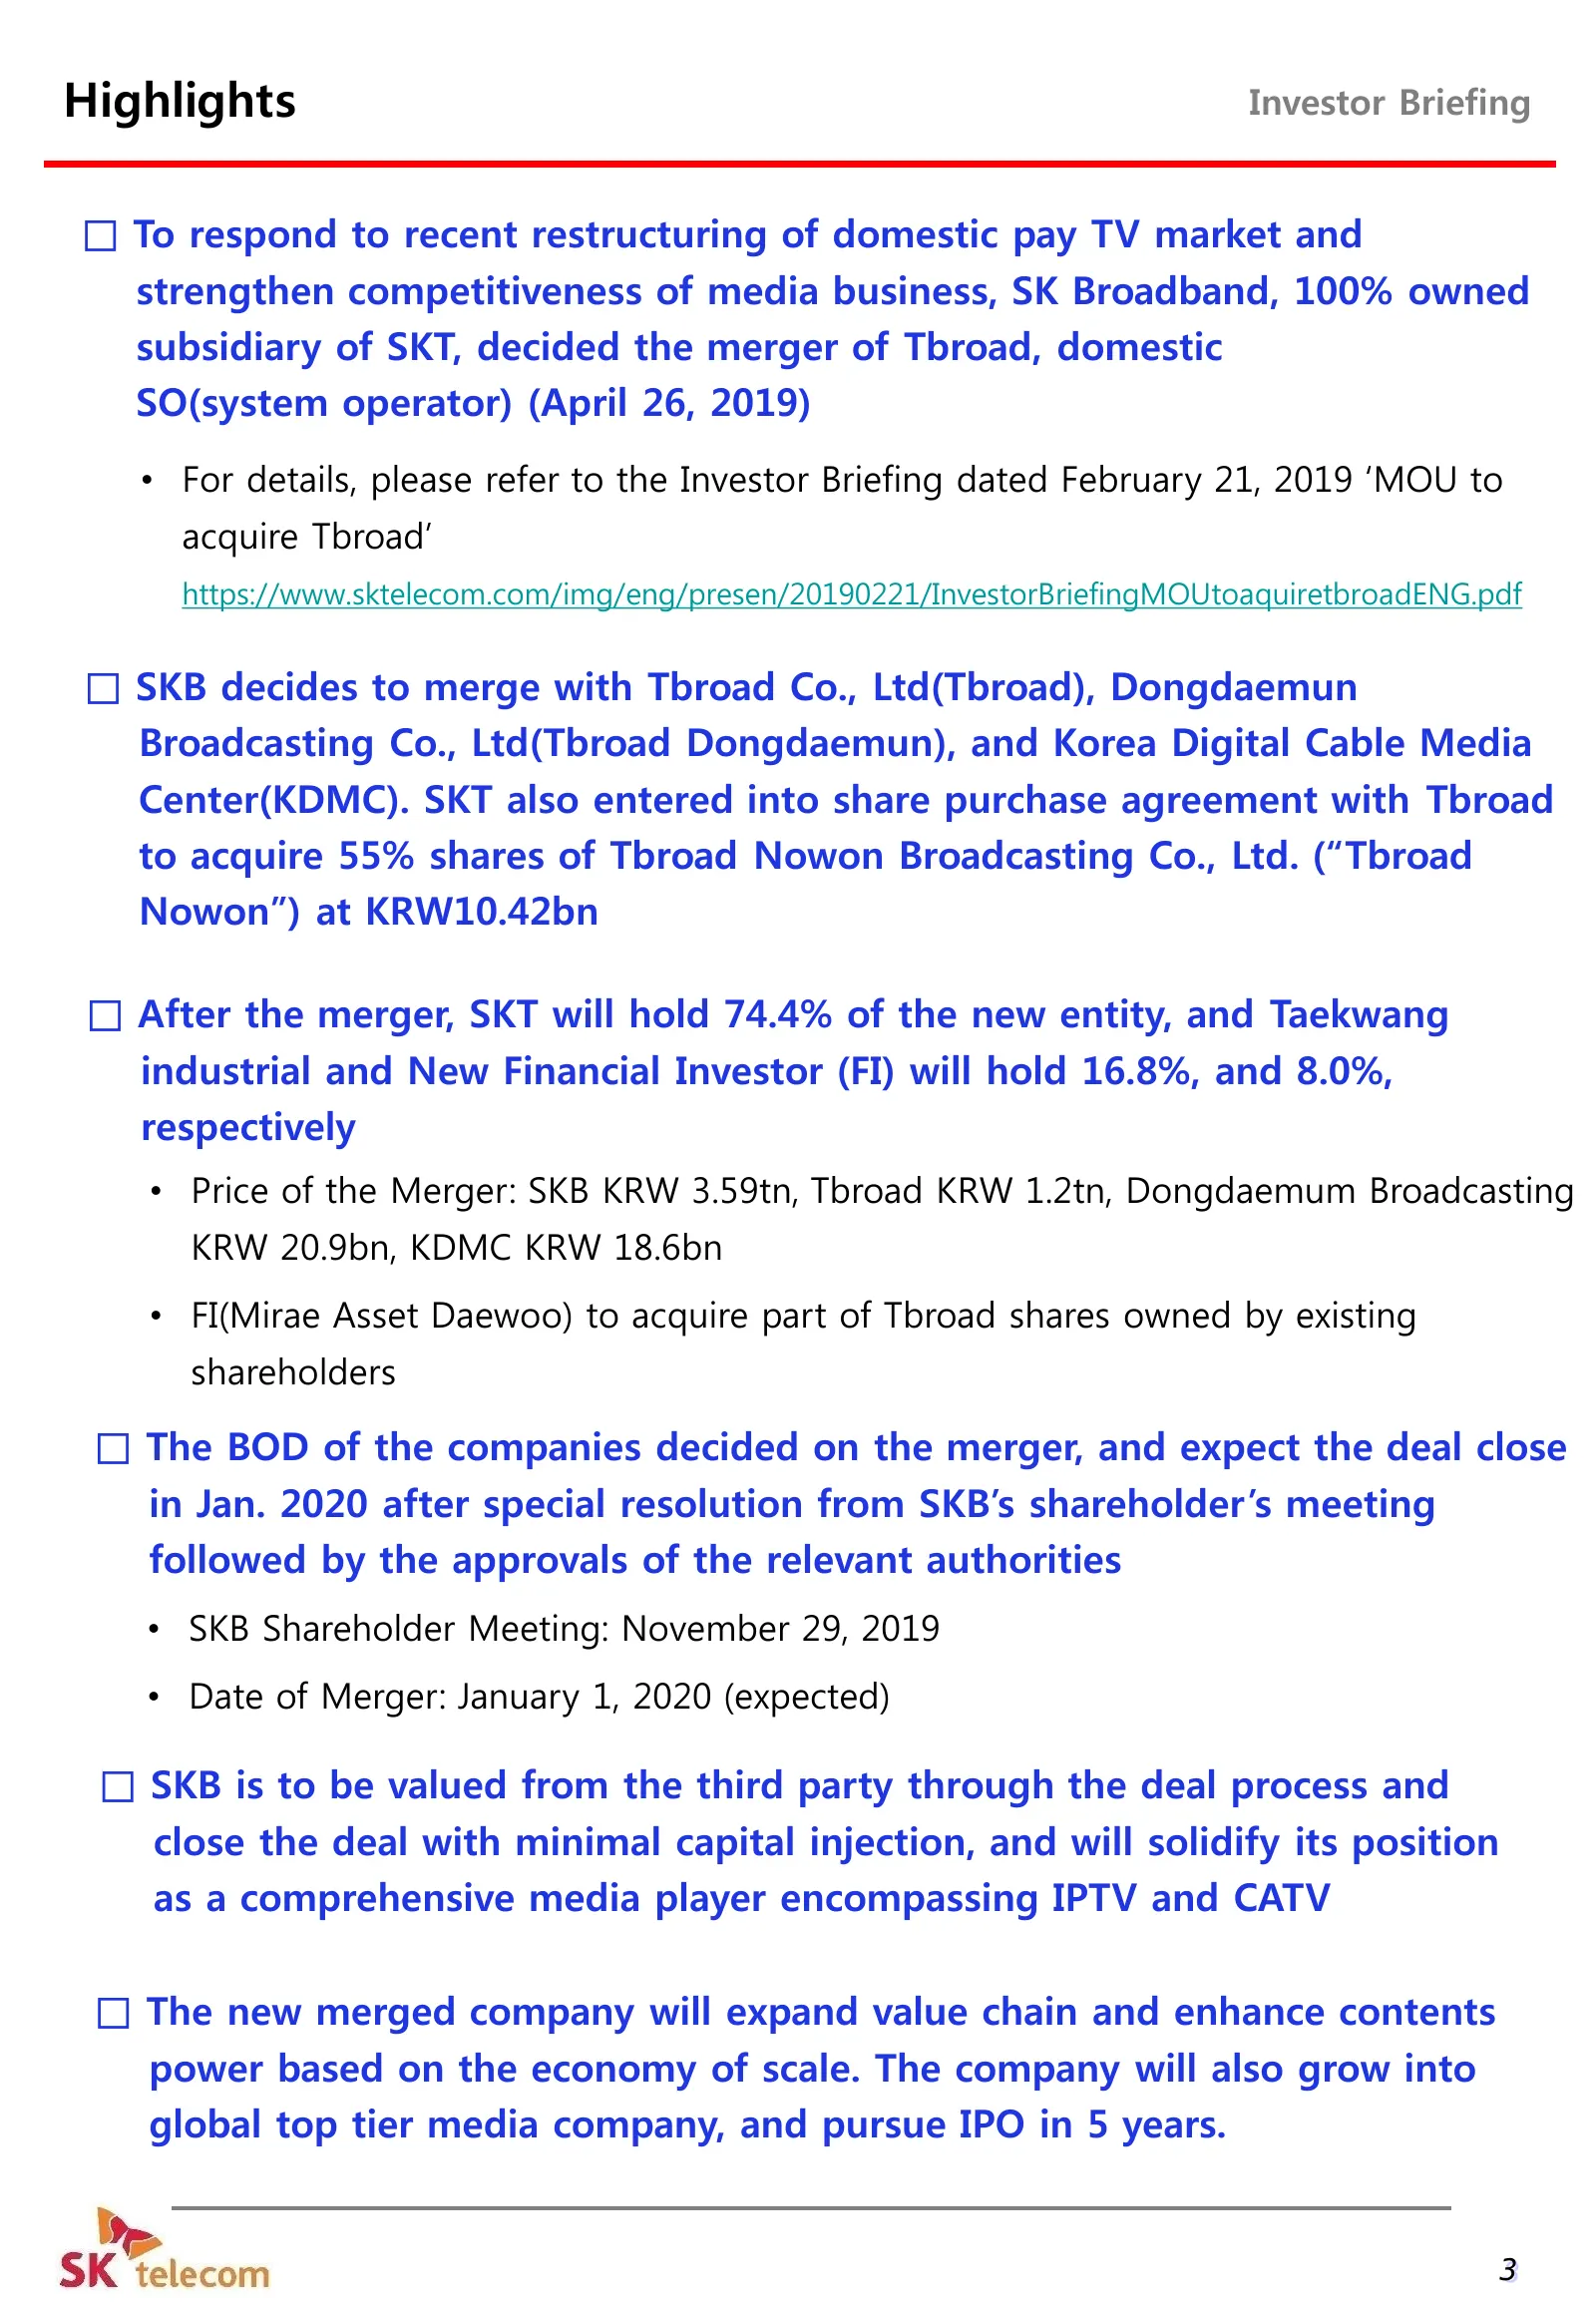
Slide 4: Highlights
Highlights Investor Briefing □ To respond to recent restructuring of domestic pay TV market and strengthen competitiveness of media business, SK Broadband, 100% owned subsidiary of SKT, decided the merger of Tbroad, domestic SO(system operator) (April 26, 2019) • For details, please refer to the Inv
Slide 5: Merger Structure
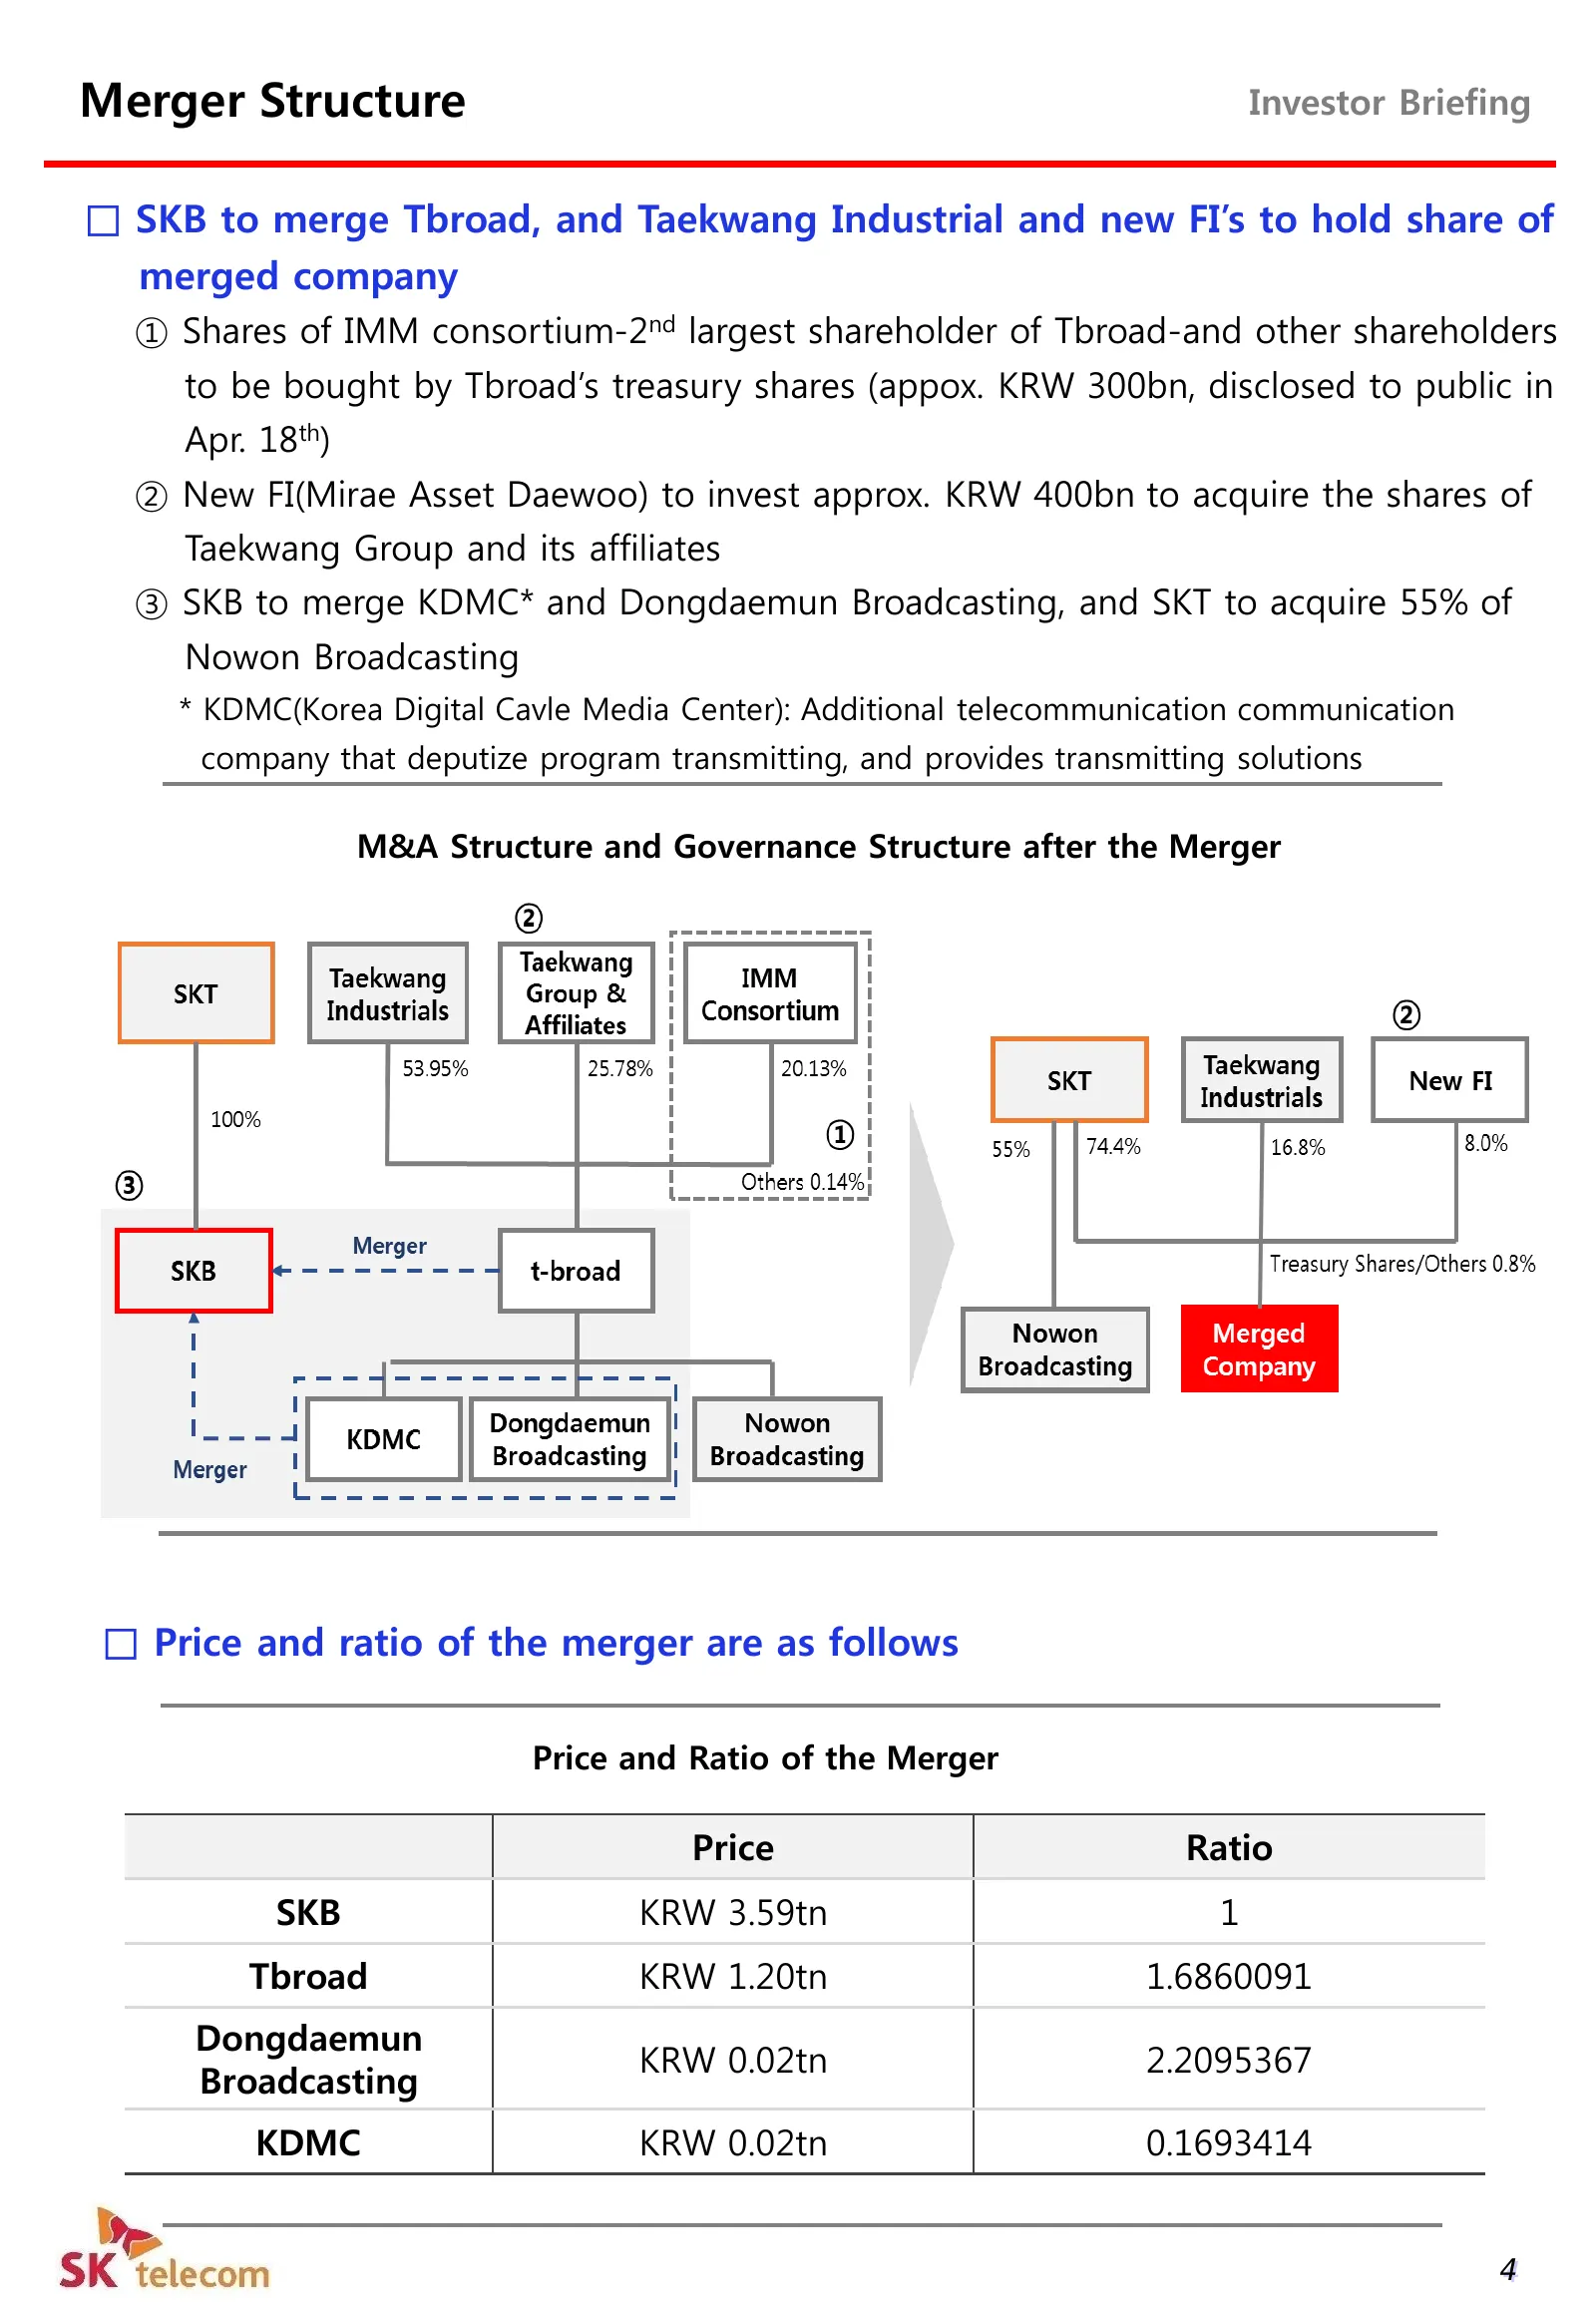
Merger Structure Investor Briefing □ SKB to merge Tbroad, and Taekwang Industrial and new FI’s to hold share of merged company ① Shares of IMM consortium-2nd largest shareholder of Tbroad-and other shareholders to be bought by Tbroad’s treasury shares (appox. KRW 300bn, disclosed to public in Apr. 1
Slide 6: Merger Structure: Timeline
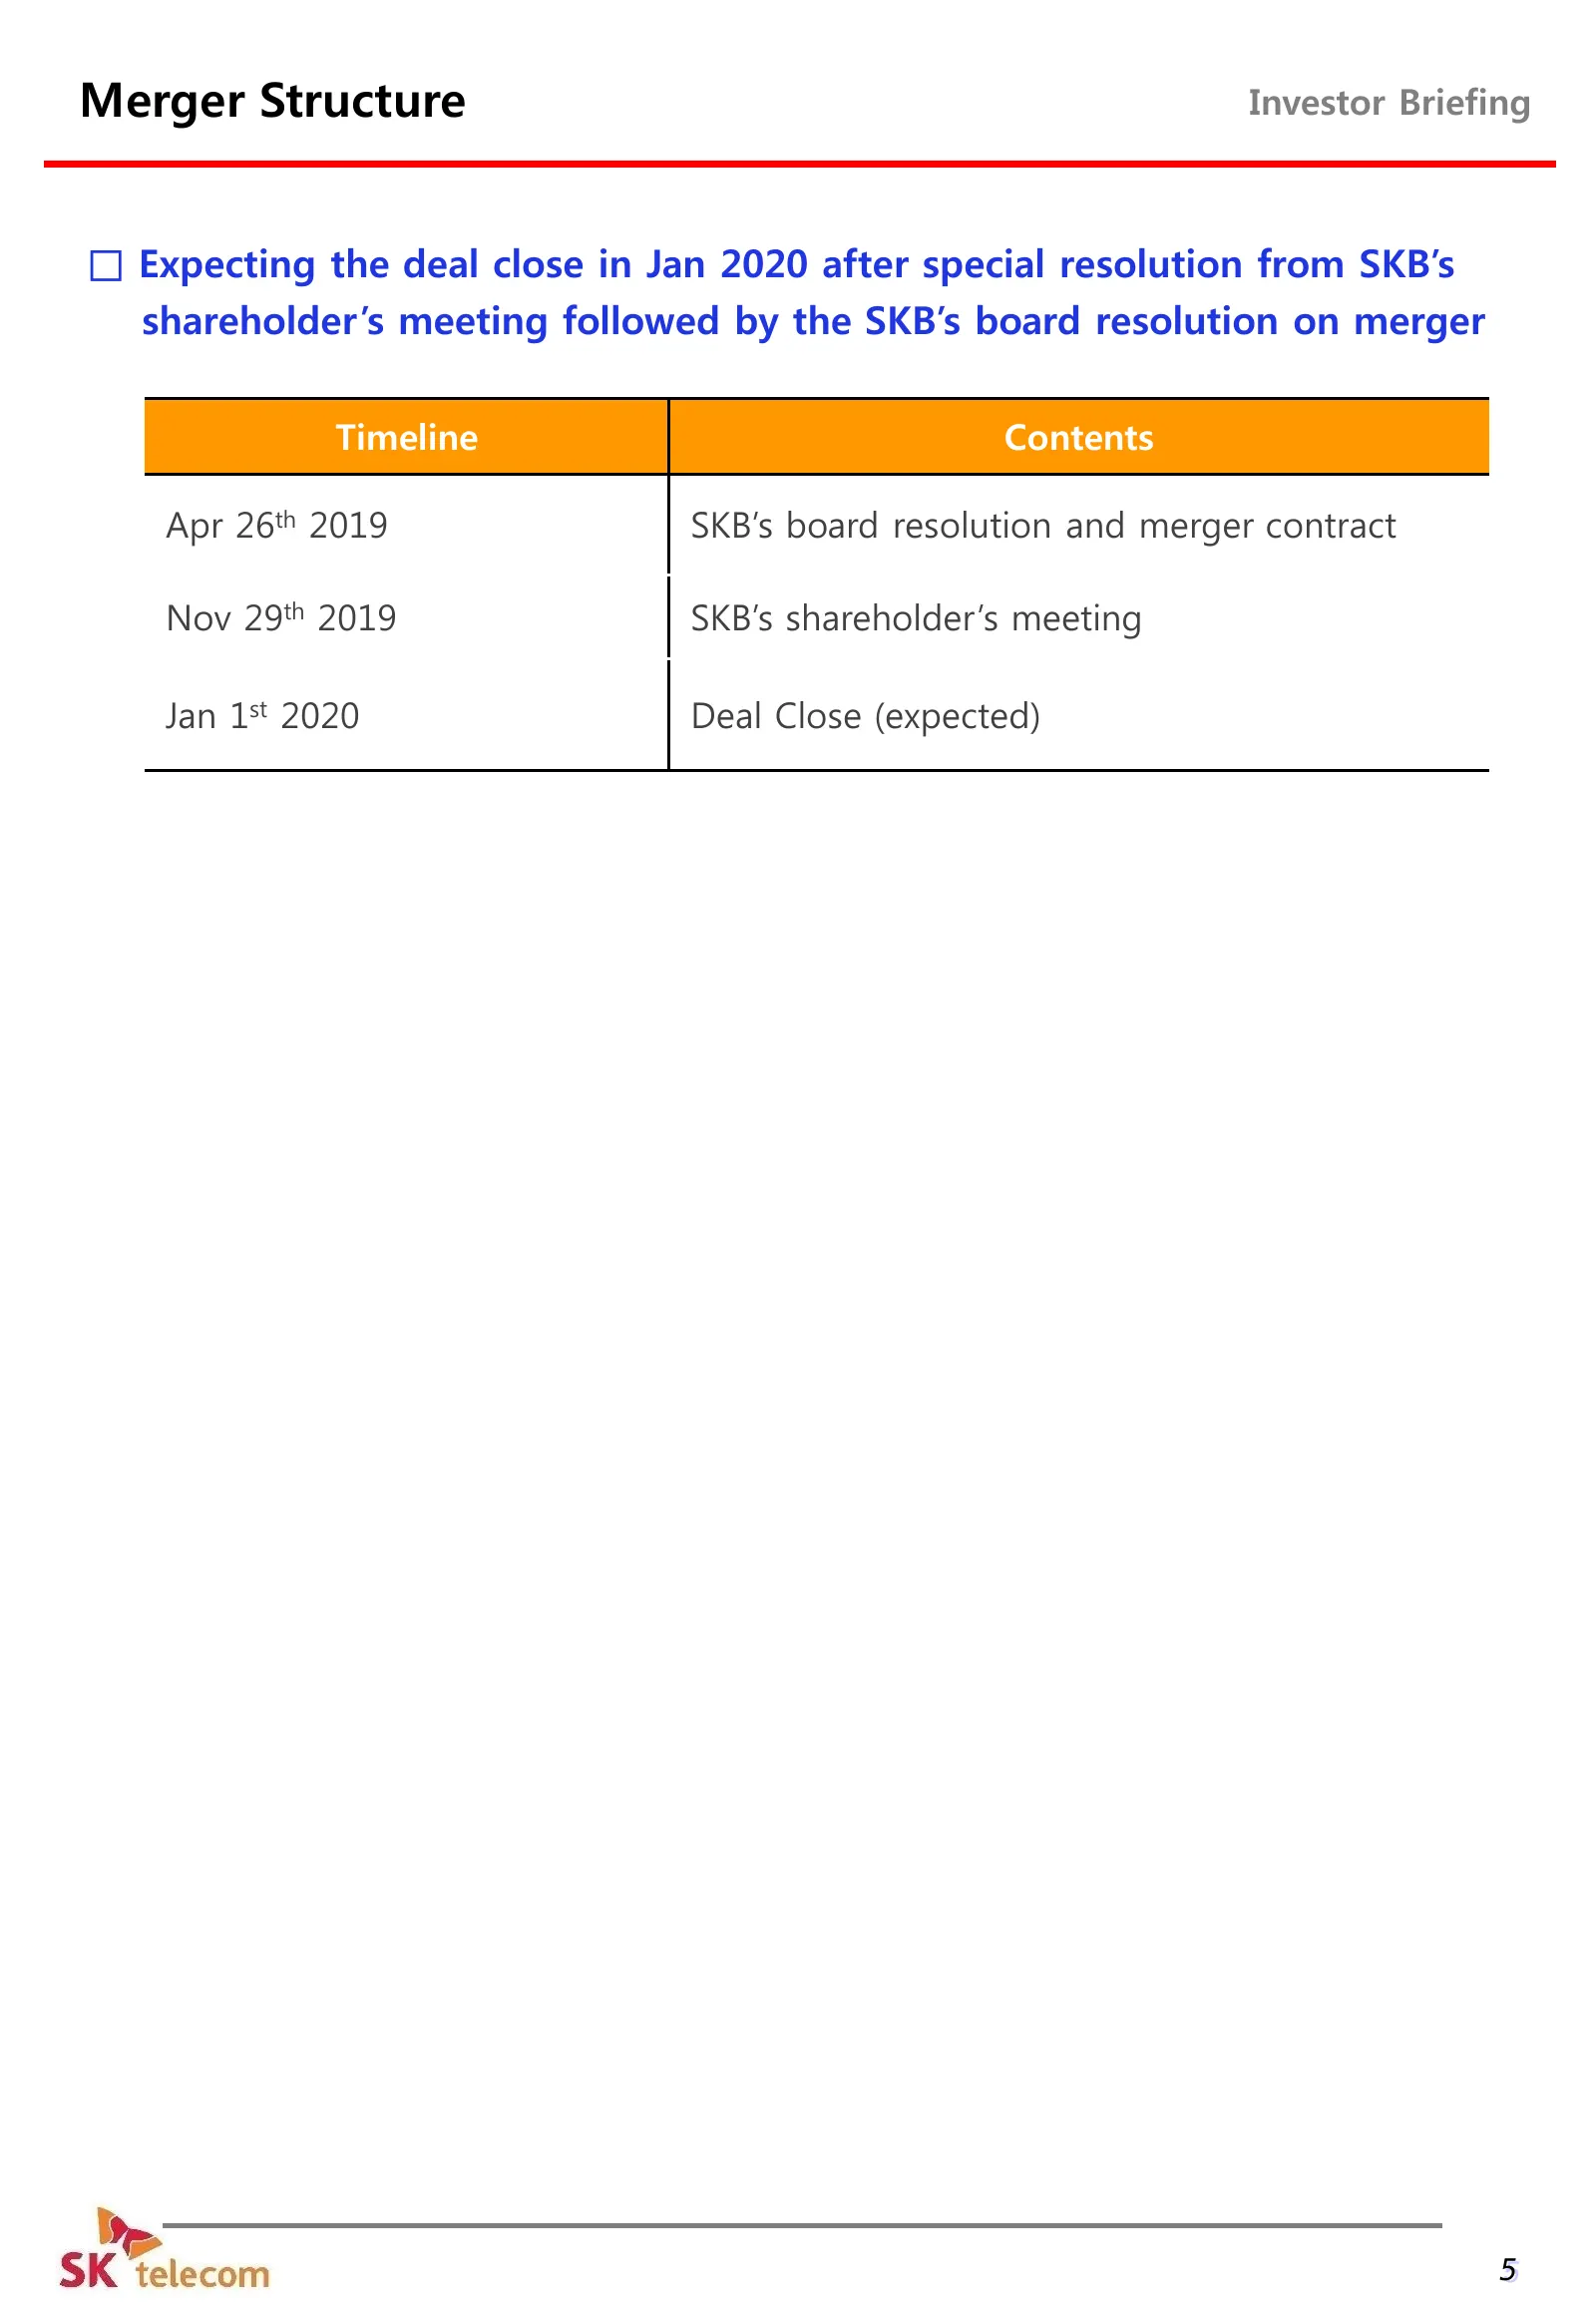
Merger Structure Investor Briefing □ Expecting the deal close in Jan 2020 after special resolution from SKB’s shareholder’s meeting followed by the SKB’s board resolution on merger Timeline Contents Apr 26th 2019 SKB’s board resolution and merger contract Nov 29th 2019 SKB’s shareholder’s meeting Ja
Slide 7: Snapshot of Tbroad
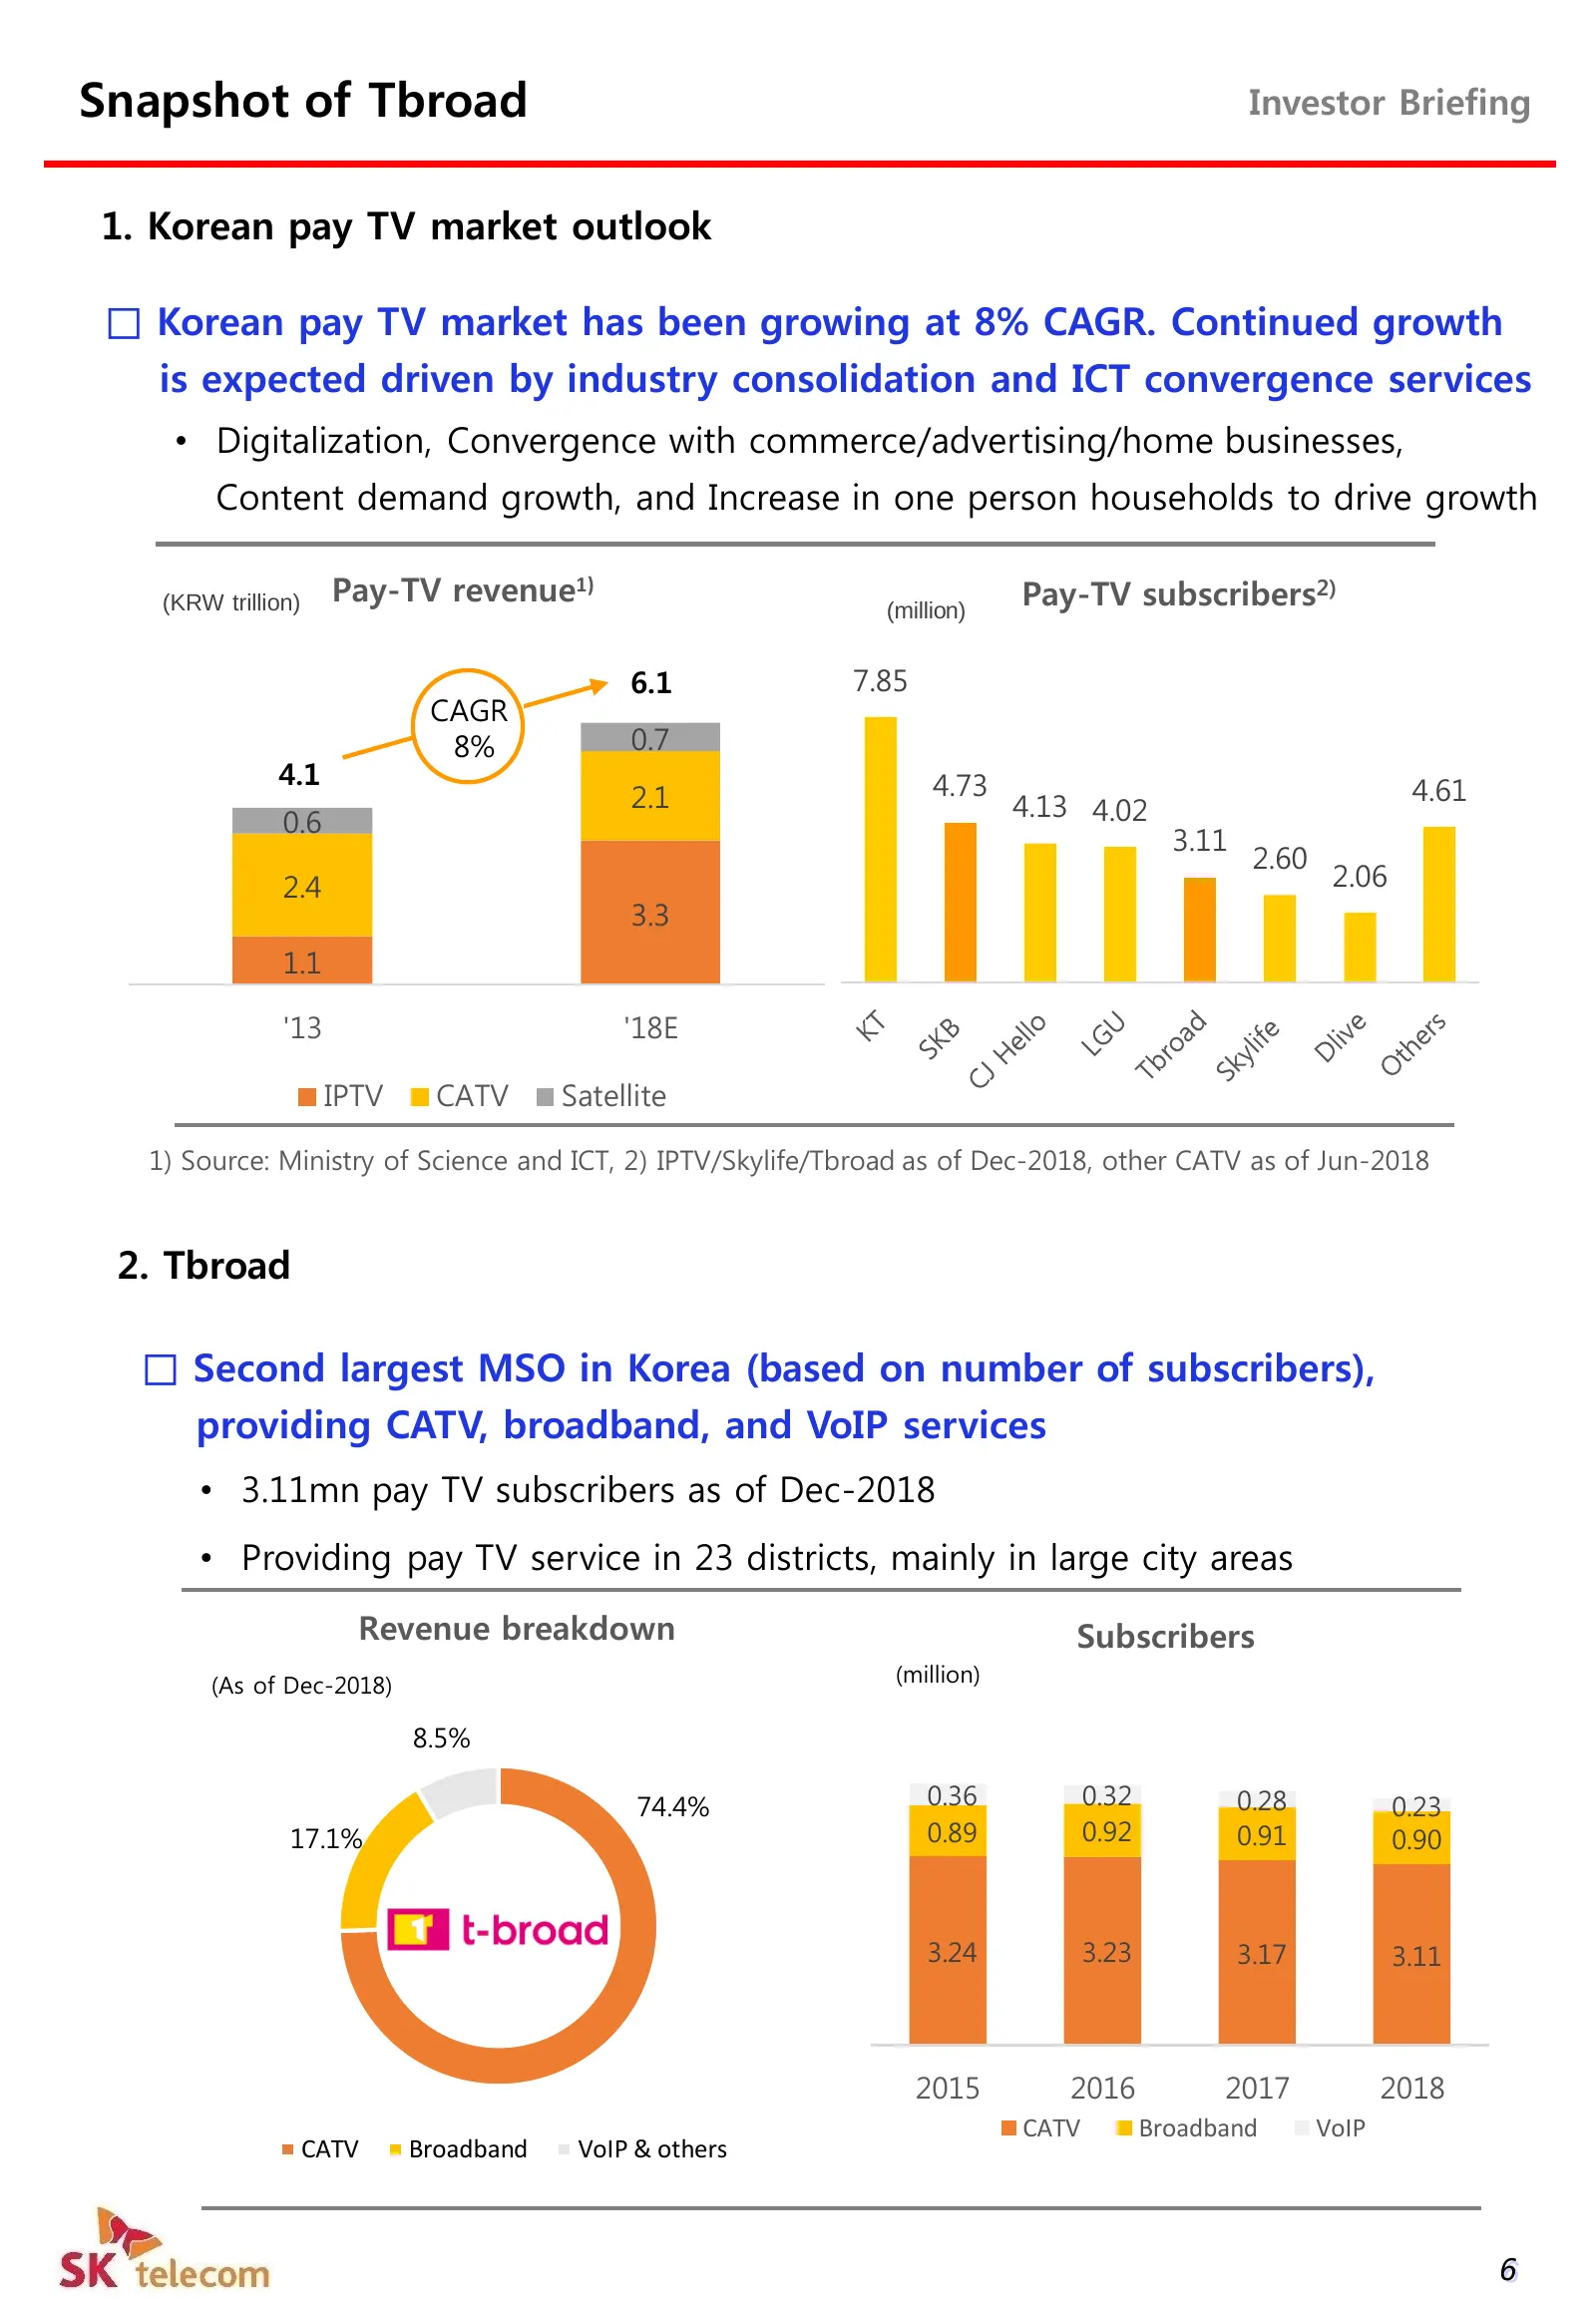
Snapshot of Tbroad Investor Briefing 1. Korean pay TV market outlook □ Korean pay TV market has been growing at 8% CAGR. Continued growth is expected driven by industry consolidation and ICT convergence services • Digitalization, Convergence with commerce/advertising/home businesses, Content demand
Slide 8: Snapshot of Tbroad: EBITDA margin and balance sheet
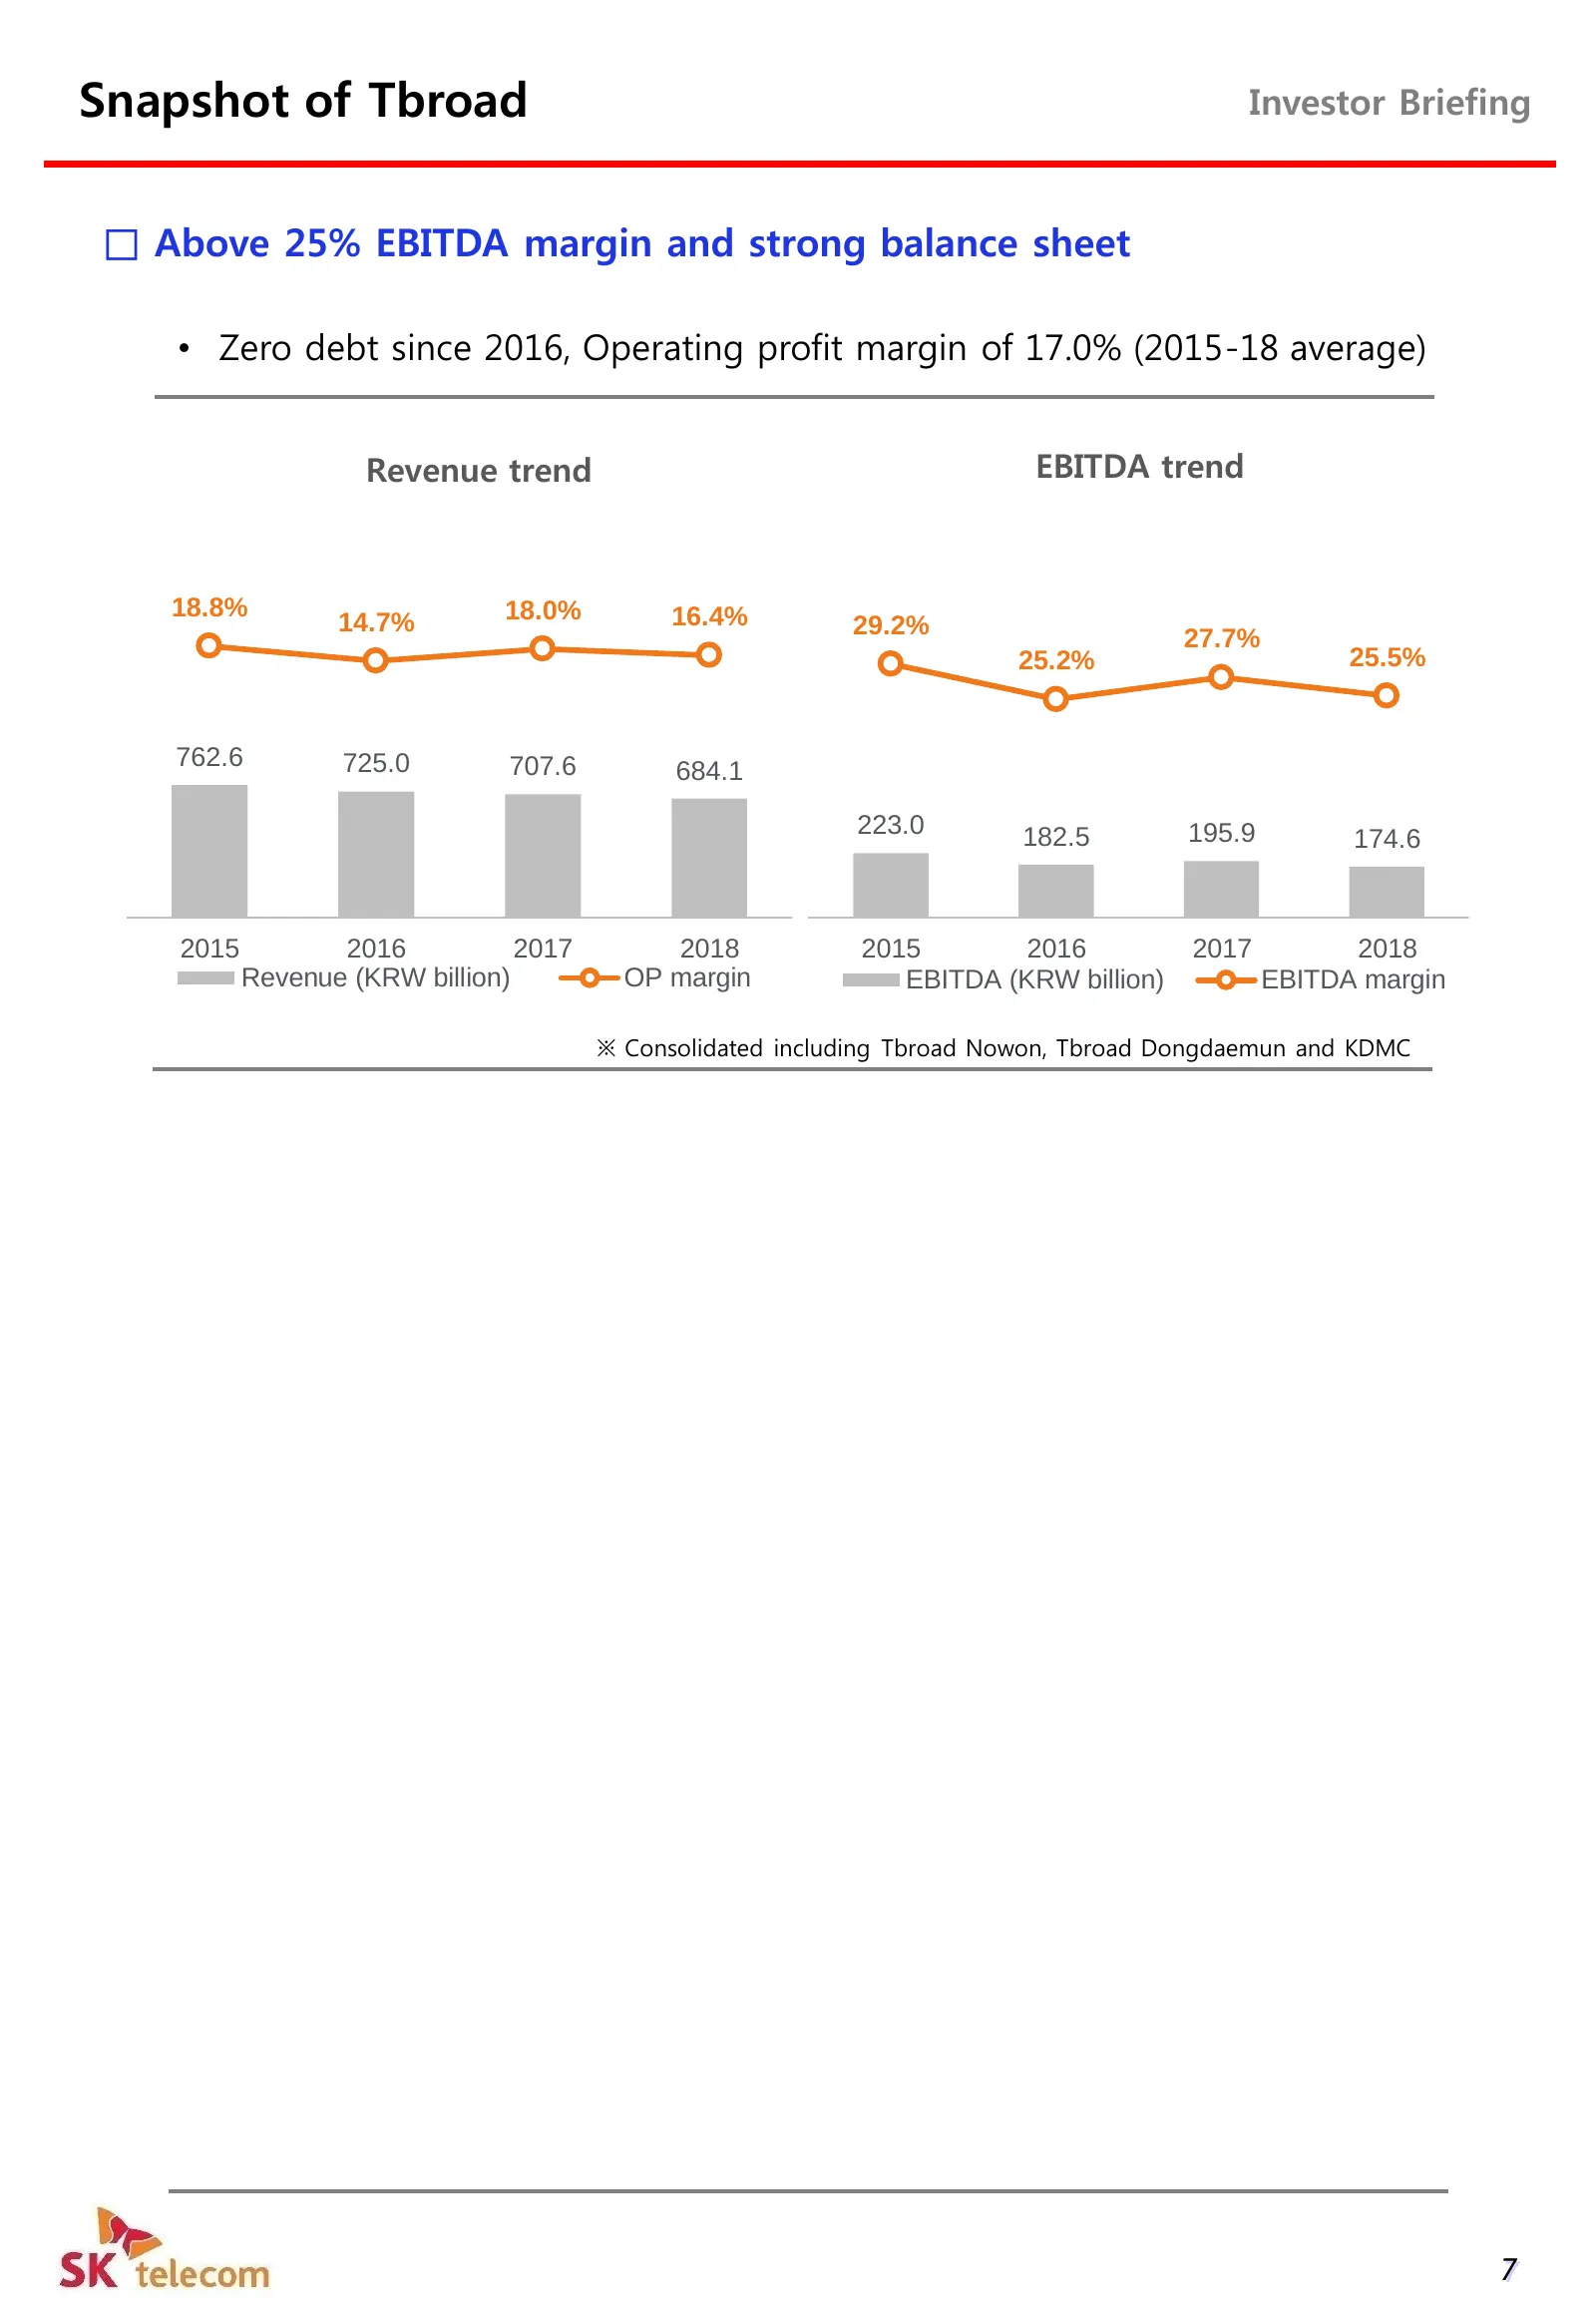
Snapshot of Tbroad Investor Briefing □ Above 25% EBITDA margin and strong balance sheet • Zero debt since 2016, Operating profit margin of 17.0% (2015-18 average) Revenue trend EBITDA trend 18.8% 18.0% 16.4% 14.7% 29.2% 27.7% 25.2% 25.5% 762.6 725.0 707.6 684.1 223.0 182.5 195.9 174.6 2015 2016 2017
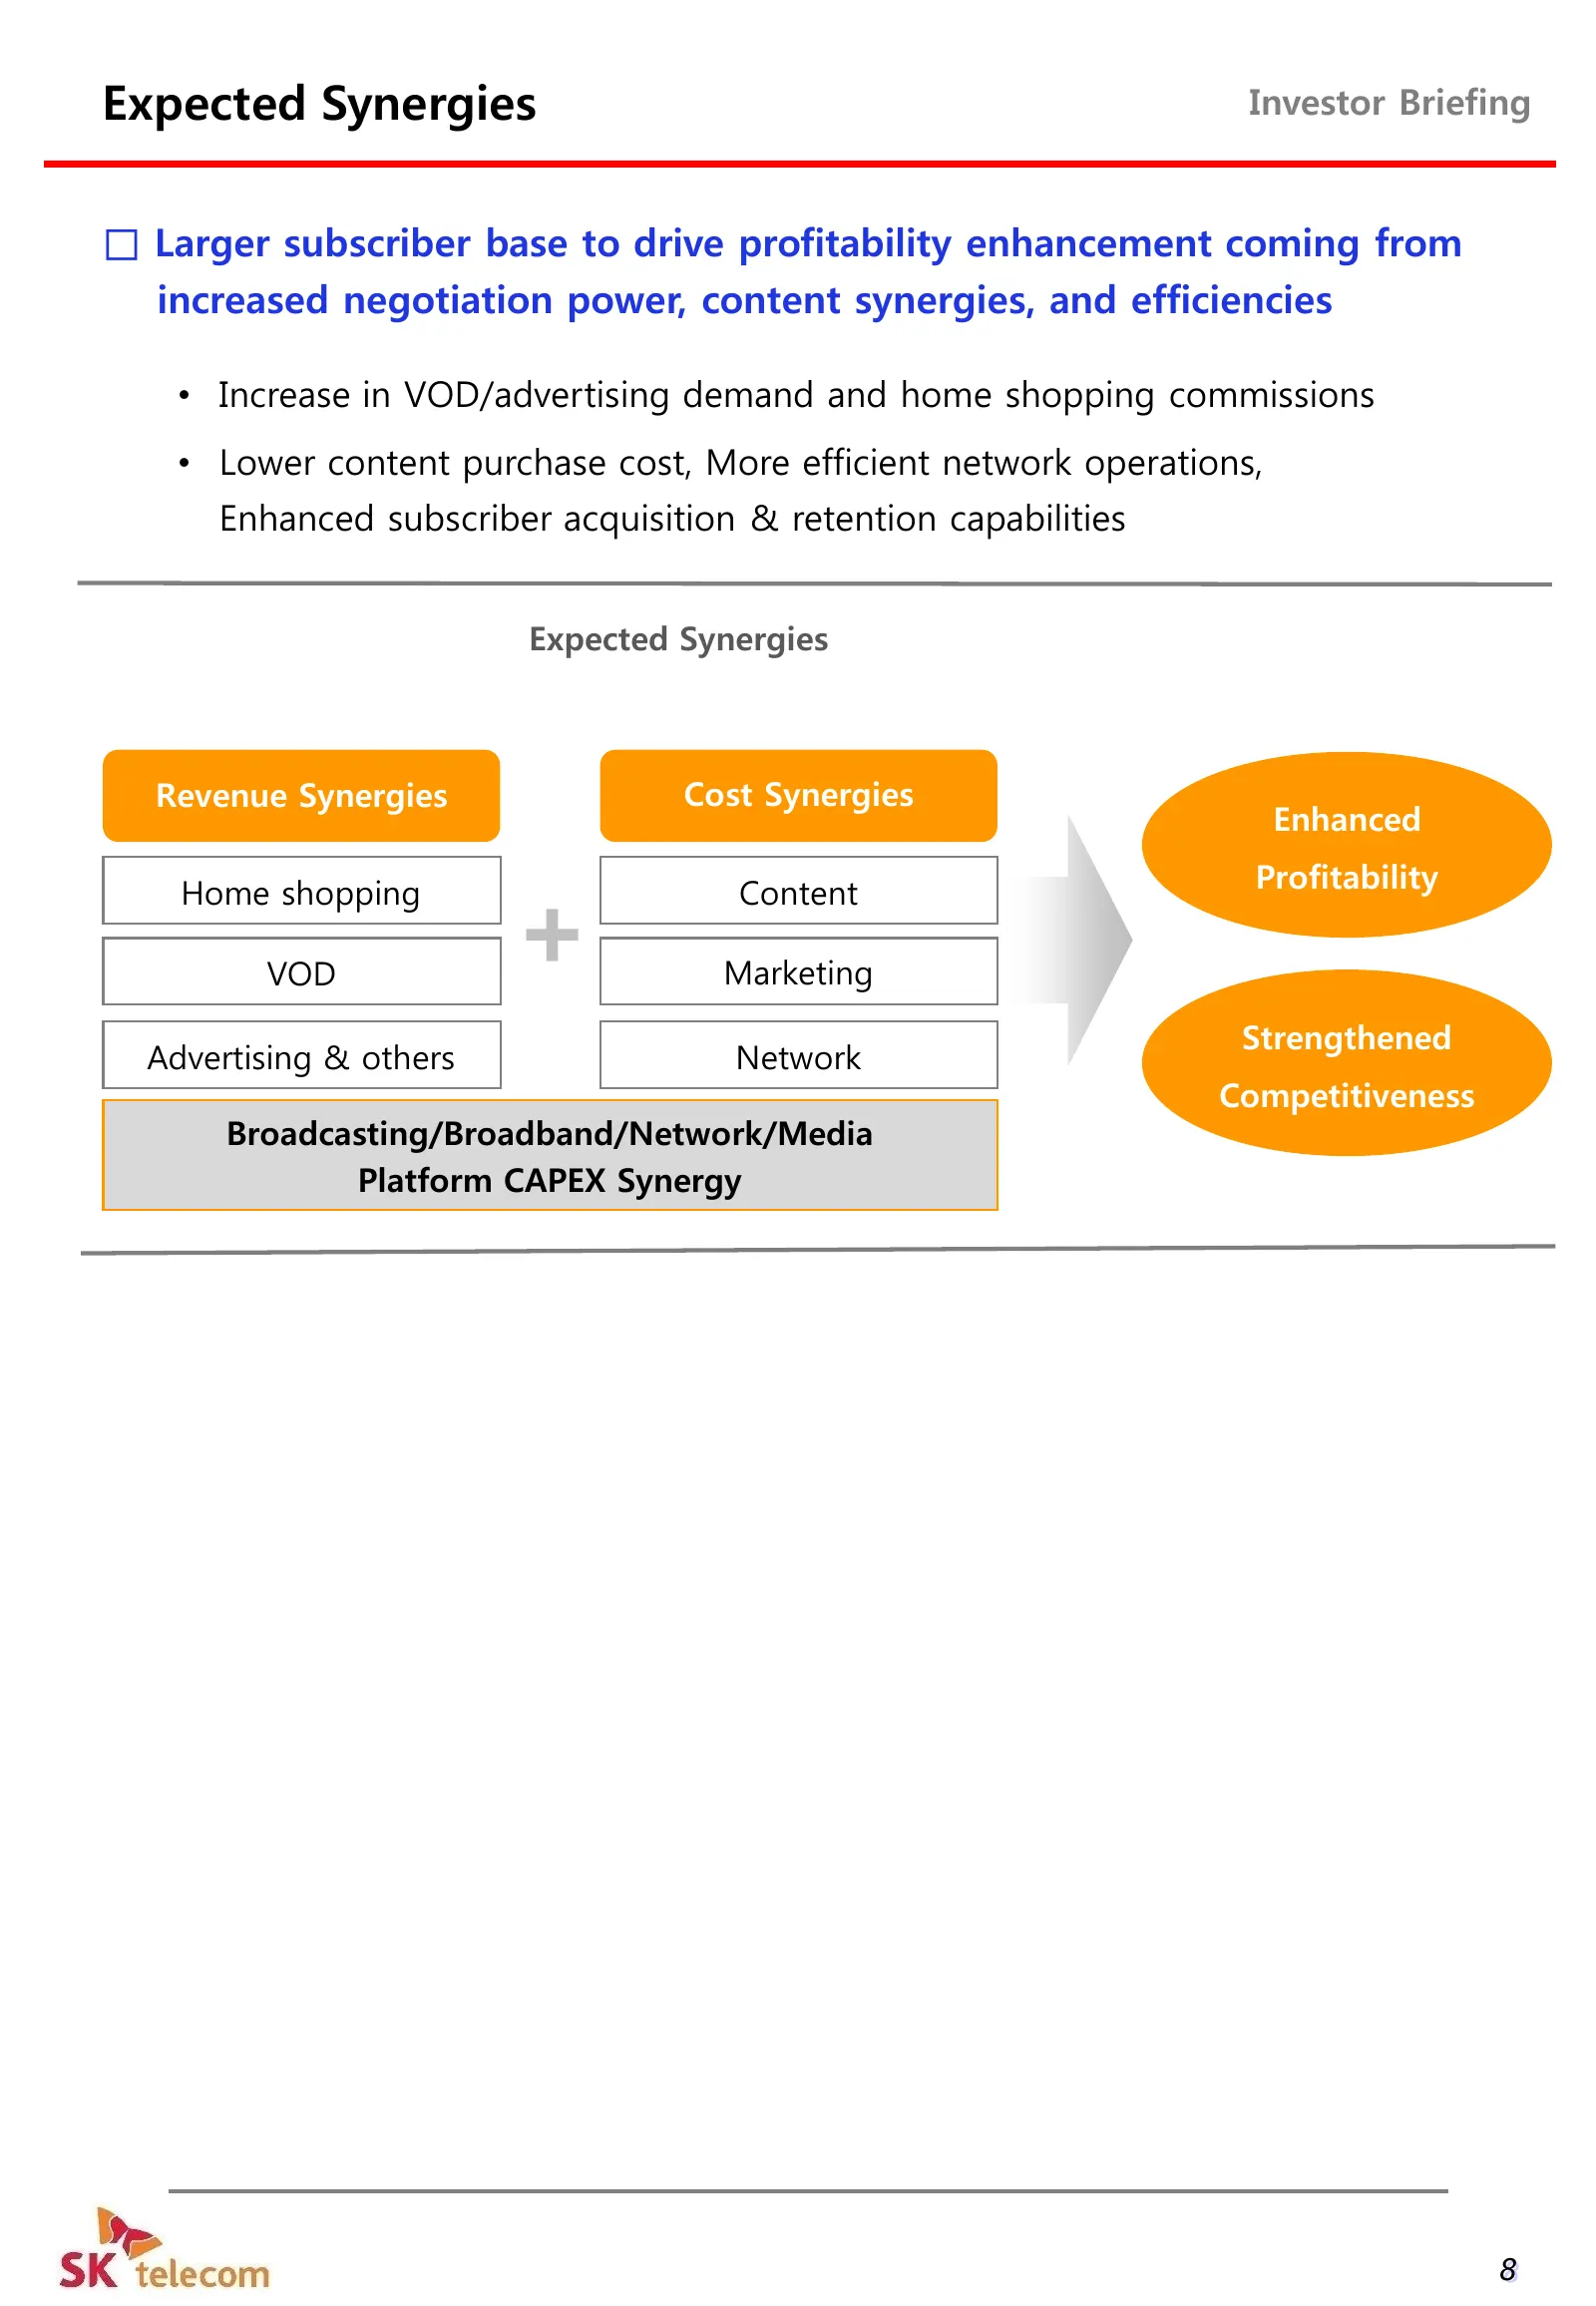
Slide 9: Expected Synergies
Expected Synergies Investor Briefing □ Larger subscriber base to drive profitability enhancement coming from increased negotiation power, content synergies, and efficiencies • Increase in VOD/advertising demand and home shopping commissions • Lower content purchase cost, More efficient network opera
Source: Internet Archive copy of sktelecom.com
More decks from SK Telecom Co., Ltd.
 Q3 2026 Earnings Presentation12 slides · Nov 4, 2026
 Q1 2026 Earnings Presentation12 slides · May 7, 2026
 FY2025 Earnings Presentation15 slides · Feb 5, 2026
 Q3 2025 Earnings Presentation18 slides · Oct 31, 2025
 Q2 2025 Earnings Presentation19 slides · Aug 12, 2025
 Q1 2025 Earnings Presentation16 slides · May 12, 2025