Dauch Corporation · NYSE:DCH
Dauch — Investor Day (November 2026)
97 slides from Dauch's investor day presentation, Nov 17, 2026

Slide 1: Capital Markets Day
CAPITAL MARKETS DAY
Slide 2: Disclosure
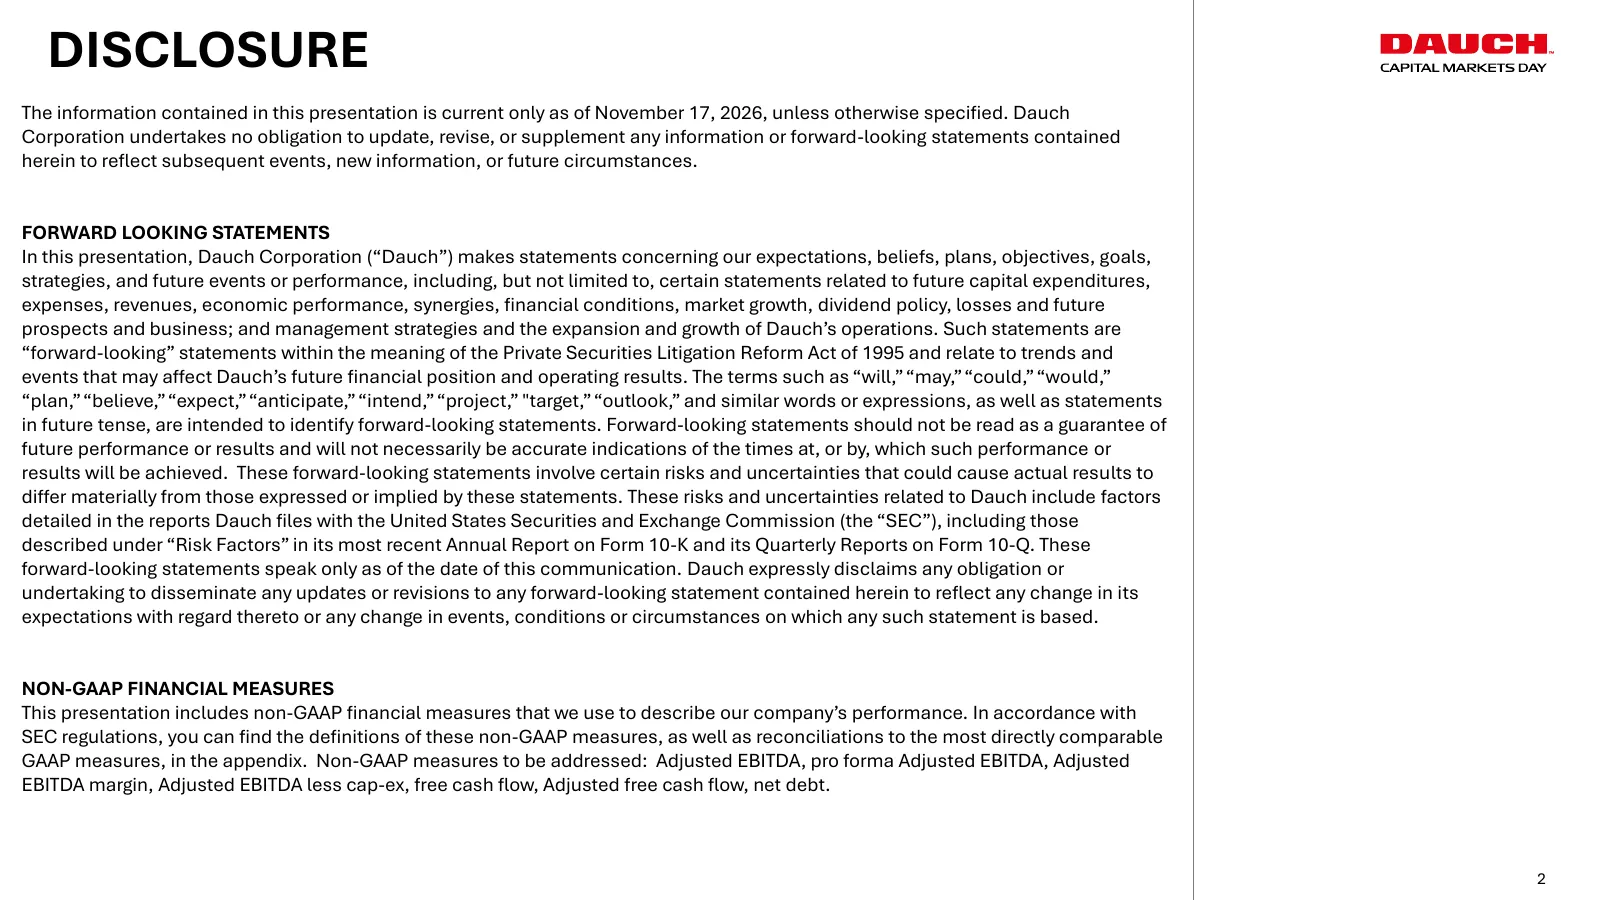
DISCLOSURE The information contained in this presentation is current only as of November 17, 2026, unless otherwise specified. Dauch Corporation undertakes no obligation to update, revise, or supplement any information or forward-looking statements contained herein to reflect subsequent events, new
Slide 3: Agenda
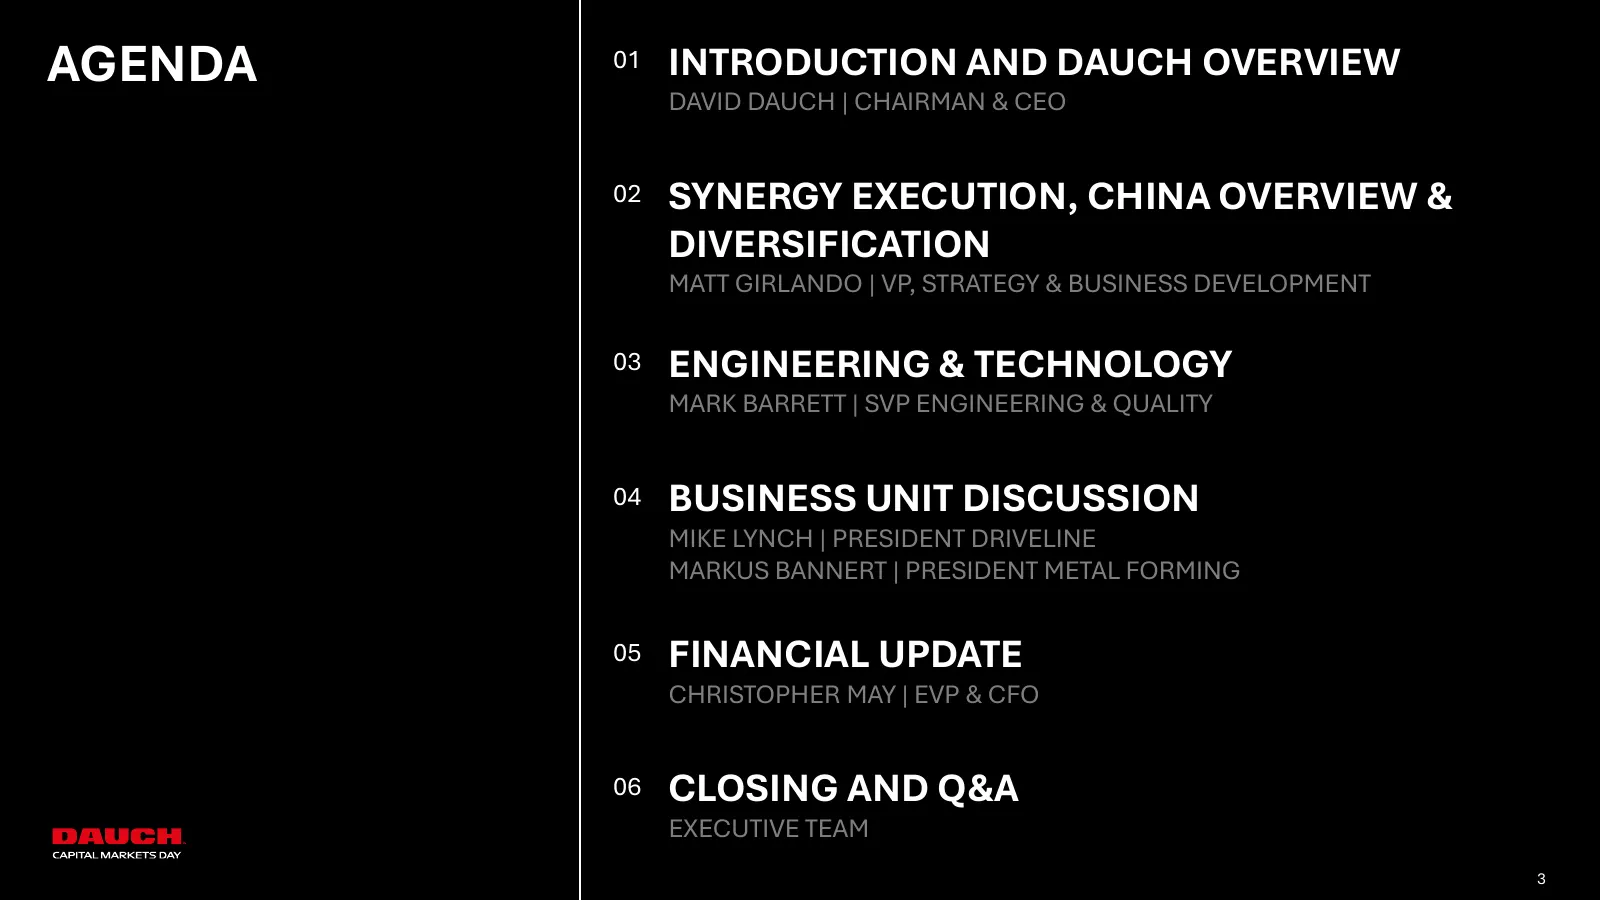
AGENDA 01 INTRODUCTION AND DAUCH OVERVIEW DAVID DAUCH | CHAIRMAN & CEO 02 SYNERGY EXECUTION, CHINA OVERVIEW & DIVERSIFICATION MATT GIRLANDO | VP, STRATEGY & BUSINESS DEVELOPMENT 03 ENGINEERING & TECHNOLOGY MARK BARRETT | SVP ENGINEERING & QUALITY 04 BUSINESS UNIT DISCUSSION MIKE LYNCH | PRESIDENT DR

Slide 4: David Dauch, Chairman & CEO
DAVID DAUCH CHAIRMAN & CHIEF EXECUTIVE OFFICER 4 4
Slide 5: The New Dauch
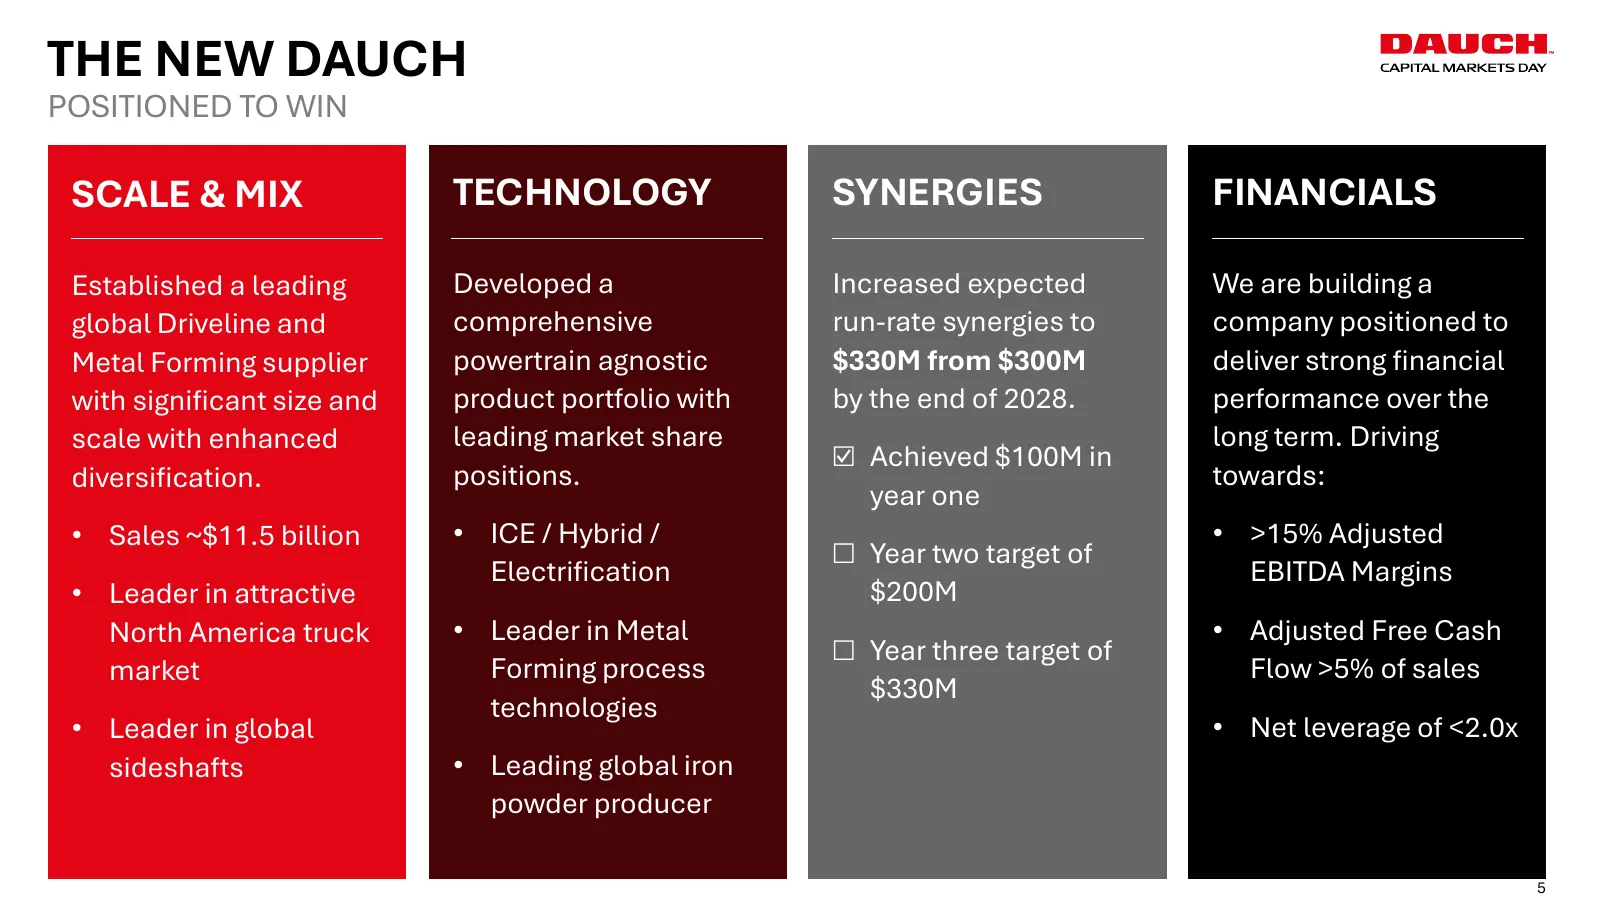
THE NEW DAUCH POSITIONED TO WIN SCALE & MIX TECHNOLOGY SYNERGIES FINANCIALS Established a leading Developed a Increased expected We are building a global Driveline and comprehensive run-rate synergies to company positioned to Metal Forming supplier powertrain agnostic $330M from $300M deliver strong
Slide 6: Our Business
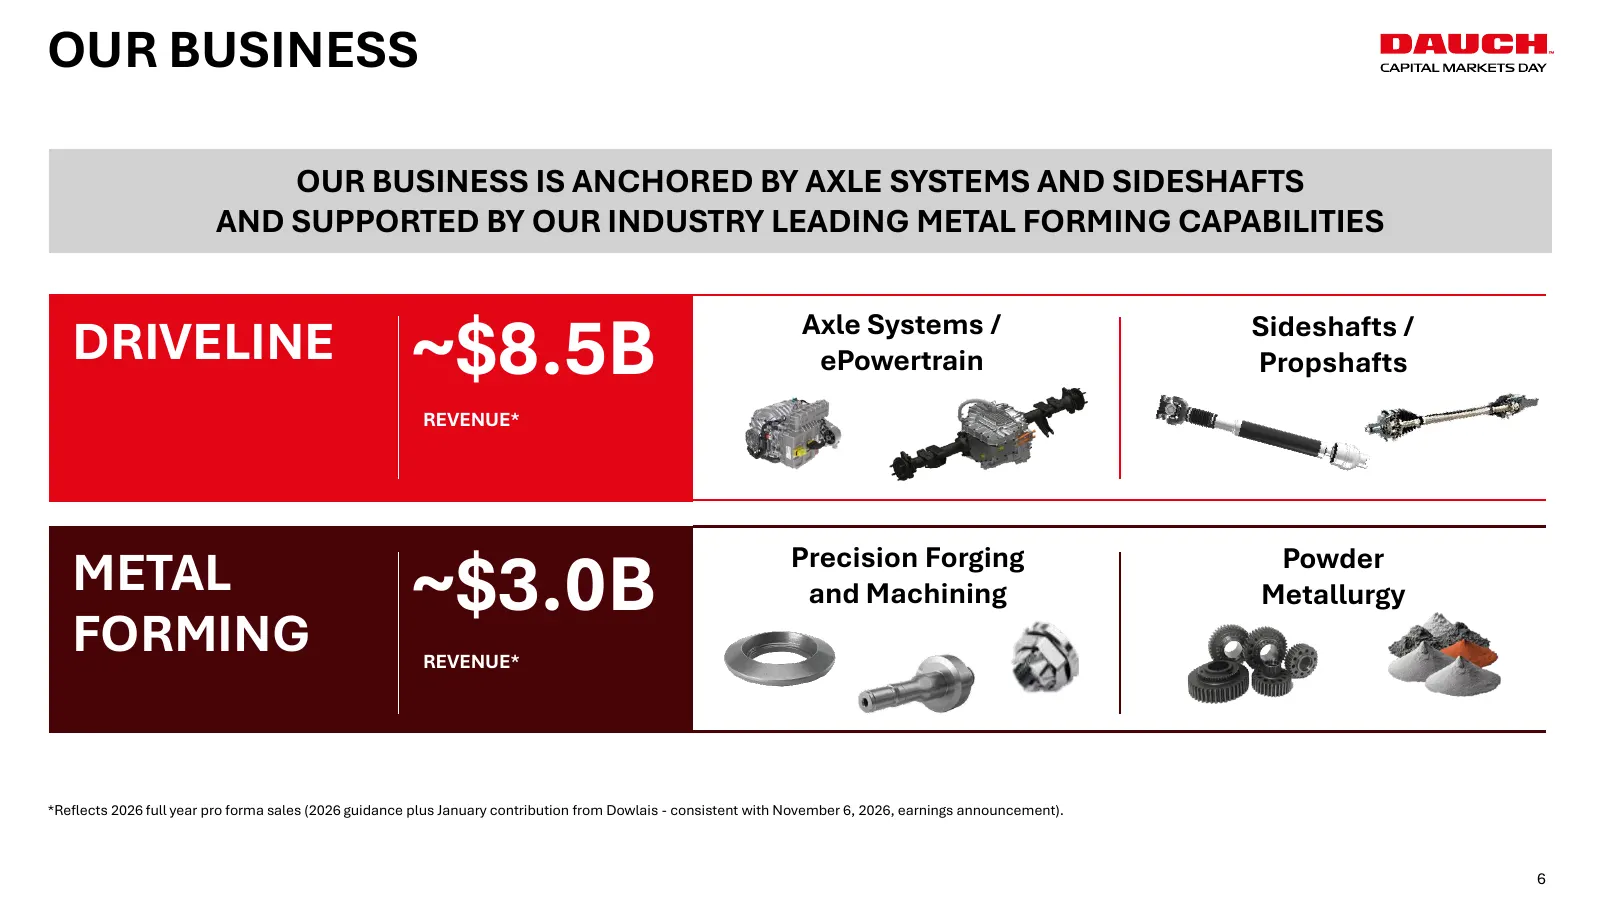
OUR BUSINESS OUR BUSINESS IS ANCHORED BY AXLE SYSTEMS AND SIDESHAFTS AND SUPPORTED BY OUR INDUSTRY LEADING METAL FORMING CAPABILITIES DRIVELINE ~$8.5B Axle Systems / ePowertrain Sideshafts / Propshafts REVENUE* ~$3.0B Precision Forging Powder METAL and Machining Metallurgy FORMING REVENUE* *Reflects
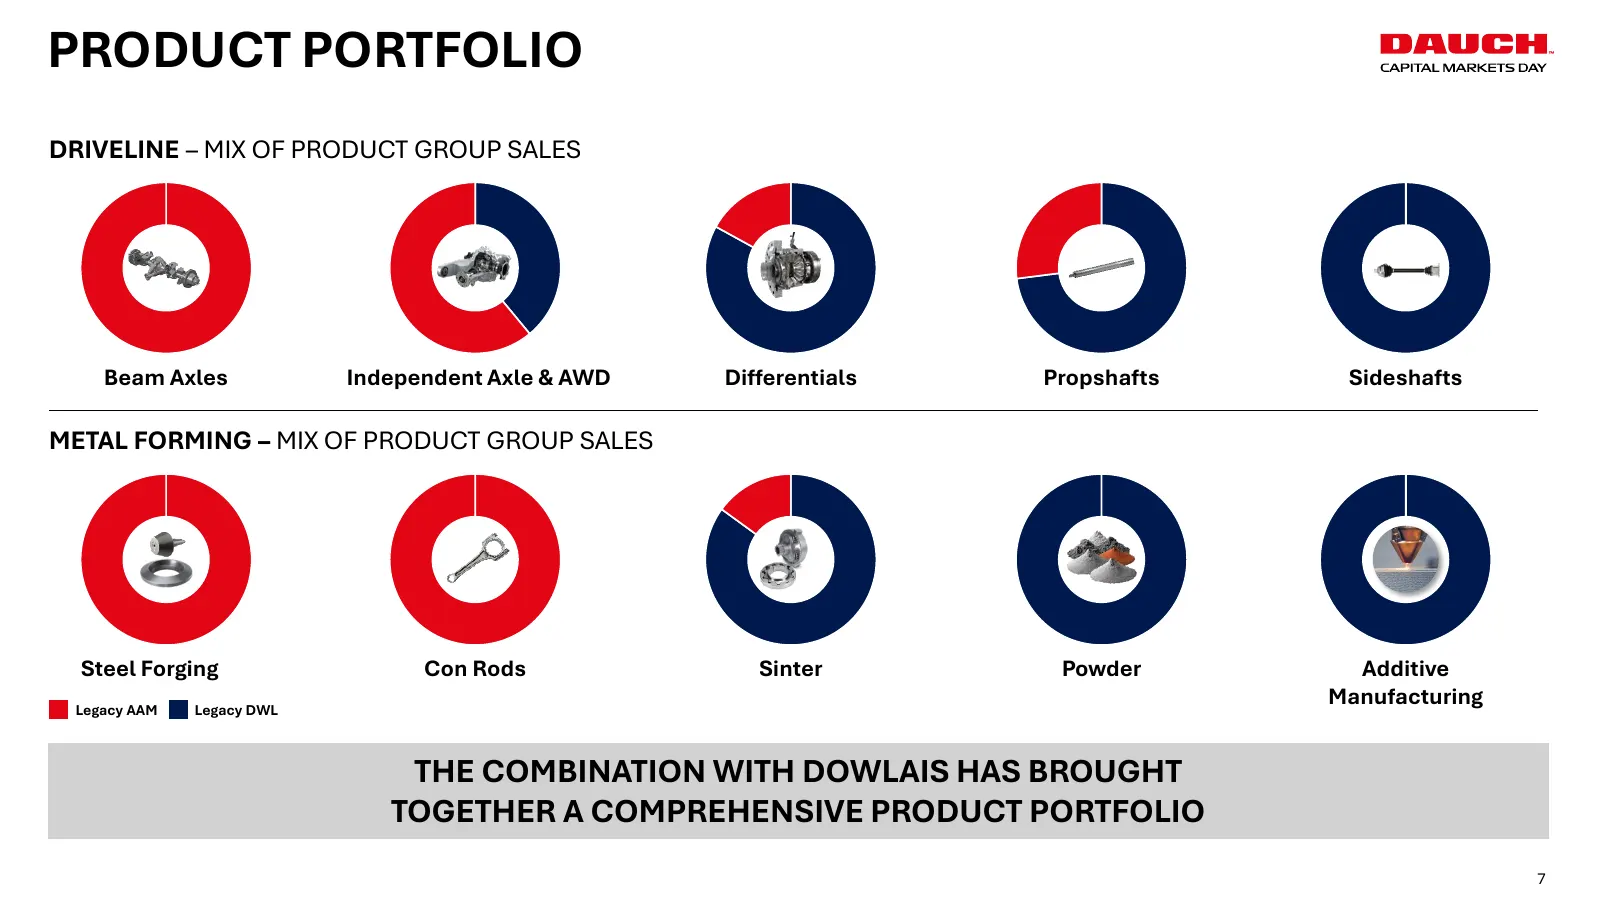
Slide 7: Product Portfolio
PRODUCT PORTFOLIO DRIVELINE – MIX OF PRODUCT GROUP SALES Beam Axles Independent Axle & AWD Differentials Propshafts Sideshafts METAL FORMING – MIX OF PRODUCT GROUP SALES Steel Forging Con Rods Sinter Powder Additive Legacy AAM Legacy DWL Manufacturing THE COMBINATION WITH DOWLAIS HAS BROUGHT TOGETHE
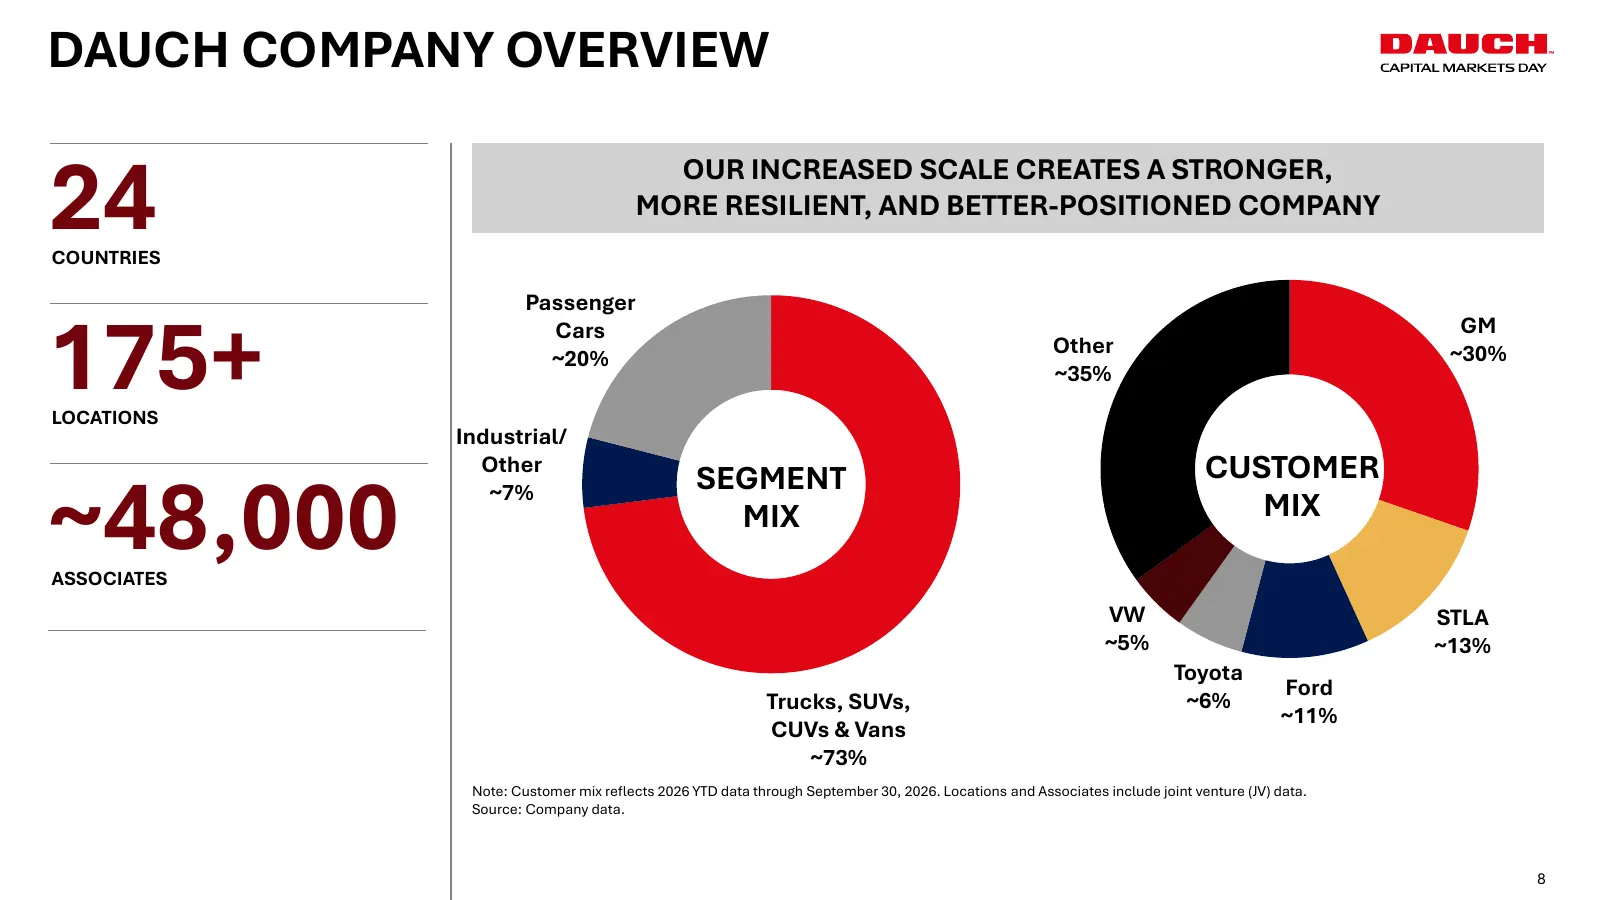
Slide 8: Dauch Company Overview
DAUCH COMPANY OVERVIEW 24 COUNTRIES OUR INCREASED SCALE CREATES A STRONGER, MORE RESILIENT, AND BETTER-POSITIONED COMPANY Passenger 175+ Cars GM Other ~30% ~20% ~35% LOCATIONS Industrial/ Other CUSTOMER ~48,000 ~7% SEGMENT MIX MIX ASSOCIATES VW STLA ~5% ~13% Toyota Ford Trucks, SUVs, ~6% ~11% CUVs &
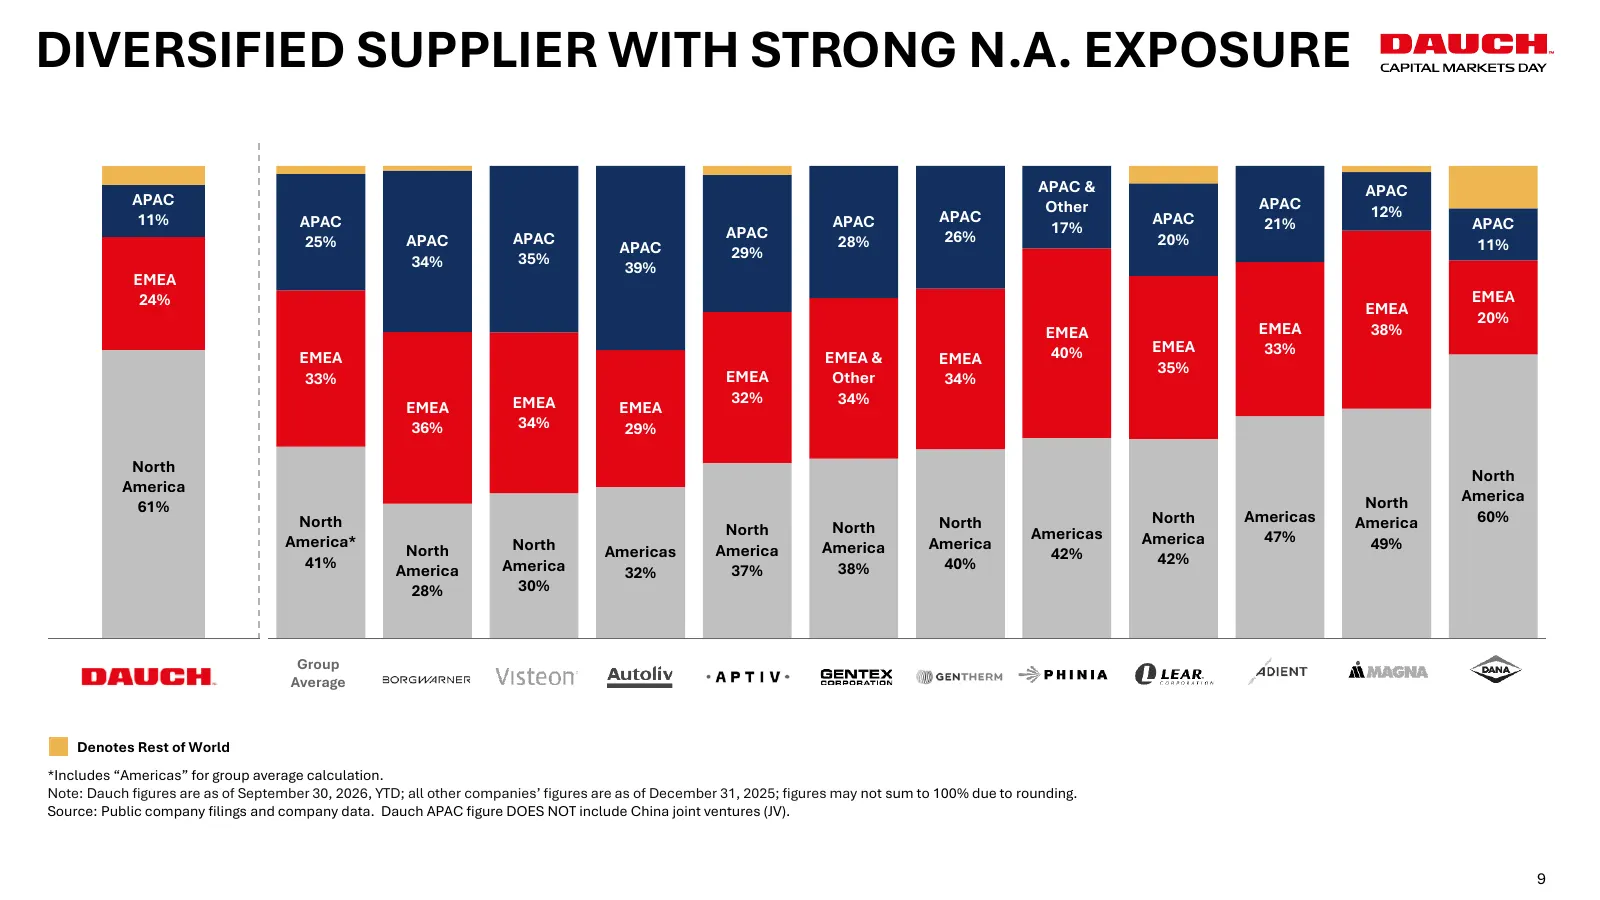
Slide 9: Diversified Supplier with Strong N.A. Exposure
DIVERSIFIED SUPPLIER WITH STRONG N.A. EXPOSURE ROW ROW ROW ROW ROW ROW 1% 2% 2% 3% 1% 9% APAC & APAC APAC Other APAC 11% APAC APAC 12% APAC APAC 17% 21% APAC APAC APAC APAC 26% 20% 25% APAC 28% 11% 34% 35% 29% 39% EMEA 24% EMEA EMEA 20% EMEA EMEA 38% 40% EMEA 33% EMEA EMEA & EMEA 35% 33% EMEA Other

Slide 10: Positioned Well for Market Trends
POSITIONED WELL FOR MARKET TRENDS 10 10
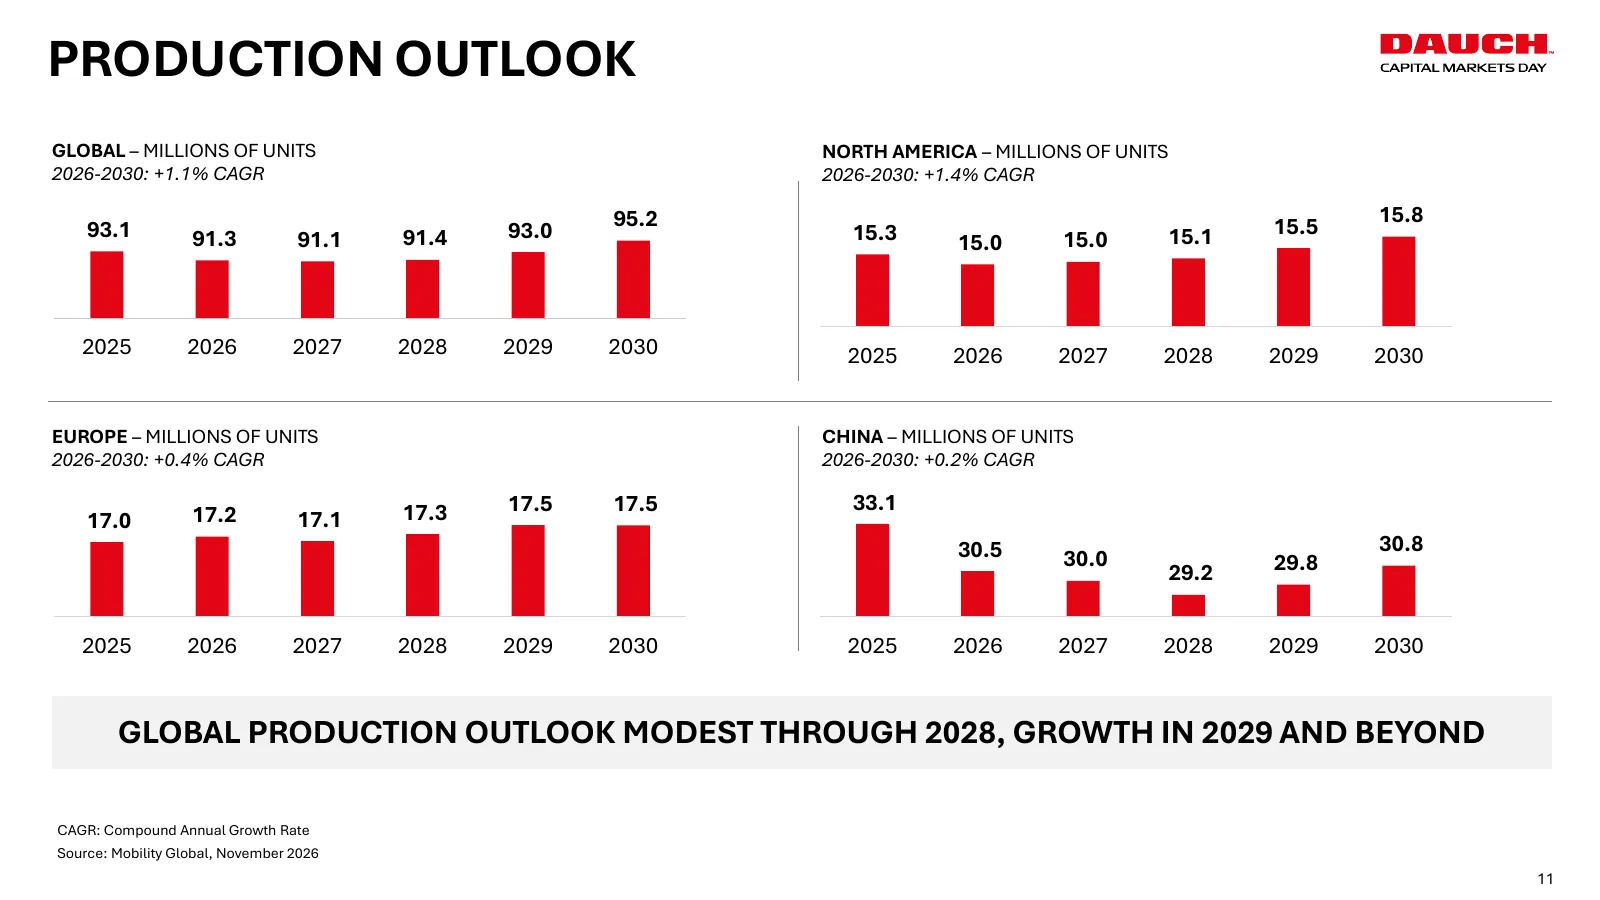
Slide 11: Production Outlook
PRODUCTION OUTLOOK GLOBAL – MILLIONS OF UNITS NORTH AMERICA – MILLIONS OF UNITS 2026-2030: +1.1% CAGR 2026-2030: +1.4% CAGR 95.2 15.5 15.8 93.1 91.3 91.1 91.4 93.0 15.3 15.0 15.1 15.0 2025 2026 2027 2028 2029 2030 2025 2026 2027 2028 2029 2030 EUROPE – MILLIONS OF UNITS CHINA – MILLIONS OF UNITS 202
Slide 12: Propulsion Outlook
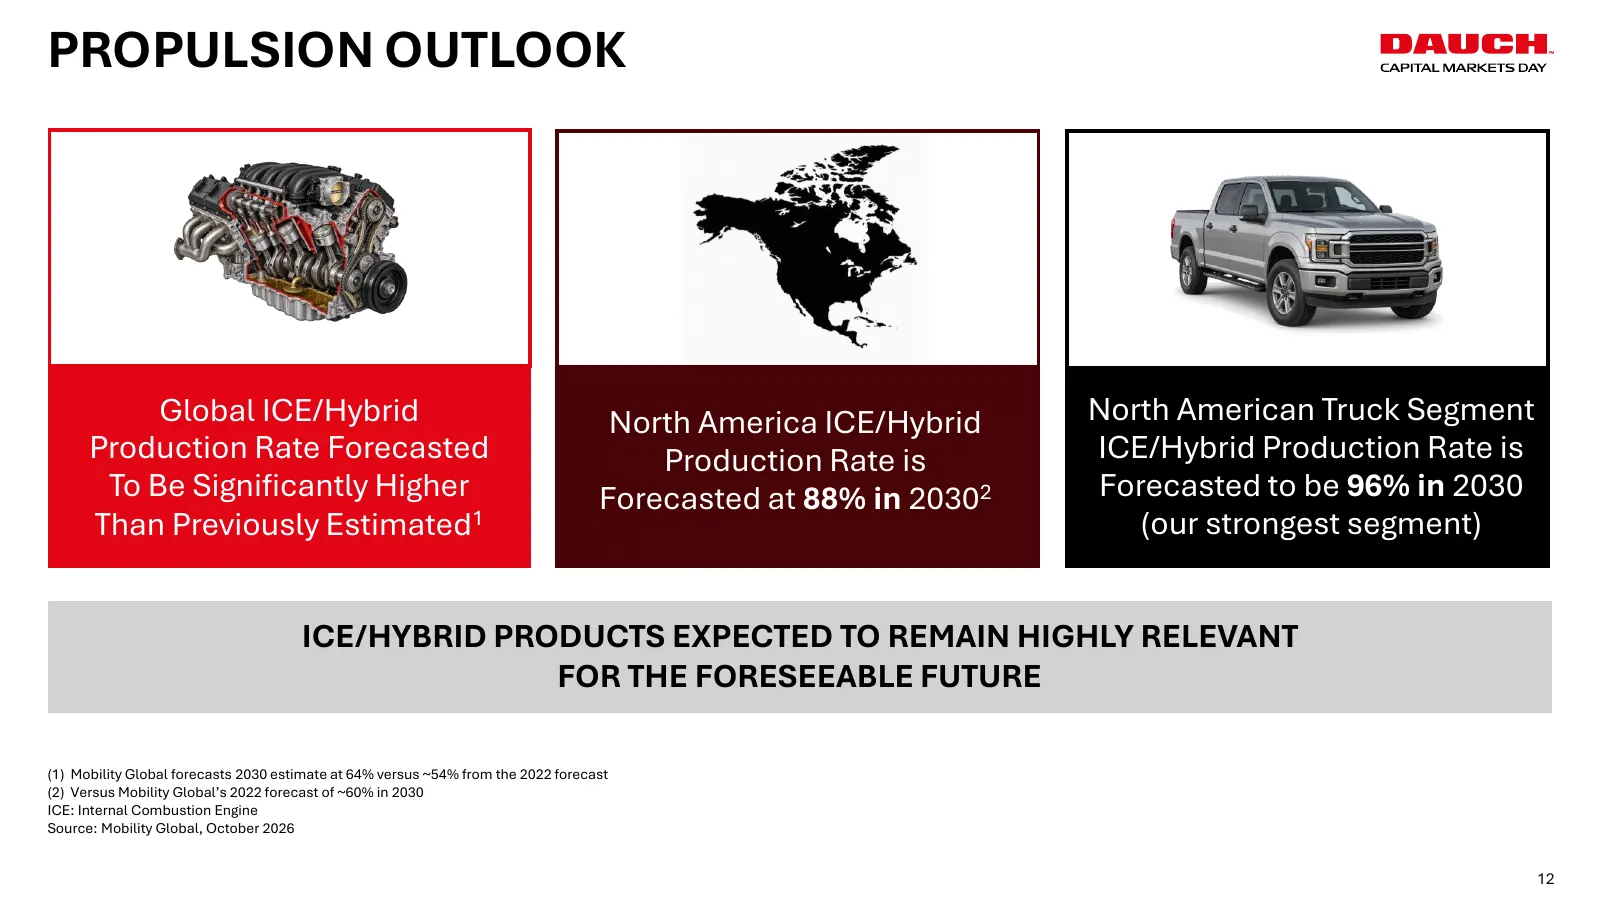
PROPULSION OUTLOOK Global ICE/Hybrid North America ICE/Hybrid North American Truck Segment Production Rate Forecasted Production Rate is ICE/Hybrid Production Rate is To Be Significantly Higher Forecasted at 88% in 20302 Forecasted to be 96% in 2030 Than Previously Estimated1 (our strongest segment)
Slide 13: Comprehensive Powertrain Agnostic Portfolio
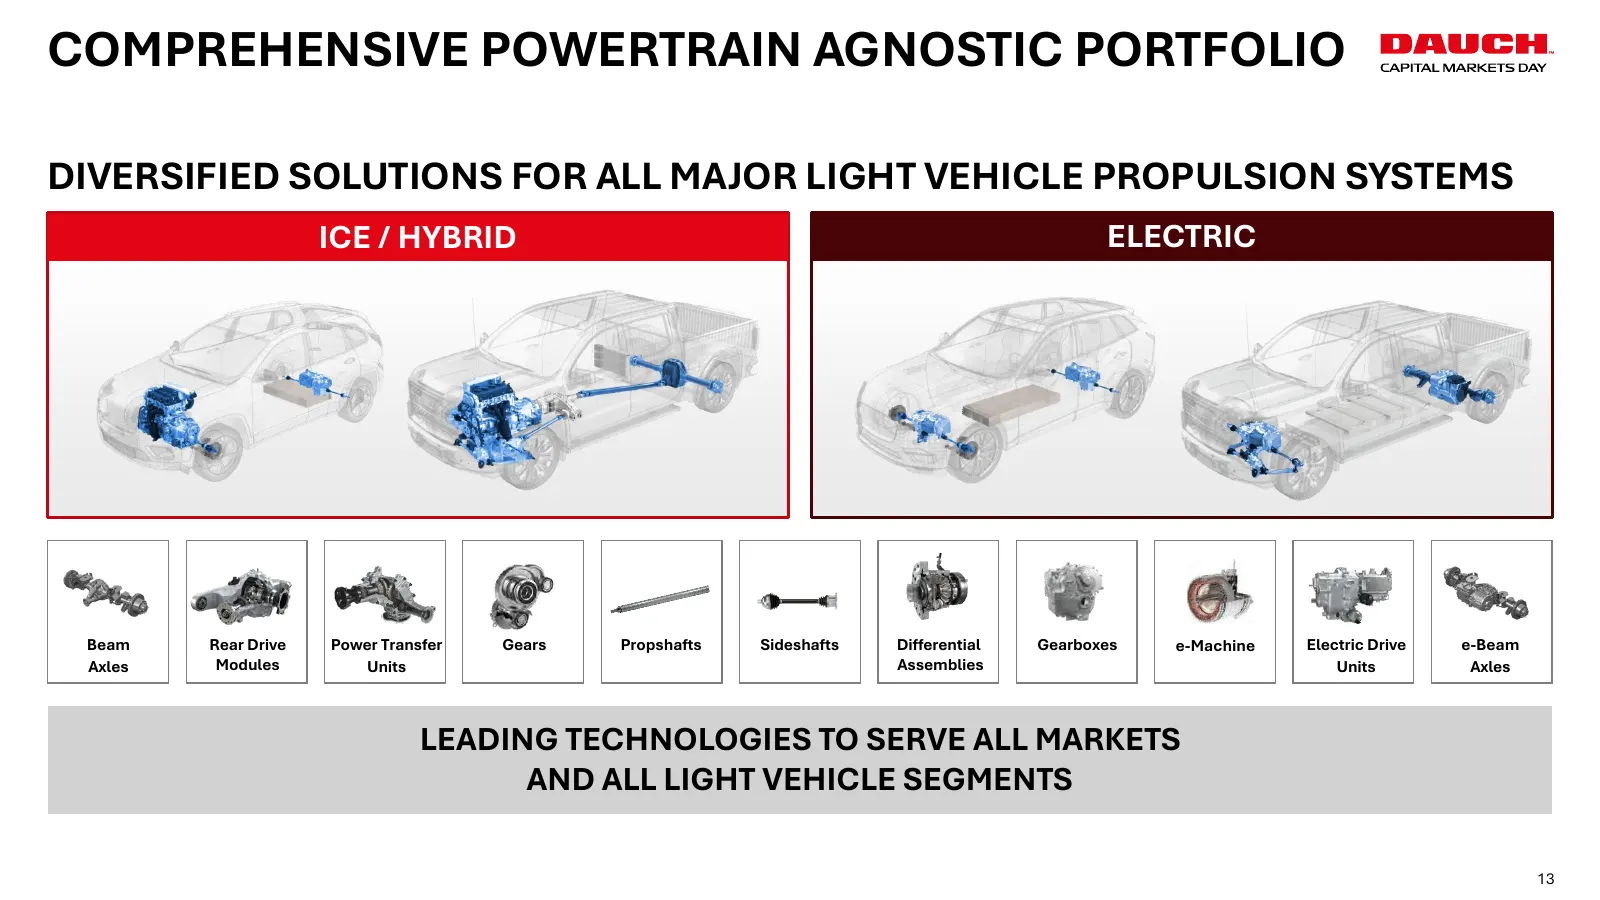
COMPREHENSIVE POWERTRAIN AGNOSTIC PORTFOLIO DIVERSIFIED SOLUTIONS FOR ALL MAJOR LIGHT VEHICLE PROPULSION SYSTEMS ICE / HYBRID ELECTRIC Beam Rear Drive Power Transfer Gears Propshafts Sideshafts Differential Gearboxes e-Machine Electric Drive e-Beam Axles Modules Units Assemblies Units Axles LEADING
Slide 14: Content Per Vehicle (CPV)
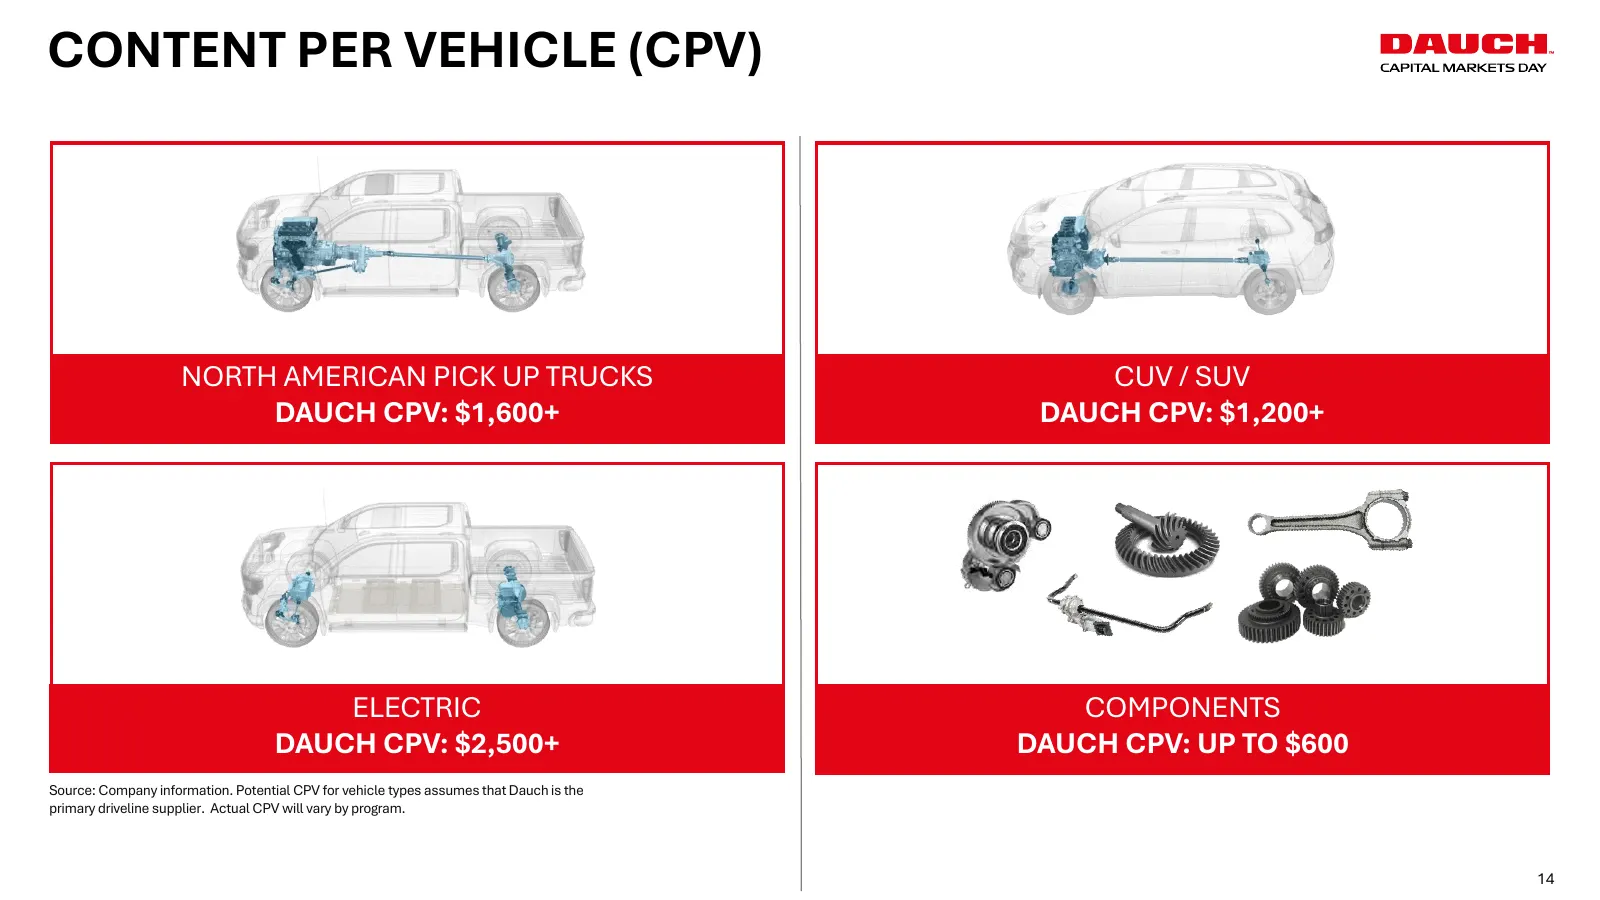
CONTENT PER VEHICLE (CPV) NORTH AMERICAN PICK UP TRUCKS CUV / SUV DAUCH CPV: $1,600+ DAUCH CPV: $1,200+ ELECTRIC COMPONENTS DAUCH CPV: $2,500+ DAUCH CPV: UP TO $600 Source: Company information. Potential CPV for vehicle types assumes that Dauch is the primary driveline supplier. Actual CPV will vary
Slide 15: Sideshafts
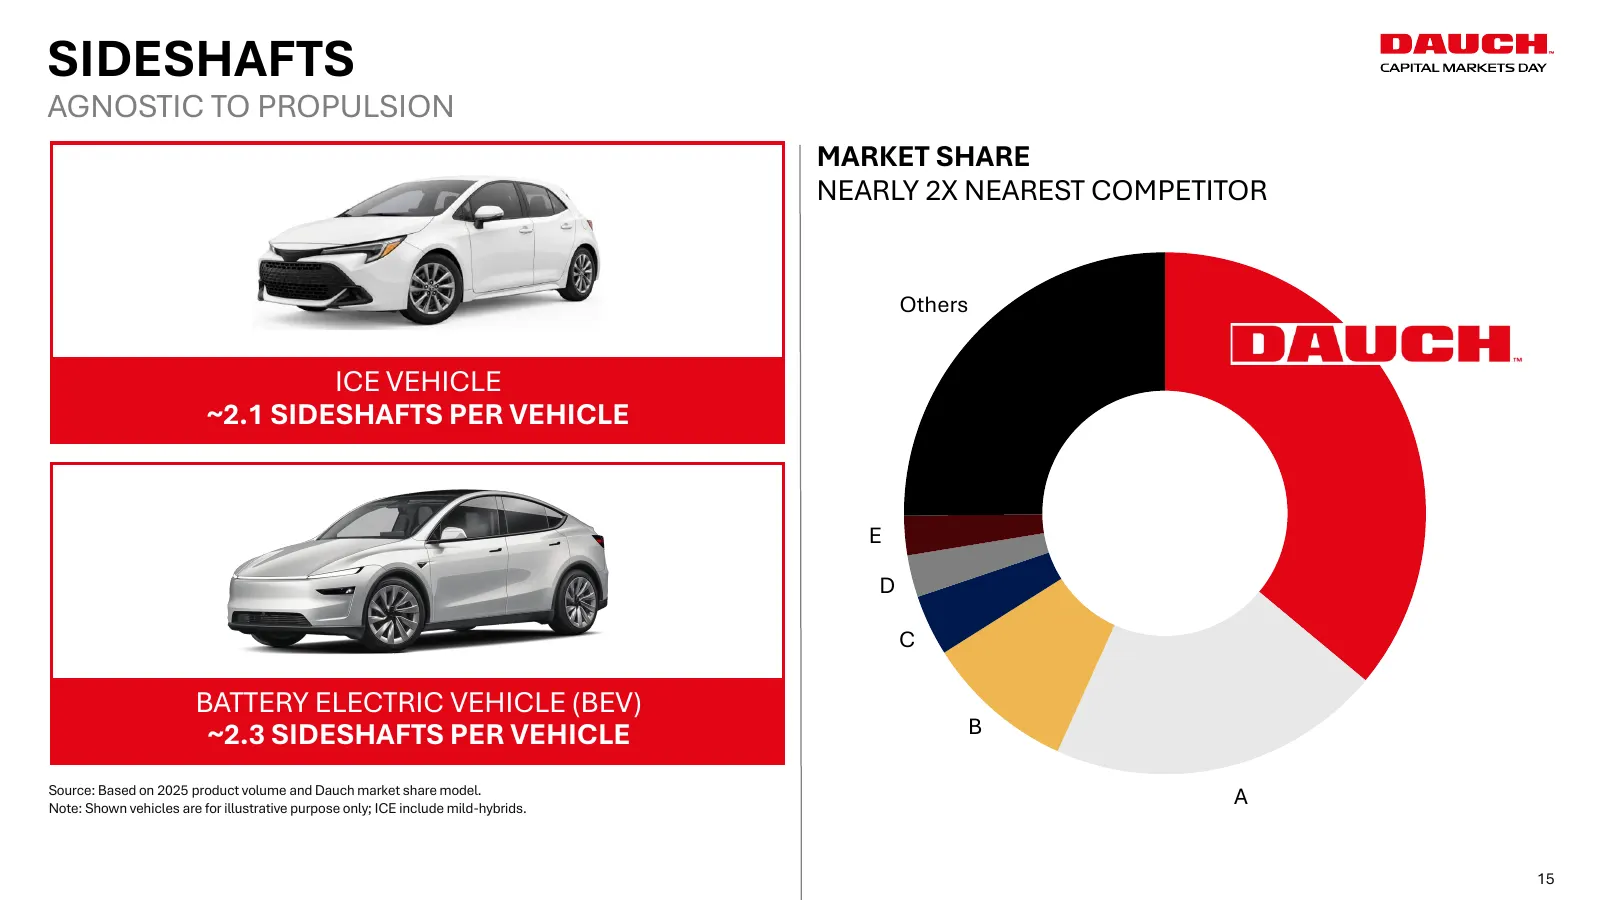
SIDESHAFTS AGNOSTIC TO PROPULSION MARKET SHARE NEARLY 2X NEAREST COMPETITOR Others ICE VEHICLE ~2.1 SIDESHAFTS PER VEHICLE E D C BATTERY ELECTRIC VEHICLE (BEV) ~2.3 SIDESHAFTS PER VEHICLE B Source: Based on 2025 product volume and Dauch market share model. Note: Shown vehicles are for illustrative p
Slide 16: Beam Axles
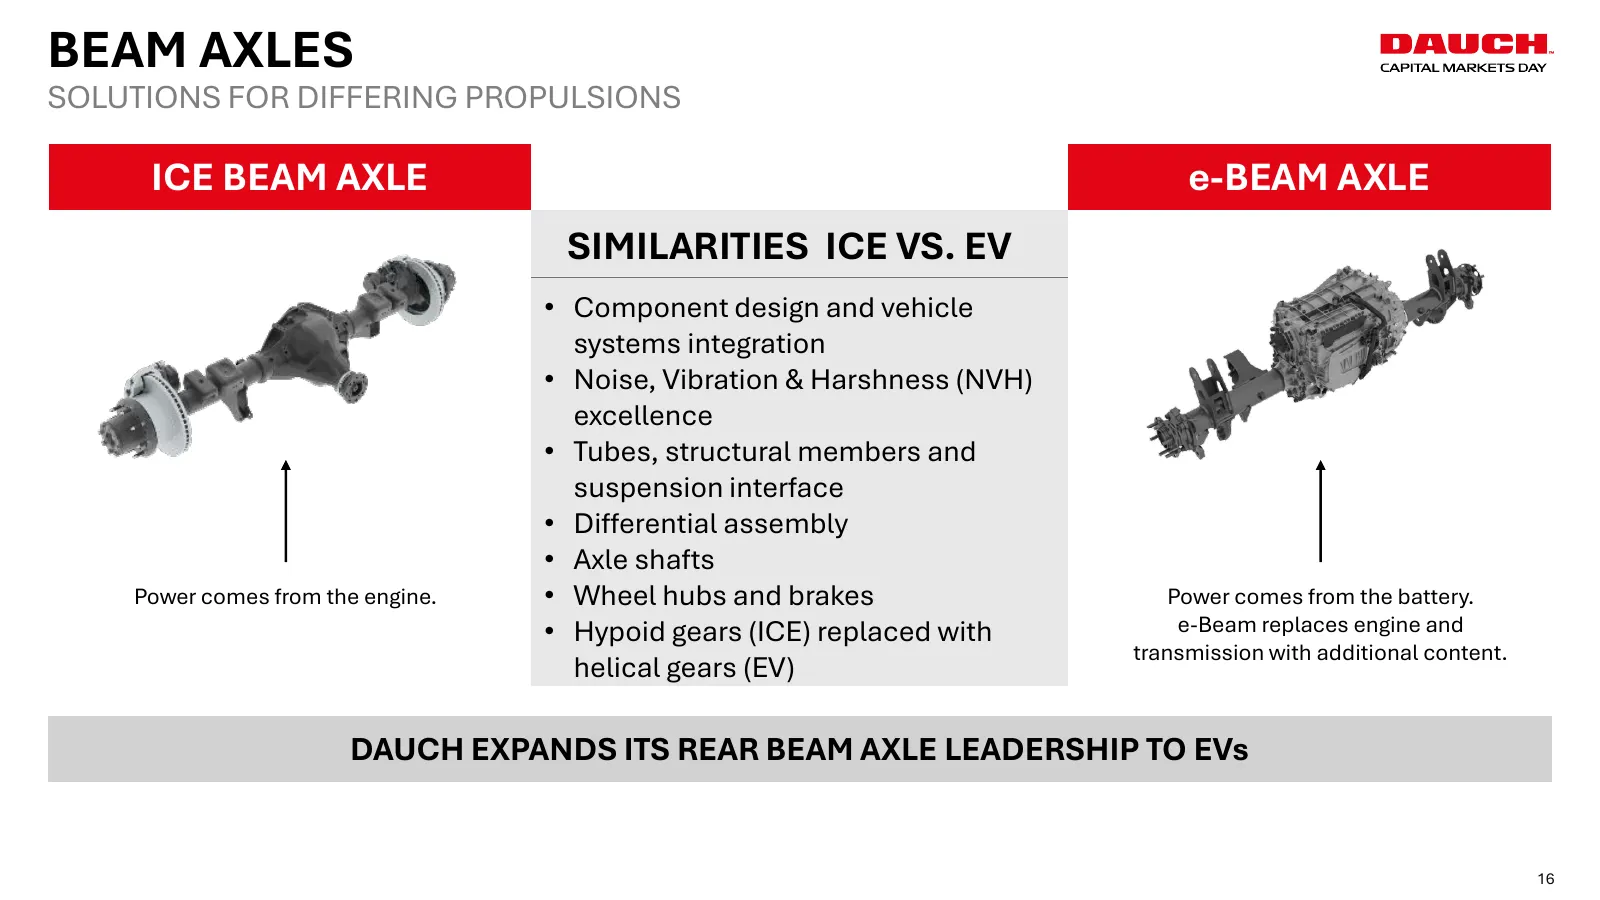
BEAM AXLES SOLUTIONS FOR DIFFERING PROPULSIONS ICE BEAM AXLE e-BEAM AXLE SIMILARITIES ICE VS. EV • Component design and vehicle systems integration • Noise, Vibration & Harshness (NVH) excellence • Tubes, structural members and suspension interface • Differential assembly • Axle shafts Power comes f
Slide 17: Dauch Awarded Key Electrification Program
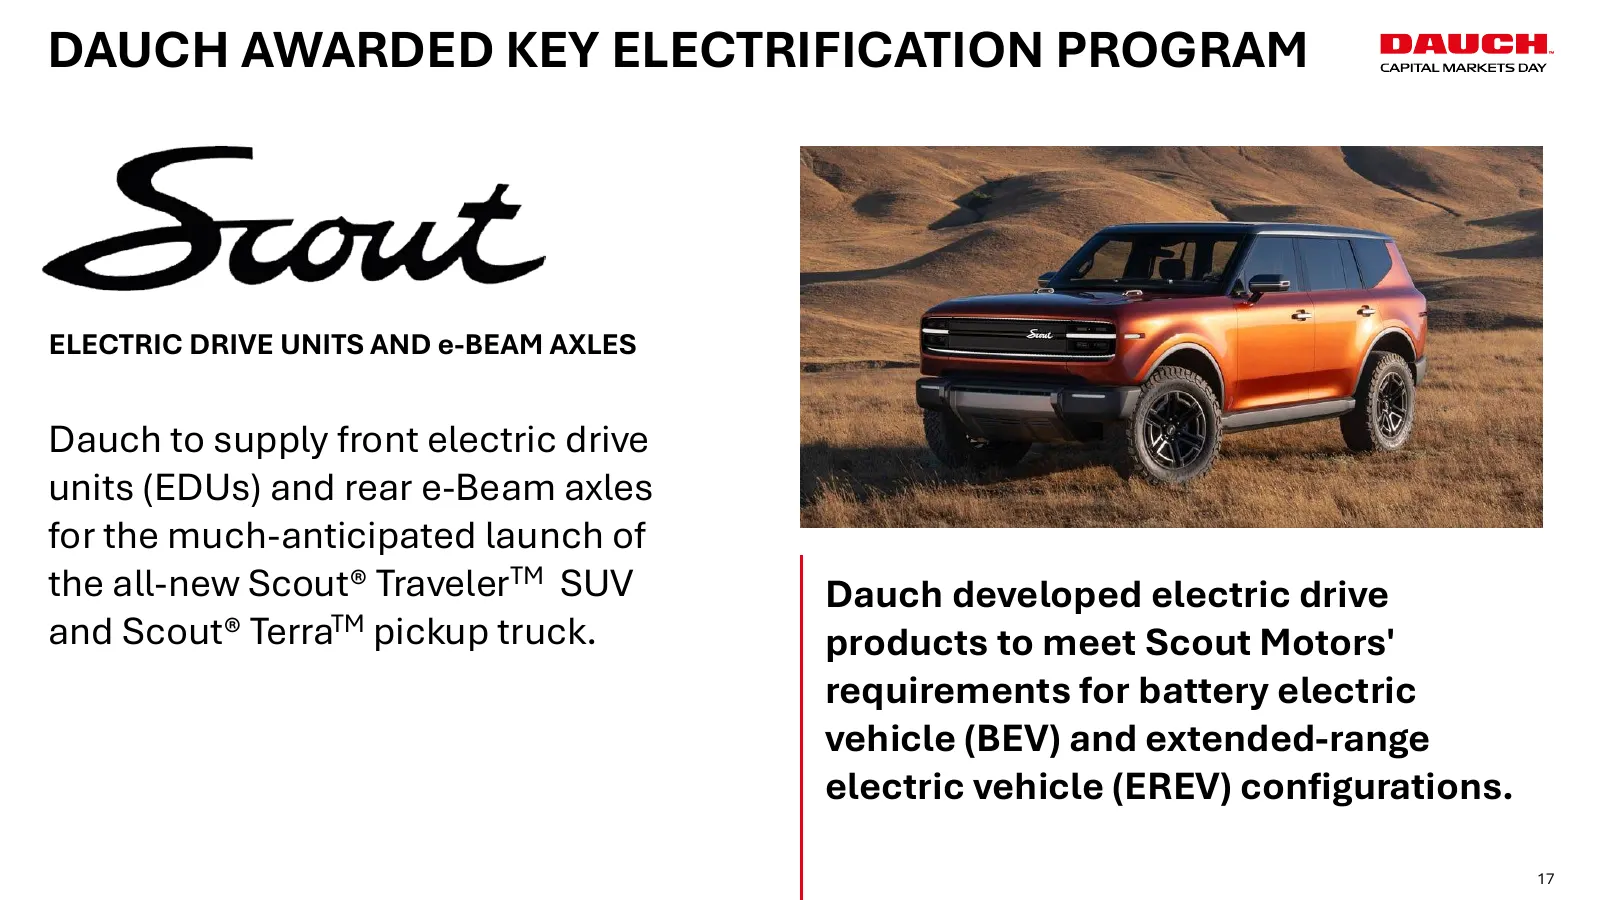
DAUCH AWARDED KEY ELECTRIFICATION PROGRAM ELECTRIC DRIVE UNITS AND e-BEAM AXLES Dauch to supply front electric drive units (EDUs) and rear e-Beam axles for the much-anticipated launch of the all-new Scout® TravelerTM SUV Dauch developed electric drive and Scout® TerraTM pickup truck. products to mee
Slide 18: Cross-Selling
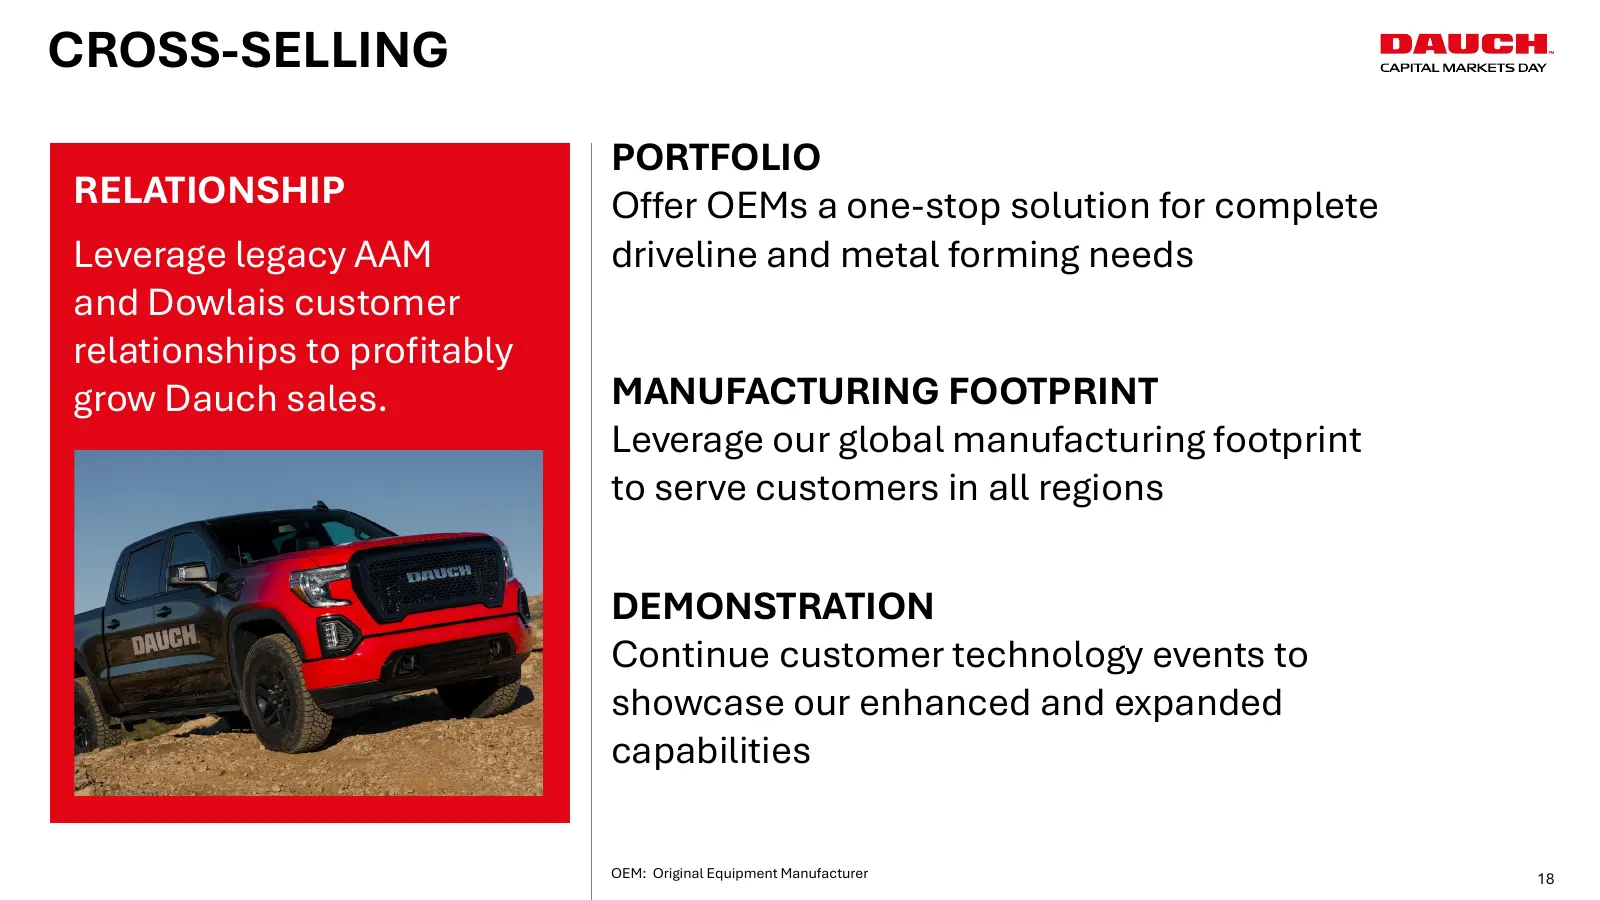
CROSS-SELLING PORTFOLIO RELATIONSHIP Offer OEMs a one-stop solution for complete Leverage legacy AAM driveline and metal forming needs and Dowlais customer relationships to profitably grow Dauch sales. MANUFACTURING FOOTPRINT Leverage our global manufacturing footprint to serve customers in all regi
Slide 19: New and Incremental Quoting Activity
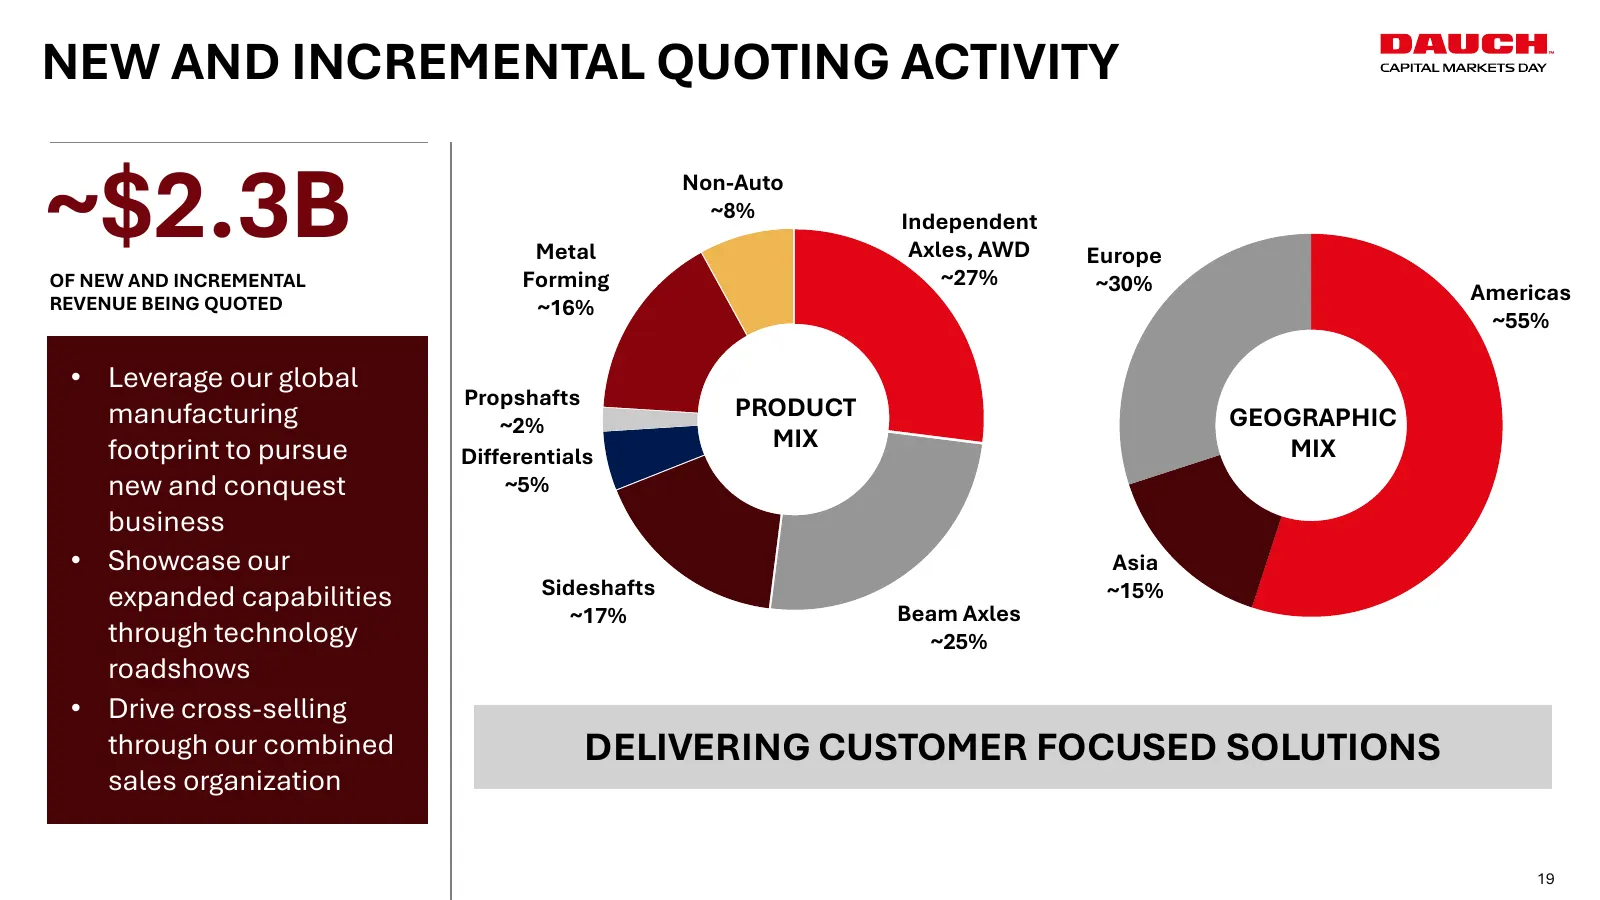
NEW AND INCREMENTAL QUOTING ACTIVITY ~$2.3B Metal Non-Auto ~8% Independent Axles, AWD ~27% Europe OF NEW AND INCREMENTAL Forming ~30% REVENUE BEING QUOTED Americas ~16% ~55% • Leverage our global Propshafts PRODUCT manufacturing ~2% GEOGRAPHIC footprint to pursue MIX MIX Differentials new and conque

Slide 20: Geographic Approach
DAUCH. CAPITAL MARKETS DAY GEOGRAPHIC APPROACH
Slide 21: Operating Approach in Key Markets
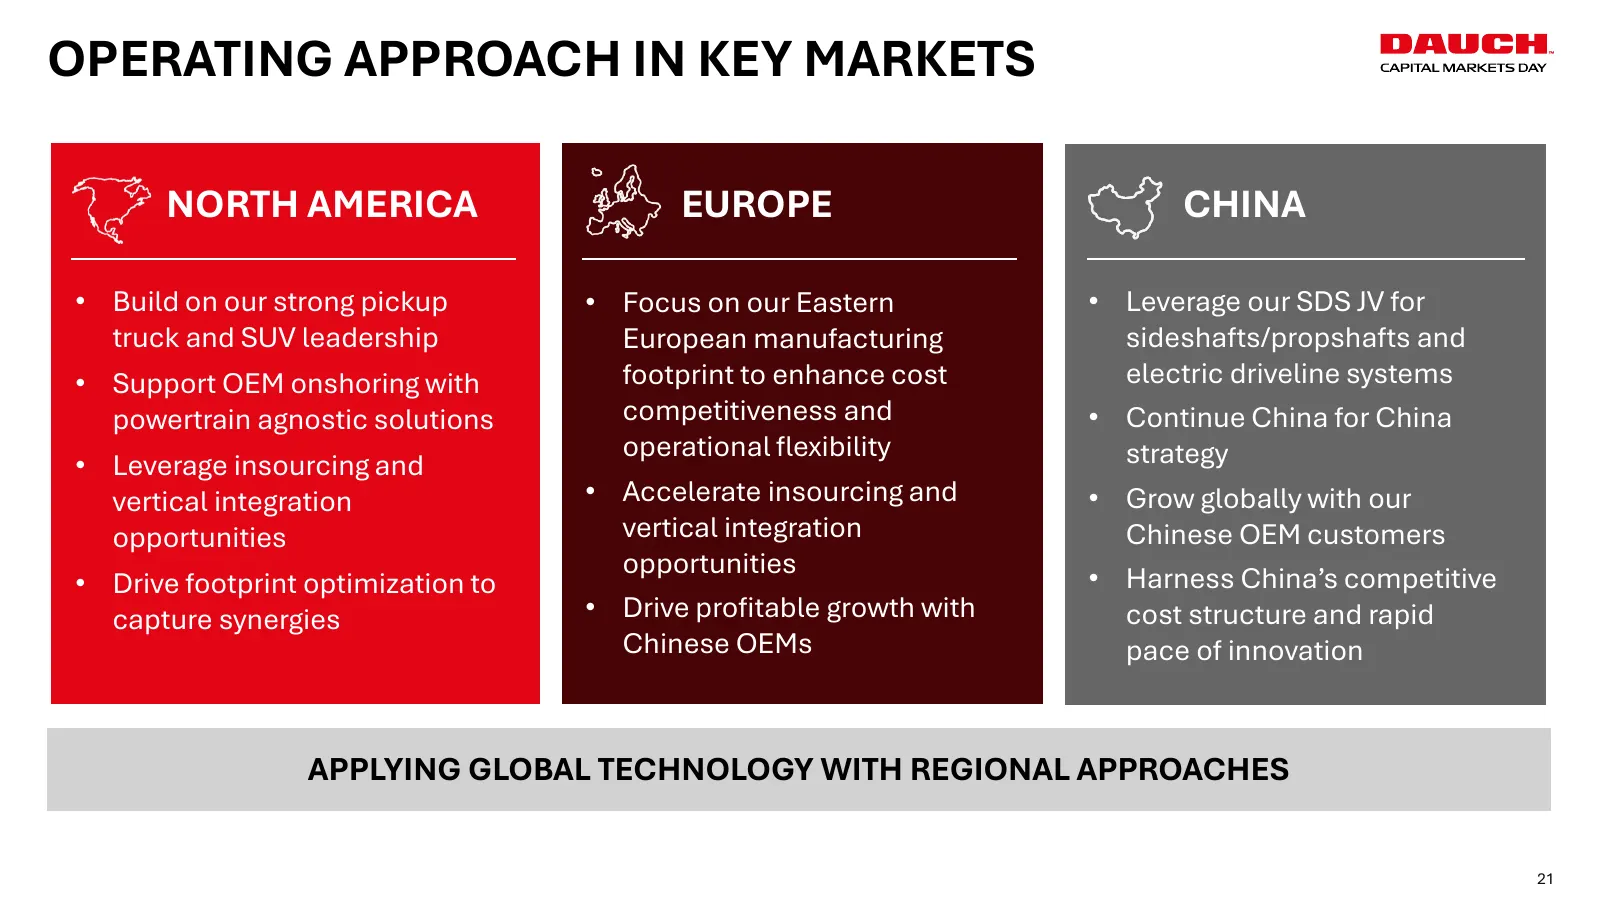
OPERATING APPROACH IN KEY MARKETS NORTH AMERICA EUROPE CHINA Build on our •• Footprint strong pickup optimization to •• Focus FocusononourourEastern Eastern • Leverage our SDS JV for truck and capture SUV leadership synergies European Europeanmanufacturing manufacturing sideshafts/propshafts and Sup

Slide 22: Outlook
DAUCH. CAPITAL MARKETS DAY OUTLOOK
Slide 23: Synergy Target Update
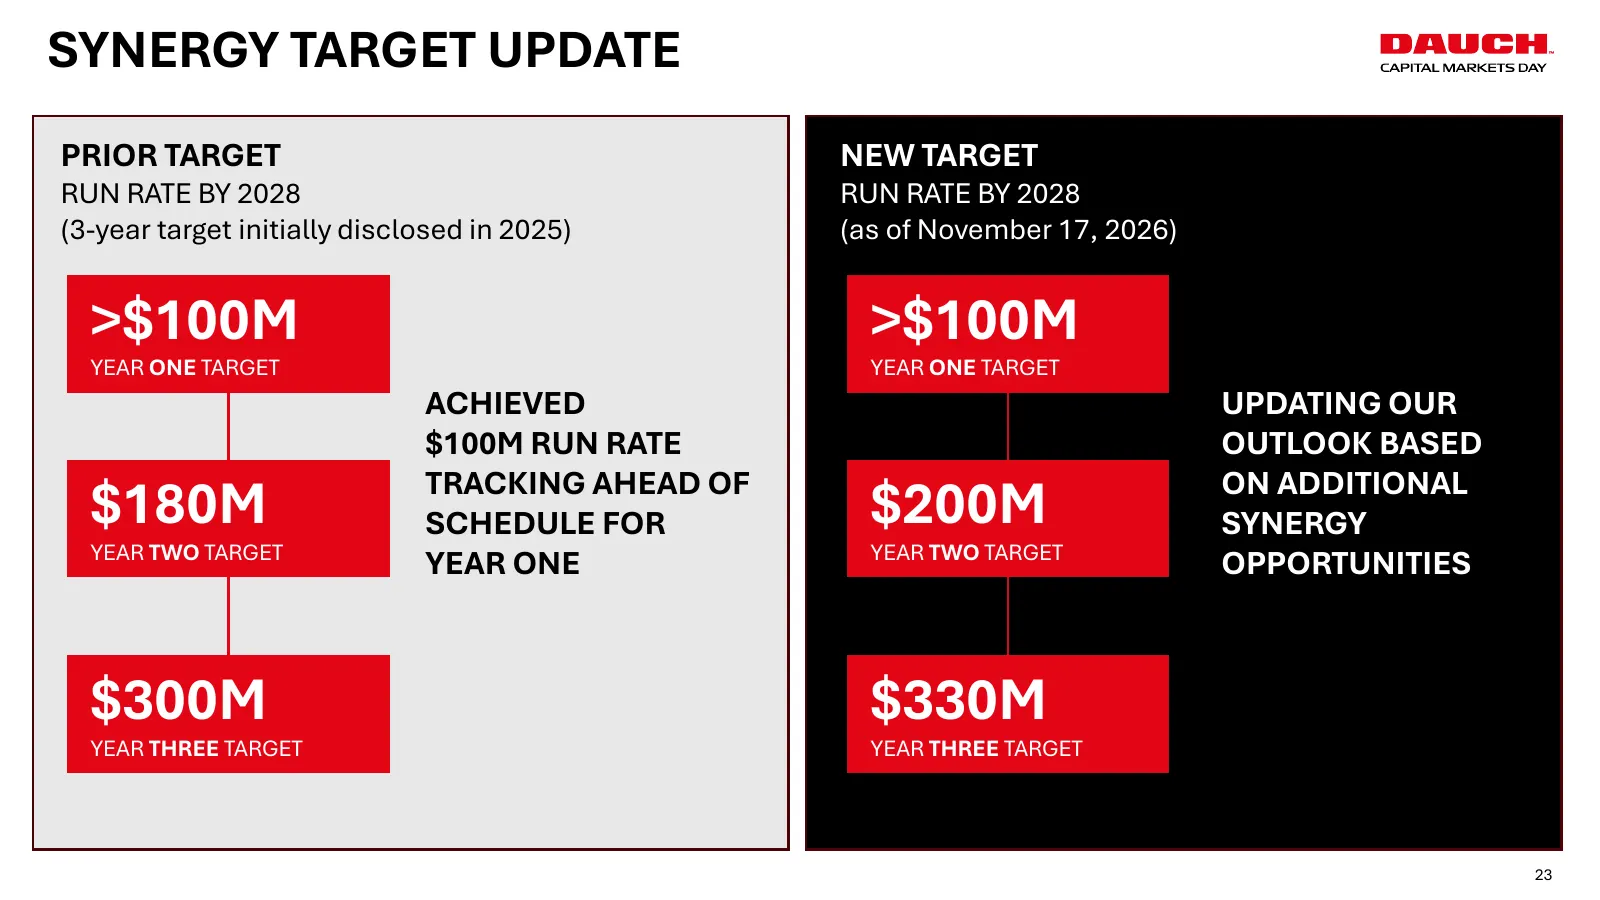
SYNERGY TARGET UPDATE PRIOR TARGET NEW TARGET RUN RATE BY 2028 RUN RATE BY 2028 (3-year target initially disclosed in 2025) (as of November 17, 2026) >$100M >$100M YEAR ONE TARGET YEAR ONE TARGET ACHIEVED UPDATING OUR $100M RUN RATE OUTLOOK BASED TRACKING AHEAD OF ON ADDITIONAL $180M SCHEDULE FOR $2
Slide 24: Financial Targets
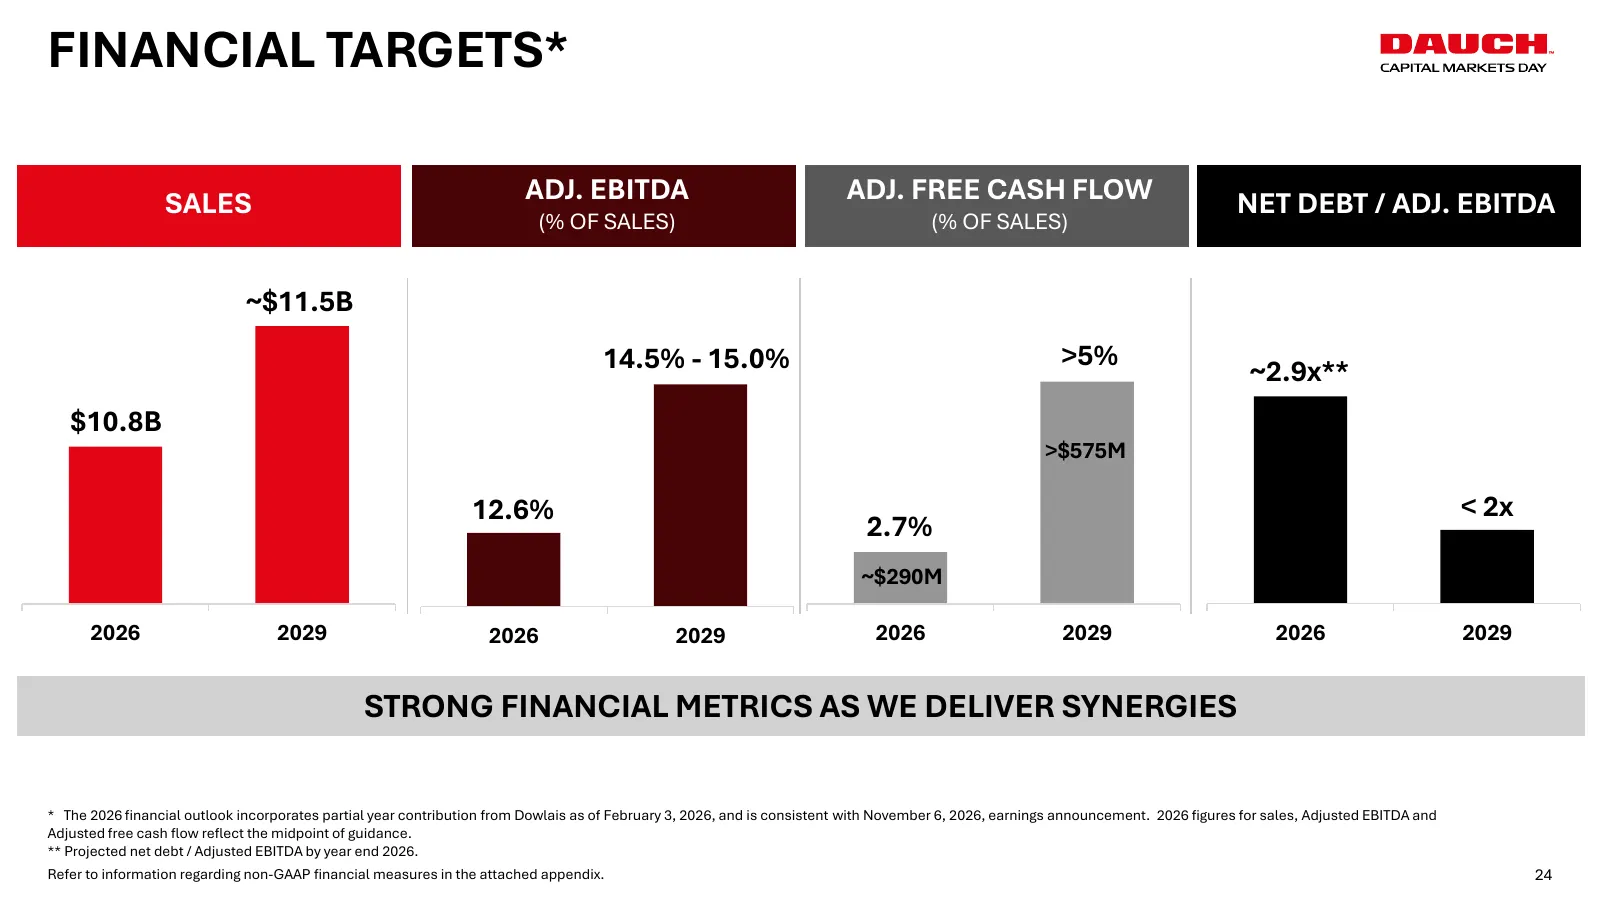
FINANCIAL TARGETS* SALES ADJ. EBITDA ADJ. FREE CASH FLOW NET DEBT / ADJ. EBITDA (% OF SALES) (% OF SALES) ~$11.5B 14.5% - 15.0% >5% ~2.9x** $10.8B >$575M 12.6% < 2x 2.7% ~$290M 2026 2029 2026 2029 2026 2029 2026 2029 STRONG FINANCIAL METRICS AS WE DELIVER SYNERGIES * The 2026 financial outlook incor
Slide 25: Unlocking Shareholder Value
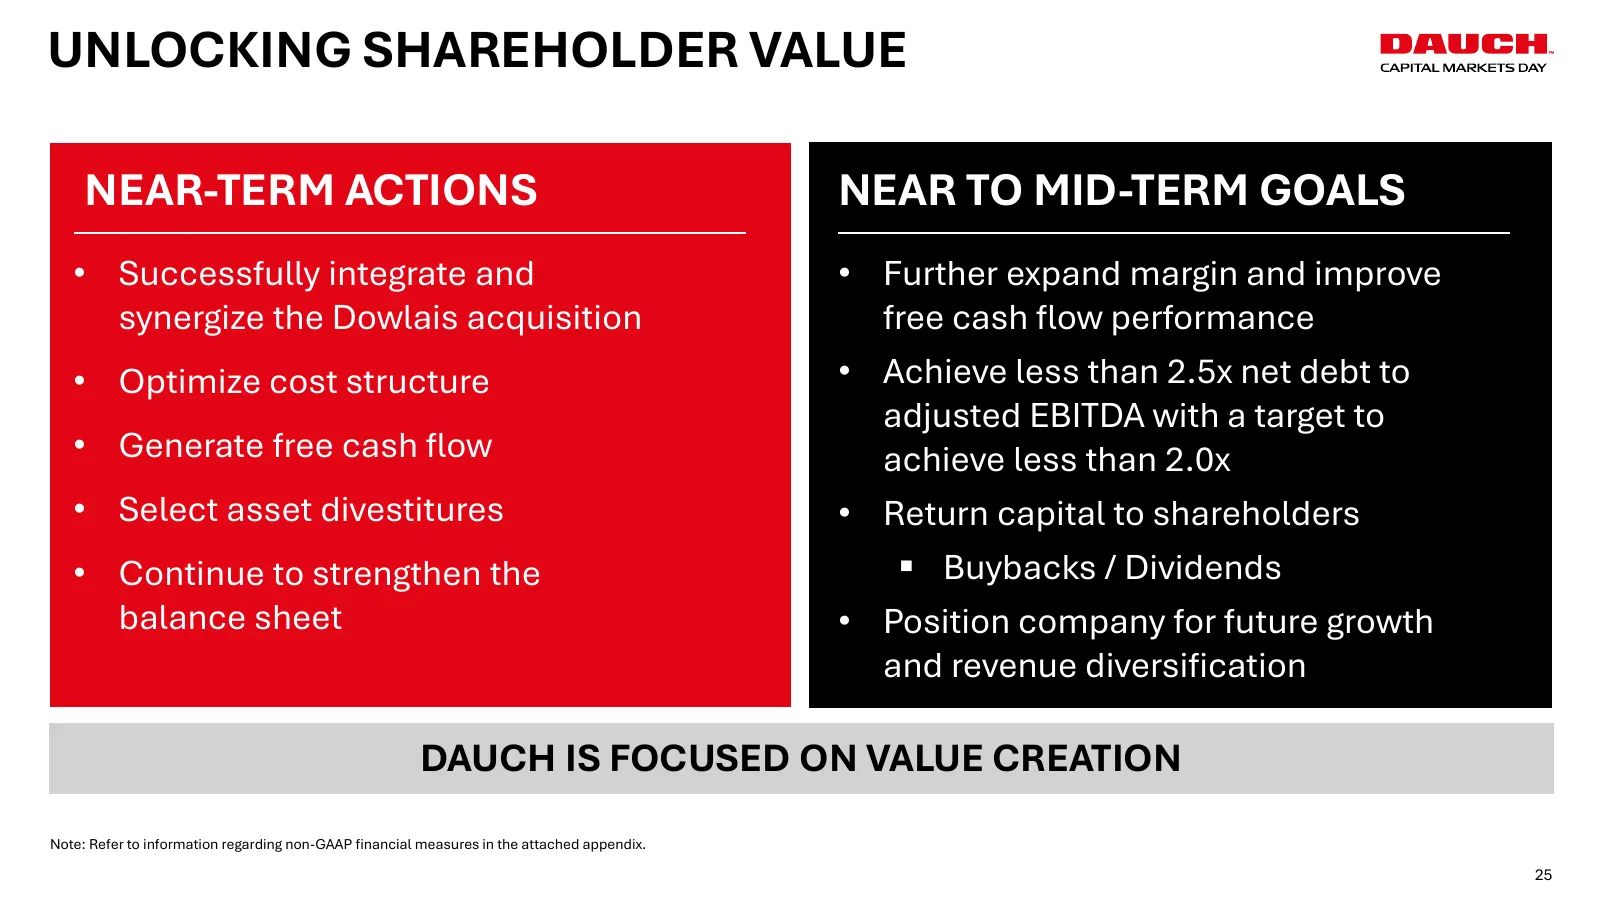
UNLOCKING SHAREHOLDER VALUE NEAR-TERM ACTIONS NEAR TO MID-TERM GOALS • Successfully integrate and • Further expand margin and improve synergize the Dowlais acquisition free cash flow performance • Optimize cost structure • Achieve less than 2.5x net debt to adjusted EBITDA with a target to • Generat
Slide 26: Matt Girlando
MATT GIRLANDO VICE-PRESIDENT, STRATEGY & BUSINESS DEVELOPMENT 26 26
Slide 27: Agenda
AGENDA 01 INTEGRATION STATUS 02 CHINA OVERVIEW 03 DIVERSIFICATION 04 KEY TAKEAWAYS 27

Slide 28: Integration Status
INTEGRATION pAUCH STATUS
Slide 29: Integration Status
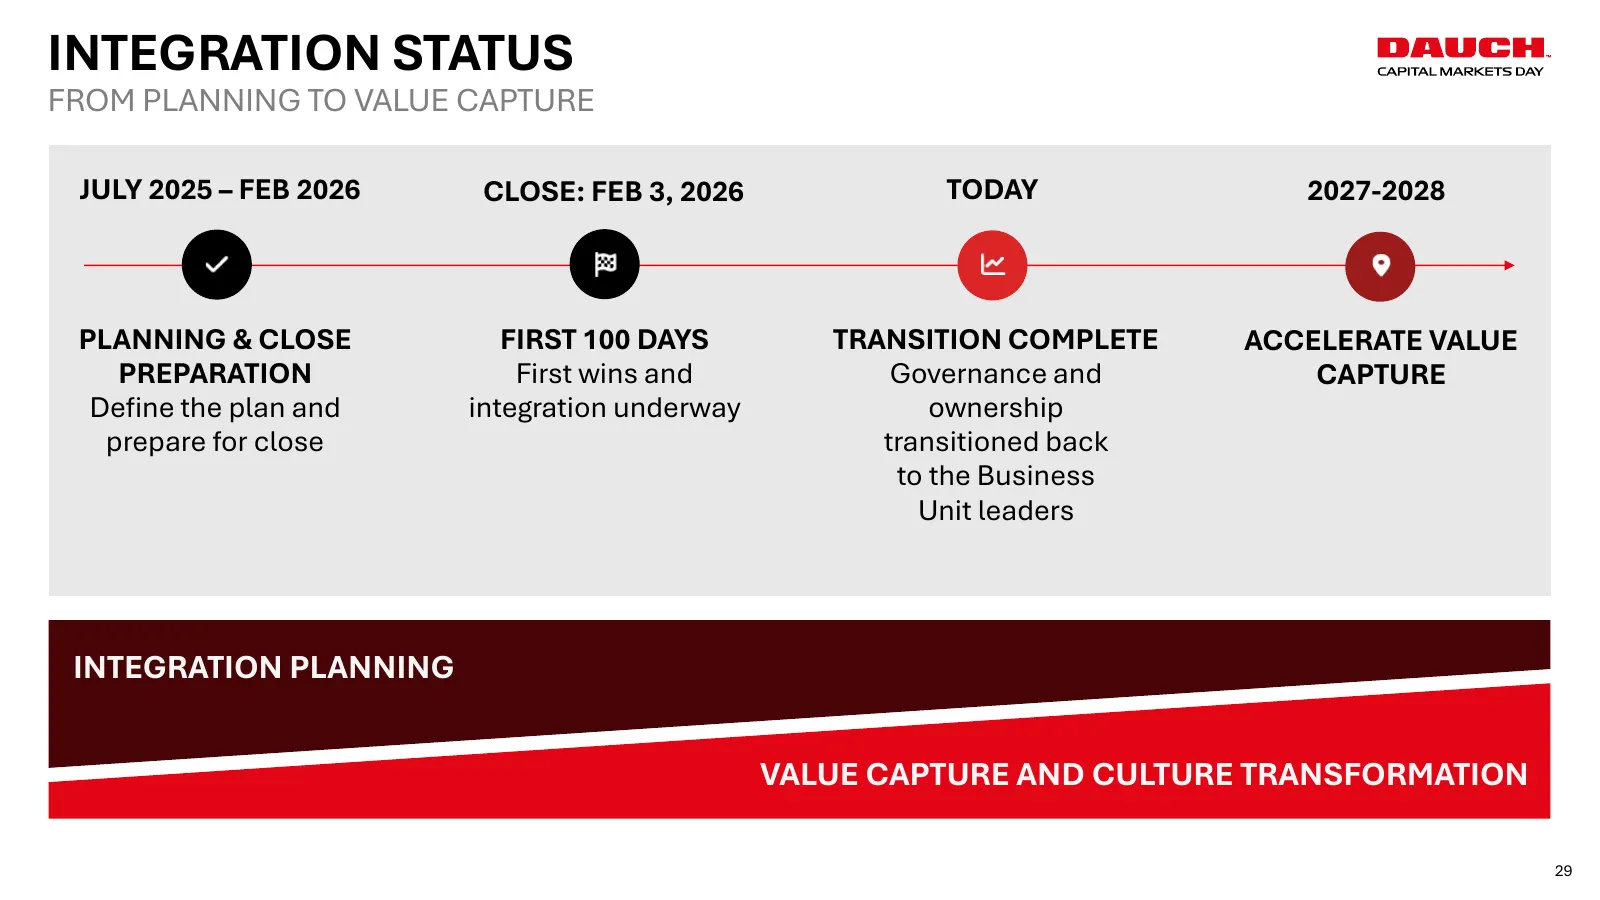
INTEGRATION STATUS FROM PLANNING TO VALUE CAPTURE JULY 2025 – FEB 2026 CLOSE: FEB 3, 2026 TODAY 2027-2028 PLANNING & CLOSE FIRST 100 DAYS TRANSITION COMPLETE ACCELERATE VALUE PREPARATION First wins and Governance and CAPTURE Define the plan and integration underway ownership prepare for close transi
Slide 30: Updated Synergy Allocation
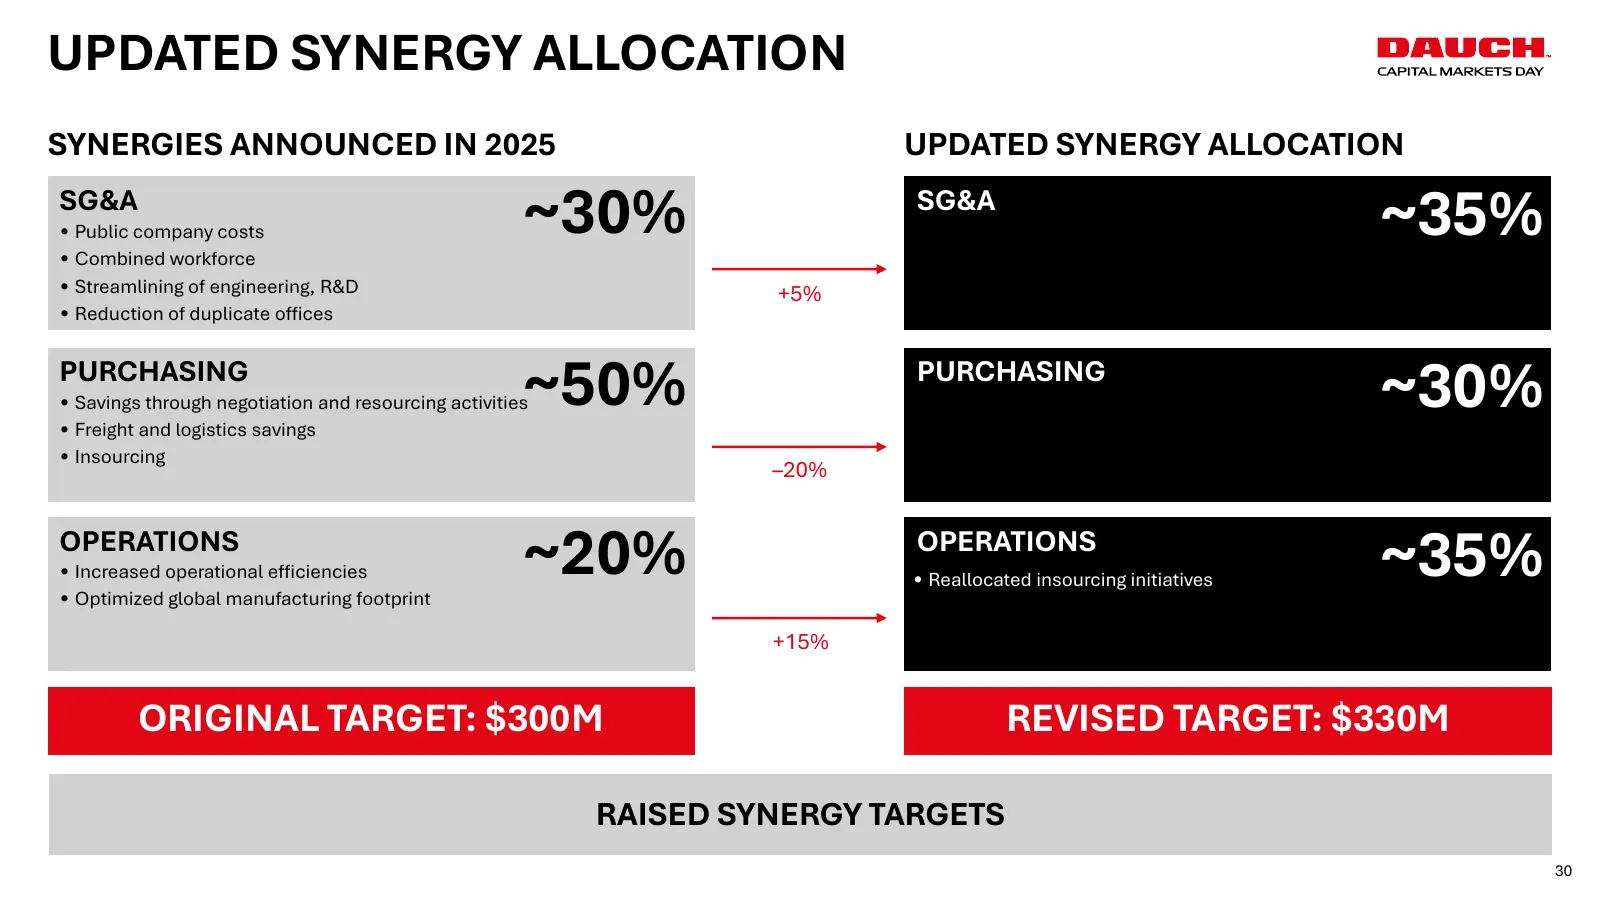
UPDATED SYNERGY ALLOCATION SYNERGIES ANNOUNCED IN 2025 UPDATED SYNERGY ALLOCATION SG&A • Public company costs • Combined workforce ~30% SG&A ~35% • Streamlining of engineering, R&D +5% • Reduction of duplicate offices PURCHASING ~50% • Savings through negotiation and resourcing activities • Freight
Slide 31: Path to Synergy Target
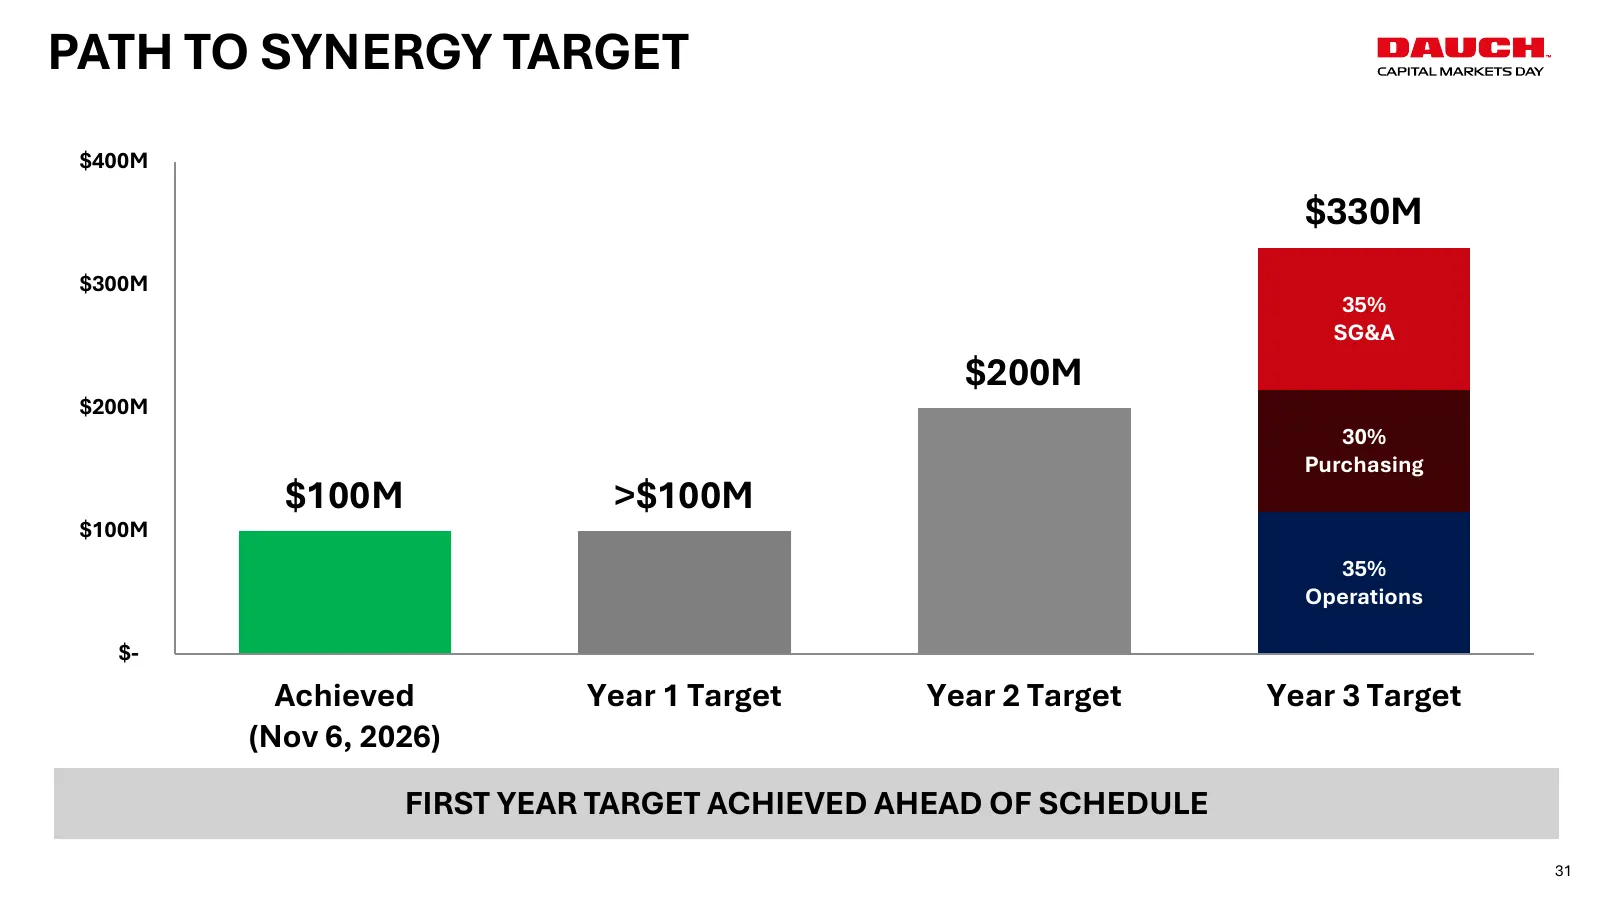
PATH TO SYNERGY TARGET $400M $330M $300M 35% SG&A $200M $200M 30% Purchasing $100M >$100M $100M 35% Operations $- Achieved Year 1 Target Year 2 Target Year 3 Target (Nov 6, 2026) FIRST YEAR TARGET ACHIEVED AHEAD OF SCHEDULE 31

Slide 32: China Overview
CHINA OVERVIEW 32
Slide 33: China Overview – Total Dauch
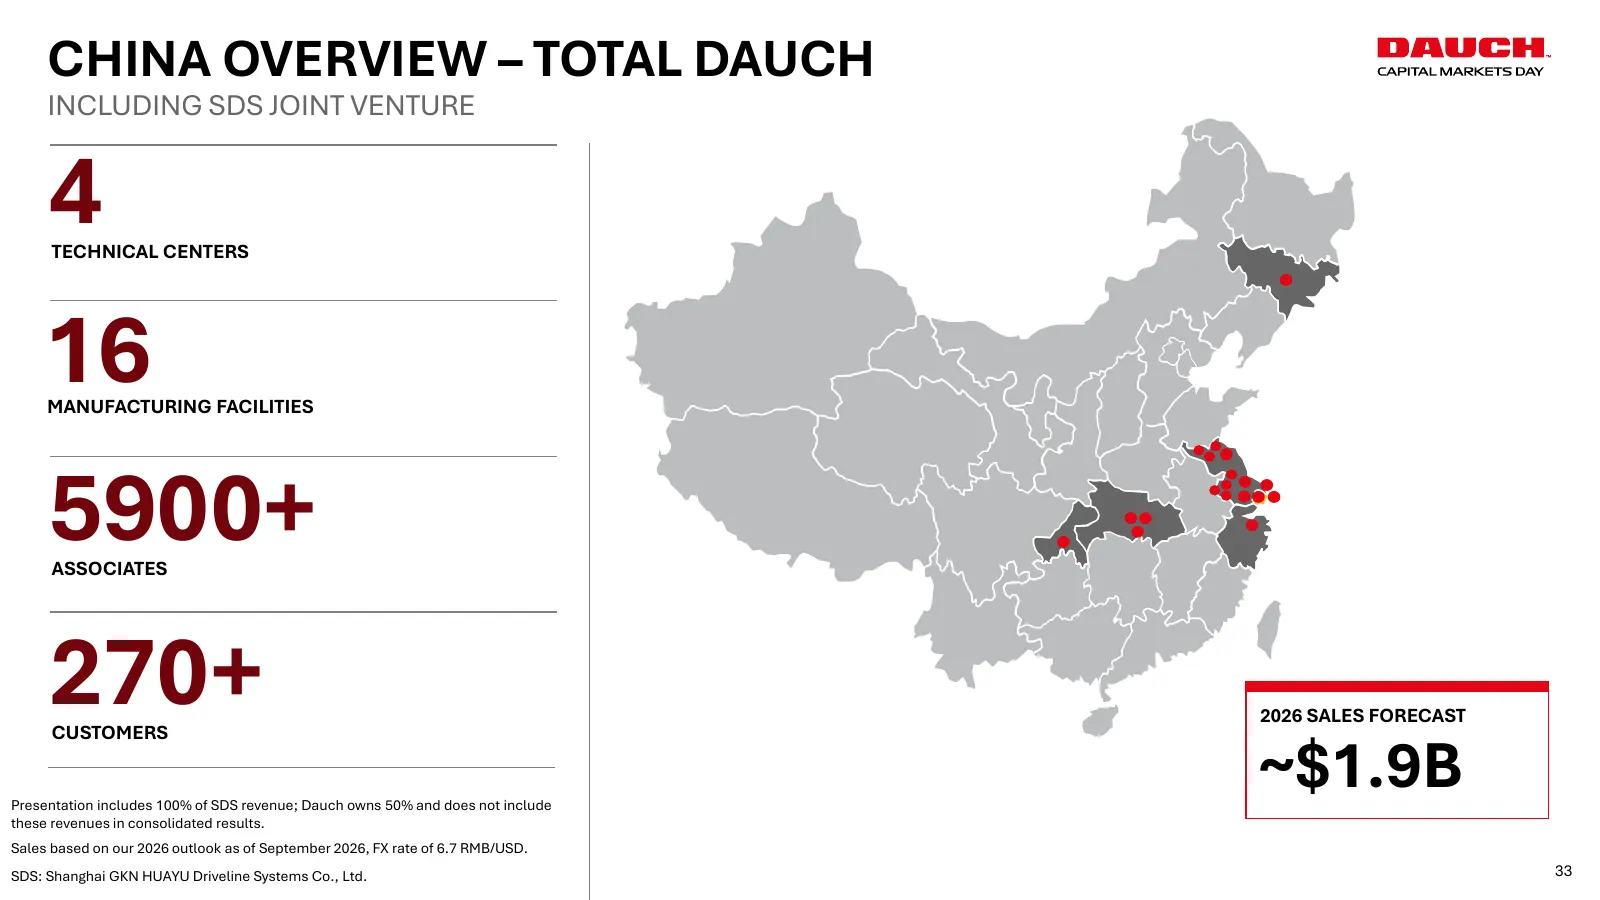
CHINA OVERVIEW – TOTAL DAUCH INCLUDING SDS JOINT VENTURE 4TECHNICAL CENTERS 16 MANUFACTURING FACILITIES 5900+ ASSOCIATES 270+ CUSTOMERS 2026 SALES FORECAST Presentation includes 100% of SDS revenue; Dauch owns 50% and does not include ~$1.9B these revenues in consolidated results. Sales based on our
Slide 34: China Sales Overview – Total Dauch
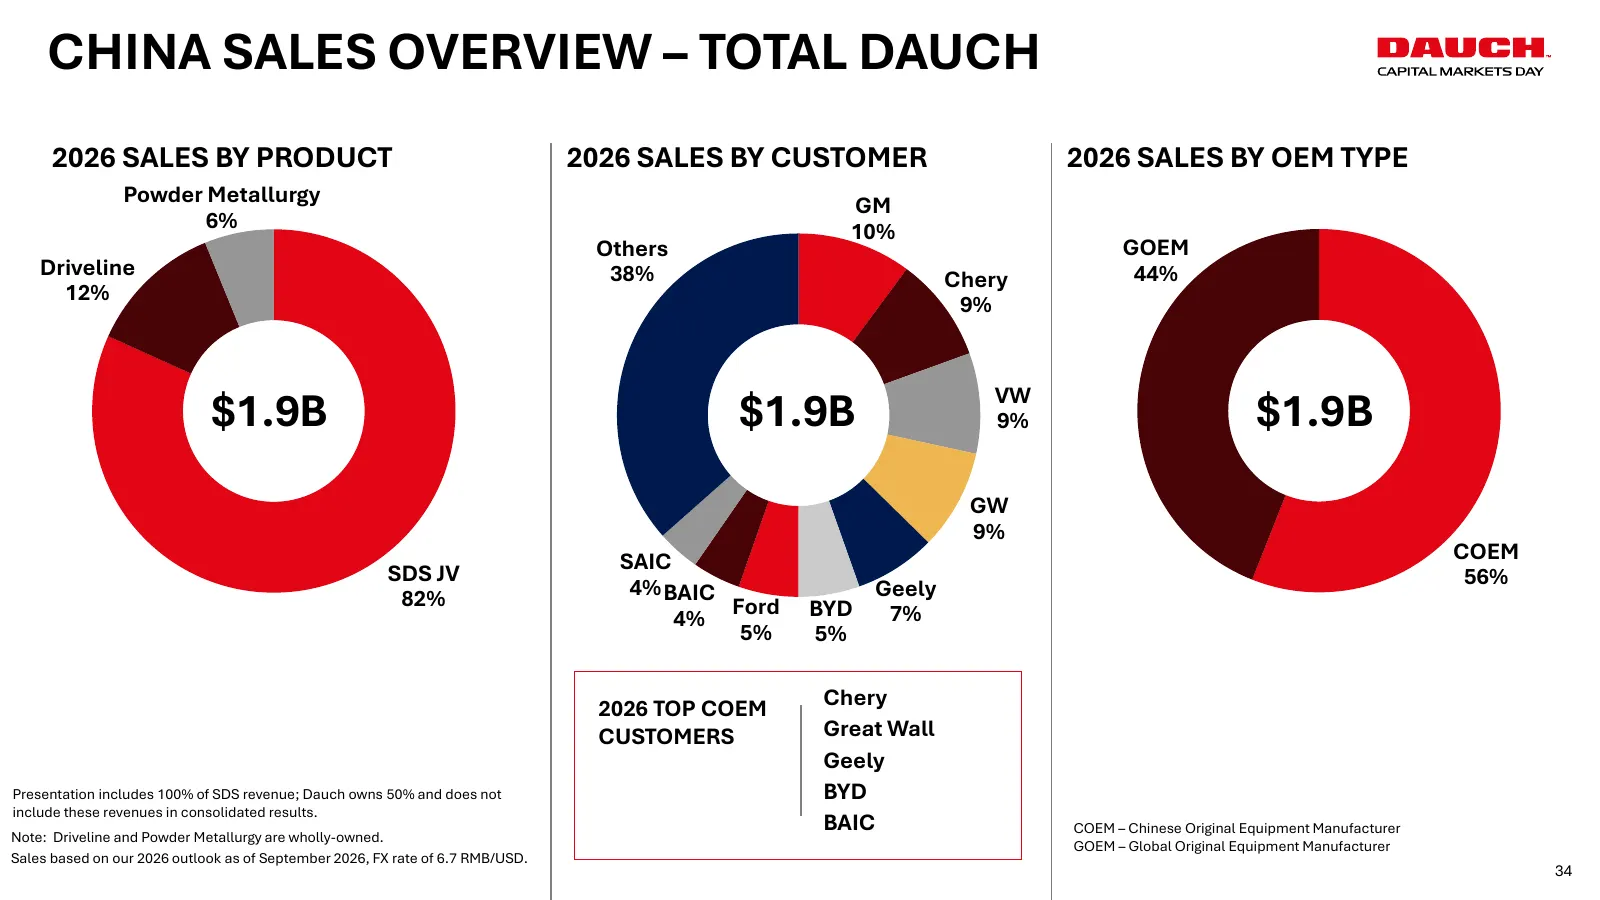
CHINA SALES OVERVIEW – TOTAL DAUCH 2026 SALES BY PRODUCT 2026 SALES BY CUSTOMER 2026 SALES BY OEM TYPE Powder Metallurgy GM 6% 10% Others GOEM Driveline 38% 44% Chery 12% 9% VW $1.9B $1.9B 9% $1.9B GW 9% SAIC COEM SDS JV 56% 82% 4% BAIC Geely 4% Ford BYD 7% 5% 5% 2026 TOP COEM Chery CUSTOMERS Great
Slide 35: China Sales Overview – SDS JV
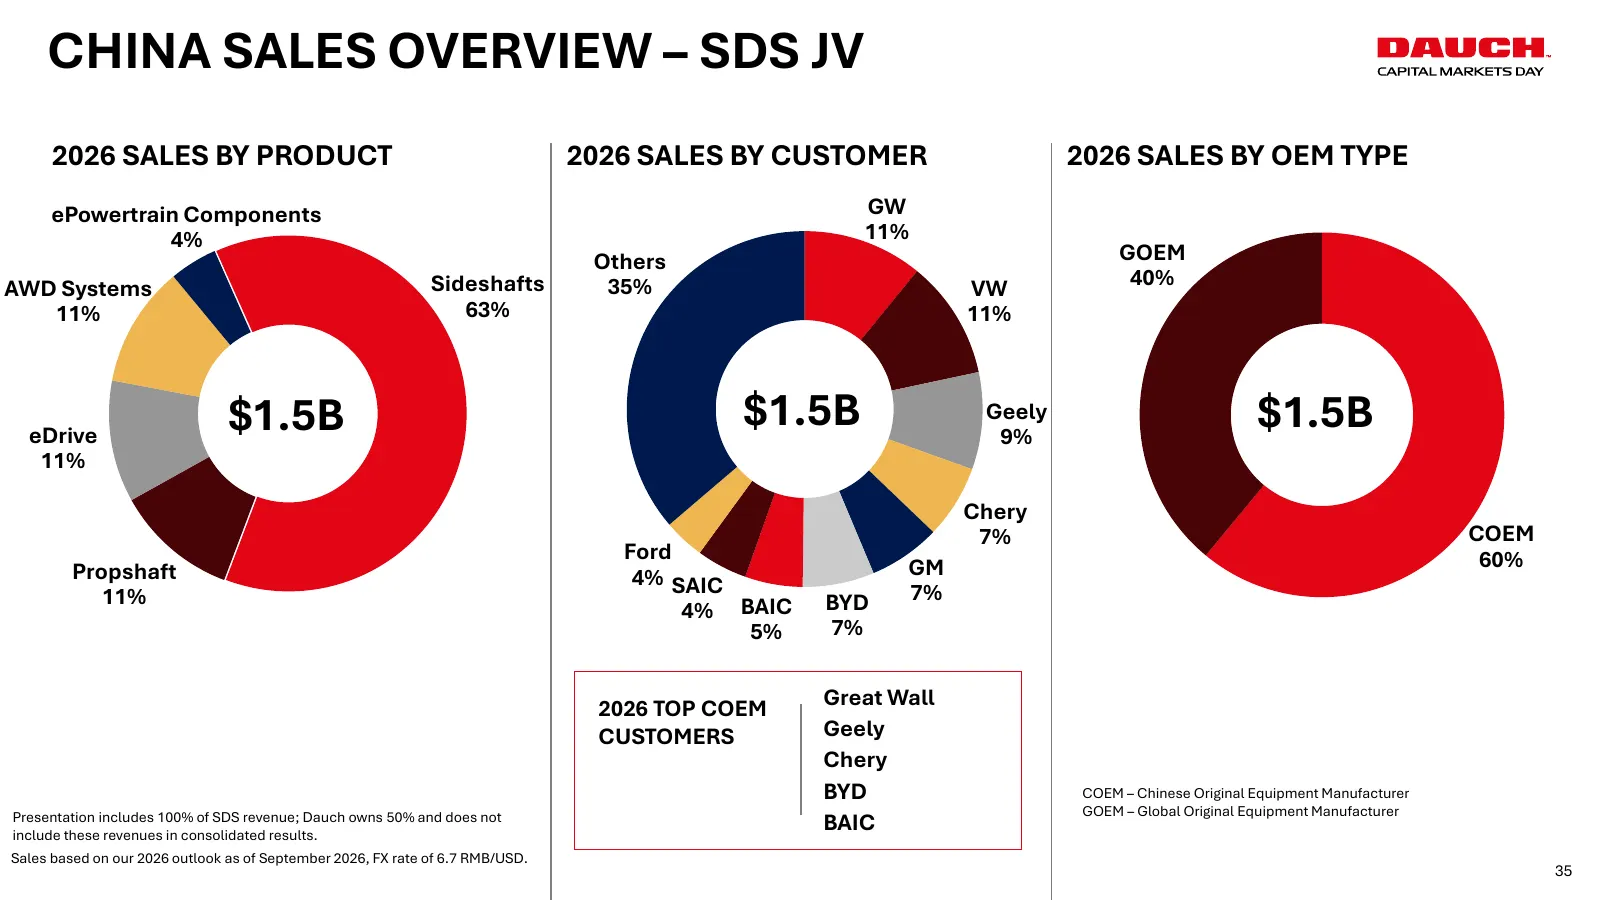
CHINA SALES OVERVIEW – SDS JV 2026 SALES BY PRODUCT 2026 SALES BY CUSTOMER 2026 SALES BY OEM TYPE ePowertrain Components GW 4% 11% Others GOEM AWD Systems Sideshafts 35% VW 40% 11% 63% 11% eDrive $1.5B $1.5B Geely 9% $1.5B 11% Chery 7% COEM Ford 60% Propshaft 4% SAIC GM 11% BYD 7% 4% BAIC 5% 7% 2026
Slide 36: China Overview – SDS Joint Venture
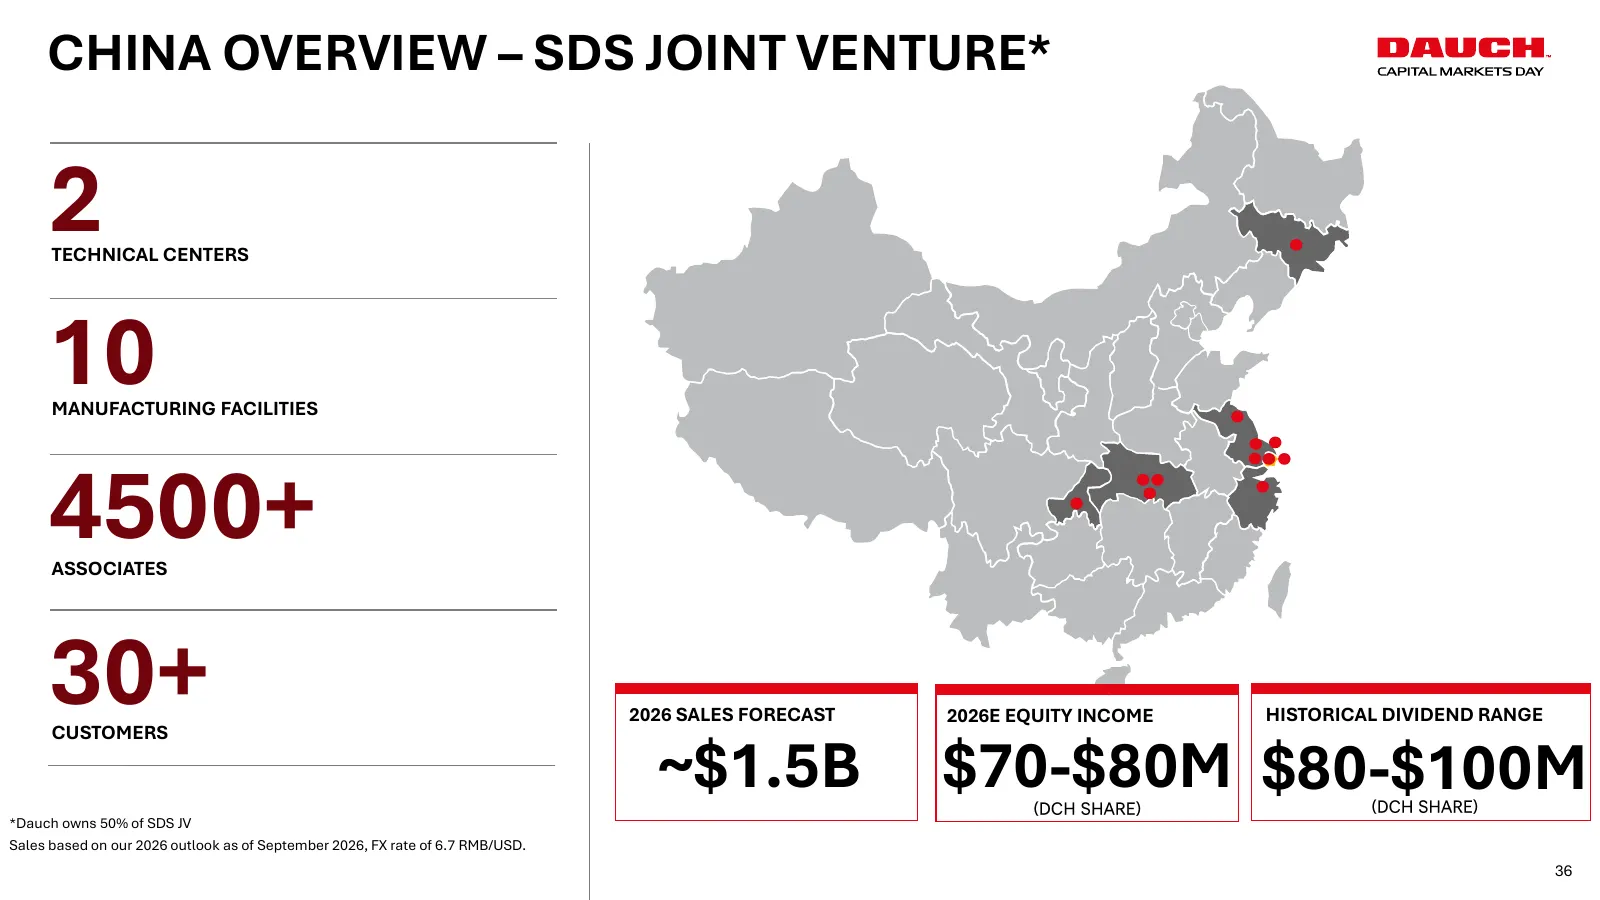
CHINA OVERVIEW – SDS JOINT VENTURE* 2 TECHNICAL CENTERS 10 MANUFACTURING FACILITIES 4500+ ASSOCIATES 30+ CUSTOMERS 2026 SALES FORECAST 2026E EQUITY INCOME HISTORICAL DIVIDEND RANGE ~$1.5B $70-$80M $80-$100M (DCH SHARE) (DCH SHARE) *Dauch owns 50% of SDS JV Sales based on our 2026 outlook as of Septe
Slide 37: SDS History
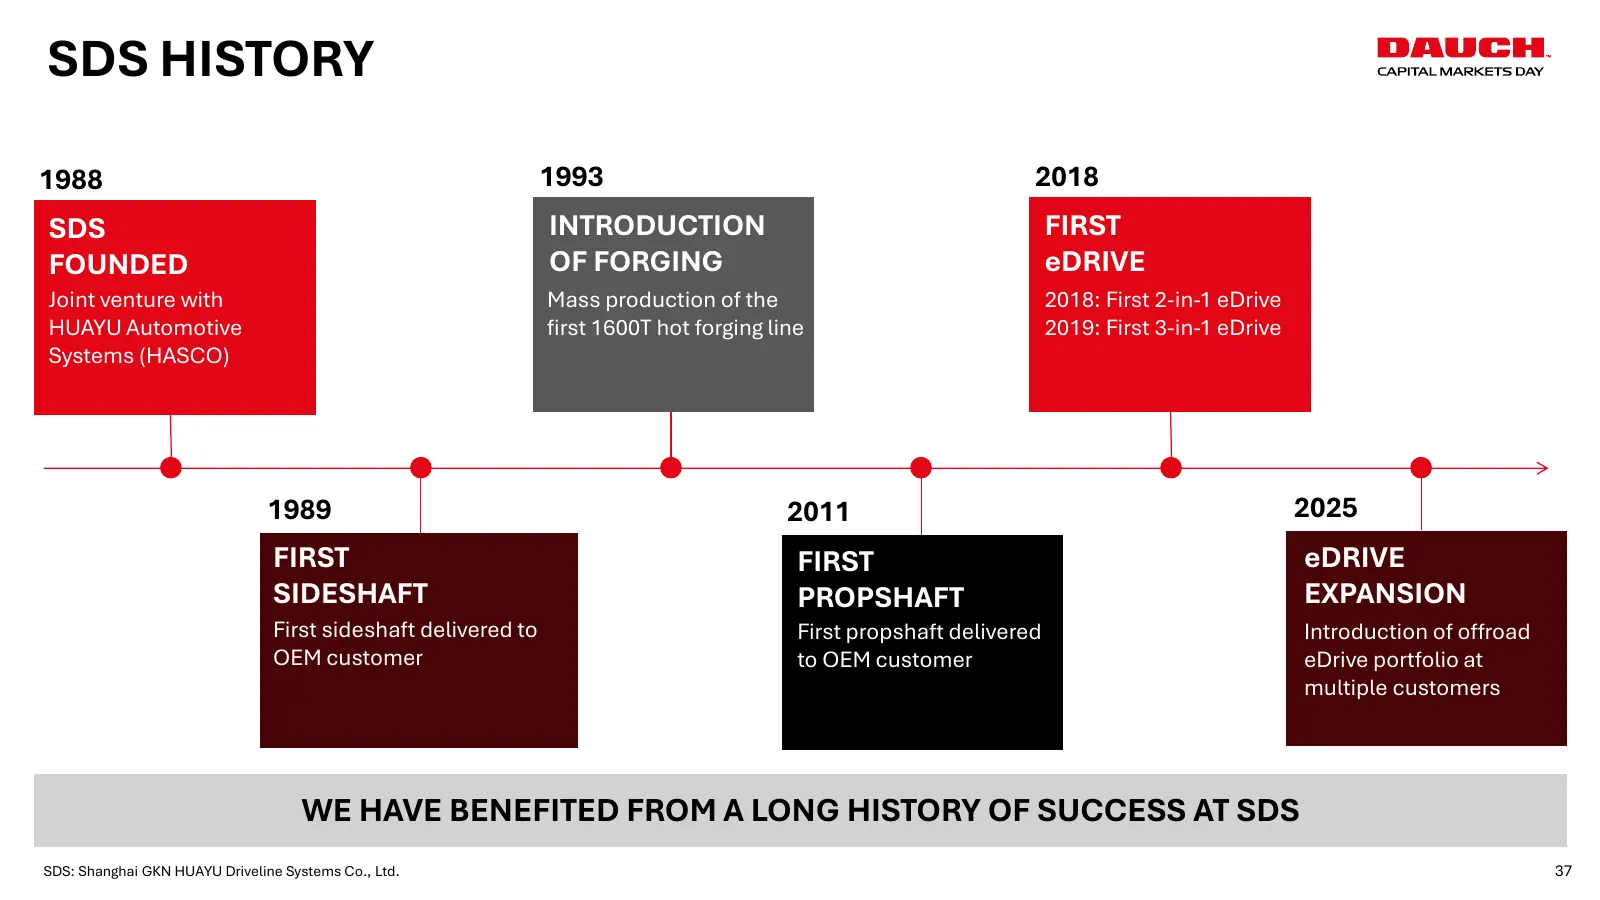
SDS HISTORY 1988 1993 2018 SDS INTRODUCTION FIRST FOUNDED OF FORGING eDRIVE Joint venture with Mass production of the 2018: First 2-in-1 eDrive HUAYU Automotive first 1600T hot forging line 2019: First 3-in-1 eDrive Systems (HASCO) 1989 2011 2025 FIRST FIRST eDRIVE SIDESHAFT PROPSHAFT EXPANSION Firs
Slide 38: SDS Product Mix and China Market Position
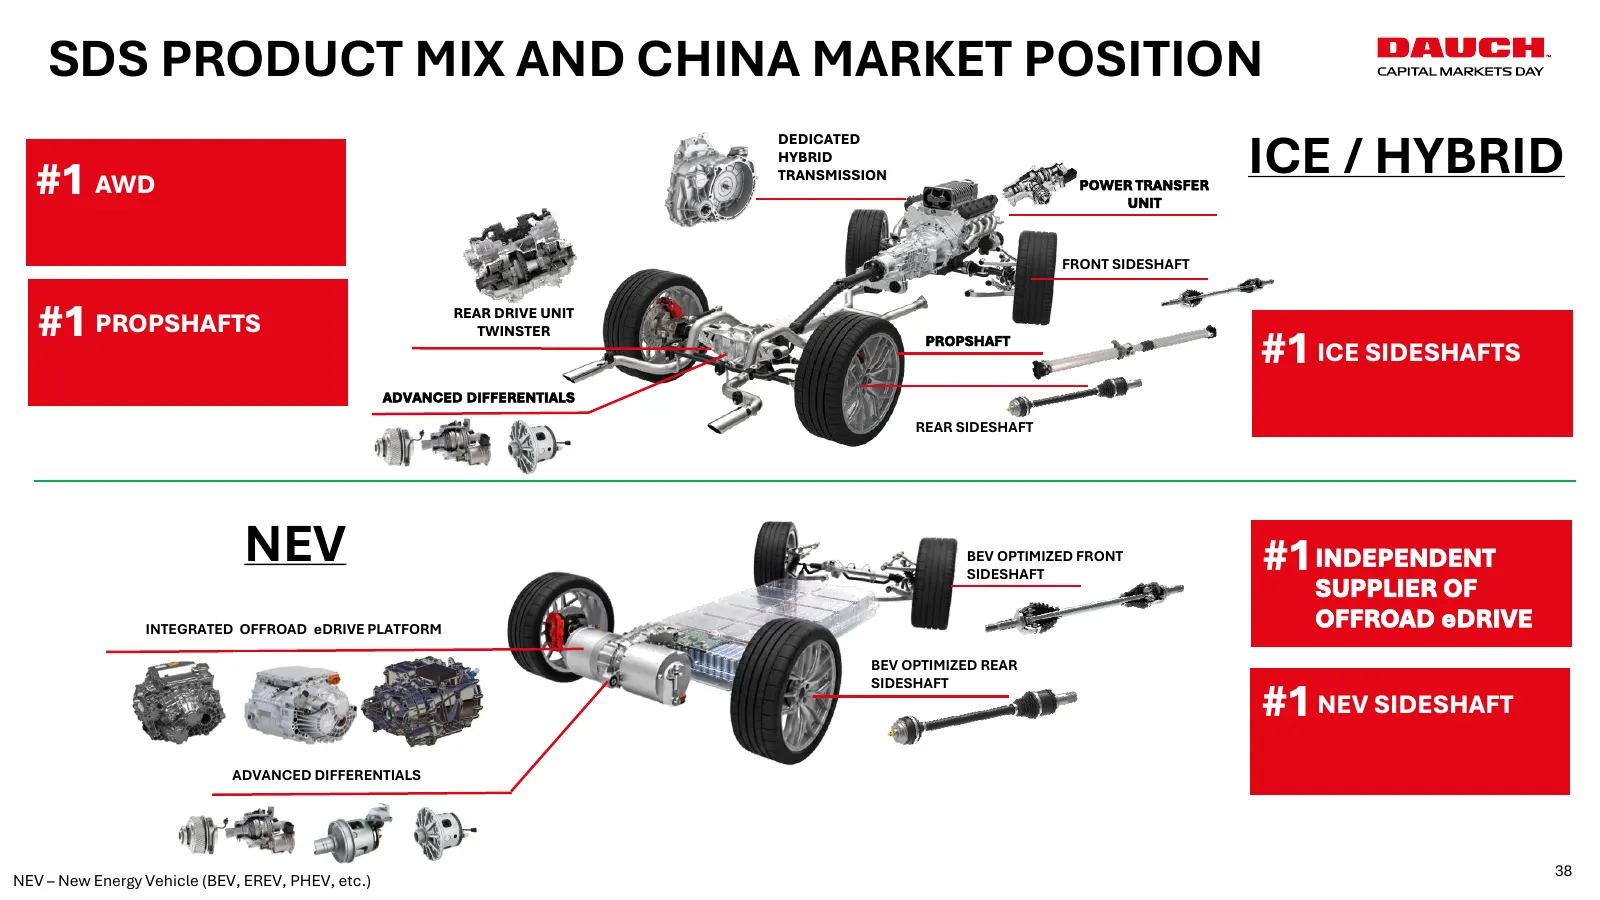
SDS PRODUCT MIX AND CHINA MARKET POSITION ICE / HYBRID DEDICATED HYBRID #1 AWD TRANSMISSION POWER TRANSFER #1 UNIT FRONT SIDESHAFT #1 PROPSHAFTS REAR DRIVE UNIT #1 ICE SIDESHAFTS TWINSTER PROPSHAFT #1 ADVANCED DIFFERENTIALS REAR SIDESHAFT NEV BEV OPTIMIZED FRONT SIDESHAFT #1 INDEPENDENT SUPPLIER OF
Slide 39: China Summary
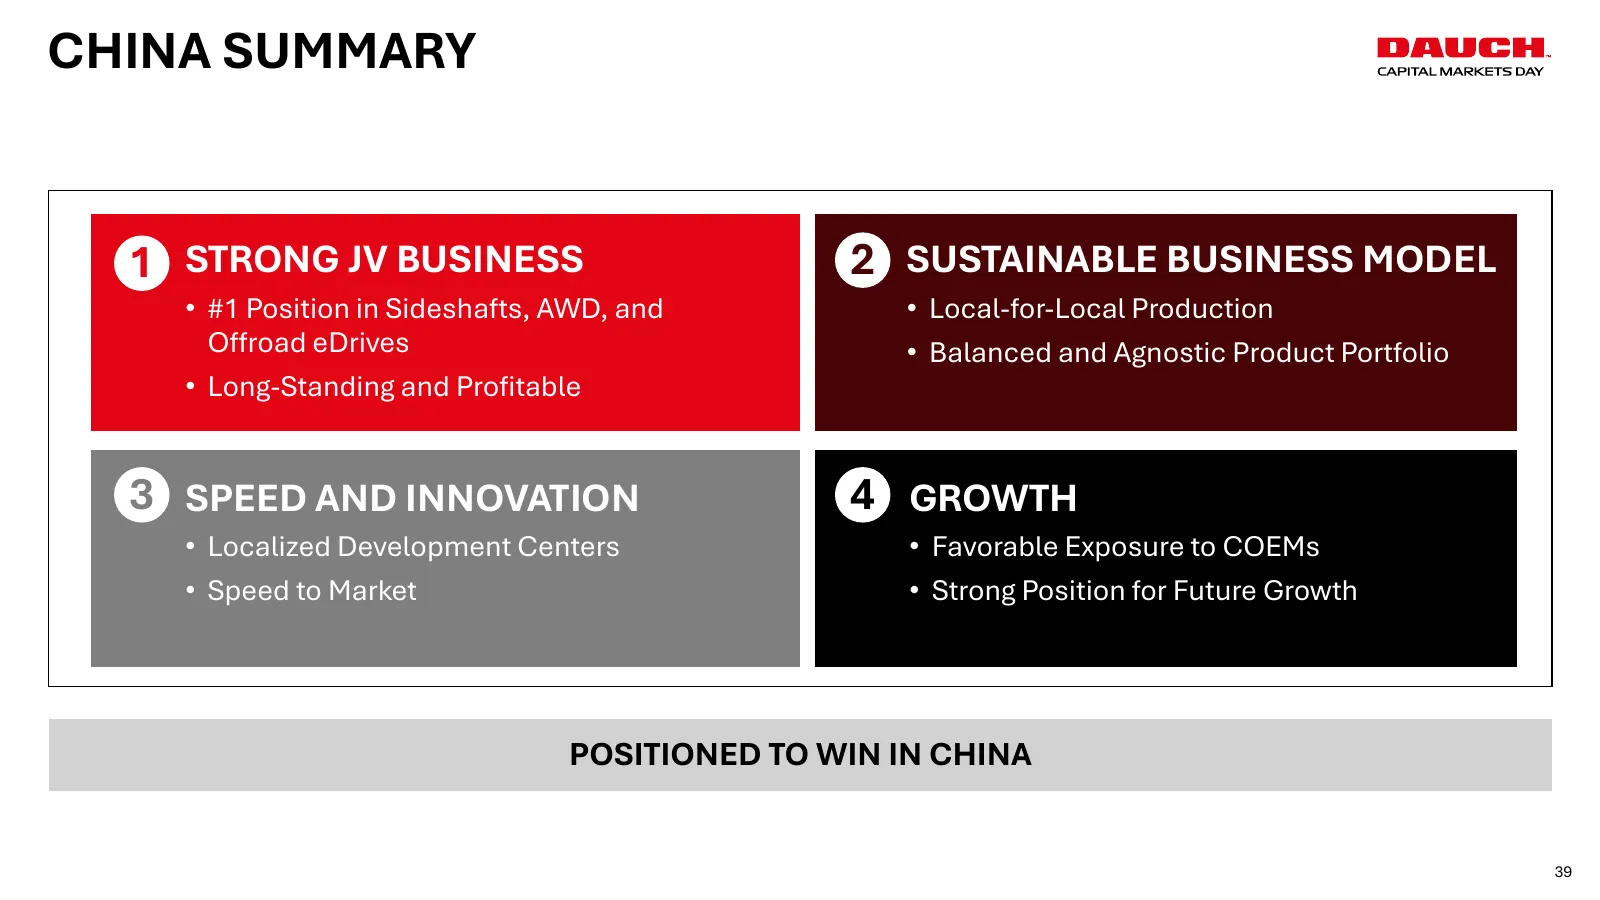
CHINA SUMMARY 1 STRONG JV BUSINESS 2 SUSTAINABLE BUSINESS MODEL • #1 Position in Sideshafts, AWD, and • Local-for-Local Production Offroad eDrives • Balanced and Agnostic Product Portfolio • Long-Standing and Profitable 3 SPEED AND INNOVATION 4 GROWTH • Localized Development Centers • Favorable Expo

Slide 40: Diversification
DAUCH. PITAL MARKETS DAY DIVERSIFICATION
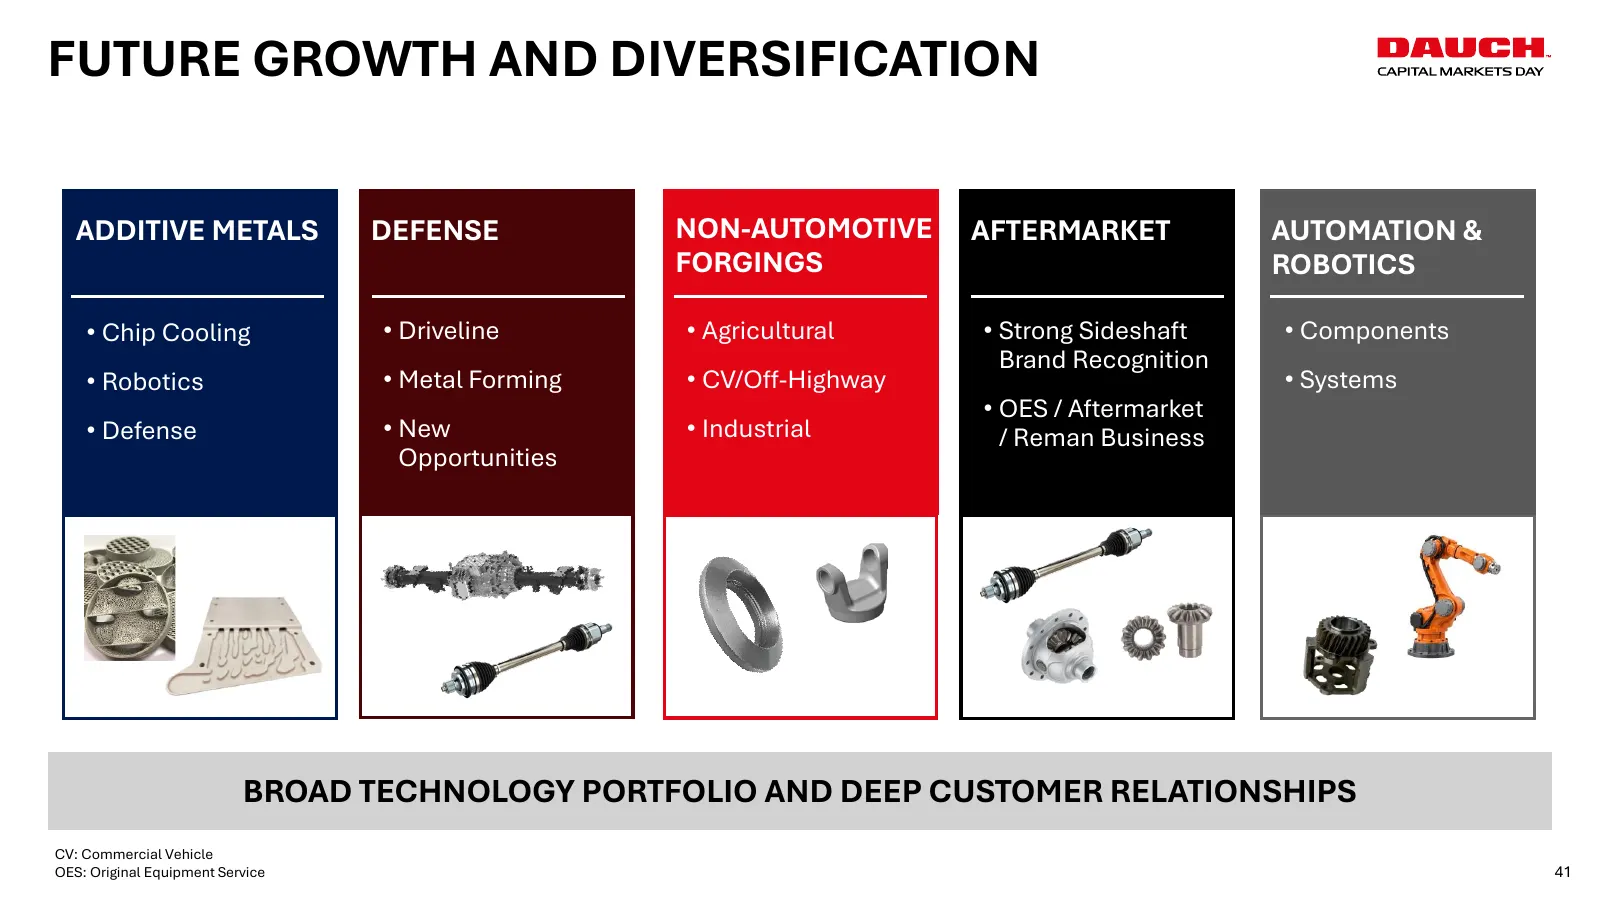
Slide 41: Future Growth and Diversification
FUTURE GROWTH AND DIVERSIFICATION ADDITIVE METALS DEFENSE NON-AUTOMOTIVE AFTERMARKET AUTOMATION & FORGINGS ROBOTICS • Chip Cooling • Driveline • Agricultural • Strong Sideshaft • Components Brand Recognition • Robotics • Metal Forming • CV/Off-Highway • Systems • OES / Aftermarket • Defense • New •
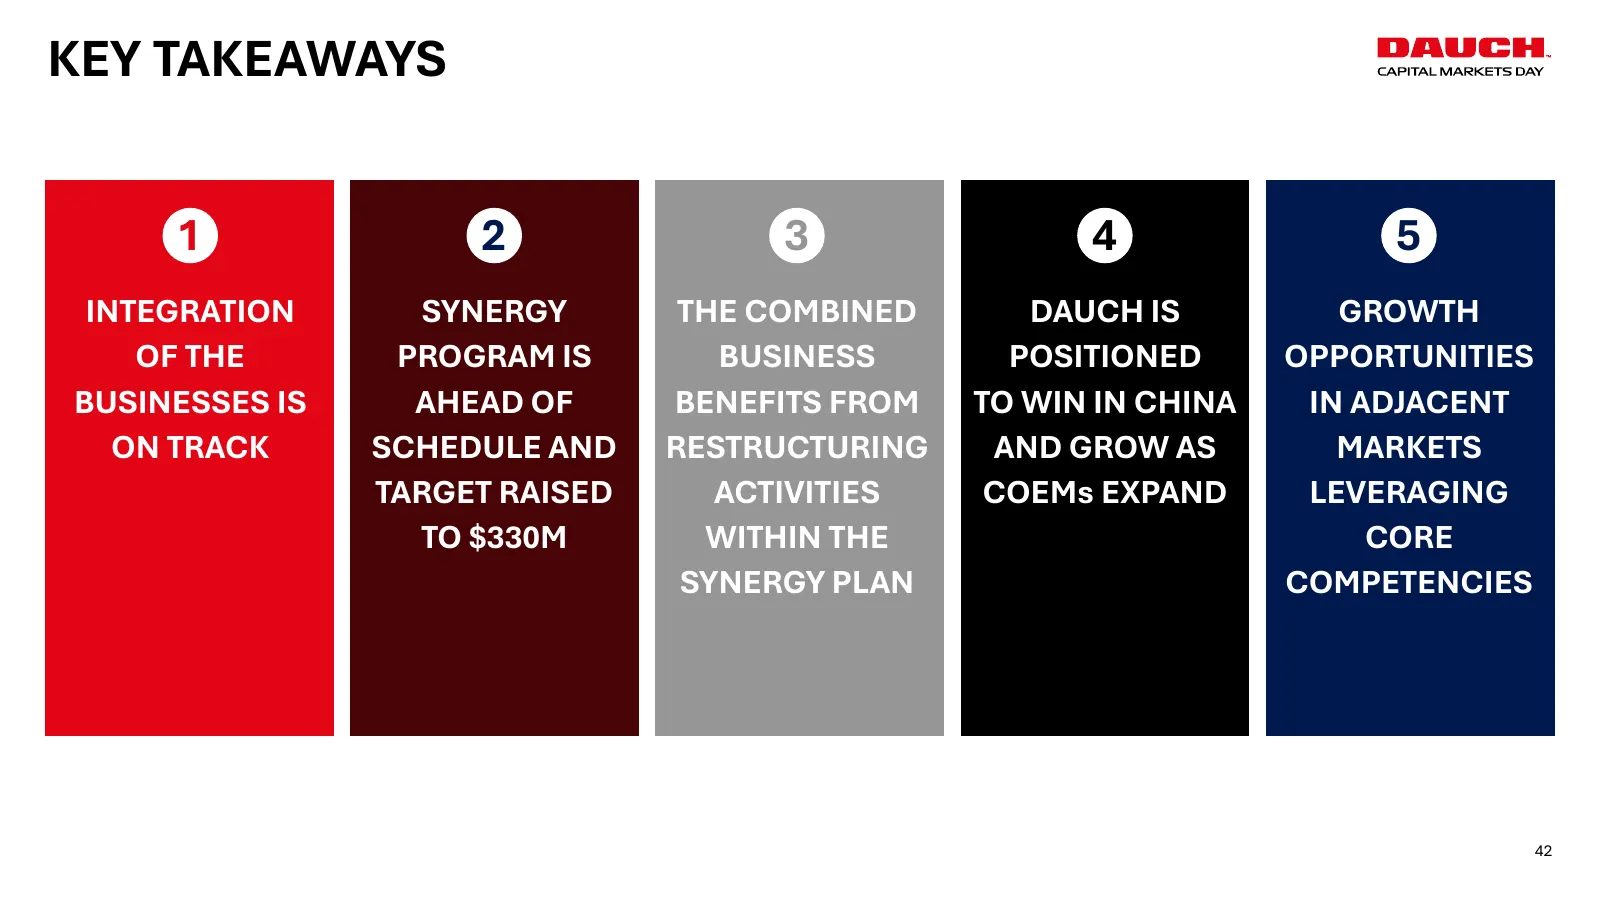
Slide 42: Key Takeaways
KEY TAKEAWAYS 1 2 3 4 5 INTEGRATION SYNERGY THE COMBINED DAUCH IS GROWTH OF THE PROGRAM IS BUSINESS POSITIONED OPPORTUNITIES BUSINESSES IS AHEAD OF BENEFITS FROM TO WIN IN CHINA IN ADJACENT ON TRACK SCHEDULE AND RESTRUCTURING AND GROW AS MARKETS TARGET RAISED ACTIVITIES COEMs EXPAND LEVERAGING TO $3
Slide 43: Mark Barrett
MARK BARRETT SENIOR VICE PRESIDENT PRODUCT ENGINEERING & QUALITY 43 43 43
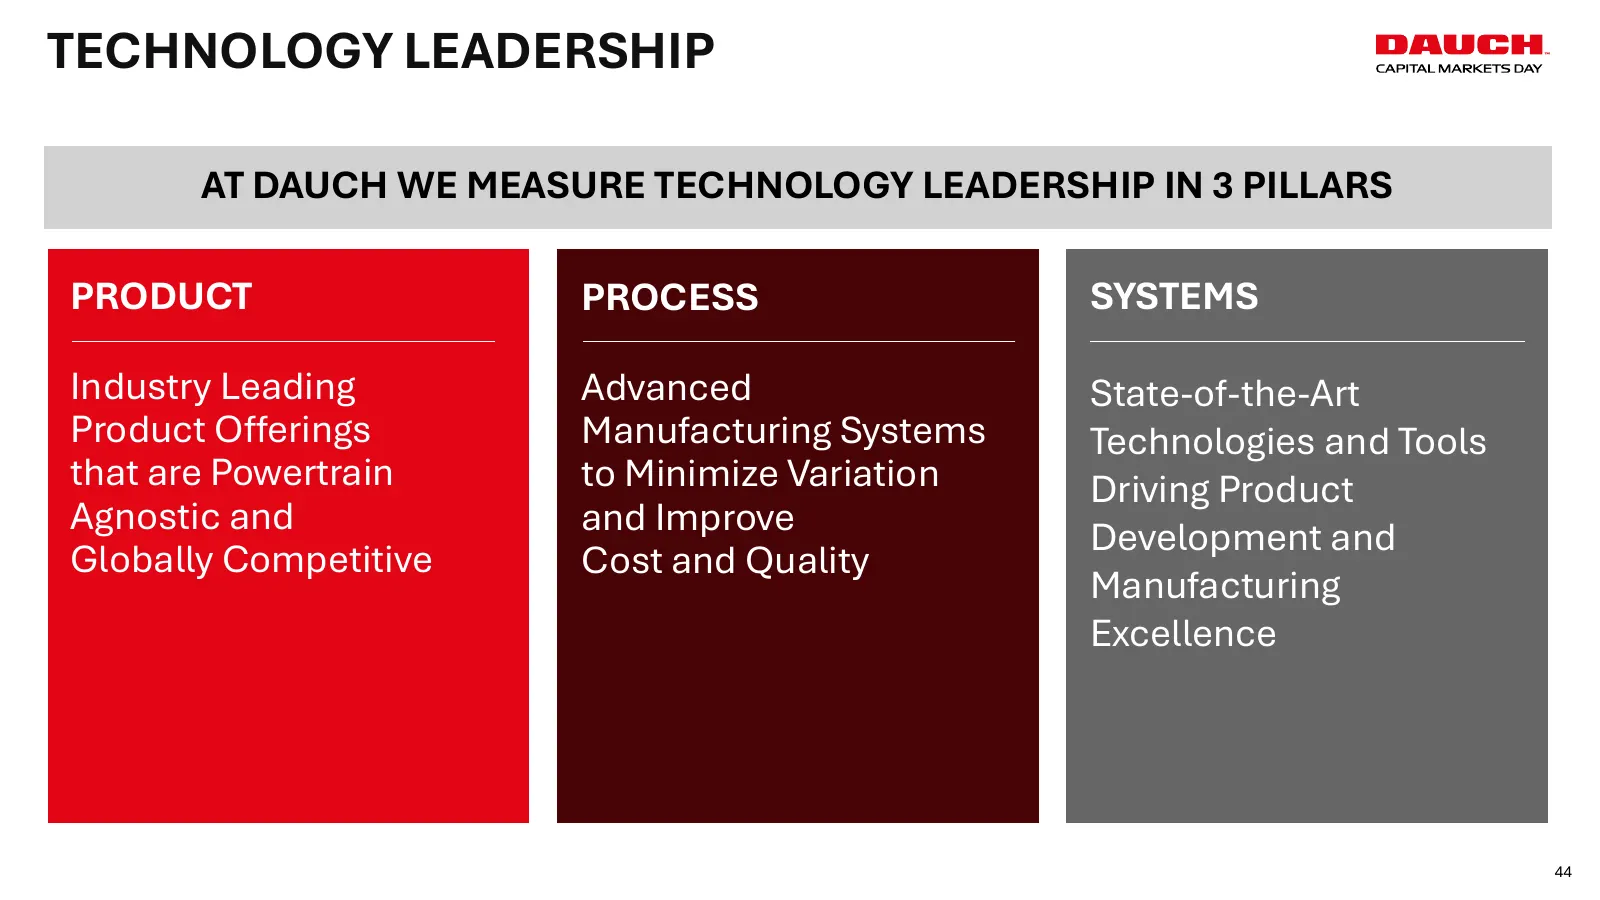
Slide 44: Technology Leadership
TECHNOLOGY LEADERSHIP AT DAUCH WE MEASURE TECHNOLOGY LEADERSHIP IN 3 PILLARS PRODUCT PROCESS SYSTEMS Industry Leading Advanced State-of-the-Art Product Offerings Manufacturing Systems Technologies and Tools that are Powertrain to Minimize Variation Driving Product Agnostic and and Improve Developmen
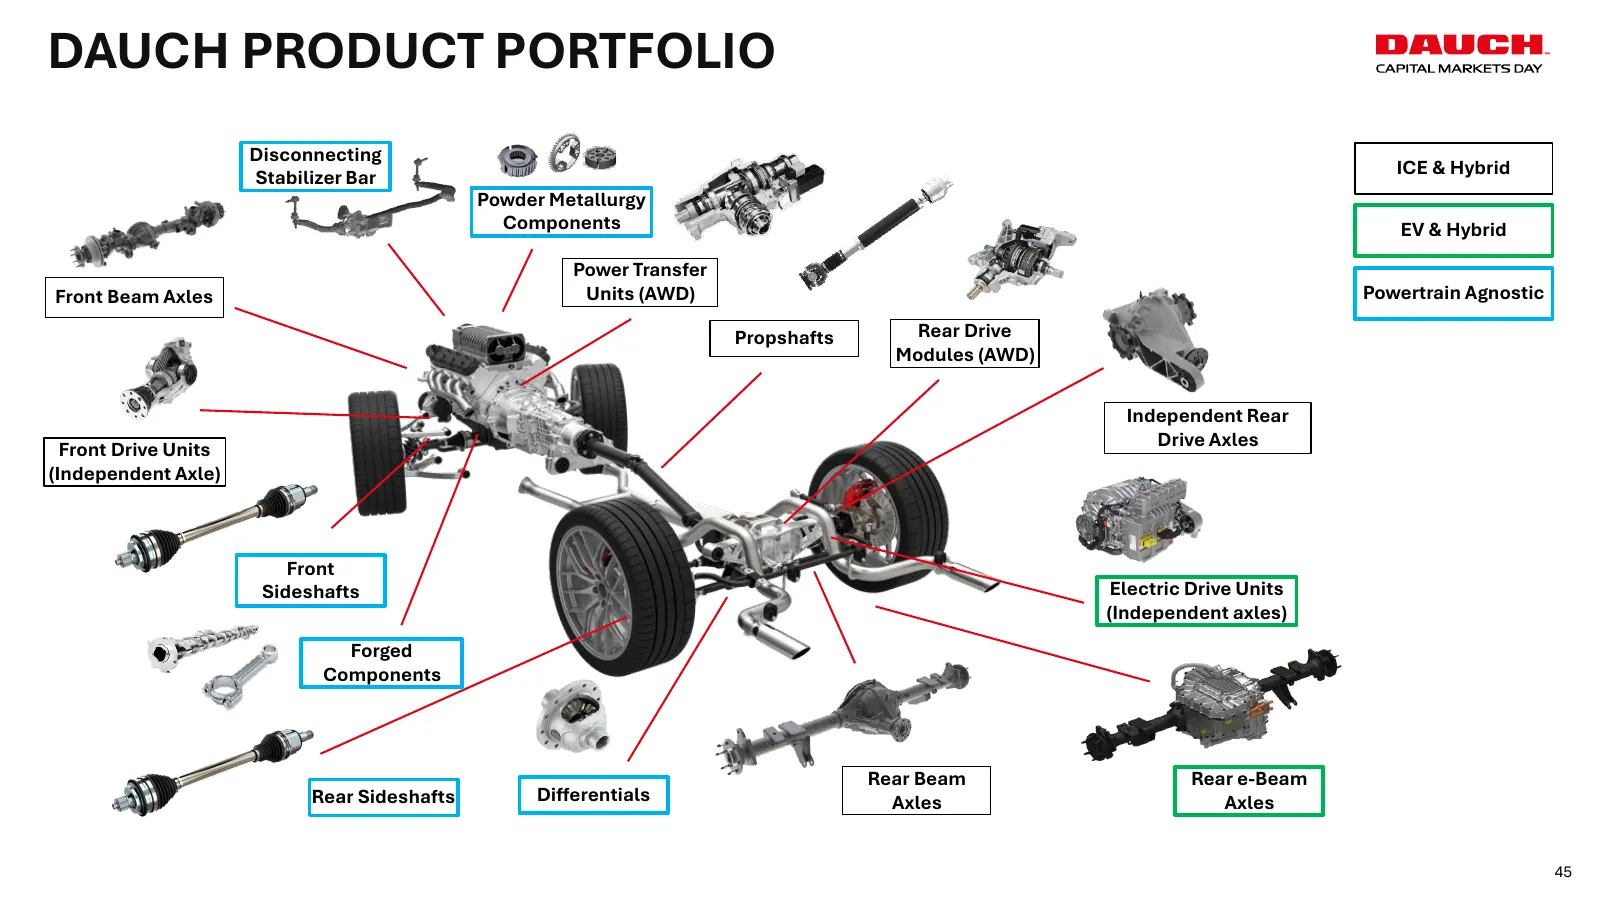
Slide 45: Dauch Product Portfolio
DAUCH PRODUCT PORTFOLIO Disconnecting ICE & Hybrid Stabilizer Bar Powder Metallurgy Components EV & Hybrid Power Transfer Front Beam Axles Units (AWD) Powertrain Agnostic Propshafts Rear Drive Modules (AWD) Independent Rear Drive Axles Front Drive Units (Independent Axle) Front Sideshafts Electric D
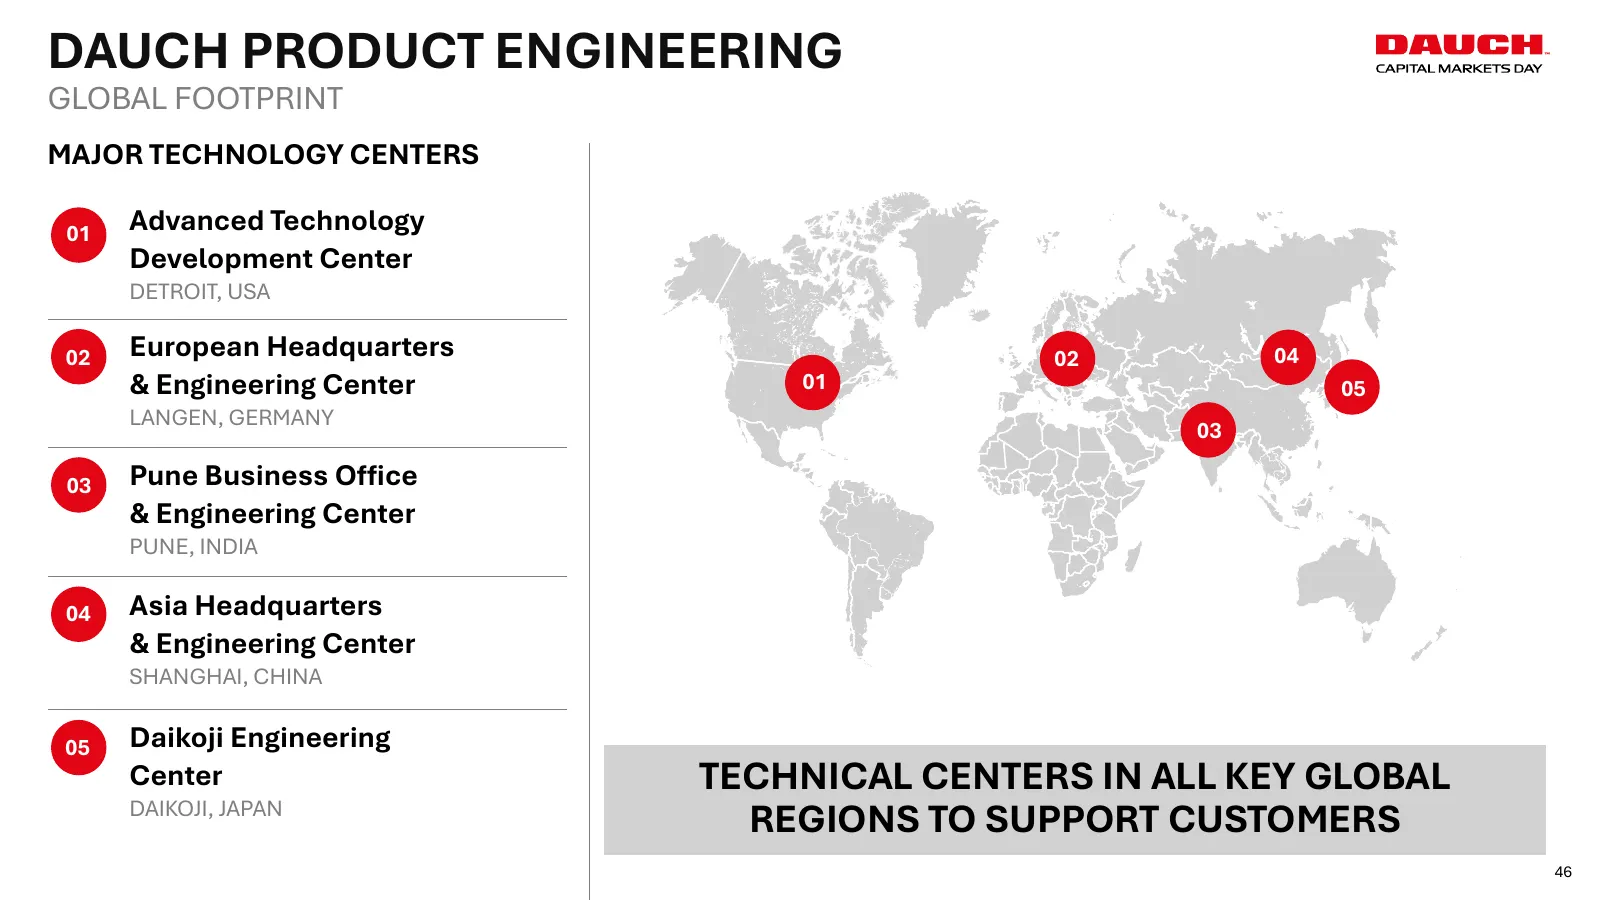
Slide 46: Dauch Product Engineering
DAUCH PRODUCT ENGINEERING GLOBAL FOOTPRINT MAJOR TECHNOLOGY CENTERS 01 Advanced Technology Development Center DETROIT, USA 02 European Headquarters 02 04 & Engineering Center 01 05 LANGEN, GERMANY 03 03 Pune Business Office & Engineering Center PUNE, INDIA 04 Asia Headquarters & Engineering Center S
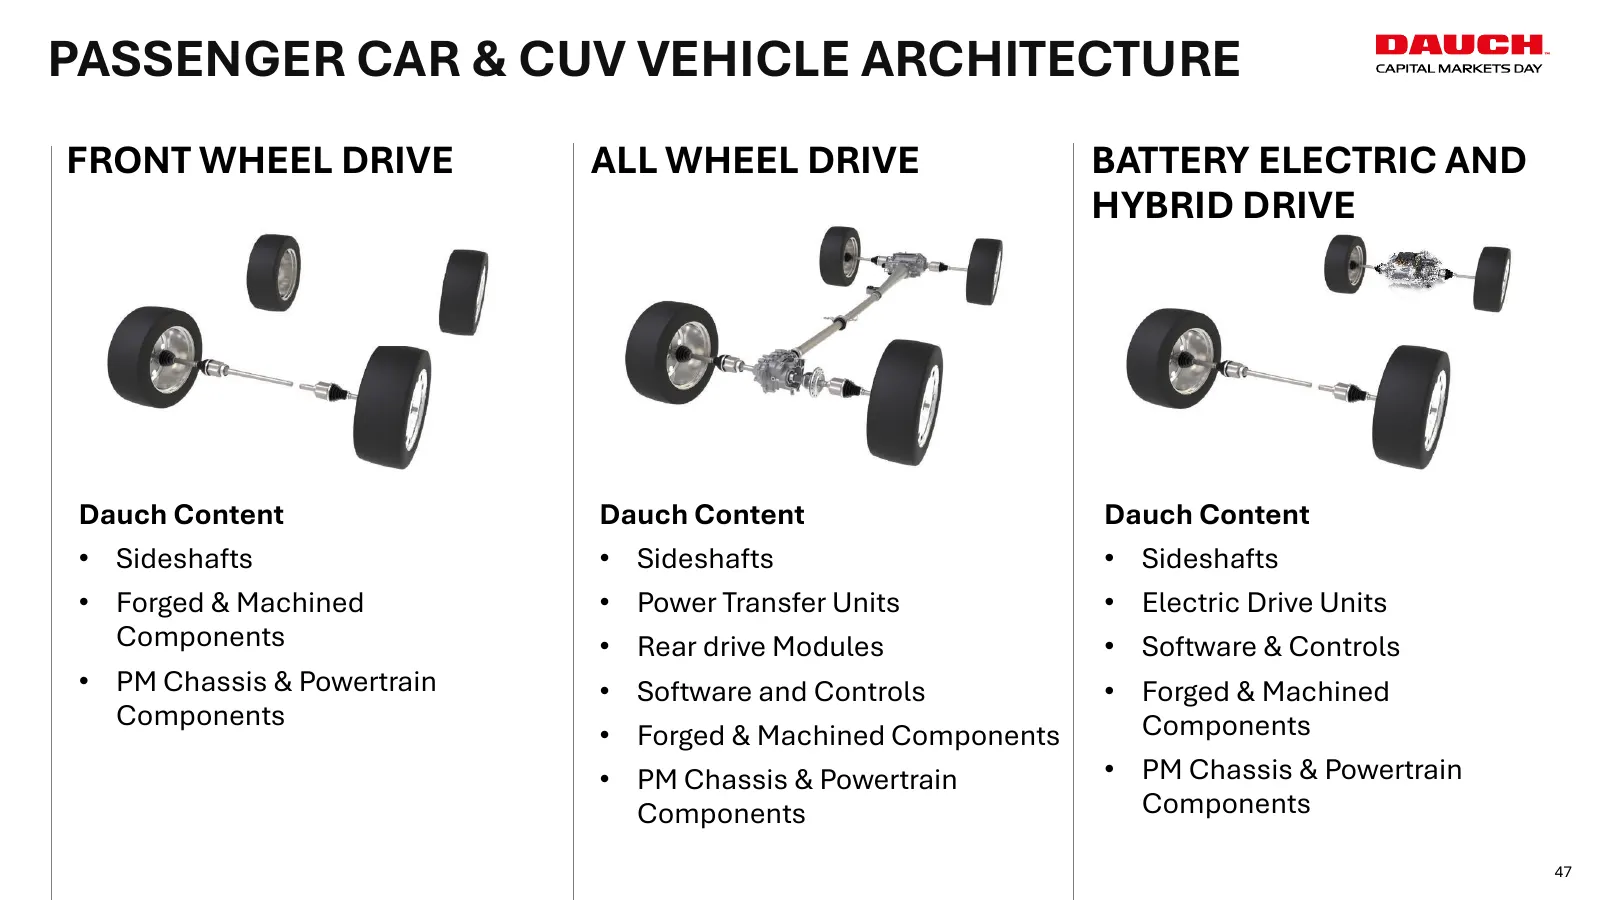
Slide 47: Passenger Car & CUV Vehicle Architecture
PASSENGER CAR & CUV VEHICLE ARCHITECTURE FRONT WHEEL DRIVE ALL WHEEL DRIVE BATTERY ELECTRIC AND HYBRID DRIVE Dauch Content Dauch Content Dauch Content • Sideshafts • Sideshafts • Sideshafts • Forged & Machined • Power Transfer Units • Electric Drive Units Components • Rear drive Modules • Software &
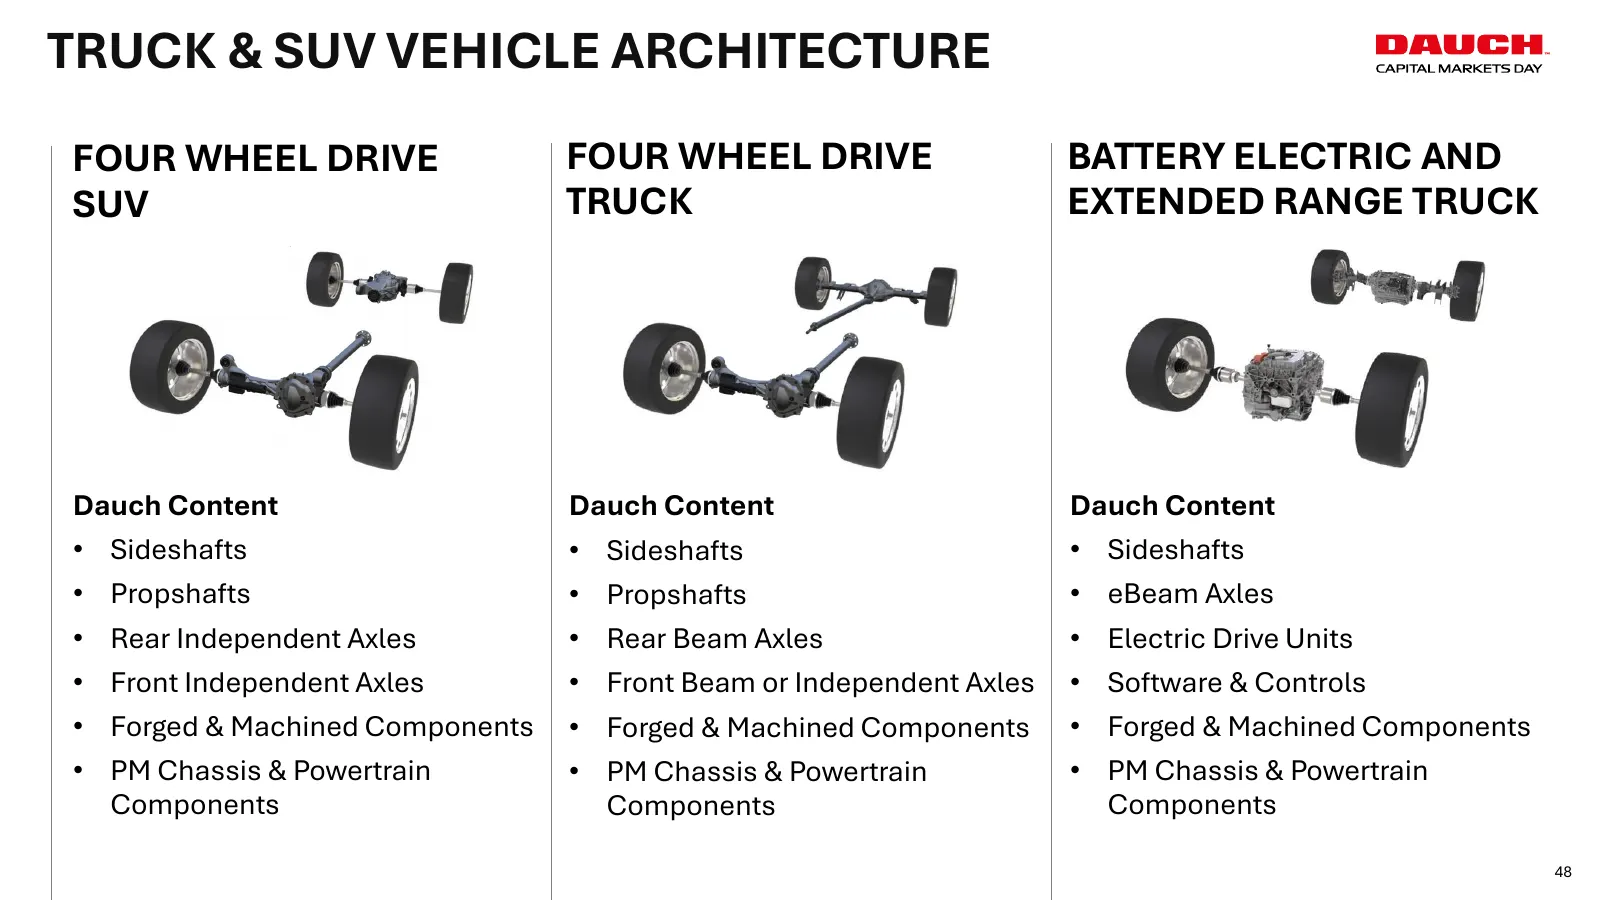
Slide 48: Truck & SUV Vehicle Architecture
TRUCK & SUV VEHICLE ARCHITECTURE FOUR WHEEL DRIVE FOUR WHEEL DRIVE BATTERY ELECTRIC AND SUV TRUCK EXTENDED RANGE TRUCK Dauch Content Dauch Content Dauch Content • Sideshafts • Sideshafts • Sideshafts • Propshafts • Propshafts • eBeam Axles • Rear Independent Axles • Rear Beam Axles • Electric Drive
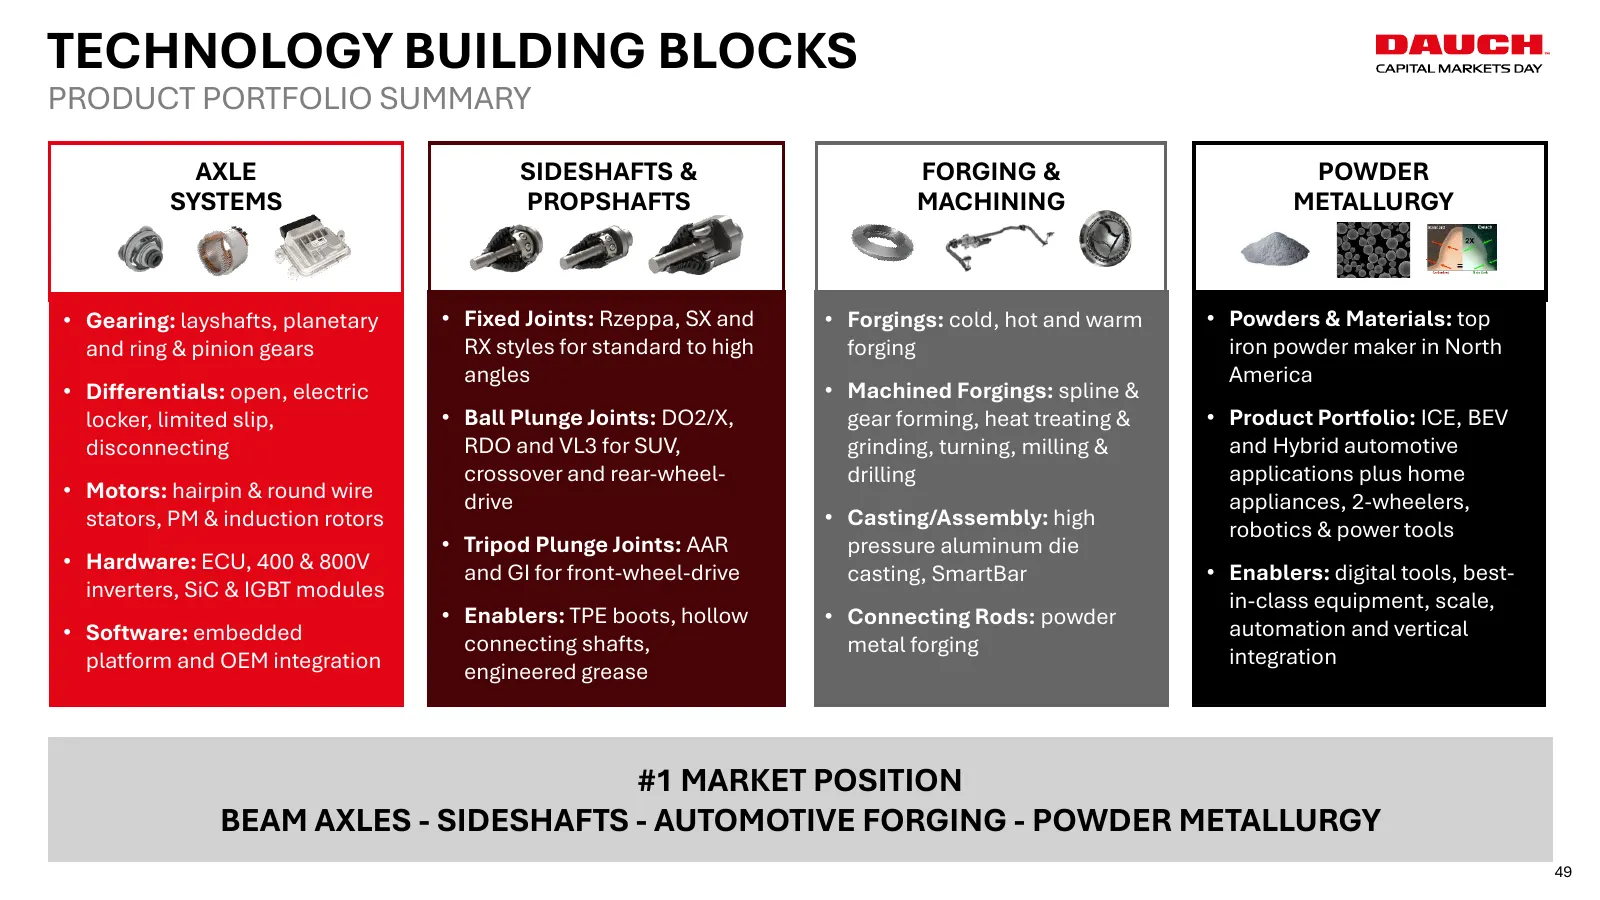
Slide 49: Technology Building Blocks
TECHNOLOGY BUILDING BLOCKS PRODUCT PORTFOLIO SUMMARY AXLE SIDESHAFTS & FORGING & POWDER SYSTEMS PROPSHAFTS MACHINING METALLURGY • Gearing: layshafts, planetary • Fixed Joints: Rzeppa, SX and • Forgings: cold, hot and warm • Powders & Materials: top and ring & pinion gears RX styles for standard to h
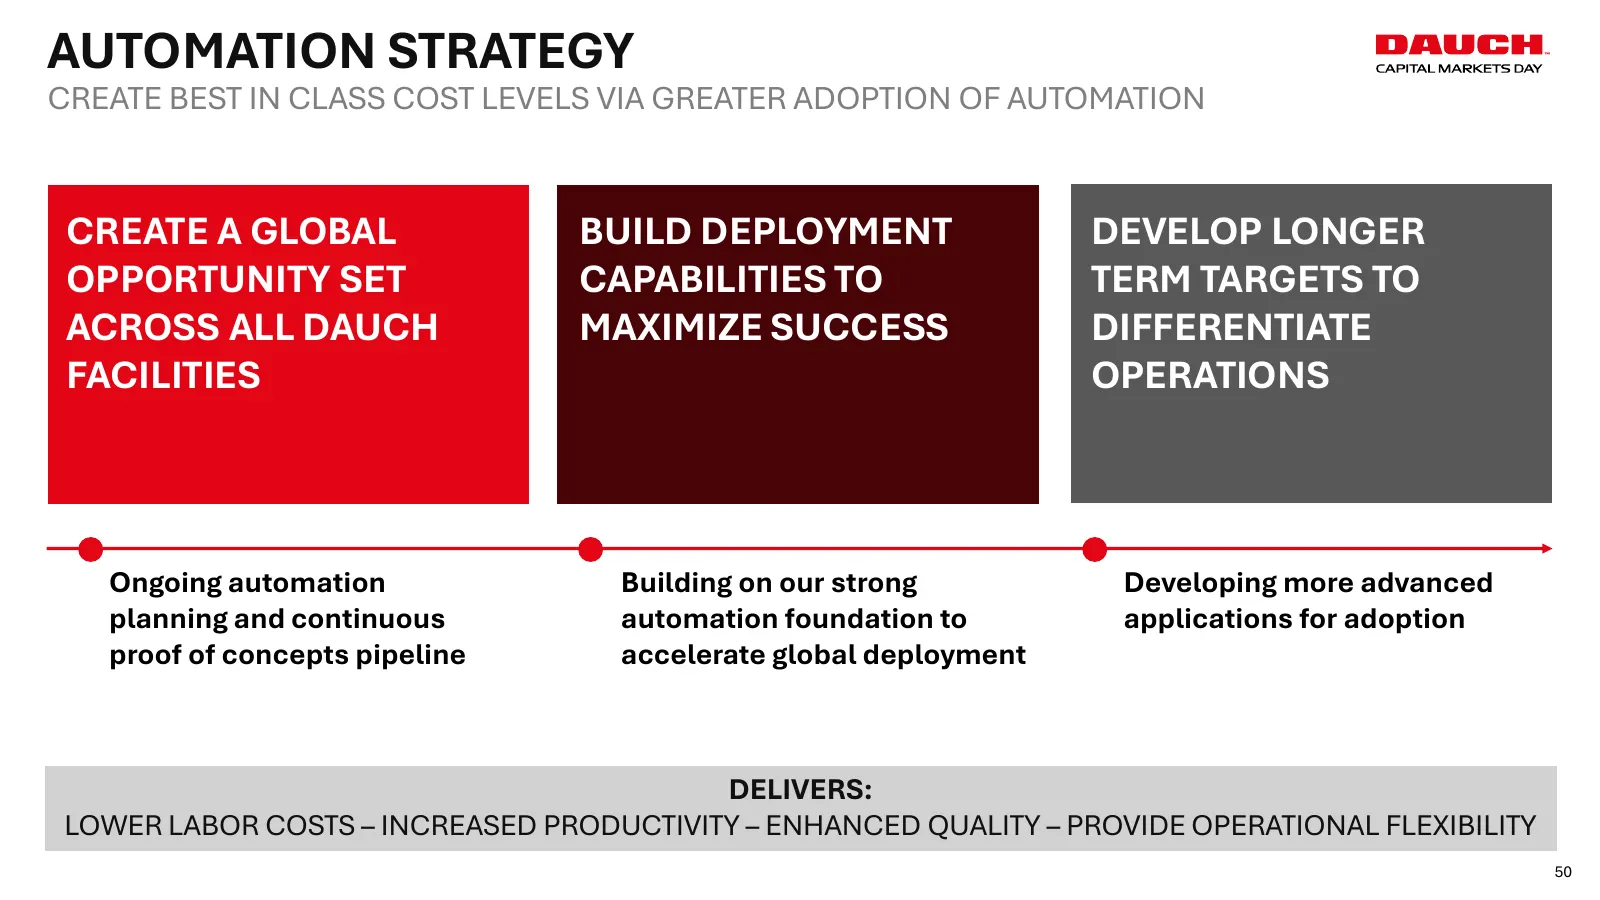
Slide 50: Automation Strategy
AUTOMATION STRATEGY CREATE BEST IN CLASS COST LEVELS VIA GREATER ADOPTION OF AUTOMATION CREATE A GLOBAL BUILD DEPLOYMENT DEVELOP LONGER OPPORTUNITY SET CAPABILITIES TO TERM TARGETS TO ACROSS ALL DAUCH MAXIMIZE SUCCESS DIFFERENTIATE FACILITIES OPERATIONS Ongoing automation Building on our strong Deve
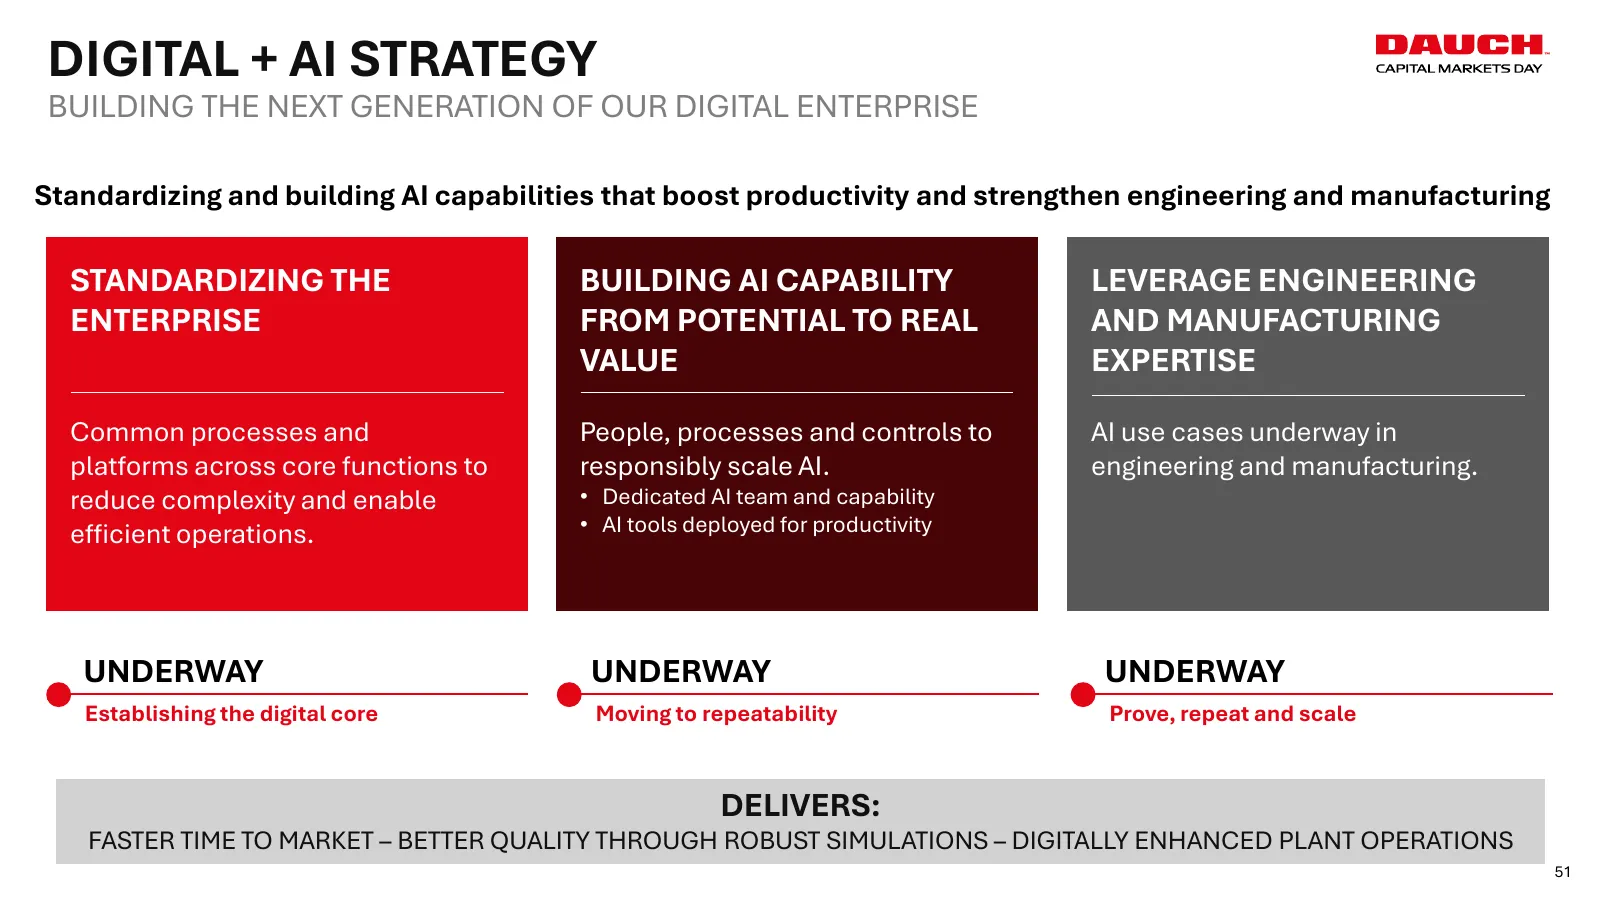
Slide 51: Digital + AI Strategy
DIGITAL + AI STRATEGY BUILDING THE NEXT GENERATION OF OUR DIGITAL ENTERPRISE Standardizing and building AI capabilities that boost productivity and strengthen engineering and manufacturing STANDARDIZING THE BUILDING AI CAPABILITY LEVERAGE ENGINEERING ENTERPRISE FROM POTENTIAL TO REAL AND MANUFACTURI
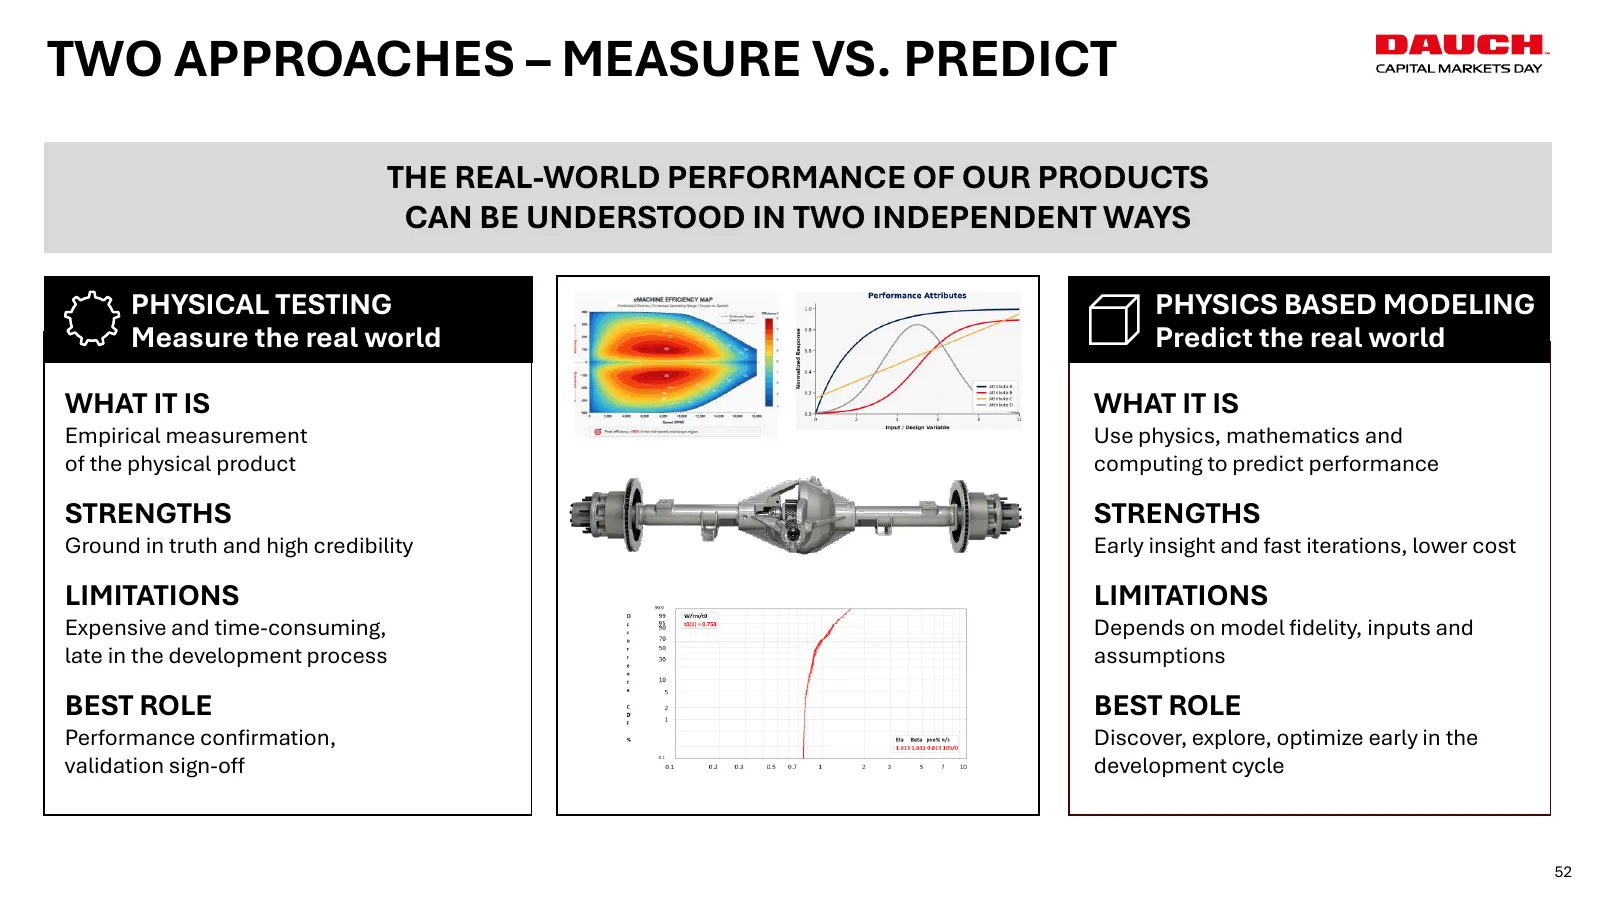
Slide 52: Two Approaches – Measure vs. Predict
TWO APPROACHES – MEASURE VS. PREDICT THE REAL-WORLD PERFORMANCE OF OUR PRODUCTS CAN BE UNDERSTOOD IN TWO INDEPENDENT WAYS PHYSICAL TESTING PHYSICS BASED MODELING Measure the real world Predict the real world WHAT IT IS WHAT IT IS Empirical measurement Use physics, mathematics and of the physical pro
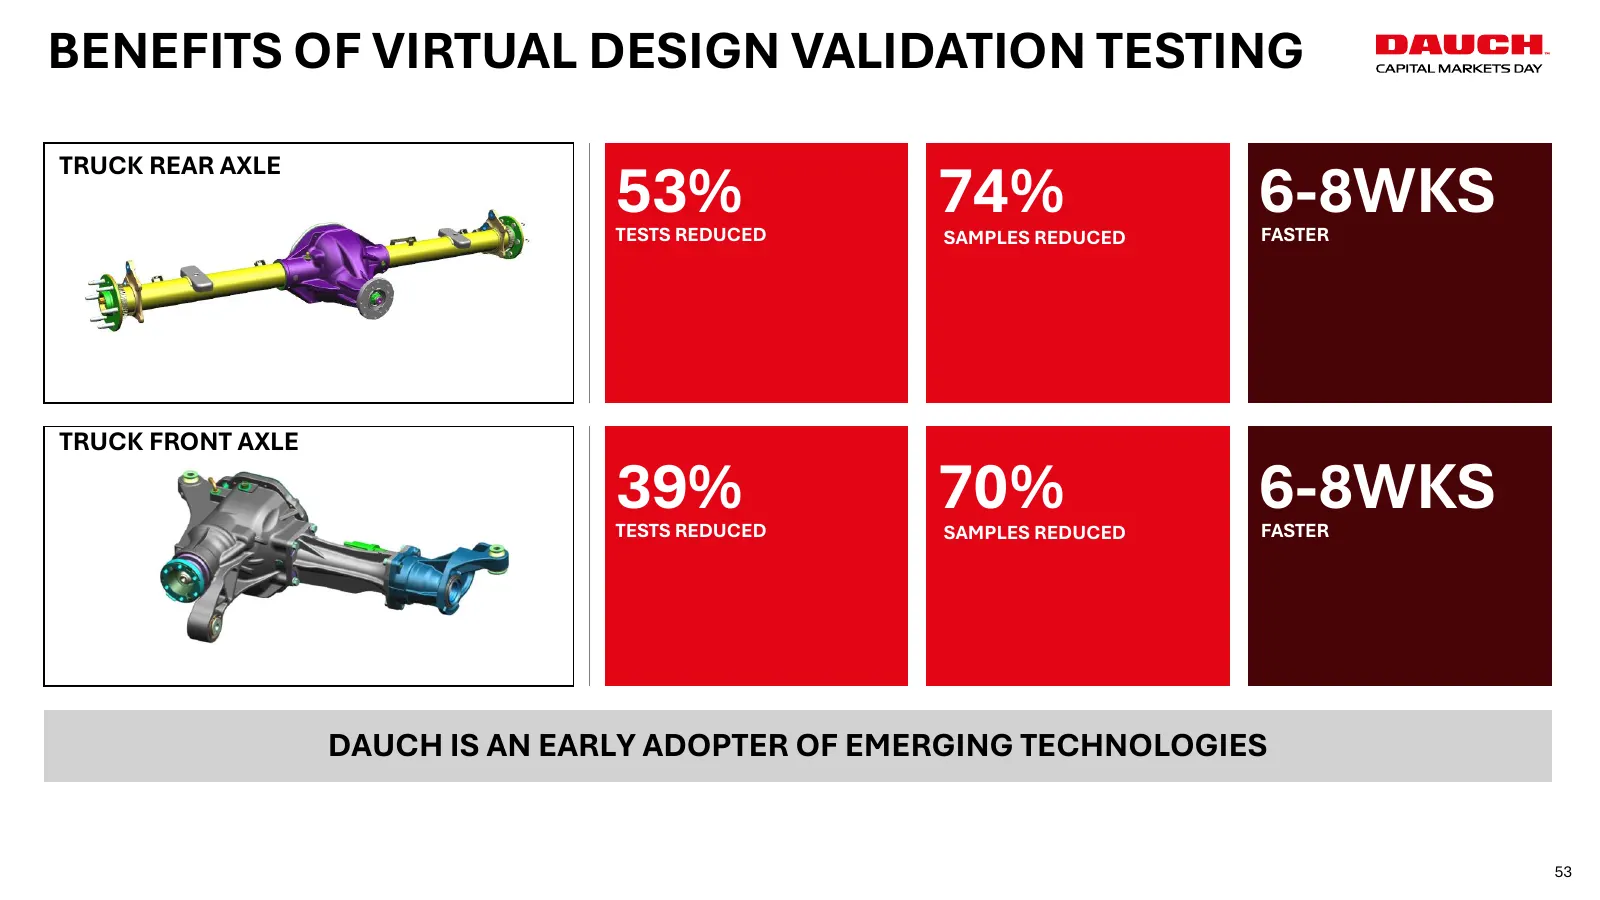
Slide 53: Benefits of Virtual Design Validation Testing
BENEFITS OF VIRTUAL DESIGN VALIDATION TESTING 53% 74% 6-8WKS TRUCK REAR AXLE TESTS REDUCED SAMPLES REDUCED FASTER TRUCK FRONT AXLE 39% TESTS REDUCED 70% SAMPLES REDUCED 6-8WKS FASTER DAUCH IS AN EARLY ADOPTER OF EMERGING TECHNOLOGIES 53
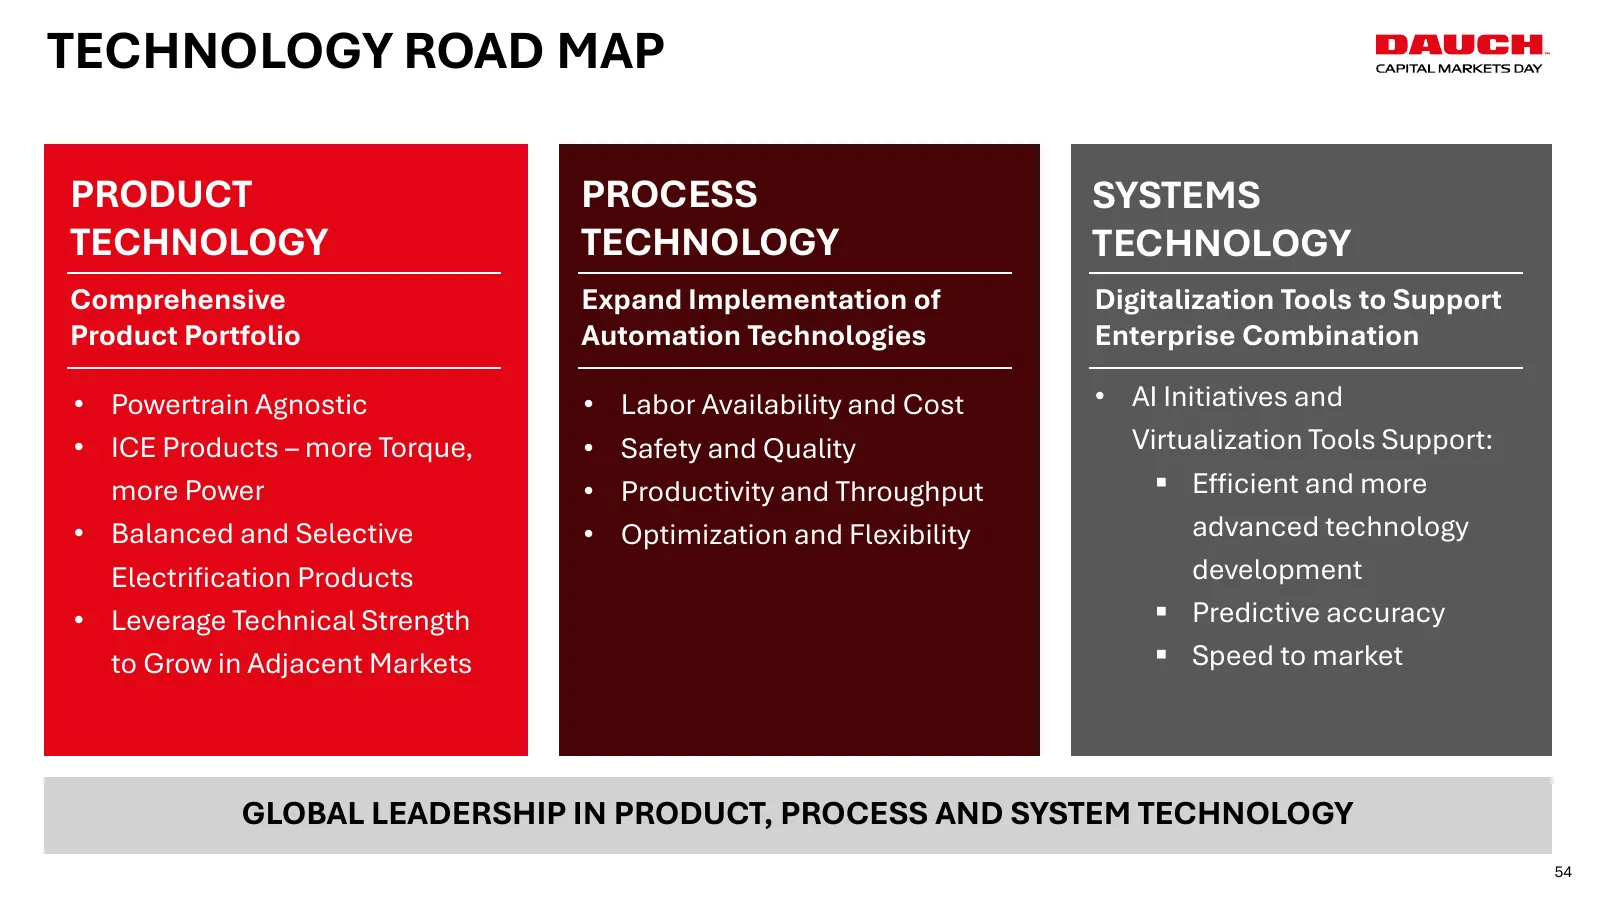
Slide 54: Technology Road Map
TECHNOLOGY ROAD MAP PRODUCT PROCESS SYSTEMS TECHNOLOGY TECHNOLOGY TECHNOLOGY Comprehensive Expand Implementation of Digitalization Tools to Support Product Portfolio Automation Technologies Enterprise Combination • Powertrain Agnostic • Labor Availability and Cost • AI Initiatives and • ICE Products
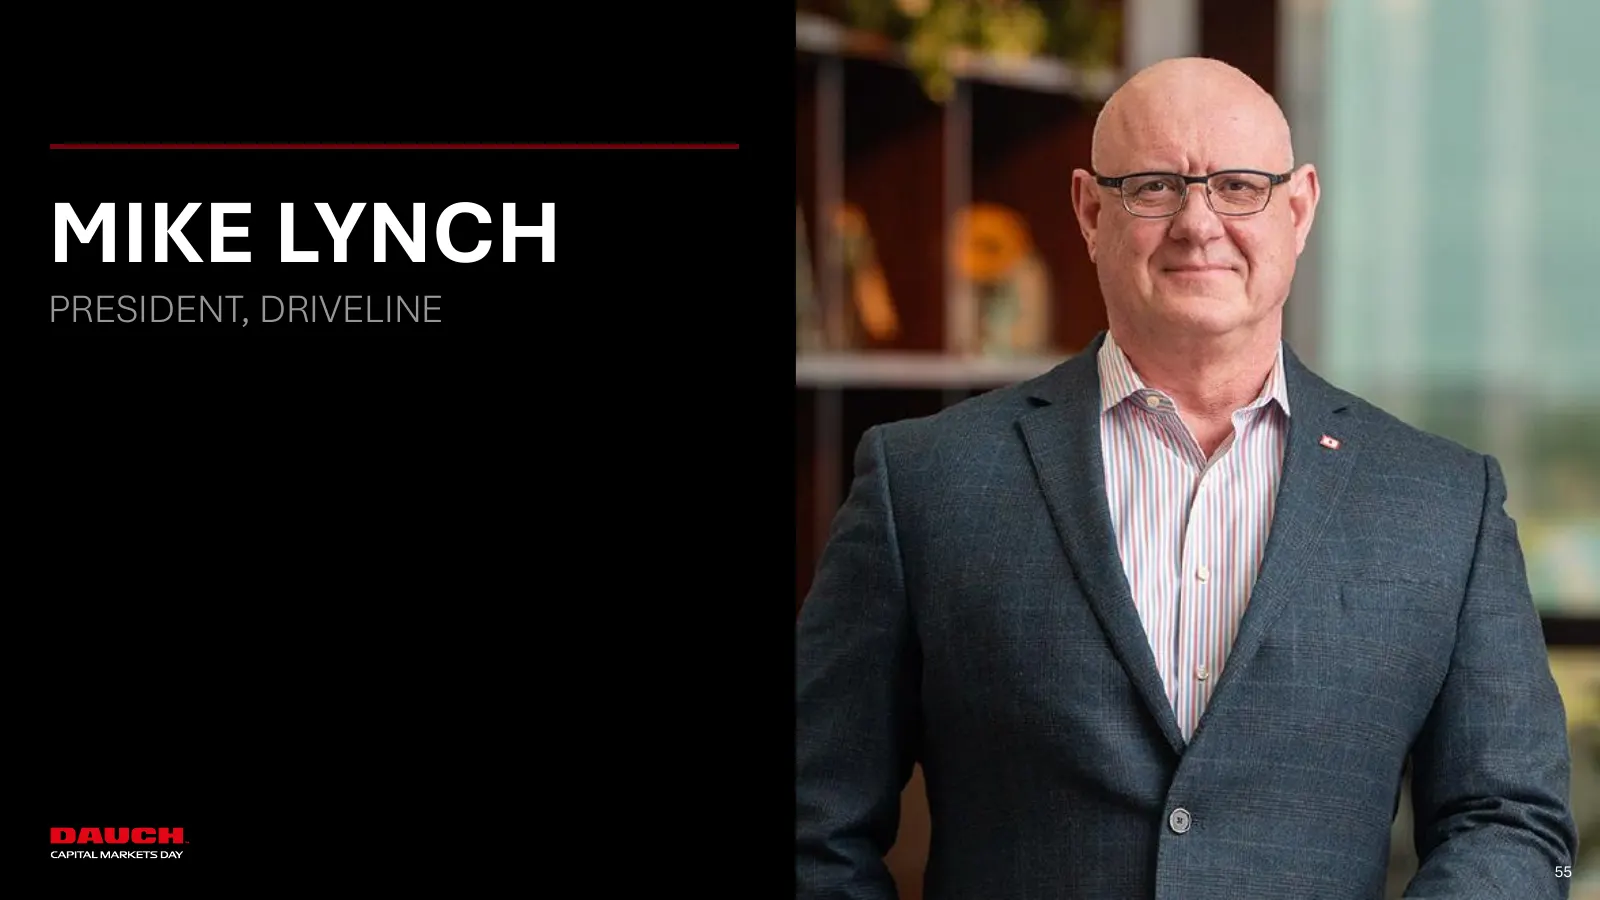
Slide 55: Mike Lynch, President, Driveline
MIKE LYNCH PRESIDENT, DRIVELINE 55 55
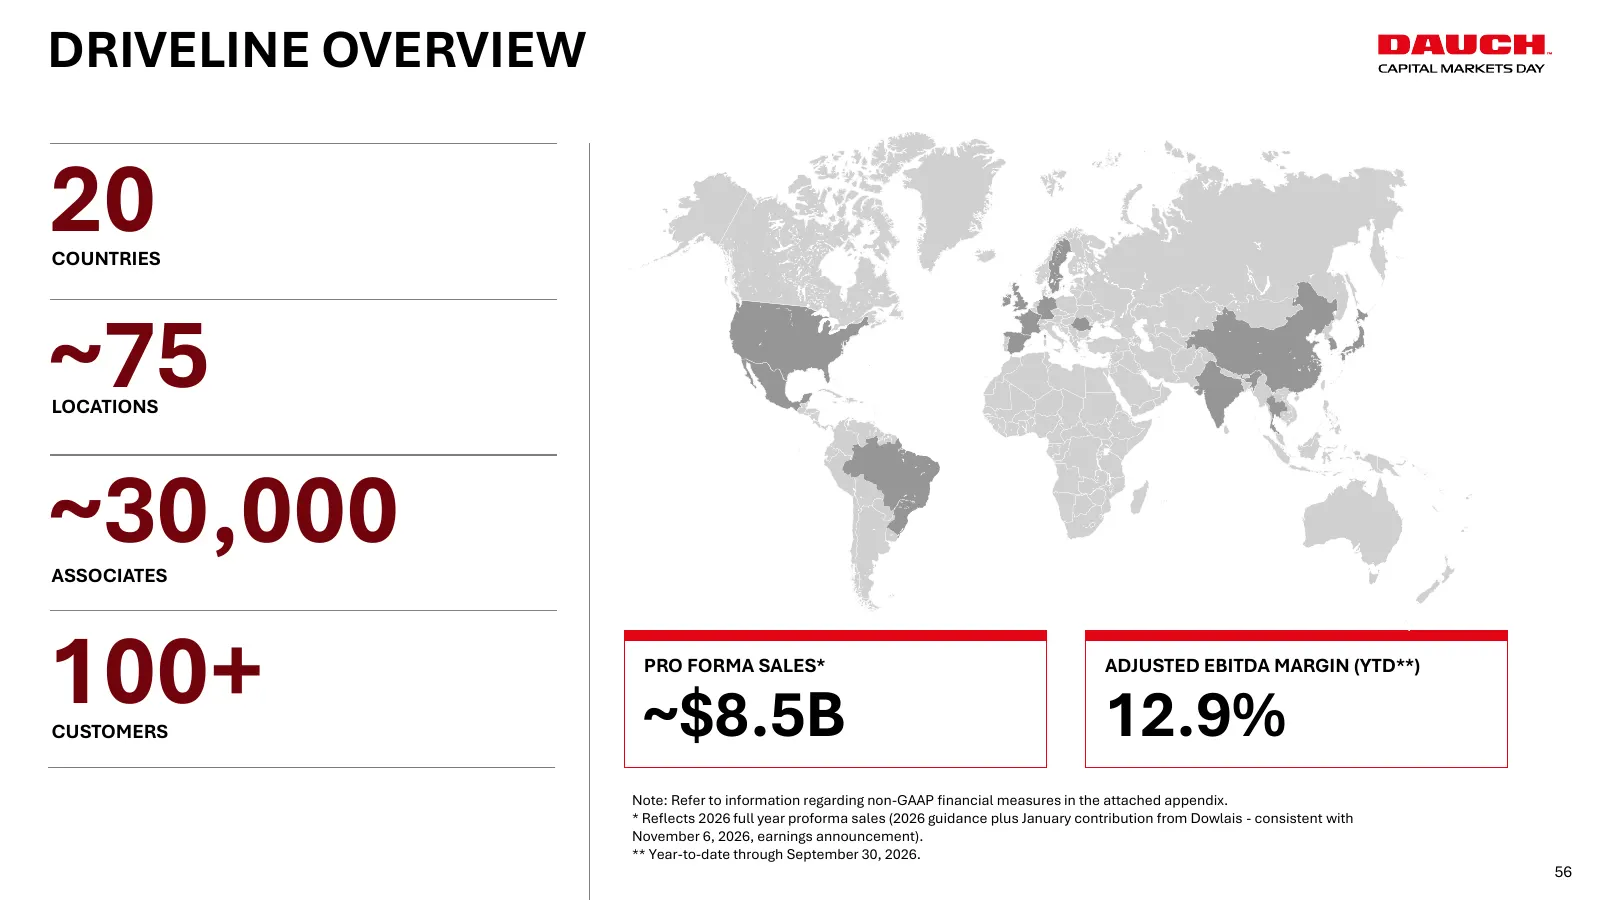
Slide 56: Driveline Overview
DRIVELINE OVERVIEW 20 COUNTRIES ~75 LOCATIONS ~30,000 ASSOCIATES 100+ CUSTOMERS PRO FORMA SALES* ~$8.5B ADJUSTED EBITDA MARGIN (YTD**) 12.9% Note: Refer to information regarding non-GAAP financial measures in the attached appendix. * Reflects 2026 full year proforma sales (2026 guidance plus January
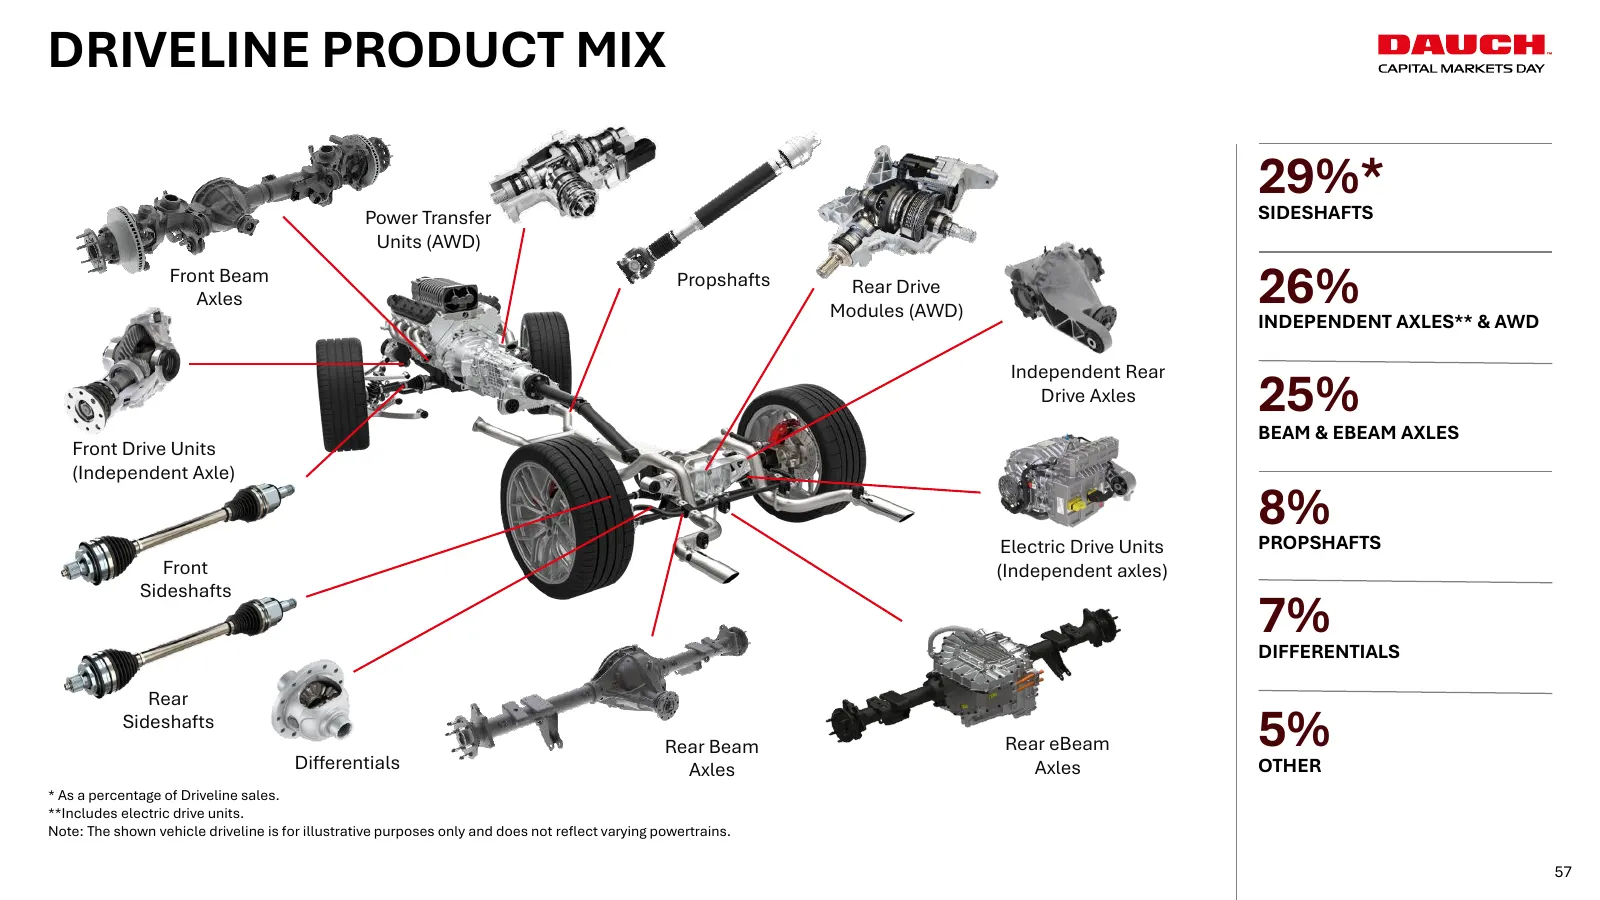
Slide 57: Driveline Product Mix
DRIVELINE PRODUCT MIX 29%* SIDESHAFTS Power Transfer Units (AWD) Front Beam Axles Propshafts Rear Drive Modules (AWD) 26% INDEPENDENT AXLES** & AWD Independent Rear Drive Axles 25% BEAM & EBEAM AXLES Front Drive Units (Independent Axle) 8% PROPSHAFTS Electric Drive Units Front (Independent axles) Si
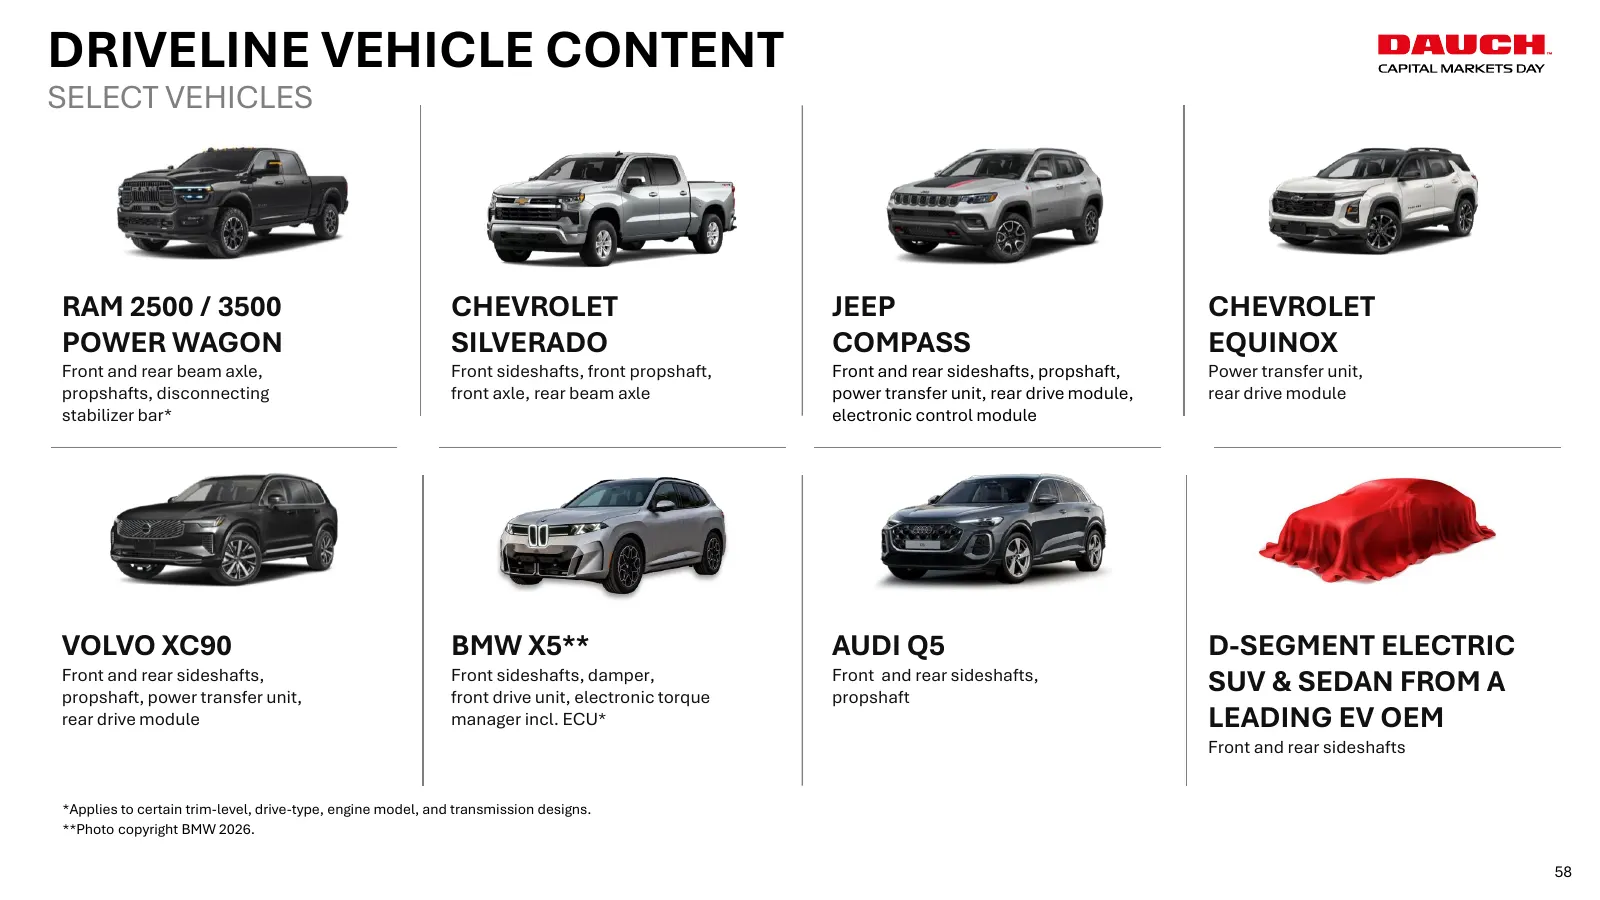
Slide 58: Driveline Vehicle Content
DRIVELINE VEHICLE CONTENT SELECT VEHICLES RAM 2500 / 3500 CHEVROLET JEEP CHEVROLET POWER WAGON SILVERADO COMPASS EQUINOX Front and rear beam axle, Front sideshafts, front propshaft, Front and rear sideshafts, propshaft, Power transfer unit, propshafts, disconnecting front axle, rear beam axle power
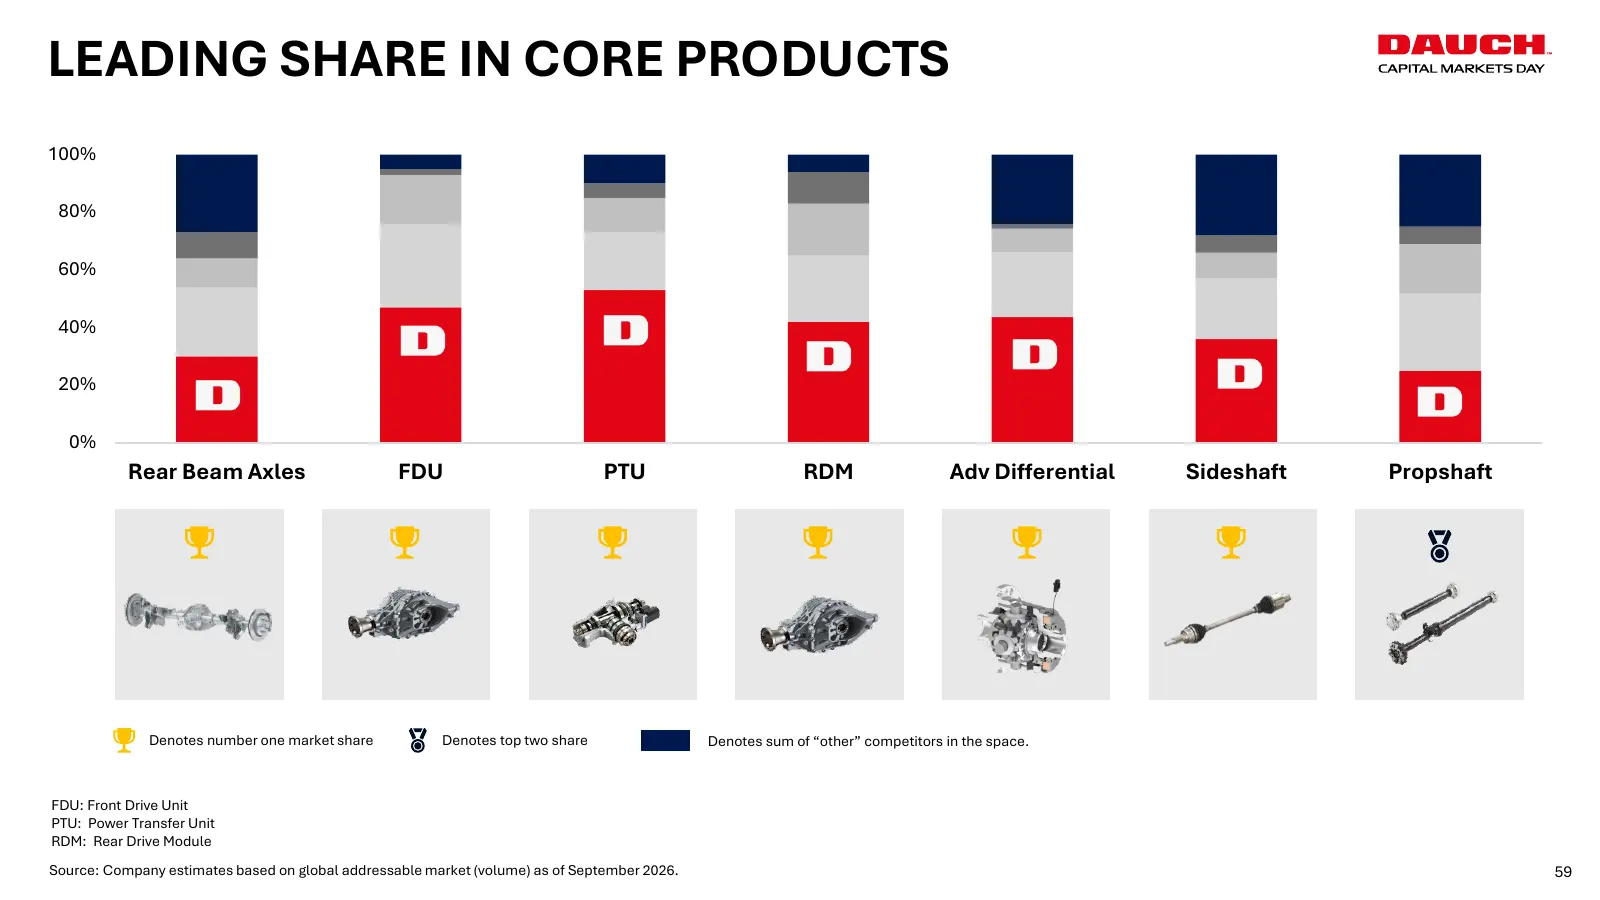
Slide 59: Leading Share in Core Products
LEADING SHARE IN CORE PRODUCTS 100% 80% 60% 40% 20% 0% Rear Beam Axles FDU PTU RDM Adv Differential Sideshaft Propshaft Denotes number one market share Denotes top two share Denotes sum of “other” competitors in the space. FDU: Front Drive Unit PTU: Power Transfer Unit RDM: Rear Drive Module Source:
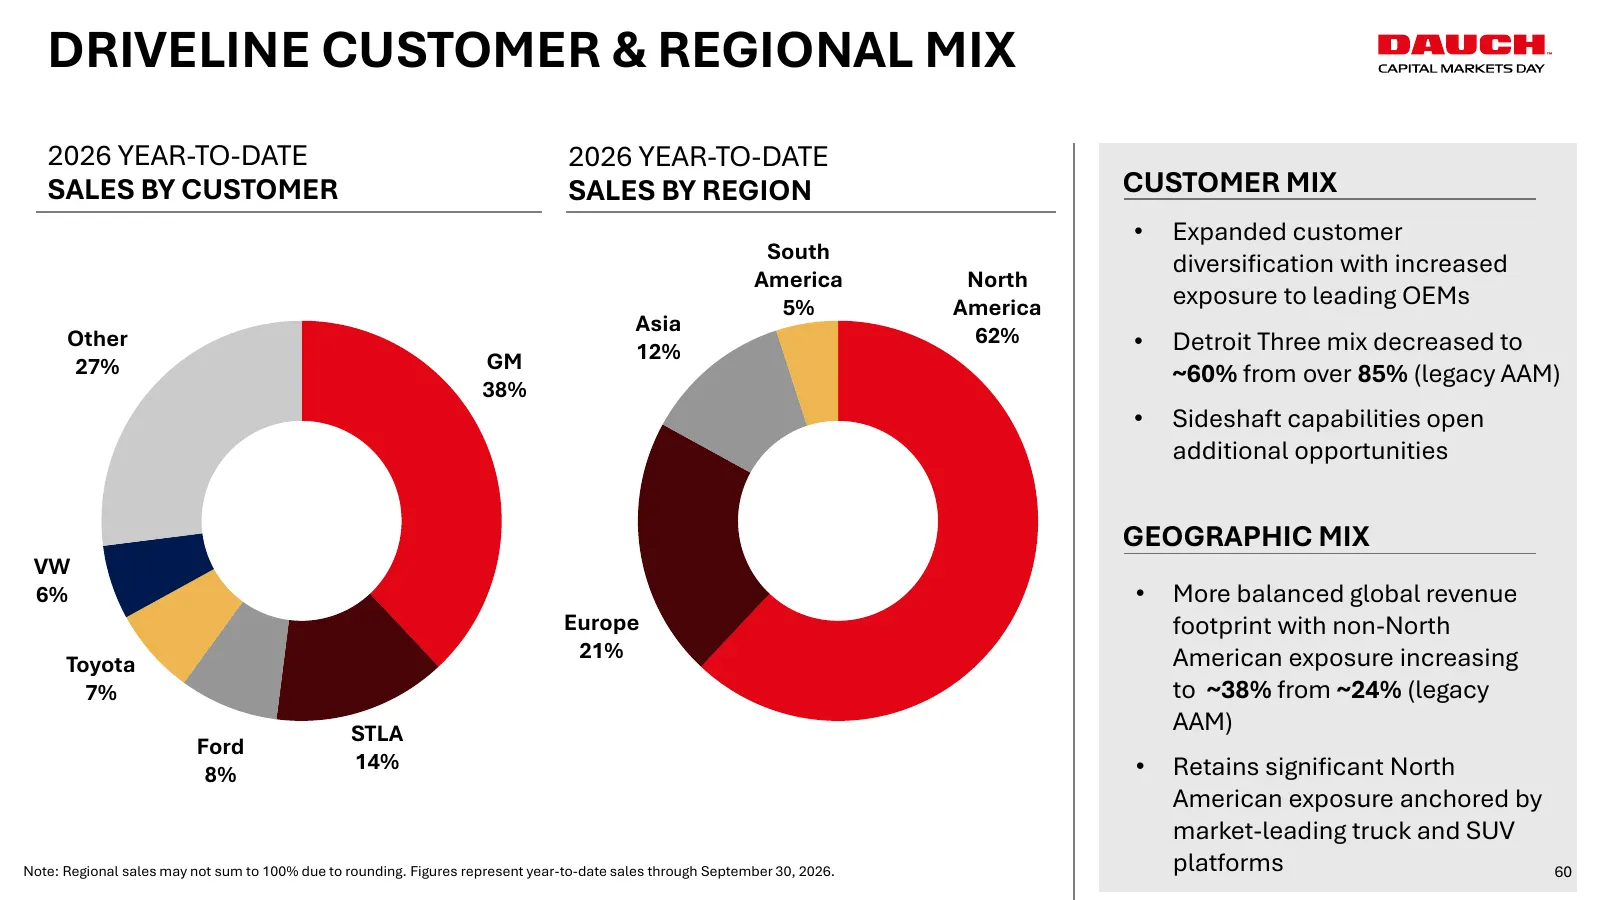
Slide 60: Driveline Customer & Regional Mix
DRIVELINE CUSTOMER & REGIONAL MIX 2026 YEAR-TO-DATE 2026 YEAR-TO-DATE SALES BY CUSTOMER SALES BY REGION CUSTOMER MIX • Expanded customer South diversification with increased America North 5% America exposure to leading OEMs Asia Other 62% • Detroit Three mix decreased to GM 12% 27% ~60% from over 85
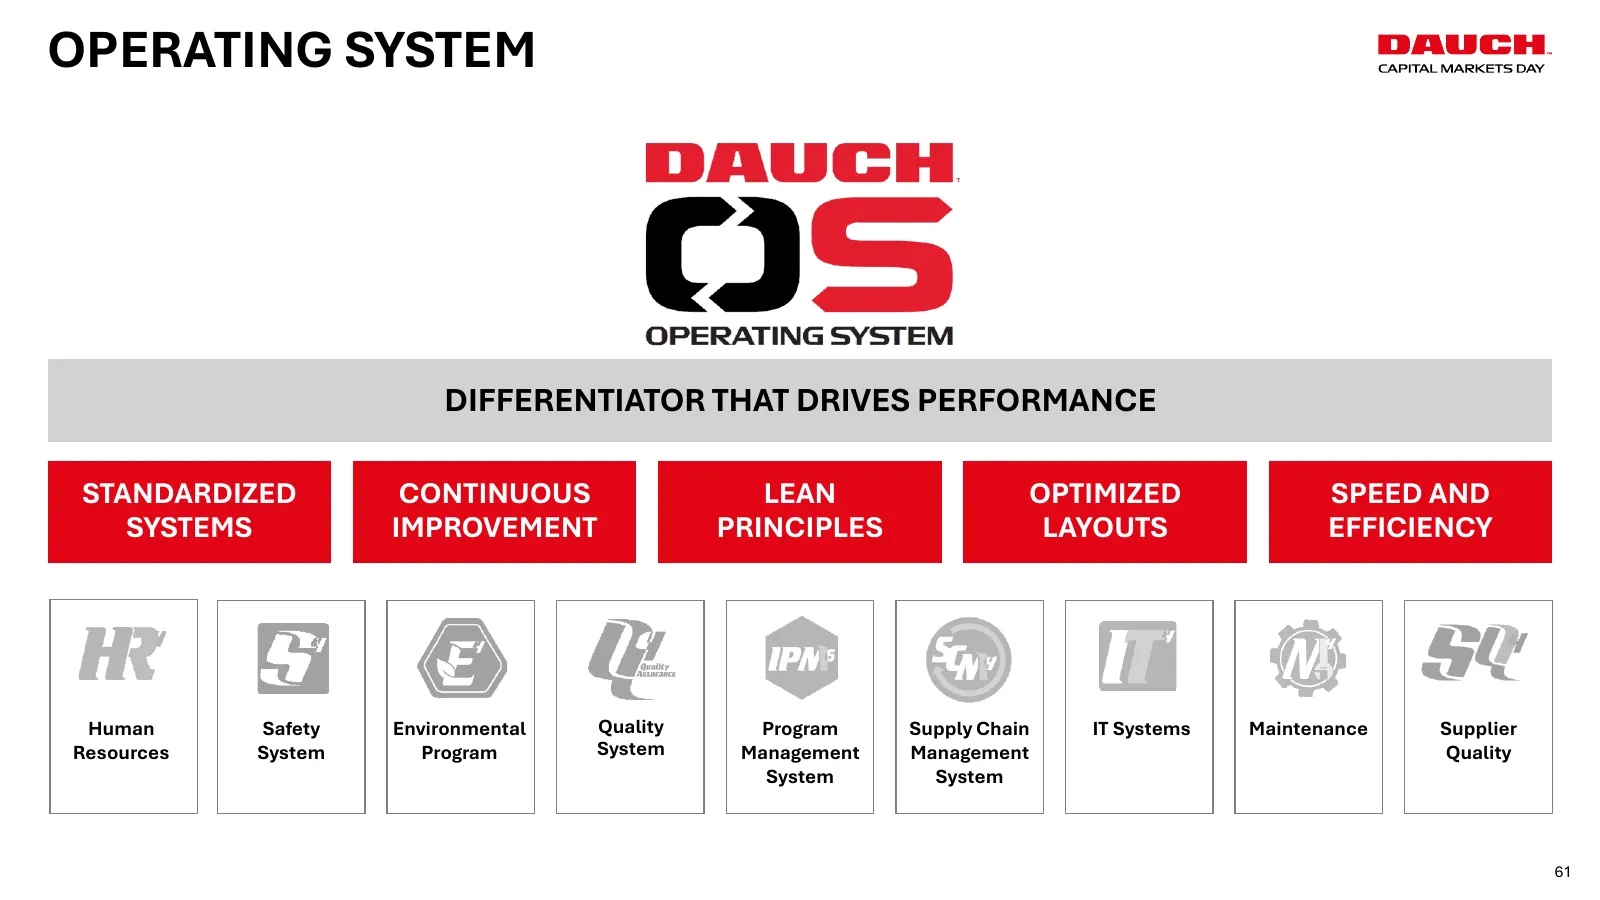
Slide 61: Operating System
OPERATING SYSTEM DIFFERENTIATOR THAT DRIVES PERFORMANCE STANDARDIZED CONTINUOUS LEAN OPTIMIZED SPEED AND SYSTEMS IMPROVEMENT PRINCIPLES LAYOUTS EFFICIENCY Human Safety Environmental Quality Program Supply Chain IT Systems Maintenance Supplier Resources System Program System Management Management Qua
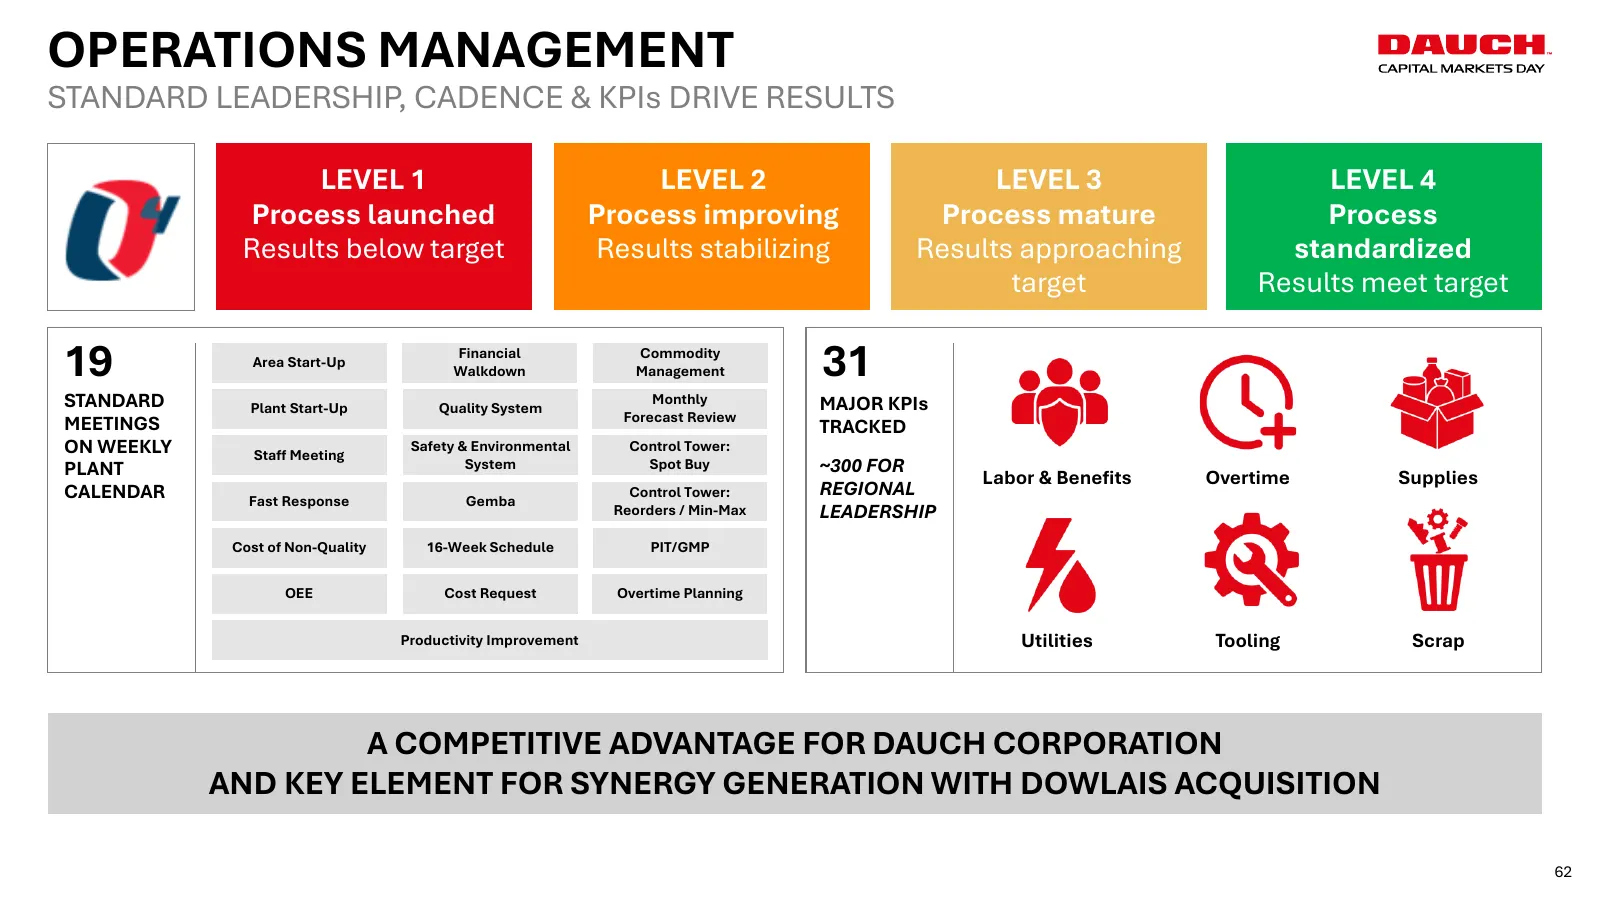
Slide 62: Operations Management
OPERATIONS MANAGEMENT STANDARD LEADERSHIP, CADENCE & KPIs DRIVE RESULTS LEVEL 1 LEVEL 2 LEVEL 3 LEVEL 4 Process launched Process improving Process mature Process Results below target Results stabilizing Results approaching standardized target Results meet target 19 Area Start-Up Financial Walkdown C
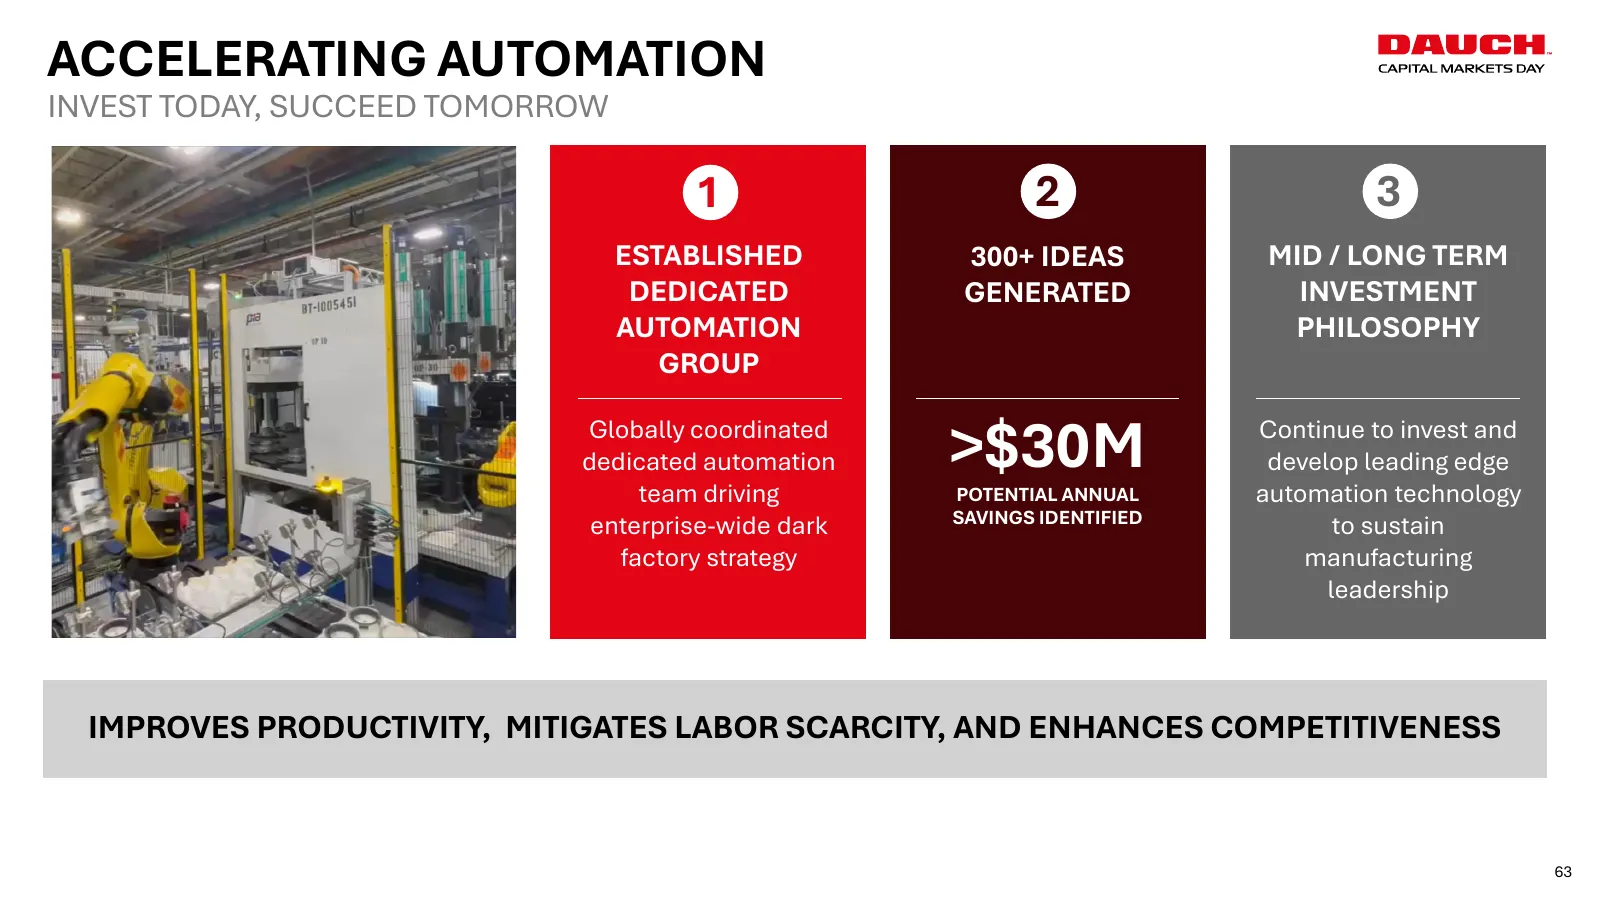
Slide 63: Accelerating Automation
ACCELERATING AUTOMATION INVEST TODAY, SUCCEED TOMORROW Results approaching target 1 2 3 ESTABLISHED 300+ IDEAS MID / LONG TERM DEDICATED GENERATED INVESTMENT ESTABLISHED MID / LONG TERM AUTOMATION PHILOSOPHY DEDICATED INVESTMENT GROUP GROUP AUTOMATION PHILOSOPHY Globally coordinated Globally dedicat
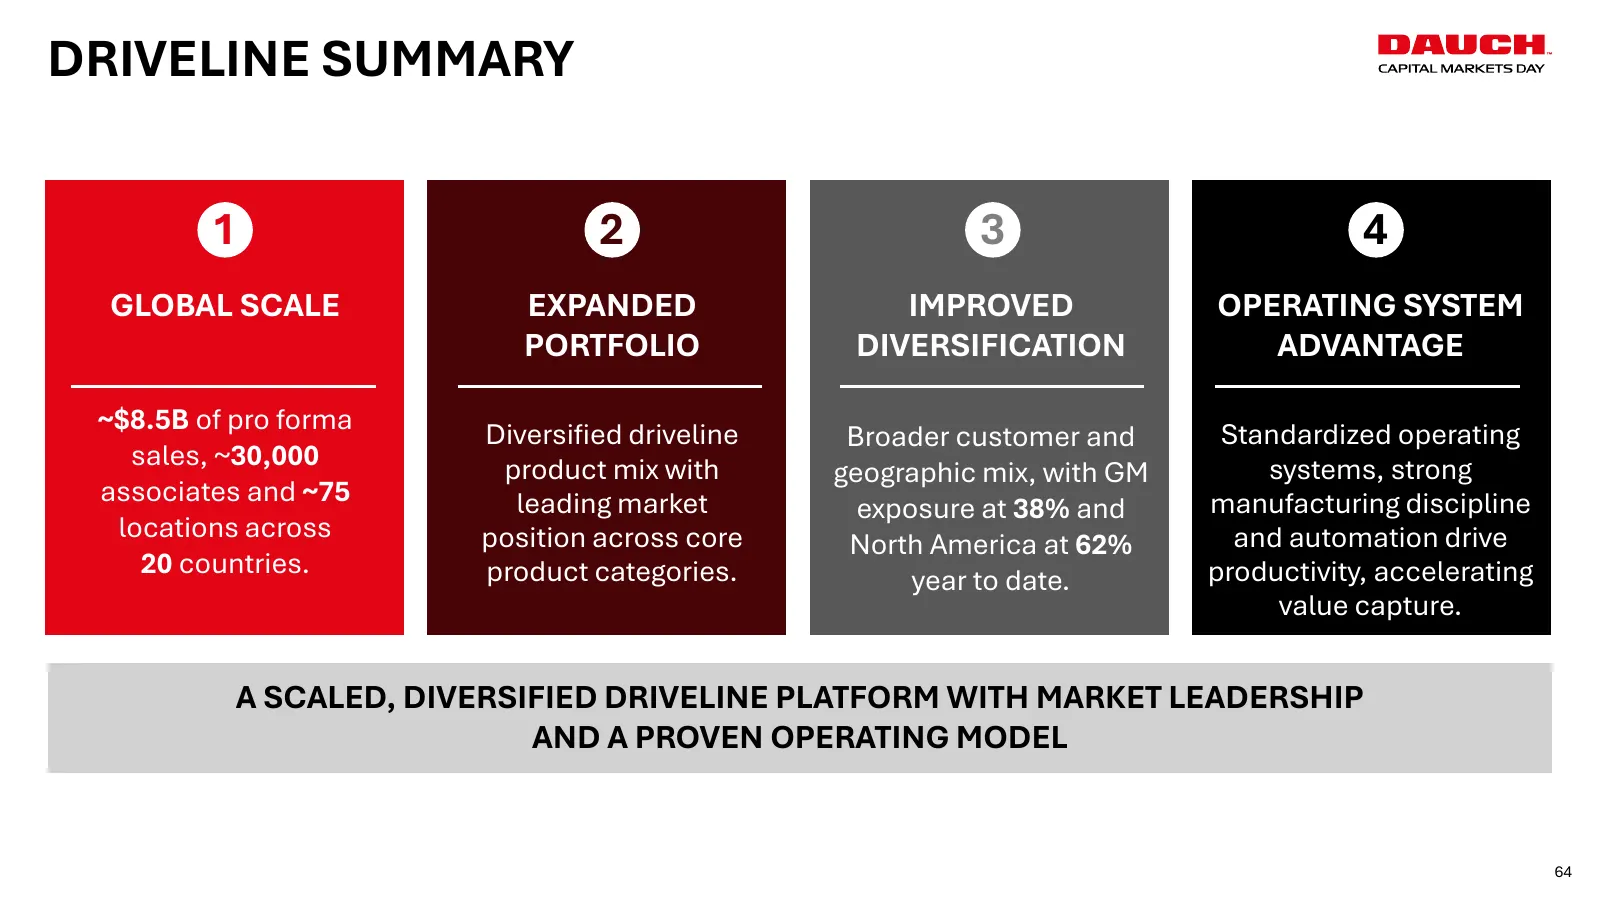
Slide 64: Driveline Summary
DRIVELINE SUMMARY 1 2 3 4 GLOBAL SCALE EXPANDED IMPROVED OPERATING SYSTEM PORTFOLIO DIVERSIFICATION ADVANTAGE ~$8.5B of pro forma Diversified driveline Broader customer and Standardized operating sales, ~30,000 product mix with systems, strong geographic mix, with GM associates and ~75 leading marke
Slide 65: Markus Bannert, President, Metal Forming
MARKUS BANNERT PRESIDENT, METAL FORMING 65 65
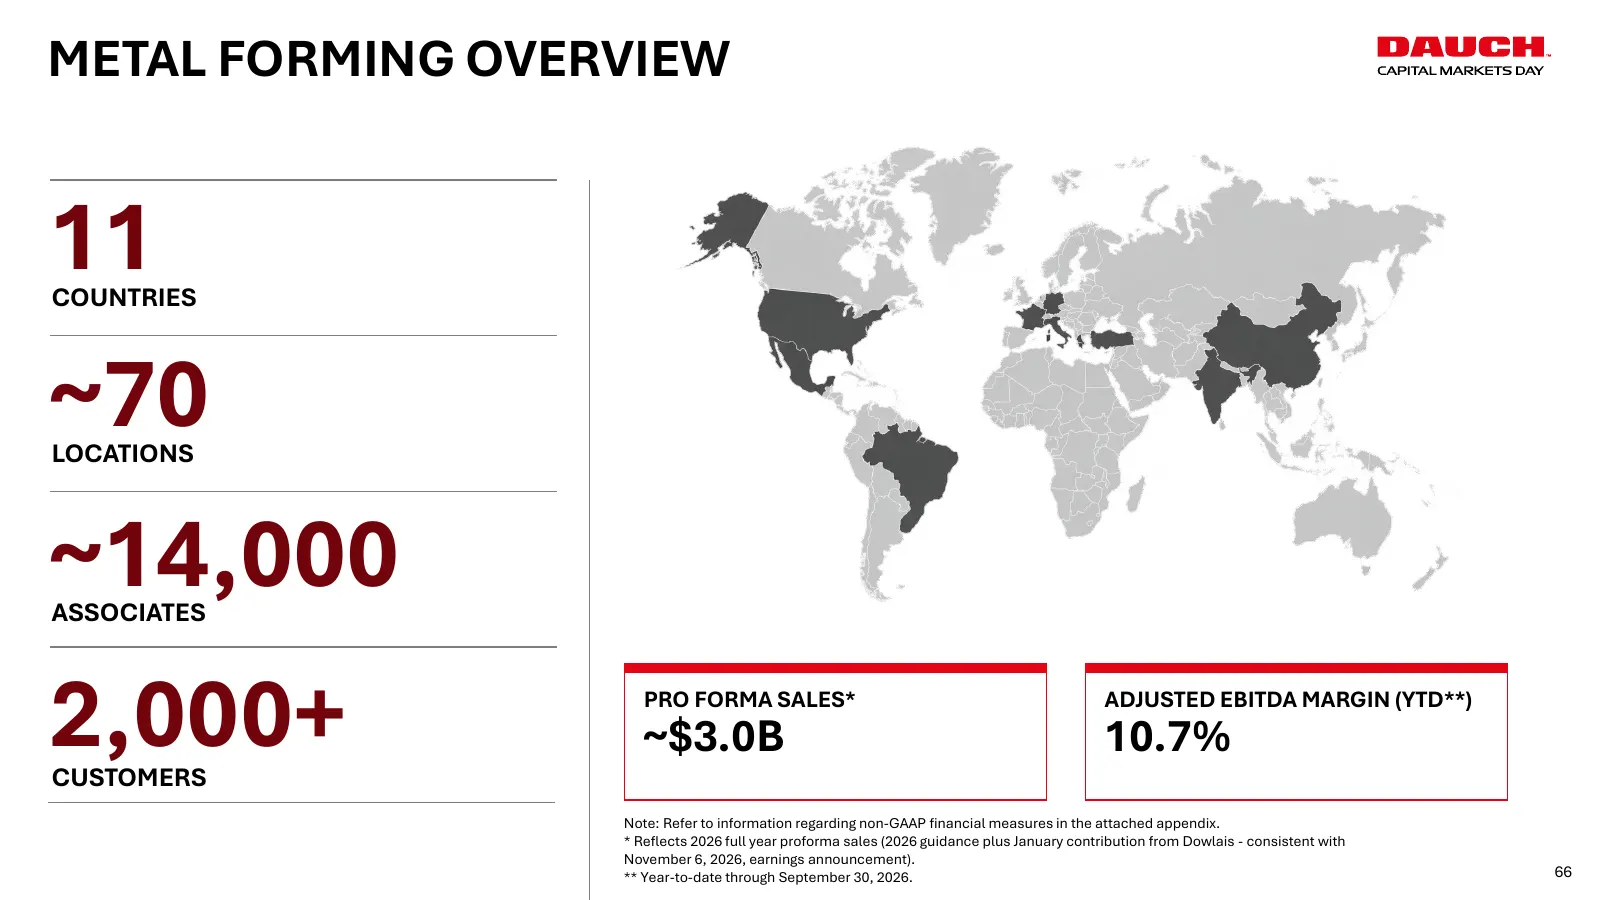
Slide 66: Metal Forming Overview
METAL FORMING OVERVIEW 11 COUNTRIES ~70 LOCATIONS ~14,000 ASSOCIATES 2,000+ CUSTOMERS PRO FORMA SALES* ~$3.0B ADJUSTED EBITDA MARGIN (YTD**) 10.7% Note: Refer to information regarding non-GAAP financial measures in the attached appendix. * Reflects 2026 full year proforma sales (2026 guidance plus J
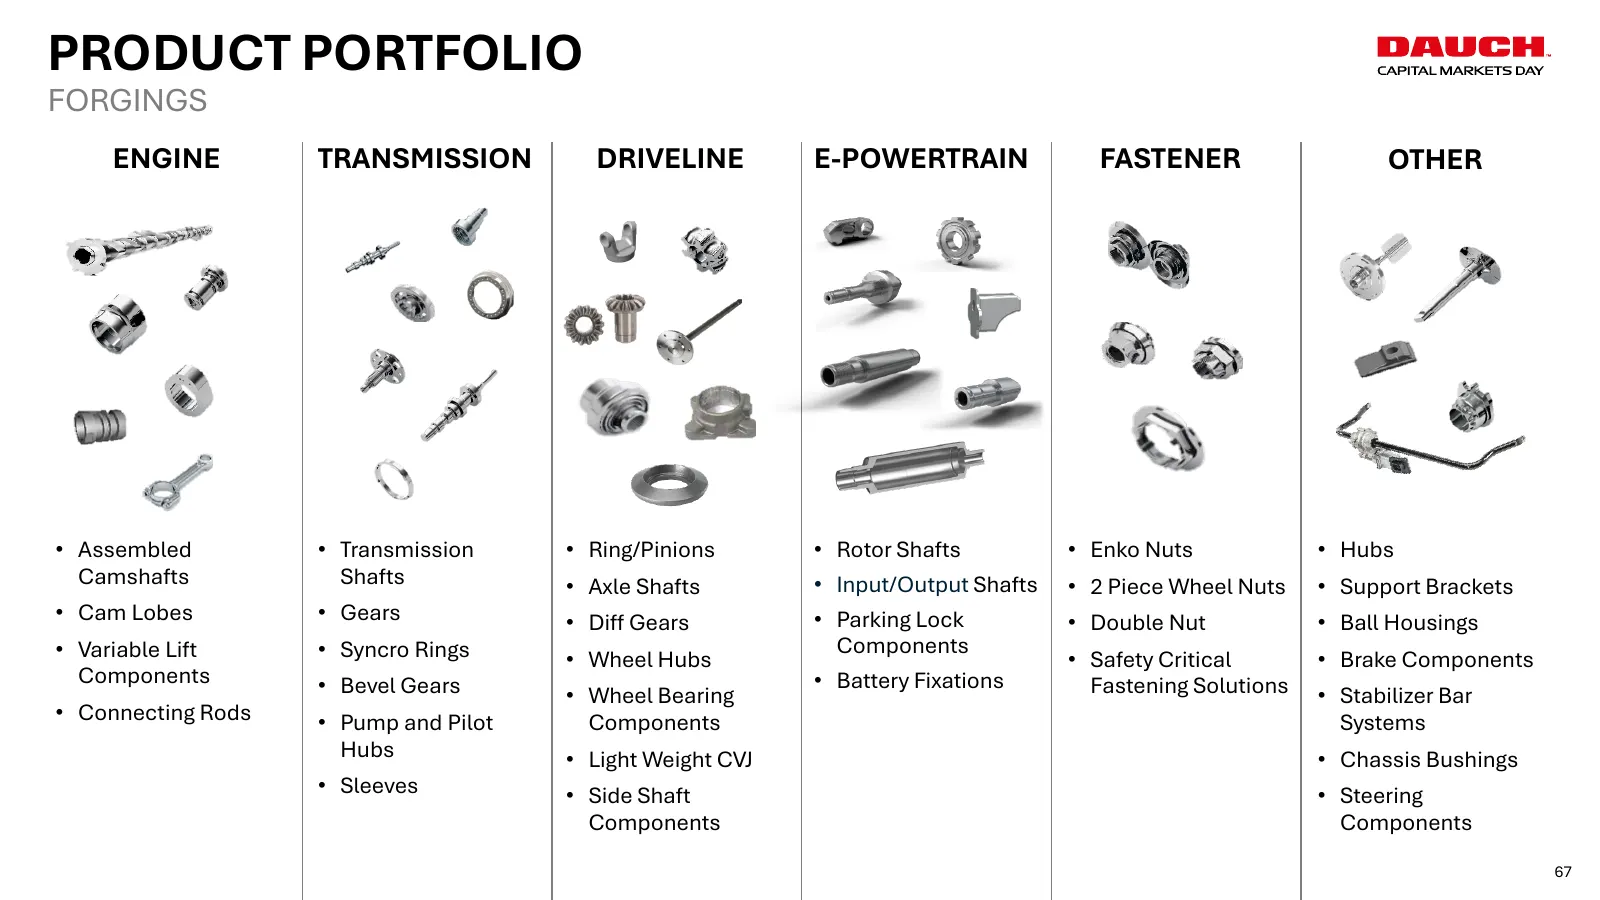
Slide 67: Product Portfolio – Forgings
PRODUCT PORTFOLIO FORGINGS ENGINE TRANSMISSION DRIVELINE E-POWERTRAIN FASTENER OTHER • Assembled • Transmission • Ring/Pinions • Rotor Shafts • Enko Nuts • Hubs Camshafts Shafts • Axle Shafts • Input/Output Shafts • 2 Piece Wheel Nuts • Support Brackets • Cam Lobes • Gears • Diff Gears • Parking Loc
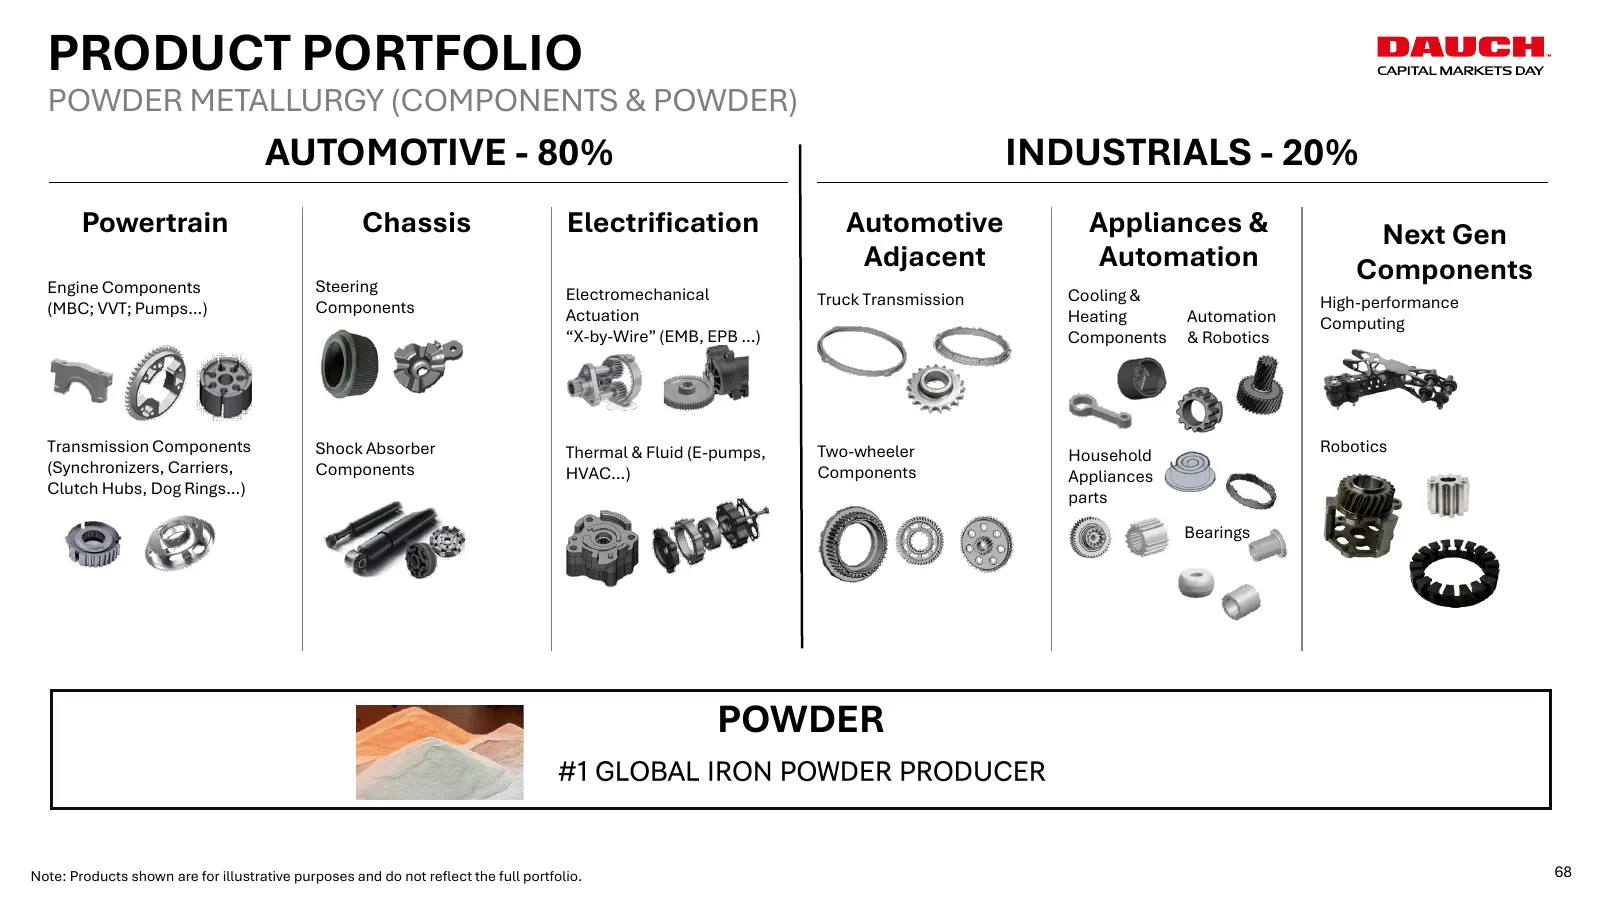
Slide 68: Product Portfolio – Powder Metallurgy
PRODUCT PORTFOLIO POWDER METALLURGY (COMPONENTS & POWDER) AUTOMOTIVE - 80% INDUSTRIALS - 20% Powertrain Chassis Electrification Automotive Appliances & Next Gen Adjacent Automation Components Engine Components Steering Electromechanical Truck Transmission Cooling & High-performance (MBC; VVT; Pumps…
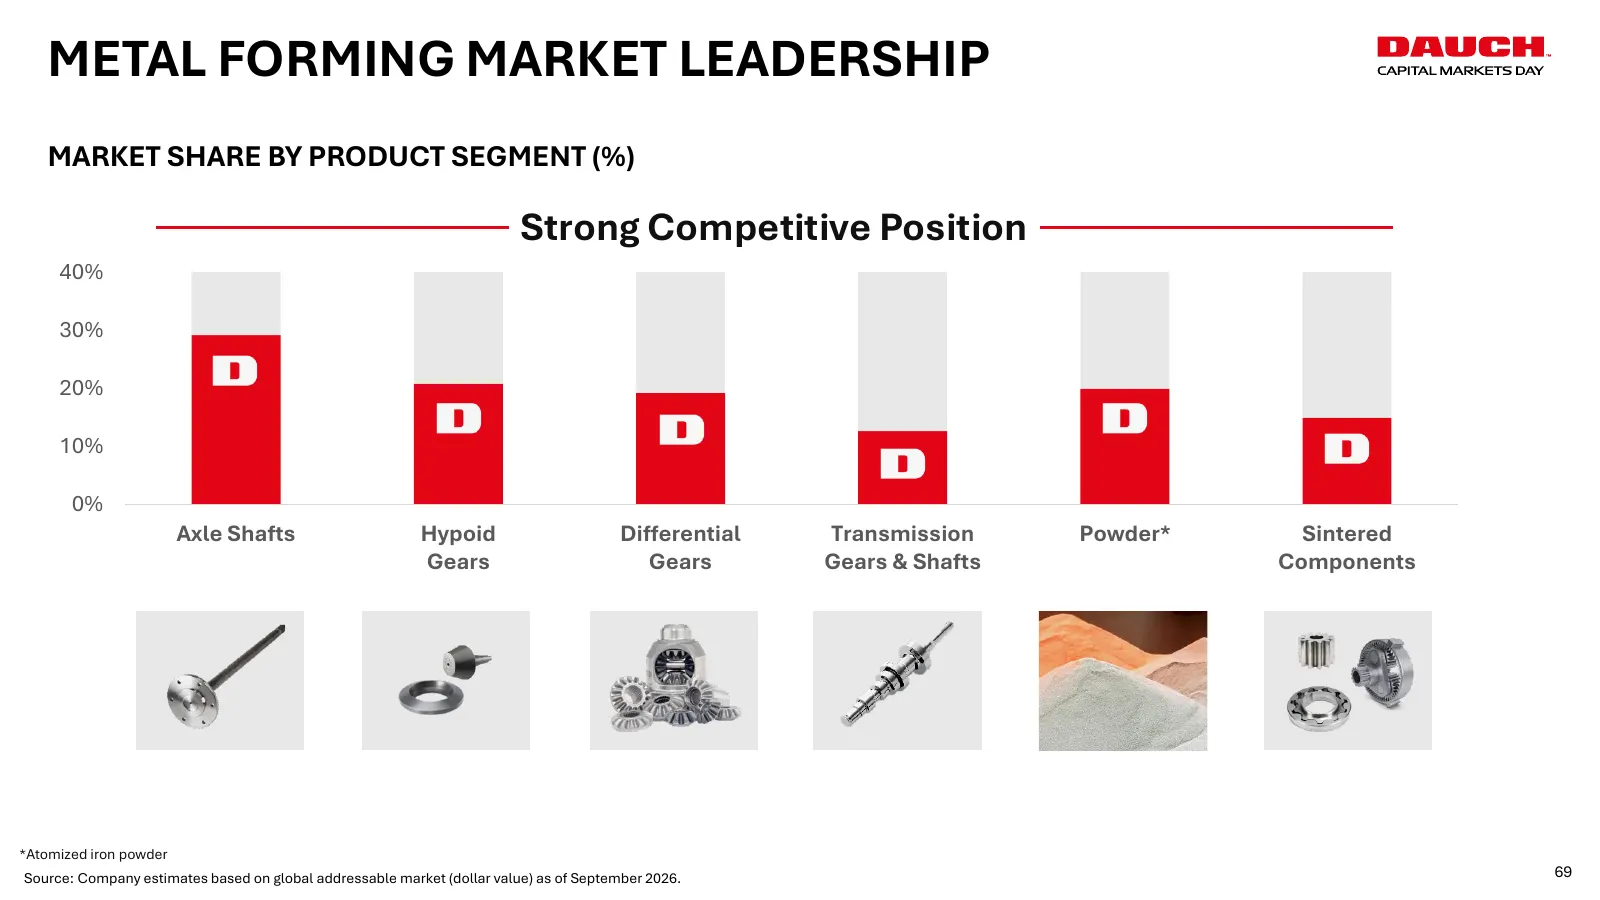
Slide 69: Metal Forming Market Leadership
METAL FORMING MARKET LEADERSHIP MARKET SHARE BY PRODUCT SEGMENT (%) Strong Competitive Position 40% 30% 20% 10% 0% Axle Shafts Hypoid Differential Transmission Powder* Sintered Gears Gears Gears & Shafts Components *Atomized iron powder Source: Company estimates based on global addressable market (d
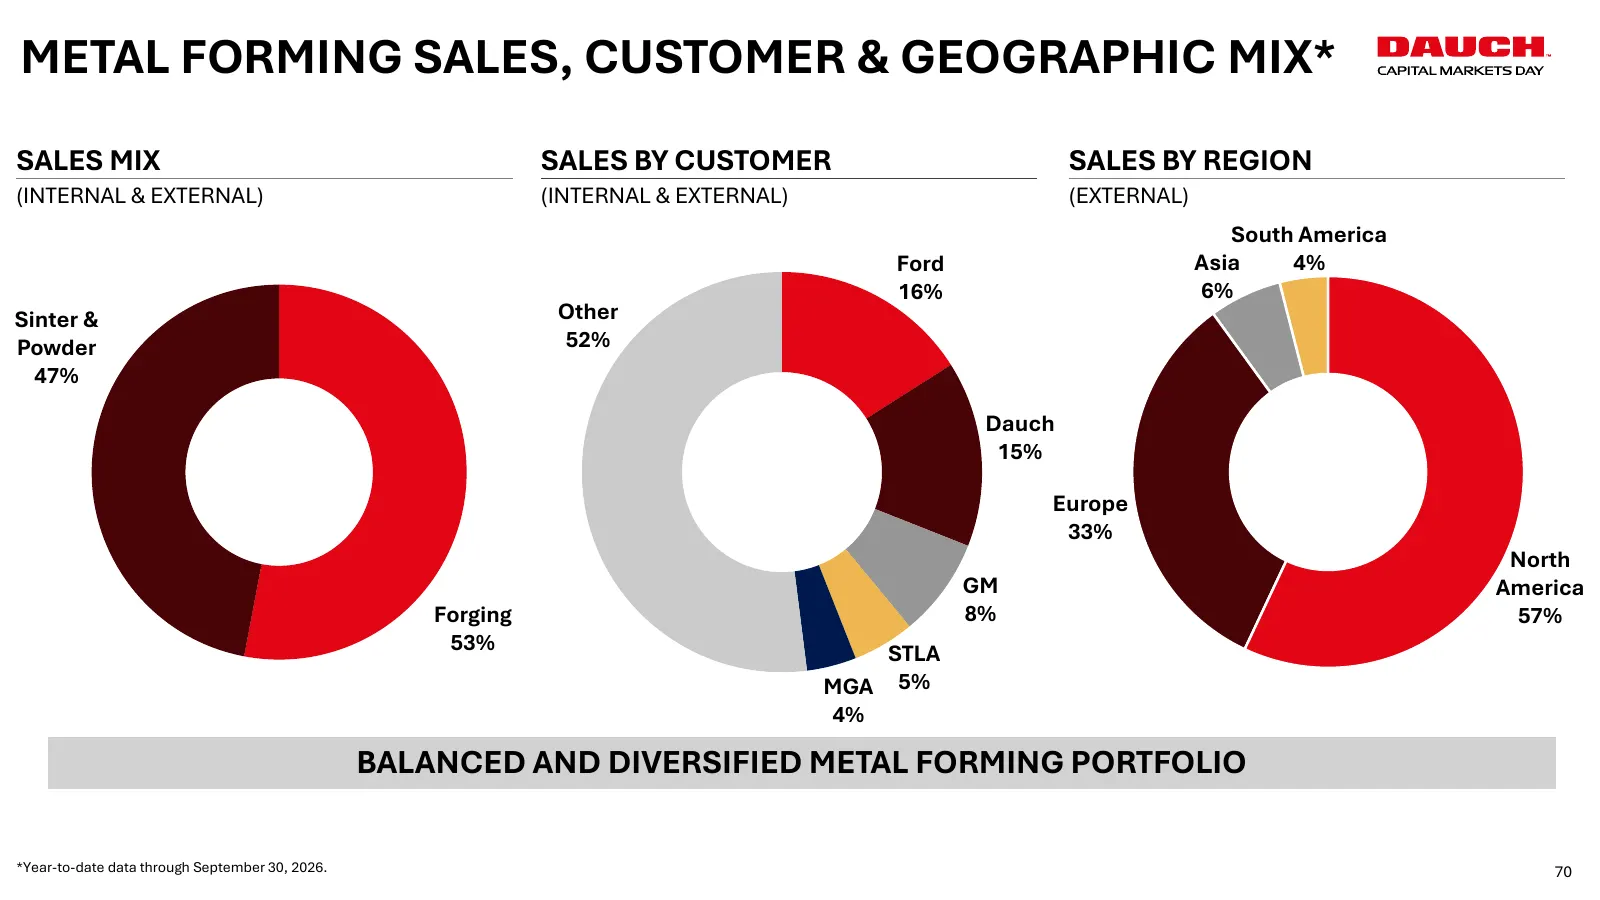
Slide 70: Metal Forming Sales, Customer & Geographic Mix
METAL FORMING SALES, CUSTOMER & GEOGRAPHIC MIX* SALES MIX SALES BY CUSTOMER SALES BY REGION (INTERNAL & EXTERNAL) (INTERNAL & EXTERNAL) (EXTERNAL) South America Ford Asia 4% 16% 6% Sinter & Other Powder 52% 47% Dauch 15% Europe 33% North GM America Forging 8% 57% 53% STLA MGA 5% 4% BALANCED AND DIVE
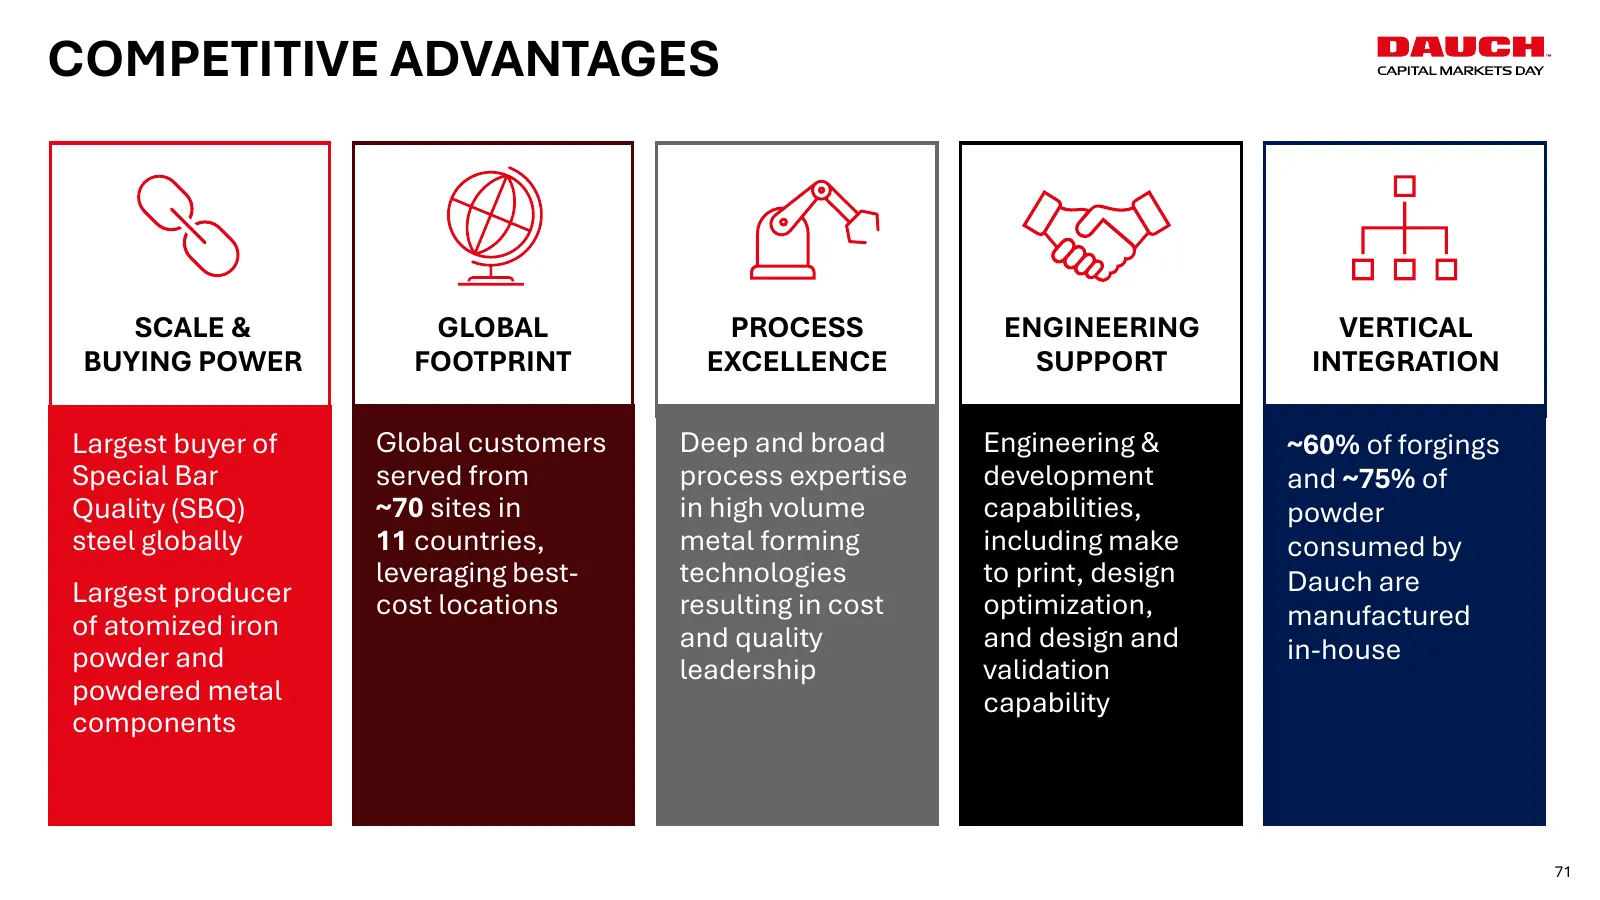
Slide 71: Competitive Advantages
COMPETITIVE ADVANTAGES SCALE & GLOBAL PROCESS ENGINEERING VERTICAL BUYING POWER FOOTPRINT EXCELLENCE SUPPORT INTEGRATION Largest buyer of Global customers Deep and broad Engineering & ~60% of forgings Special Bar served from process expertise development and ~75% of Quality (SBQ) ~70 sites in in hig
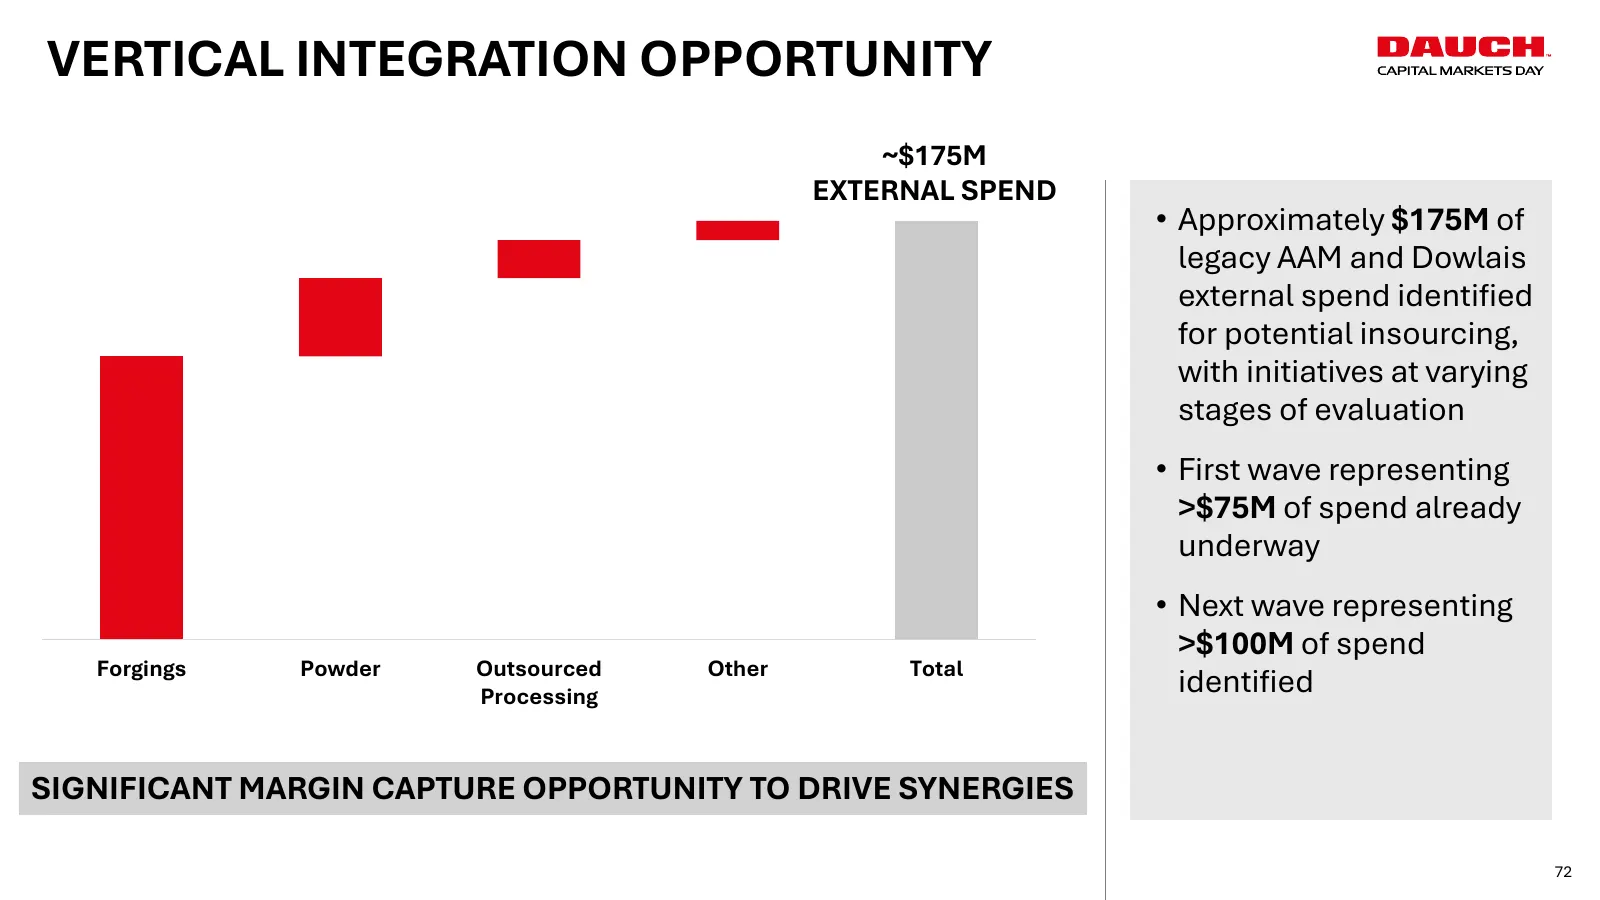
Slide 72: Vertical Integration Opportunity
VERTICAL INTEGRATION OPPORTUNITY ~$175M EXTERNAL SPEND • Approximately $175M of legacy AAM and Dowlais external spend identified for potential insourcing, with initiatives at varying stages of evaluation • First wave representing >$75M of spend already underway • Next wave representing >$100M of spe
Slide 73: Metal Forming Summary
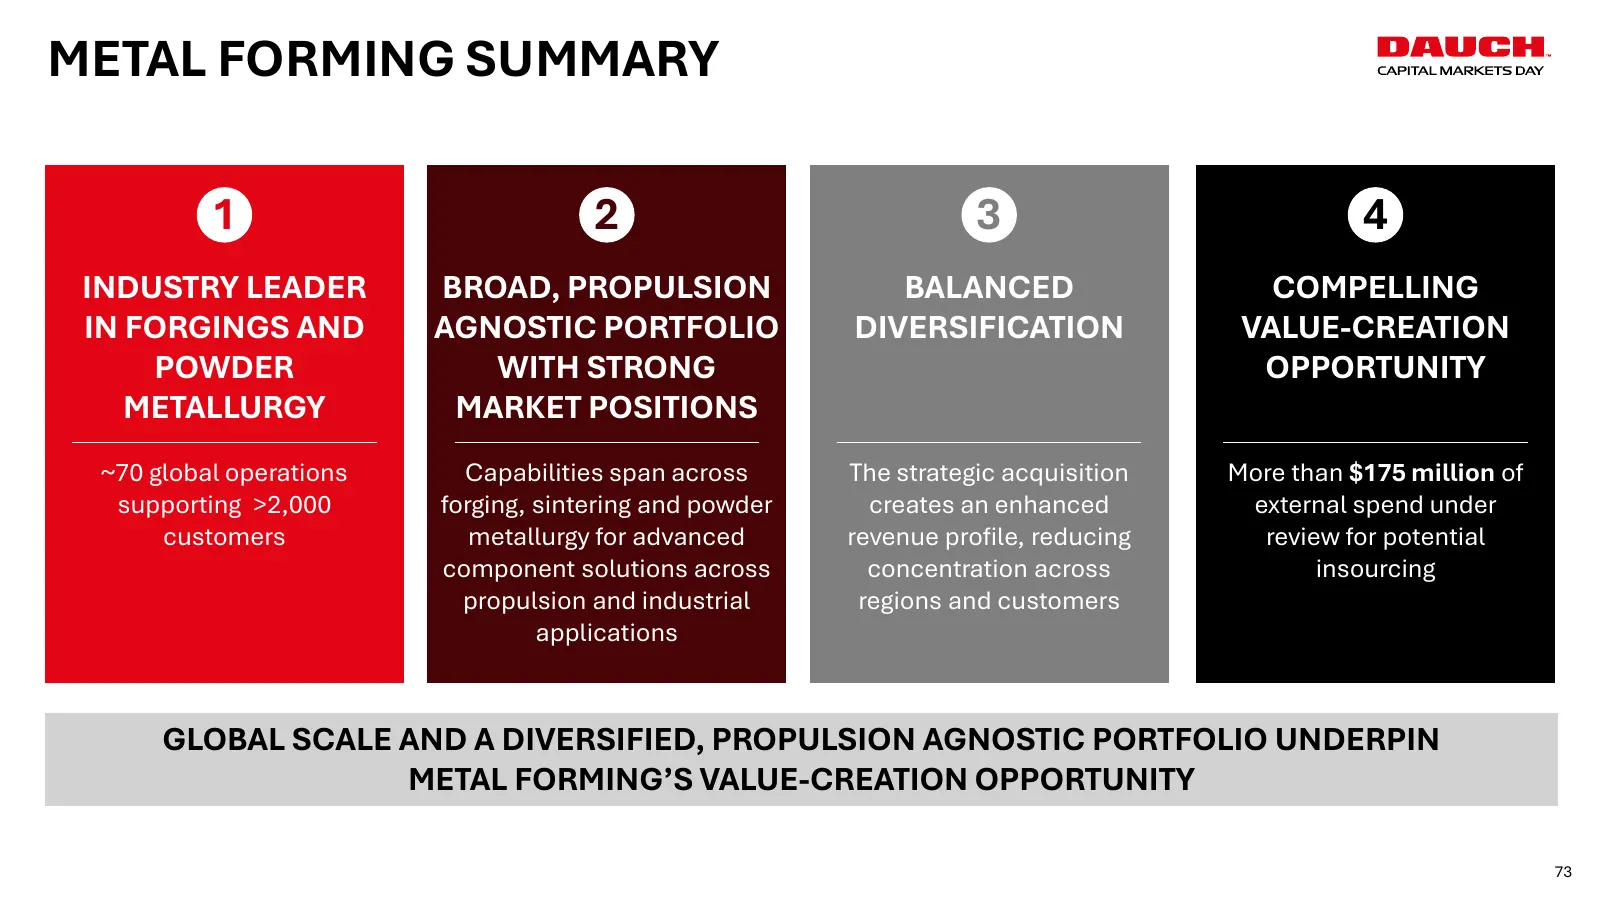
METAL FORMING SUMMARY 1 2 3 4 INDUSTRY LEADER BROAD, PROPULSION BALANCED COMPELLING IN FORGINGS AND AGNOSTIC PORTFOLIO DIVERSIFICATION VALUE-CREATION POWDER WITH STRONG OPPORTUNITY METALLURGY MARKET POSITIONS ~70 global operations Capabilities span across The strategic acquisition More than $175 mil
Slide 74: Christopher May, EVP & CFO
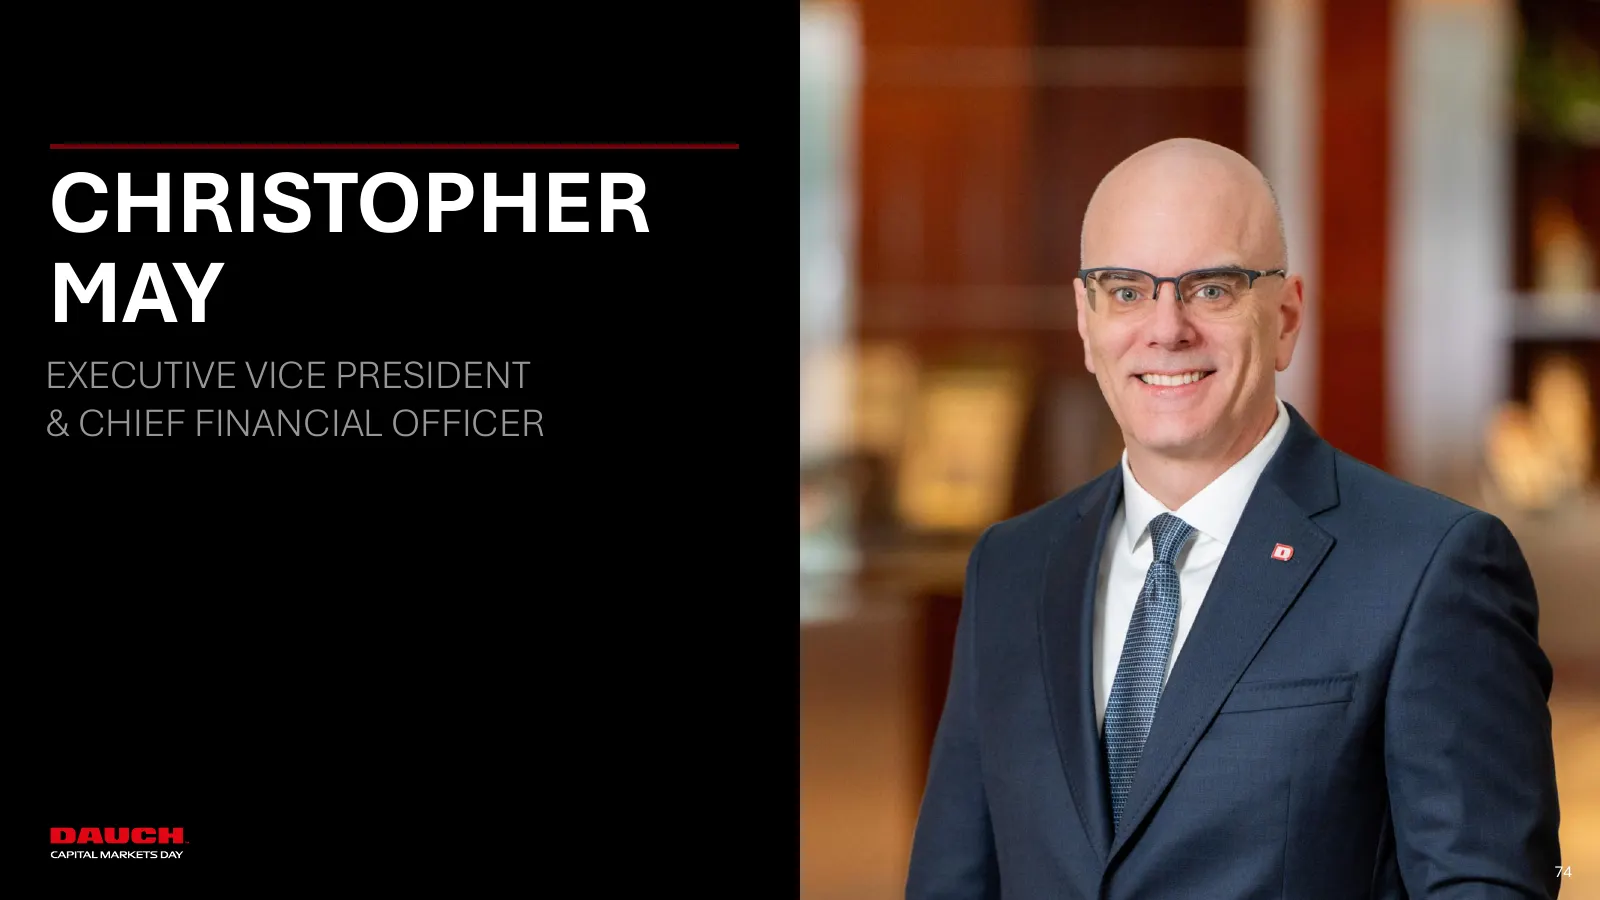
CHRISTOPHER MAY EXECUTIVE VICE PRESIDENT & CHIEF FINANCIAL OFFICER 74 74
Slide 75: Agenda
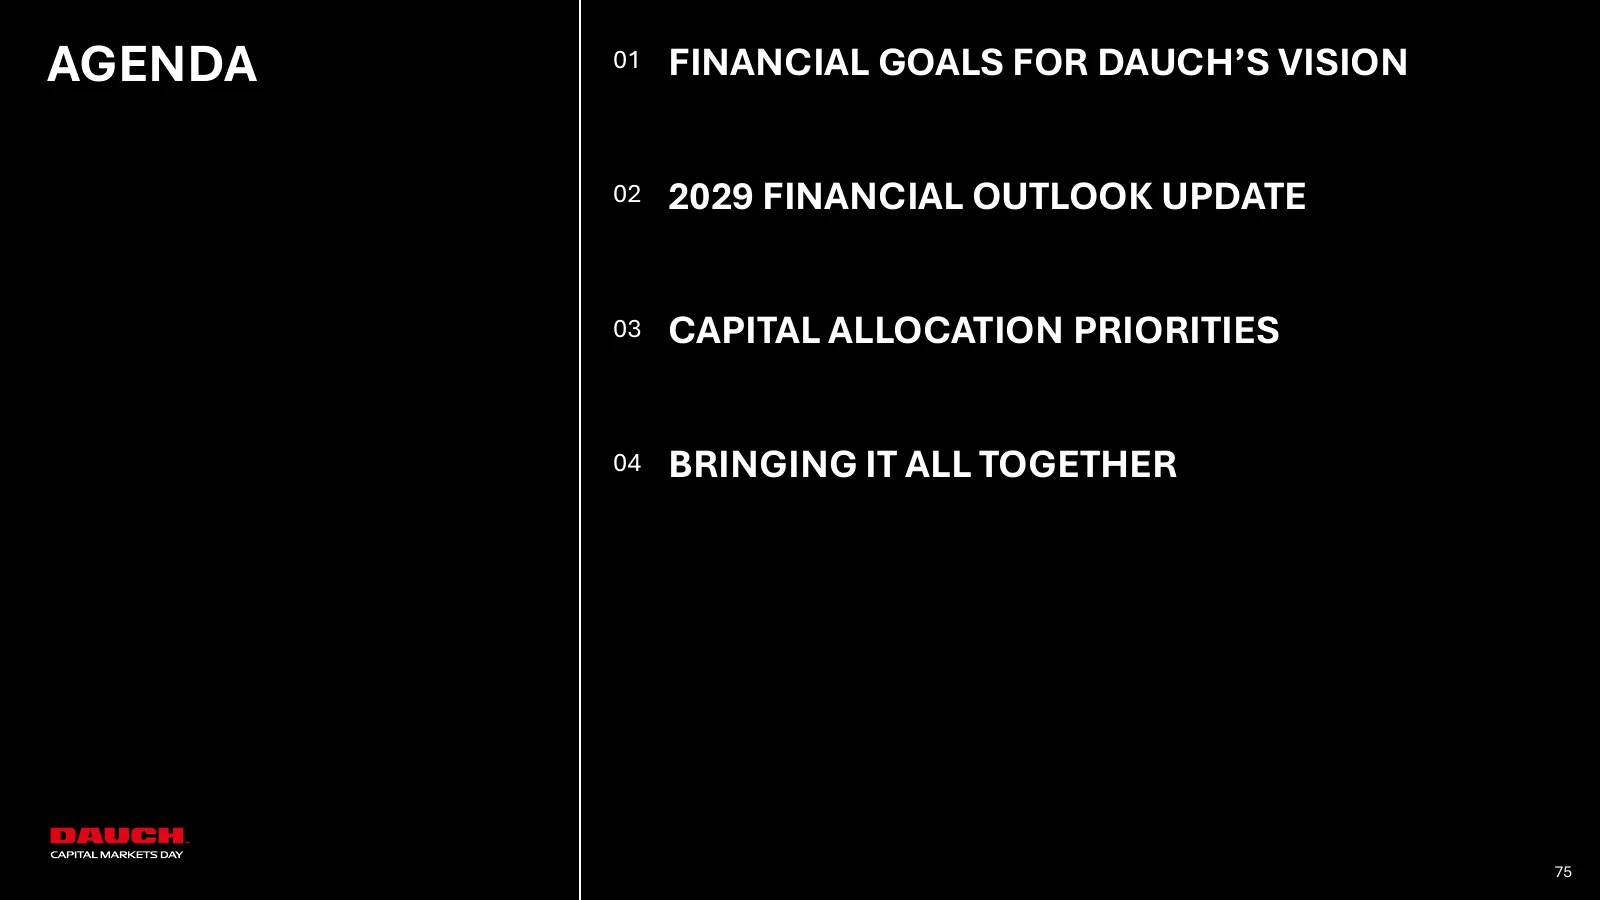
AGENDA 01 FINANCIAL GOALS FOR DAUCH’S VISION 02 2029 FINANCIAL OUTLOOK UPDATE 03 CAPITAL ALLOCATION PRIORITIES 04 BRINGING IT ALL TOGETHER 75
Slide 76: Financial Goals for Dauch's Vision
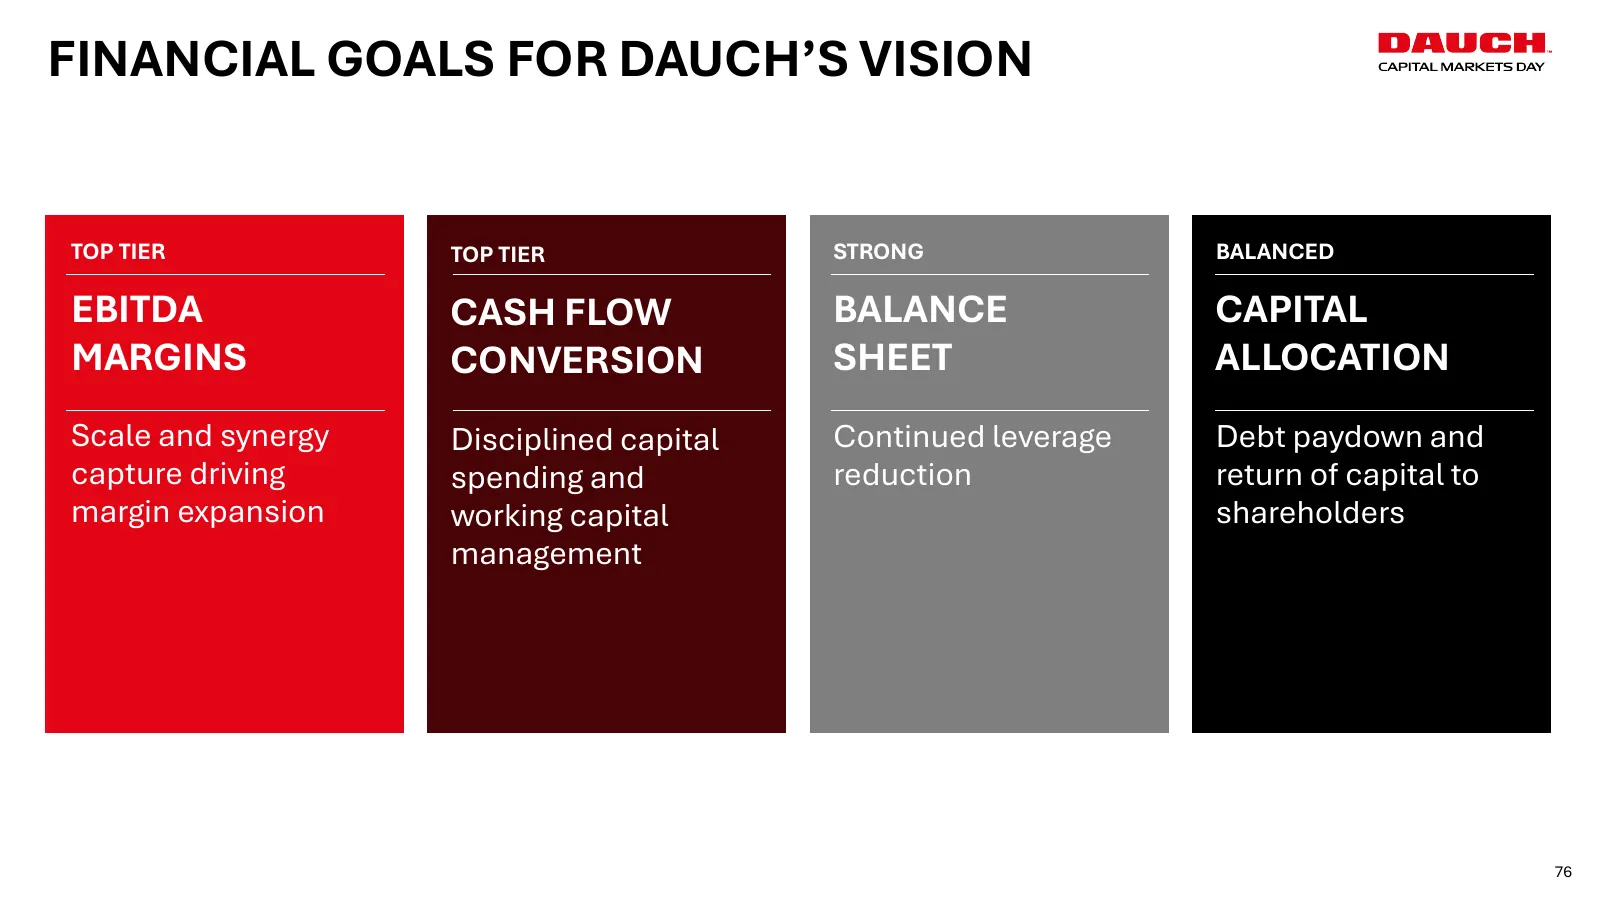
FINANCIAL GOALS FOR DAUCH’S VISION TOP TIER TOP TIER STRONG BALANCED EBITDA CASH FLOW BALANCE CAPITAL MARGINS CONVERSION SHEET ALLOCATION Scale and synergy Disciplined capital Continued leverage Debt paydown and capture driving spending and reduction return of capital to margin expansion working cap
Slide 77: Financial Goals for Dauch's Vision – 2029 Targets
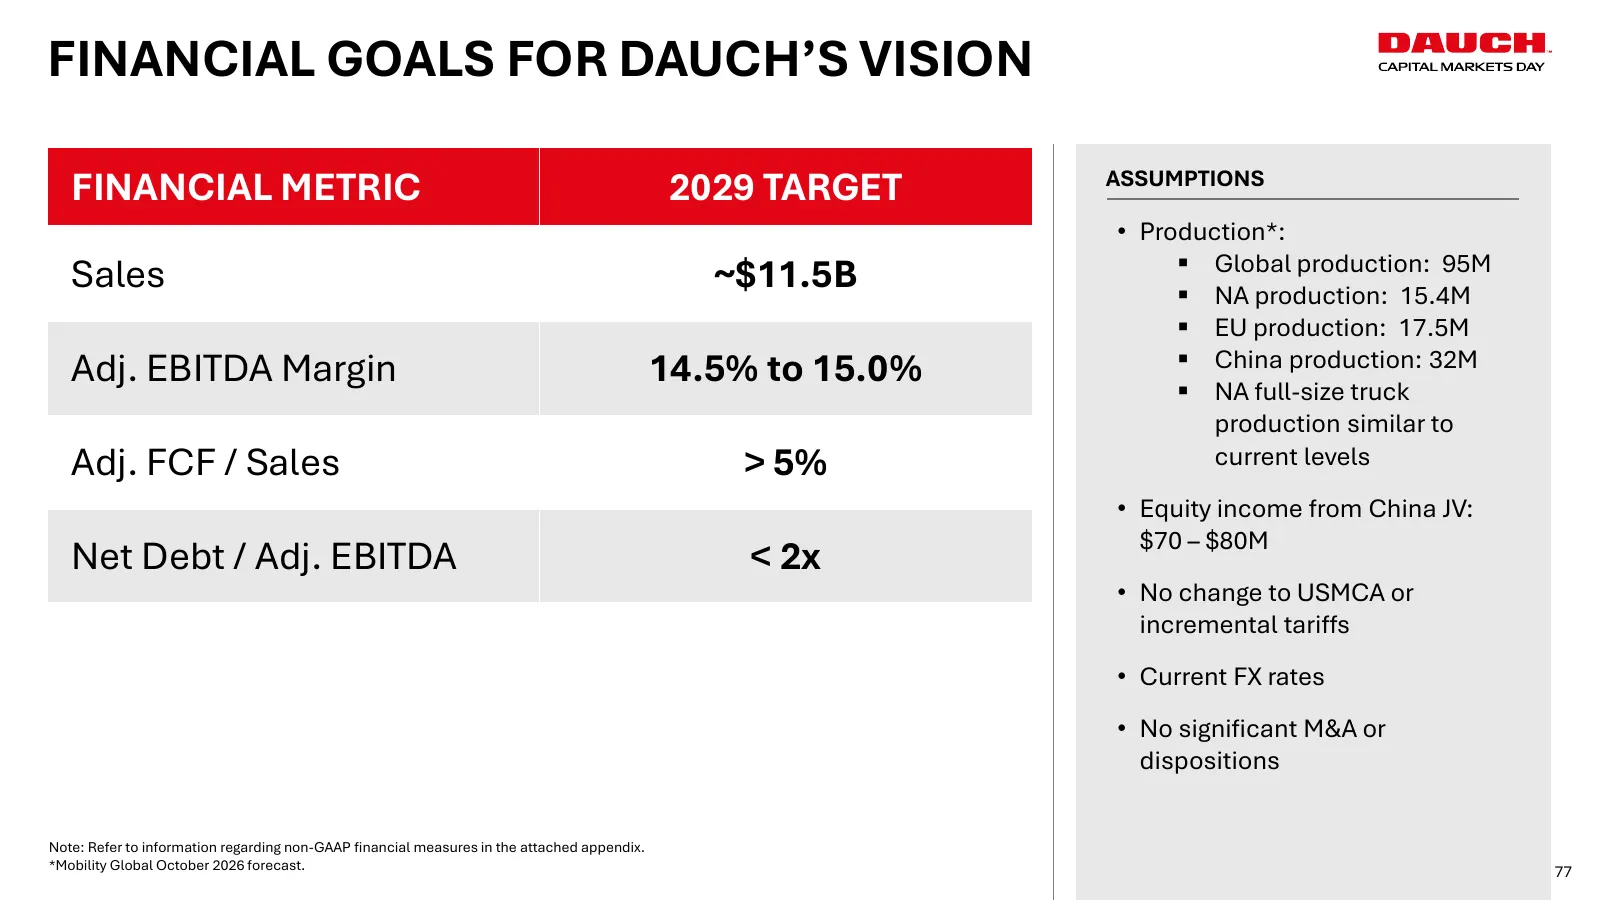
FINANCIAL GOALS FOR DAUCH’S VISION FINANCIAL METRIC 2029 TARGET ASSUMPTIONS • Production*: ▪ Global production: 95M Sales ~$11.5B ▪ NA production: 15.4M ▪ EU production: 17.5M Adj. EBITDA Margin 14.5% to 15.0% ▪ China production: 32M ▪ NA full-size truck production similar to Adj. FCF / Sales > 5% c
Slide 78: Revenue Walk 2026 to 2029
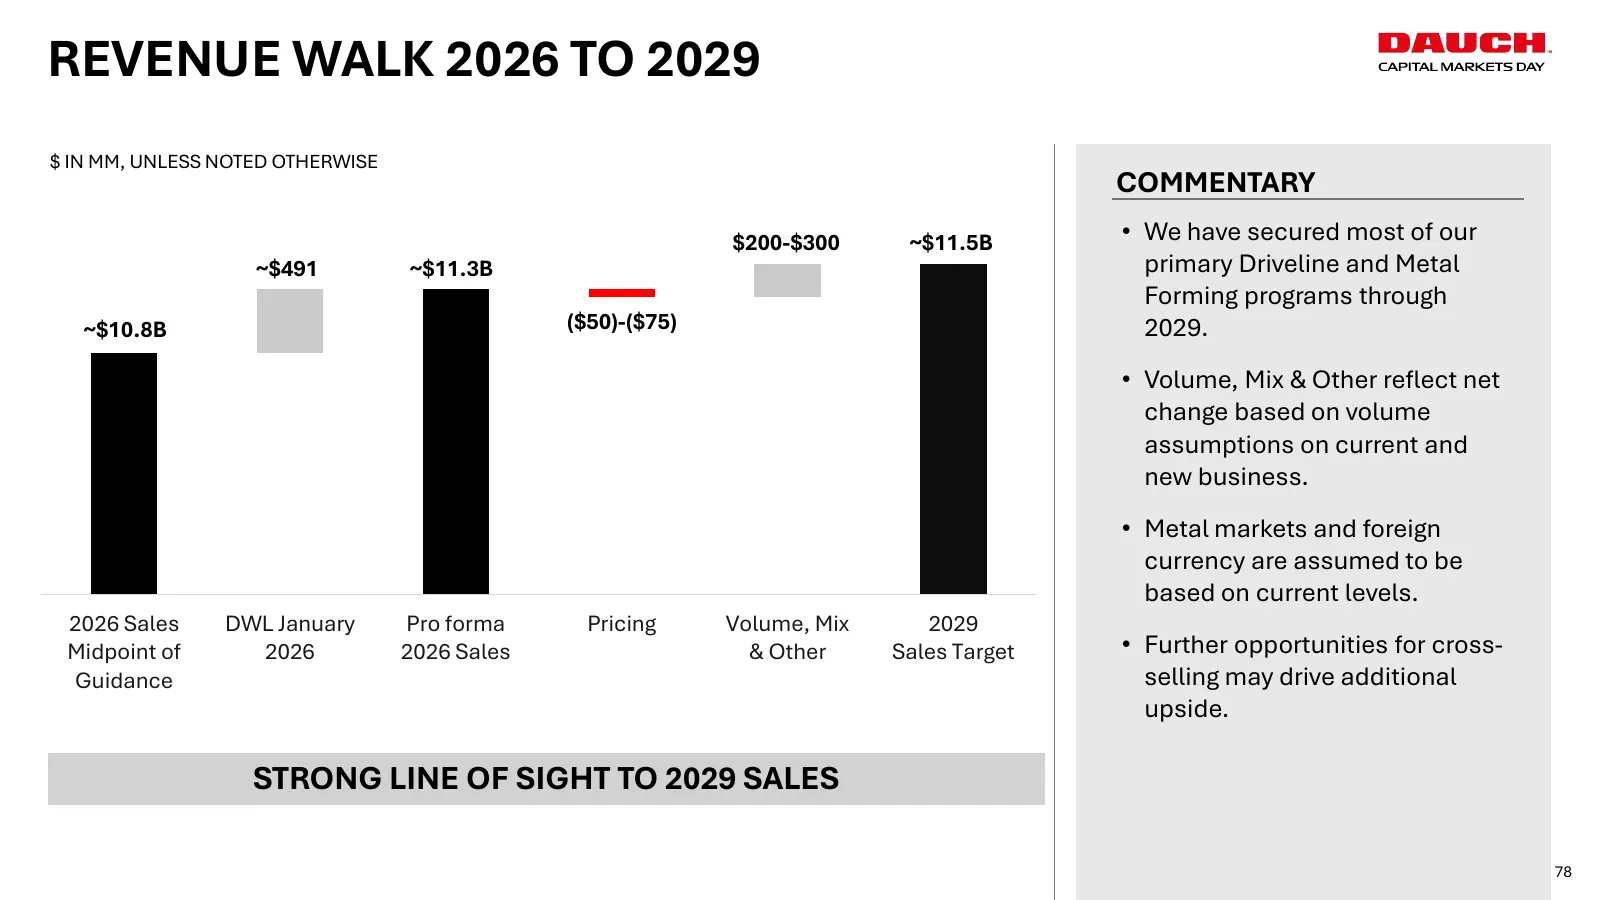
REVENUE WALK 2026 TO 2029 $ IN MM, UNLESS NOTED OTHERWISE COMMENTARY $200-$300 ~$11.5B • We have secured most of our ~$491 ~$11.3B primary Driveline and Metal Forming programs through ~$10.8B ($50)-($75) 2029. • Volume, Mix & Other reflect net change based on volume assumptions on current and new bu
Slide 79: Drivers of Long-Term Margin Expansion
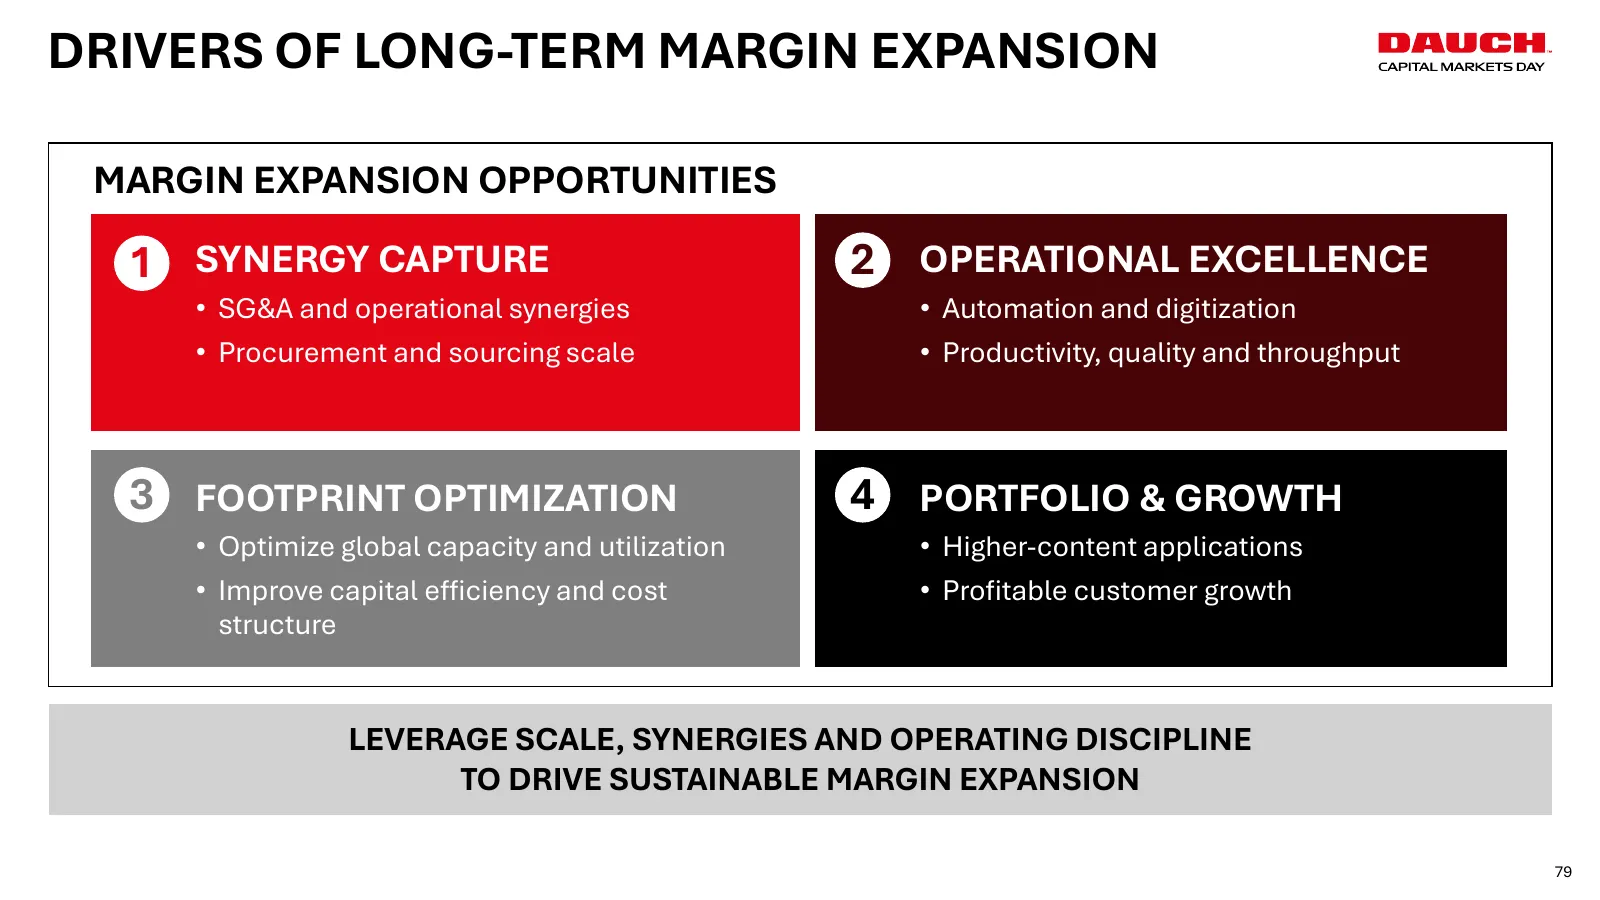
DRIVERS OF LONG-TERM MARGIN EXPANSION MARGIN EXPANSION OPPORTUNITIES 1 SYNERGY CAPTURE 2 OPERATIONAL EXCELLENCE • SG&A and operational synergies • Automation and digitization • Procurement and sourcing scale • Productivity, quality and throughput 3 FOOTPRINT OPTIMIZATION 4 PORTFOLIO & GROWTH • Optim
Slide 80: Adjusted EBITDA Walk 2026 to 2029 Target
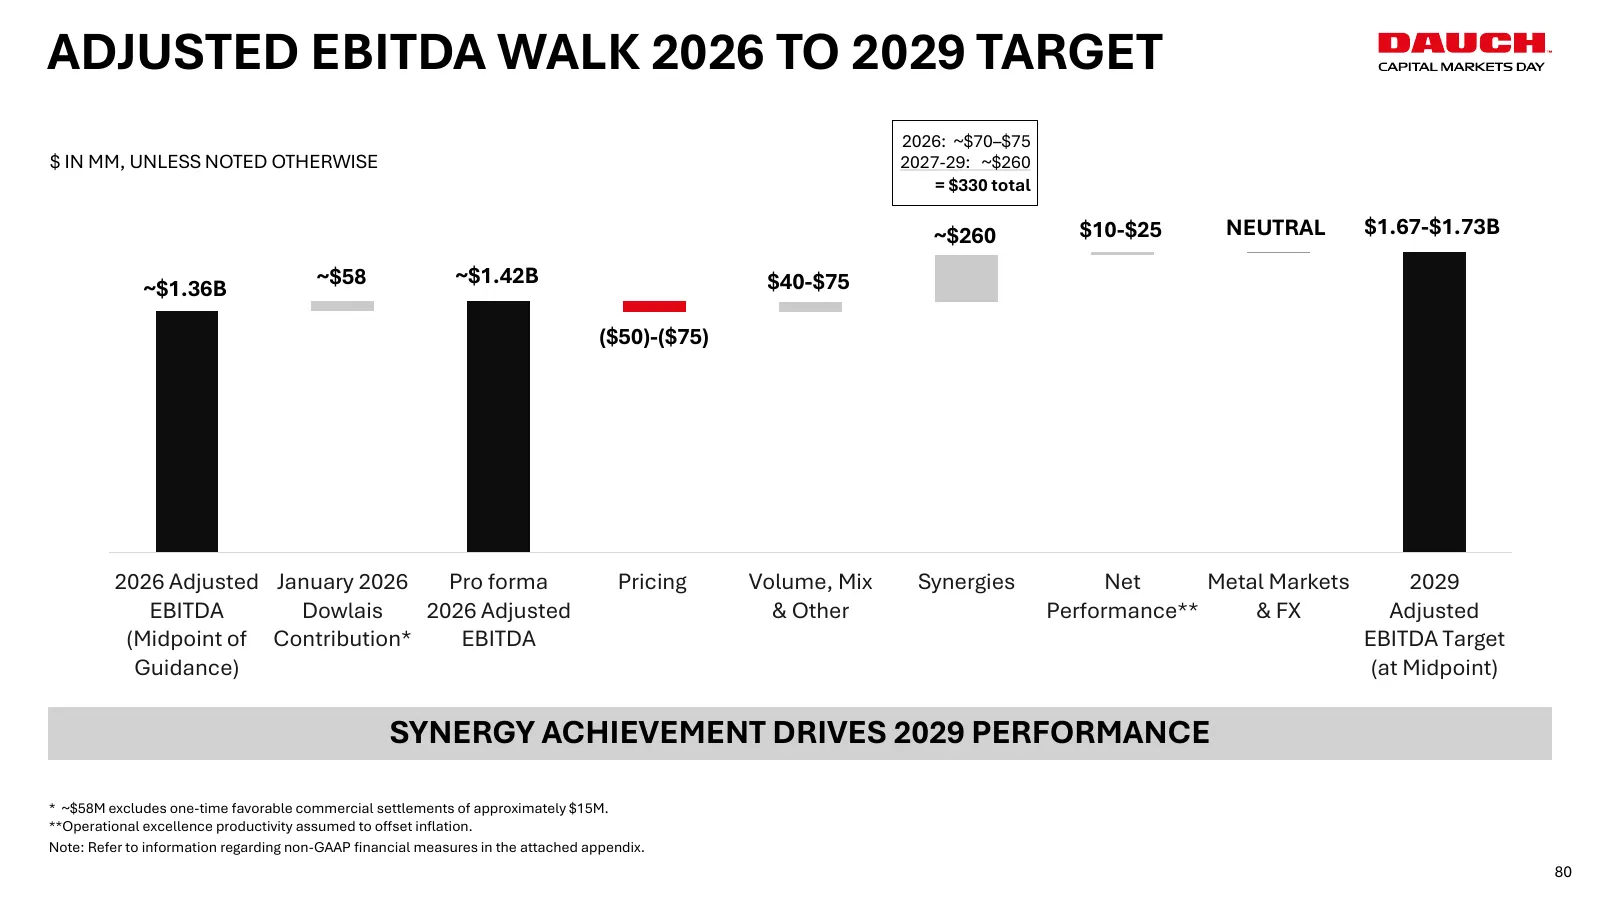
ADJUSTED EBITDA WALK 2026 TO 2029 TARGET 2026: ~$70–$75 $ IN MM, UNLESS NOTED OTHERWISE 2027-29: ~$260 = $330 total ~$260 $10-$25 NEUTRAL $1.67-$1.73B ~$58 ~$1.42B $40-$75 ~$1.36B ($50)-($75) 2026 Adjusted January 2026 Pro forma Pricing Volume, Mix Synergies Net Metal Markets 2029 EBITDA Dowlais 202
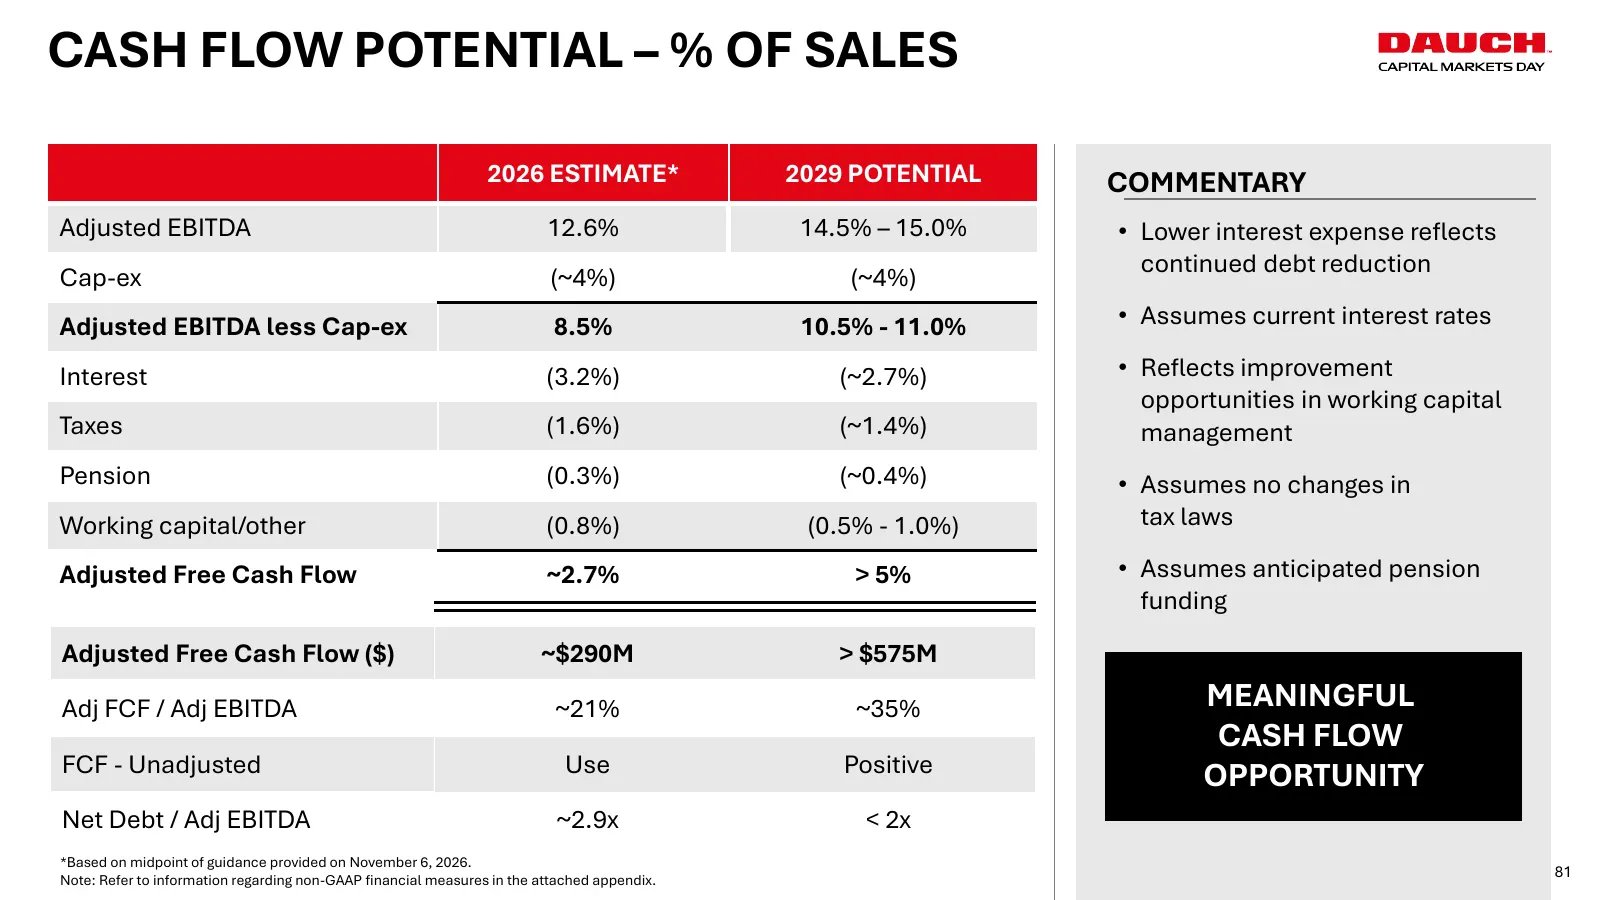
Slide 81: Cash Flow Potential – % of Sales
CASH FLOW POTENTIAL – % OF SALES 2026 ESTIMATE* 2029 POTENTIAL COMMENTARY Adjusted EBITDA 12.6% 14.5% – 15.0% • Lower interest expense reflects Cap-ex (~4%) (~4%) continued debt reduction Adjusted EBITDA less Cap-ex 8.5% 10.5% - 11.0% • Assumes current interest rates Interest (3.2%) (~2.7%) • Reflec
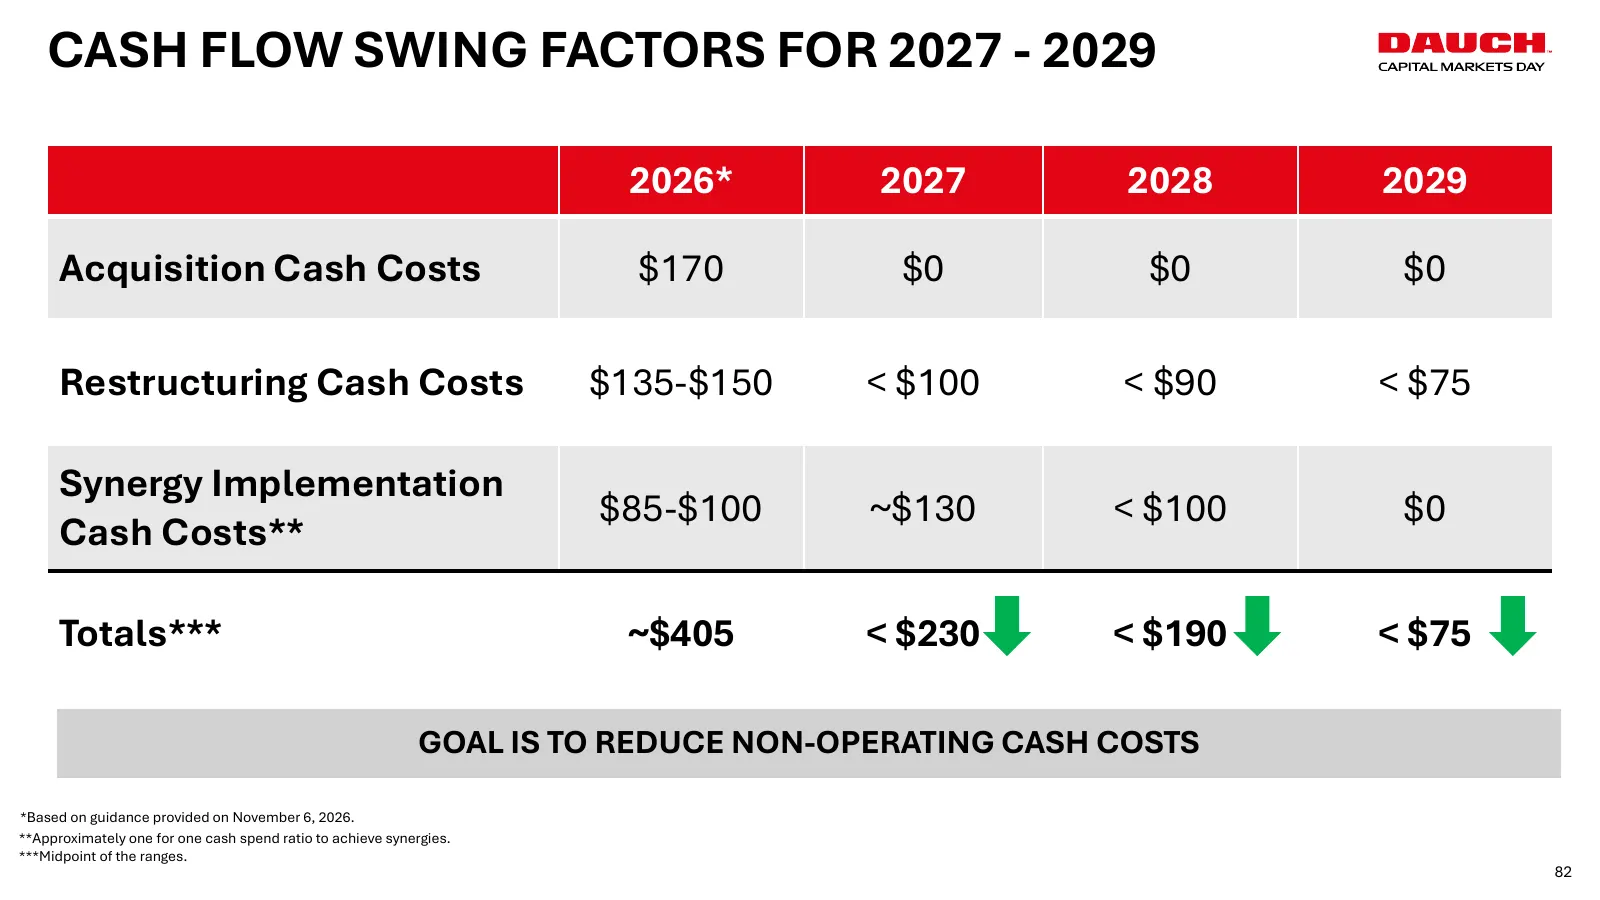
Slide 82: Cash Flow Swing Factors for 2027 - 2029
CASH FLOW SWING FACTORS FOR 2027 - 2029 2026* 2027 2028 2029 Acquisition Cash Costs $170 $0 $0 $0 Restructuring Cash Costs $135-$150 < $100 < $90 < $75 Synergy Implementation $85-$100 ~$130 < $100 $0 Cash Costs** Totals*** ~$405 < $230 < $190 < $75 GOAL IS TO REDUCE NON-OPERATING CASH COSTS *Based o
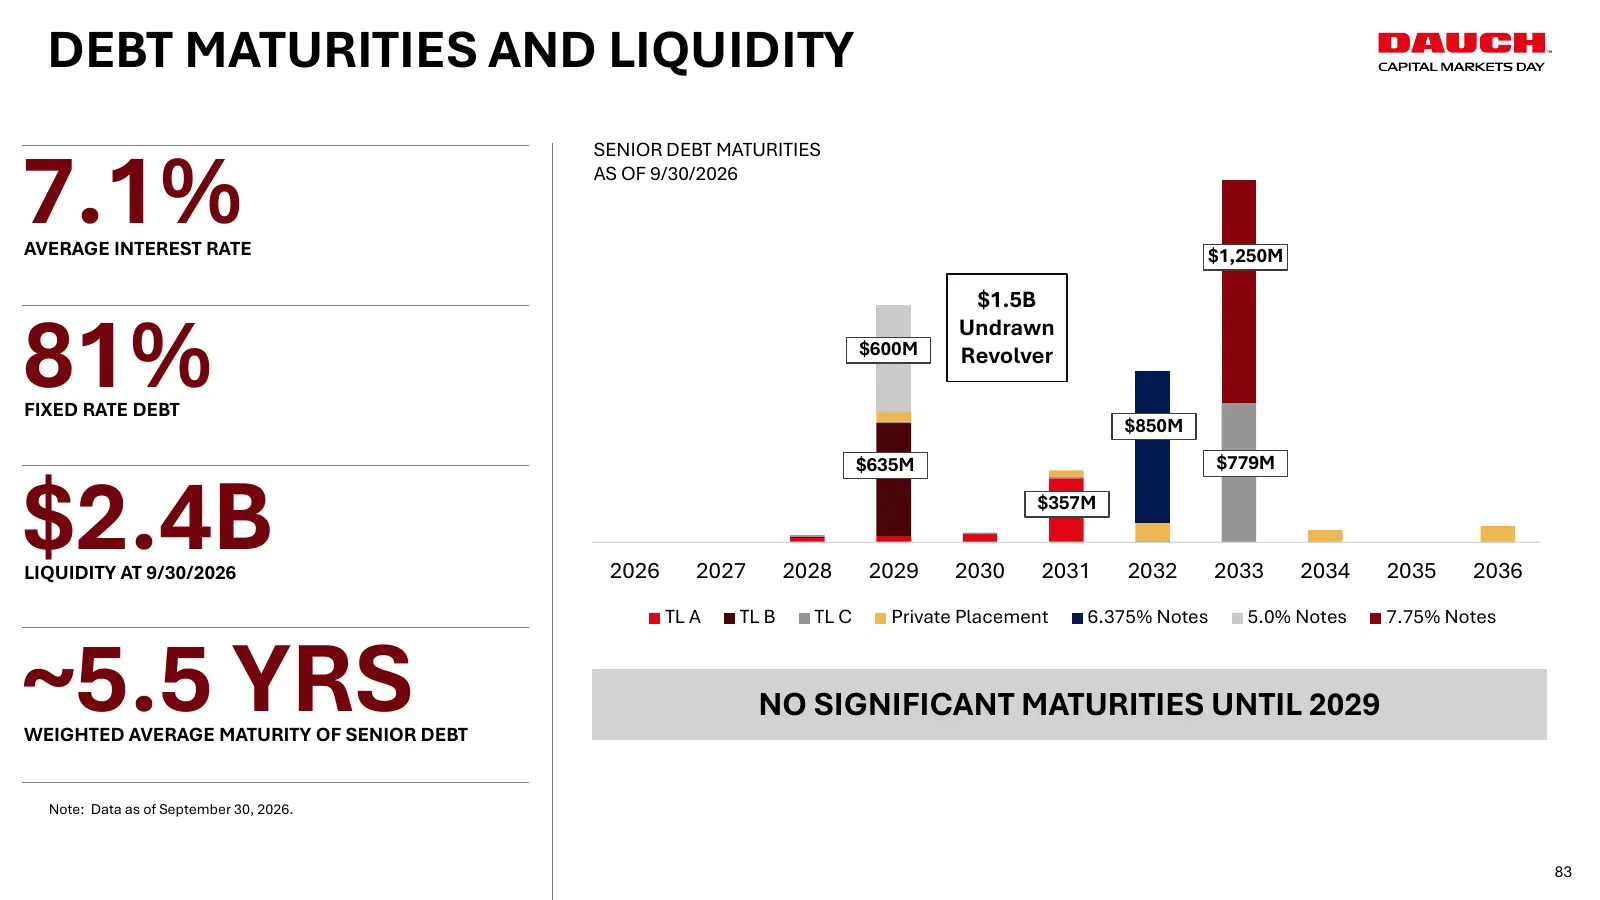
Slide 83: Debt Maturities and Liquidity
DEBT MATURITIES AND LIQUIDITY 7.1% SENIOR DEBT MATURITIES AS OF 9/30/2026 AVERAGE INTEREST RATE $1,250M $1.5B 81% Undrawn $600M Revolver FIXED RATE DEBT $850M $635M $779M $2.4B LIQUIDITY AT 9/30/2026 2026 2027 2028 2029 2030 $357M 2031 2032 2033 2034 2035 2036 TL A TL B TL C Private Placement 6.375%
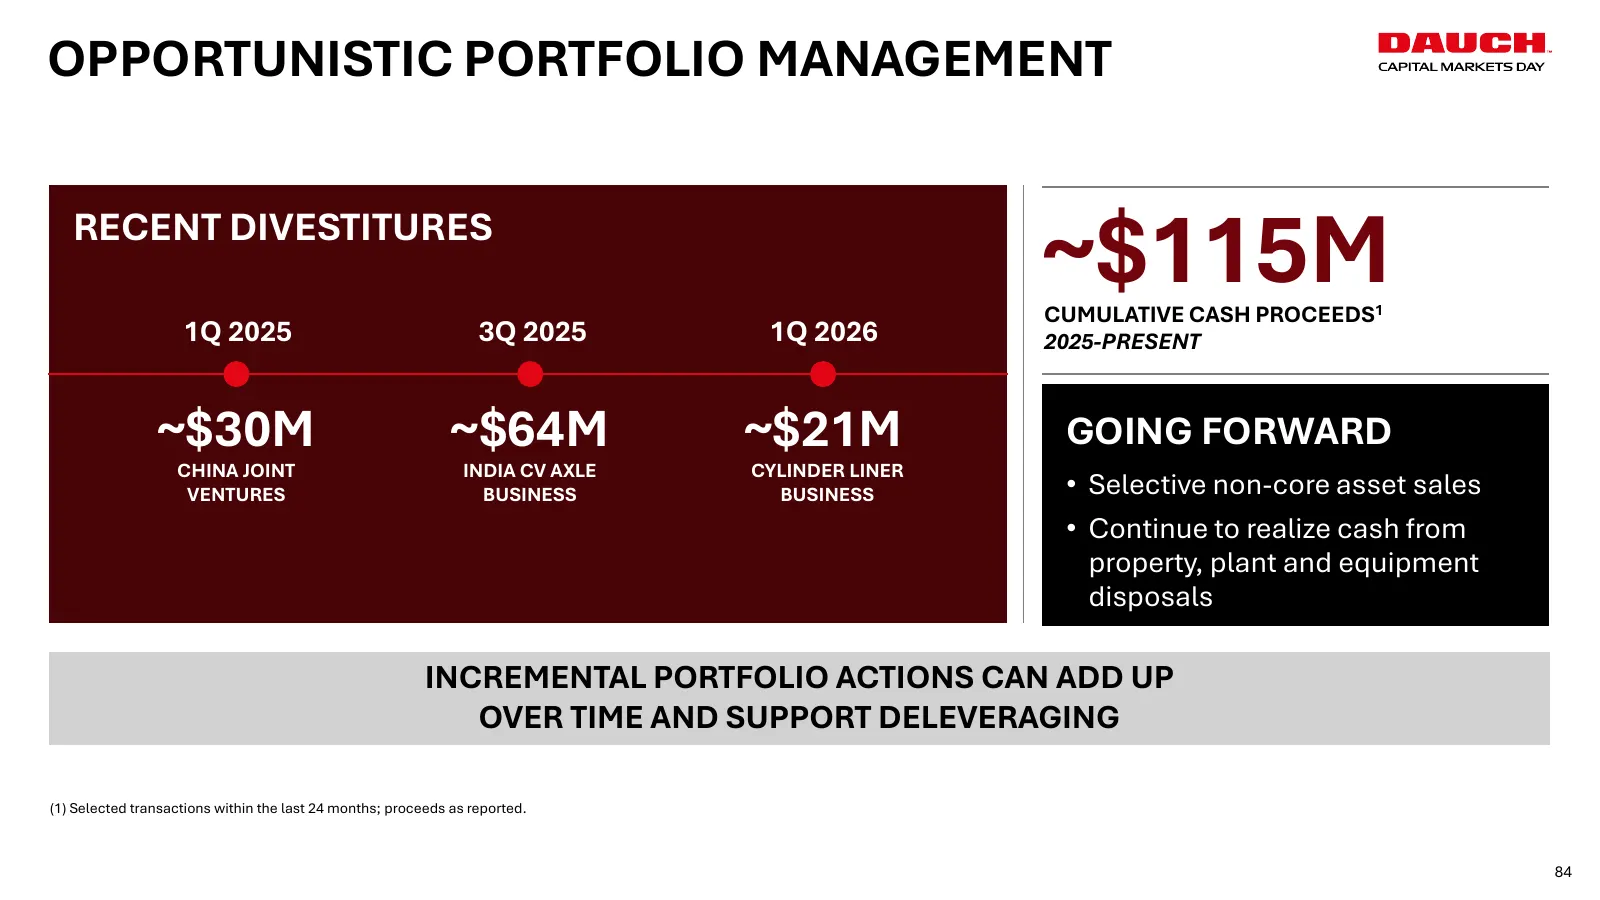
Slide 84: Opportunistic Portfolio Management
OPPORTUNISTIC PORTFOLIO MANAGEMENT RECENT DIVESTITURES ~$115M CUMULATIVE CASH PROCEEDS1 1Q 2025 3Q 2025 1Q 2026 2025-PRESENT ~$30M ~$64M ~$21M GOING FORWARD CHINA JOINT INDIA CV AXLE CYLINDER LINER VENTURES BUSINESS BUSINESS • Selective non-core asset sales • Continue to realize cash from property,

Slide 85: Capital Allocation Priorities
CAPITAL ALLOCATION PRIORITIES 85
Slide 86: Capital Allocation
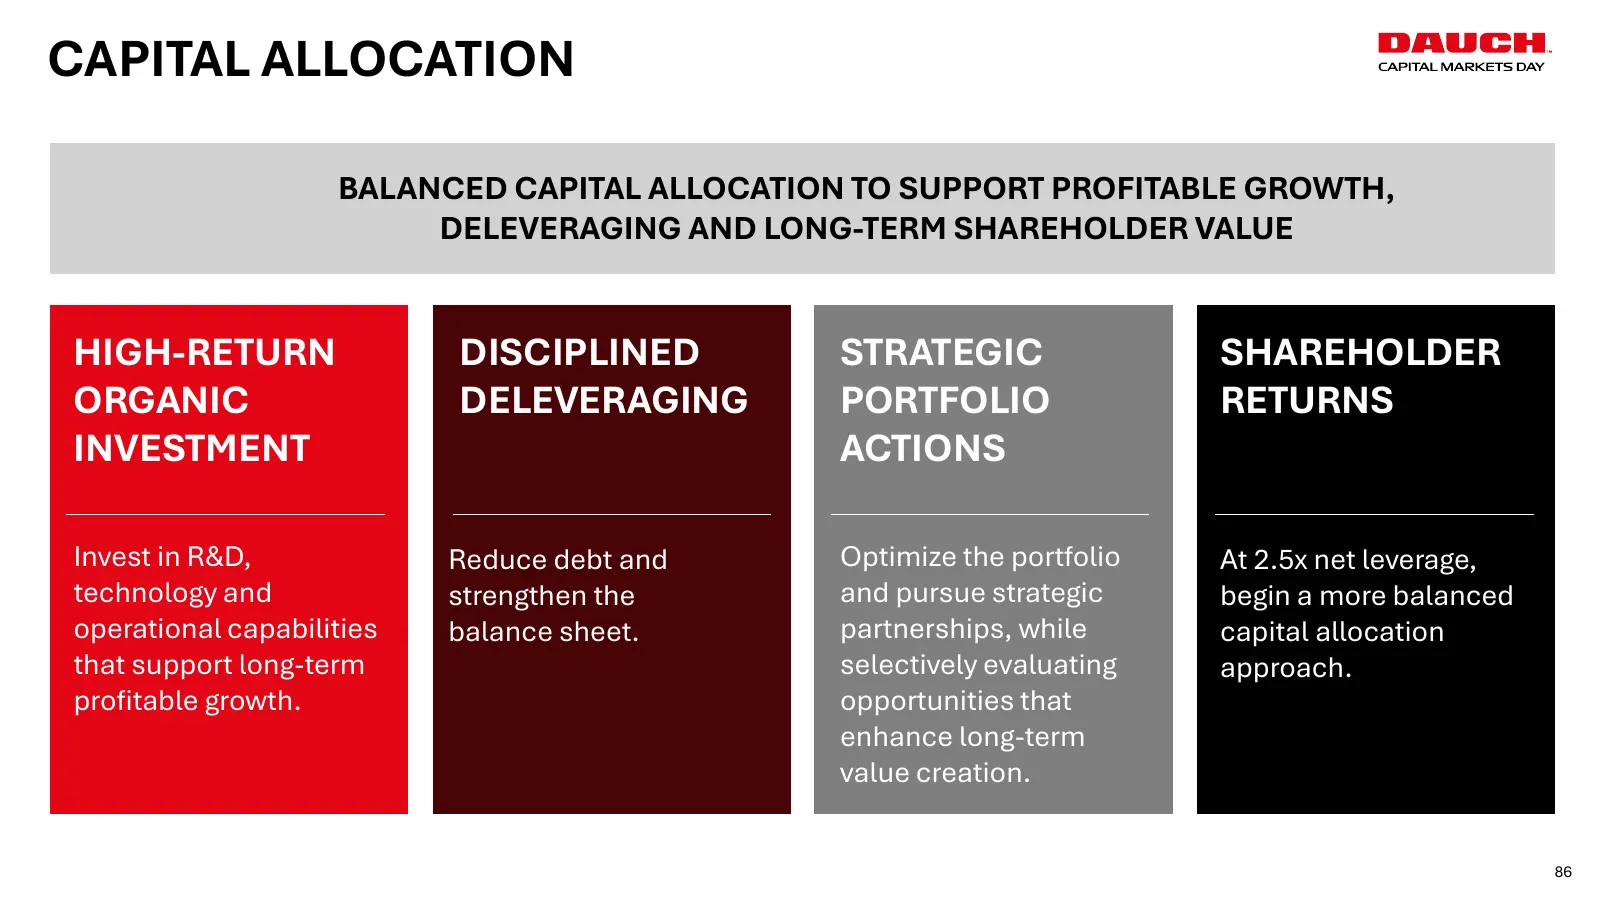
CAPITAL ALLOCATION BALANCED CAPITAL ALLOCATION TO SUPPORT PROFITABLE GROWTH, DELEVERAGING AND LONG-TERM SHAREHOLDER VALUE HIGH-RETURN DISCIPLINED STRATEGIC SHAREHOLDER ORGANIC DELEVERAGING PORTFOLIO RETURNS INVESTMENT ACTIONS Invest in R&D, Reduce debt and Optimize the portfolio At 2.5x net leverage
Slide 87: Bringing It All Together
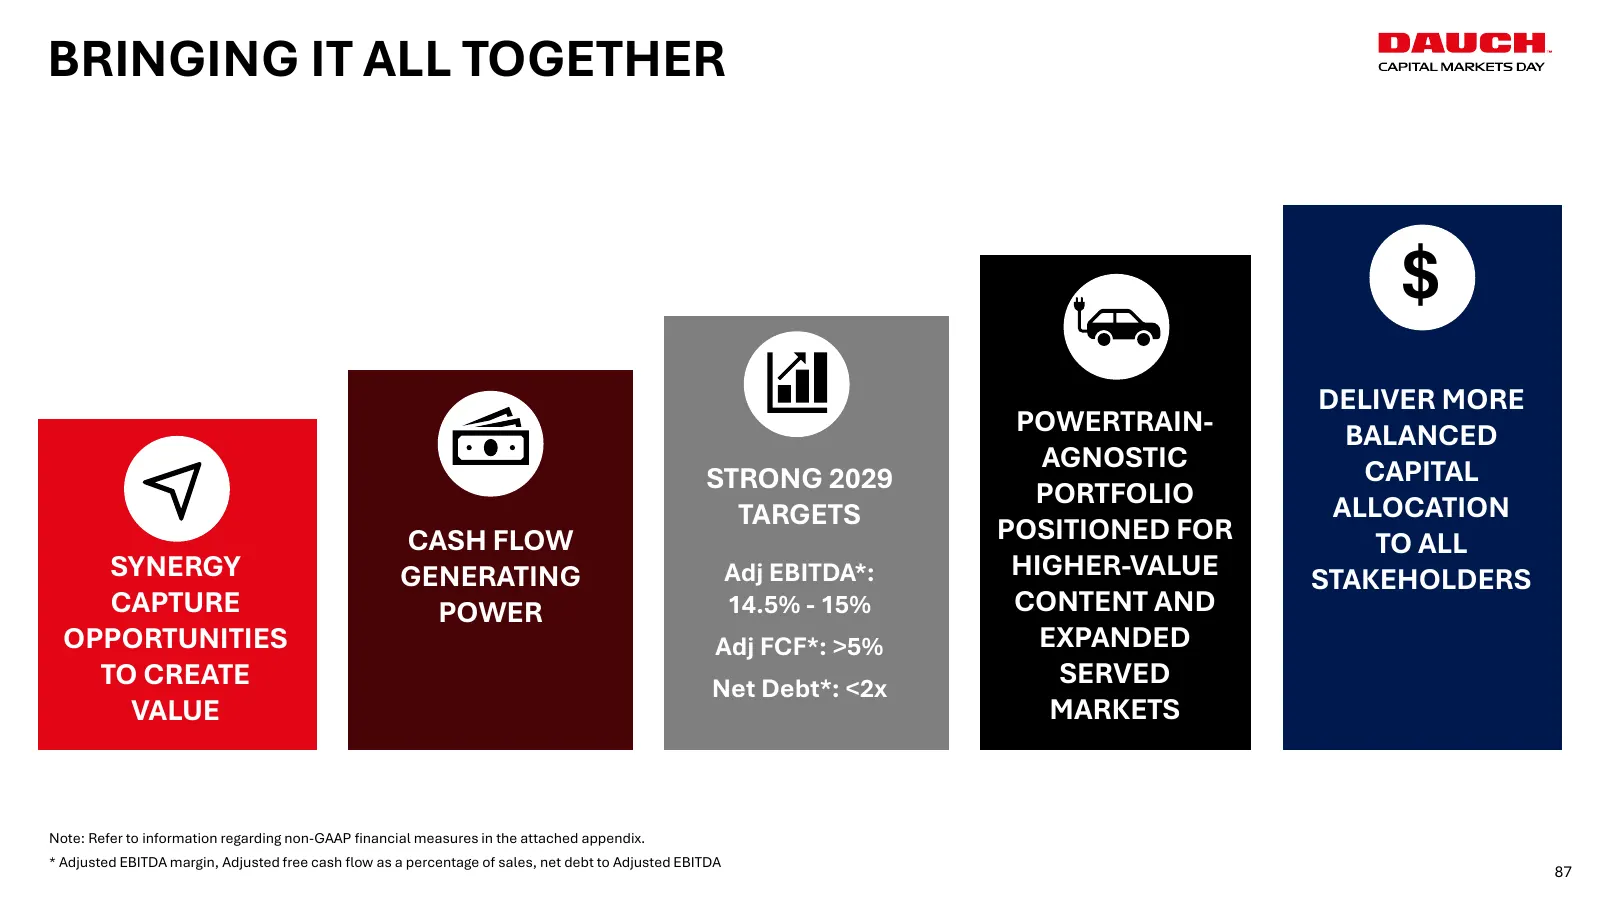
BRINGING IT ALL TOGETHER $ DELIVER MORE POWERTRAIN- BALANCED AGNOSTIC CAPITAL STRONG 2029 PORTFOLIO TARGETS ALLOCATION CASH FLOW POSITIONED FOR TO ALL SYNERGY GENERATING Adj EBITDA*: HIGHER-VALUE STAKEHOLDERS CAPTURE POWER 14.5% - 15% CONTENT AND OPPORTUNITIES Adj FCF*: >5% EXPANDED TO CREATE Net De

Slide 88: David Dauch, Chairman & CEO
DAVID DAUCH CHAIRMAN & CHIEF EXECUTIVE OFFICER 88 88
Slide 89: Key Takeaways from Today's Presentation
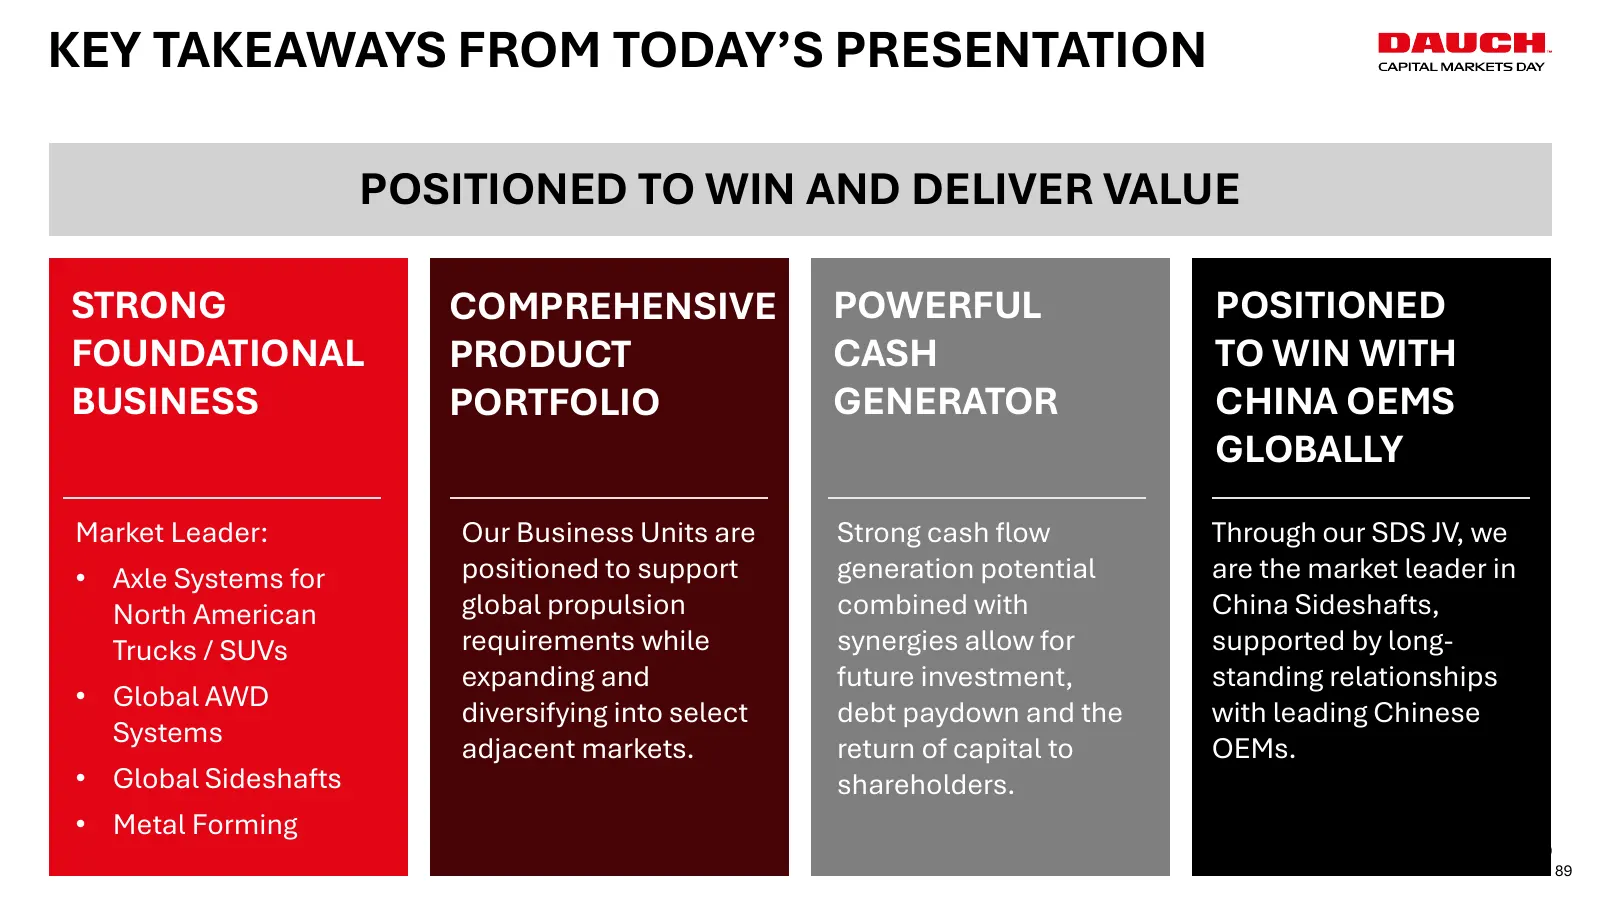
KEY TAKEAWAYS FROM TODAY’S PRESENTATION POSITIONED TO WIN AND DELIVER VALUE STRONG COMPREHENSIVE POWERFUL POSITIONED FOUNDATIONAL PRODUCT CASH TO WIN WITH BUSINESS PORTFOLIO GENERATOR CHINA OEMS GLOBALLY Market Leader: Our Business Units are Strong cash flow Through our SDS JV, we • Axle Systems for
Slide 90: Long-Term Vision - Beyond 2029
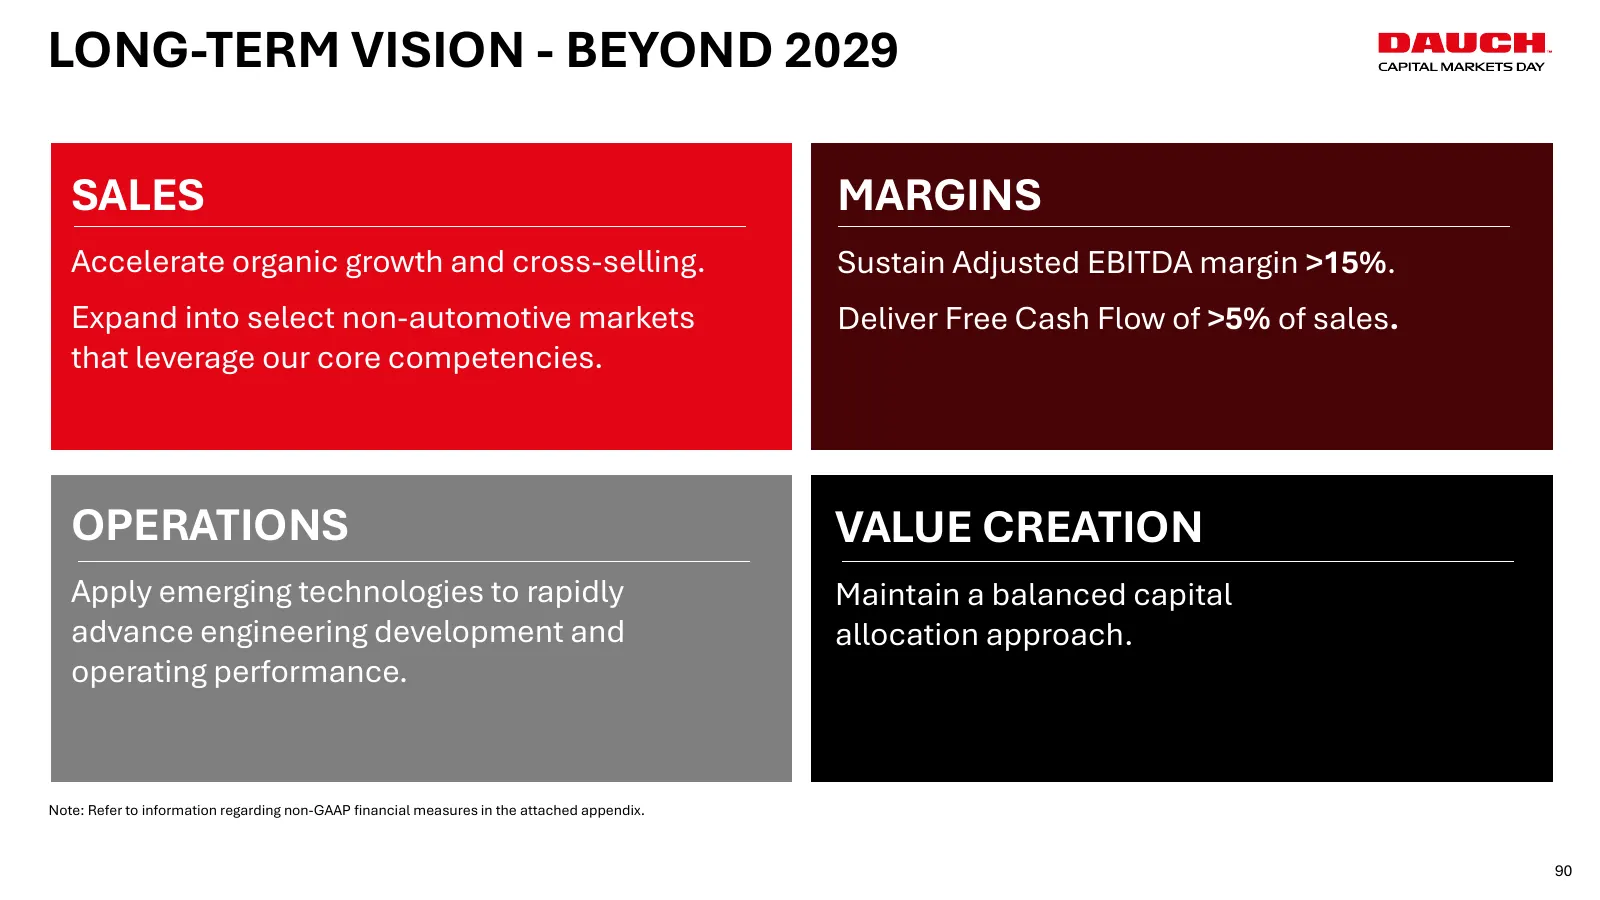
LONG-TERM VISION - BEYOND 2029 SALES MARGINS Accelerate organic growth and cross-selling. Sustain Adjusted EBITDA margin >15%. Expand into select non-automotive markets Deliver Free Cash Flow of >5% of sales. that leverage our core competencies. OPERATIONS VALUE CREATION Apply emerging technologies
Slide 91: Appendix / Supplemental Data
APPENDIX / SUPPLEMENTAL DATA 91
Slide 92: Additional Disclosures
ADDITIONAL DISCLOSURES Non-GAAP Financial Information This presentation refers to certain financial measures, including Adjusted EBITDA, Adjusted EBITDA margin, Adjusted Earnings per Share, Adjusted Free Cash Flow, Net Debt, Net Leverage Ratio and Liquidity that are not required by, or presented in
Slide 93: Reconciliation of Non-GAAP Measures
RECONCILIATION OF NON-GAAP MEASURES The accompanying financial information provides reconciliations of certain non-GAAP financial measures, including adjusted EBITDA and adjusted free cash flow, to the most directly comparable financial measures calculated and presented in accordance with GAAP. We h
Slide 94: Supplemental Data – Segment Financial Information
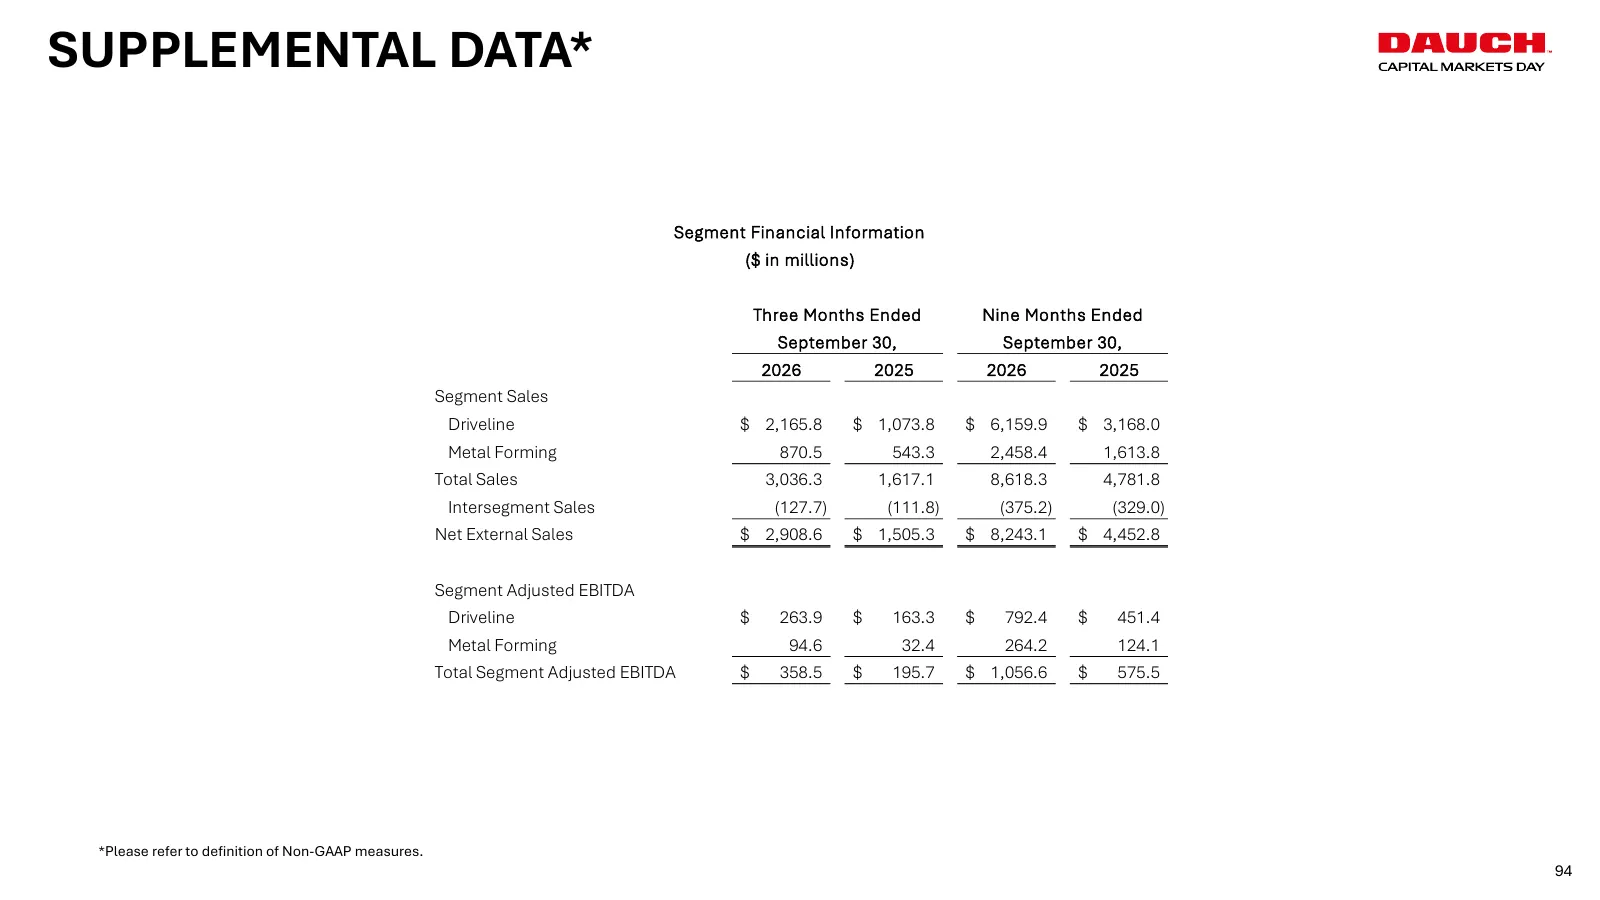
SUPPLEMENTAL DATA* Segment Financial Information ($ in millions) Three Months Ended Nine Months Ended September 30, September 30, 2026 2025 2026 2025 Segment Sales Driveline $ 2,165.8 $ 1,073.8 $ 6,159.9 $ 3,168.0 Metal Forming 870.5 543.3 2,458.4 1,613.8 Total Sales 3,036.3 1,617.1 8,618.3 4,781.8
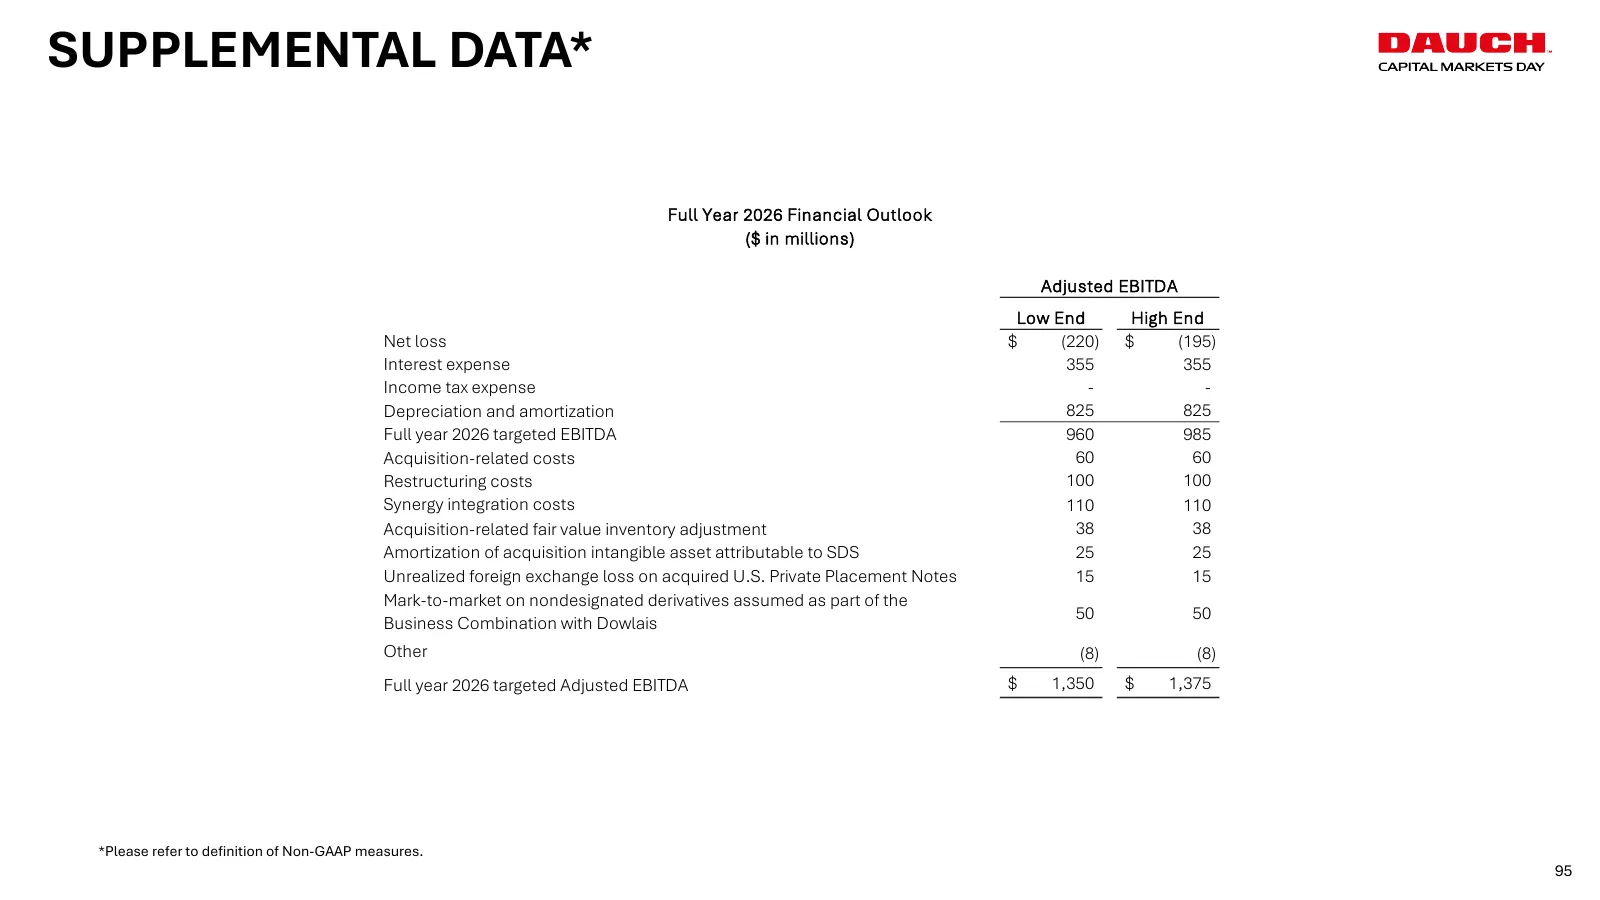
Slide 95: Supplemental Data – Full Year 2026 Adjusted EBITDA Outlook
SUPPLEMENTAL DATA* Full Year 2026 Financial Outlook ($ in millions) Adjusted EBITDA Low End High End Net loss $ (220) $ (195) Interest expense 355 355 Income tax expense - - Depreciation and amortization 825 825 Full year 2026 targeted EBITDA 960 985 Acquisition-related costs 60 60 Restructuring cos
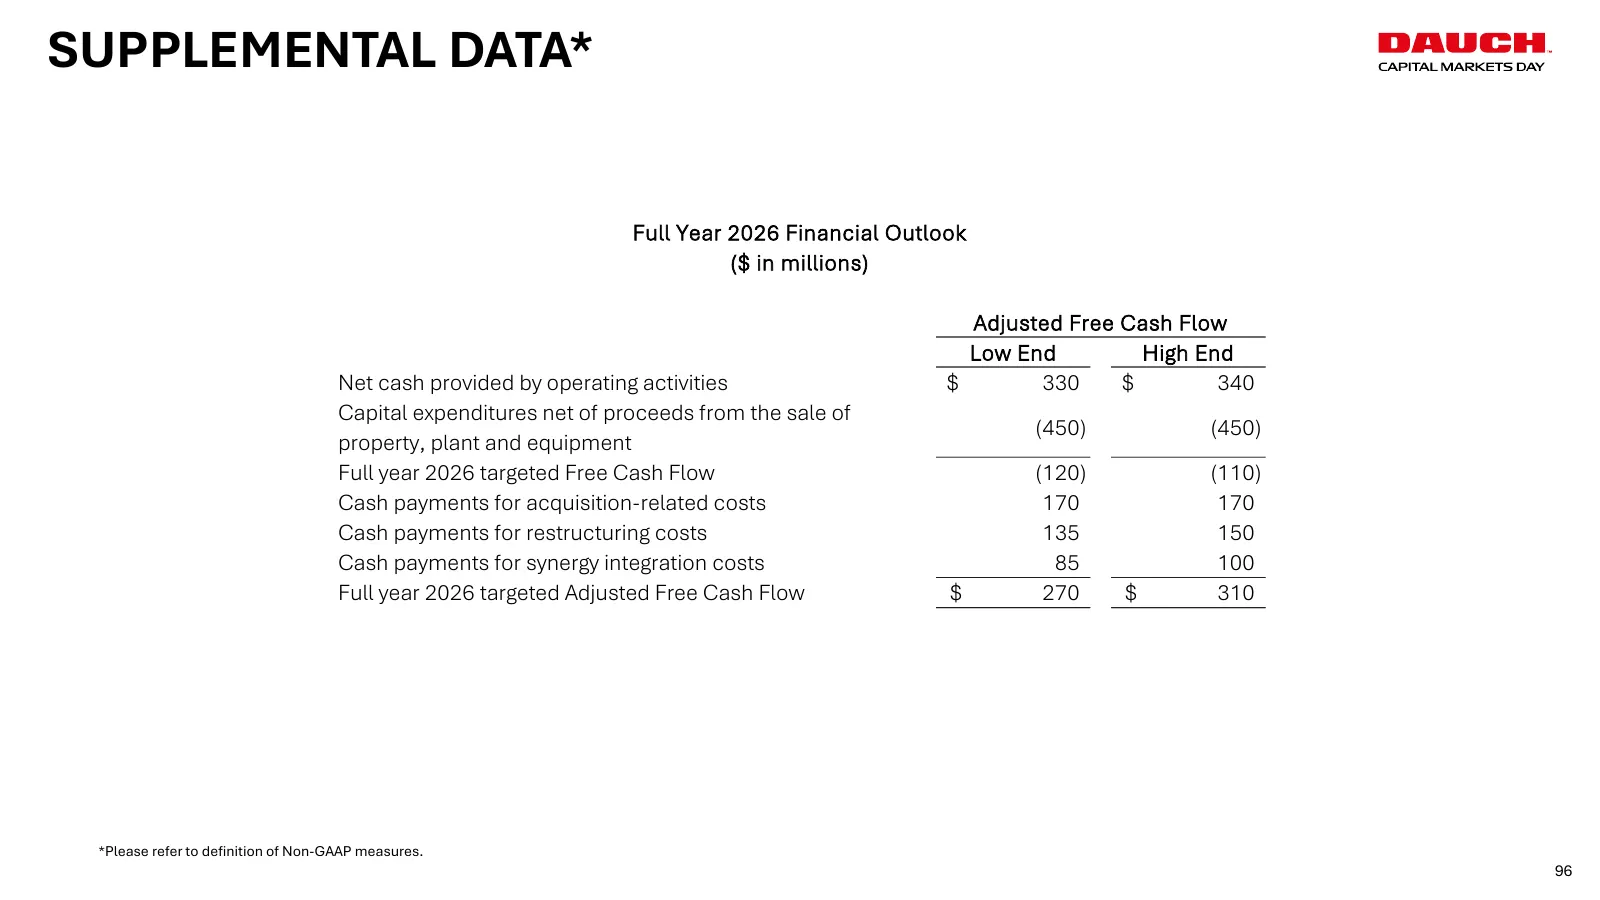
Slide 96: Supplemental Data – Full Year 2026 Adjusted Free Cash Flow Outlook
SUPPLEMENTAL DATA* Full Year 2026 Financial Outlook ($ in millions) Adjusted Free Cash Flow Low End High End Net cash provided by operating activities $ 330 $ 340 Capital expenditures net of proceeds from the sale of (450) (450) property, plant and equipment Full year 2026 targeted Free Cash Flow (1
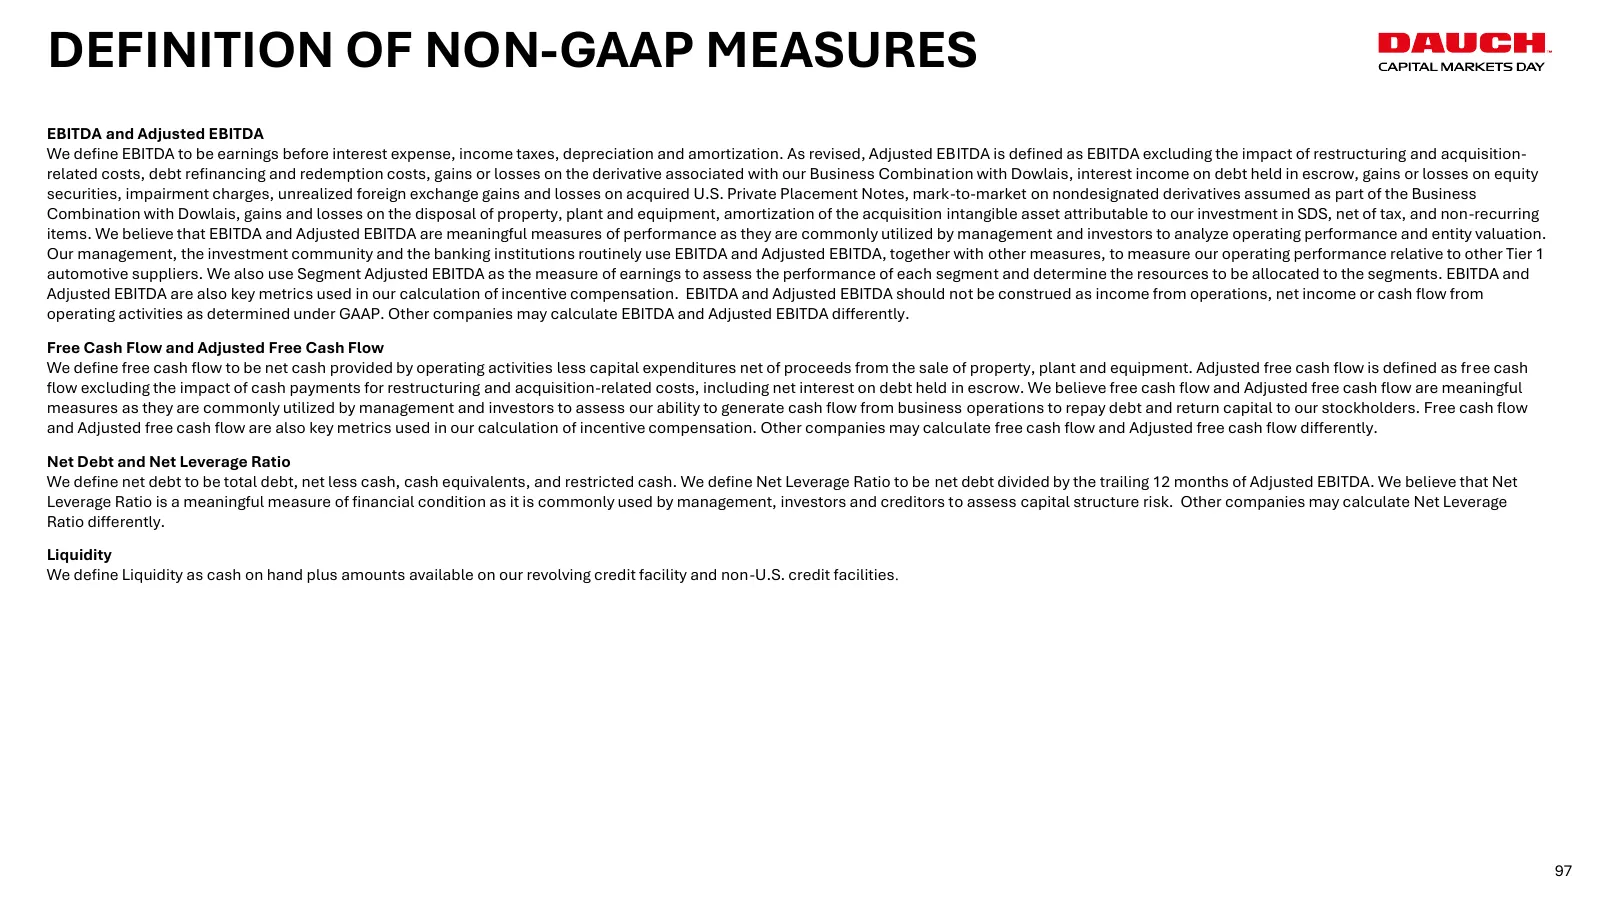
Slide 97: Definition of Non-GAAP Measures
DEFINITION OF NON-GAAP MEASURES EBITDA and Adjusted EBITDA We define EBITDA to be earnings before interest expense, income taxes, depreciation and amortization. As revised, Adjusted EBITDA is defined as EBITDA excluding the impact of restructuring and acquisition- related costs, debt refinancing and
Source: company website
More decks from Dauch Corporation
 Q3 2026 Earnings Presentation25 slides · Nov 6, 2026
 Q2 2026 Earnings Presentation25 slides · Aug 7, 2026
 Q1 2026 Earnings Presentation25 slides · May 8, 2026
 Investor Presentation (March 2026)27 slides · March 2026
 Q4 2025 Earnings Presentation23 slides · Feb 13, 2026
 American Axle & Manufacturing Holdings, Inc. (AAM) — Investor Presentation (December 2025)28 slides · December 2025