Kingfisher PLC · LSE:KGF
Kingfisher — FY2001/02 Earnings Presentation
50 slides from Kingfisher's earnings presentation, 2002

Slide 1: Leading in international home retail
Leading in international home retail
Slide 2: Francis Mackay, Chairman
Francis Mackay Chairman
Slide 3: My first three months
My first three months • Real value creating opportunities – quality businesses – attractive growth markets – depth and breadth of good managers – strategic issues under review

Slide 4: Geoff Mulcahy, Chief Executive
Geoff Mulcahy Chief Executive
Slide 5: 2001 a Year of Delivery
2001 a Year of Delivery….. • Better placed for future success • Focused on two well positioned businesses • Attractive growth markets • Stronger balance sheet Ready to exploit opportunities
Slide 6: Delivered sound financials
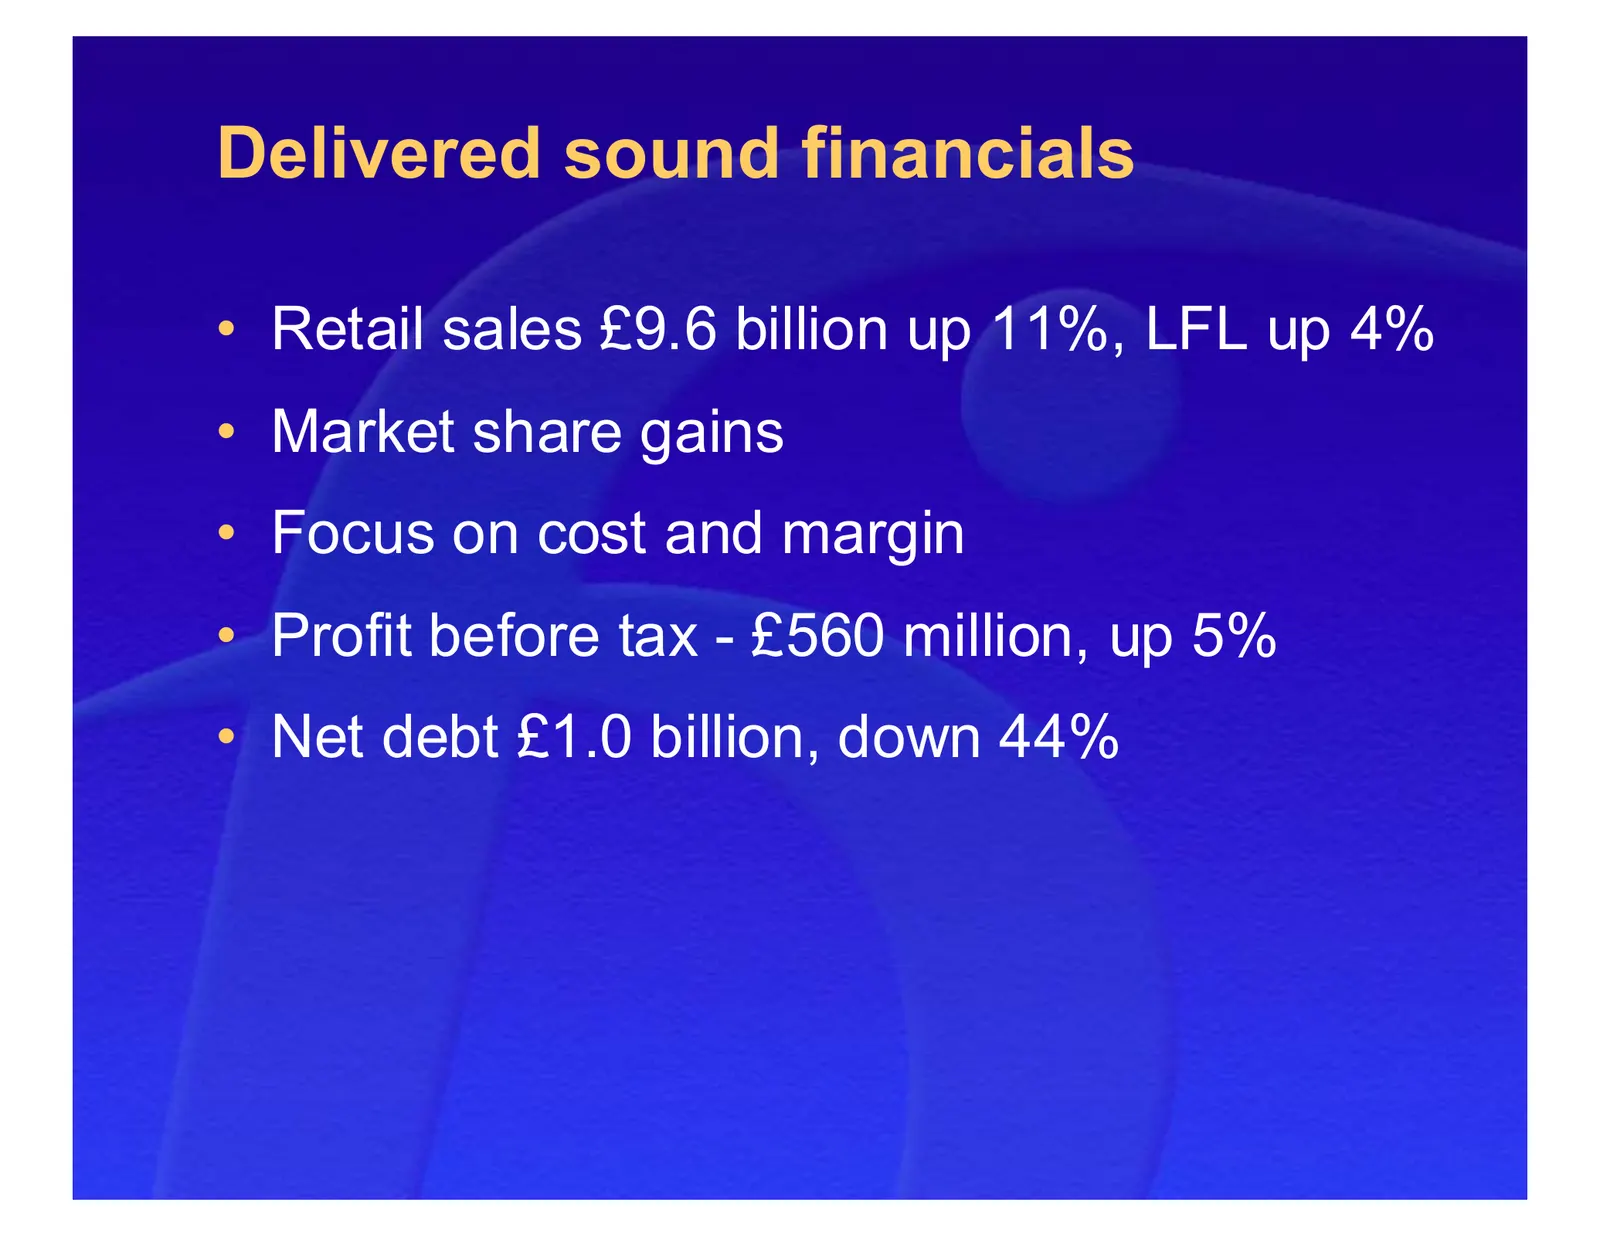
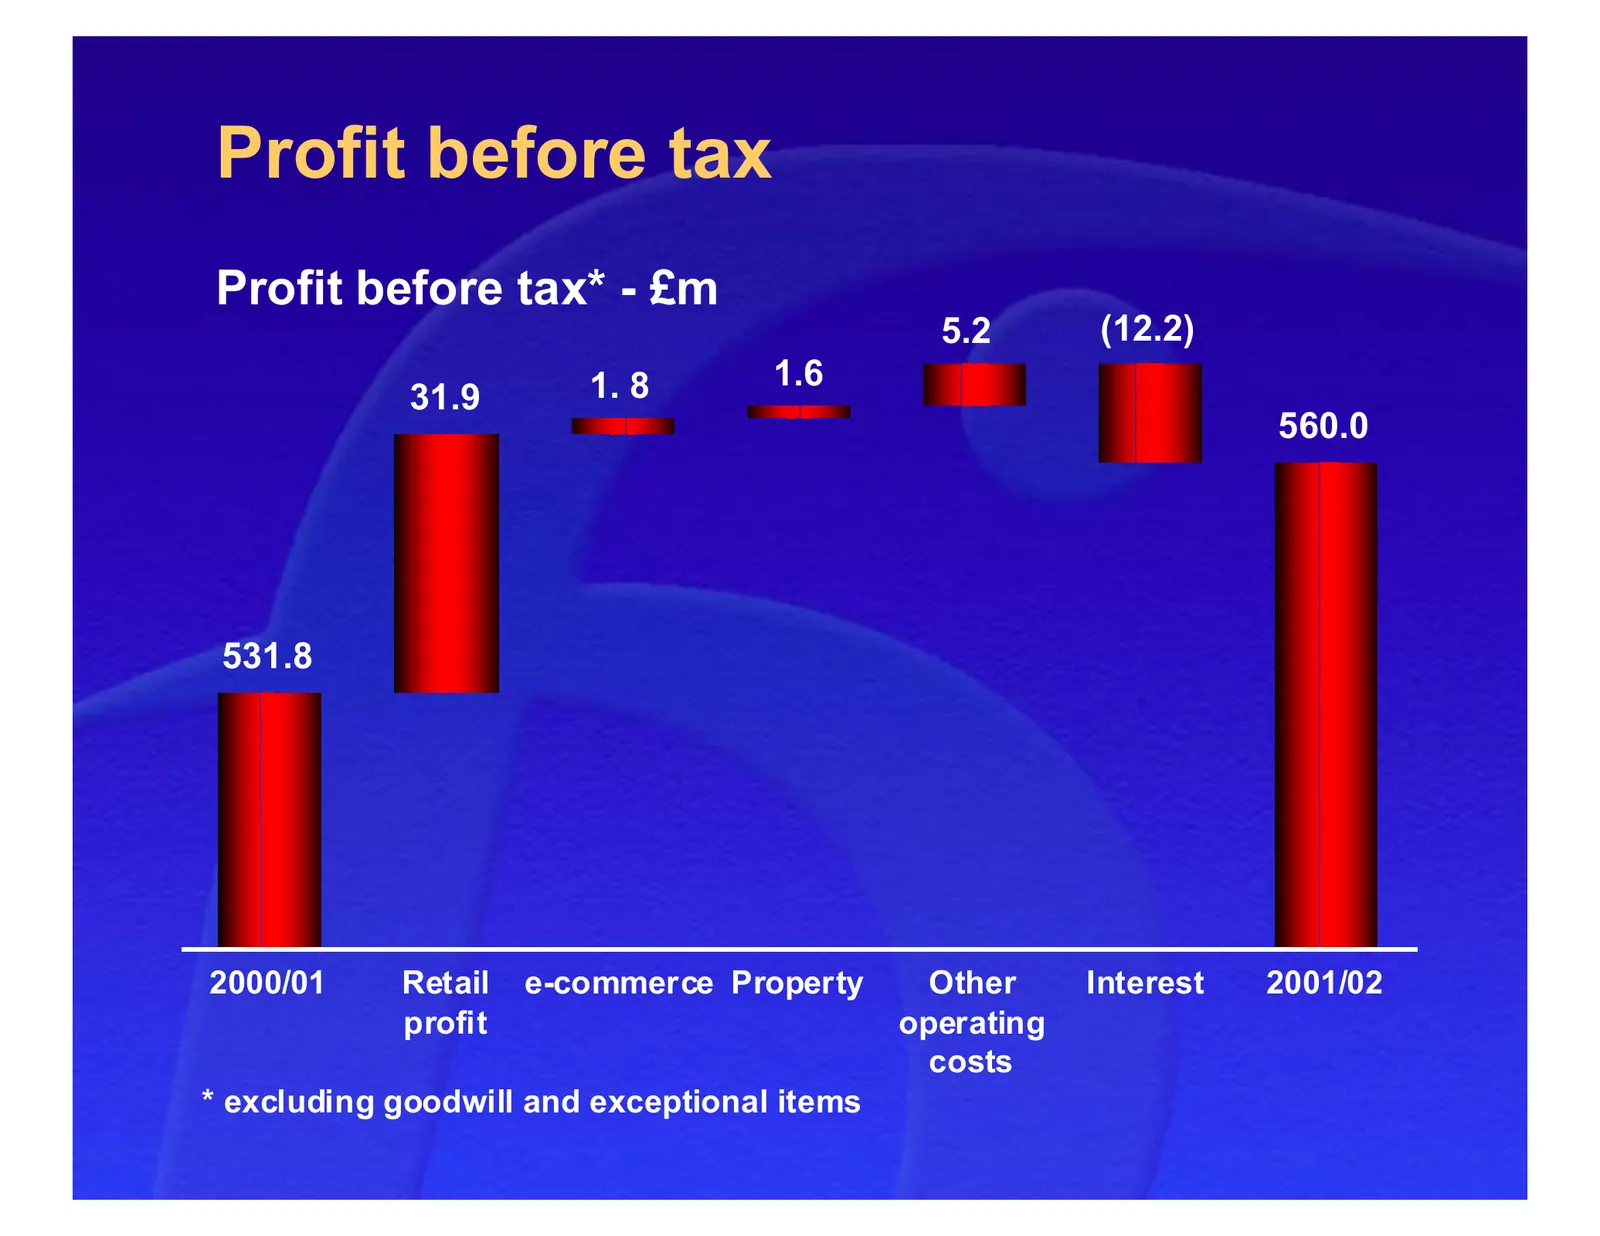
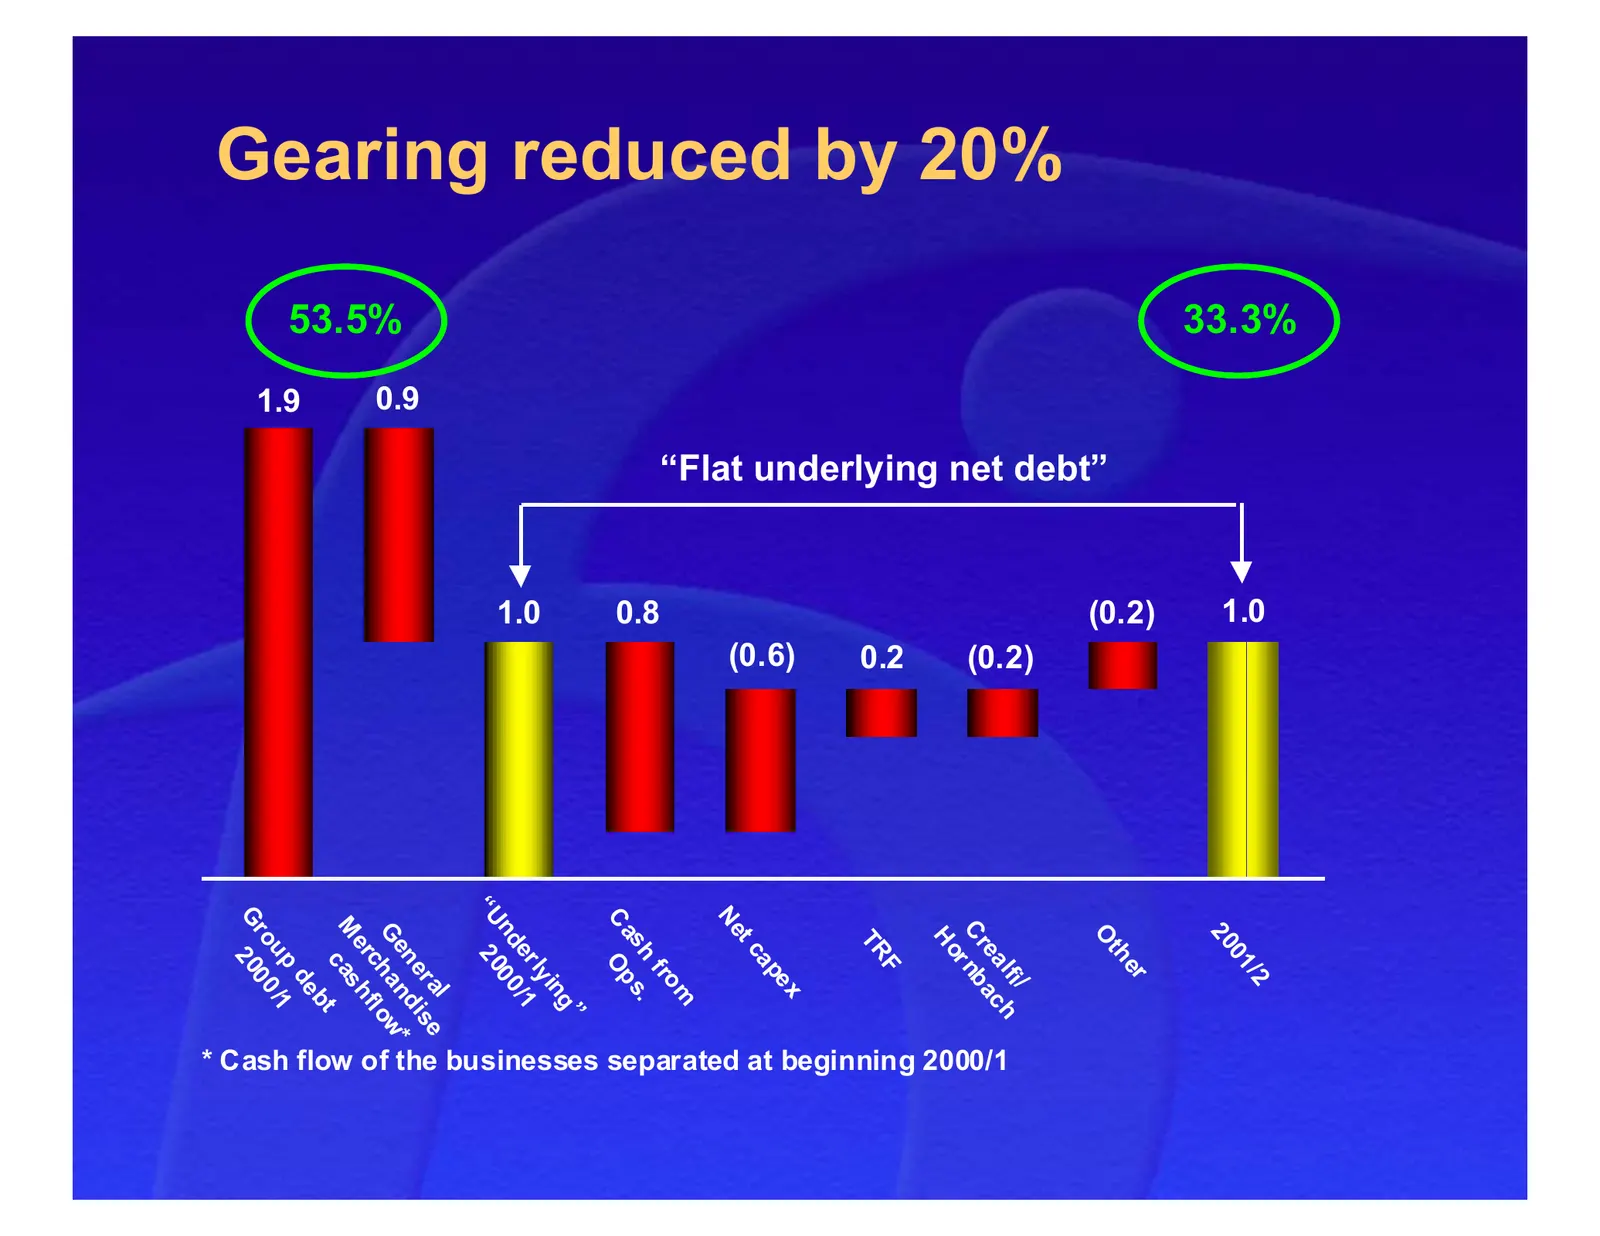
Delivered sound financials • Retail sales £9.6 billion up 11%, LFL up 4% • Market share gains • Focus on cost and margin • Profit before tax - £560 million, up 5% • Net debt £1.0 billion, down 44%
Slide 7: Strategic alliance
Strategic alliance • Leading German DIY warehouse operator • German DIY market biggest in Europe • Complements no1. positions in UK and France
Slide 8: Operational Agenda
Operational Agenda • Maintaining momentum of fast growth businesses • Accelerating the expansion of our slower growing but strong brands • Turning around underperformers
Slide 9: Operational Delivery
Operational Delivery • Maintaining momentum of fast growth businesses – roll out of B&Q Warehouses – roll out of Brico Dépôt – acquisition of BUT franchises
Slide 10: Operational Delivery
Operational Delivery • Stimulating growth in strong, but slower growth, brands – acceleration of the Darty store opening, refurbishment and extension programme – continuing reinvigoration of Castorama
Slide 11: Operational Delivery
Operational Delivery • Turning around ProMarkt – successful first phase of turnaround plan – new local German management
Slide 12: Helen Weir, Group Finance Director
Helen Weir Group Finance Director 2001/02 Year End Financial Performance
Slide 13: Financial Performance
Financial Performance • Performance update • Summary financials • Accounting and reporting

Slide 14: Performance Update
Performance Update Continuing operations
Slide 15: Our main brands have grown ahead of the market
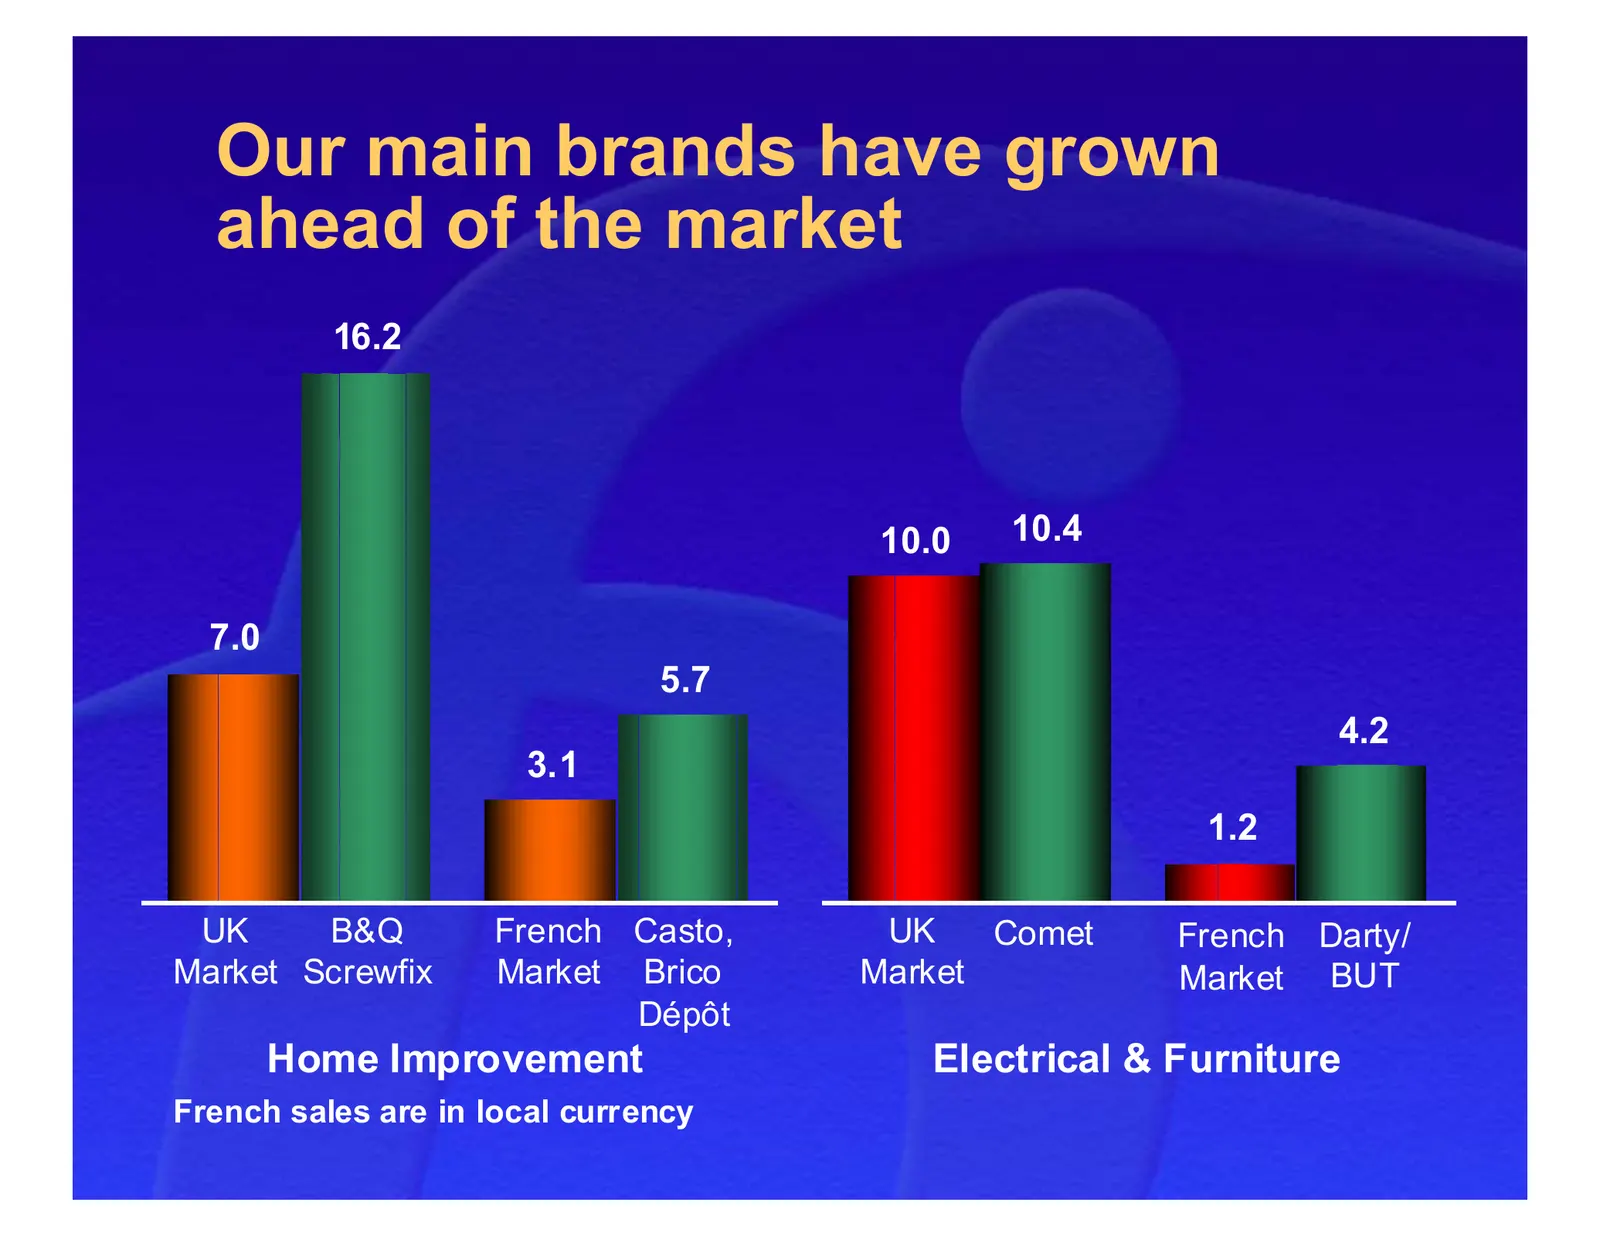
Our main brands have grown ahead of the market 16.2 10.0 10.4 7.0 5.7 4.2 3.1 1.2 UK B&Q French Casto, UK Comet French Darty/ Market Screwfix Market Brico Market Market BUT Dépôt Home Improvement Electrical & Furniture French sales are in local currency
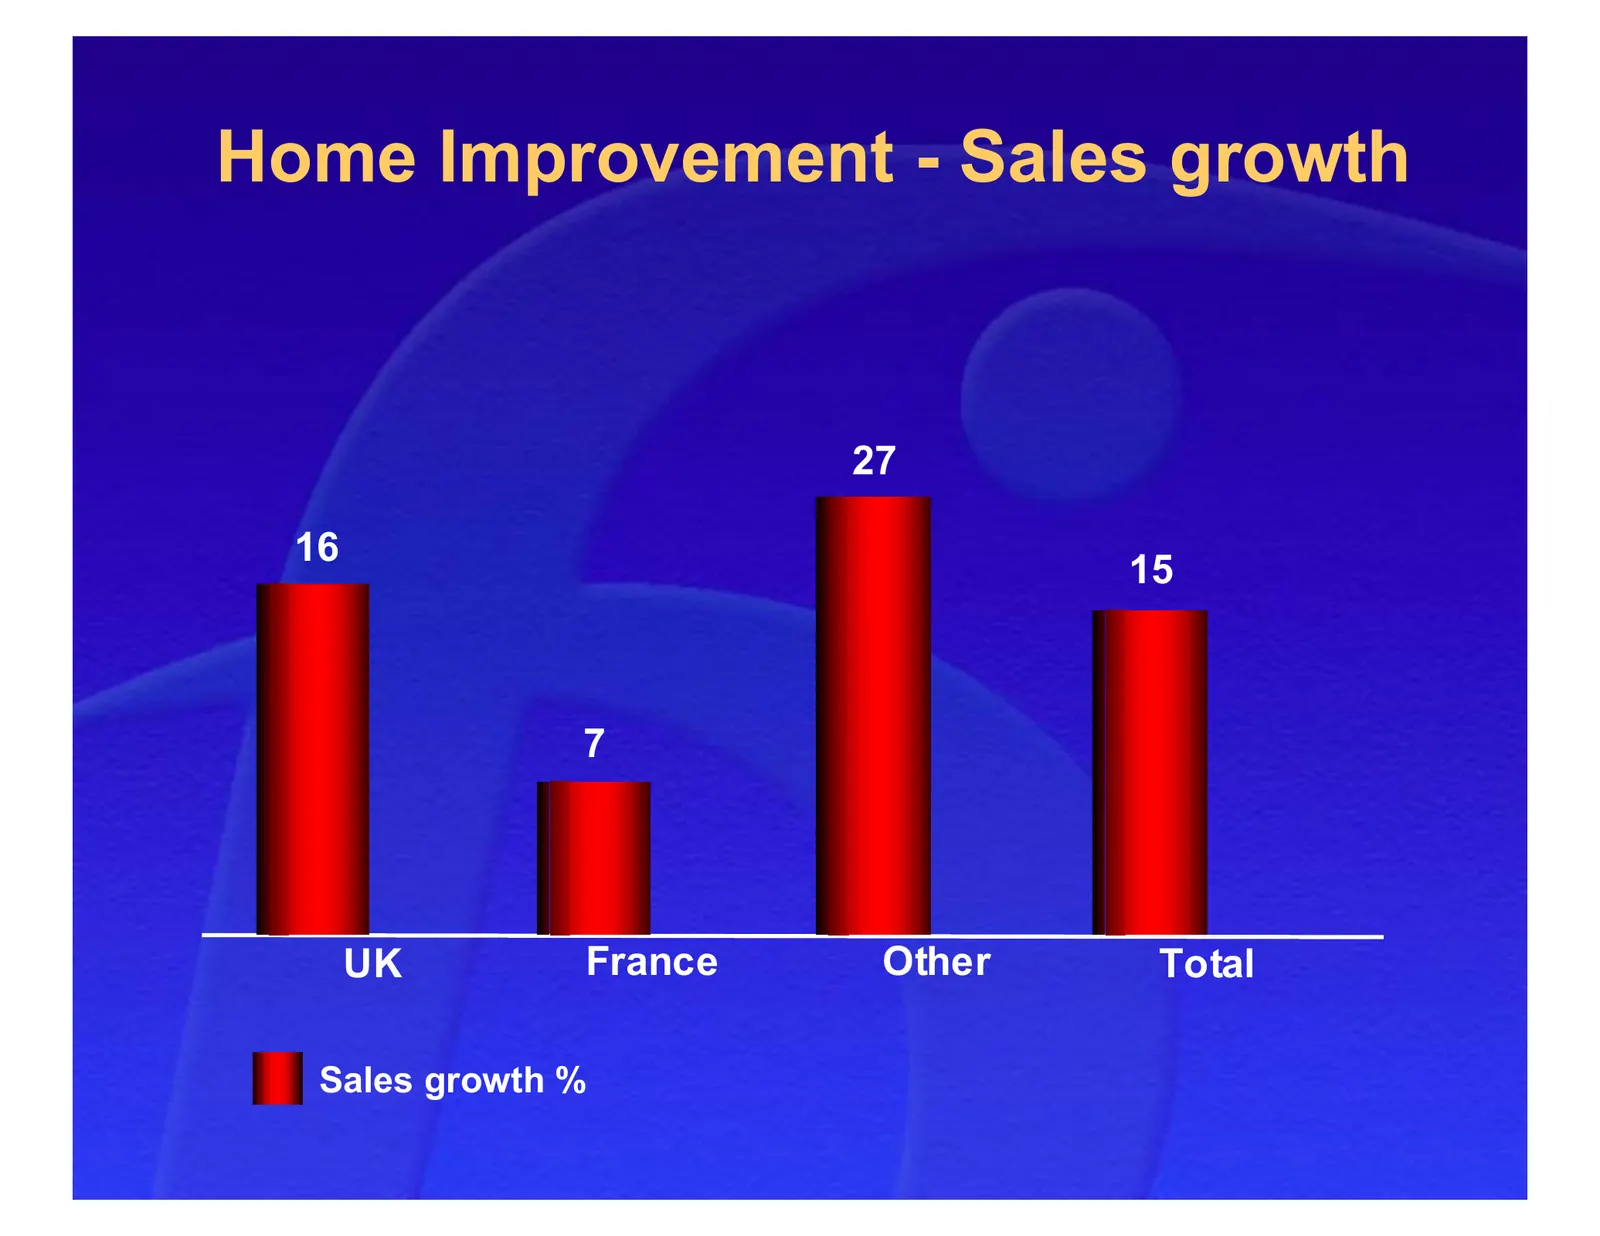
Slide 16: Home Improvement - Sales growth
Home Improvement - Sales growth 27 16 15 7 UK France Other Total Sales growth %
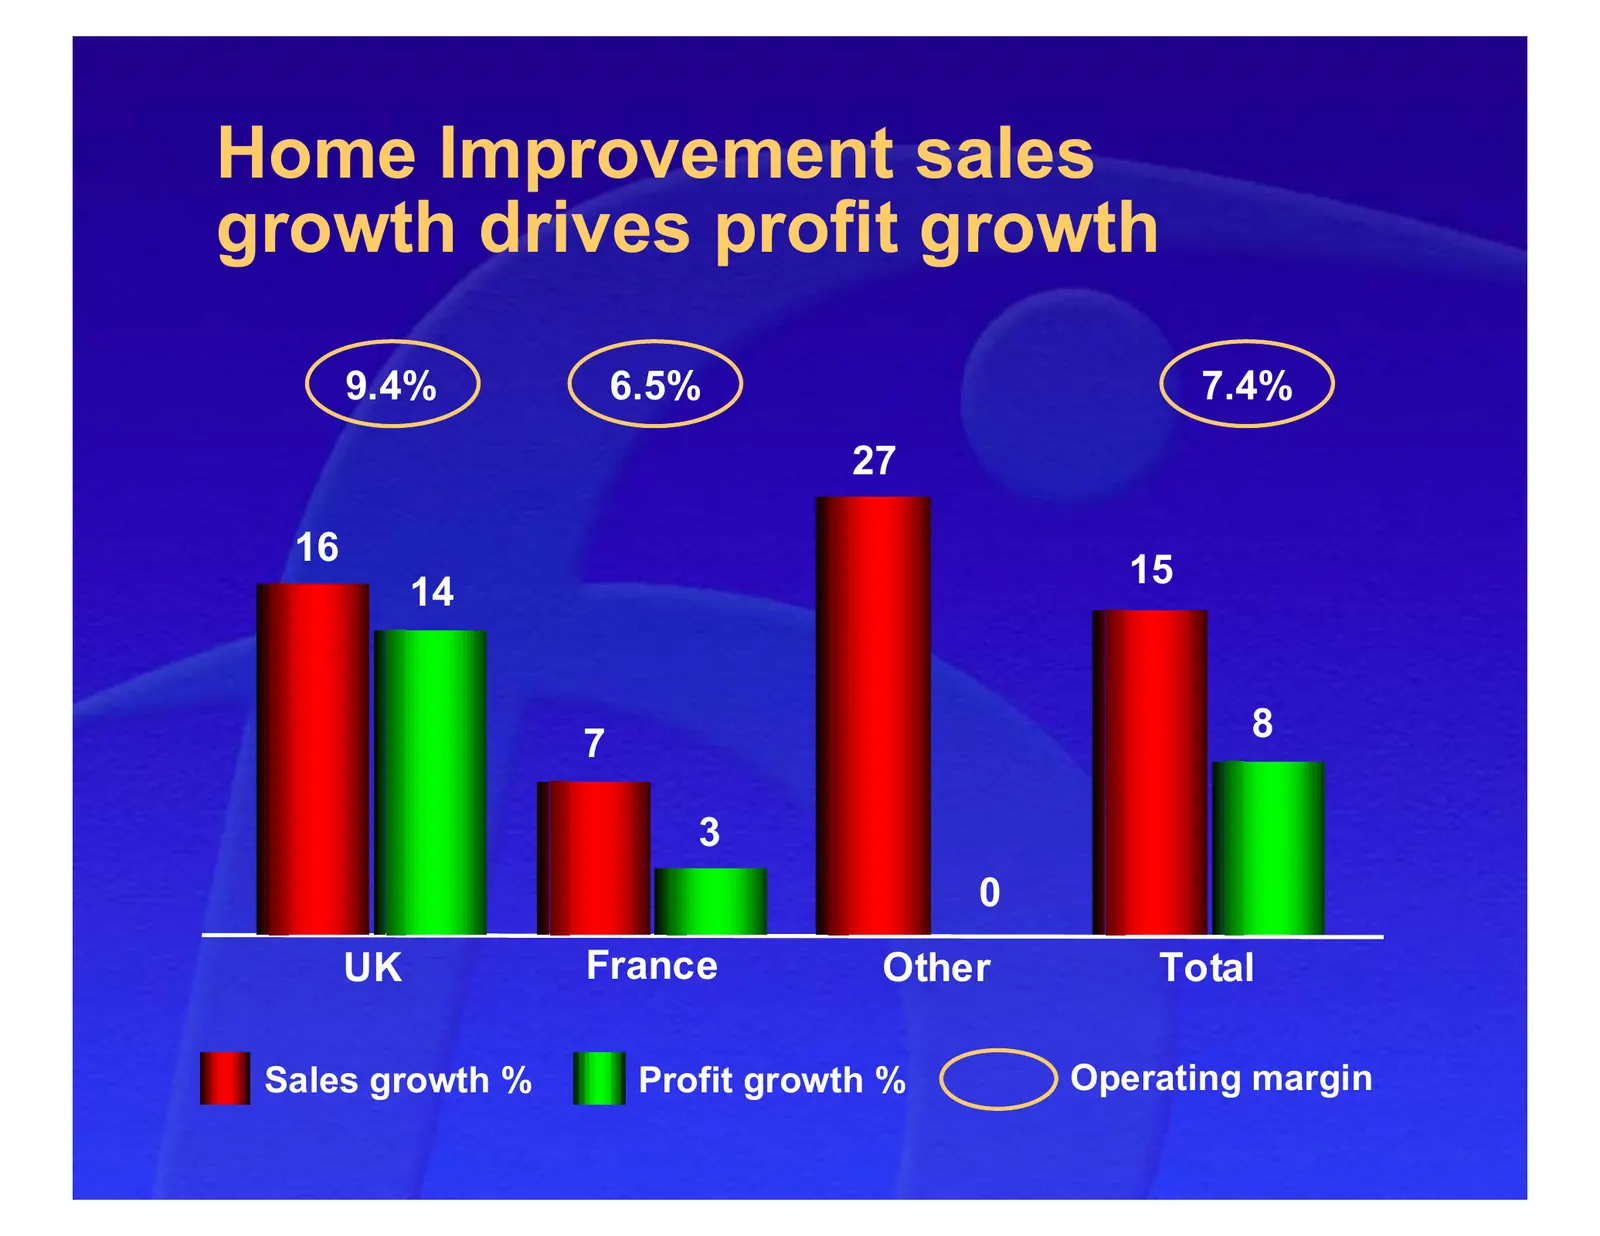
Slide 17: Home Improvement sales growth drives profit growth
Home Improvement sales growth drives profit growth 9.4% 6.5% 7.4% 27 16 15 14 8 7 3 0 UK France Other Total Sales growth % Profit growth % Operating margin
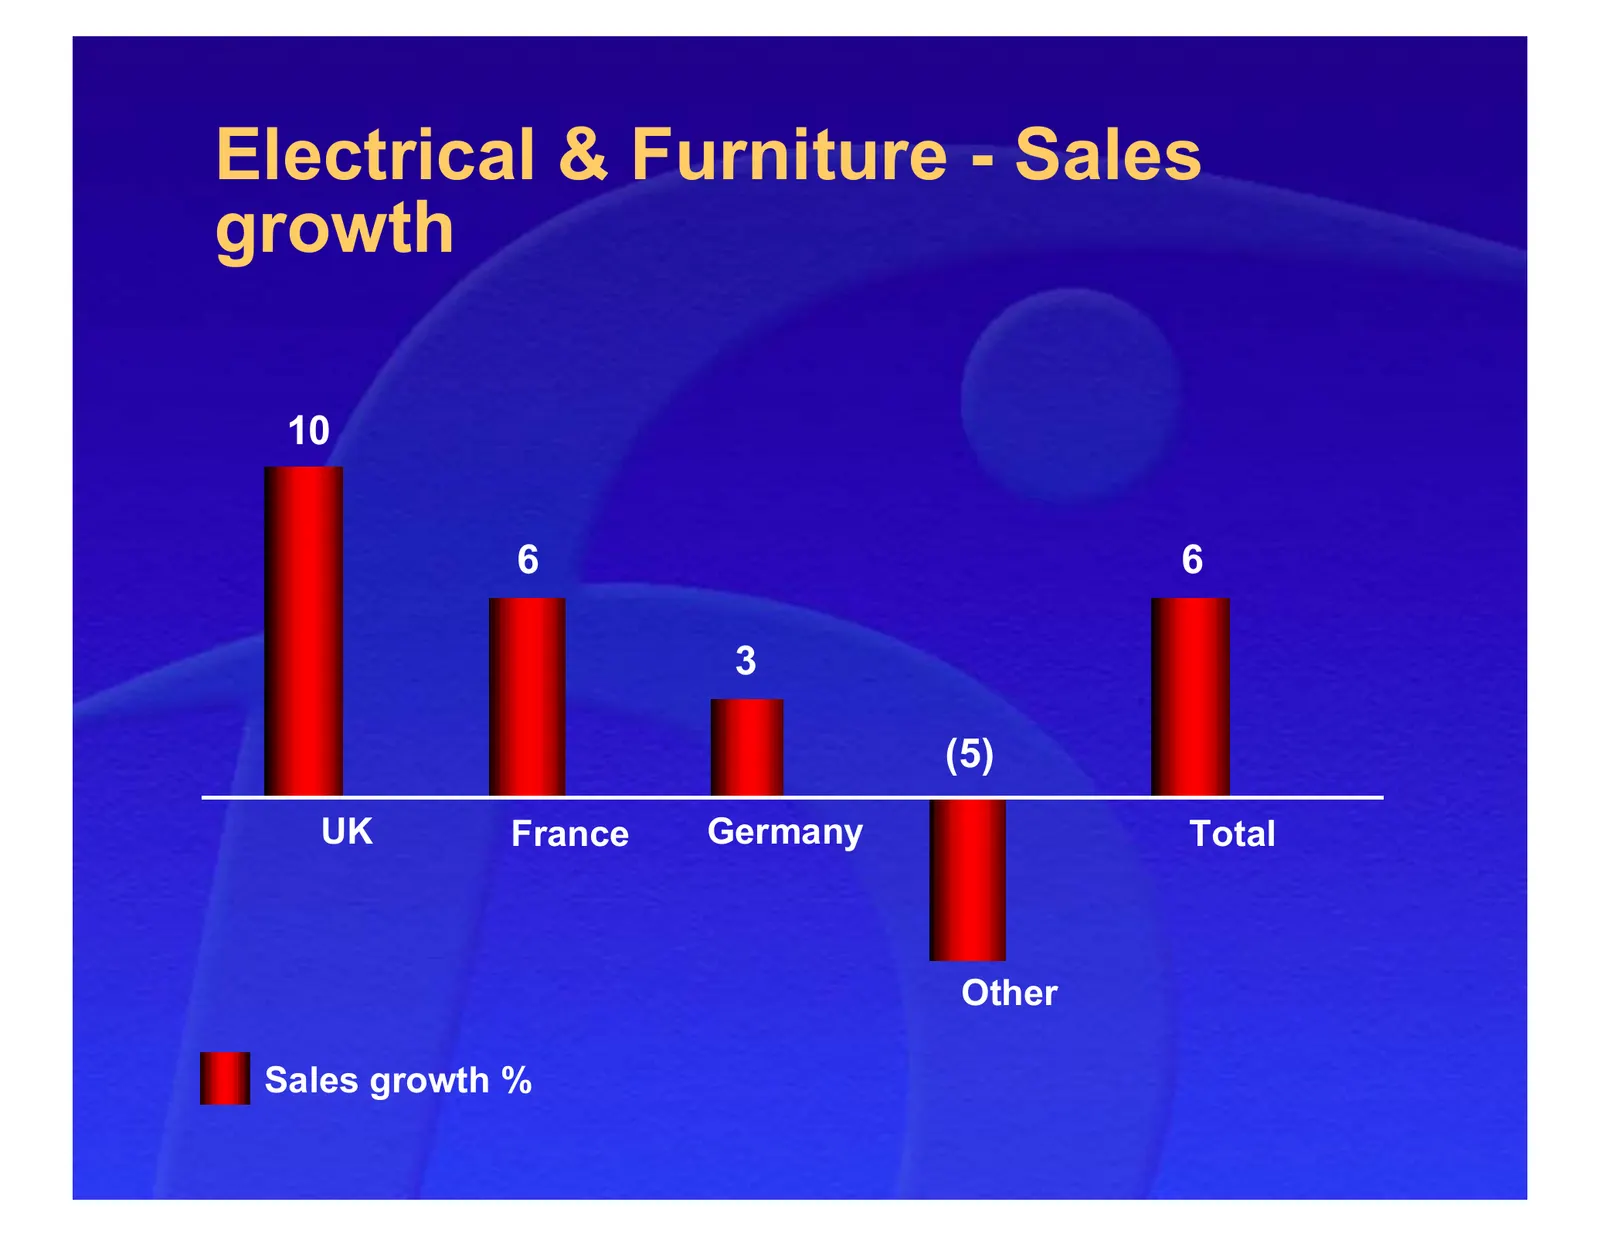
Slide 18: Electrical & Furniture - Sales growth
Electrical & Furniture - Sales growth 10 6 6 3 (5) UK France Germany Total Other Sales growth %
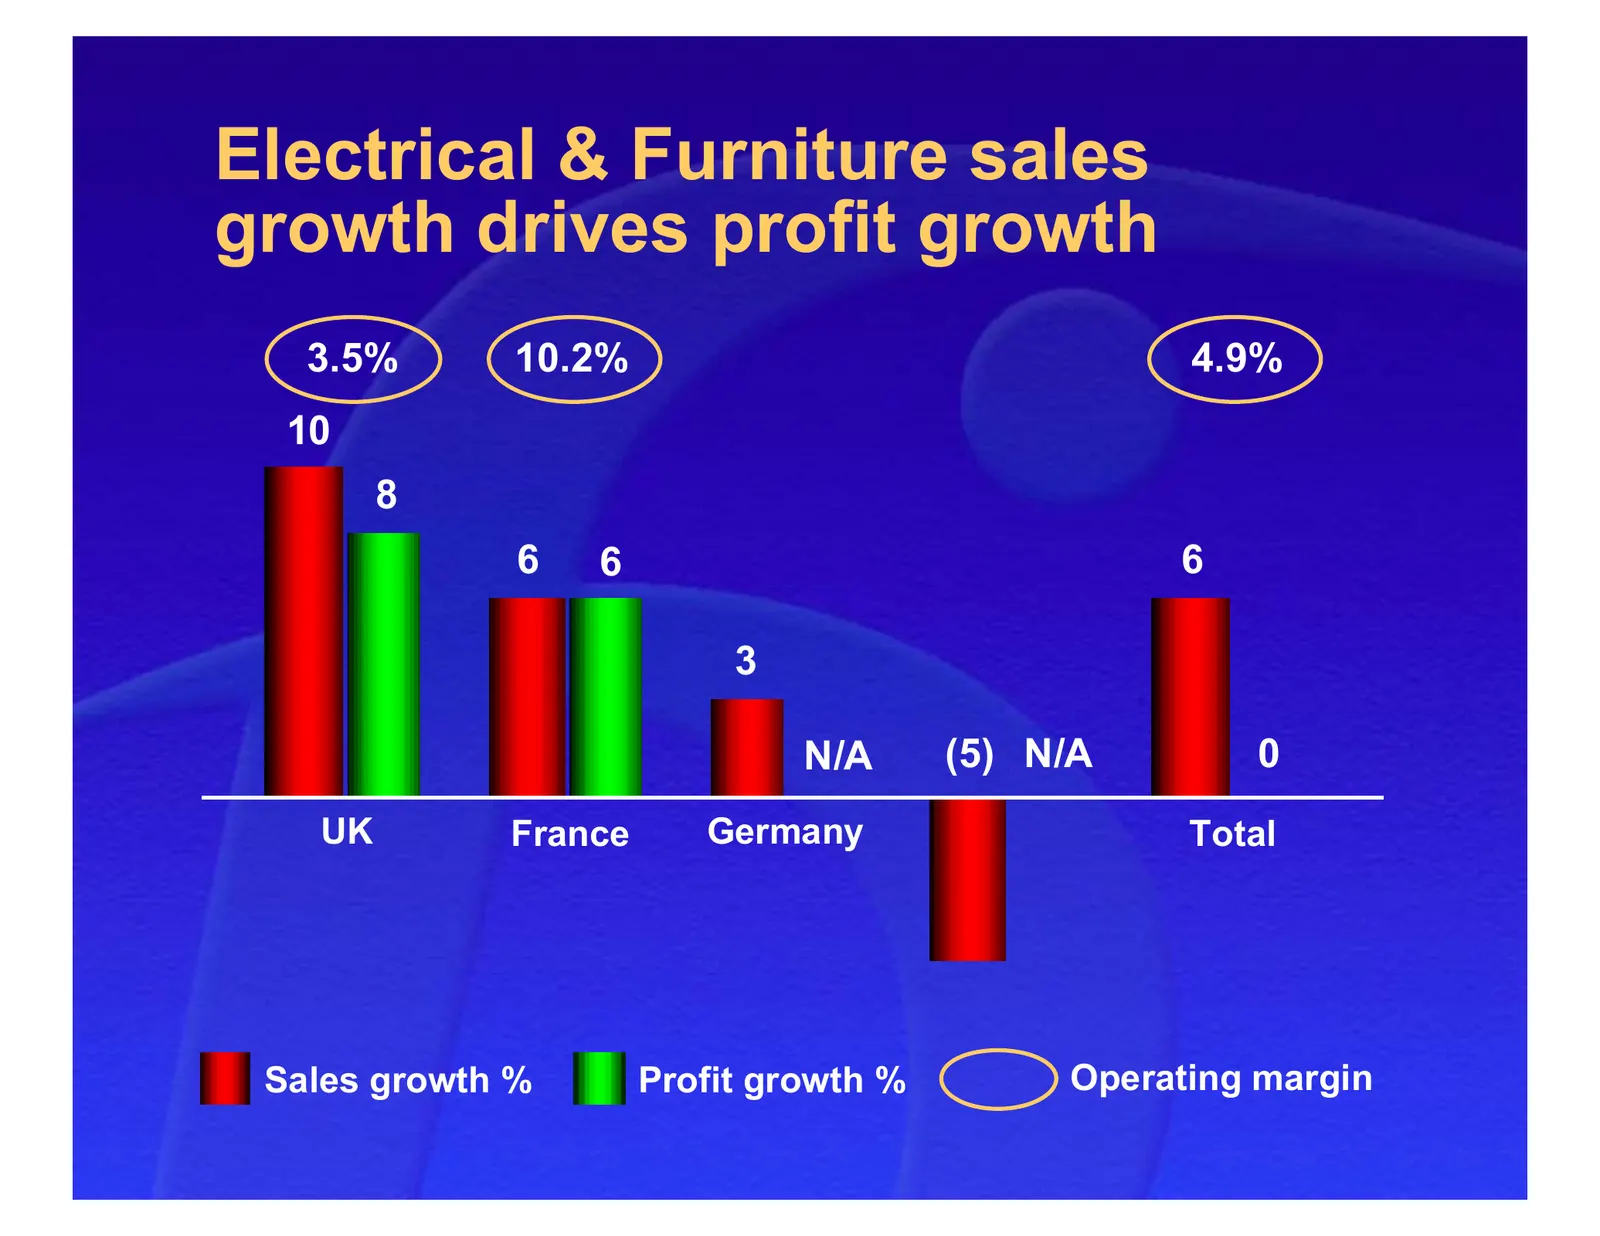
Slide 19: Electrical & Furniture sales growth drives profit growth
Electrical & Furniture sales growth drives profit growth 3.5% 10.2% 4.9% 10 8 6 6 6 3 N/A (5) N/A 0 UK France Germany Total Sales growth % Profit growth % Operating margin
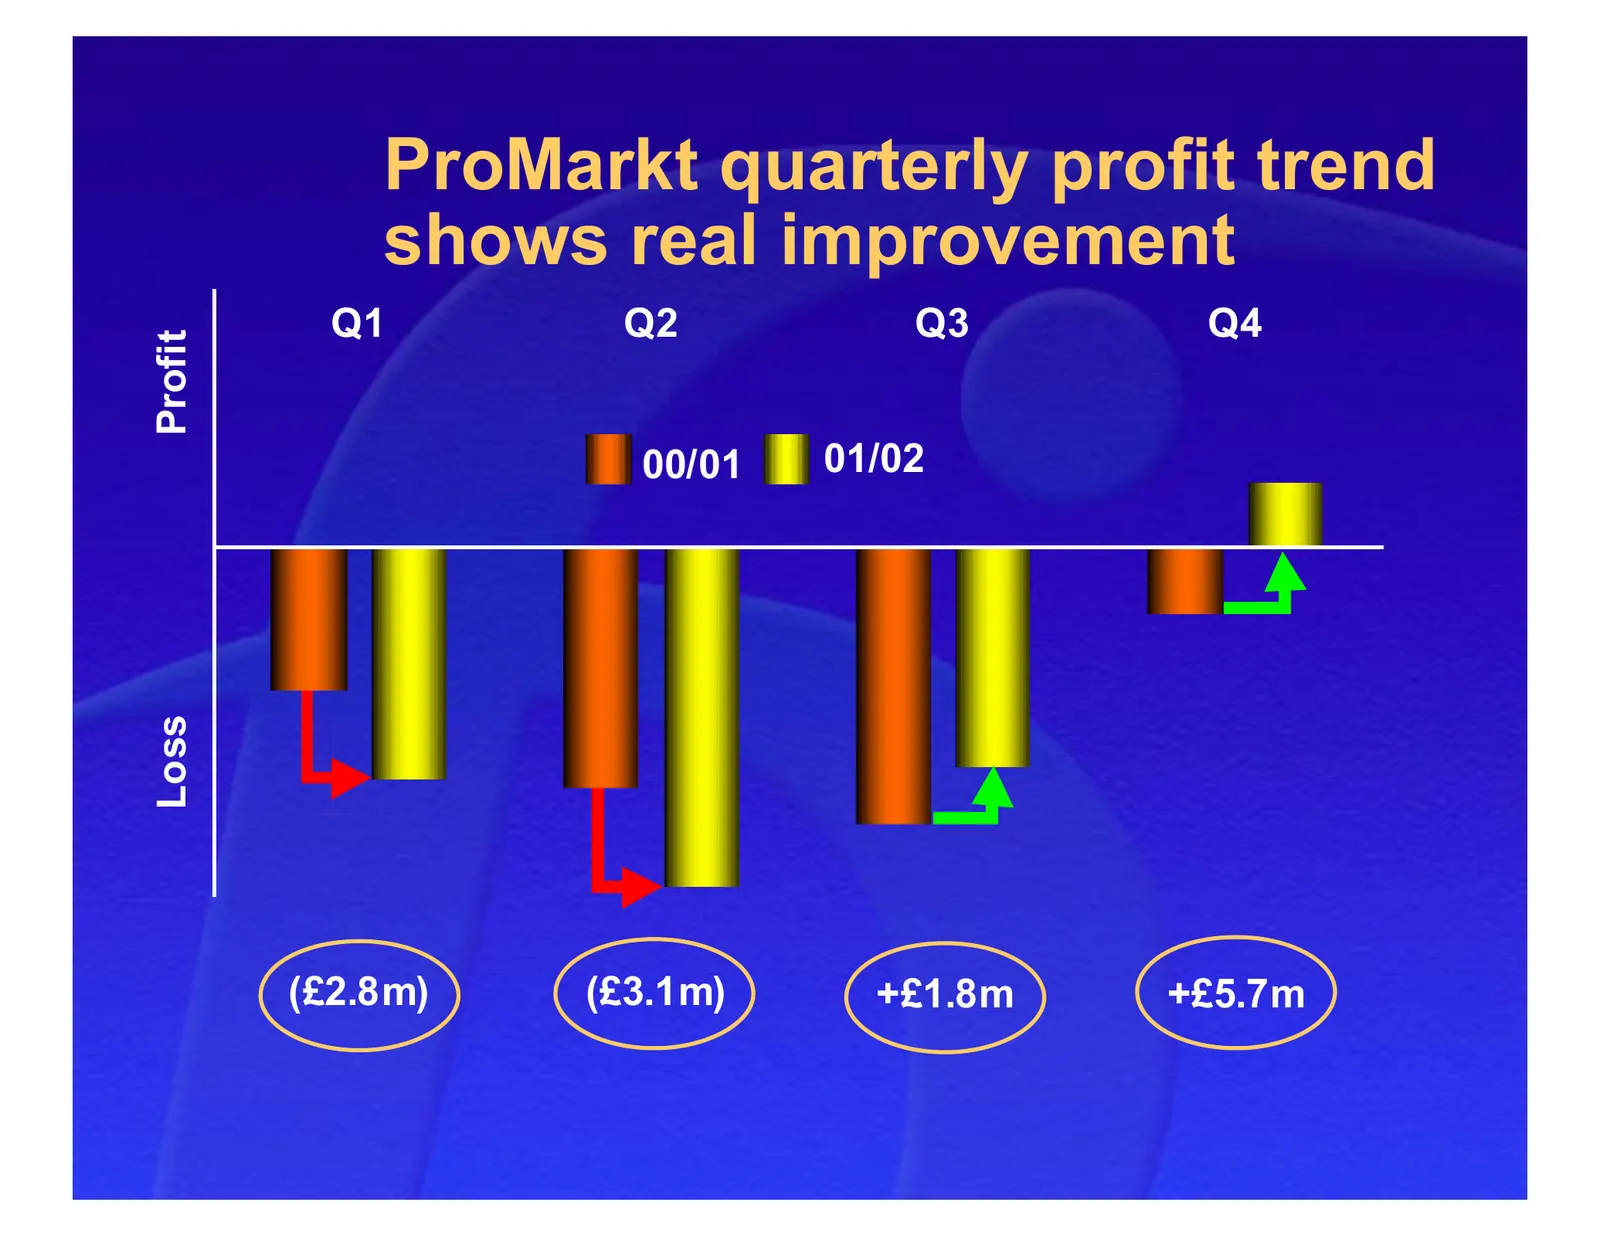
Slide 20: ProMarkt quarterly profit trend shows real improvement
ProMarkt quarterly profit trend shows real improvement Q1 Q2 Q3 Q4 Profit 00/01 01/02 Loss (£2.8m) (£3.1m) +£1.8m +£5.7m
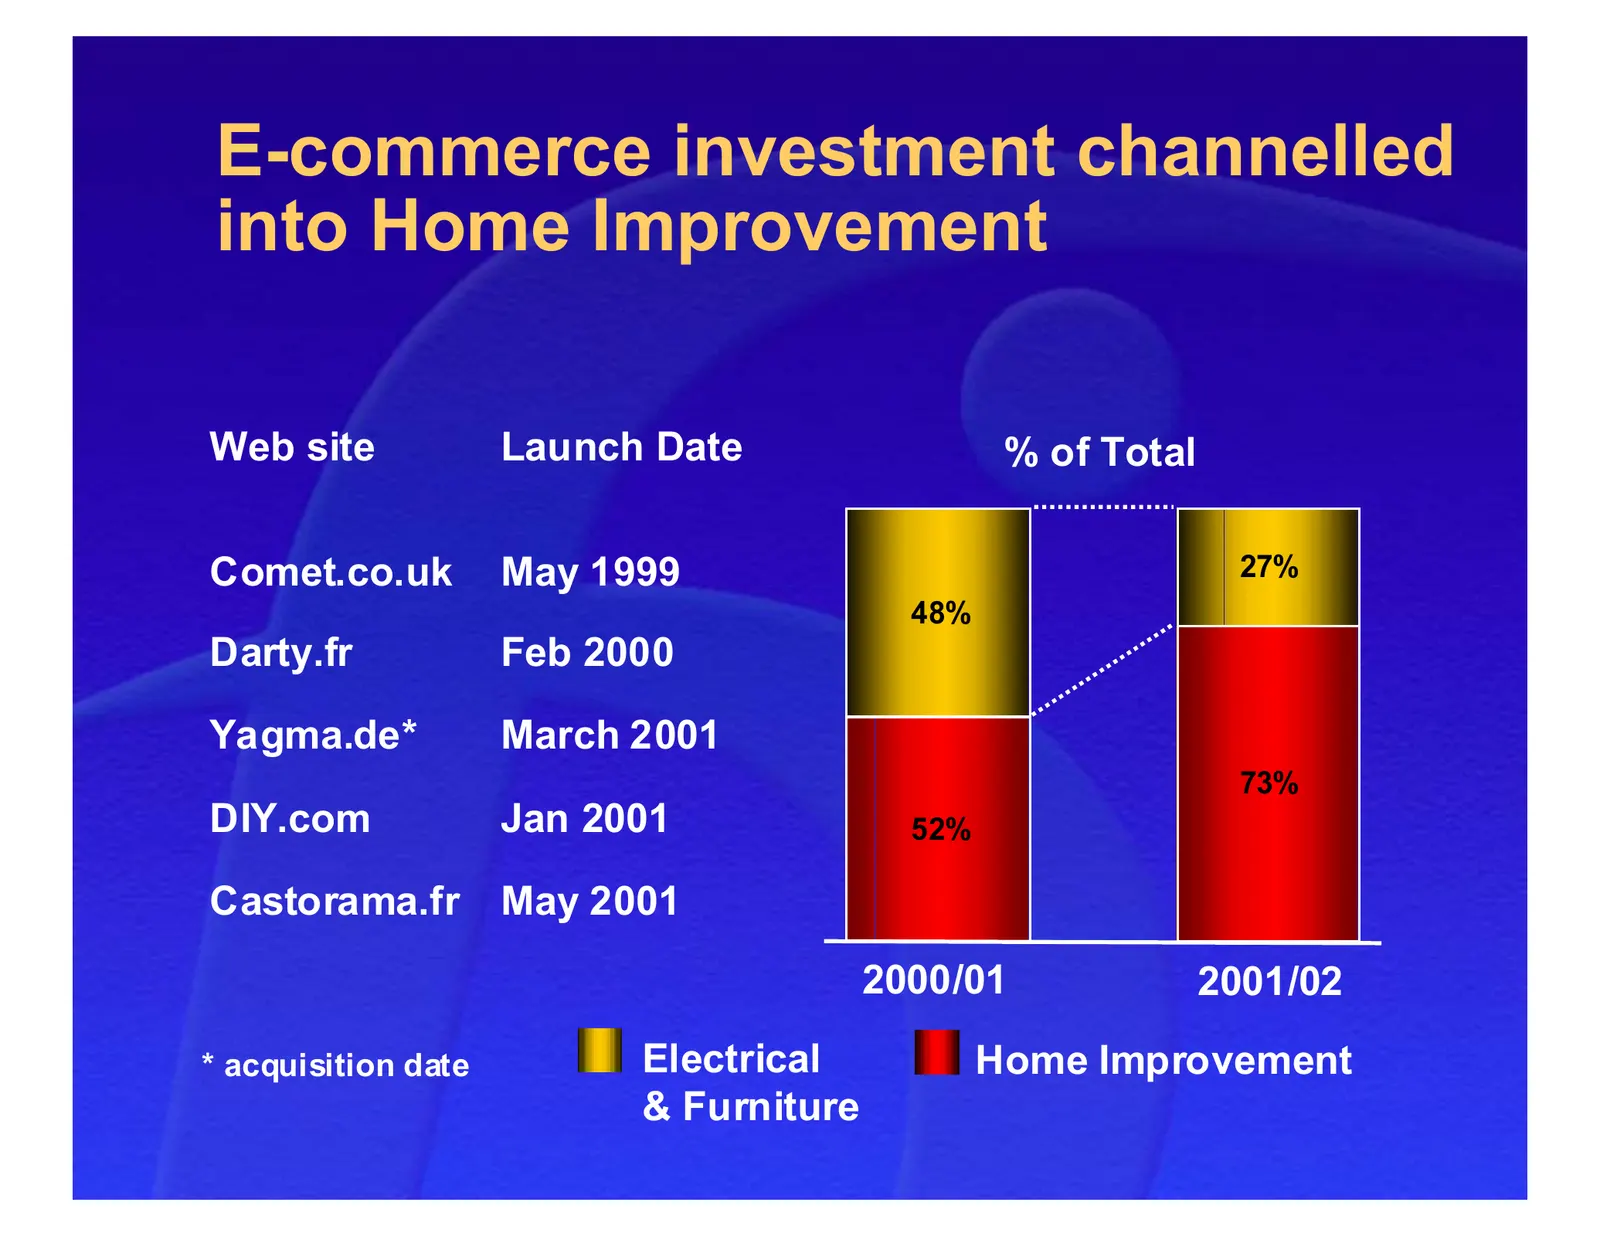
Slide 21: E-commerce investment channelled into Home Improvement
E-commerce investment channelled into Home Improvement Web site Launch Date % of Total Comet.co.uk May 1999 27% 48% Darty.fr Feb 2000 Yagma.de* March 2001 73% DIY.com Jan 2001 52% Castorama.fr May 2001 2000/01 2001/02 * acquisition date Electrical Home Improvement & Furniture
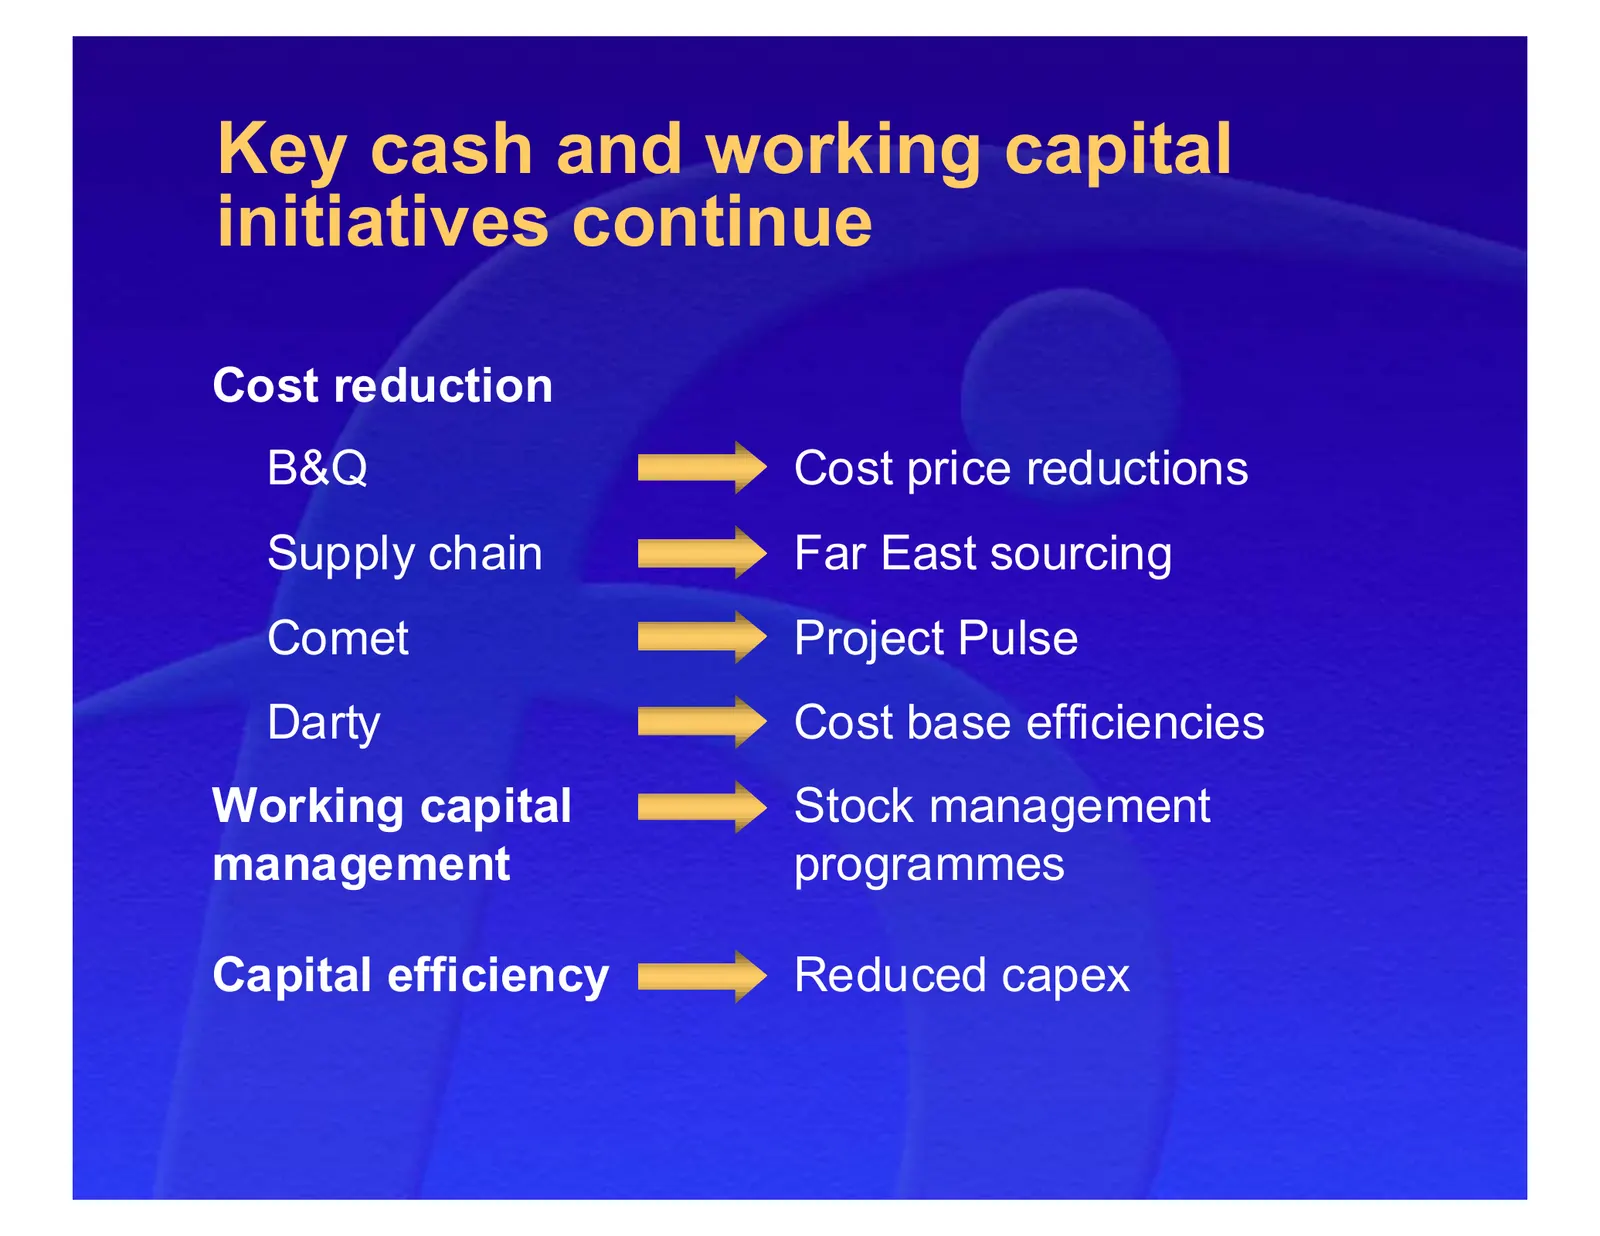
Slide 22: Key cash and working capital initiatives continue
Key cash and working capital initiatives continue Cost reduction B&Q Cost price reductions Supply chain Far East sourcing Comet Project Pulse Darty Cost base efficiencies Working capital Stock management management programmes Capital efficiency Reduced capex
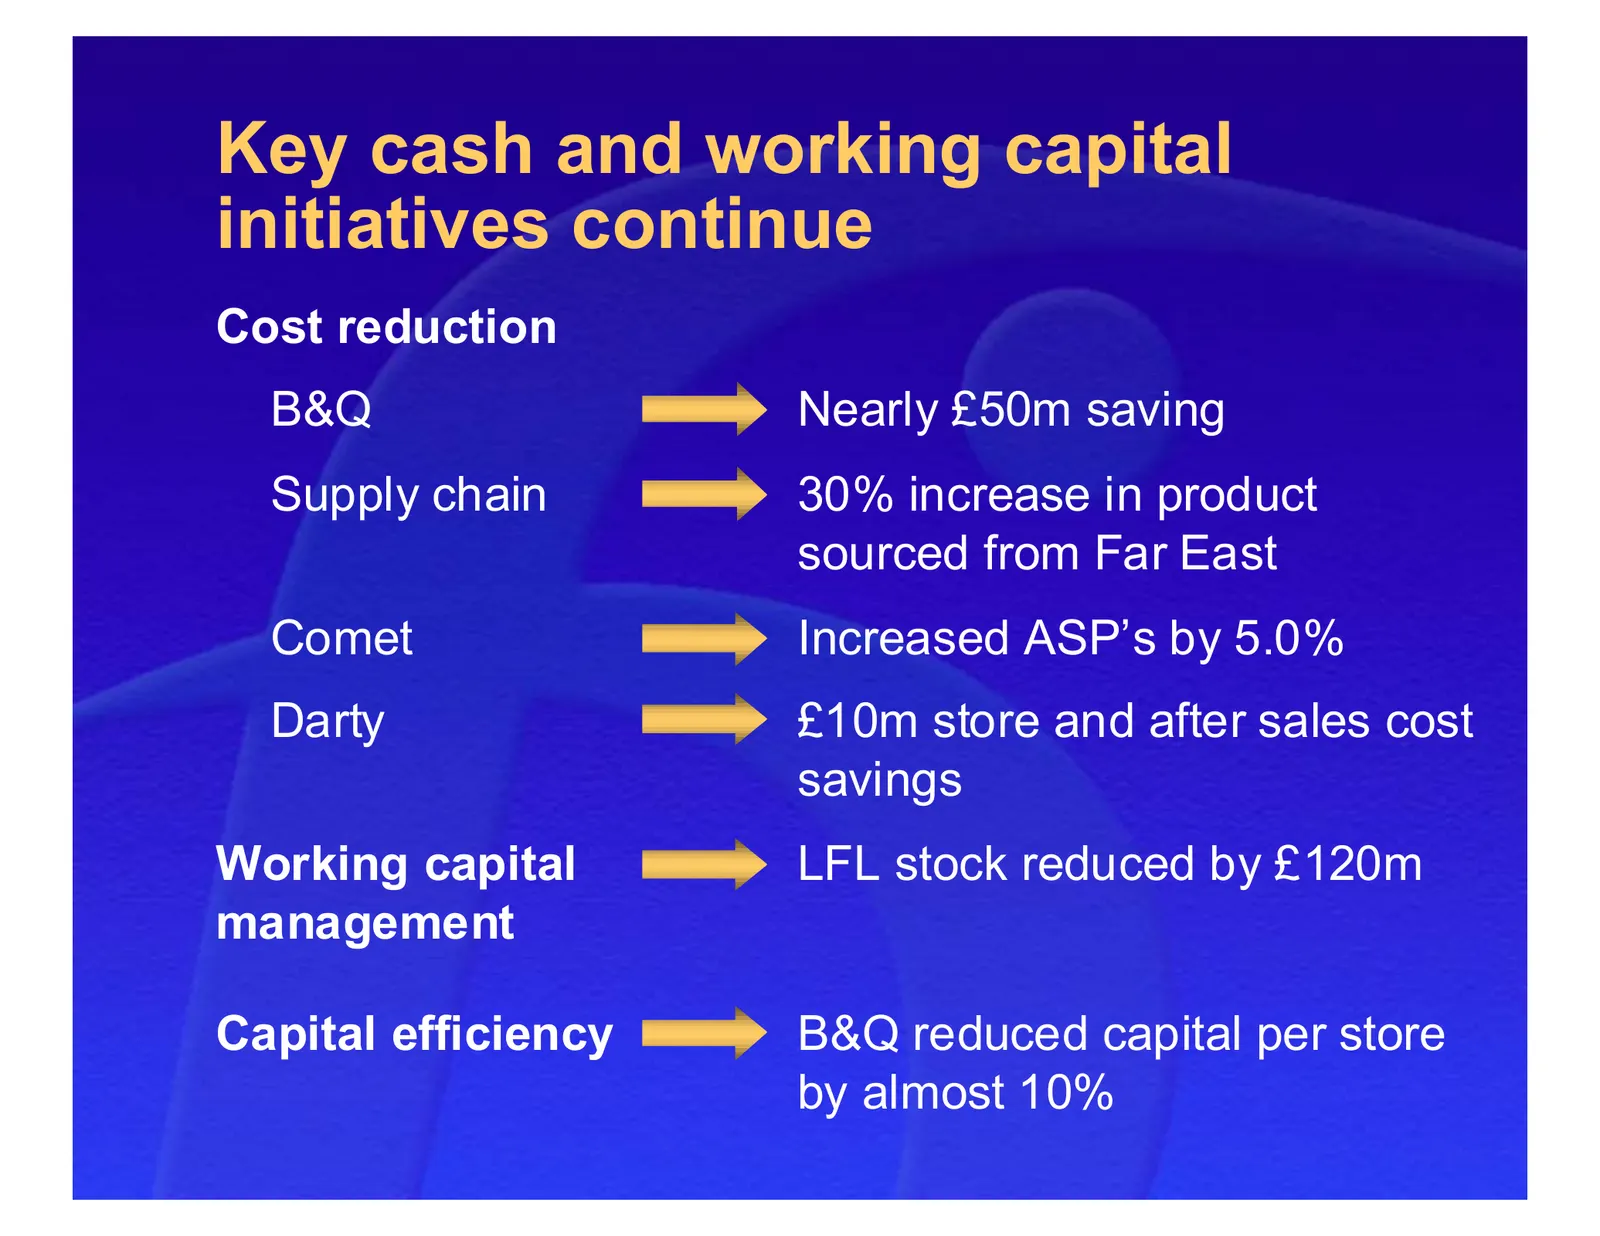
Slide 23: Key cash and working capital initiatives continue
Key cash and working capital initiatives continue Cost reduction B&Q Nearly £50m saving Supply chain 30% increase in product sourced from Far East Comet Increased ASP’s by 5.0% Darty £10m store and after sales cost savings Working capital LFL stock reduced by £120m management Capital efficiency B&Q

Slide 24: Summary Financials
Summary Financials
Slide 25: Profit before tax
Profit before tax Profit before tax* - £m 5.2 (12.2) 1. 8 1.6 31.9 560.0 531.8 2000/01 Retail e-commerce Property Other Interest 2001/02 profit operating costs * excluding goodwill and exceptional items
Slide 26: Profit after tax
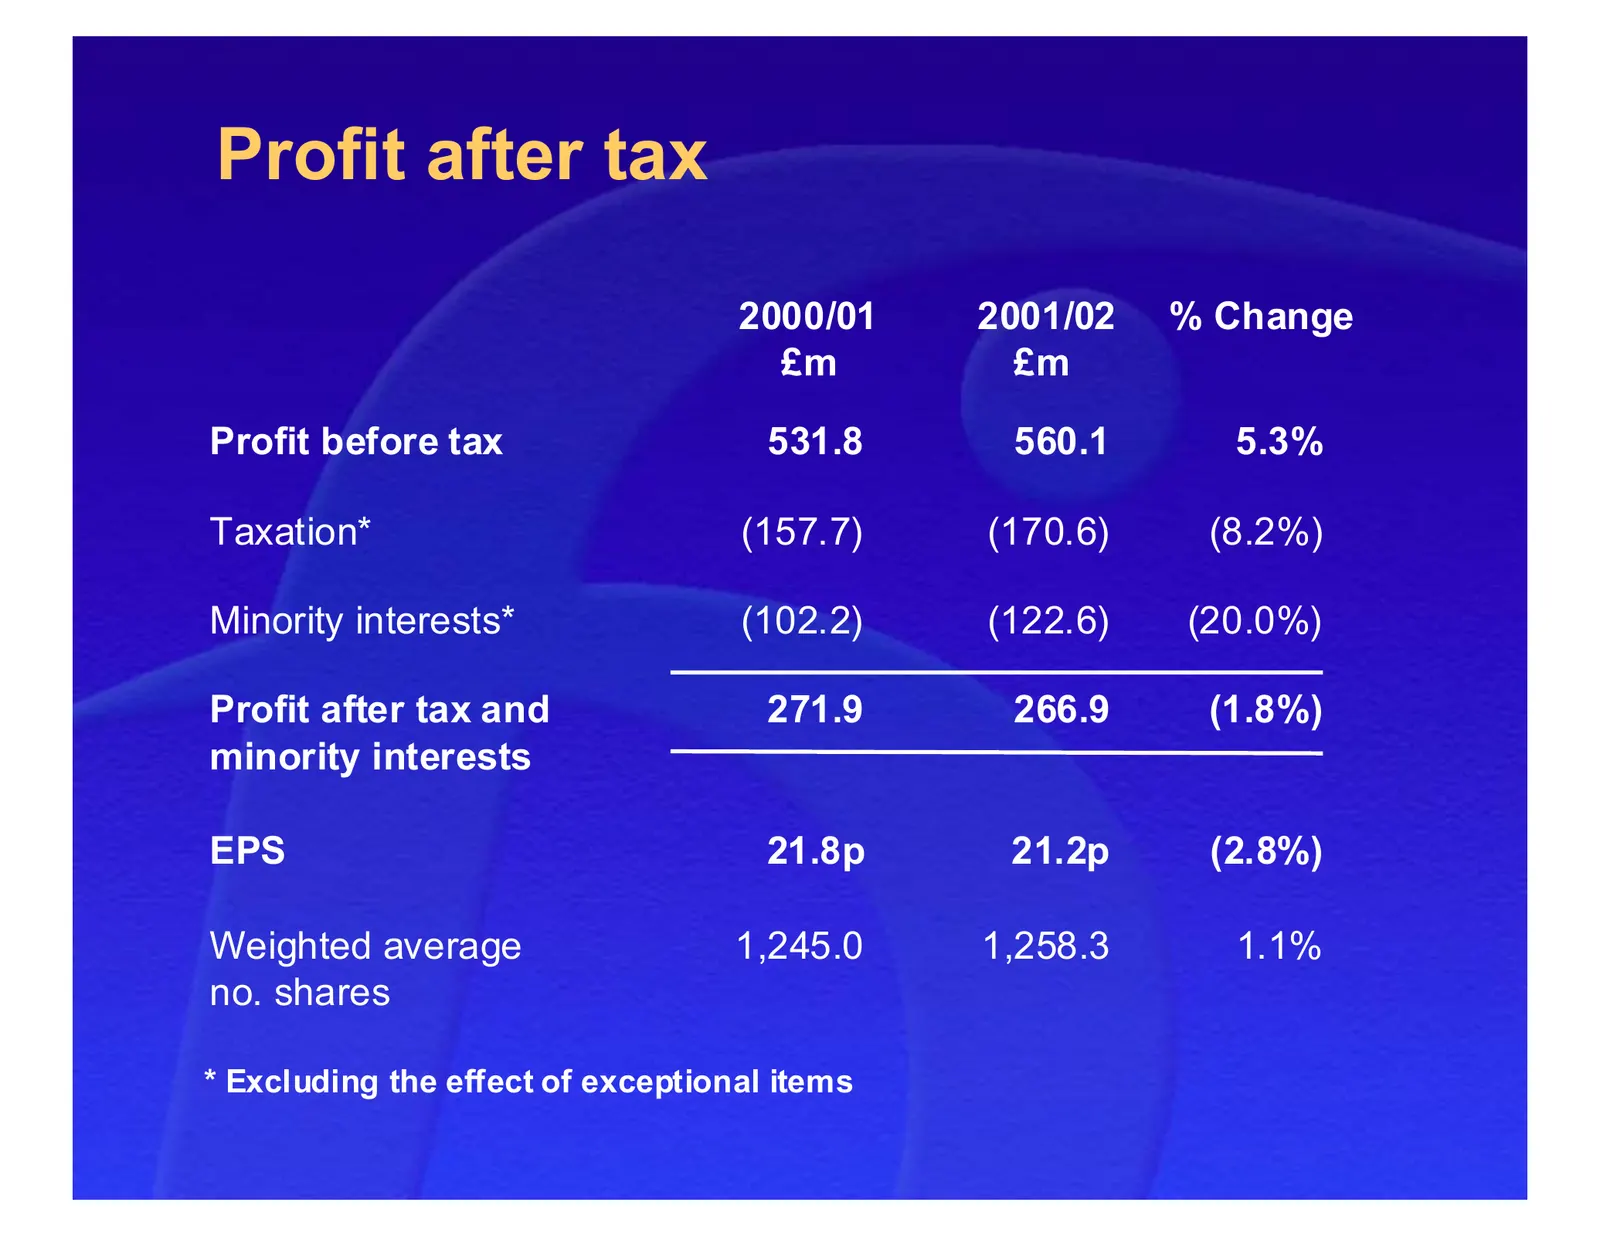
Profit after tax 2000/01 2001/02 % Change £m £m Profit before tax 531.8 560.1 5.3% Taxation* (157.7) (170.6) (8.2%) Minority interests* (102.2) (122.6) (20.0%) Profit after tax and 271.9 266.9 (1.8%) minority interests EPS 21.8p 21.2p (2.8%) Weighted average 1,245.0 1,258.3 1.1% no. shares * Excludi
Slide 27: Dividend cover maintained at 1.8 times
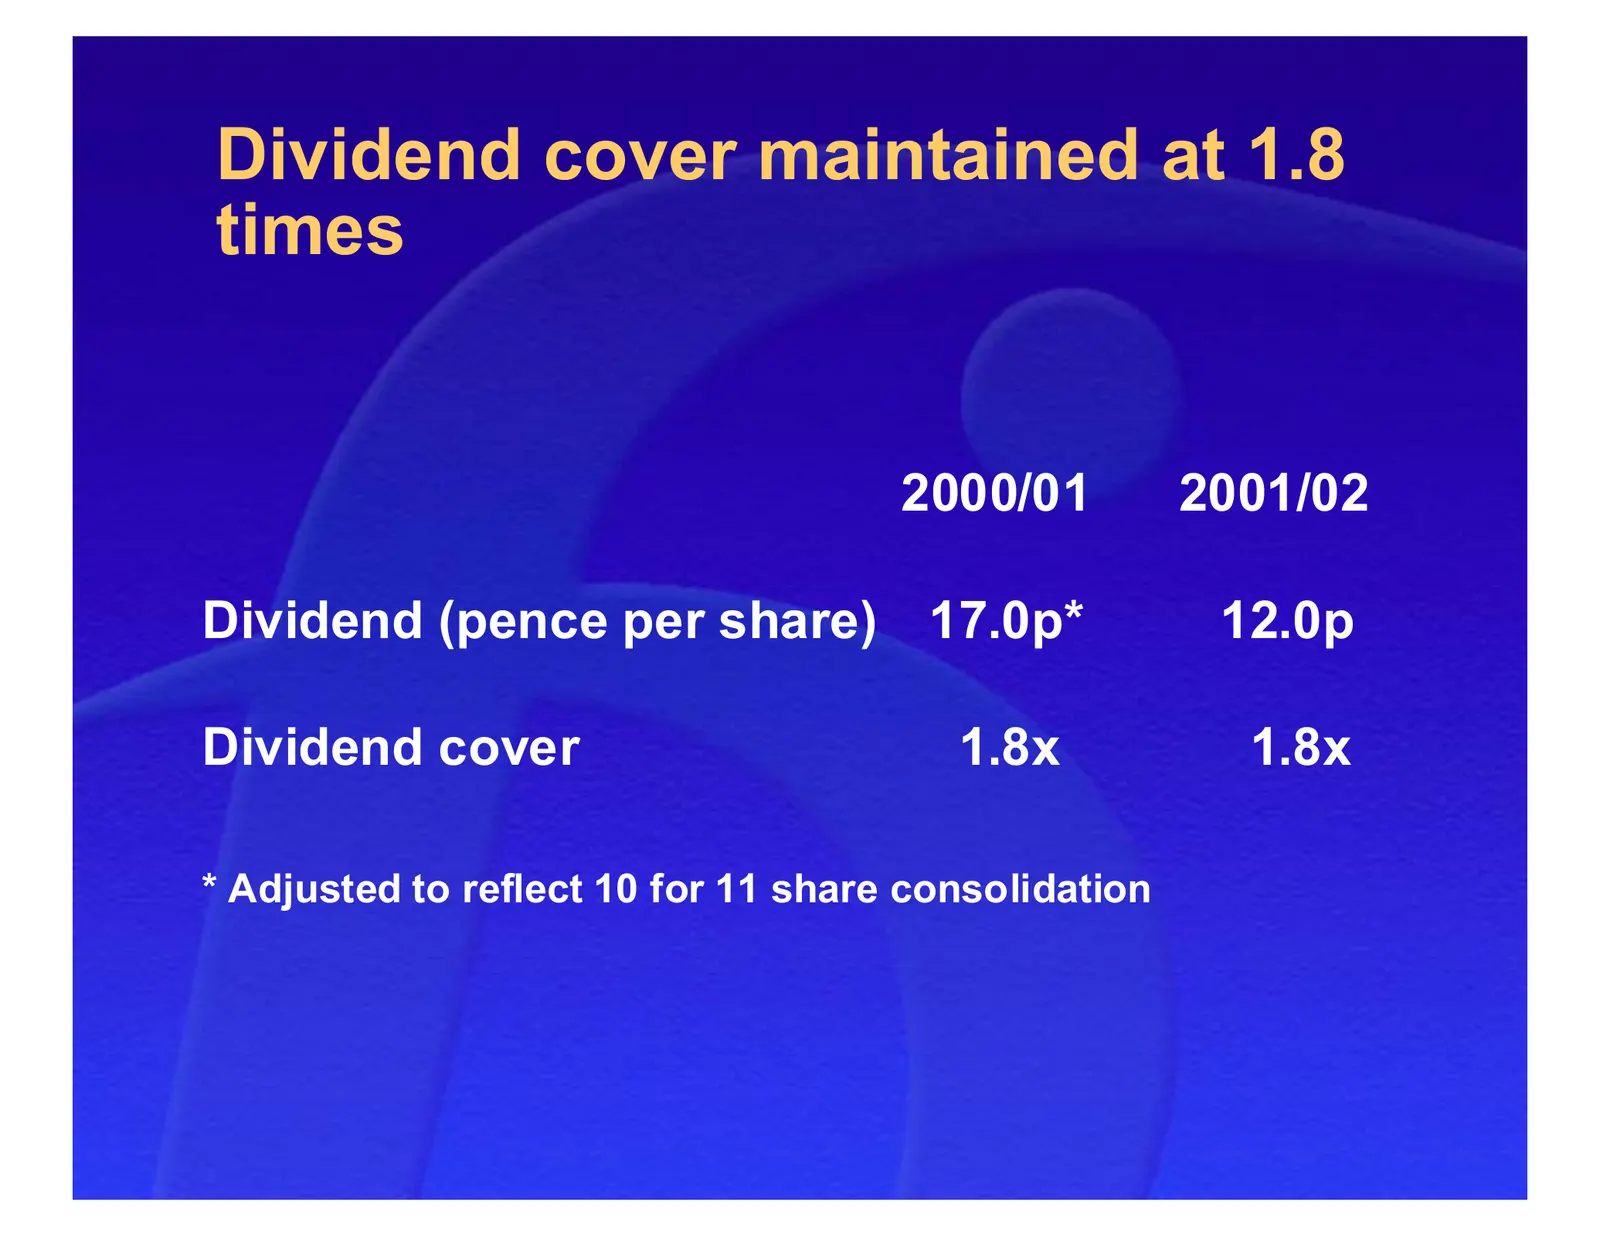
Dividend cover maintained at 1.8 times 2000/01 2001/02 Dividend (pence per share) 17.0p* 12.0p Dividend cover 1.8x 1.8x * Adjusted to reflect 10 for 11 share consolidation

Slide 28: Balance sheet
Balance sheet
Slide 29: Gearing reduced by 20%
Gearing reduced by 20% 53.5% 33.3% 1.9 0.9 “Flat underlying net debt” 1.0 0.8 (0.2) 1.0 (0.6) 0.2 (0.2) “U 2 G 200 N C M cas n d 000 ro et C r nb G h a ow as p s 20 O H TR er h re a en nd * u p 0 /1 th er /1 ca o h . 01 c fl al ch O F er er i s ly fr pe / de fi/ 2 om in al e x bt g ” * Cash flow of

Slide 30: Accounting and reporting changes
Accounting and reporting changes
Slide 31: FRS 17
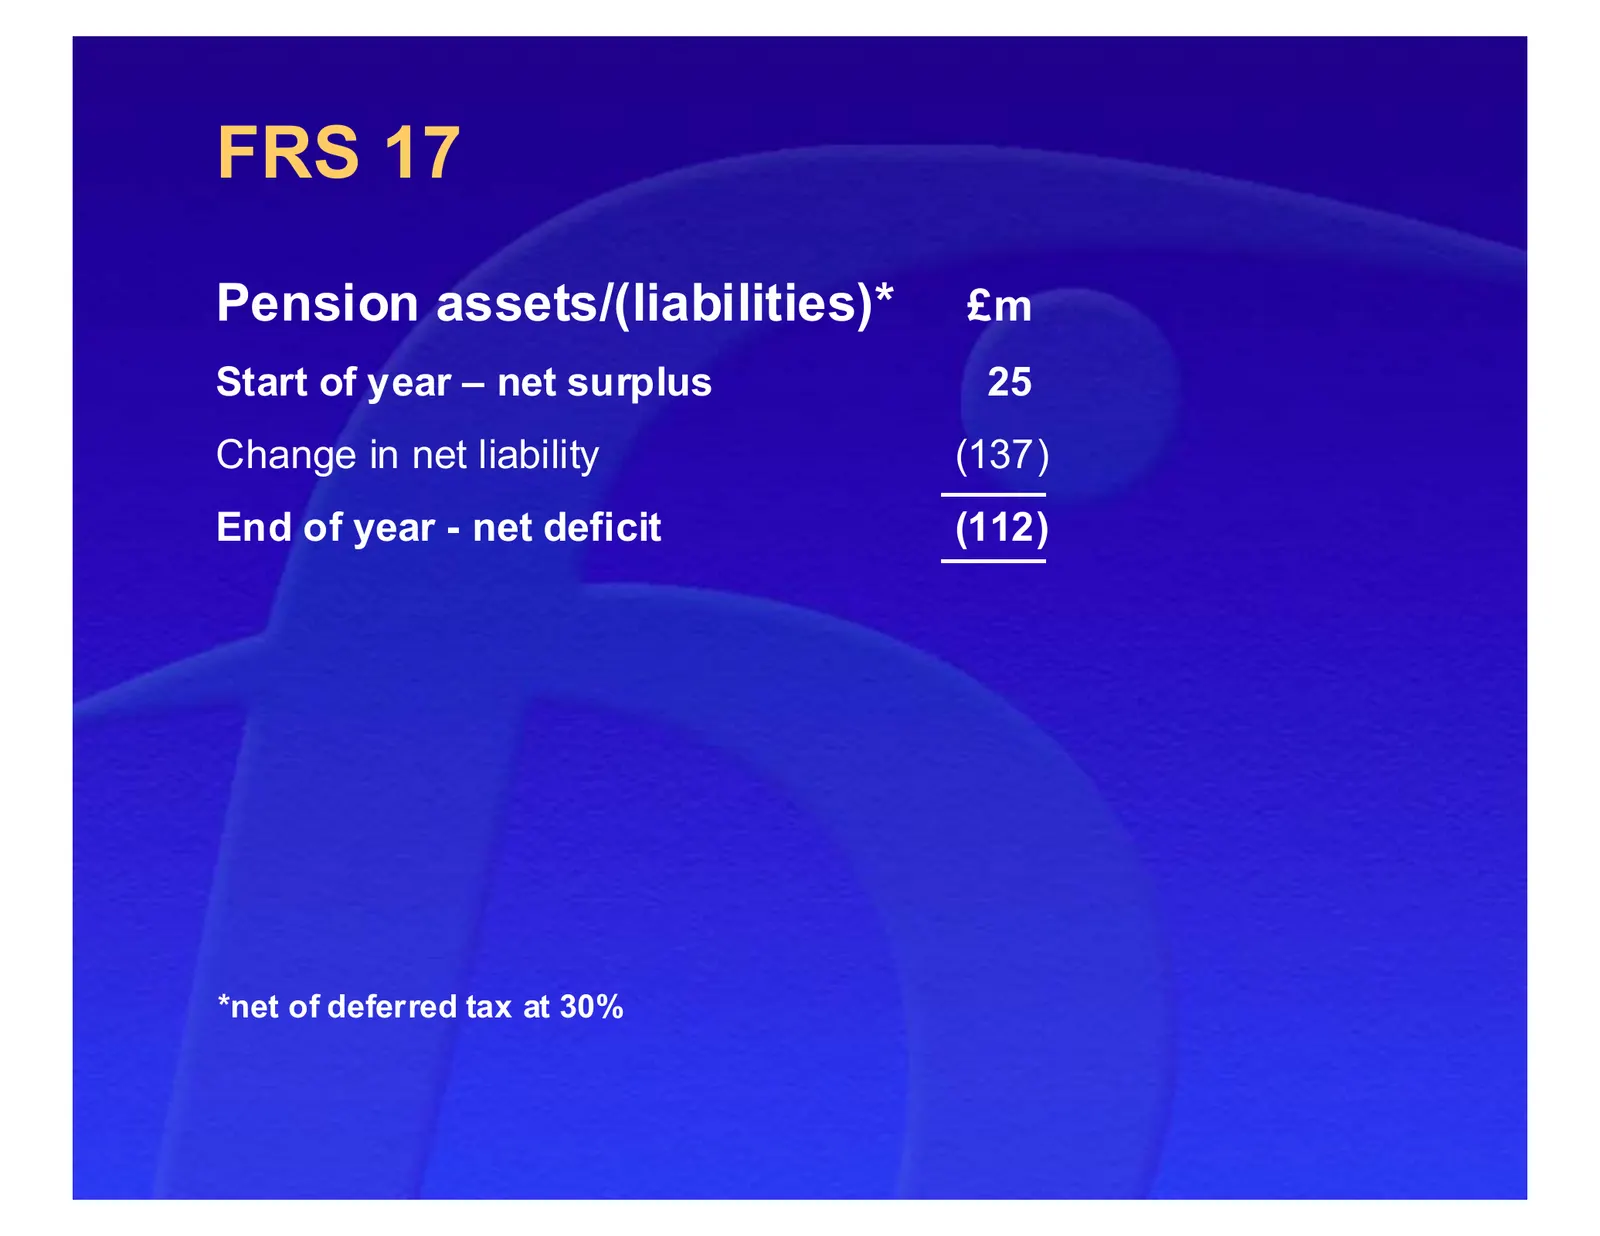
FRS 17 Pension assets/(liabilities)* £m Start of year – net surplus 25 Change in net liability (137) End of year - net deficit (112) *net of deferred tax at 30%
Slide 32: FRS 17
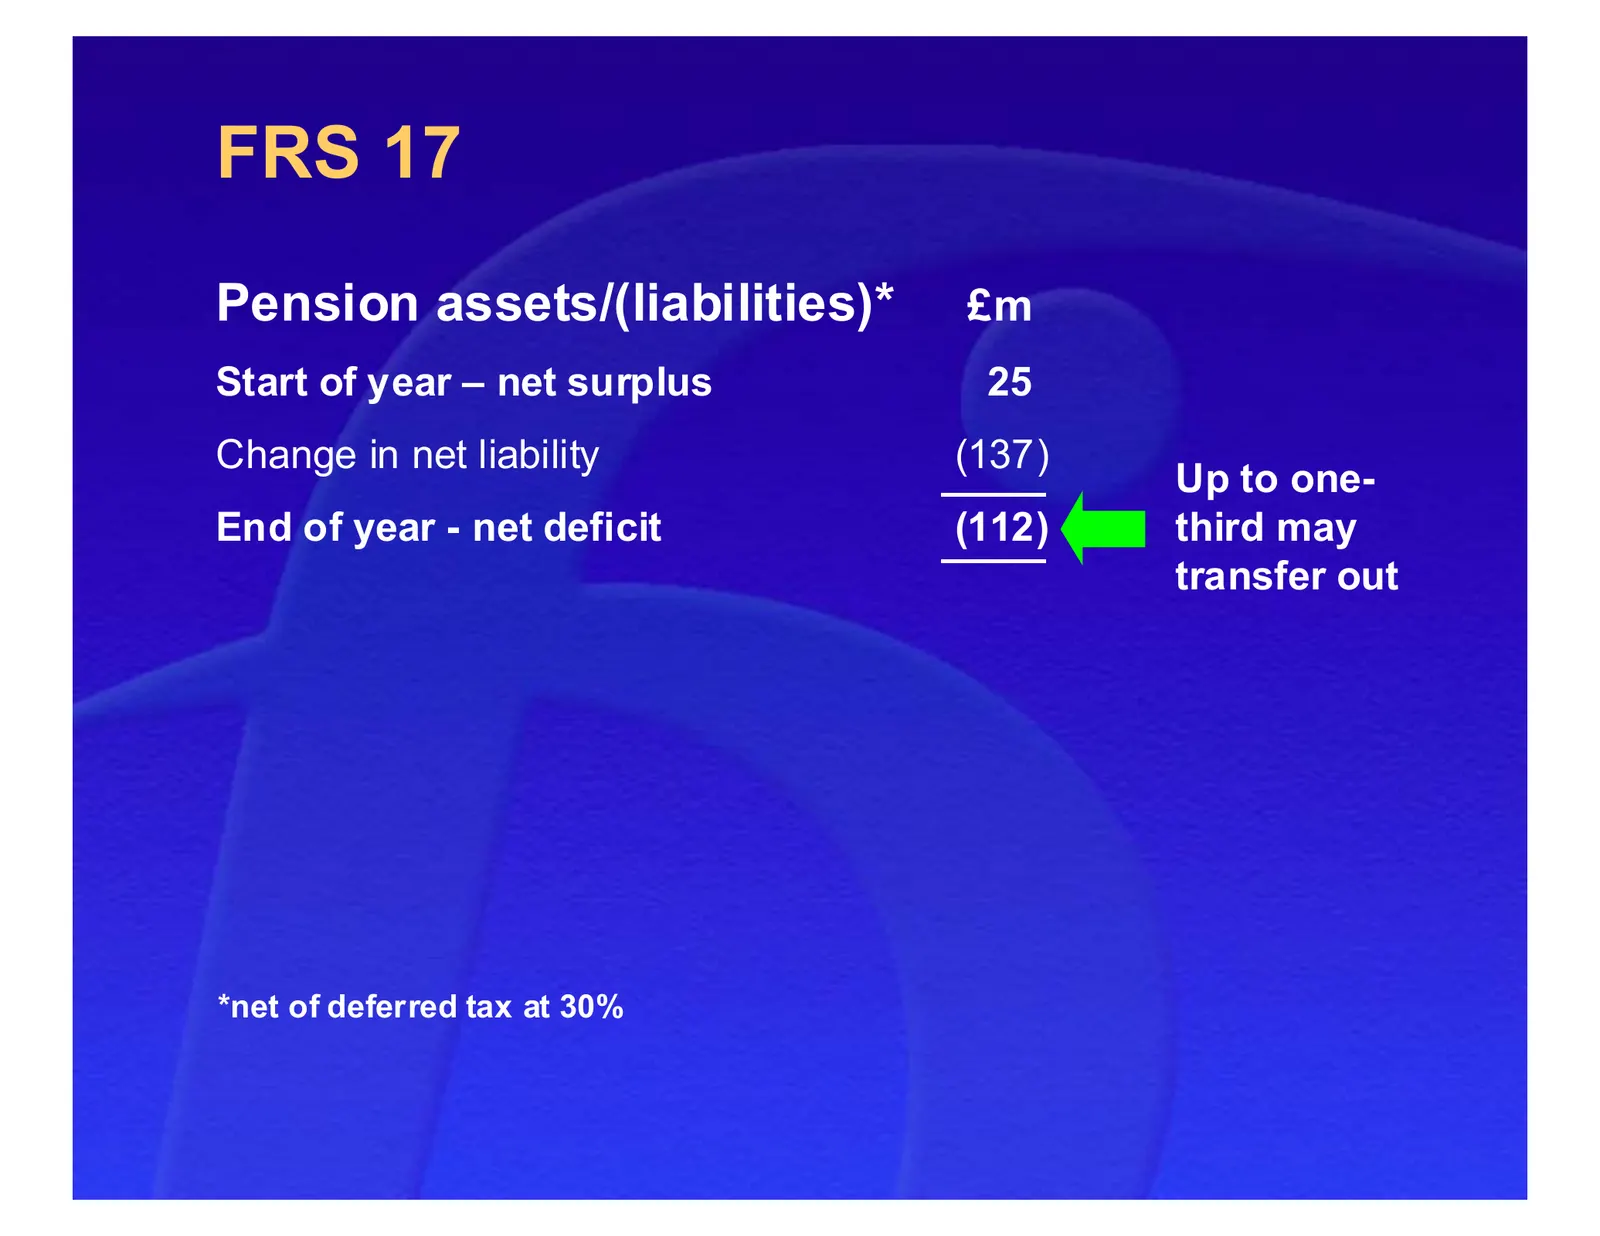
FRS 17 Pension assets/(liabilities)* £m Start of year – net surplus 25 Change in net liability (137) Up to one- End of year - net deficit (112) third may transfer out *net of deferred tax at 30%
Slide 33: FRS 17
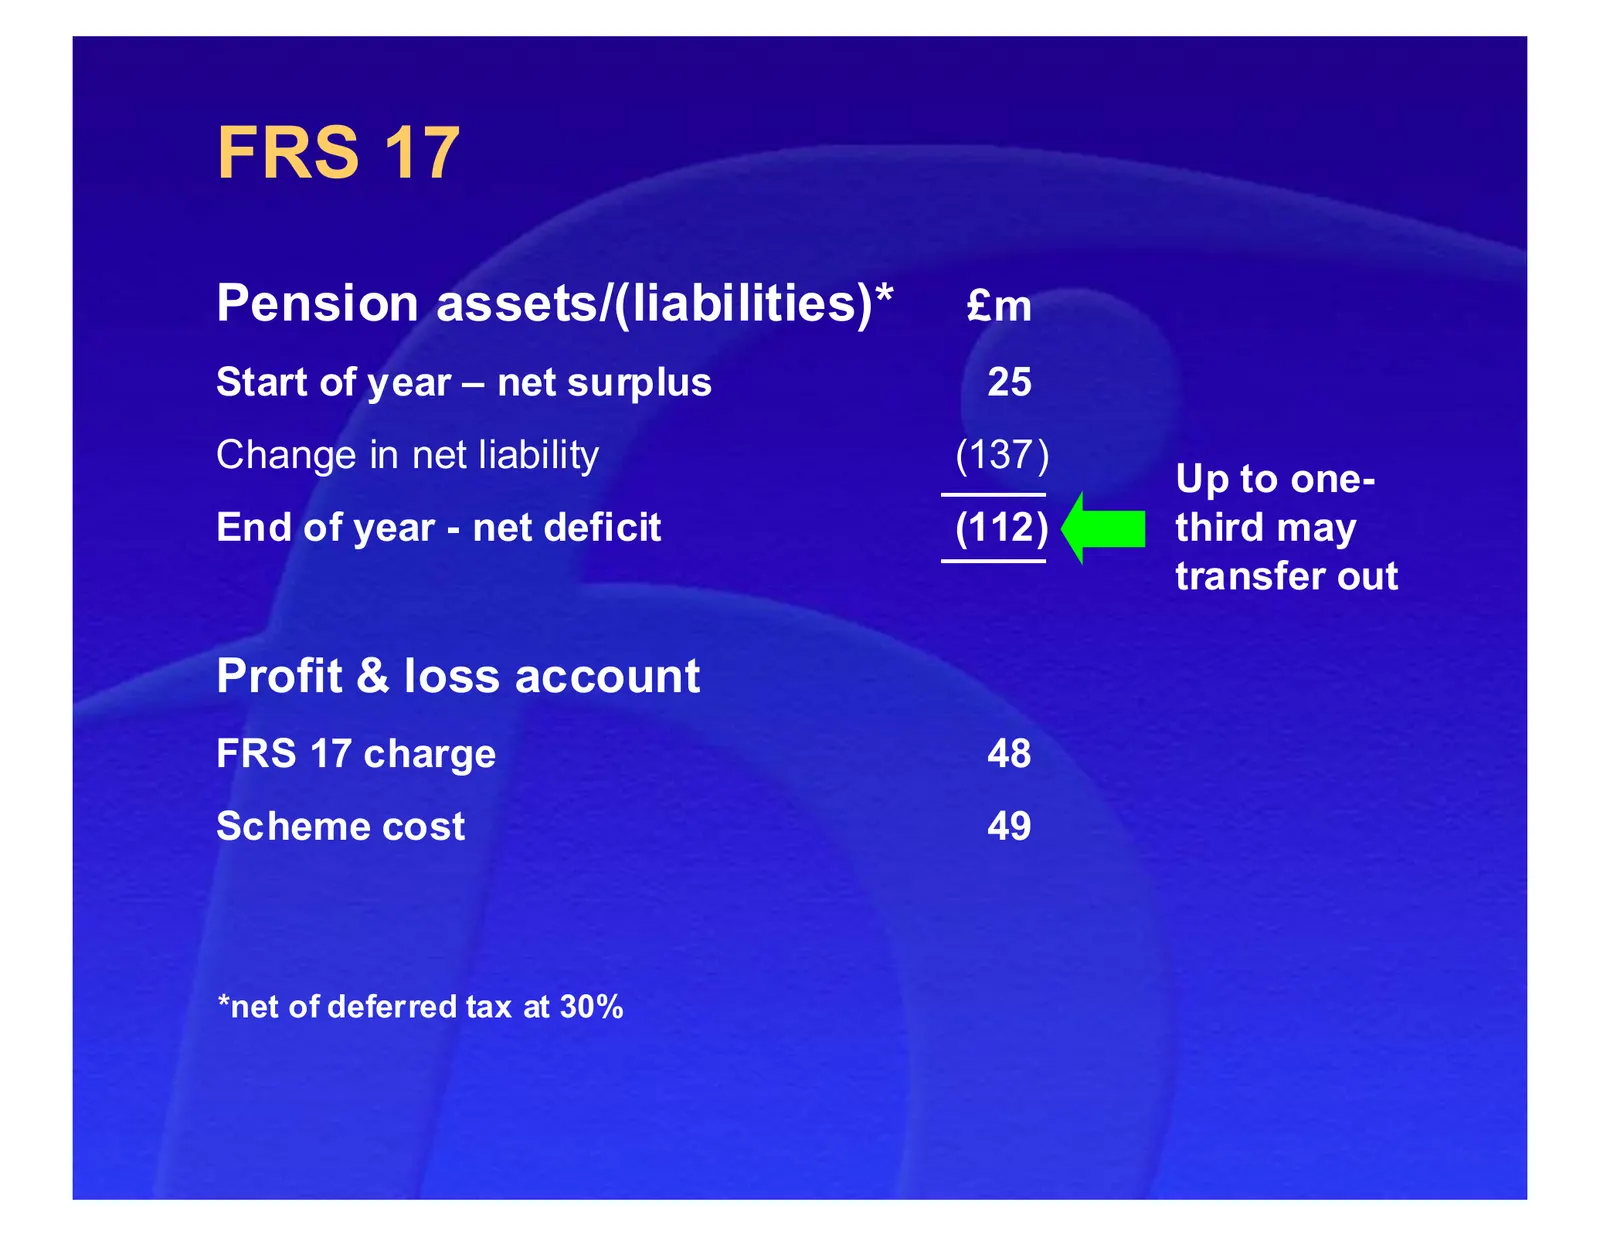
FRS 17 Pension assets/(liabilities)* £m Start of year – net surplus 25 Change in net liability (137) Up to one- End of year - net deficit (112) third may transfer out Profit & loss account FRS 17 charge 48 Scheme cost 49 *net of deferred tax at 30%
Slide 34: Quarterly reporting to include
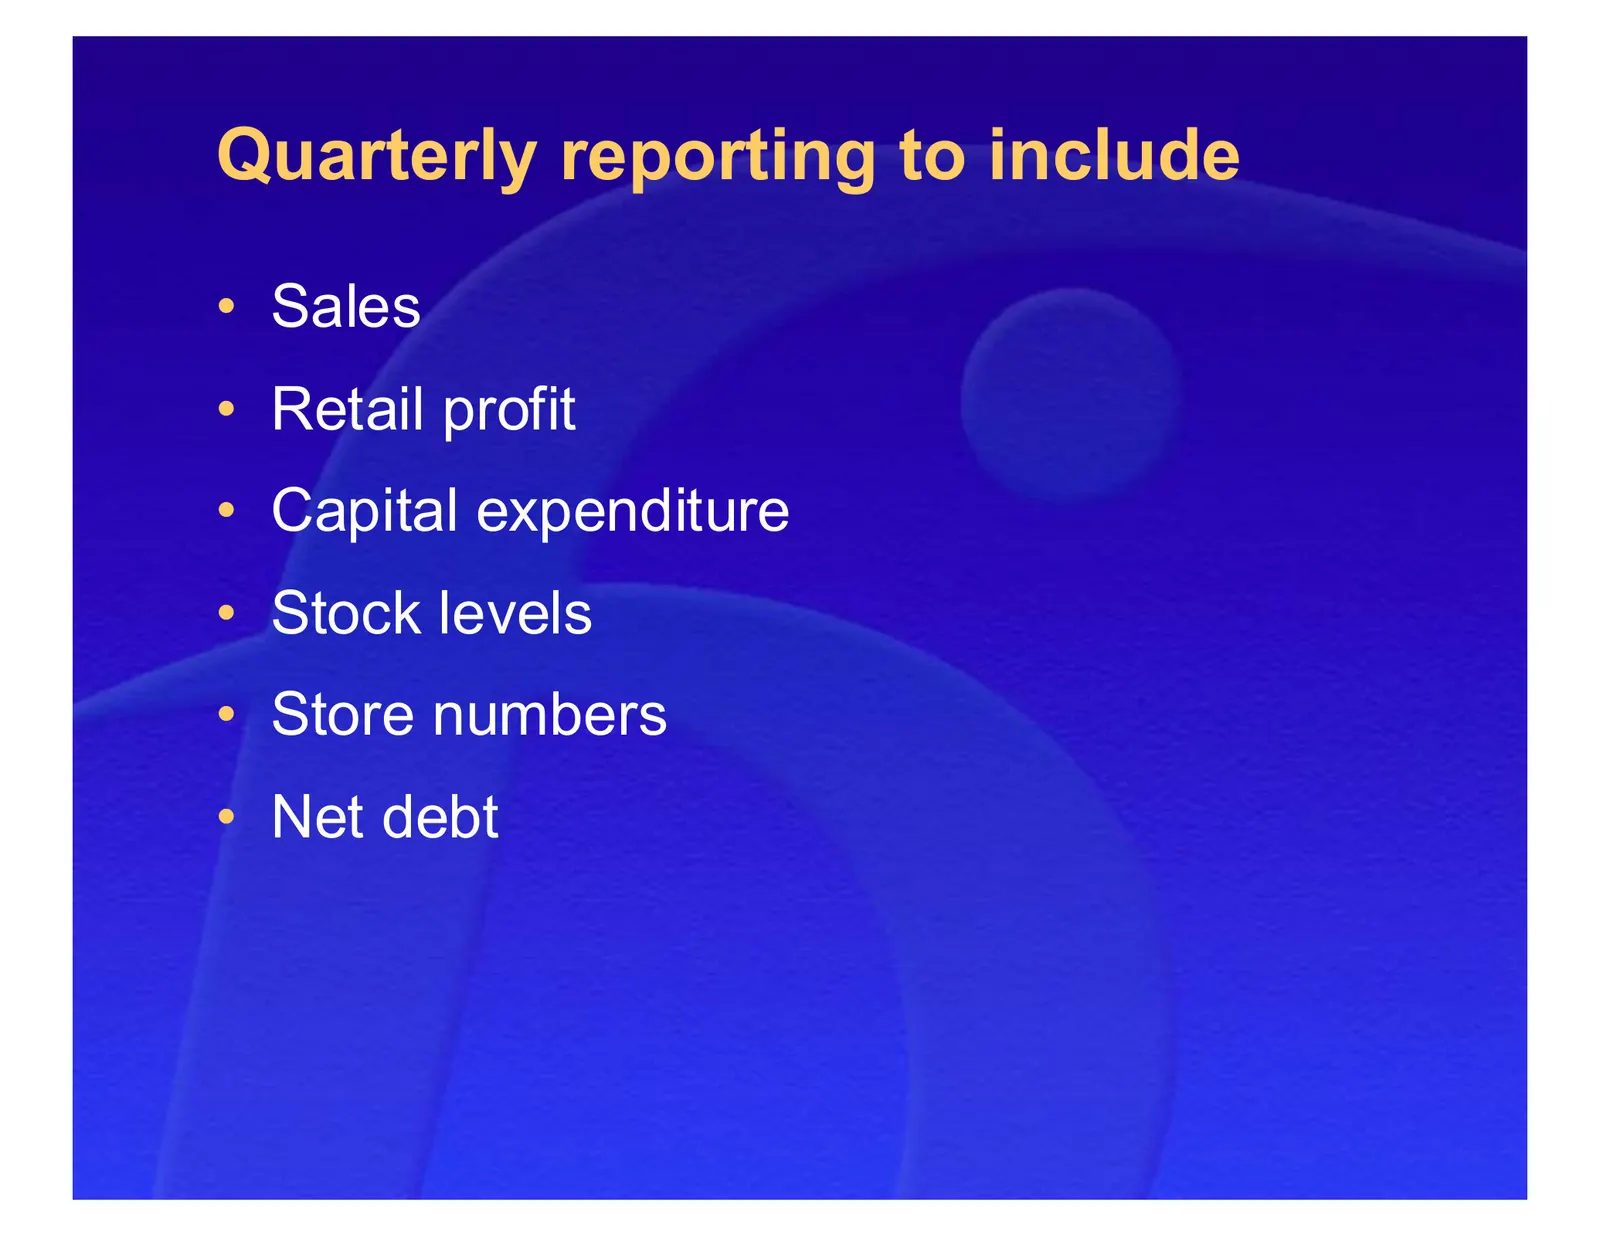
Quarterly reporting to include • Sales • Retail profit • Capital expenditure • Stock levels • Store numbers • Net debt
Slide 35: Summary
Summary • Solid business performance: good sales and profit growth • Focus maintained into second half – cost control – working capital management – capital efficiency • Strengthened balance sheet

Slide 36: Geoff Mulcahy, Chief Executive
Geoff Mulcahy Chief Executive
Slide 37: Strategic objective: European leader in our retail markets
Strategic objective European leader in our retail markets Why? Market leaders better placed to achieve: • Greatest profit • Strongest shareholder returns
Slide 38: Our vision
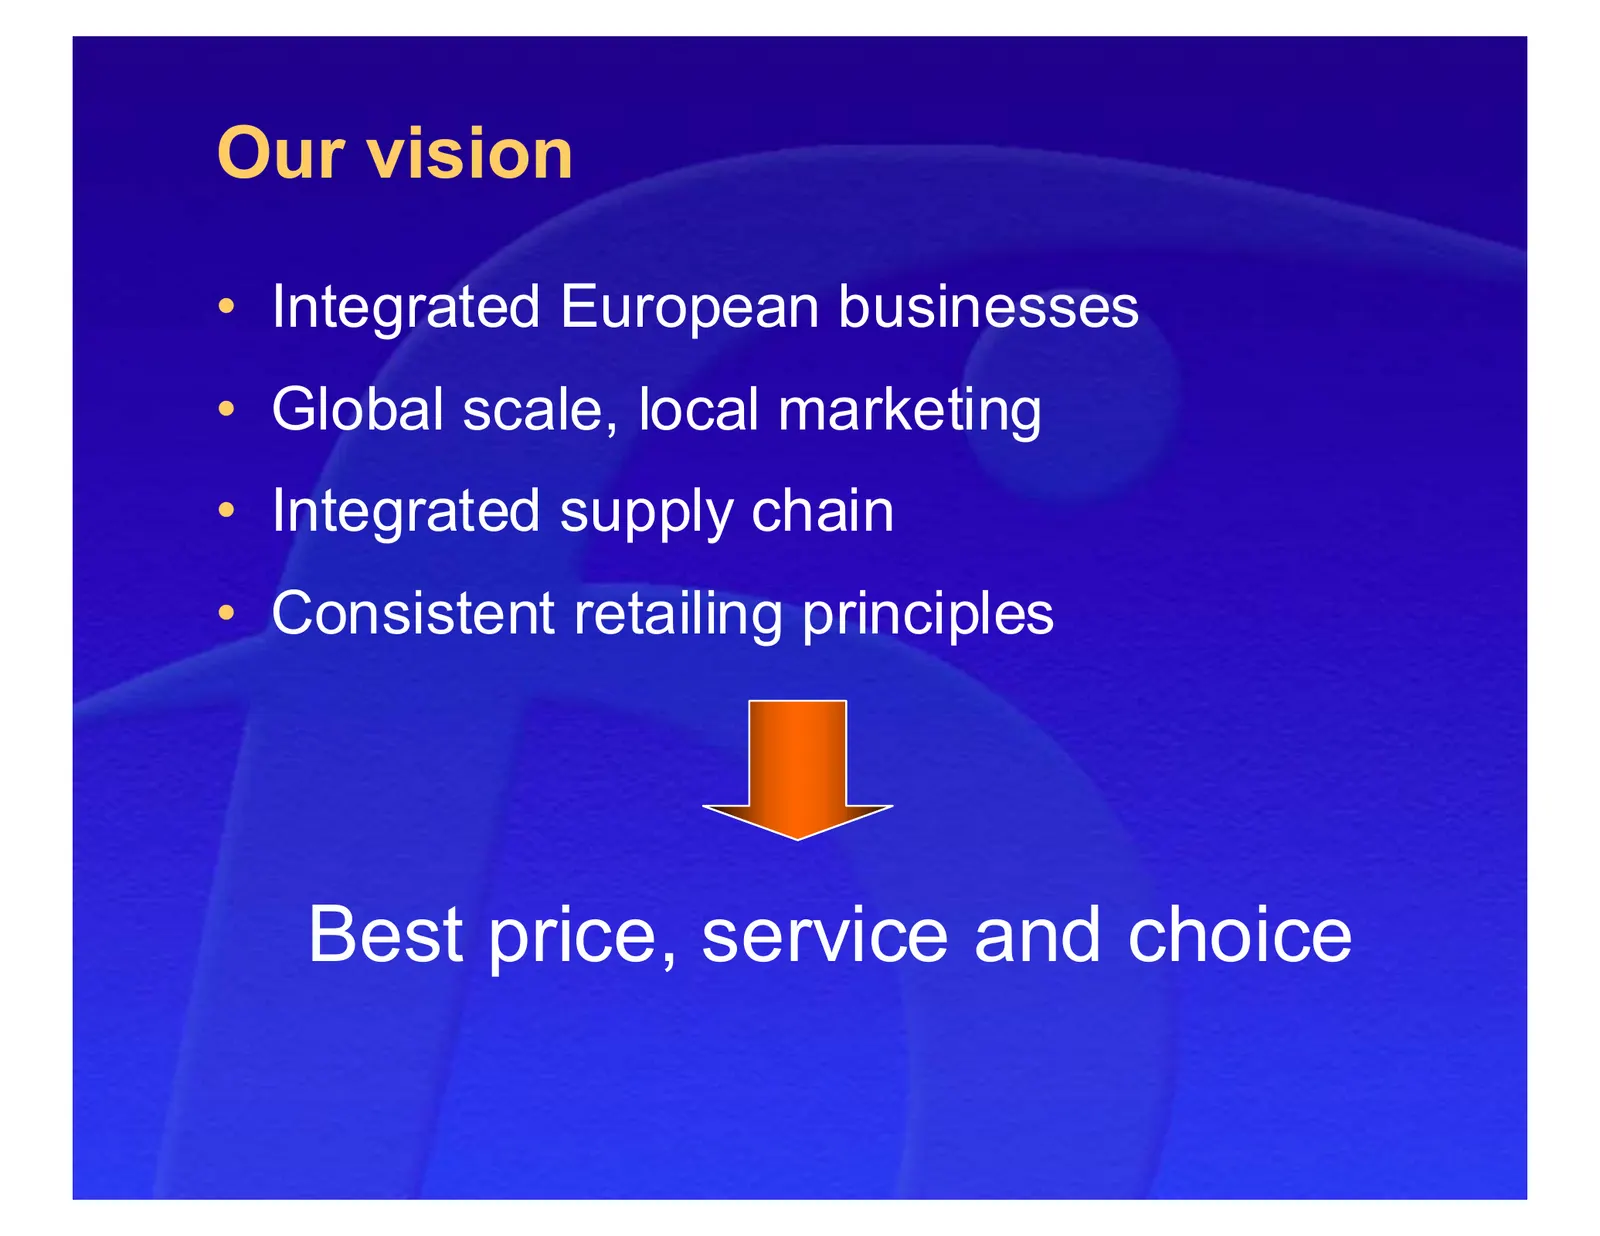
Our vision • Integrated European businesses • Global scale, local marketing • Integrated supply chain • Consistent retailing principles Best price, service and choice
Slide 39: Leading positions in Europe
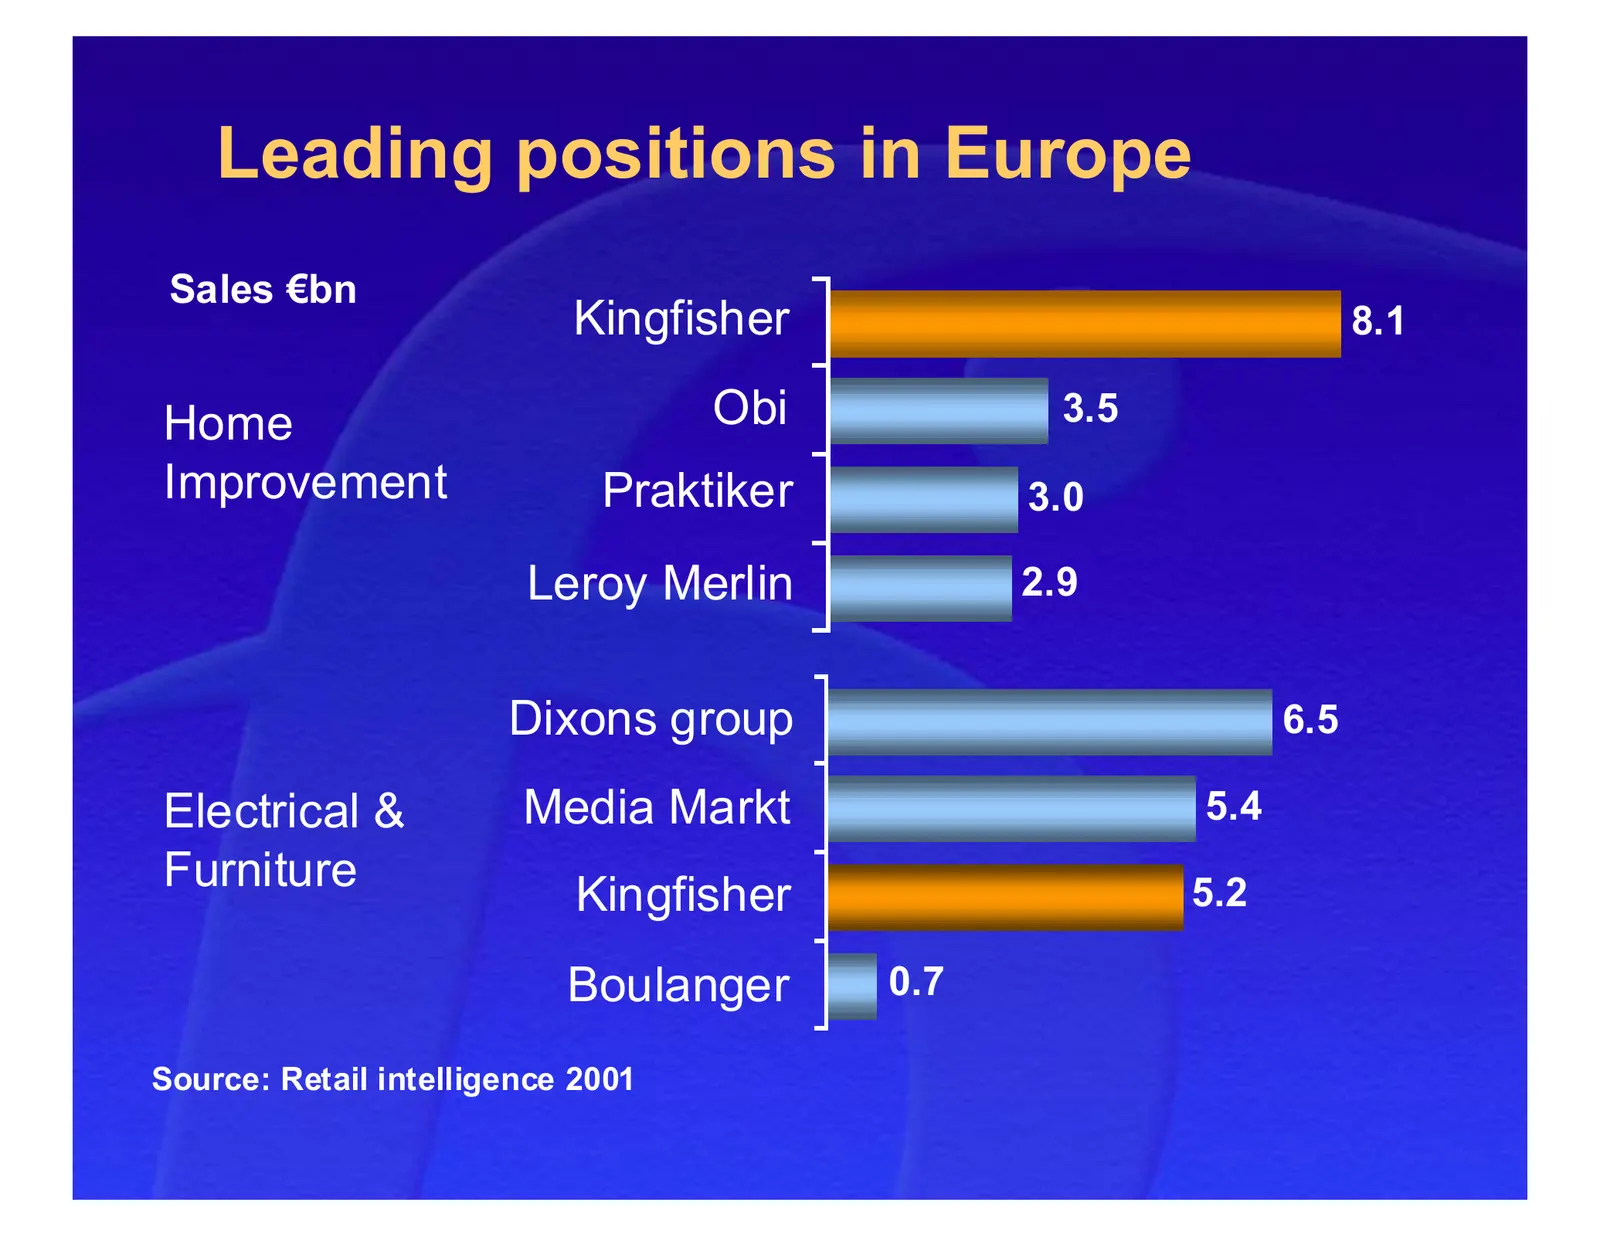
Leading positions in Europe Sales €bn Kingfisher 8.1 Home Obi 3.5 Improvement Praktiker 3.0 Leroy Merlin 2.9 Dixons group 6.5 Electrical & Media Markt 5.4 Furniture Kingfisher 5.2 Boulanger 0.7 Source: Retail intelligence 2001
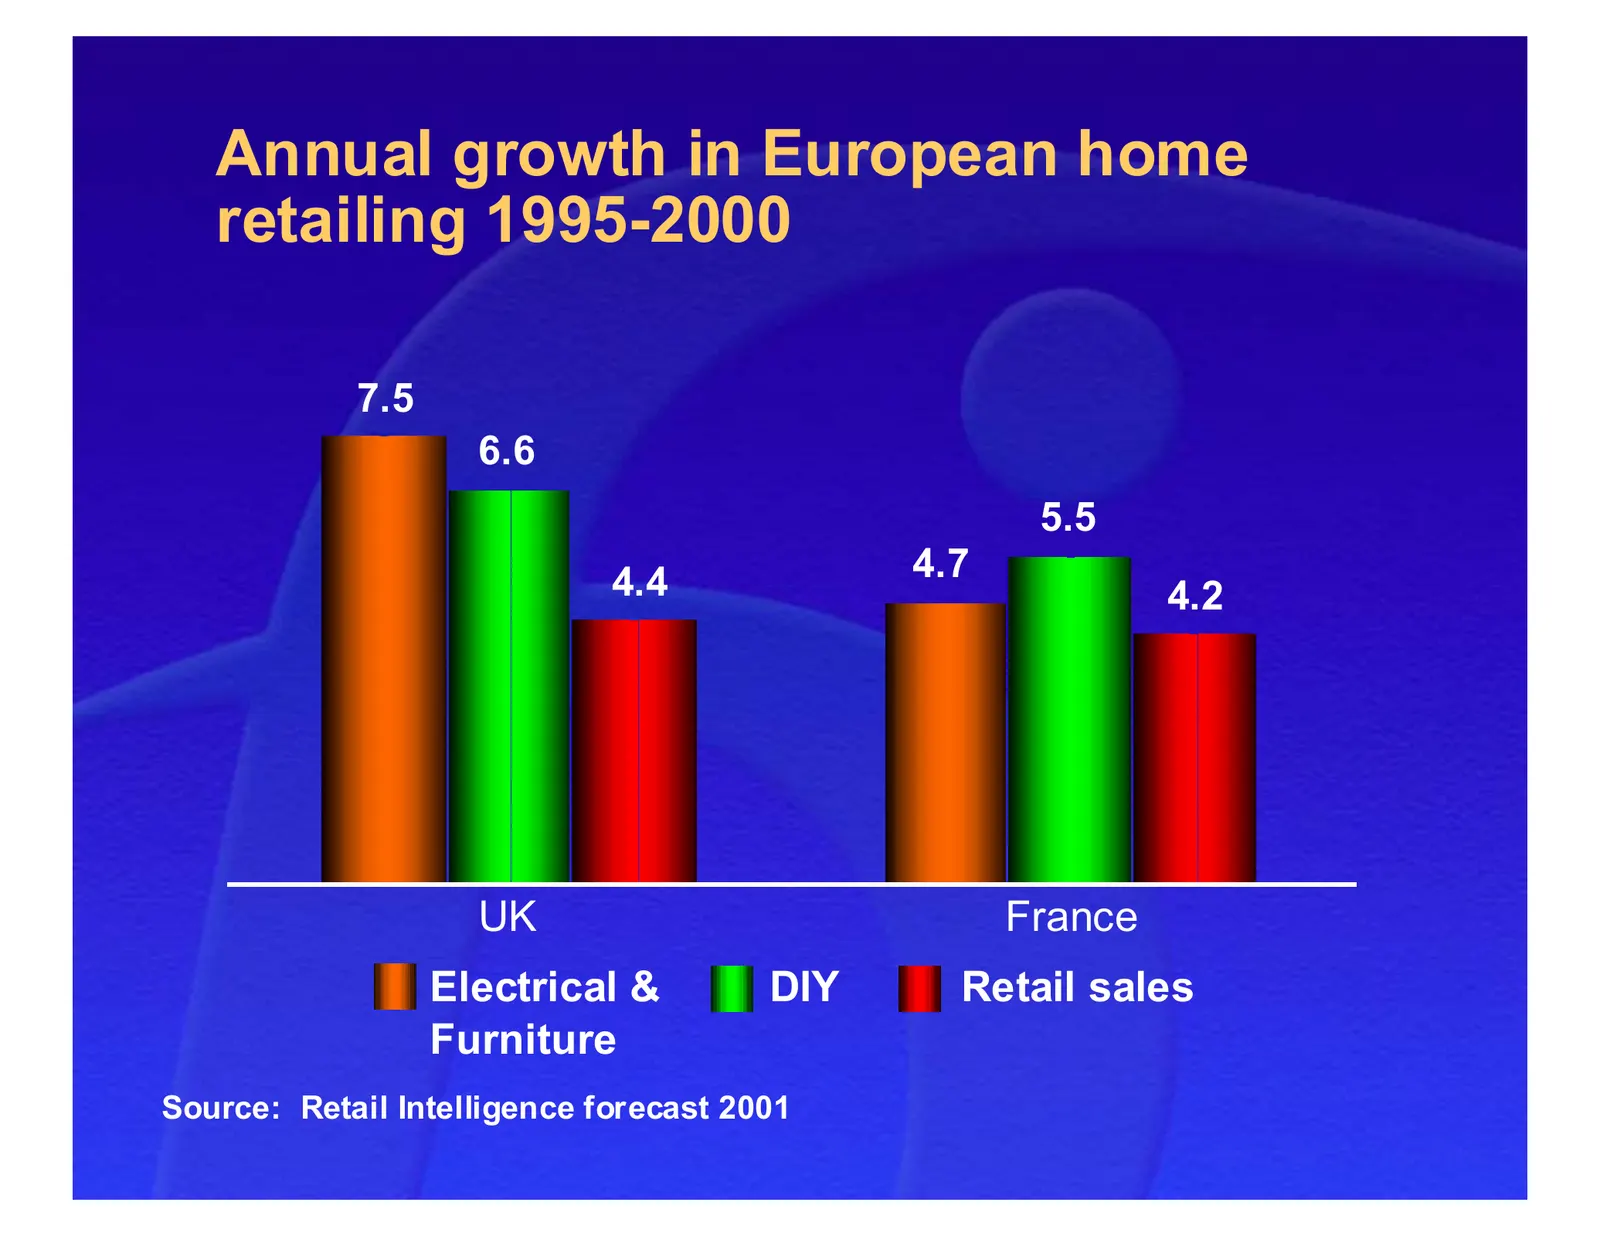
Slide 40: Annual growth in European home retailing 1995-2000
Annual growth in European home retailing 1995-2000 7.5 6.6 5.5 4.4 4.7 4.2 UK France Electrical & DIY Retail sales Furniture Source: Retail Intelligence forecast 2001
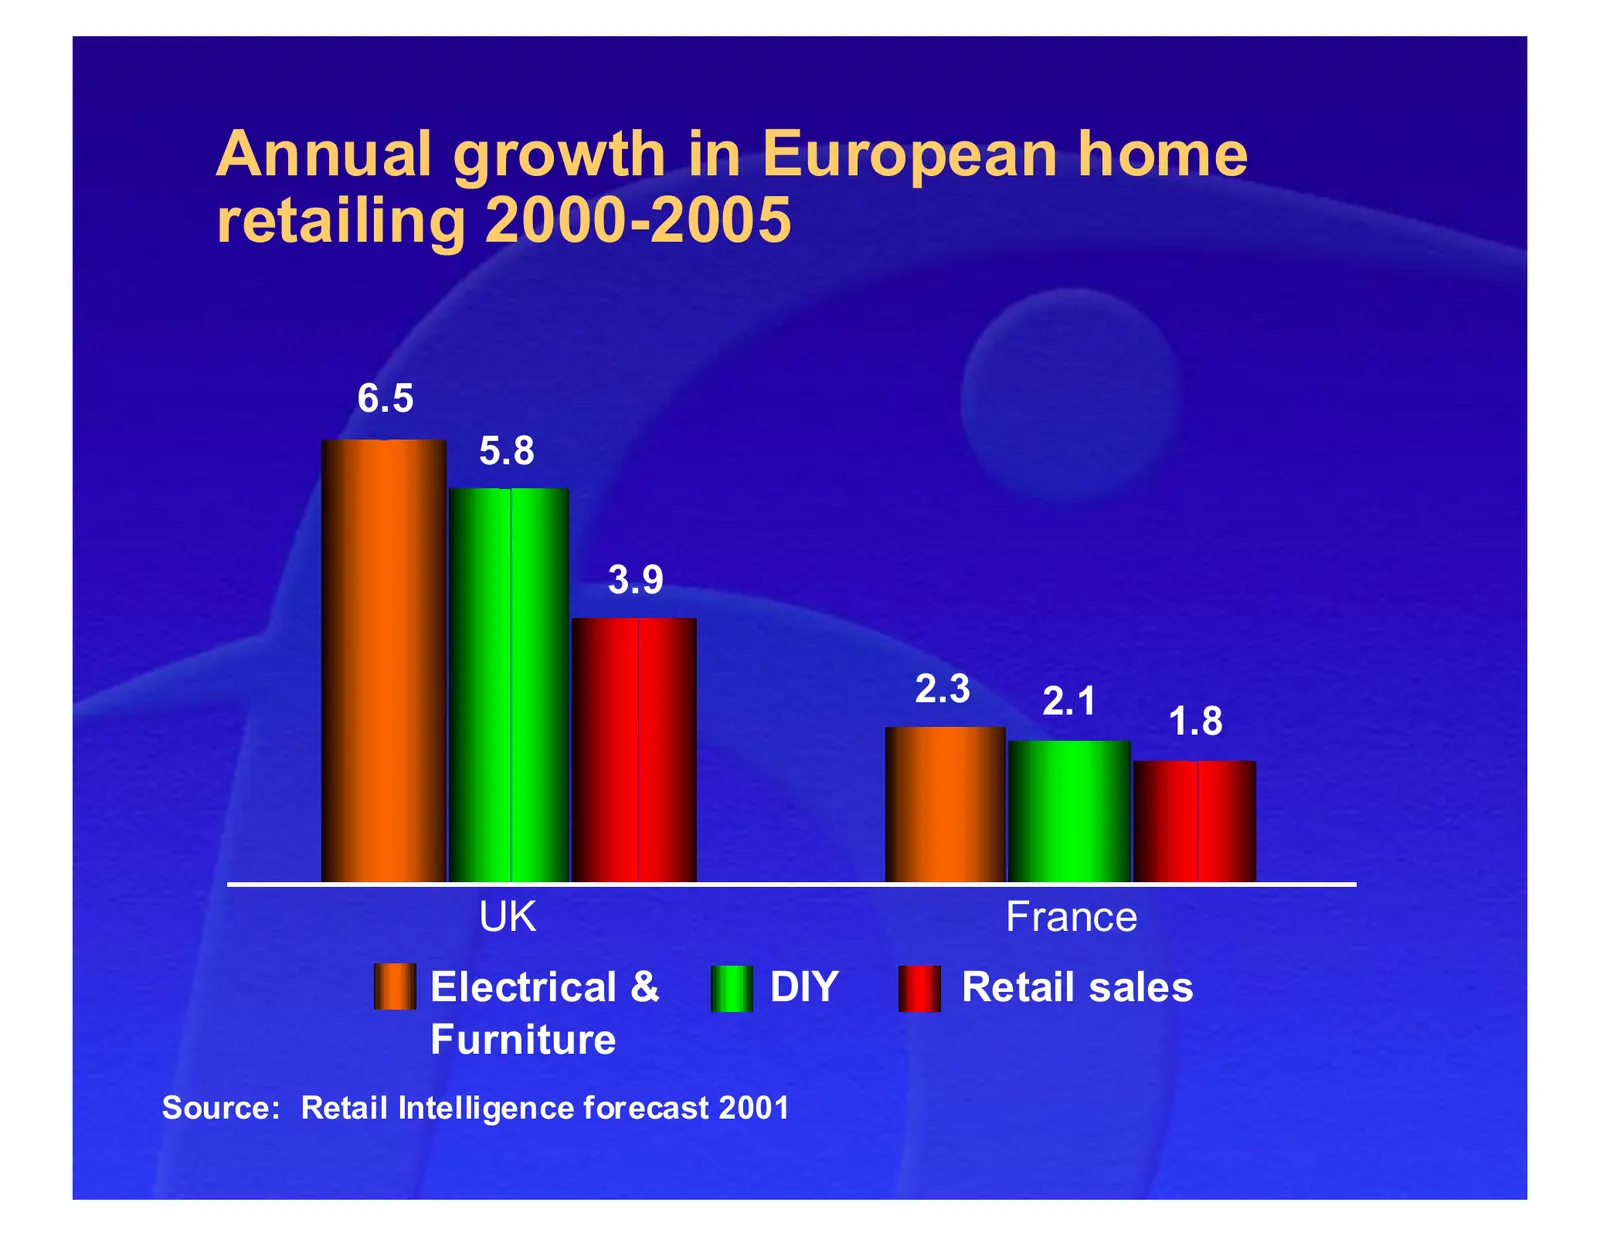
Slide 41: Annual growth in European home retailing 2000-2005
Annual growth in European home retailing 2000-2005 6.5 5.8 3.9 2.3 2.1 1.8 UK France Electrical & DIY Retail sales Furniture Source: Retail Intelligence forecast 2001
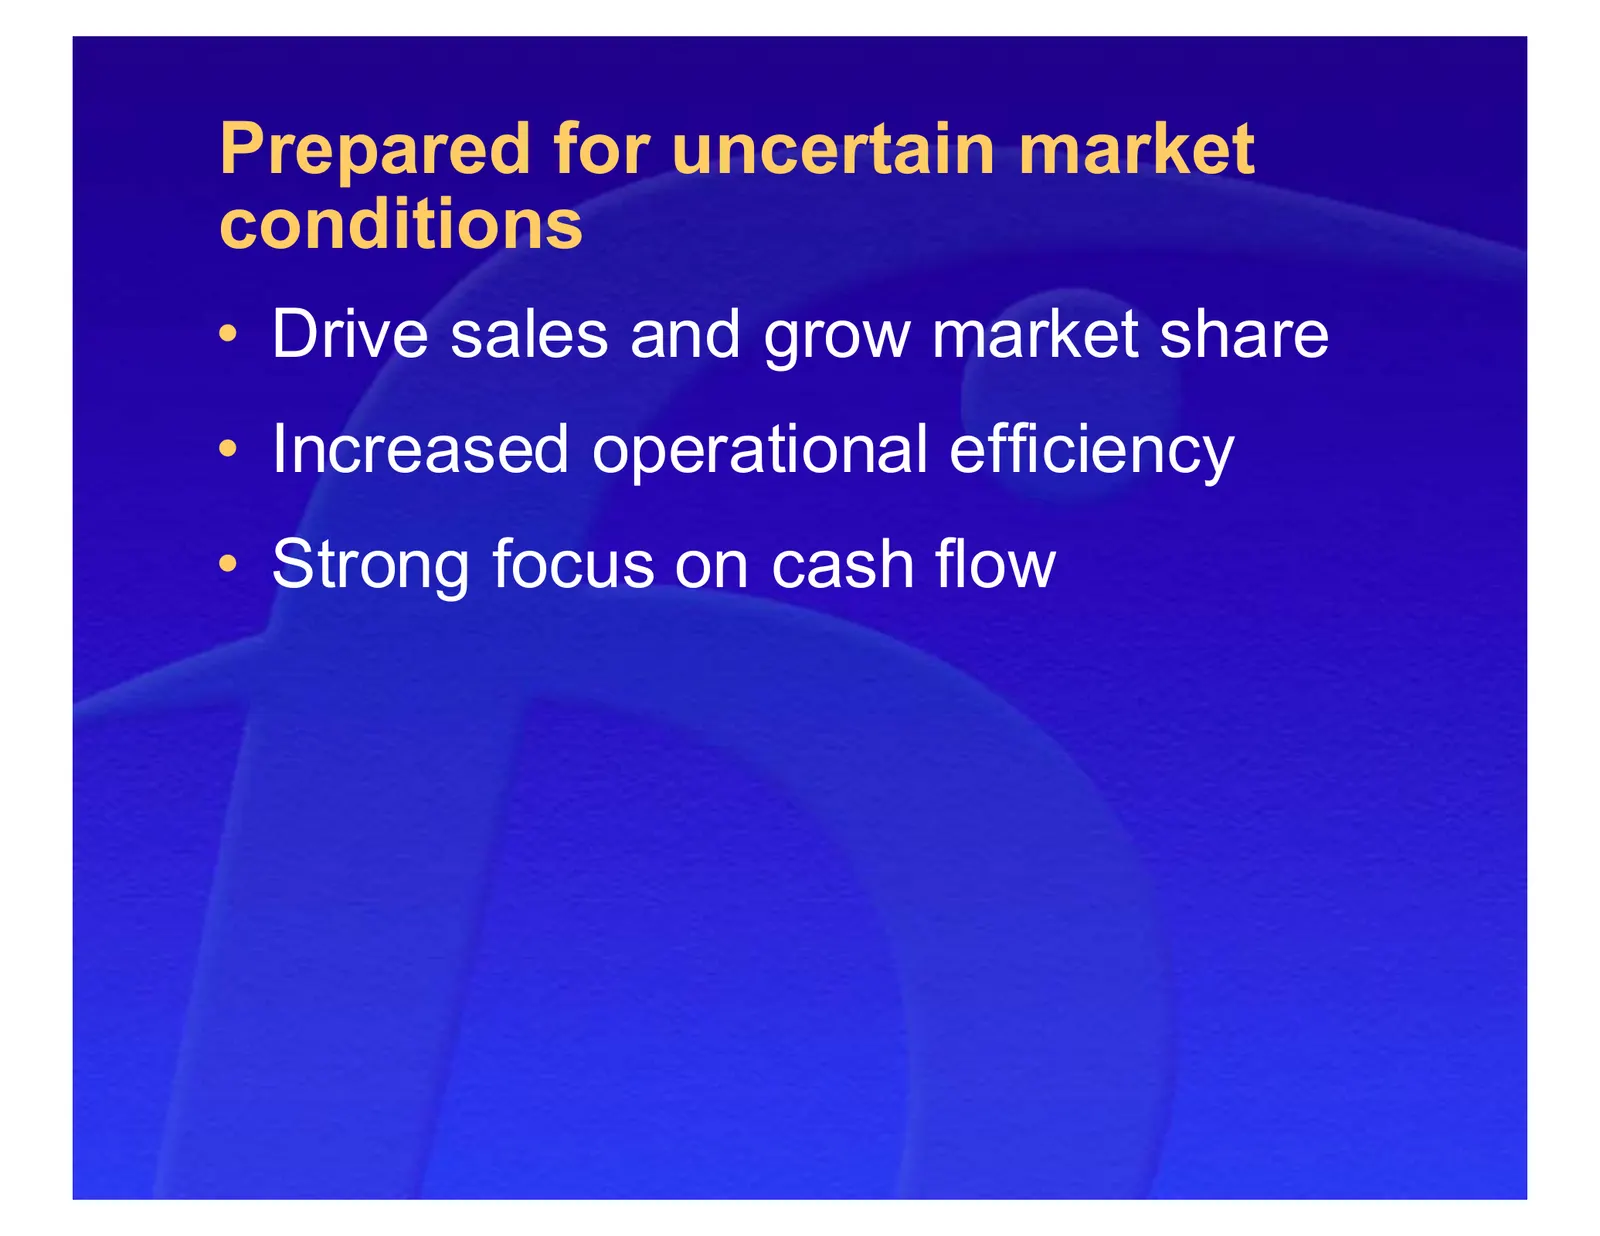
Slide 42: Prepared for uncertain market conditions
Prepared for uncertain market conditions • Drive sales and grow market share • Increased operational efficiency • Strong focus on cash flow
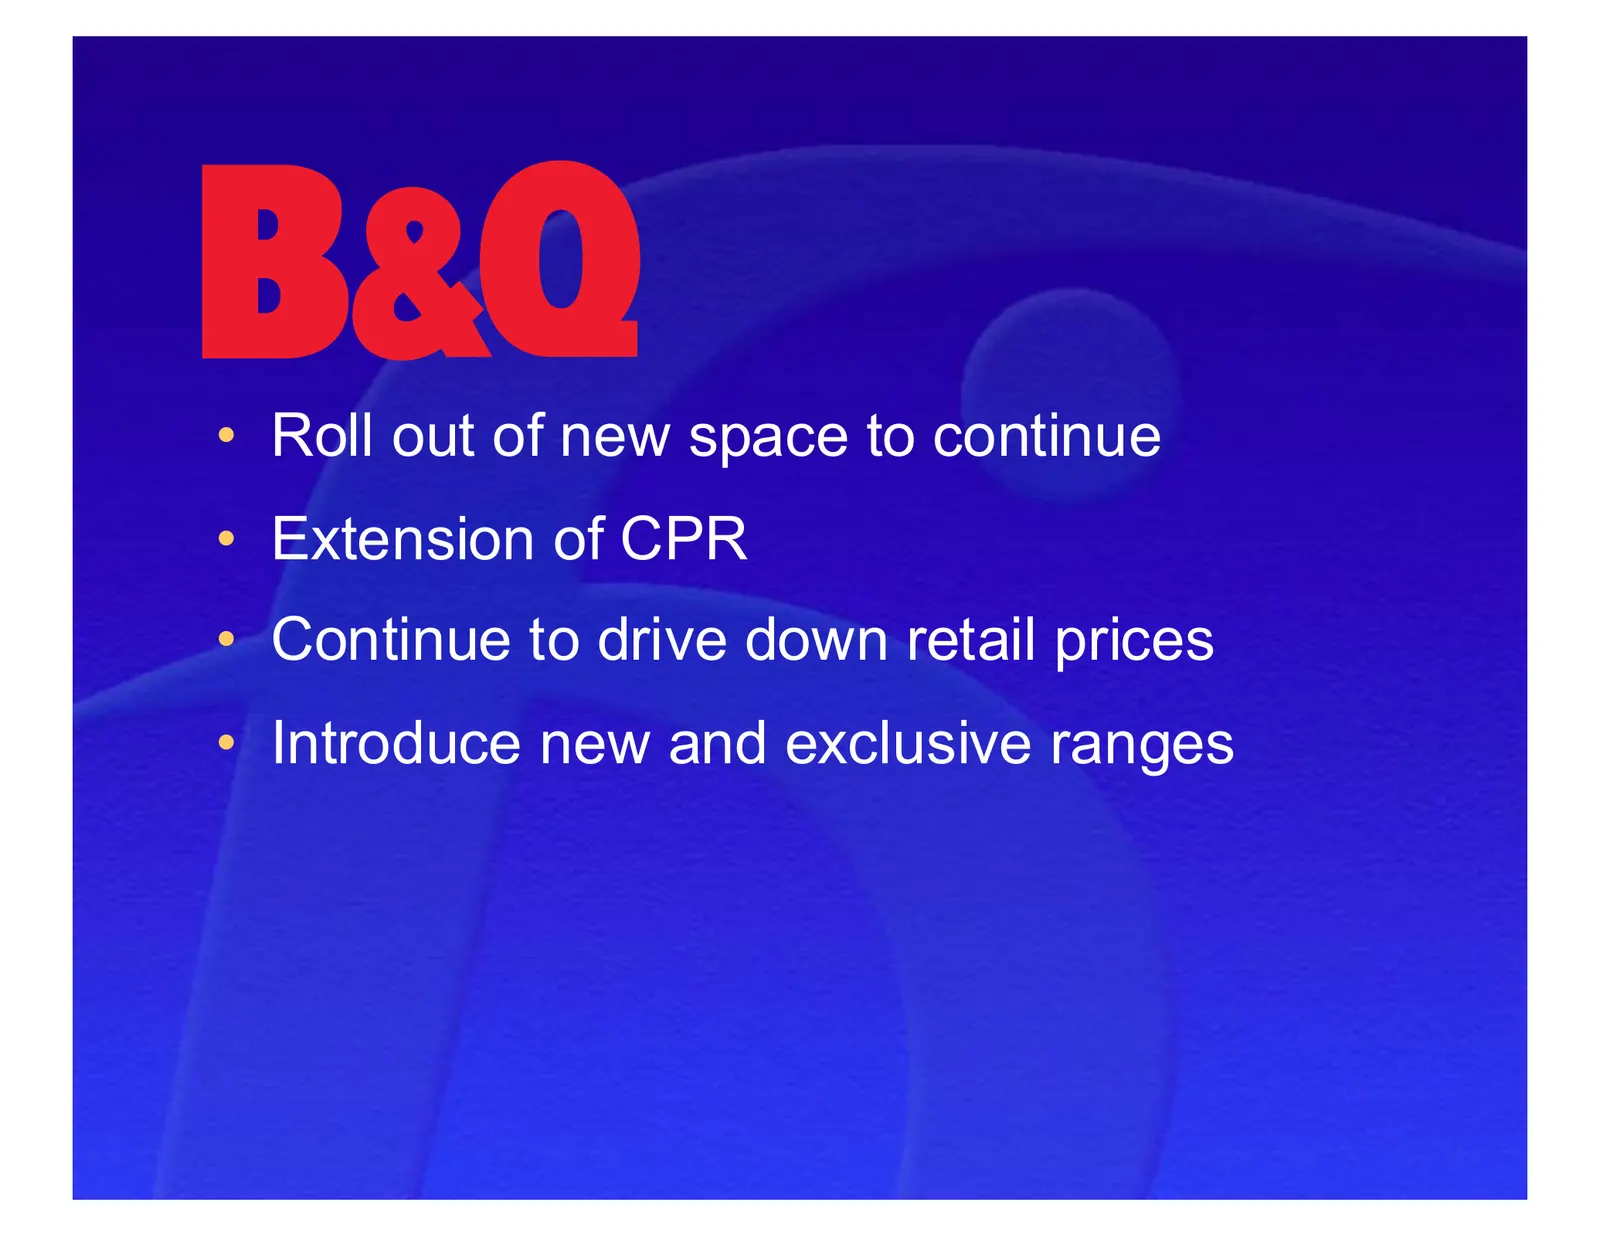
Slide 43: B&Q: roll out of new space and lower prices
• Roll out of new space to continue • Extension of CPR • Continue to drive down retail prices • Introduce new and exclusive ranges
Slide 44: Castorama/B&Q franchise buy back and refurbishment
• Buy back of franchises • Refurbishment of owned and franchised stores • More ranges bought centrally
Slide 45: Comet: destination stores and Project Pulse
• Roll out of destination stores • Refresh existing stores • Continue the successful Project Pulse
Slide 46: Darty: high tech categories and cost reduction
• Faster growth, high tech categories • Cost reduction programme • Store opening, refurbishment and extension programme
Slide 47: Roll out Brico Dépôt stores
• Roll out Brico Dépôt stores • Target of 100 stores in France
Slide 48: Castorama: potential still to be tapped
potential still to be tapped • Fantastic brand • Enormous opportunity • Work continues to reinvigorate the brand
Slide 49: Build on benefits of turnaround plan
Build on benefits of turnaround plan • Improved cost control • Range standardisation • Centralised buying and distribution
Slide 50: In conclusion
In conclusion • Last year was a year of delivery • Agenda for growth unchanged • Clear objectives for each business for coming year
Source: Internet Archive copy of kingfisher.com
More decks from Kingfisher PLC
 H1 2026/27 Earnings Presentation33 slides · Sep 22, 2026
 FY2025/26 Earnings Presentation39 slides · Mar 24, 2026
 H1 2025/26 Earnings Presentation38 slides · Sep 23, 2025
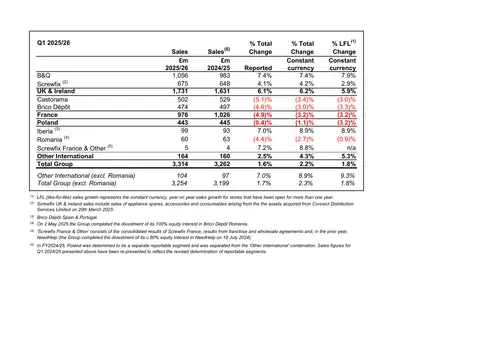 H1 2025/26 Earnings Presentation6 slides · September 2025
 FY2024/25 Earnings Presentation35 slides · Apr 8, 2025
 FY2024/25 Earnings Presentation40 slides · Mar 25, 2025