Inventurus Knowledge Solutions Limited · NSE:IKS
Inventurus Knowledge Solutions — IKS Health — Q1 FY27 Earnings Presentation
17 slides from Inventurus Knowledge Solutions's earnings presentation, 2026
Slide 1: IKS Health Q1 FY27 Investor Presentation
IKS Health Q1 FY 27 Investor Presentation 1
Slide 2: Disclaimer
Disclaimer This presentation may include opinions and assumptions about future performance which could be considered as forward-looking statements. Forward-looking statements intrinsically cover several risks and uncertainties, which may lead to a material difference between actual results and the s
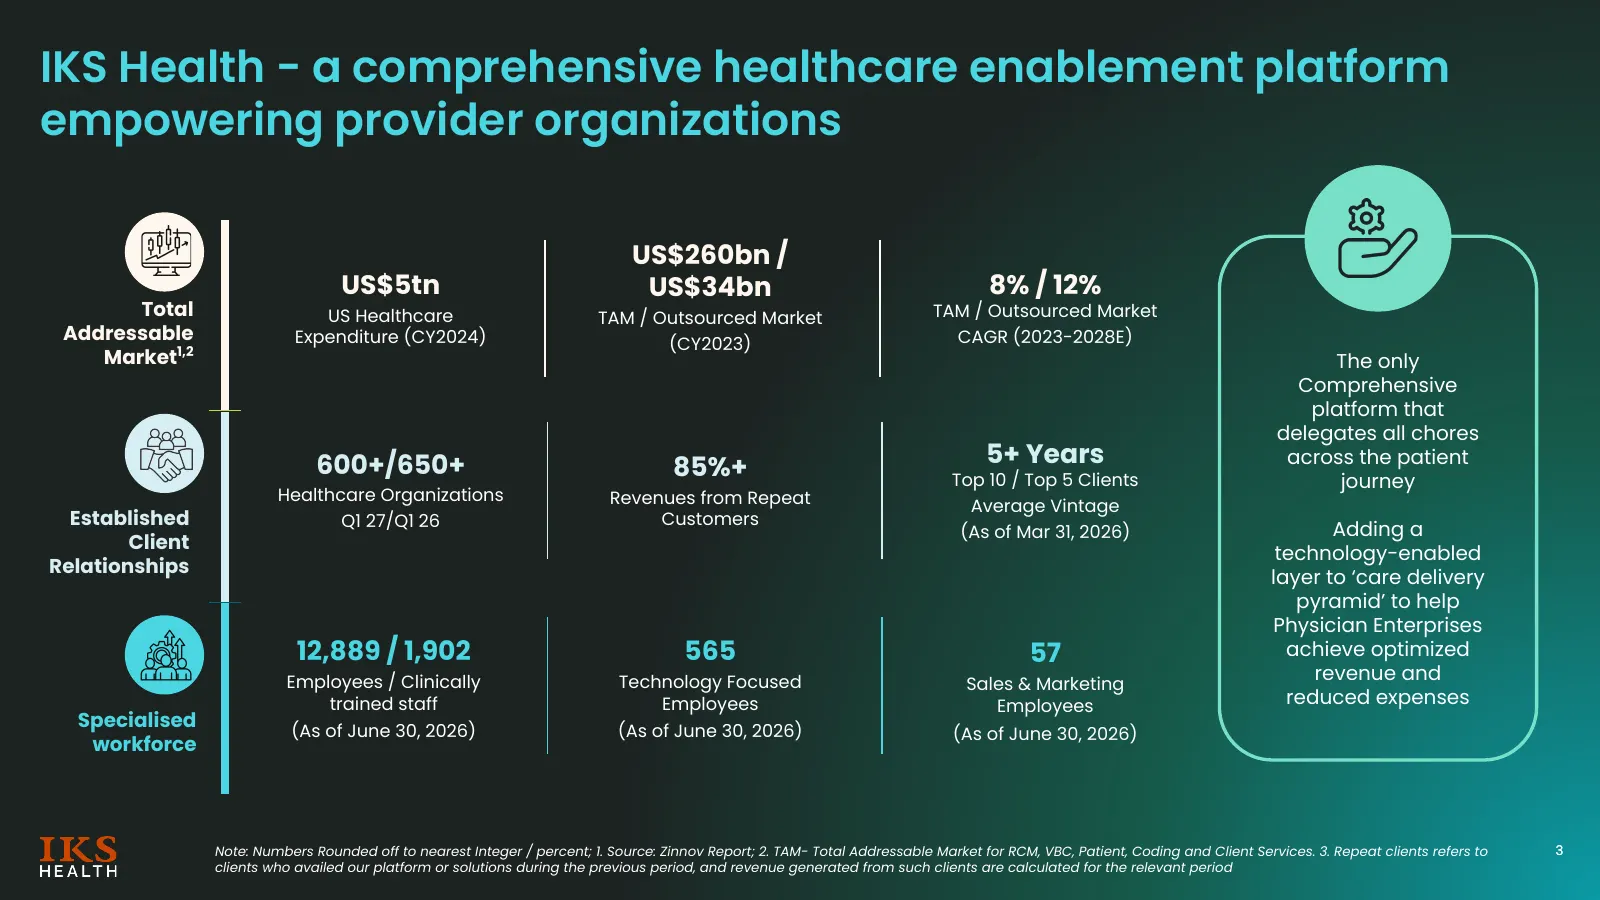
Slide 3: IKS Health - a comprehensive healthcare enablement platform empowering provider organizations
IKS Health - a comprehensive healthcare enablement platform empowering provider organizations US$260bn / US$5tn US$34bn 8% / 12% Total US Healthcare TAM / Outsourced Market TAM / Outsourced Market Addressable Expenditure (CY2024) (CY2023) CAGR (2023-2028E) Market1,2 The only Comprehensive platform t
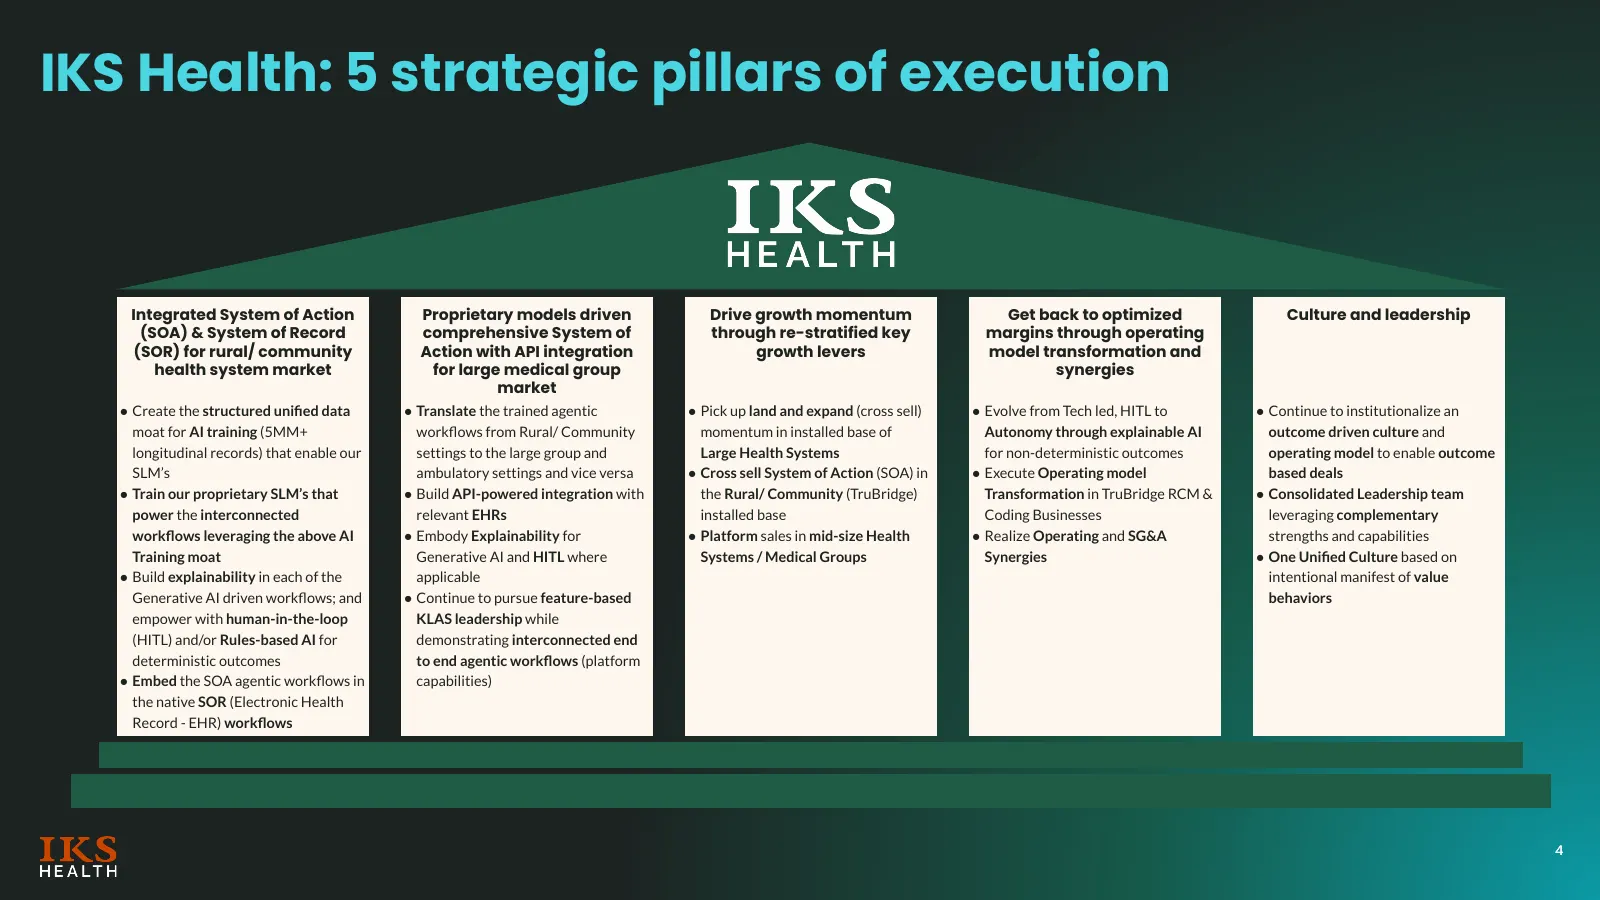
Slide 4: IKS Health: 5 strategic pillars of execution
IKS Health: 5 strategic pillars of execution Integrated System of Action Proprietary models driven Drive growth momentum Get back to optimized Culture and leadership (SOA) & System of Record comprehensive System of through re-stratified key margins through operating (SOR) for rural/ community Action
Slide 5: Awards and Recognition
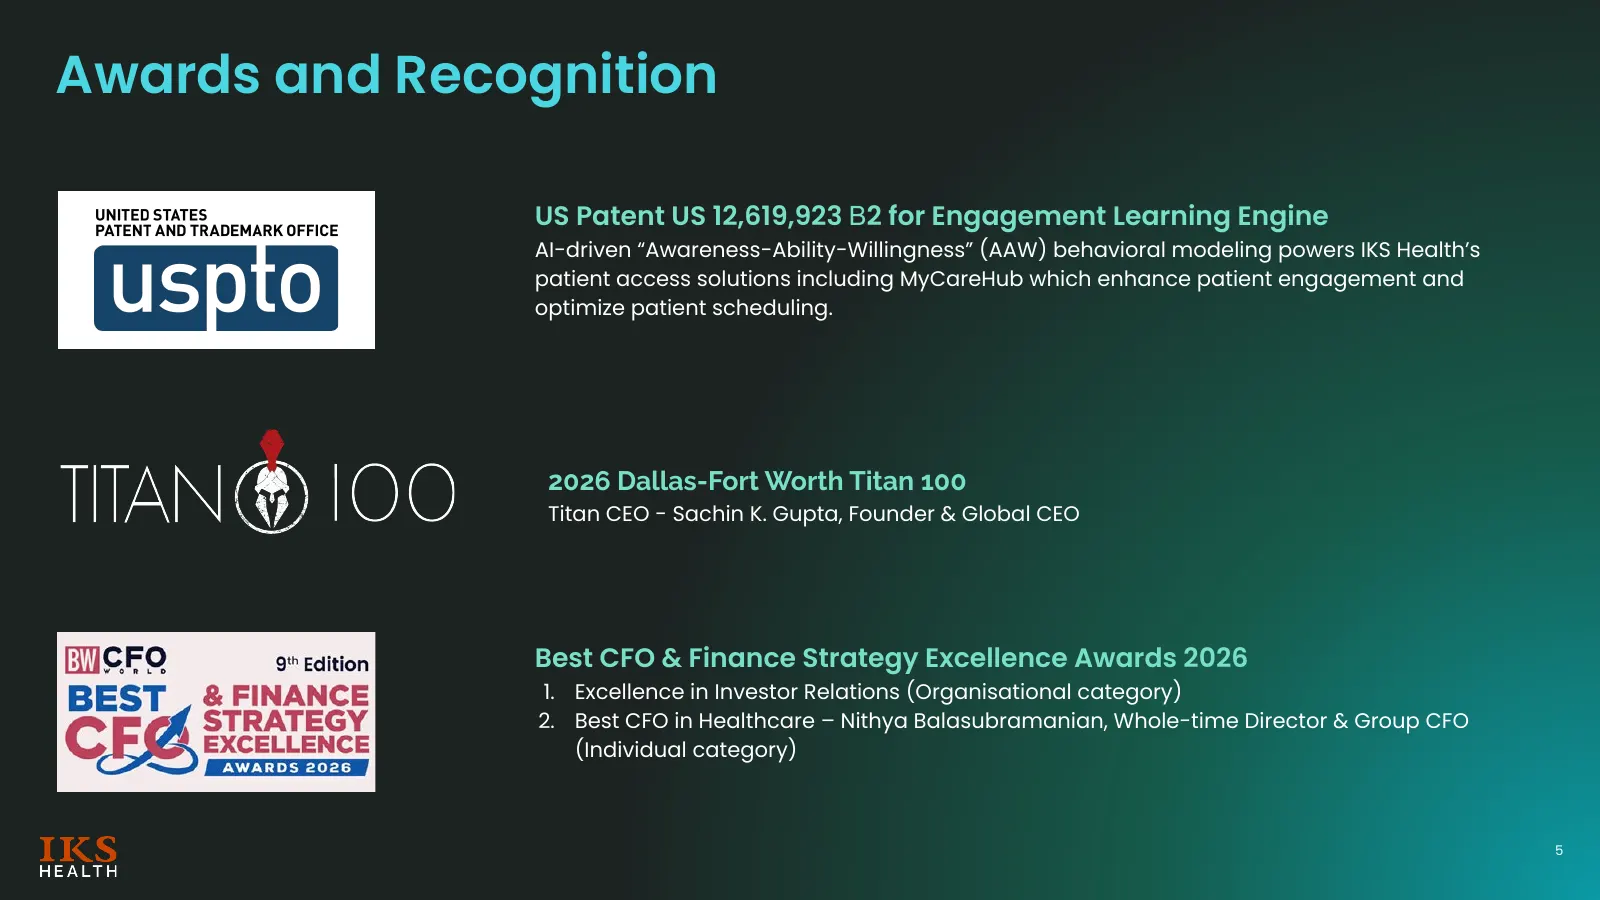
Awards and Recognition US Patent US 12,619,923 В2 for Engagement Learning Engine AI-driven “Awareness-Ability-Willingness” (AAW) behavioral modeling powers IKS Health’s patient access solutions including MyCareHub which enhance patient engagement and optimize patient scheduling. 2026 Dallas-Fort Wor
Slide 6: Awards and Recognition
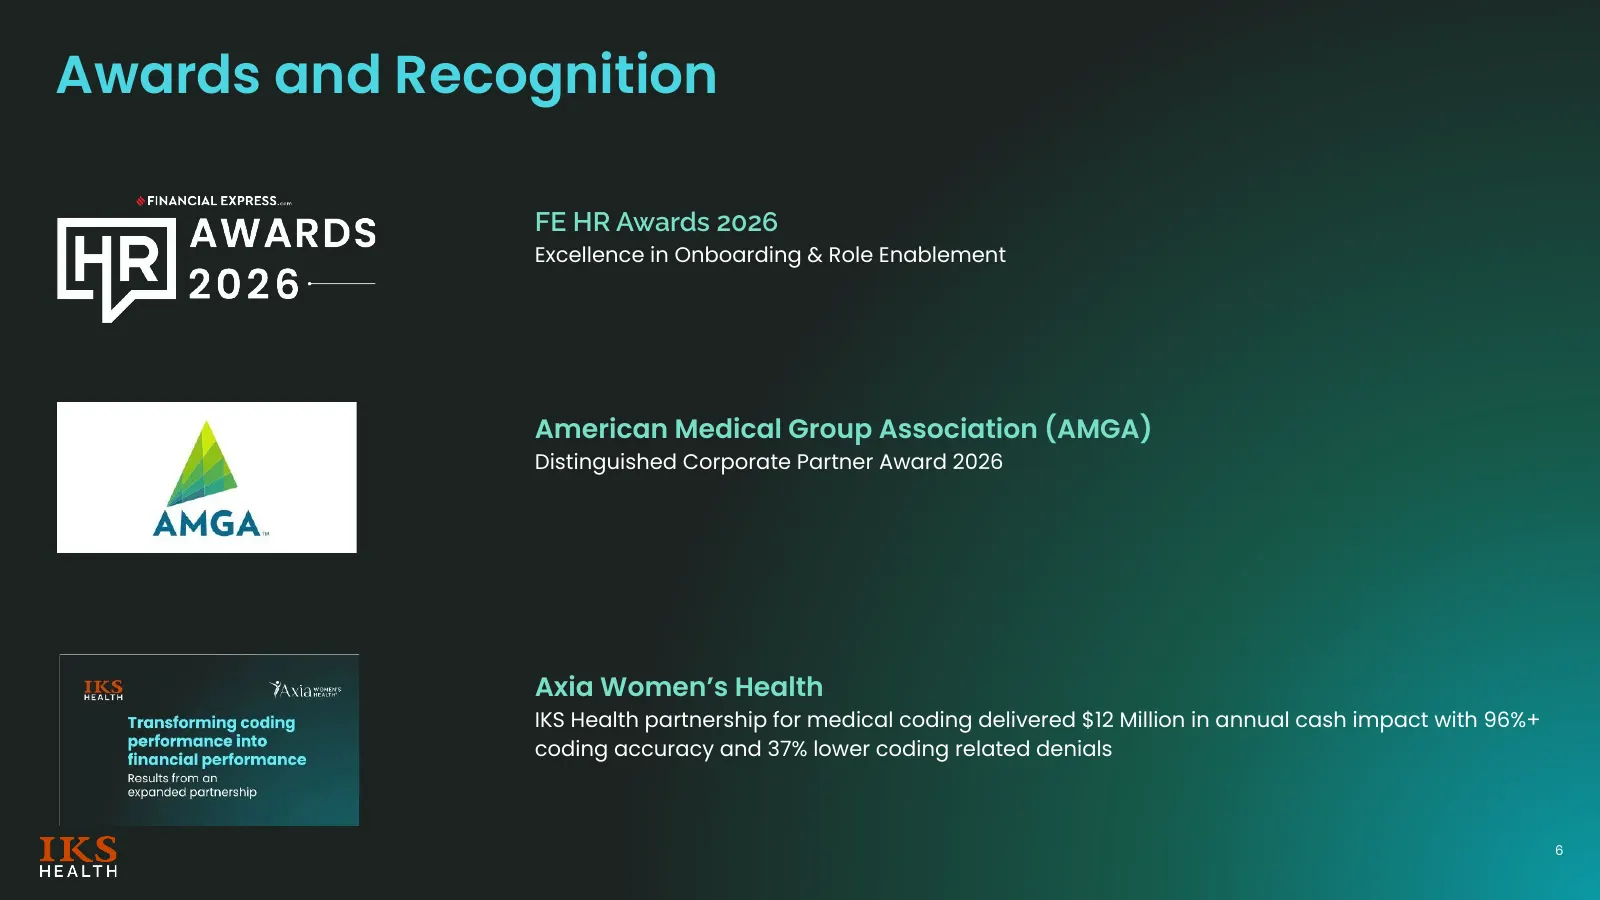
Awards and Recognition FE HR Awards 2026 Excellence in Onboarding & Role Enablement American Medical Group Association (AMGA) Distinguished Corporate Partner Award 2026 Axia Women’s Health IKS Health partnership for medical coding delivered $12 Million in annual cash impact with 96%+ coding accuracy
Slide 7: IKS Health enables care transformation across the patient journey
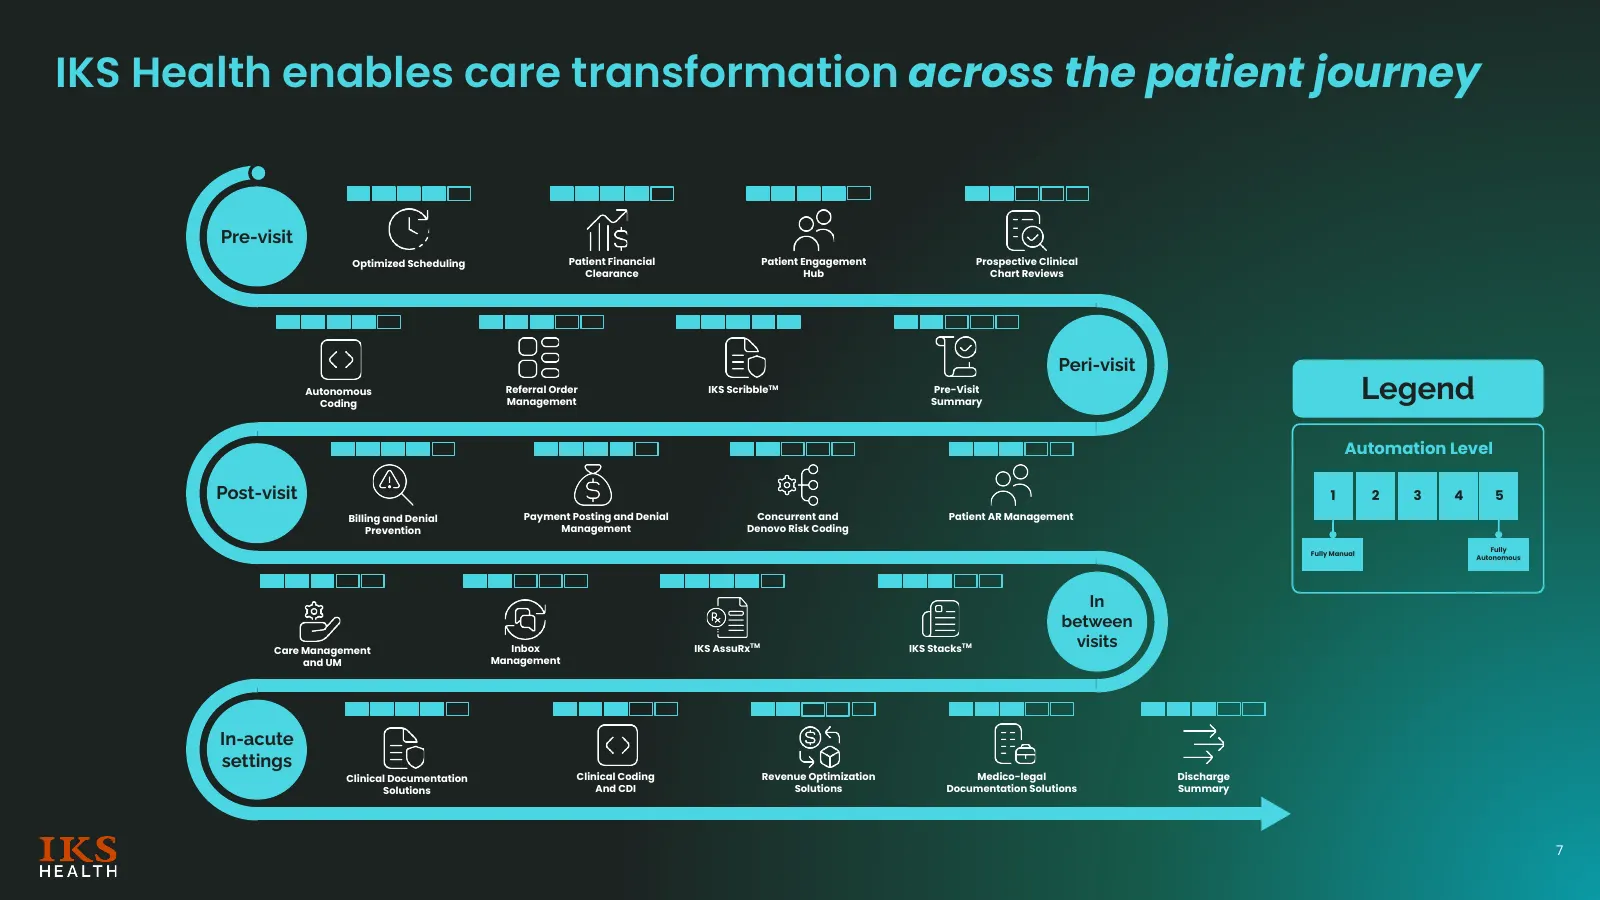
IKS Health enables care transformation across the patient journey Pre-visit Optimized Scheduling Patient Financial Patient Engagement Prospective Clinical Clearance Hub Chart Reviews Peri-visit Autonomous Coding Referral Order Management IKS ScribbleTM Pre-Visit Summary Legend Automation Level Post-
Slide 8: Q1 - Strong growth while delivering continuous margin expansion
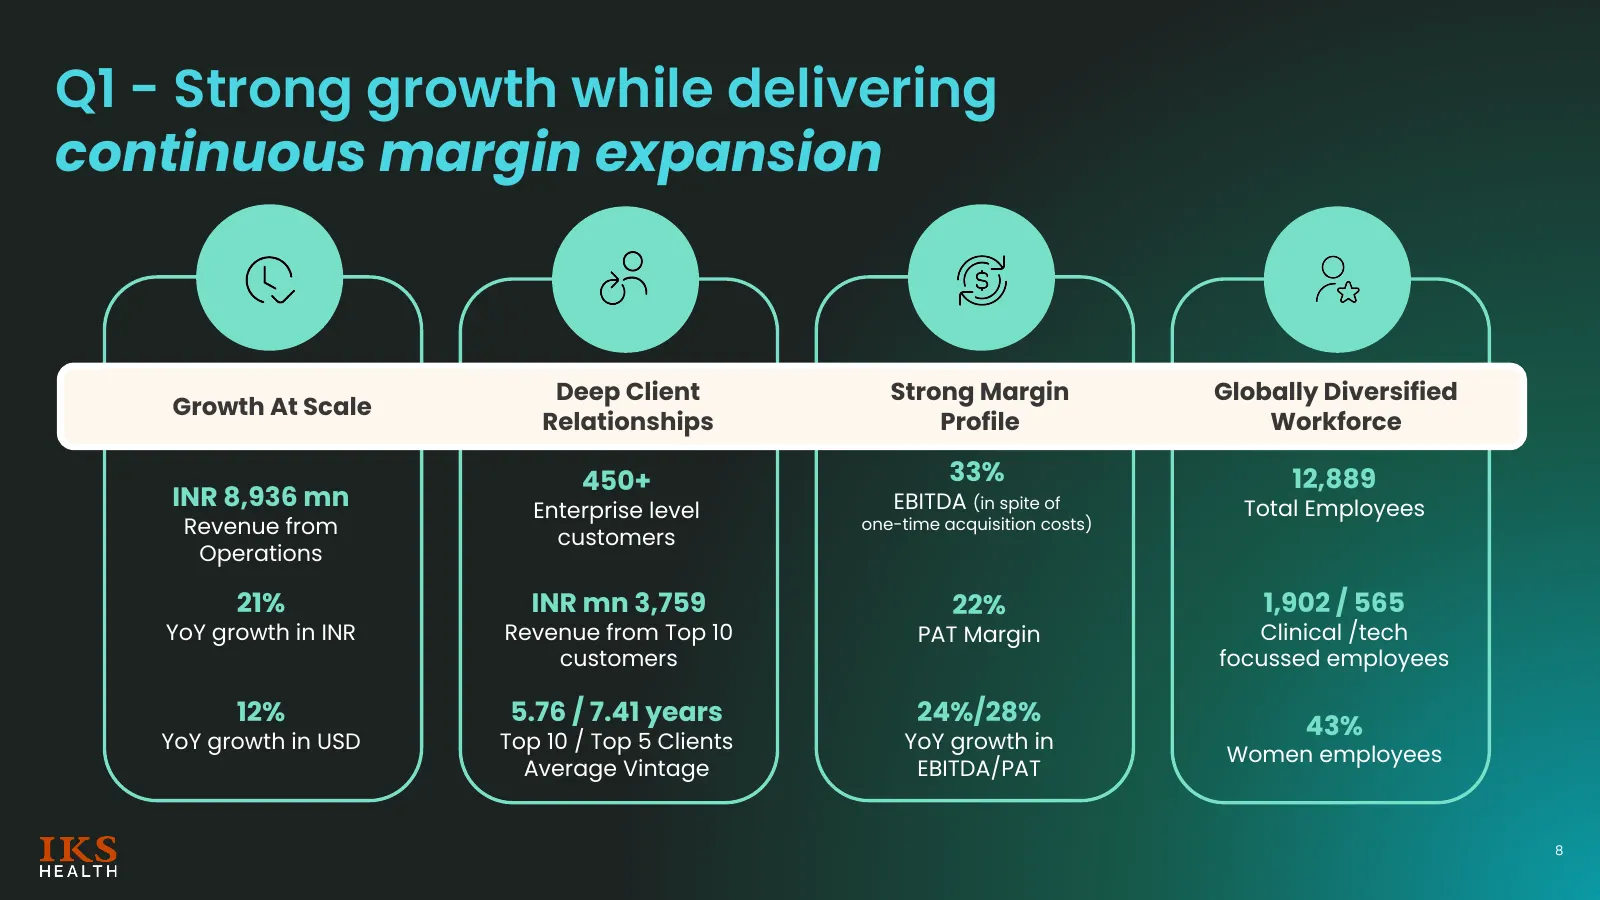
Q1 - Strong growth while delivering continuous margin expansion Deep Client Strong Margin Globally Diversified Growth At Scale Relationships Profile Workforce 450+ 33% 12,889 INR 8,936 mn Enterprise level EBITDA (in spite of Total Employees Revenue from customers one-time acquisition costs) Operatio
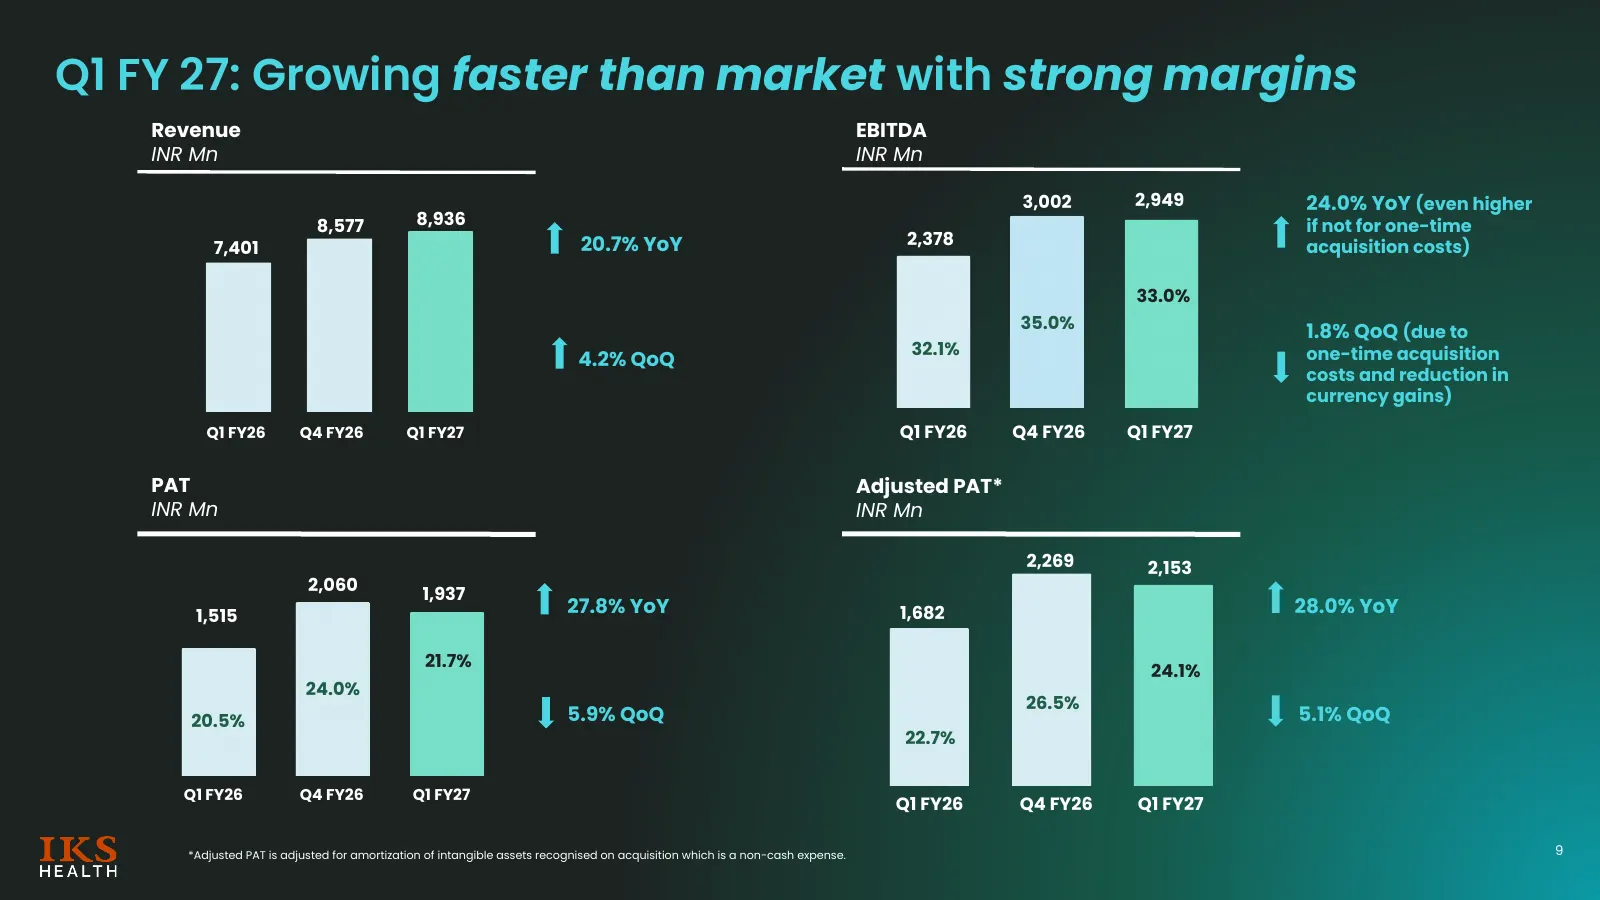
Slide 9: Q1 FY 27: Growing faster than market with strong margins
Q1 FY 27: Growing faster than market with strong margins Revenue EBITDA INR Mn INR Mn 3,002 2,949 24.0% YoY (even higher 8,577 8,936 if not for one-time 20.7% YoY 2,378 acquisition costs) 7,401 33.0% 35.0% 1.8% QoQ (due to 32.1% one-time acquisition 4.2% QoQ costs and reduction in currency gains) Q1
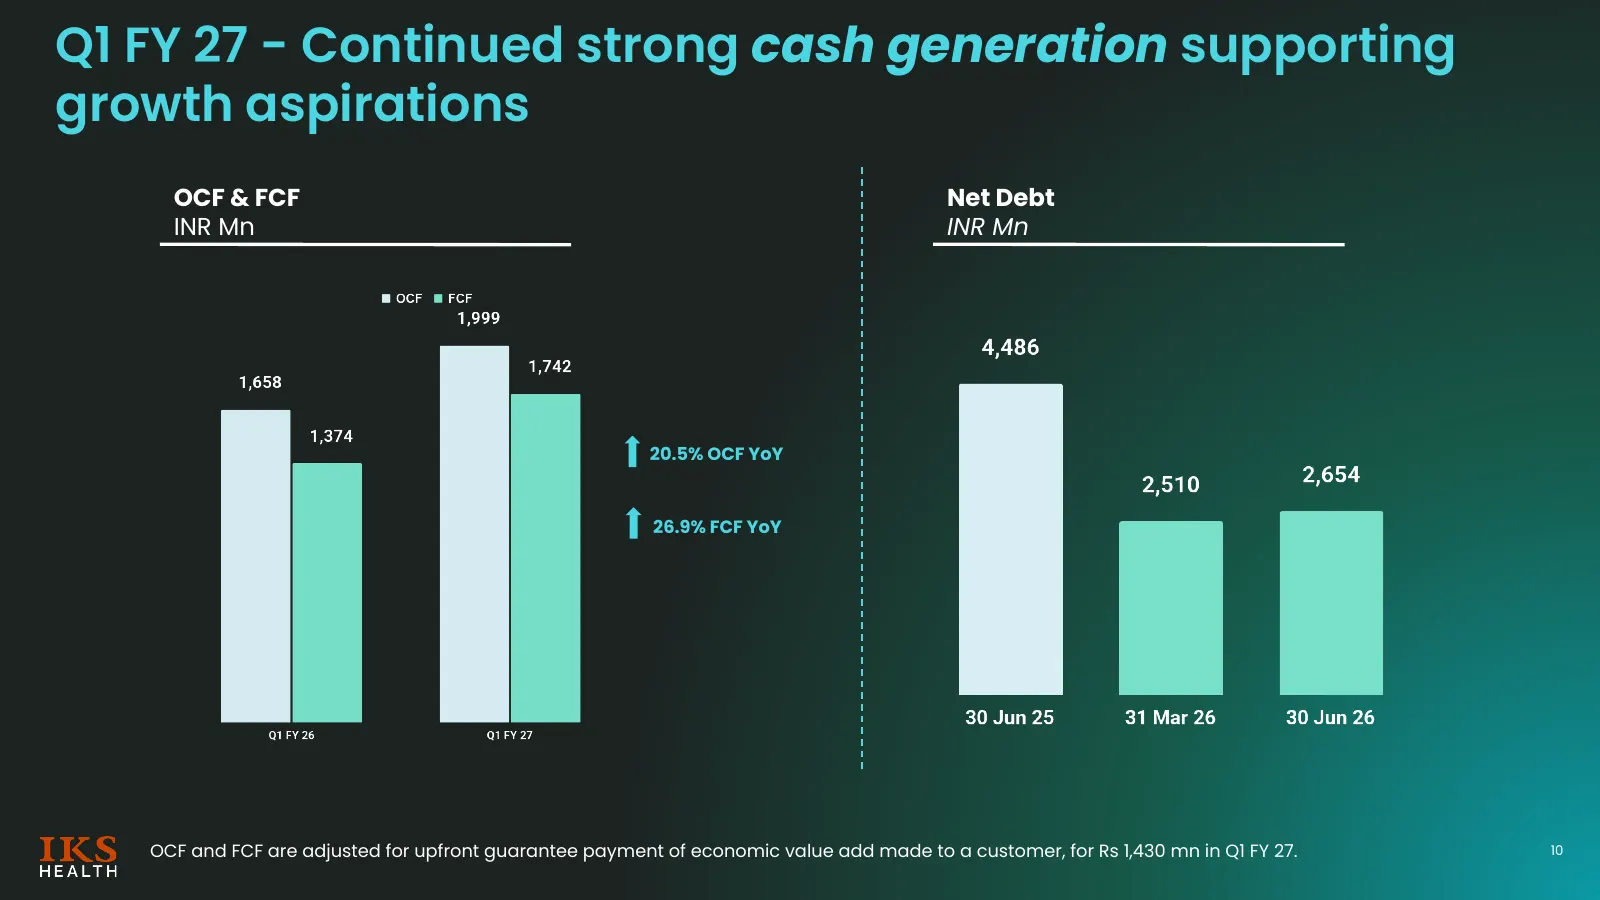
Slide 10: Q1 FY 27 - Continued strong cash generation supporting growth aspirations
Q1 FY 27 - Continued strong cash generation supporting growth aspirations OCF & FCF Net Debt INR Mn INR Mn 20.5% OCF YoY 26.9% FCF YoY OCF and FCF are adjusted for upfront guarantee payment of economic value add made to a customer, for Rs 1,430 mn in Q1 FY 27. 10
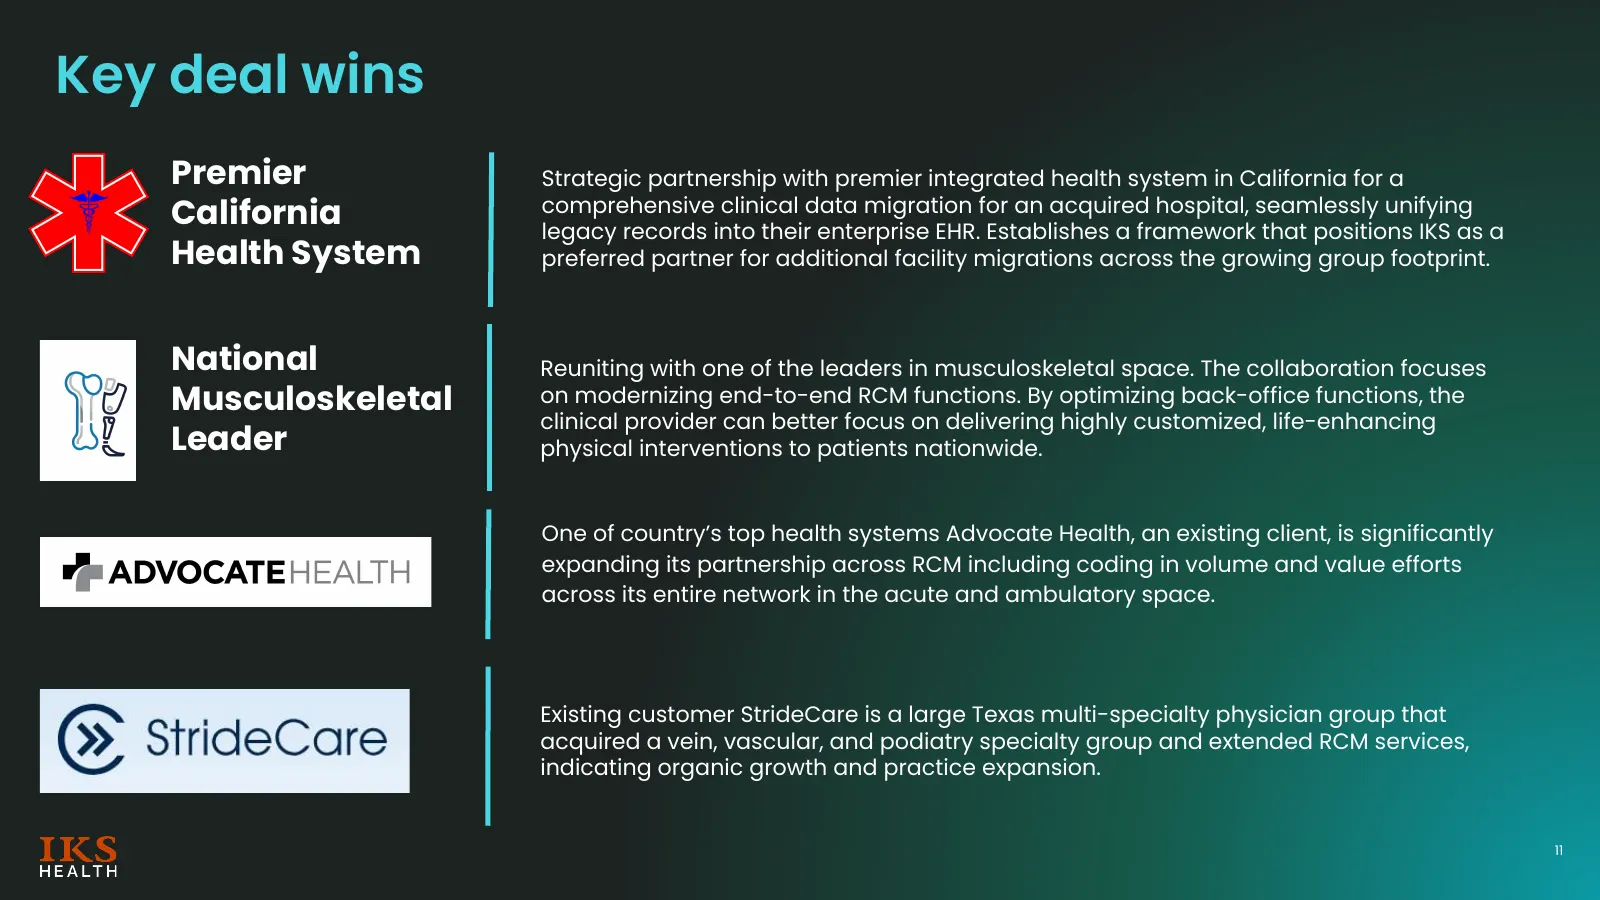
Slide 11: Key deal wins
Key deal wins Premier Strategic partnership with premier integrated health system in California for a comprehensive clinical data migration for an acquired hospital, seamlessly unifying California legacy records into their enterprise EHR. Establishes a framework that positions IKS as a Health System
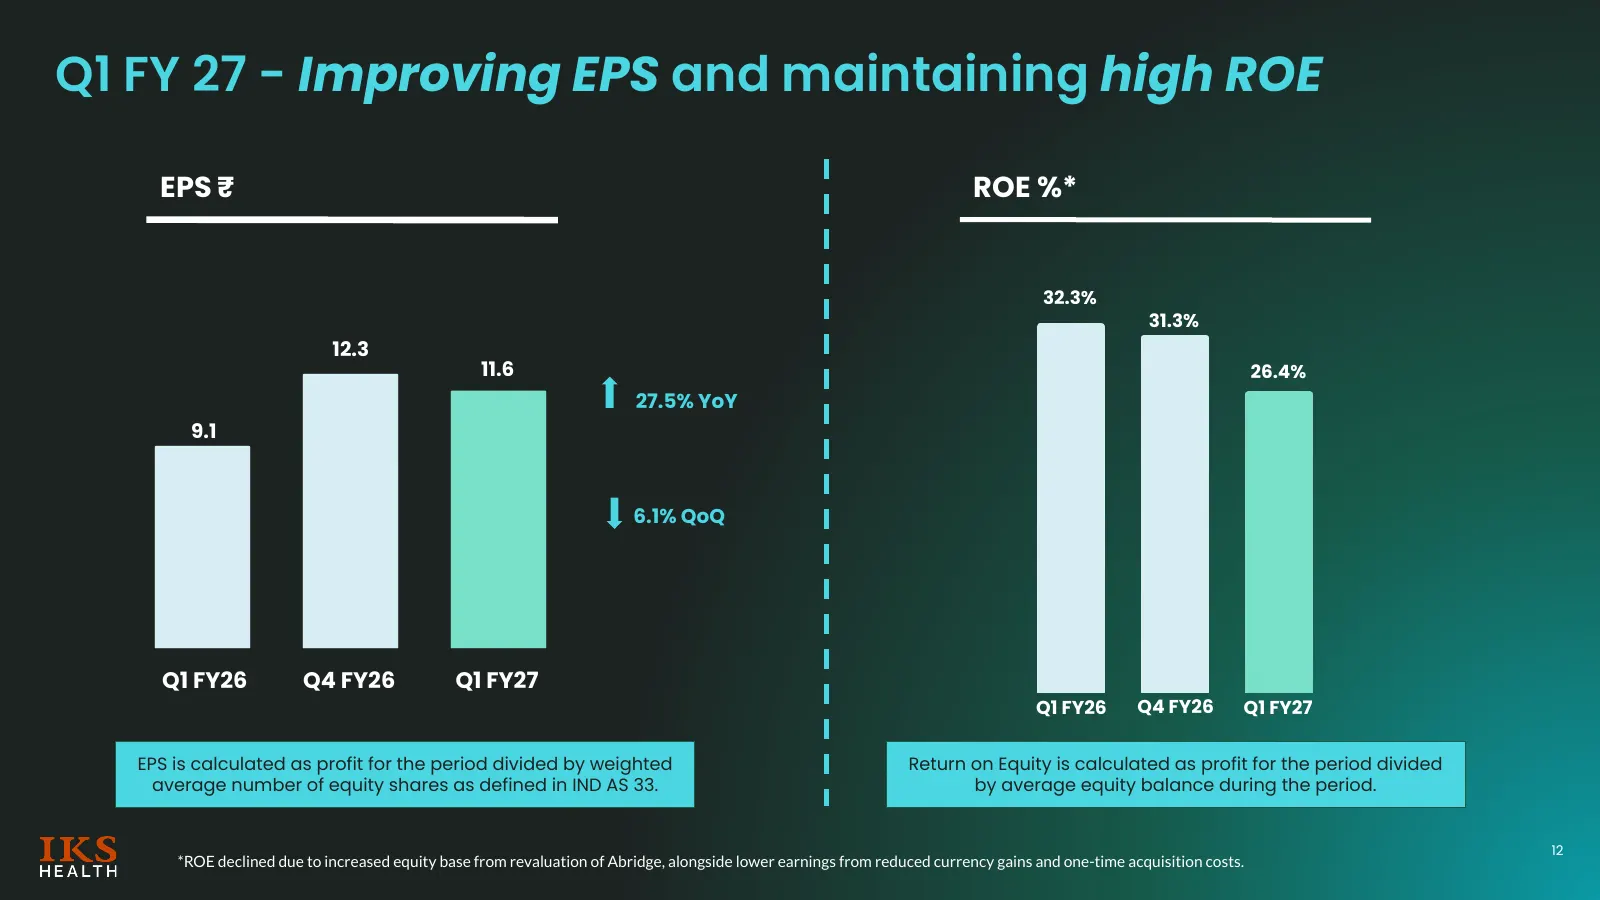
Slide 12: Q1 FY 27 - Improving EPS and maintaining high ROE
Q1 FY 27 - Improving EPS and maintaining high ROE EPS ₹ ROE %* 32.3% 31.3% 12.3 11.6 26.4% 27.5% YoY 9.1 6.1% QoQ Q1 FY26 Q4 FY26 Q1 FY27 Q1 FY26 Q4 FY26 Q1 FY27 EPS is calculated as profit for the period divided by weighted Return on Equity is calculated as profit for the period divided average num
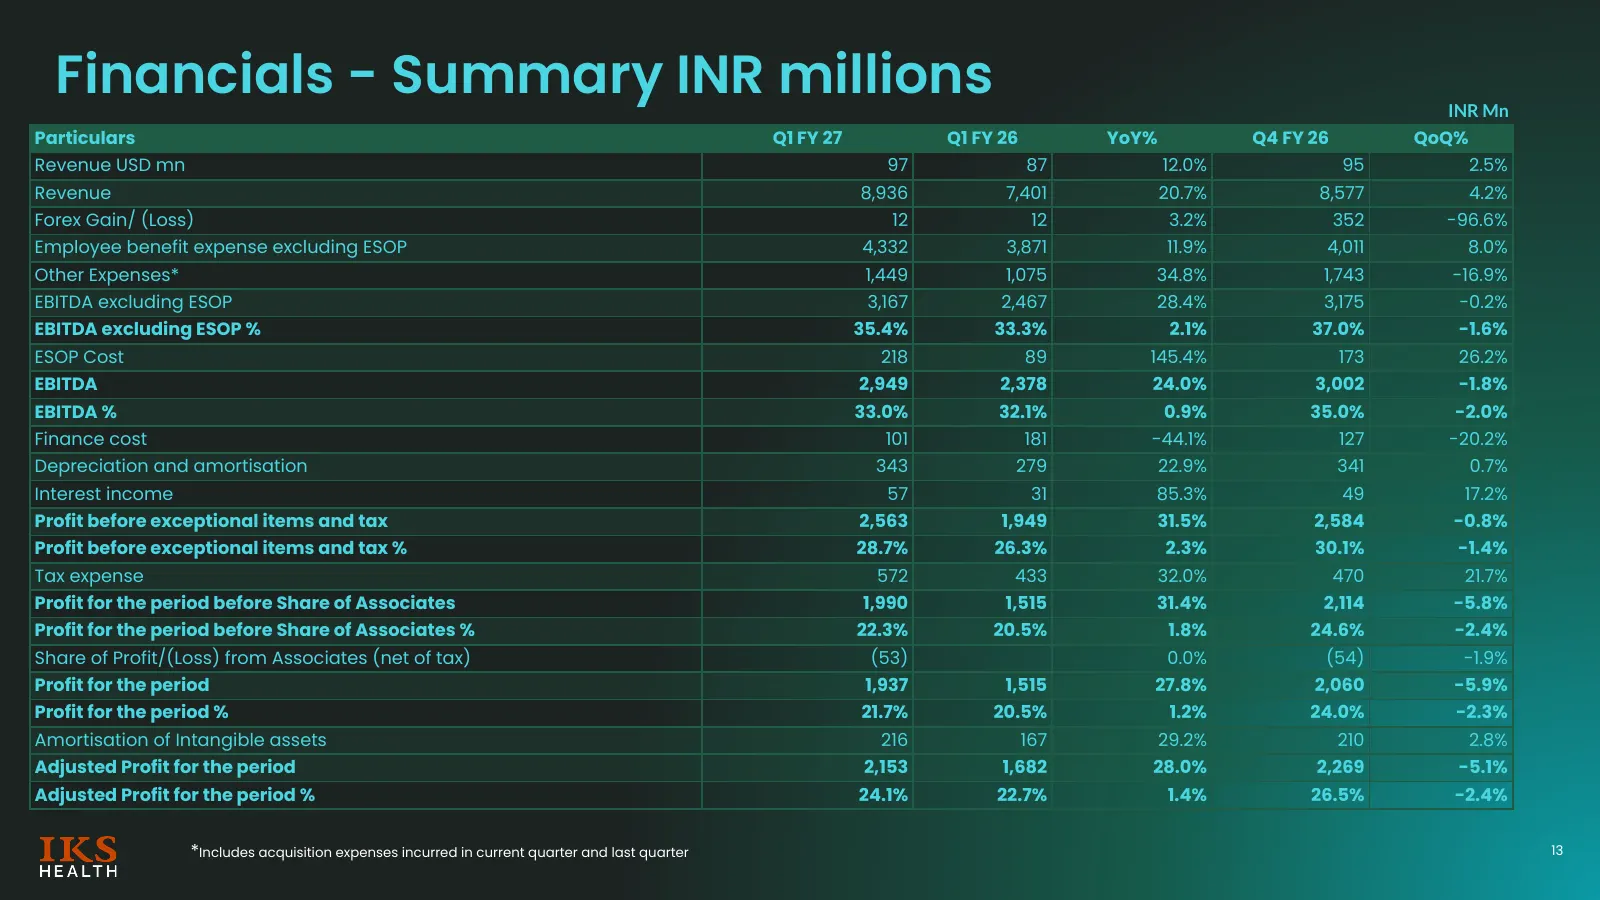
Slide 13: Financials - Summary INR millions
Financials - Summary INR millions INR Mn Particulars Q1 FY 27 Q1 FY 26 YoY% Q4 FY 26 QoQ% Revenue USD mn 97 87 12.0% 95 2.5% Revenue 8,936 7,401 20.7% 8,577 4.2% Forex Gain/ (Loss) 12 12 3.2% 352 -96.6% Employee benefit expense excluding ESOP 4,332 3,871 11.9% 4,011 8.0% Other Expenses* 1,449 1,075
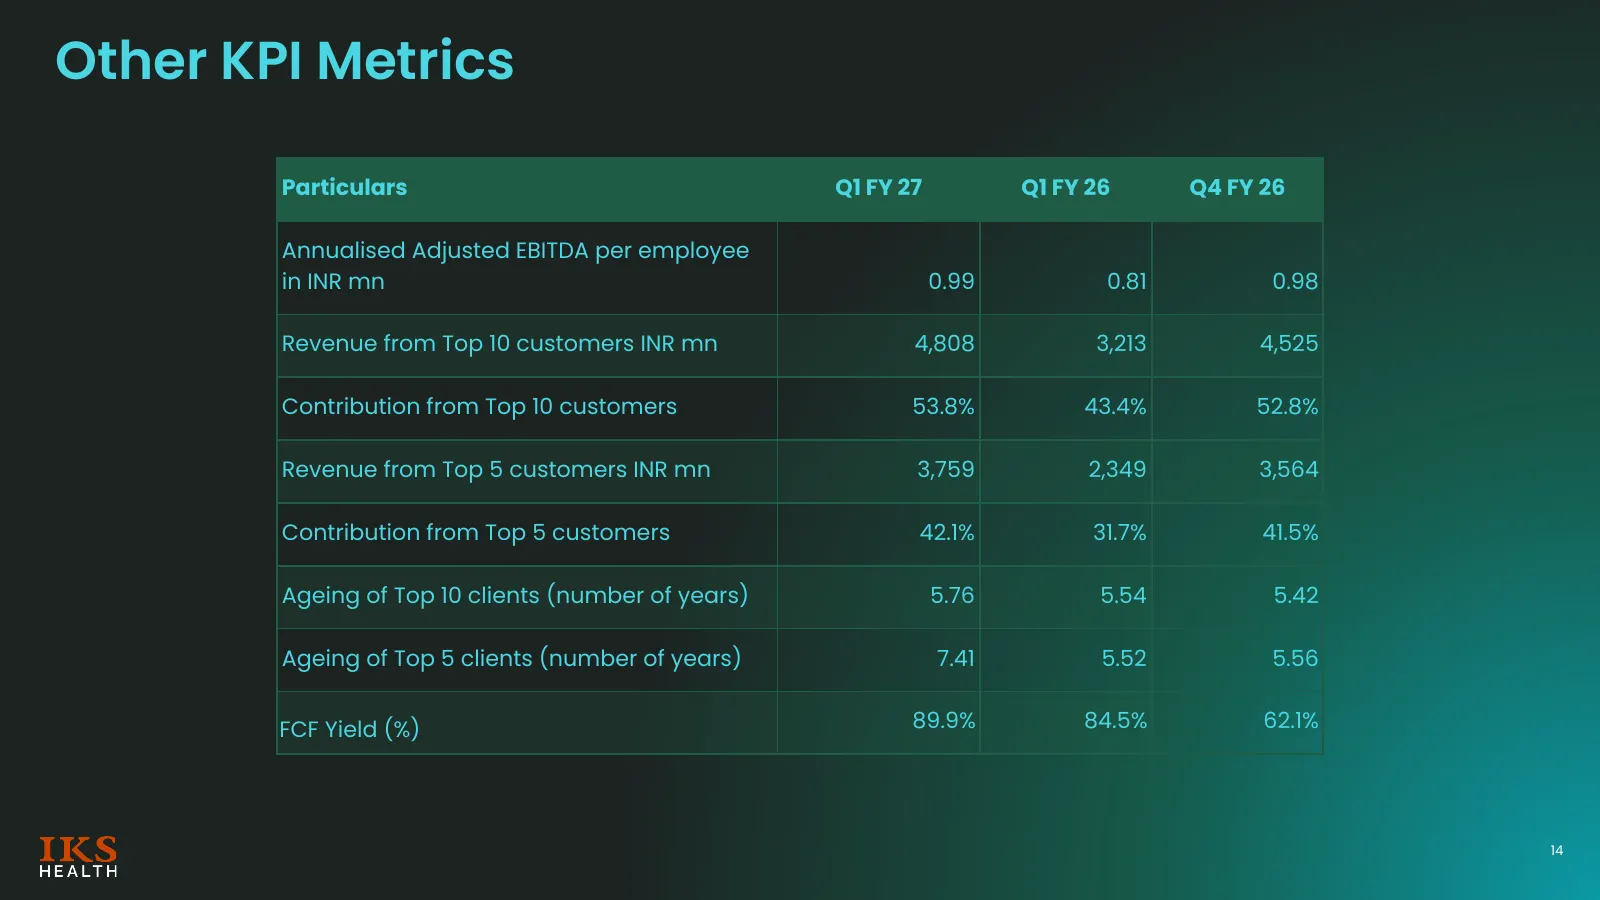
Slide 14: Other KPI Metrics
Other KPI Metrics Particulars Q1 FY 27 Q1 FY 26 Q4 FY 26 Annualised Adjusted EBITDA per employee in INR mn 0.99 0.81 0.98 Revenue from Top 10 customers INR mn 4,808 3,213 4,525 Contribution from Top 10 customers 53.8% 43.4% 52.8% Revenue from Top 5 customers INR mn 3,759 2,349 3,564 Contribution fro
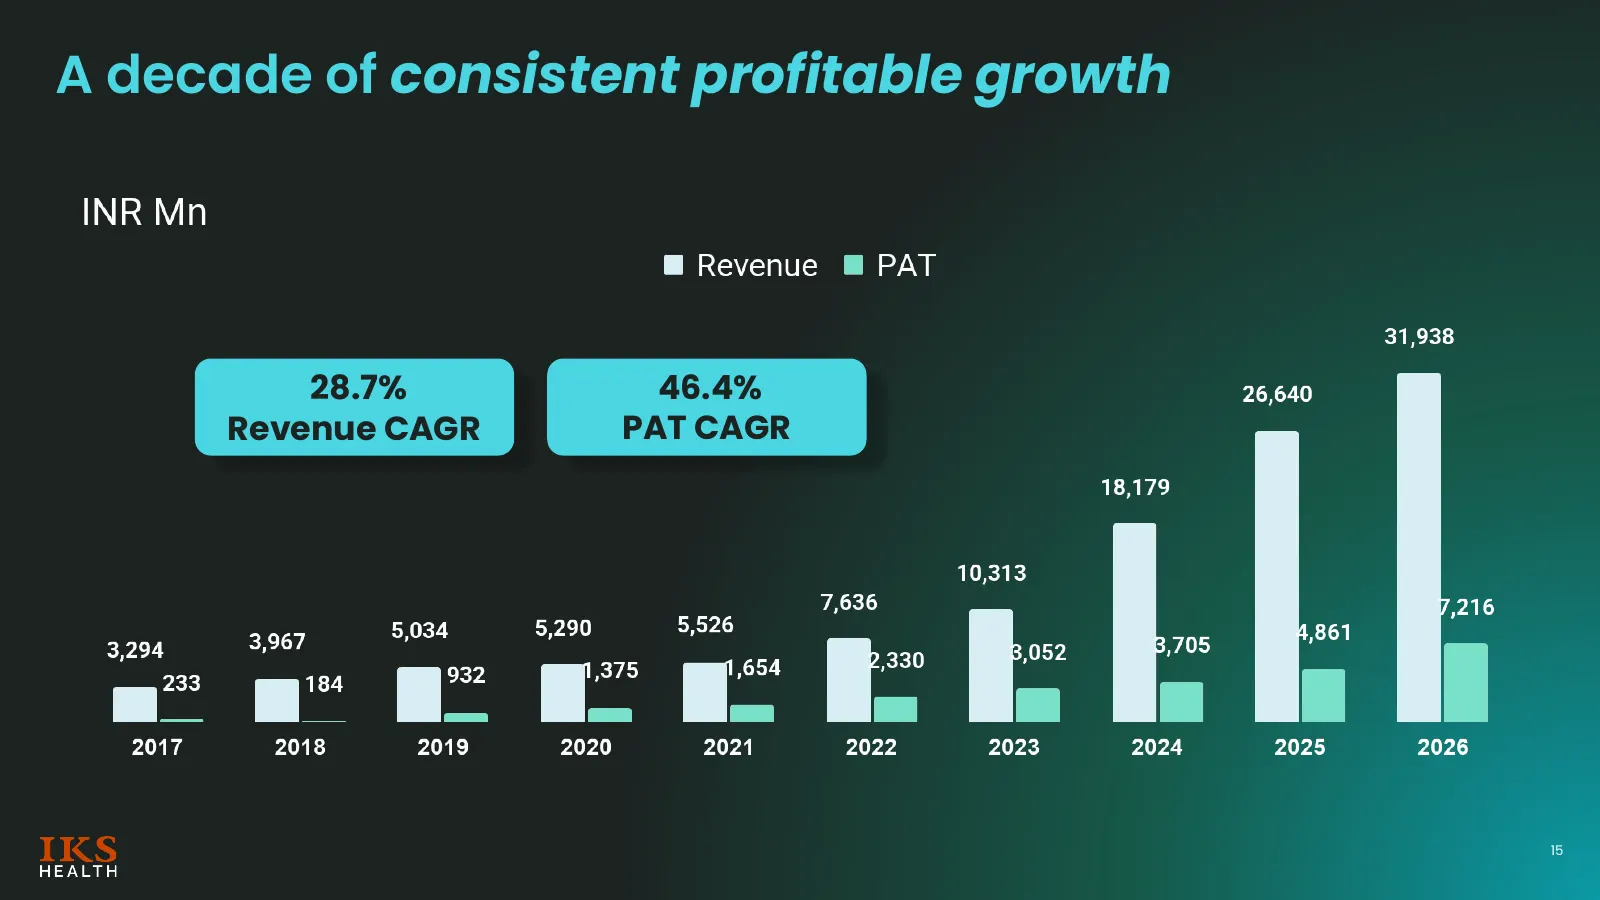
Slide 15: A decade of consistent profitable growth
A decade of consistent profitable growth 28.7% 46.4% Revenue CAGR PAT CAGR 15
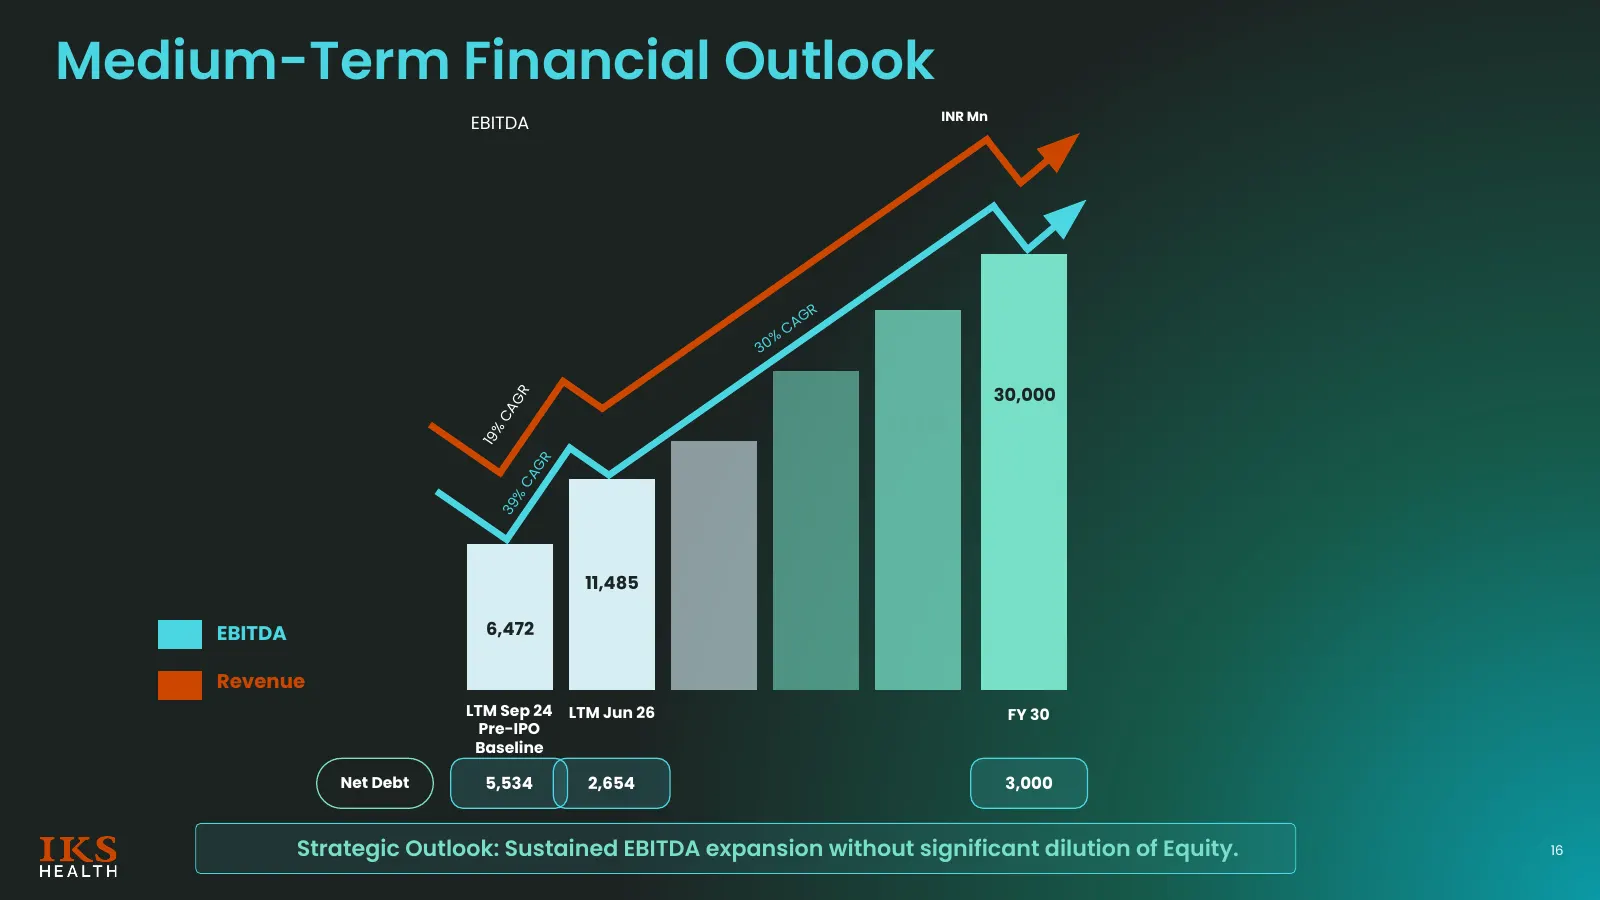
Slide 16: Medium-Term Financial Outlook
Medium-Term Financial Outlook INR Mn EBITDA GR CA % 30 30,000 GR CA 30,000 % 19 GR CA % 39 11,485 EBITDA 6,472 Revenue LTM Sep 24 LTM Jun 26 FY 30 Pre-IPO Baseline Net Debt 5,534 2,654 3,000 Strategic Outlook: Sustained EBITDA expansion without significant dilution of Equity. 16

Slide 17: Thank You
Thank You HEALTH
Source: company website
More decks from Inventurus Knowledge Solutions Limited
 Q2 FY27 Earnings Presentation19 slides · Nov 5, 2026
 Q2 FY27 Earnings Presentation18 slides · November 2026
 Q1 FY27 Earnings Presentation18 slides · Aug 5, 2026
 Q4 FY26 Earnings Presentation34 slides · May 13, 2026
 Merger or Acquisition (April 2026)28 slides · Apr 23, 2026
 Q3 FY2026 Earnings Presentation16 slides · Feb 4, 2026