Holly Energy Partners LP — Investor Presentation (May 2012)
33 slides from Holly Energy Partners LP's investor presentation, May 4, 2012
Slide 1: Holly Energy Partners, L.P. Spring 2012 Investor Update
Holly Energy Partners, L.P. Spring 2012 Investor Update
Slide 2: Safe Harbor Disclosure Statement
Safe Harbor Disclosure Statement 2 Statements made during the course of this presentation that are not historical facts are “forward-looking statements” within the meaning of the U.S. Private Securities Litigation Reform Act of 1995. Forward- looking statements are inherently uncertain and necessari
Slide 3: Holly Energy Partners Investment Highlights
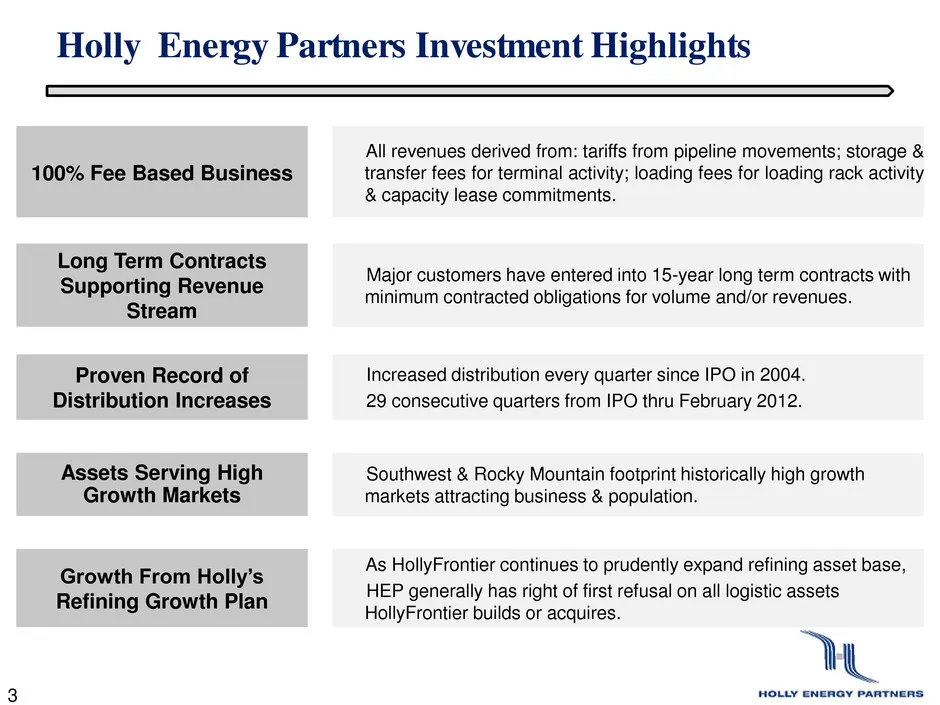
Holly Energy Partners Investment Highlights 100% Fee Based Business All revenues derived from: tariffs from pipeline movements; storage & transfer fees for terminal activity; loading fees for loading rack activity & capacity lease commitments. Long Term Contracts Supporting Revenue Stream Major cust
Slide 4: Presentation Topics
Presentation Topics HEP IPO Formation & Asset History Growth Approach / Orientation Low Risk Profile Parent Sponsor: HollyFrontier Corporation Growth Opportunities Conclusion / Key Strengths 4
Slide 5: HEP Formation 2004: IPO Detail
HEP Formation 2004: IPO Detail 5 HEP formed in 2004 and taken public in an Initial Public Offering sponsored by Holly Corporation (now HollyFrontier Corporation NYSE:HFC) • 49% of common units sold to public holders • HFC retained 49% ownership of common units • HFC became 2% General Partner owner
Slide 6: HEP Formation 2004: Rationale
HEP Formation 2004: Rationale 6 • Parent sponsor had significant logistic assets (pipelines, terminals & loading rack facilities) to support its Southwest U.S. refining business • Parent also knew the value of this business would not be fully recognized & appreciated by Wall Street investors as it p
Slide 7: HEP Formation 2004: Assets & Business
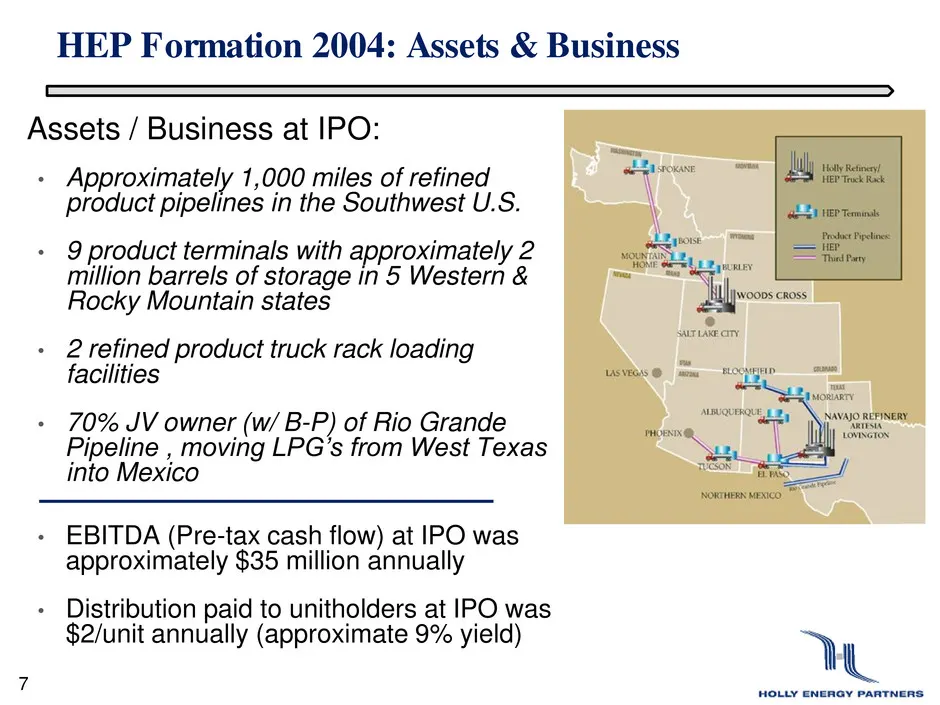
HEP Formation 2004: Assets & Business 7 Assets / Business at IPO: • Approximately 1,000 miles of refined product pipelines in the Southwest U.S. • 9 product terminals with approximately 2 million barrels of storage in 5 Western & Rocky Mountain states • 2 refined product truck rack loading facilitie
Slide 8: Growth
W HOLLY E! Growth
Slide 9: HEP Growth Chronology: IPO to Present
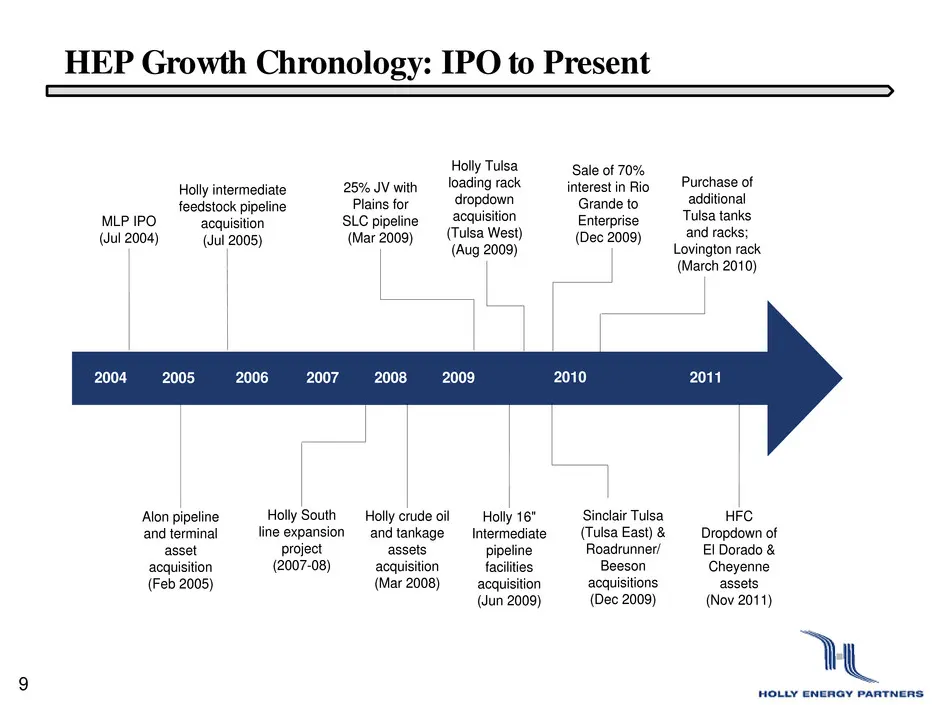
9 2004 2005 2006 2007 2008 2009 MLP IPO (Jul 2004) Holly intermediate feedstock pipeline acquisition (Jul 2005) 25% JV with Plains for SLC pipeline (Mar 2009) Holly Tulsa loading rack dropdown acquisition (Tulsa West) (Aug 2009) Holly crude oil and tankage assets acquisition (Mar 2008) Alon pipeline
Slide 10: Current Holly Energy Partners Assets: Then & Now
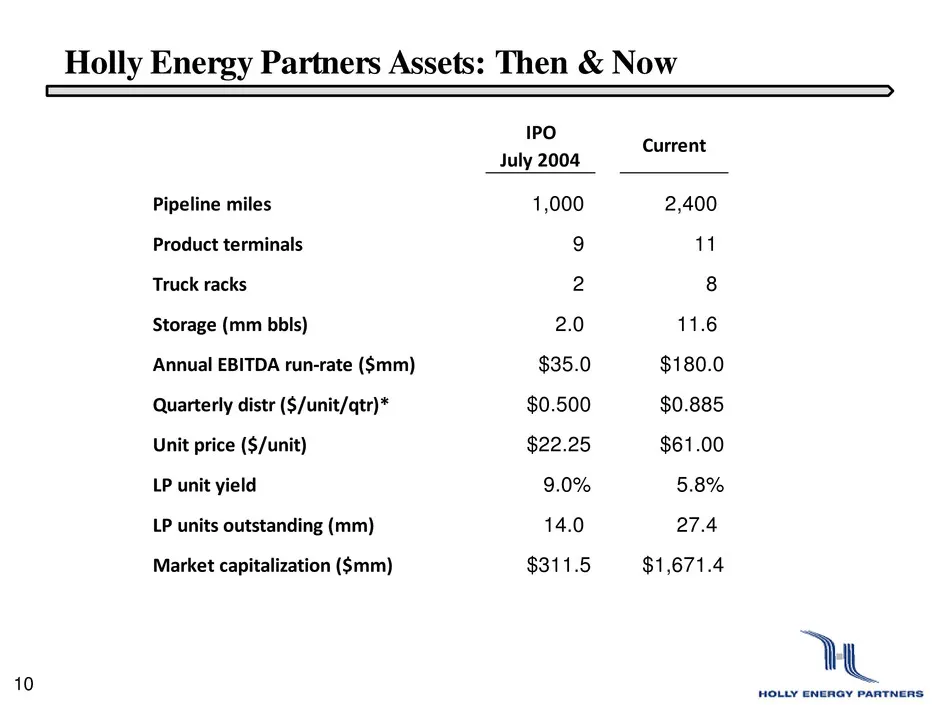
IPO July 2004 Pipeline miles 1,000 2,400 Product terminals 9 11 Truck racks 2 8 Storage (mm bbls) 2.0 11.6 Annual EBITDA run-rate ($mm) $35.0 $180.0 Quarterly distr ($/unit/qtr)* $0.500 $0.885 Unit price ($/unit) $22.25 $61.00 LP unit yield 9.0% 5.8% LP units outstanding (mm) 14.0 27.4 Market capita
Slide 11: HEP Assets: Current Footprint -- Description
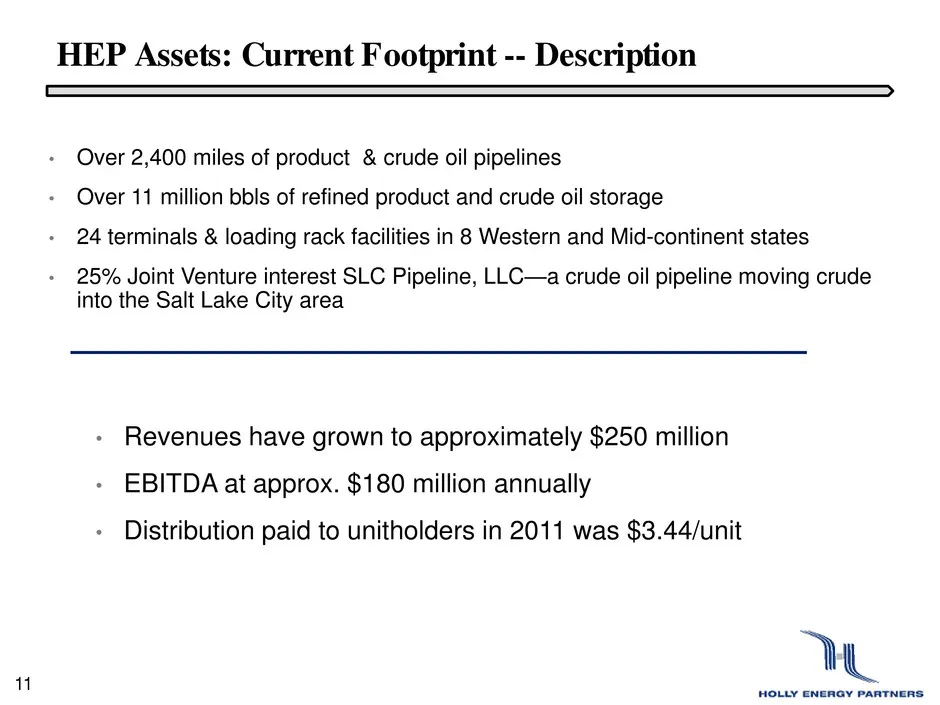
HEP Assets: Current Footprint -- Description • Over 2,400 miles of product & crude oil pipelines • Over 11 million bbls of refined product and crude oil storage • 24 terminals & loading rack facilities in 8 Western and Mid-continent states • 25% Joint Venture interest SLC Pipeline, LLC—a crude oil p
Slide 12: HFC and HEP Assets: Current Footprint -- Map
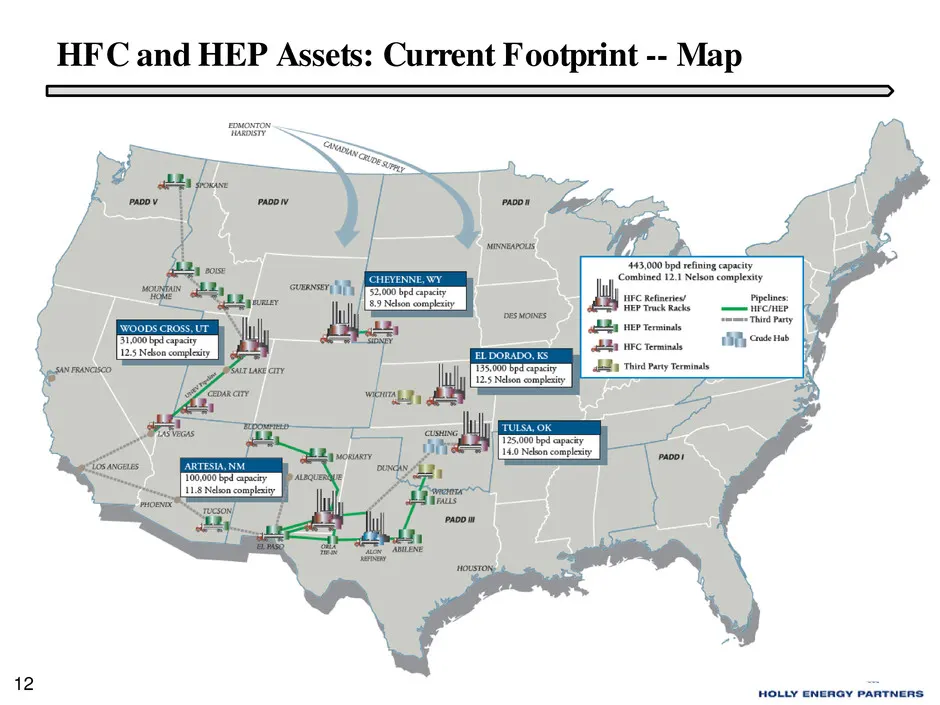
HFC and HEP Assets: Current Footprint -- Map 12
Slide 13: Traditionally High Growth, Niche Markets
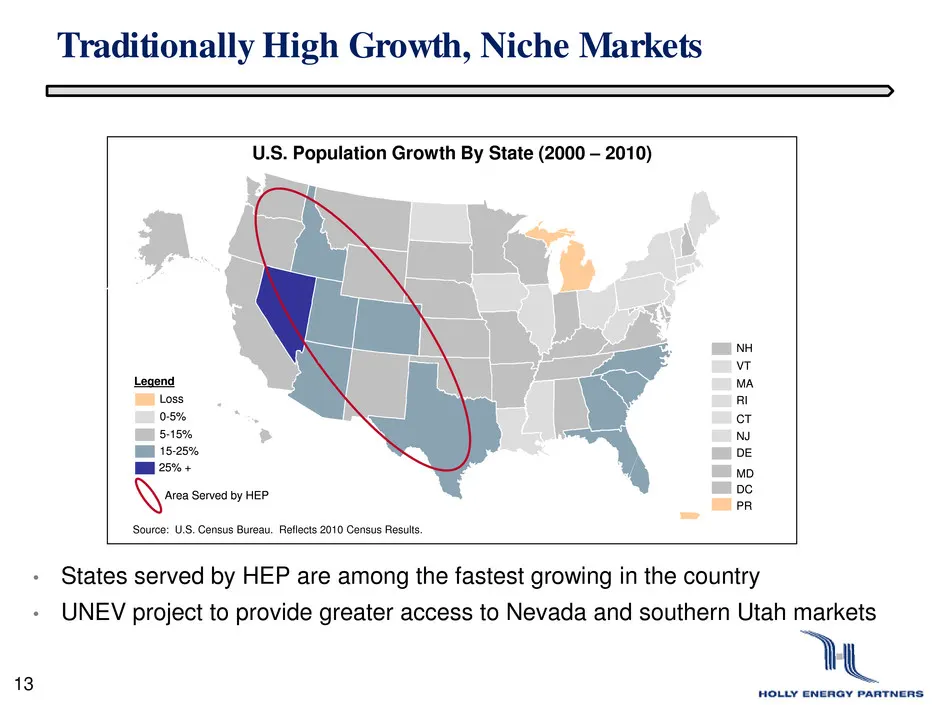
U.S. Population Growth By State (2000 – 2010) Traditionally High Growth, Niche Markets • States served by HEP are among the fastest growing in the country • UNEV project to provide greater access to Nevada and southern Utah markets RI DC Loss 0-5% 5-15% 15-25% 25% + NH VT MA CT NJ DE MD PR Legend Ar
Slide 14: HEP Growth: EBITDA Since Inception
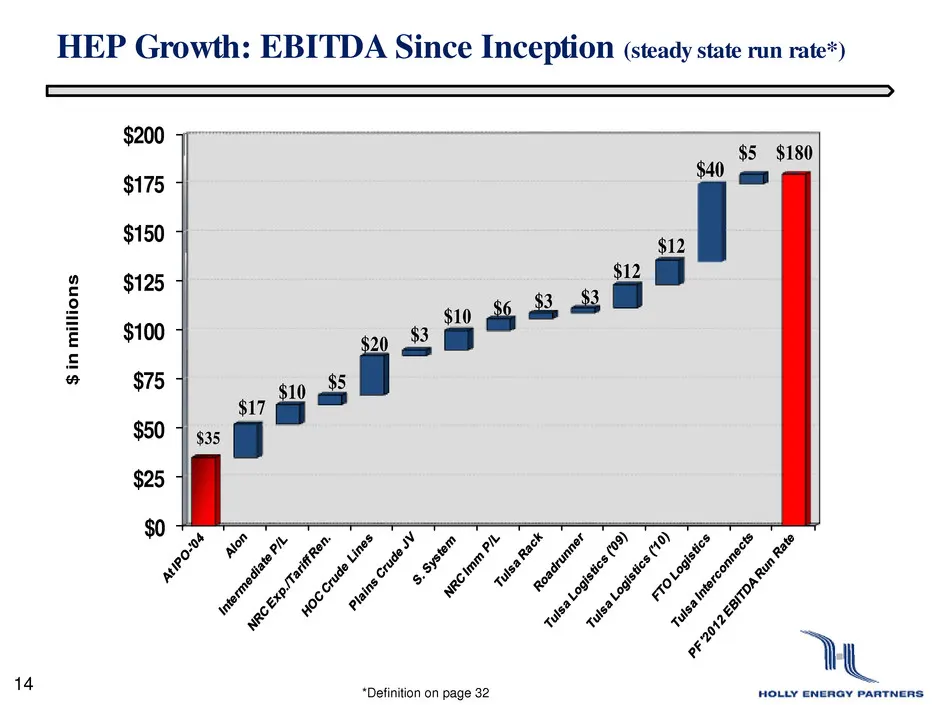
HEP Growth: EBITDA Since Inception (steady state run rate*) 14 $0 $25 $50 $75 $100 $125 $150 $175 $200 $35 $17 $10 $5 $20 $3 $10 $6 $3 $3 $12 $12 $40 $5 $180 $ in mi llio ns *Definition on page 32
Slide 15: HEP Growth: Distributable Cash Flow
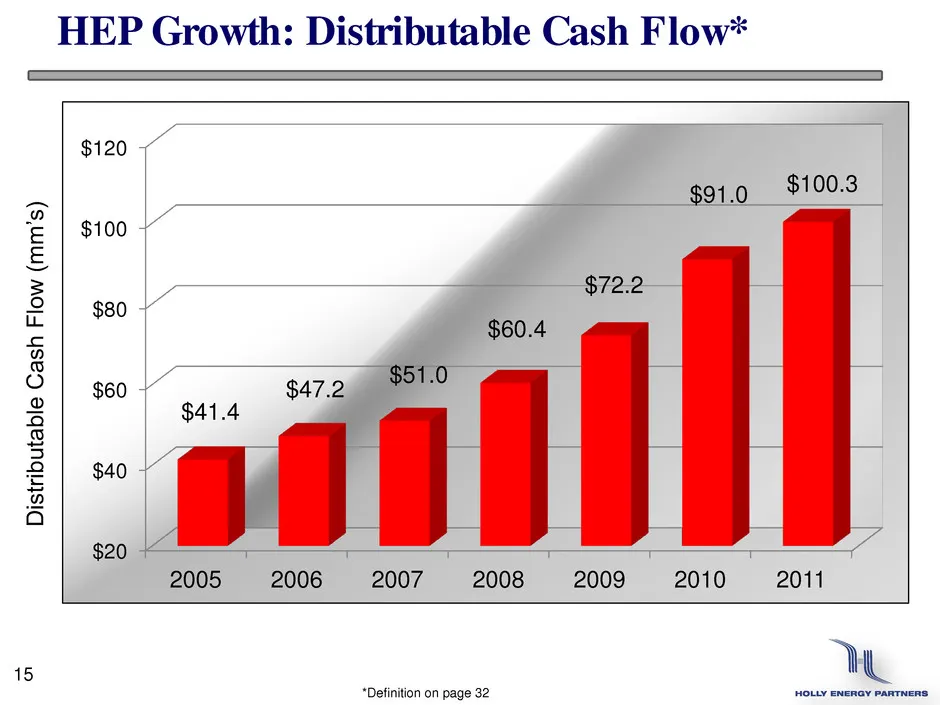
15 HEP Growth: Distributable Cash Flow* $20 $40 $60 $80 $100 $120 2005 2006 2007 2008 2009 2010 2011 $41.4 $47.2 $51.0 $60.4 $72.2 $91.0 $100.3 Di stribu tab le Ca sh Flow (mm’ s) *Definition on page 32
Slide 16: HEP Growth: Limited Partner Distributions
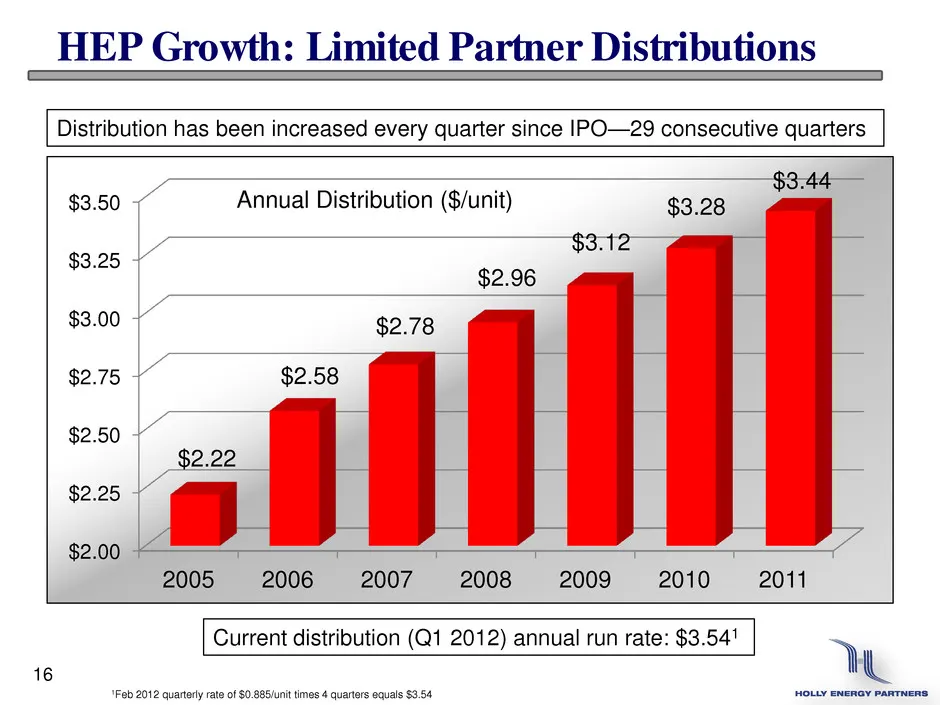
16 HEP Growth: Limited Partner Distributions $2.00 $2.25 $2.50 $2.75 $3.00 $3.25 $3.50 2005 2006 2007 2008 2009 2010 2011 $2.22 $2.58 $2.78 $2.96 $3.12 $3.28 $3.44 Annual Distribution ($/unit) Distribution has been increased every quarter since IPO—29 consecutive quarters Current distribution (Q1 20
Slide 17: Low Risk Profile / Orientation
Low Risk Profile / Orientation 17
Slide 18: Stable Cash Flows
Stable Cash Flows Revenue Stability: • Minimum commitments paid by major shippers • (even if shipments do not occur) • Long term (15-year) contracts in place with major customers • Over 80% of revenues tied to long term contracts and minimum commitments 18
Slide 19: Stable Cash Flows – Minimum Commitments
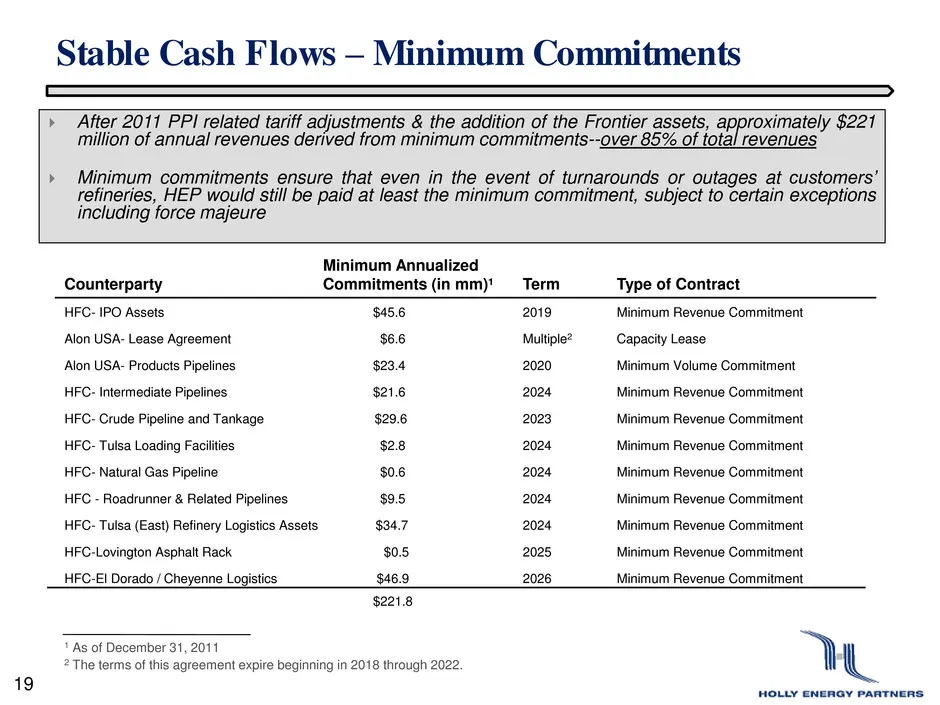
Stable Cash Flows – Minimum Commitments After 2011 PPI related tariff adjustments & the addition of the Frontier assets, approximately $221 million of annual revenues derived from minimum commitments--over 85% of total revenues Minimum commitments ensure that even in the event of turnarounds or
Slide 20: No Commodity Risk
No Commodity Risk No Commodity Risk: 100% fee based revenue stream HEP owns no inventory—no inventory price risk No commodity ownership risk or hedging necessary 20
Slide 21: Relationship w/ Parent Sponsor--HollyFrontier
Relationship w/ Parent Sponsor--HollyFrontier 21
Slide 22: Strategic Relationship with HollyFrontier
Strategic Relationship with HollyFronter HEP’s assets are integral to HFC’s refineries Currently HFC owns 40% of the MLP through a limited partner interest and 2% through a general partner interest HEP generally has right of first refusal on all logistics assets Holly acquires or builds 22
Slide 23: Strong Parent / Sponsor: HollyFrontier
23 Pure Play Competitive Refiner 5 refineries with over 440,000 barrels per day (bpd) High complexity facilities -- combined Nelson Complexity rating of over 12.0 Multiple sources of crude supply -- All crude oil ‘WTI’ price based Attractive markets Geographic: Rocky Mountains, Southwest and
Slide 24: HollyFrontier Corporation: Strong Returns on Capital
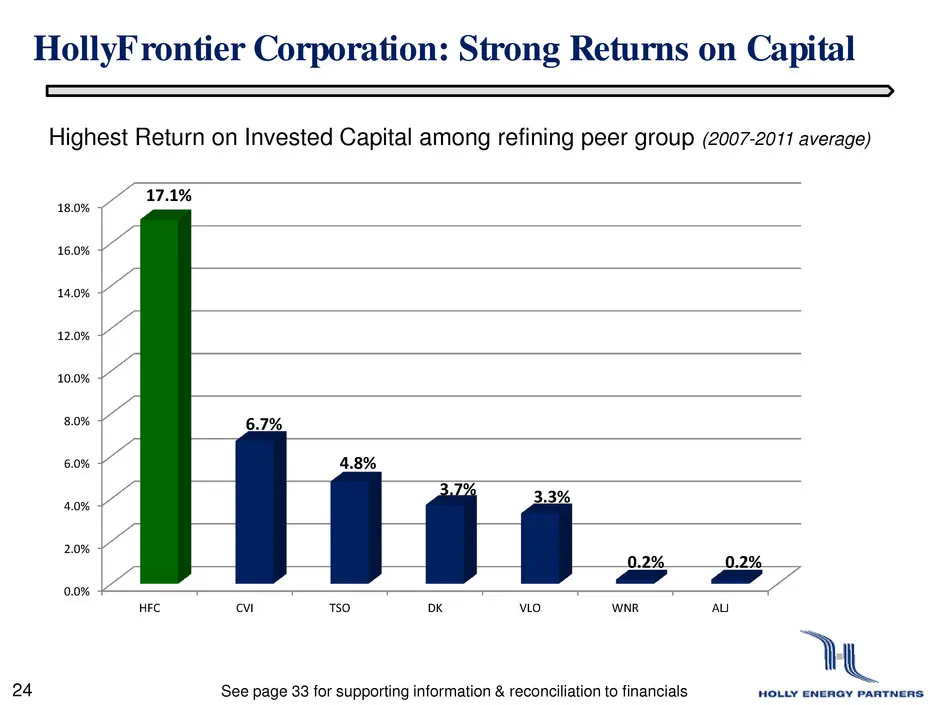
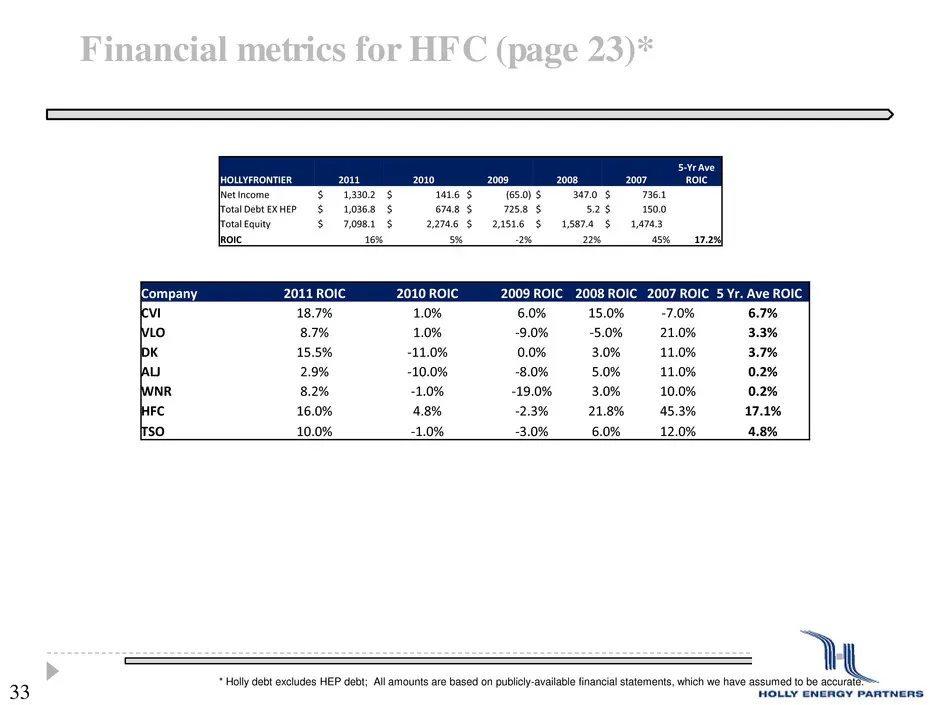
0.0% 2.0% 4.0% 6.0% 8.0% 10.0% 12.0% 14.0% 16.0% 18.0% HFC CVI TSO DK VLO WNR ALJ 17.1% 6.7% 4.8% 3.7% 3.3% 0.2% 0.2% HollyFrontier Corporation: Strong Returns on Capital 24 Highest Return on Invested Capital among refining peer group (2007-2011 average) 3 4 See page 33 for supporting information &
Slide 25: Future Growth Opportunities
Future Growth Opportunities 25
Slide 26: Growth Opportunity: UNEV Pipeline– 2012
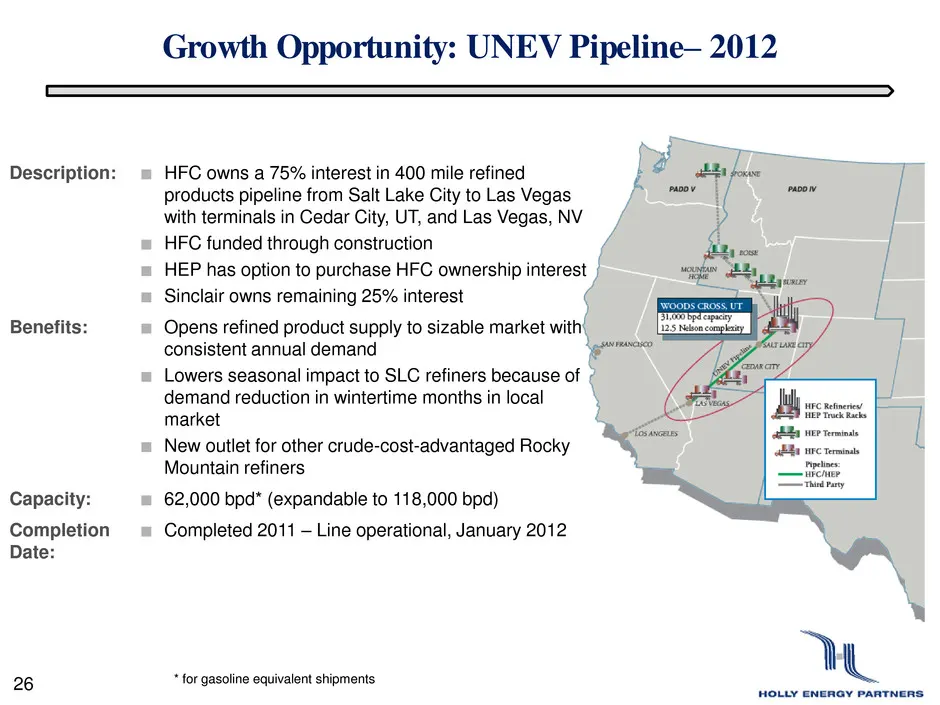
Growth Opportunity: UNEV Pipeline– 2012 Description: ■ HFC owns a 75% interest in 400 mile refined products pipeline from Salt Lake City to Las Vegas with terminals in Cedar City, UT, and Las Vegas, NV ■ HFC funded through construction ■ HEP has option to purchase HFC ownership interest ■ Sinclair o
Slide 27: Growth Opportunity: Permian Basin Crude Oil Infrastructure
Growth Opportunity: Permian Basin Crude Oil Infrastructure Description: ■ Expand HEP’s existing crude oil pipeline system in the Permian Basin to transport crude oil in the rapidly developing western Permian production area Benefits: ■ Transport additional volumes of crude oil to HFC or into crude o
Slide 28: Conclusion / Key Strengths
Conclusion / Key Strengths 28
Slide 29: Holly Energy Partners Investment Highlights
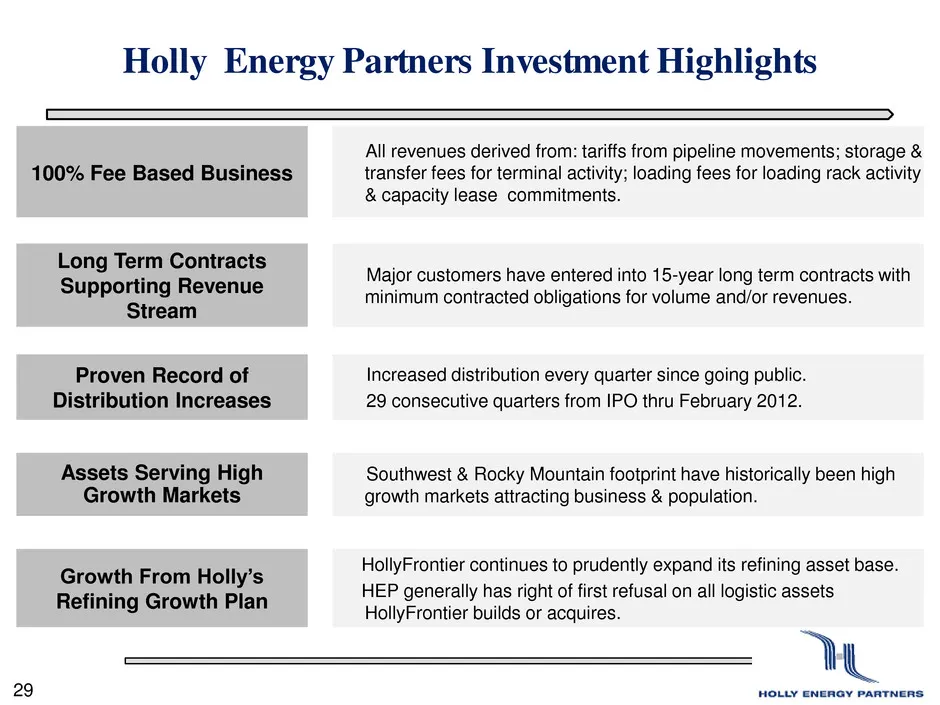
Holly Energy Partners Investment Highlights 100% Fee Based Business All revenues derived from: tariffs from pipeline movements; storage & transfer fees for terminal activity; loading fees for loading rack activity & capacity lease commitments. Long Term Contracts Supporting Revenue Stream Major cust

Slide 30: Contact Information
Contact Information: 30 Holly Energy Partners, L.P. (NYSE: HEP) 2828 N. Harwood, Suite 1300 Dallas, Texas 75201 (214) 871-3555 For investor relations questions please contact: Neale Hickerson, Vice President-Investor Relations neale.hickerson@hollyenergy.com Julia Heidenreich, Investor Relations jul
Slide 31: Appendix
W HOLLY E! Appendix
Slide 32: Definitions
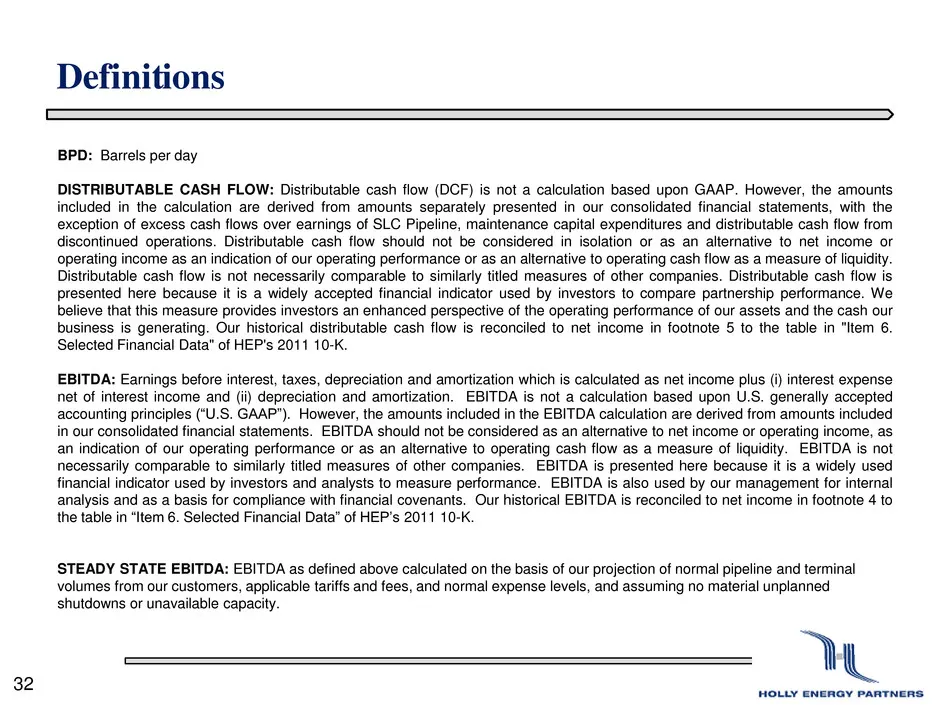
Definitions 32 BPD: Barrels per day DISTRIBUTABLE CASH FLOW: Distributable cash flow (DCF) is not a calculation based upon GAAP. However, the amounts included in the calculation are derived from amounts separately presented in our consolidated financial statements, with the exception of excess cash
Slide 33: Financial metrics for HFC
Financial metrics for HFC (page 23)* * Holly debt excludes HEP debt; All amounts are based on publicly-available financial statements, which we have assumed to be accurate. 33 HOLLYFRONTIER 2011 2010 2009 2008 2007 5-Yr Ave ROIC Net Income $ 1,330.2 $ 141.6 $ (65.0) $ 347.0 $ 736.1 Total Debt EX HEP
Source: SEC EDGAR · 8-K filed May 4, 2012
More decks from Holly Energy Partners LP
 Investor Presentation (March 2023)20 slides · Mar 2, 2023
 Investor Presentation (August 2022)24 slides · Aug 16, 2022
 Investor Presentation (May 2022)23 slides · May 17, 2022
 Investor Presentation (March 2022)12 slides · Mar 22, 2022
 Investor Presentation (March 2022)18 slides · Mar 1, 2022
 Investor Presentation (December 2021)18 slides · Dec 9, 2021