Golden Entertainment — Investor Presentation (February 2017)
22 slides from Golden Entertainment's investor presentation, Feb 2, 2017
Slide 1: Investor Presentation February 2017
Exhibit 99.1 ENTERTAINMENT. CASINOS * DISTRIBUTED GAMING INVESTOR PRESENTATION | Fesruary 2017
Slide 2: Forward-Looking Statements
Forward-Looking Statements This presentation includes forward-looking statements regarding future events and future results that are subject to the safe harbors created under the Securities Act of 1933 and the Securities Exchange Act of 1934, or the Exchange Act. Forward-looking statements can gener
Slide 3: Investment Highlights
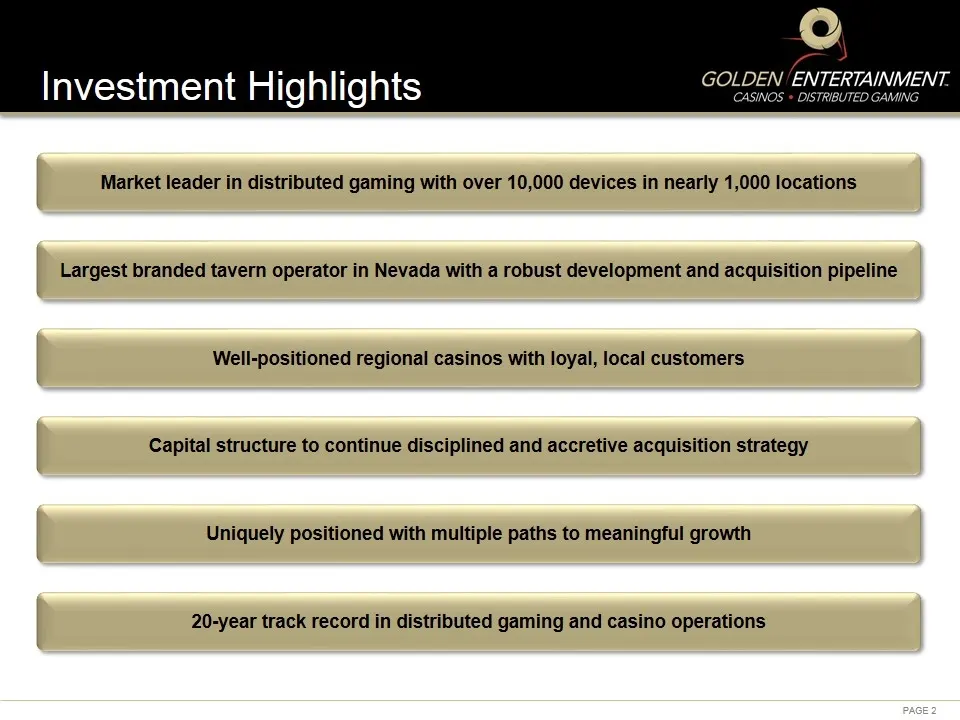
Investment Highlights Market leader in distributed gaming with over 10,000 devices in nearly 1,000 locations Largest branded tavern operator in Nevada with a robust development and acquisition pipeline Capital structure to continue disciplined and accretive acquisition strategy Uniquely positioned w
Slide 4: Business Overview
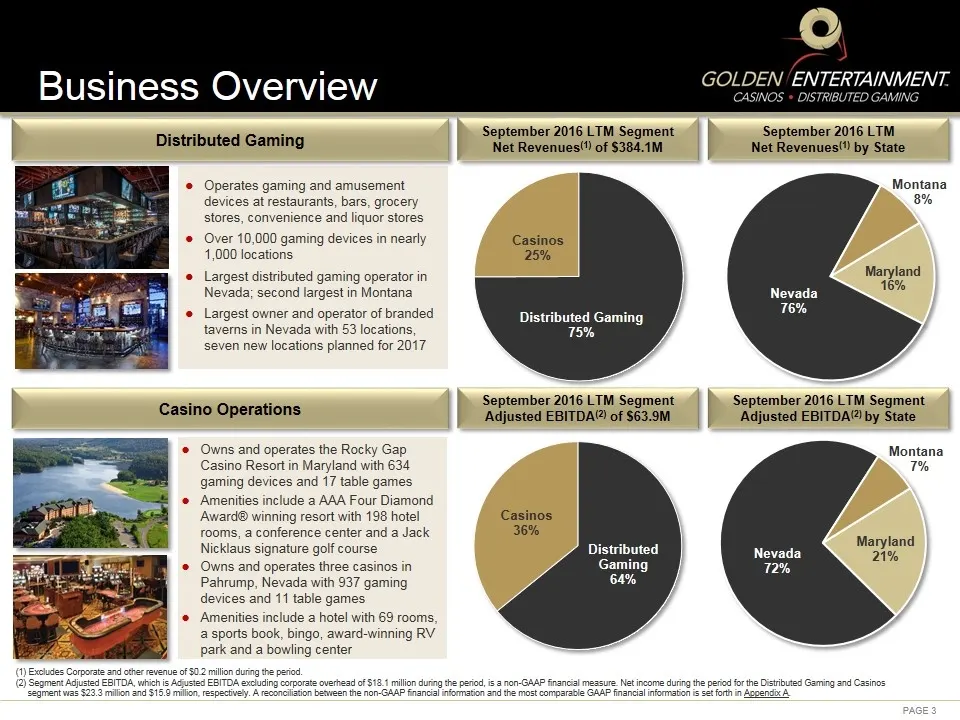
Casino Operations (1) Excludes Corporate and other revenue of $0.2 million during the period. (2) Segment Adjusted EBITDA, which is Adjusted EBITDA excluding corporate overhead of $18.1 million during the period, is a non-GAAP financial measure. Net income during the period for the Distributed Gamin
Slide 5: History of Growth by Acquisition
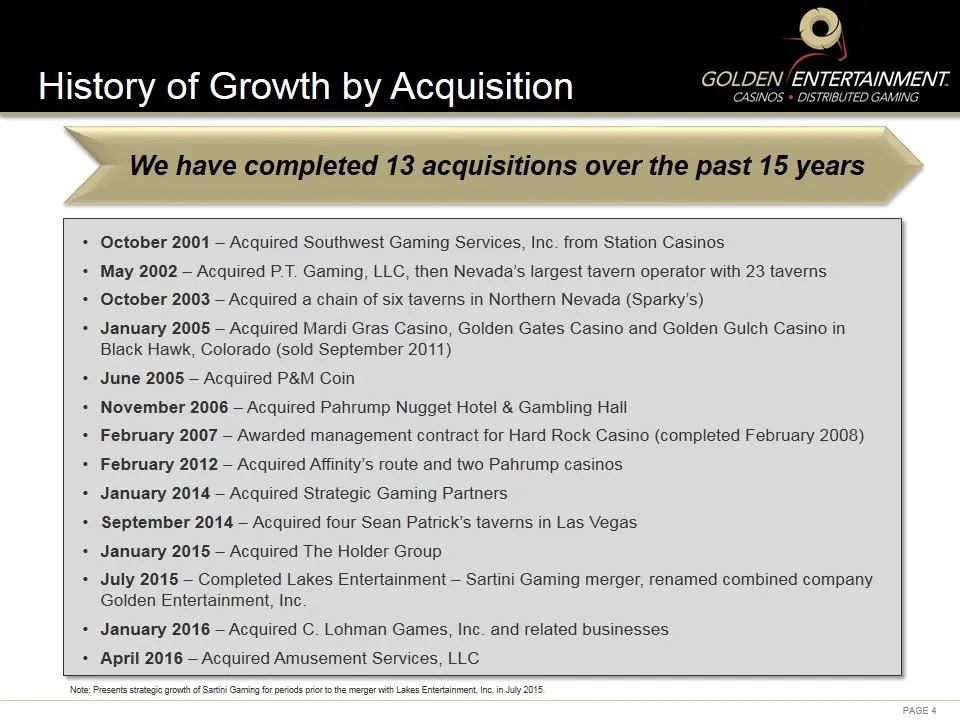
Note: Presents strategic growth of Sartini Gaming for periods prior to the merger with Lakes Entertainment, Inc. in July 2015. History of Growth by Acquisition October 2001 – Acquired Southwest Gaming Services, Inc. from Station Casinos May 2002 – Acquired P.T. Gaming, LLC, then Nevada’s largest tav
Slide 6: Leader in Distributed Gaming
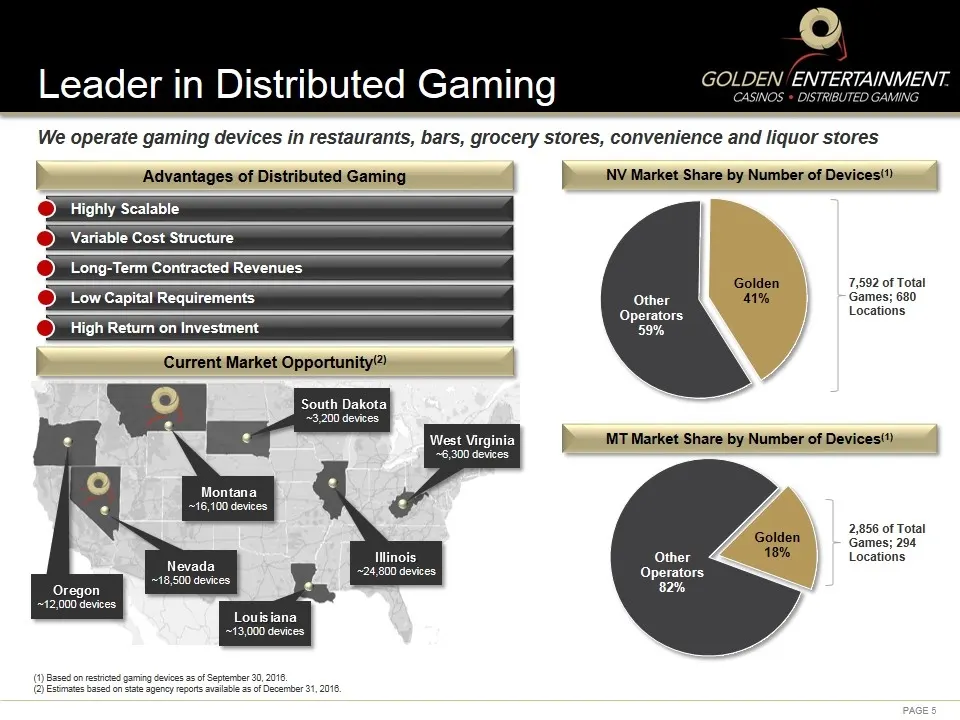
(1) Based on restricted gaming devices as of September 30, 2016. (2) Estimates based on state agency reports available as of December 31, 2016. We operate gaming devices in restaurants, bars, grocery stores, convenience and liquor stores Leader in Distributed Gaming Advantages of Distributed Gaming
Slide 7: Contracted Recurring Revenue
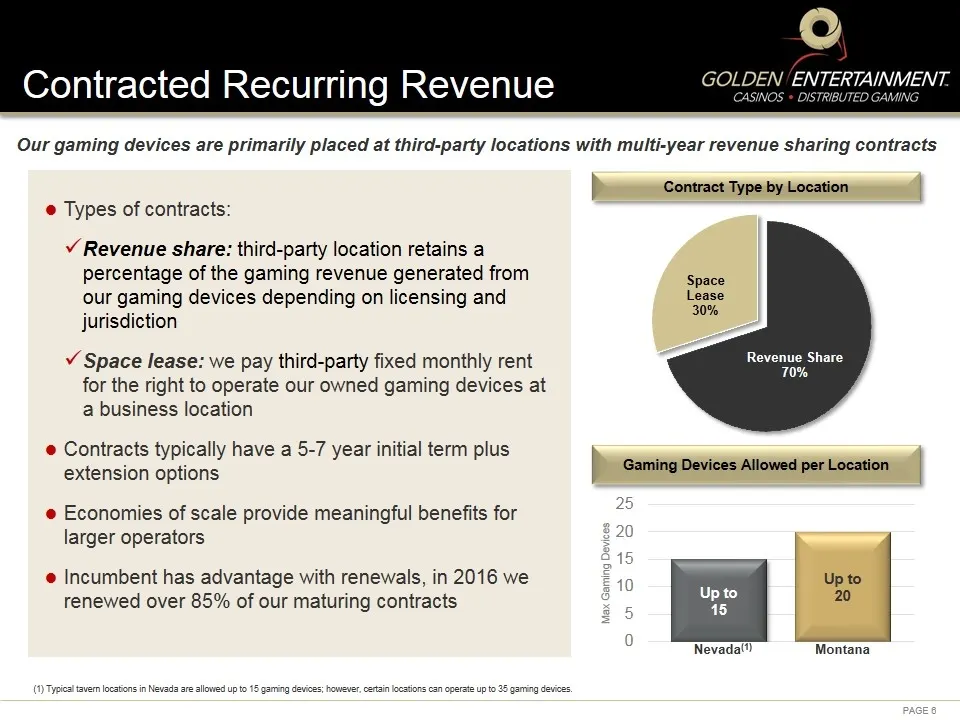
Contract Type by Location Contracted Recurring Revenue Our gaming devices are primarily placed at third-party locations with multi-year revenue sharing contracts Gaming Devices Allowed per Location Types of contracts: Revenue share: third-party location retains a percentage of the gaming revenue gen
Slide 8: Largest Owner of Branded Taverns
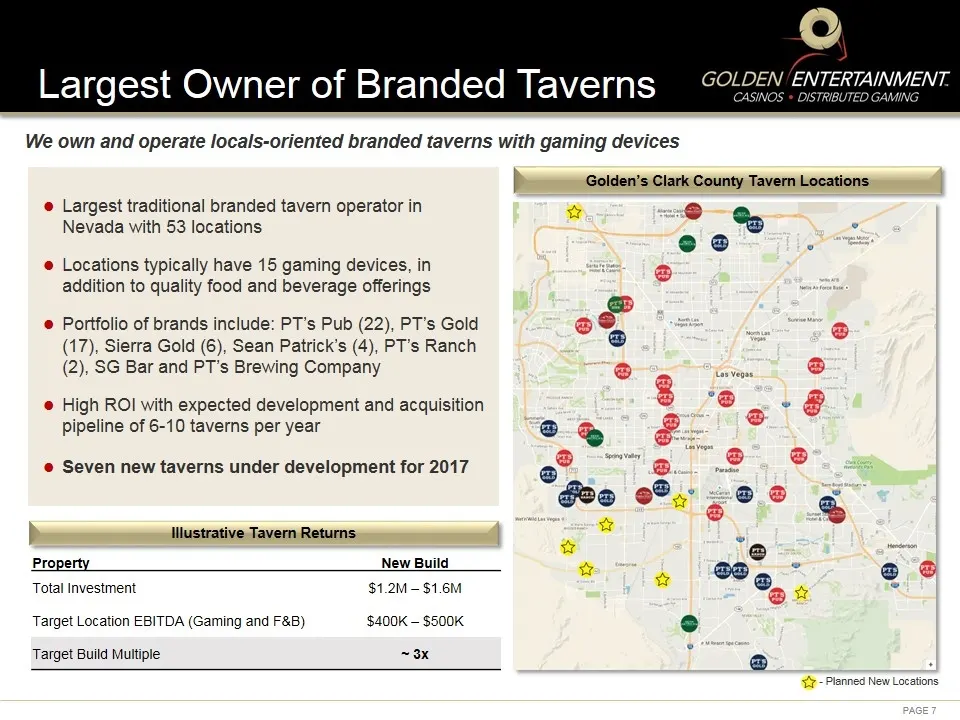
Largest Owner of Branded Taverns Golden’s Clark County Tavern Locations - Planned New Locations Property New Build Total Investment $1.2M – $1.6M Target Location EBITDA (Gaming and F&B) $400K – $500K Target Build Multiple ~ 3x Illustrative Tavern Returns We own and operate locals-oriented branded ta
Slide 9: Our Tavern Customer
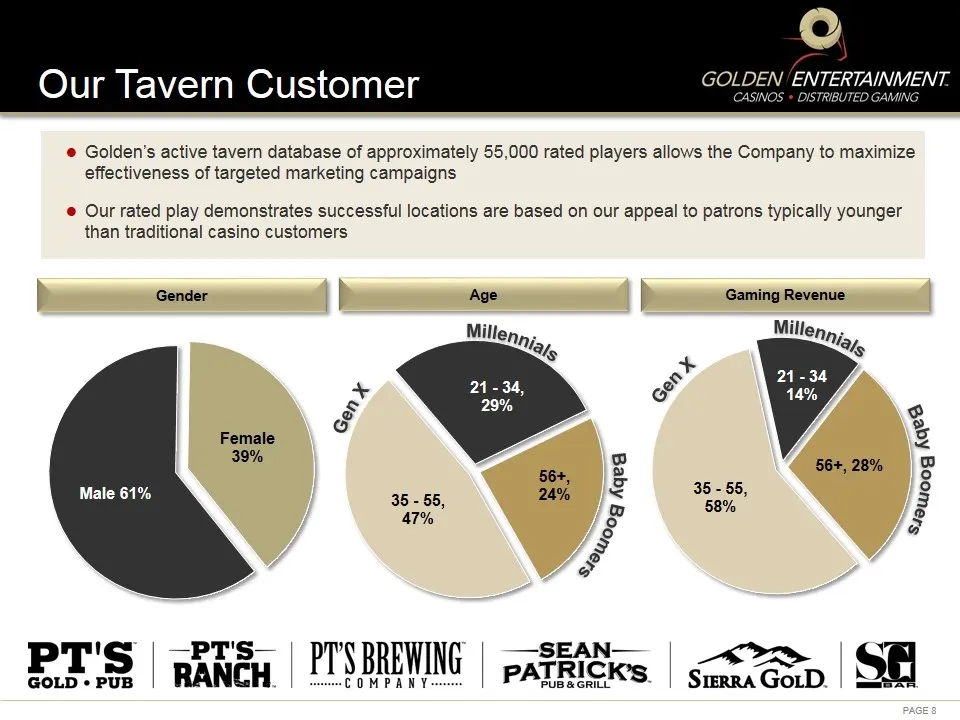
Our Tavern Customer Golden’s active tavern database of approximately 55,000 rated players allows the Company to maximize effectiveness of targeted marketing campaigns Our rated play demonstrates successful locations are based on our appeal to patrons typically younger than traditional casino custome
Slide 10: Nevada Casinos
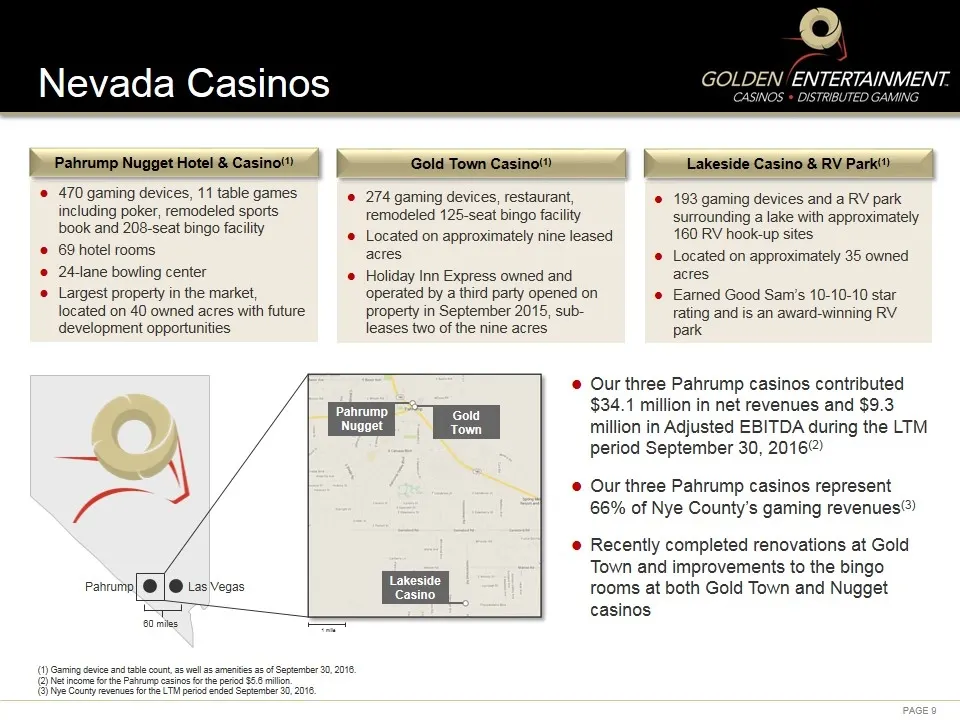
(1) Gaming device and table count, as well as amenities as of September 30, 2016. (2) Net income for the Pahrump casinos for the period $5.6 million. (3) Nye County revenues for the LTM period ended September 30, 2016. Nevada Casinos 470 gaming devices, 11 table games including poker, remodeled spor
Slide 11: Rocky Gap Casino Resort
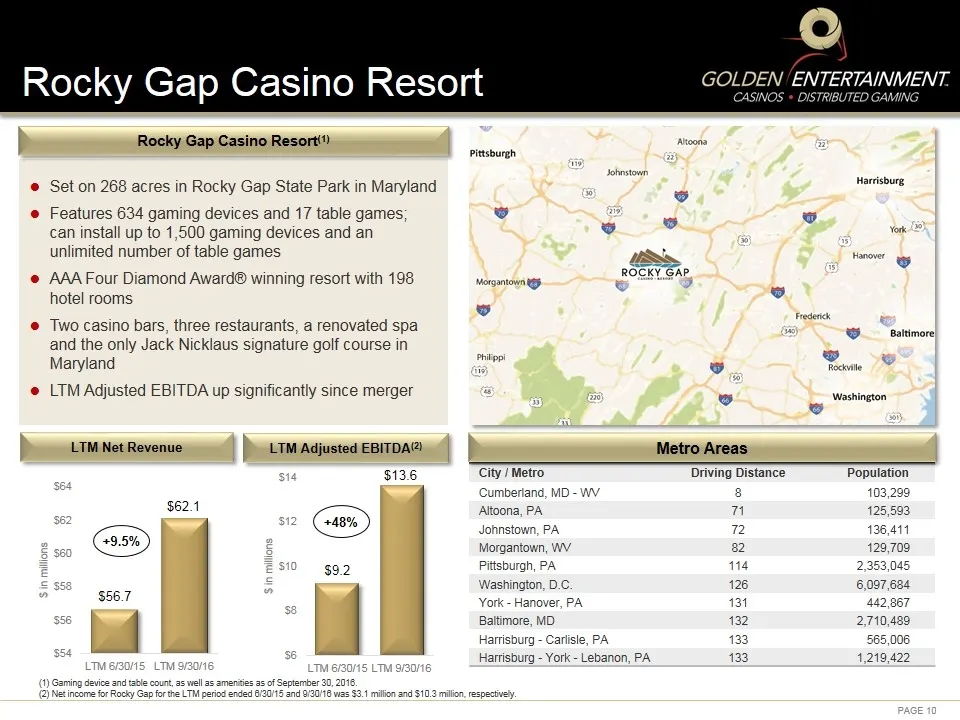
(1) Gaming device and table count, as well as amenities as of September 30, 2016. (2) Net income for Rocky Gap for the LTM period ended 6/30/15 and 9/30/16 was $3.1 million and $10.3 million, respectively. Rocky Gap Casino Resort Set on 268 acres in Rocky Gap State Park in Maryland Features 634 gami
Slide 12: Casino Properties
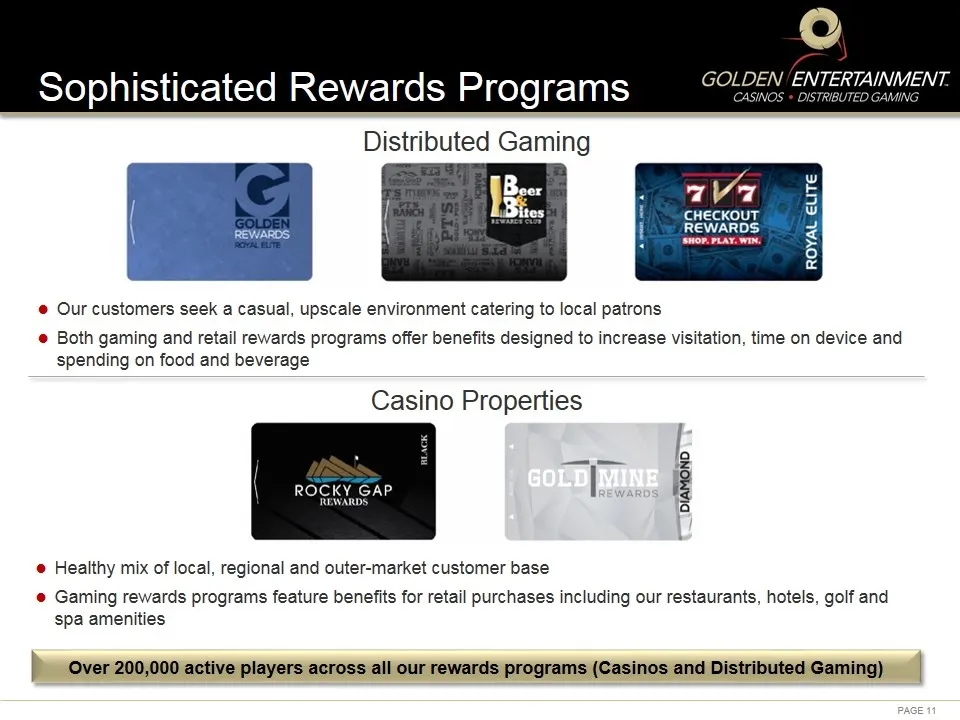
Casino Properties Healthy mix of local, regional and outer-market customer base Gaming rewards programs feature benefits for retail purchases including our restaurants, hotels, golf and spa amenities Sophisticated Rewards Programs Distributed Gaming Our customers seek a casual, upscale environment c
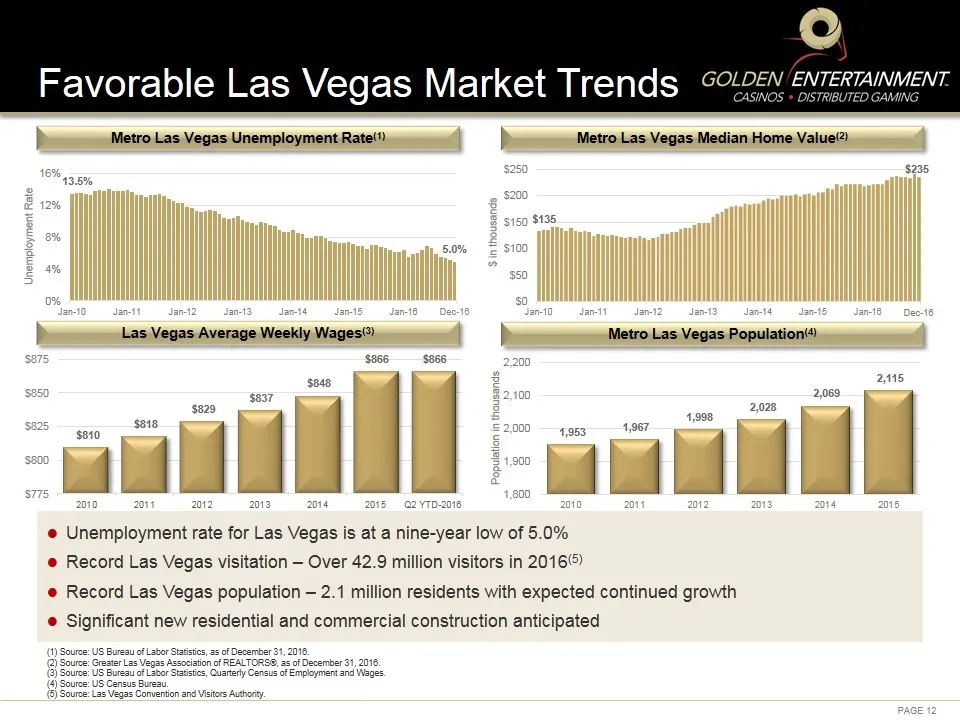
Slide 13: Favorable Las Vegas Market Trends
(1) Source: US Bureau of Labor Statistics, as of December 31, 2016. (2) Source: Greater Las Vegas Association of REALTORS®, as of December 31, 2016. (3) Source: US Bureau of Labor Statistics, Quarterly Census of Employment and Wages. (4) Source: US Census Bureau. (5) Source: Las Vegas Convention and
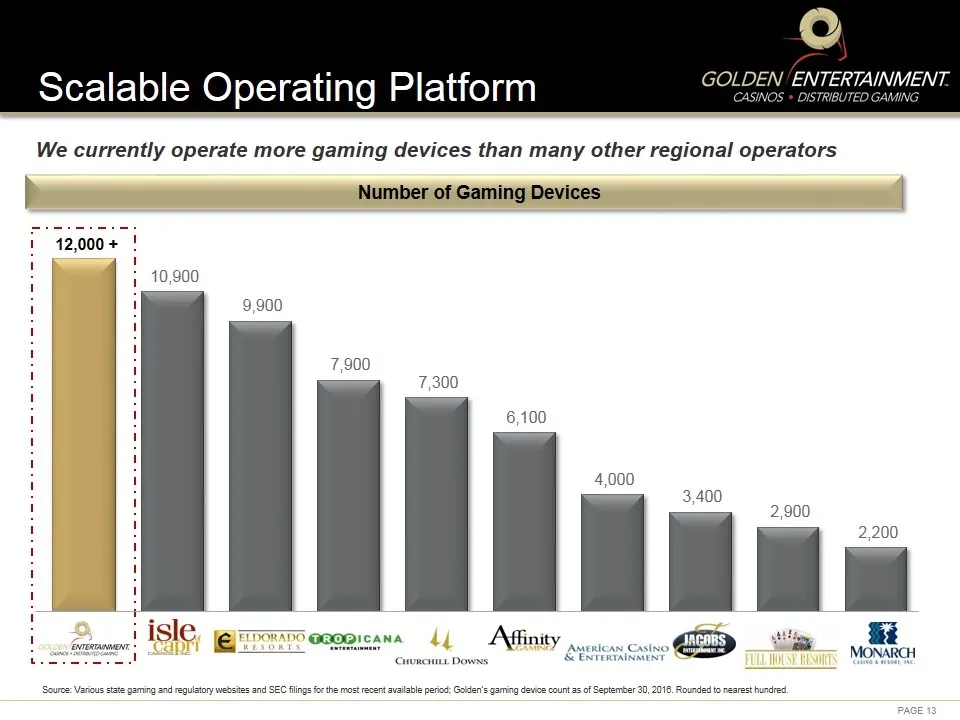
Slide 14: Scalable Operating Platform
Source: Various state gaming and regulatory websites and SEC filings for the most recent available period; Golden’s gaming device count as of September 30, 2016. Rounded to nearest hundred. Scalable Operating Platform We currently operate more gaming devices than many other regional operators Number
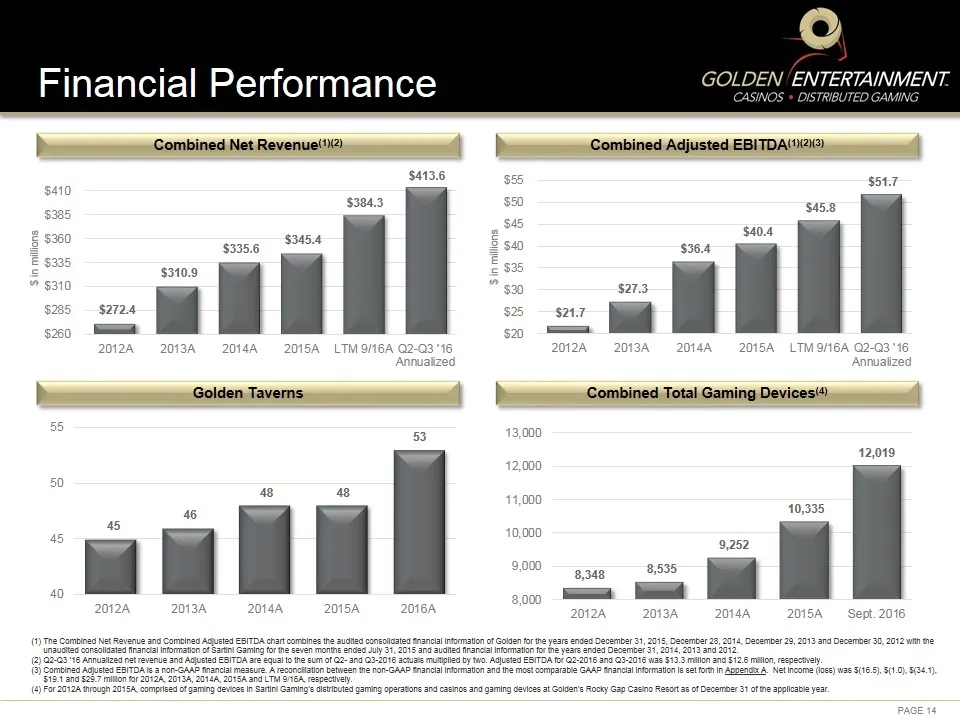
Slide 15: Combined Net Revenue and Adjusted EBITDA
(1) The Combined Net Revenue and Combined Adjusted EBITDA chart combines the audited consolidated financial information of Golden for the years ended December 31, 2015, December 28, 2014, December 29, 2013 and December 30, 2012 with the unaudited consolidated financial information of Sartini Gaming
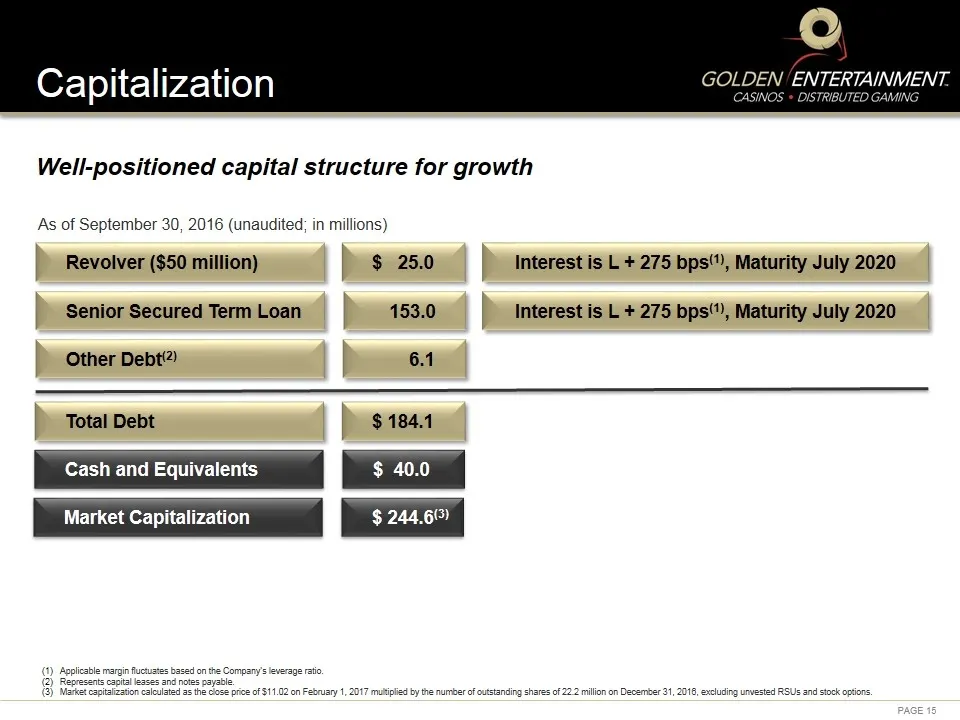
Slide 16: Capitalization
Capitalization Cash and Equivalents $ 40.0 Applicable margin fluctuates based on the Company’s leverage ratio. Represents capital leases and notes payable. Market capitalization calculated as the close price of $11.02 on February 1, 2017 multiplied by the number of outstanding shares of 22.2 million
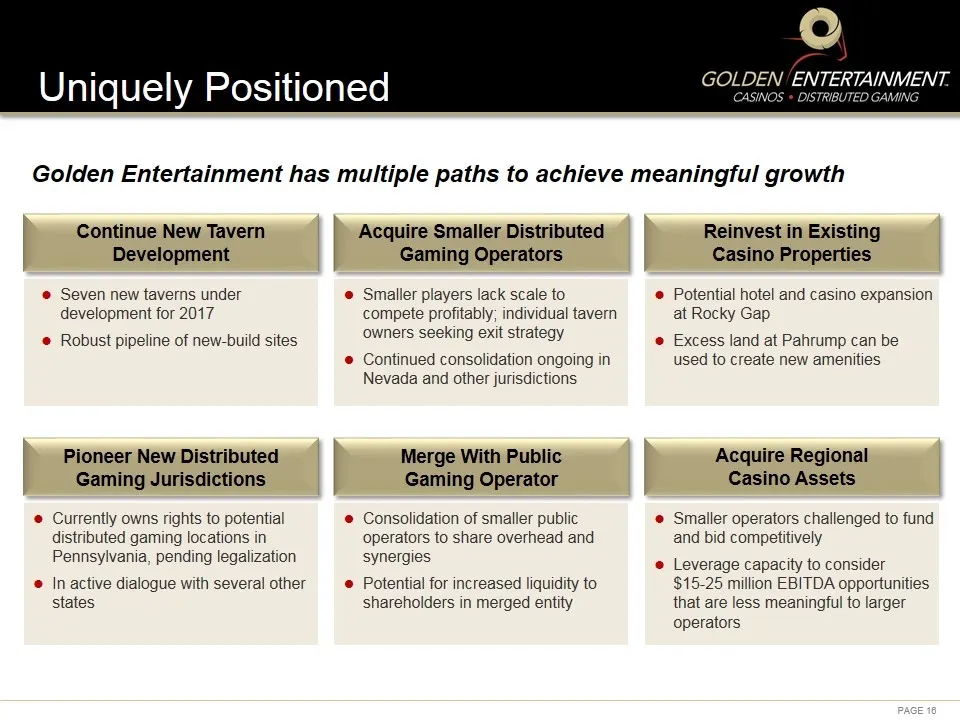
Slide 17: Uniquely Positioned
Uniquely Positioned Seven new taverns under development for 2017 Robust pipeline of new-build sites Smaller players lack scale to compete profitably; individual tavern owners seeking exit strategy Continued consolidation ongoing in Nevada and other jurisdictions Potential hotel and casino expansion
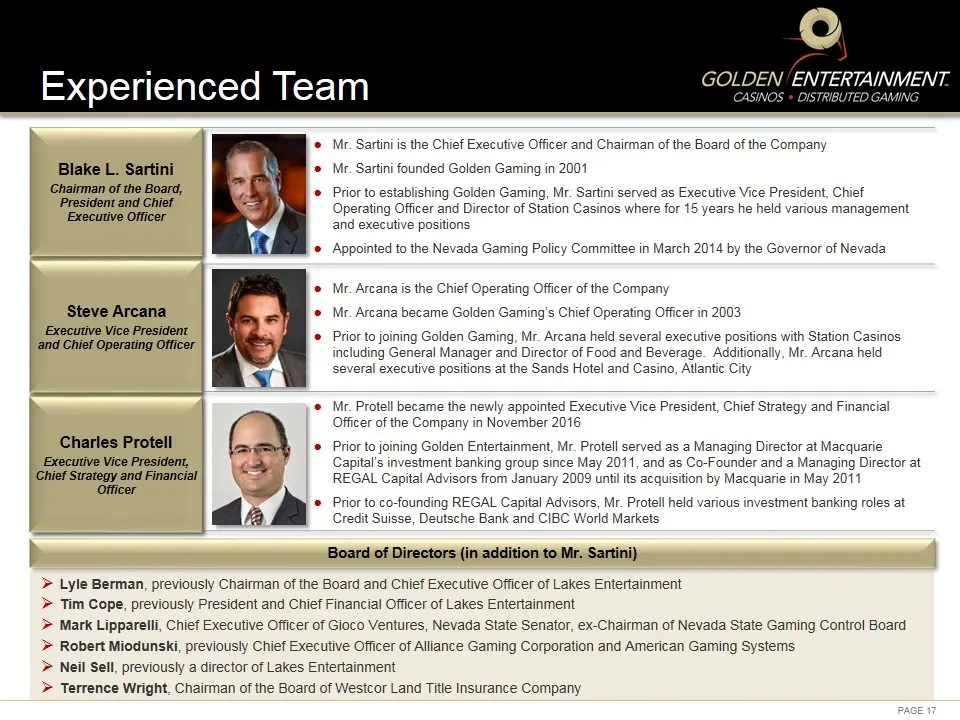
Slide 18: Management Team
Blake L. Sartini Chairman of the Board, President and Chief Executive Officer Mr. Sartini is the Chief Executive Officer and Chairman of the Board of the Company Mr. Sartini founded Golden Gaming in 2001 Prior to establishing Golden Gaming, Mr. Sartini served as Executive Vice President, Chief Opera
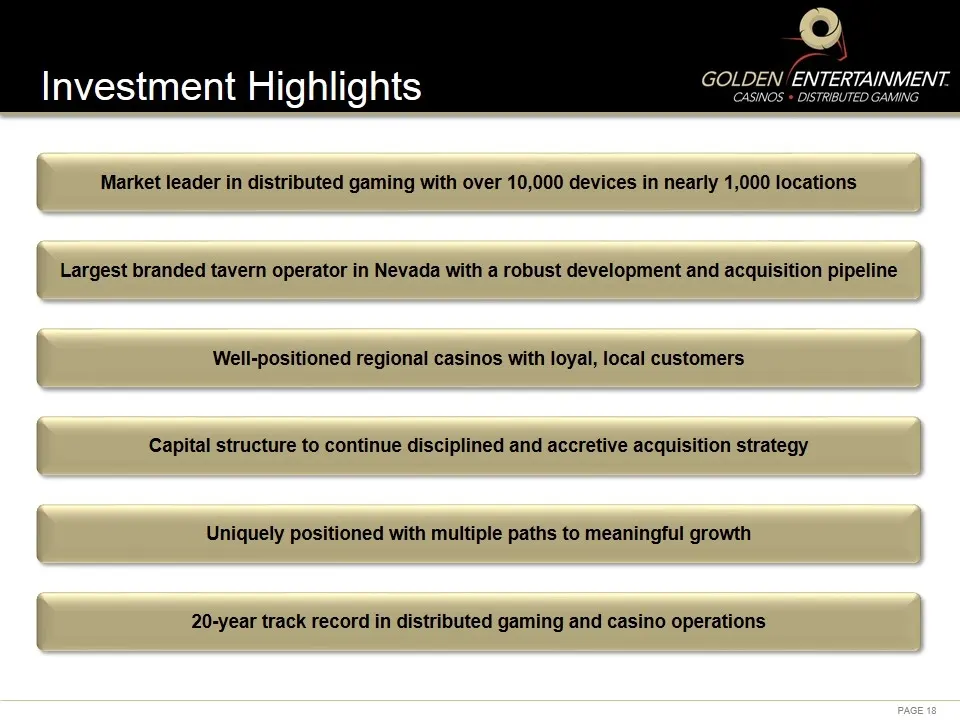
Slide 19: Investment Highlights
Investment Highlights Market leader in distributed gaming with over 10,000 devices in nearly 1,000 locations Largest branded tavern operator in Nevada with a robust development and acquisition pipeline Capital structure to continue disciplined and accretive acquisition strategy Uniquely positioned w
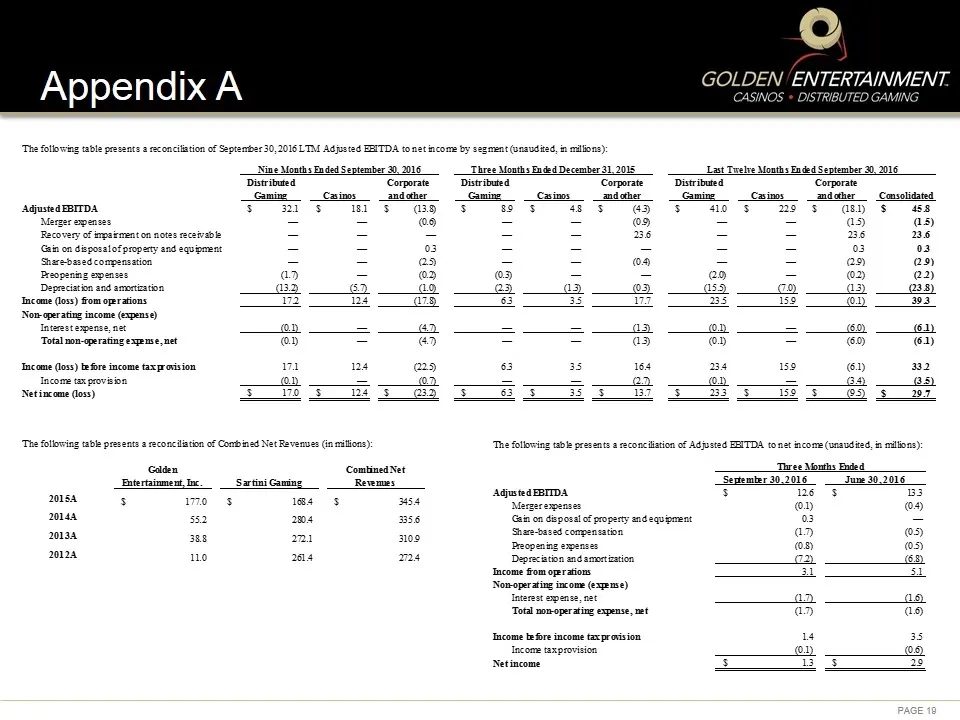
Slide 20: Appendix A
GOLDEN ‘ENTERTAINMENT. AS DISTRIBUTED GAMINC Appendix A Corporate andthe Tncame (ass) tere income tax raision 32 Income texproviion as) Netincame oss) Sr ‘Tires Mohs Ended Satini Gaming Seqeminr 302016 __ June 30.2016 16 Bs mua a ny bey ase 2 : aah ai prea 3 ae Tncome tefre income tp avision Income
Slide 21: Appendix A (continued)
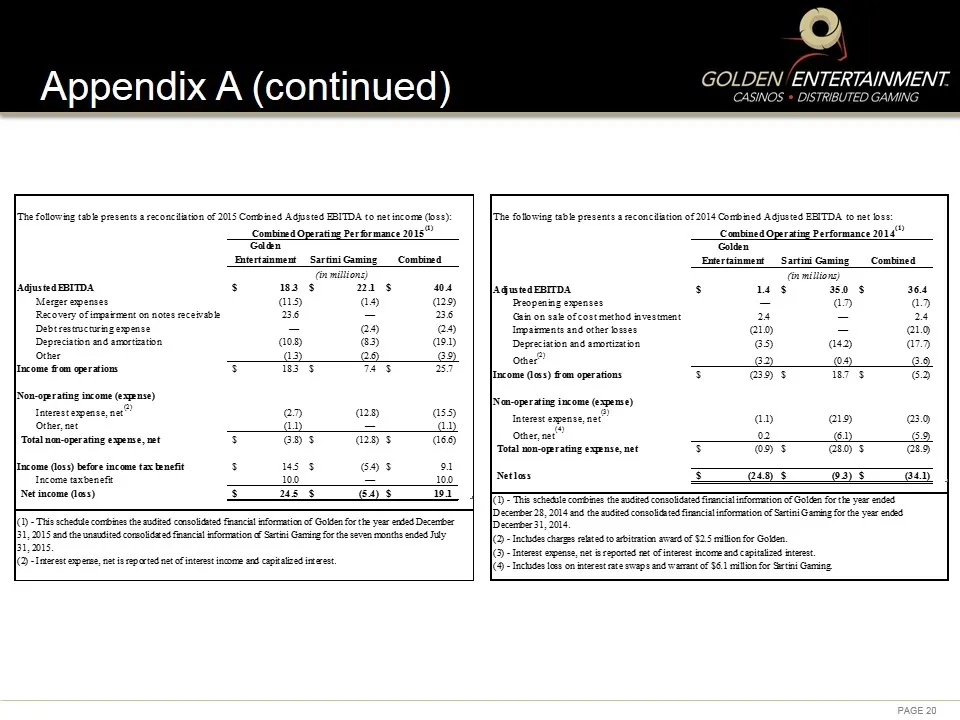
GOLDEN) EN TERTAINMENT. Appendix A (continued) Combined Operating Performance 2015” Combined Operating Performance 2014" = oo ea aeons ote elit secs “cous a — =: -_ oe [Income (loss) from operations en . aig Longue f [$an-operating income (expense) = = ‘Toa ‘on-oprrating expense, net cD |Decentber 3
Slide 22: Appendix A (continued)
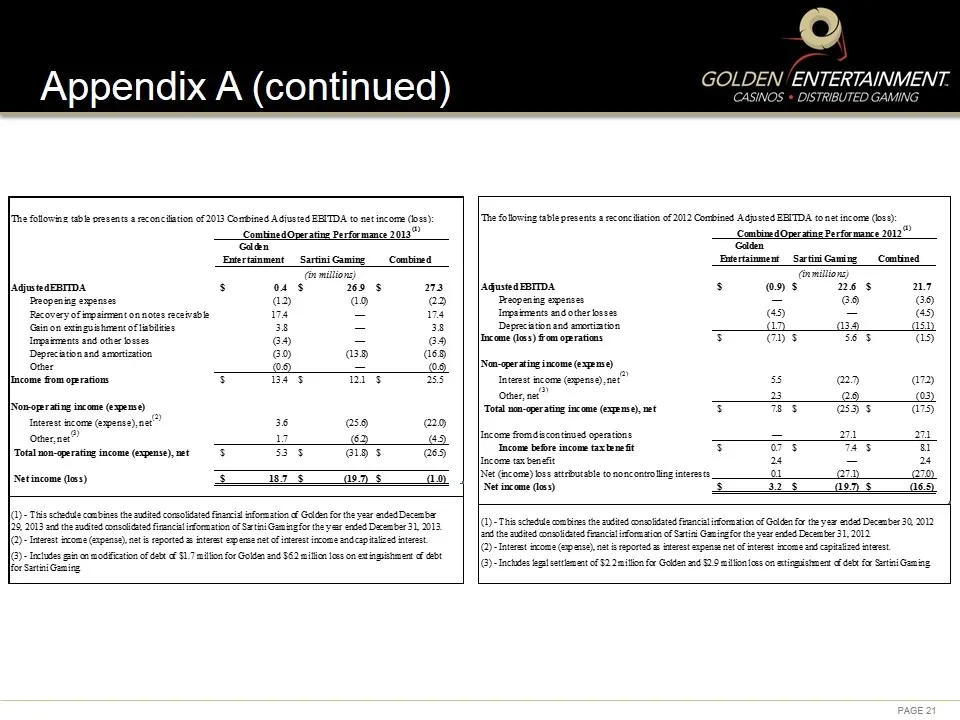
Appendix A (continued) GOLDEN ‘ENTERTAINMENT. CASINOS + DISTRIBUTED GAMING “ fncome om oprations fNomoperating income (expense) Interest ncoms (expense), ae ‘Total non operating income (expense), net ‘Netincome dass) AgustedEBIDA Pe ‘Combine Oper sine Performance 2012" aiden Enertainment SartiniGami
Source: SEC EDGAR · 8-K filed Feb 2, 2017
More decks from Golden Entertainment Inc
 Merger or Acquisition (November 2025)16 slides · Nov 6, 2025
 Investor Presentation (May 2025)21 slides · May 8, 2025
 Merger or Acquisition (June 2017)16 slides · Jun 12, 2017
 Investor Presentation (May 2017)20 slides · May 10, 2017
 Investor Presentation (May 2016)29 slides · May 16, 2016
 Investor Presentation (September 2015)22 slides · Sep 21, 2015