OUTFRONT Media Inc. · NYSE:OUT
OUTFRONT Media — Q2 2015 Earnings Presentation
29 slides from OUTFRONT Media's earnings presentation, Aug 6, 2015
Slide 1: Second Quarter 2015
2015 Second Quarter August 6, 2015
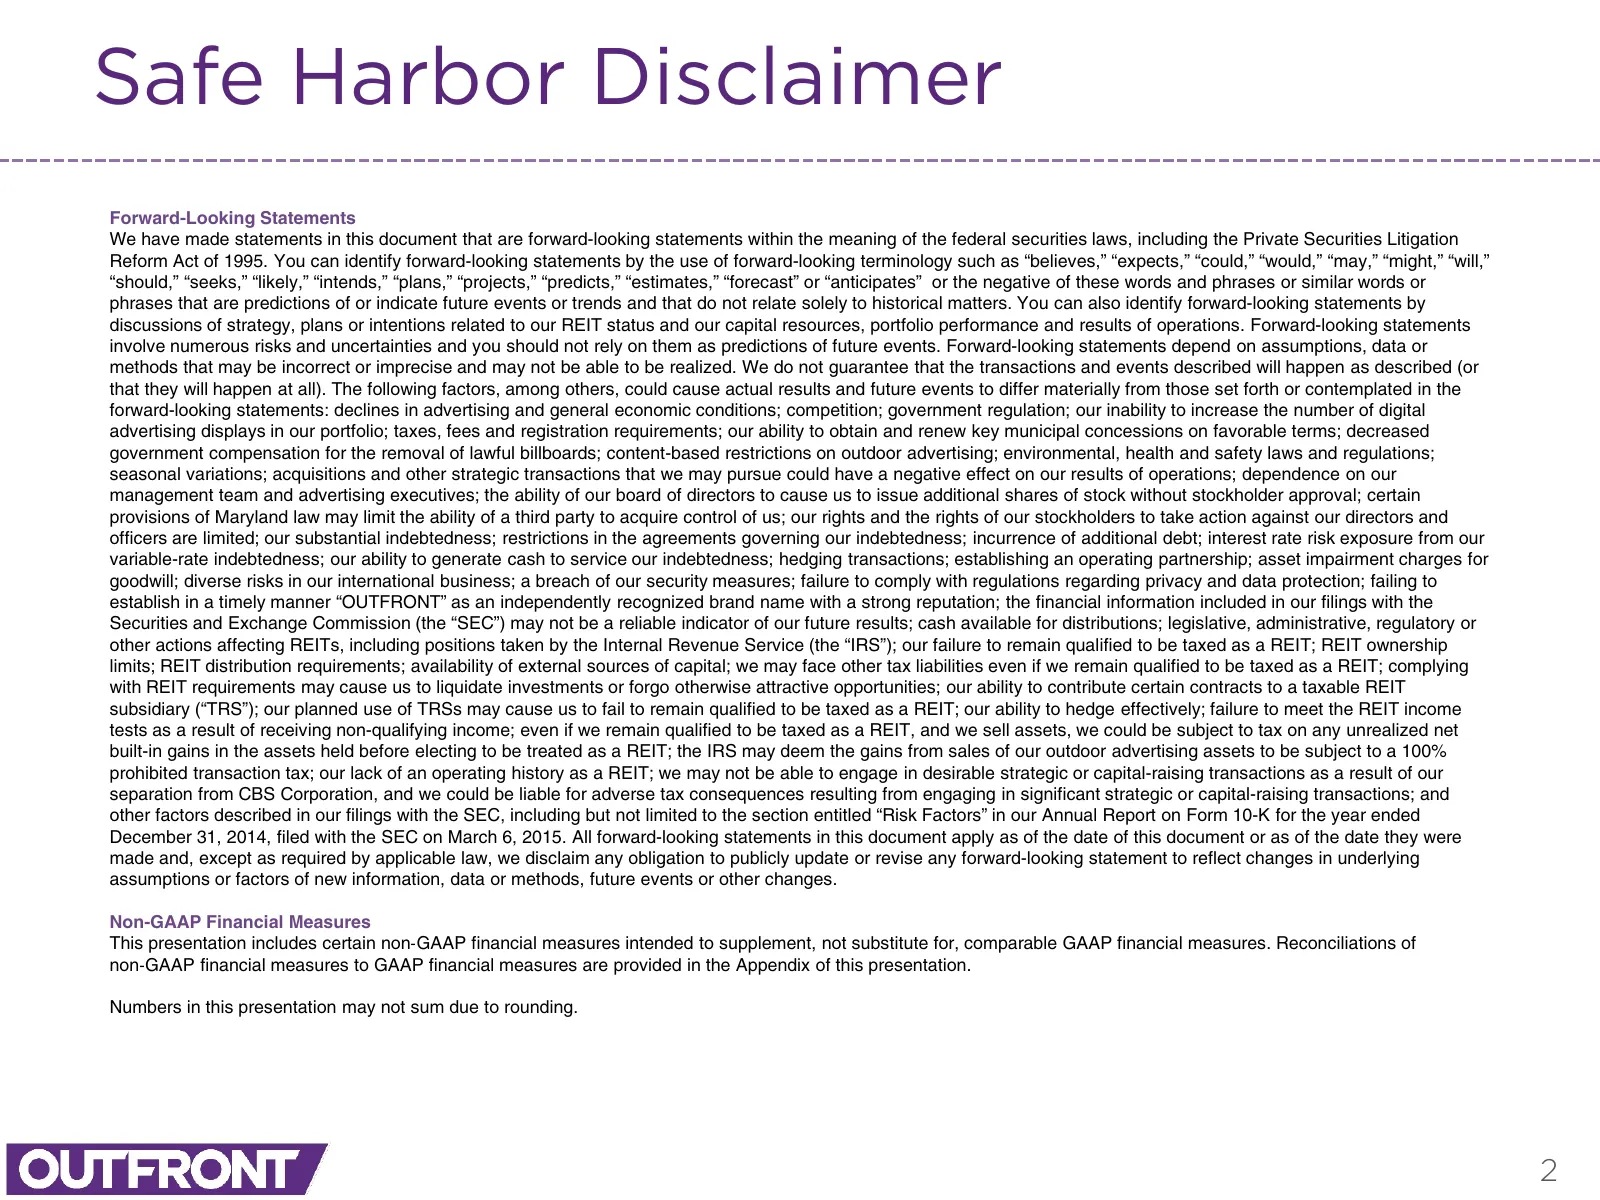
Slide 2: Safe Harbor Disclaimer
Safe Harbor Disclaimer Forward-Looking Statements We have made statements in this document that are forward-looking statements within the meaning of the federal securities laws, including the Private Securities Litigation Reform Act of 1995. You can identify forward-looking statements by the use of

Slide 3: Jeremy Male, CEO
Jeremy Male CEO 3
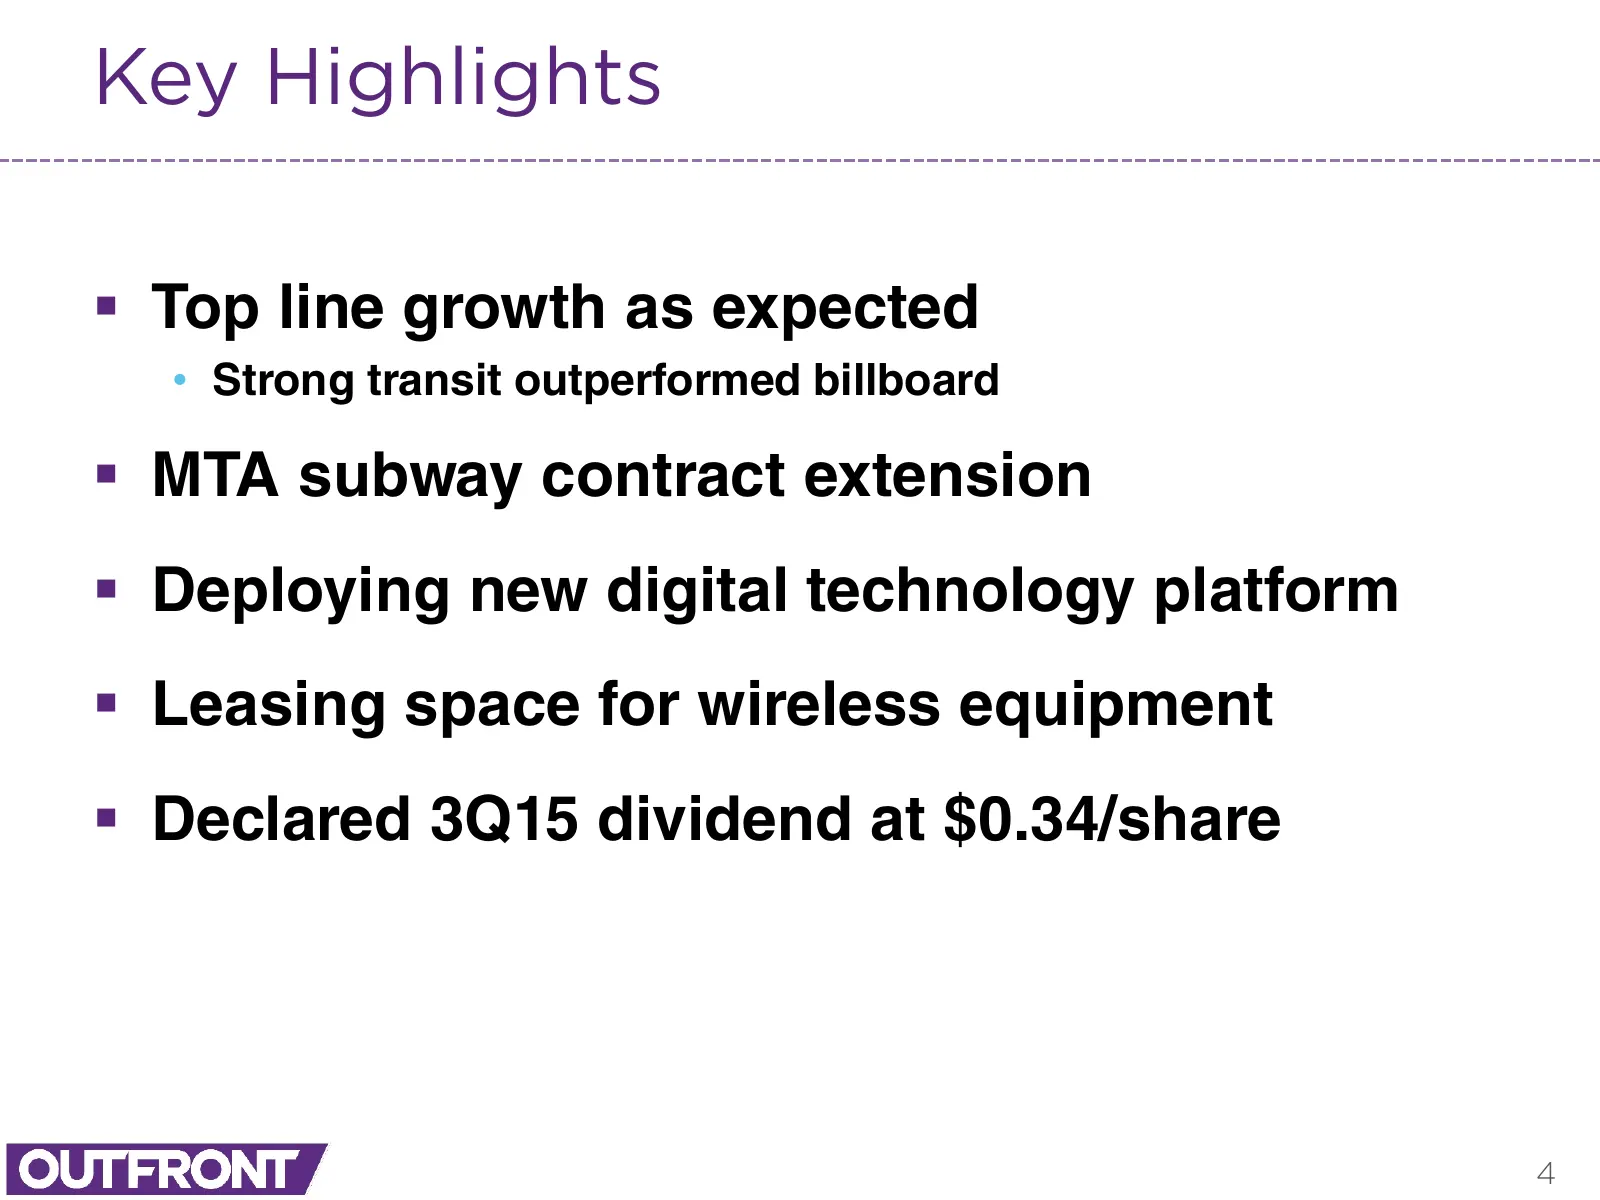
Slide 4: Key Highlights
Key Highlights Top line growth as expected • Strong transit outperformed billboard MTA subway contract extension Deploying new digital technology platform Leasing space for wireless equipment Declared 3Q15 dividend at $0.34/share 4
Slide 5: Donald Shassian, EVP & CFO
Donald Shassian EVP & CFO 5
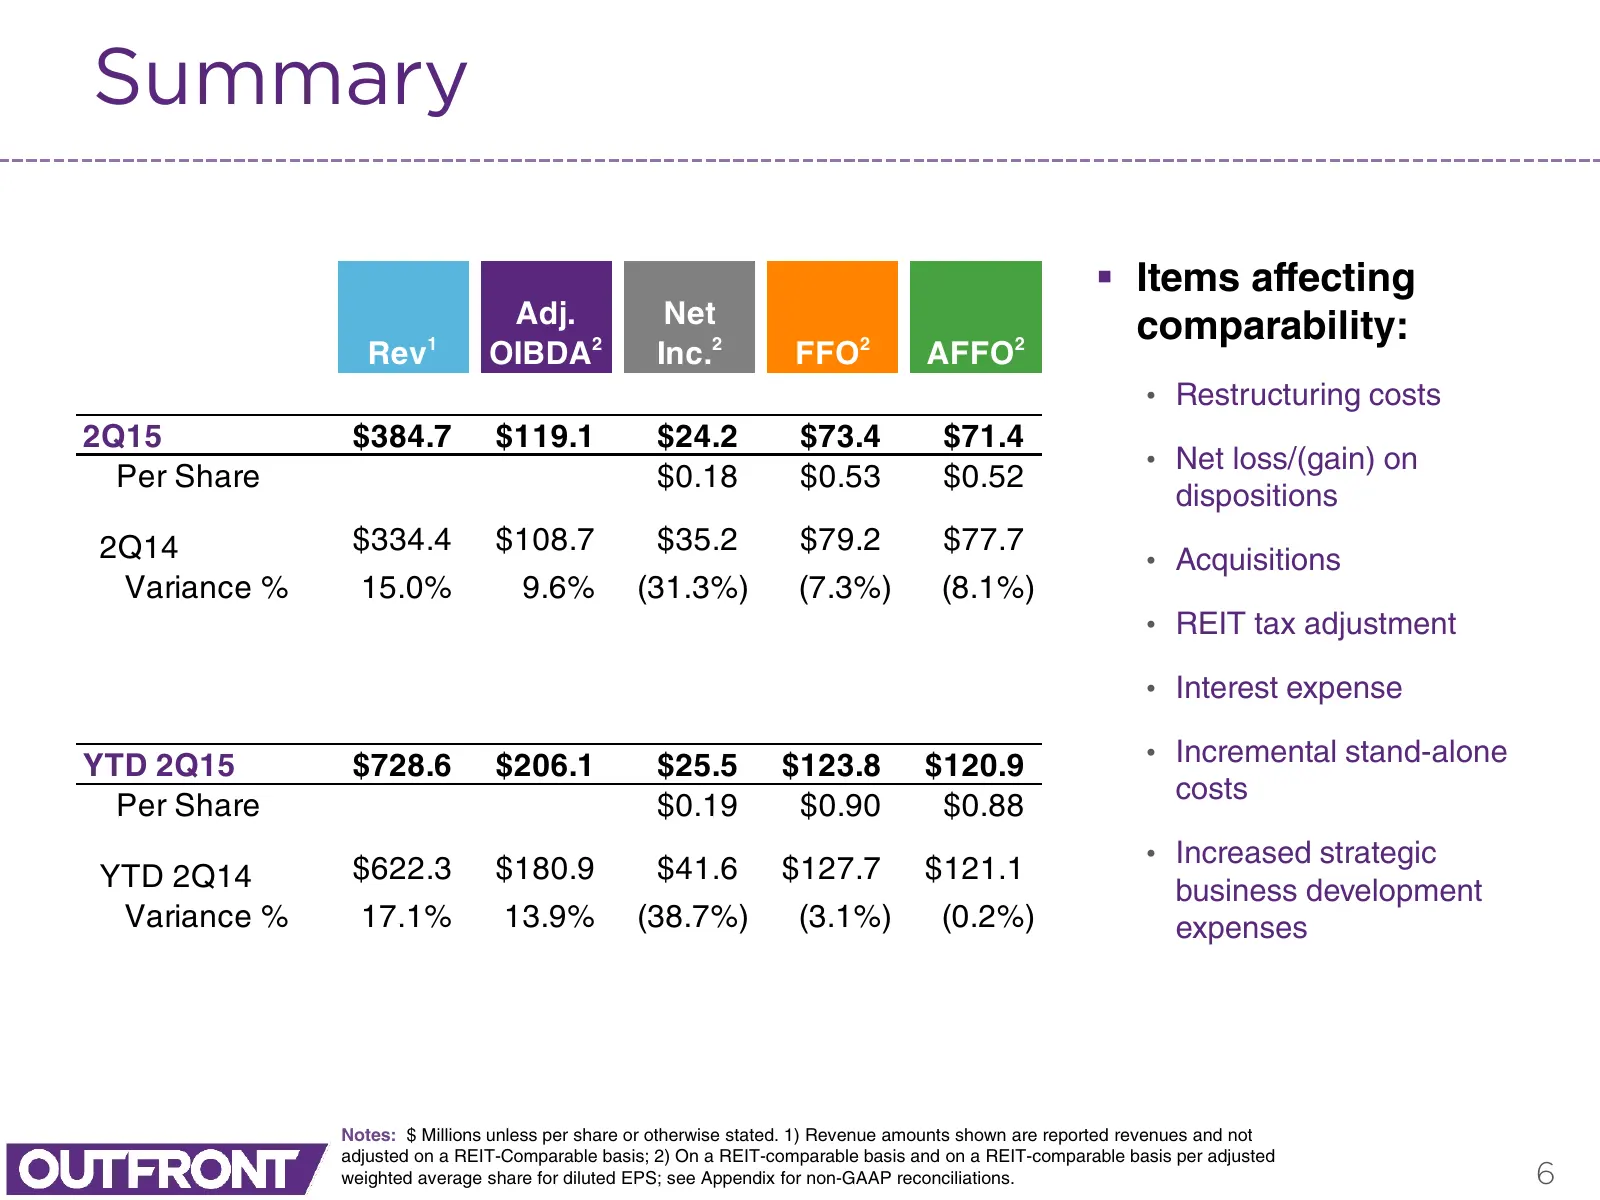
Slide 6: Summary
Summary Items affecting Adj. Net comparability: 1 Rev OIBDA2 Inc.2 FFO2 AFFO2 • Restructuring costs 2Q15 $384.7 $119.1 $24.2 $73.4 $71.4 • Net loss/(gain) on Per Share $0.18 $0.53 $0.52 dispositions 2Q14 $334.4 $108.7 $35.2 $79.2 $77.7 • Acquisitions Variance % 15.0% 9.6% (31.3%) (7.3%) (8.1%) • R
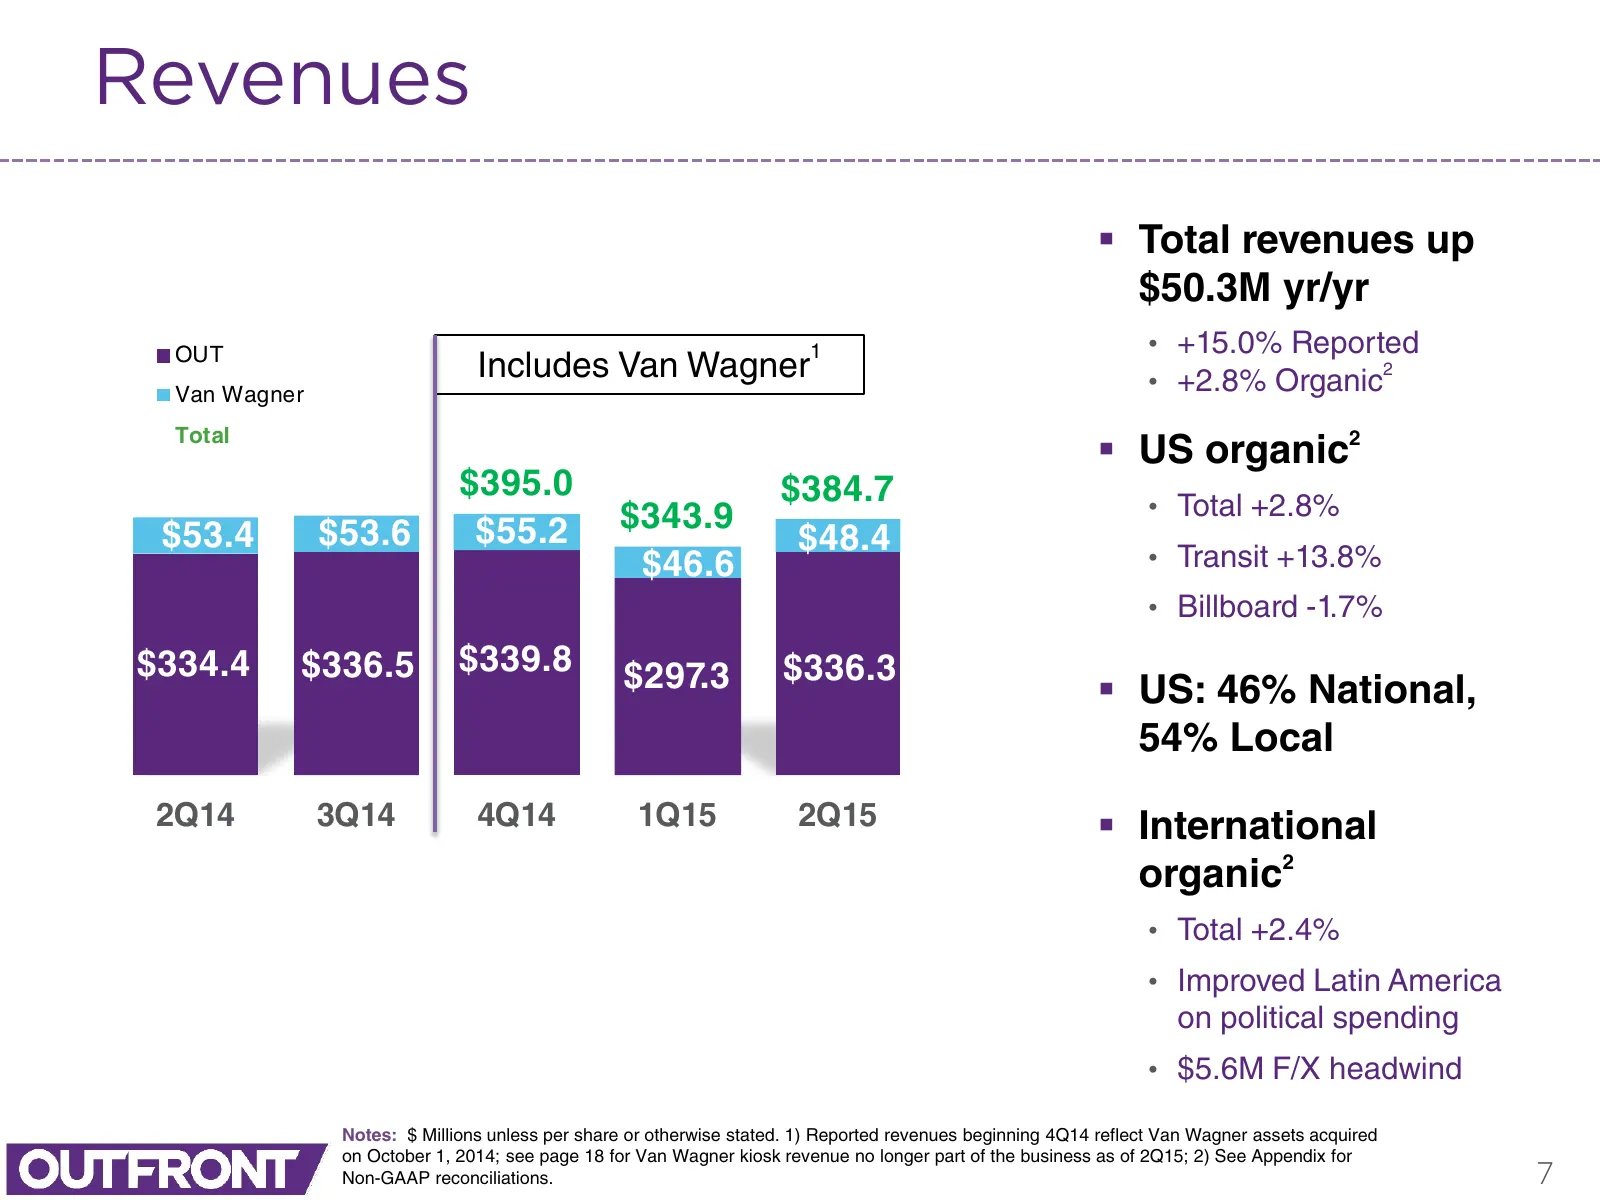
Slide 7: Revenues
Revenues Total revenues up $50.3M yr/yr OUT 1 • +15.0% Reported Includes Van Wagner • +2.8% Organic 2 Van Wagner Total US organic2 $395.0 $384.7 $343.9 • Total +2.8% $53.4 $53.6 $55.2 $48.4 $46.6 • Transit +13.8% • Billboard -1.7% $334.4 $336.5 $339.8 $297.3 $336.3 US: 46% National, 54% Local
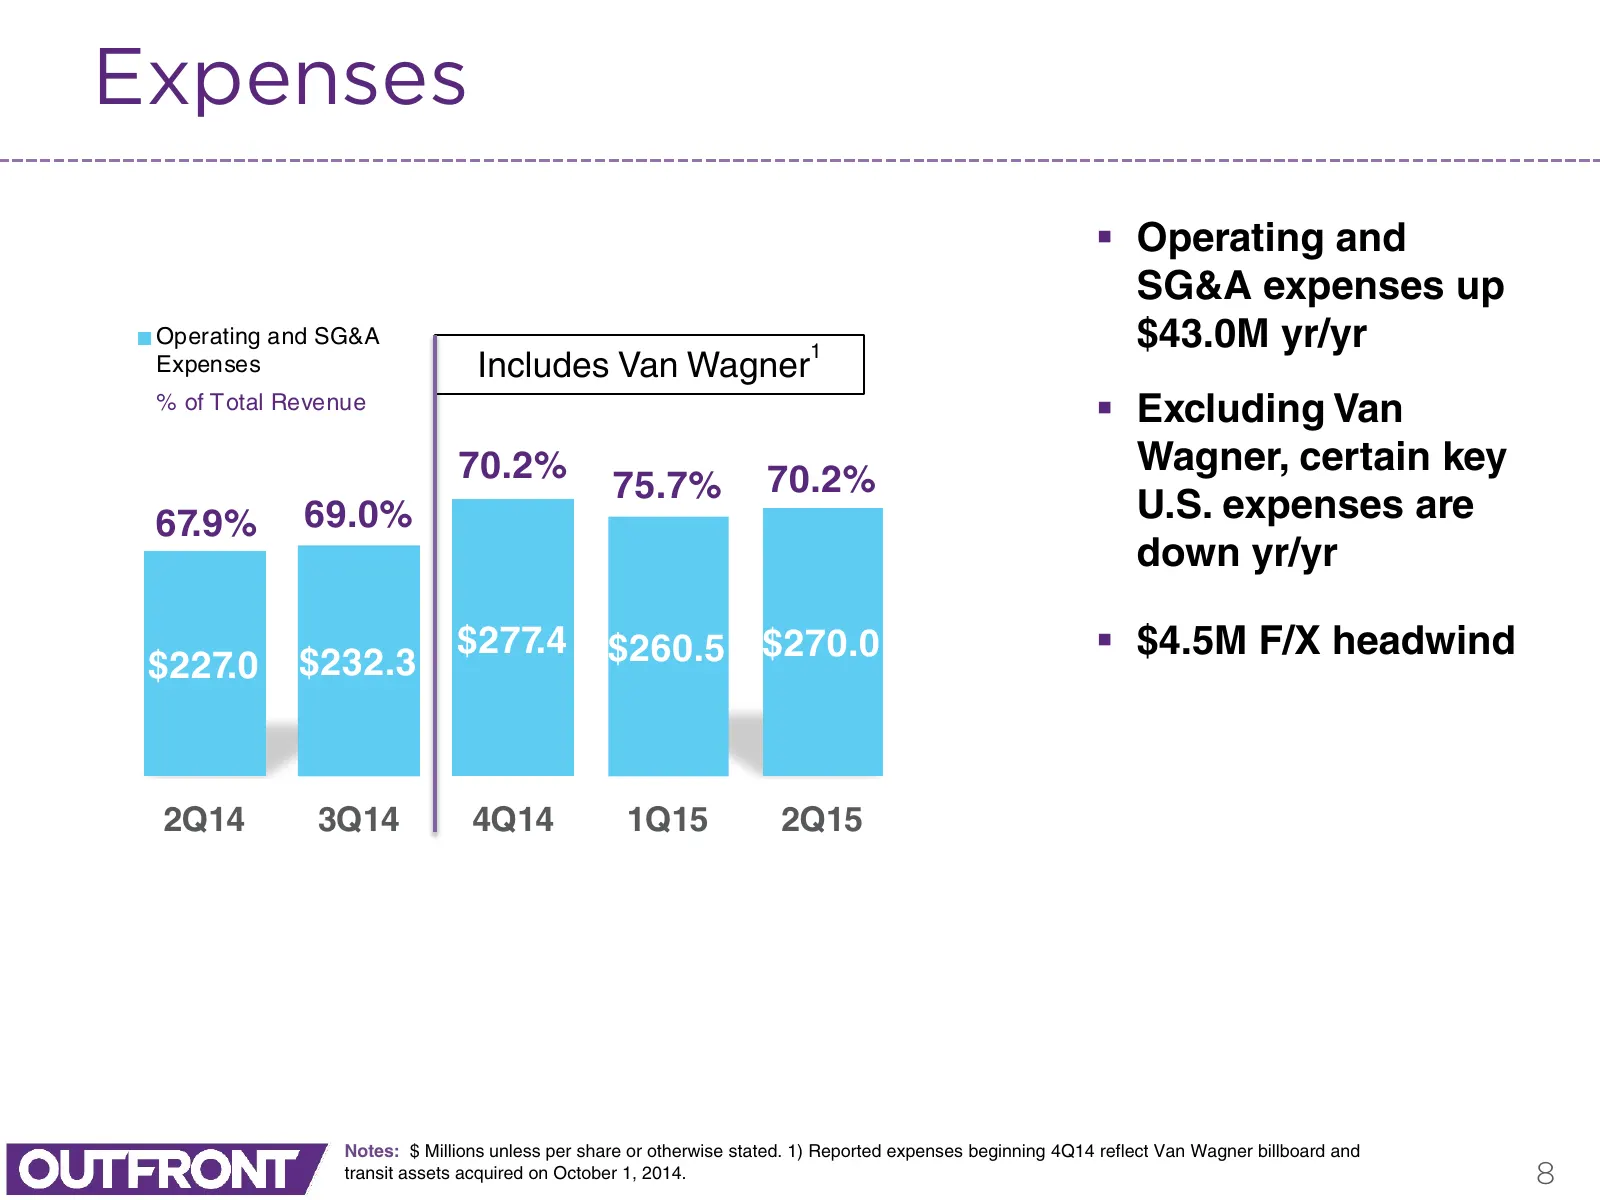
Slide 8: Expenses
Expenses Operating and SG&A expenses up Operating and SG&A 1 $43.0M yr/yr Expenses Includes Van Wagner % of Total Revenue Excluding Van 70.2% Wagner, certain key 75.7% 70.2% 67.9% 69.0% U.S. expenses are down yr/yr $277.4 $260.5 $270.0 $4.5M F/X headwind $227.0 $232.3 2Q14 3Q14 4Q14 1Q15 2Q15
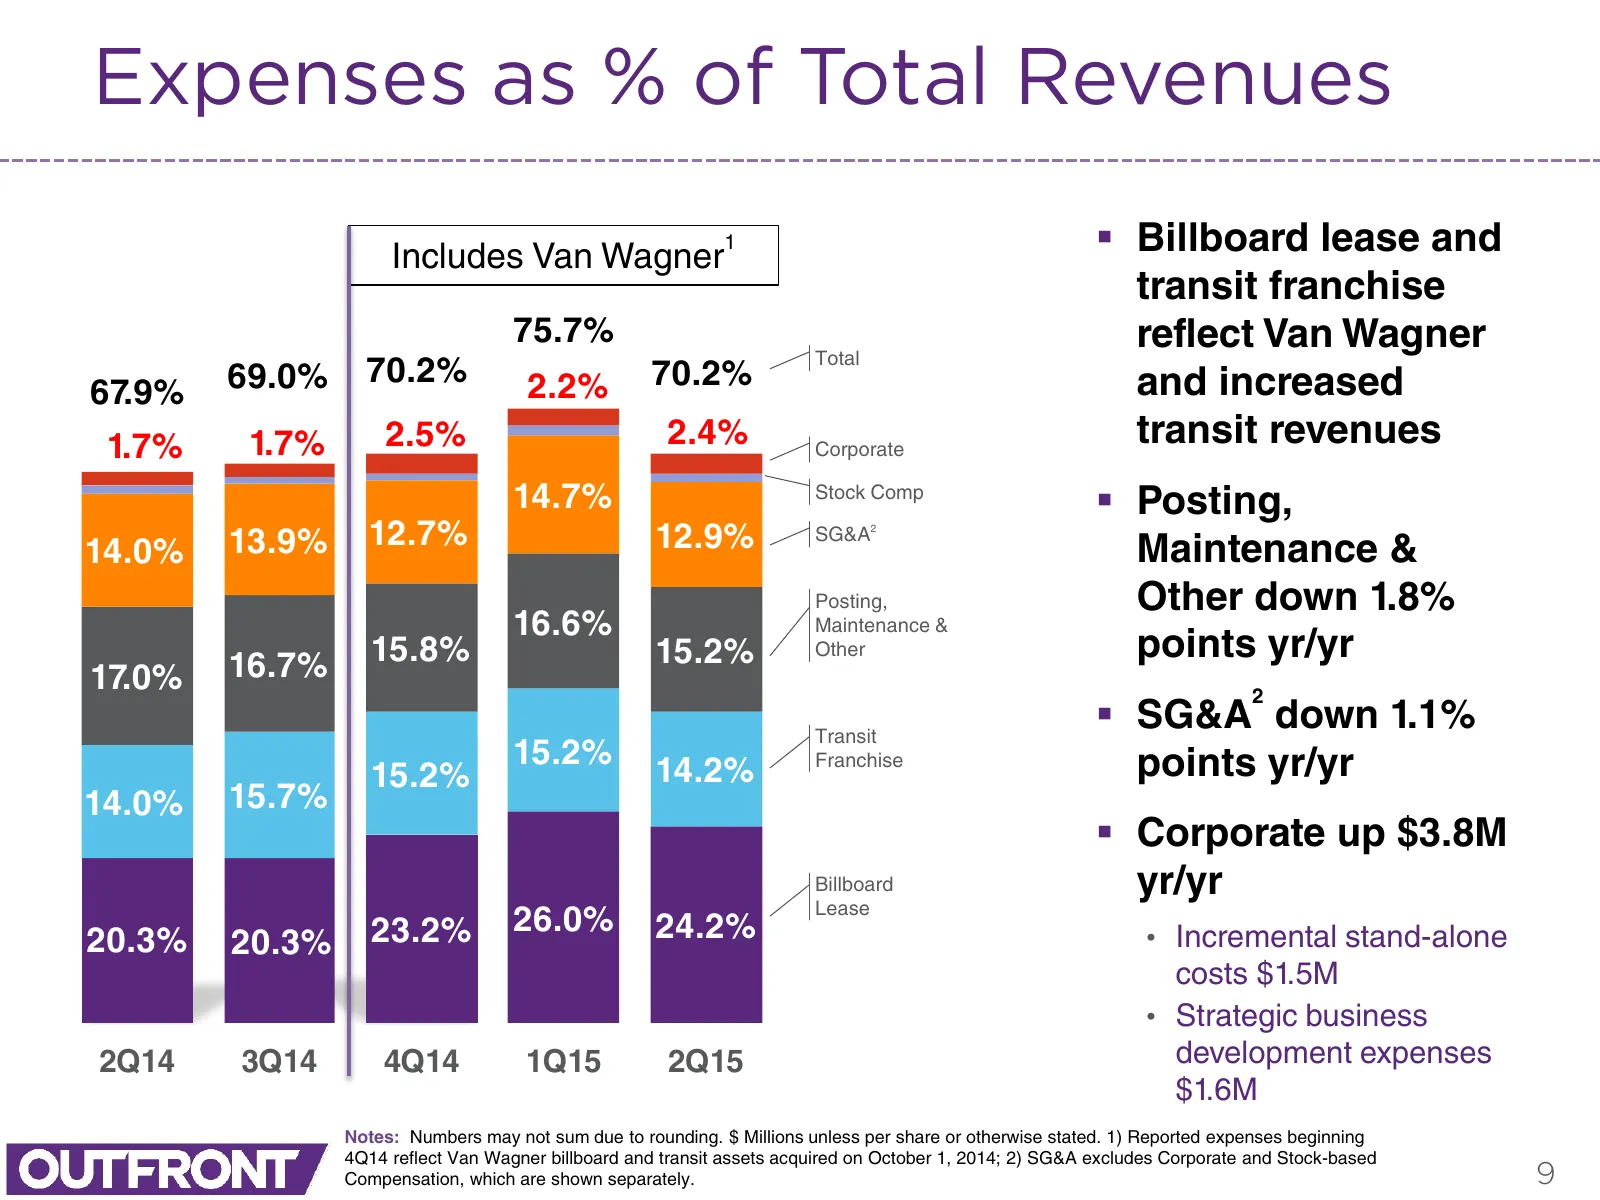
Slide 9: Expenses as % of Total Revenues
Expenses as % of Total Revenues Includes Van Wagner 1 Billboard lease and transit franchise 75.7% reflect Van Wagner Total 69.0% 70.2% 2.2% 70.2% and increased 67.9% 1.7% 1.7% 2.5% 2.4% Corporate transit revenues 14.7% Stock Comp Posting, 13.9% 12.7% 12.9% SG&A2 Maintenance & 14.0% Posting, Othe
Slide 10: Adjusted OIBDA
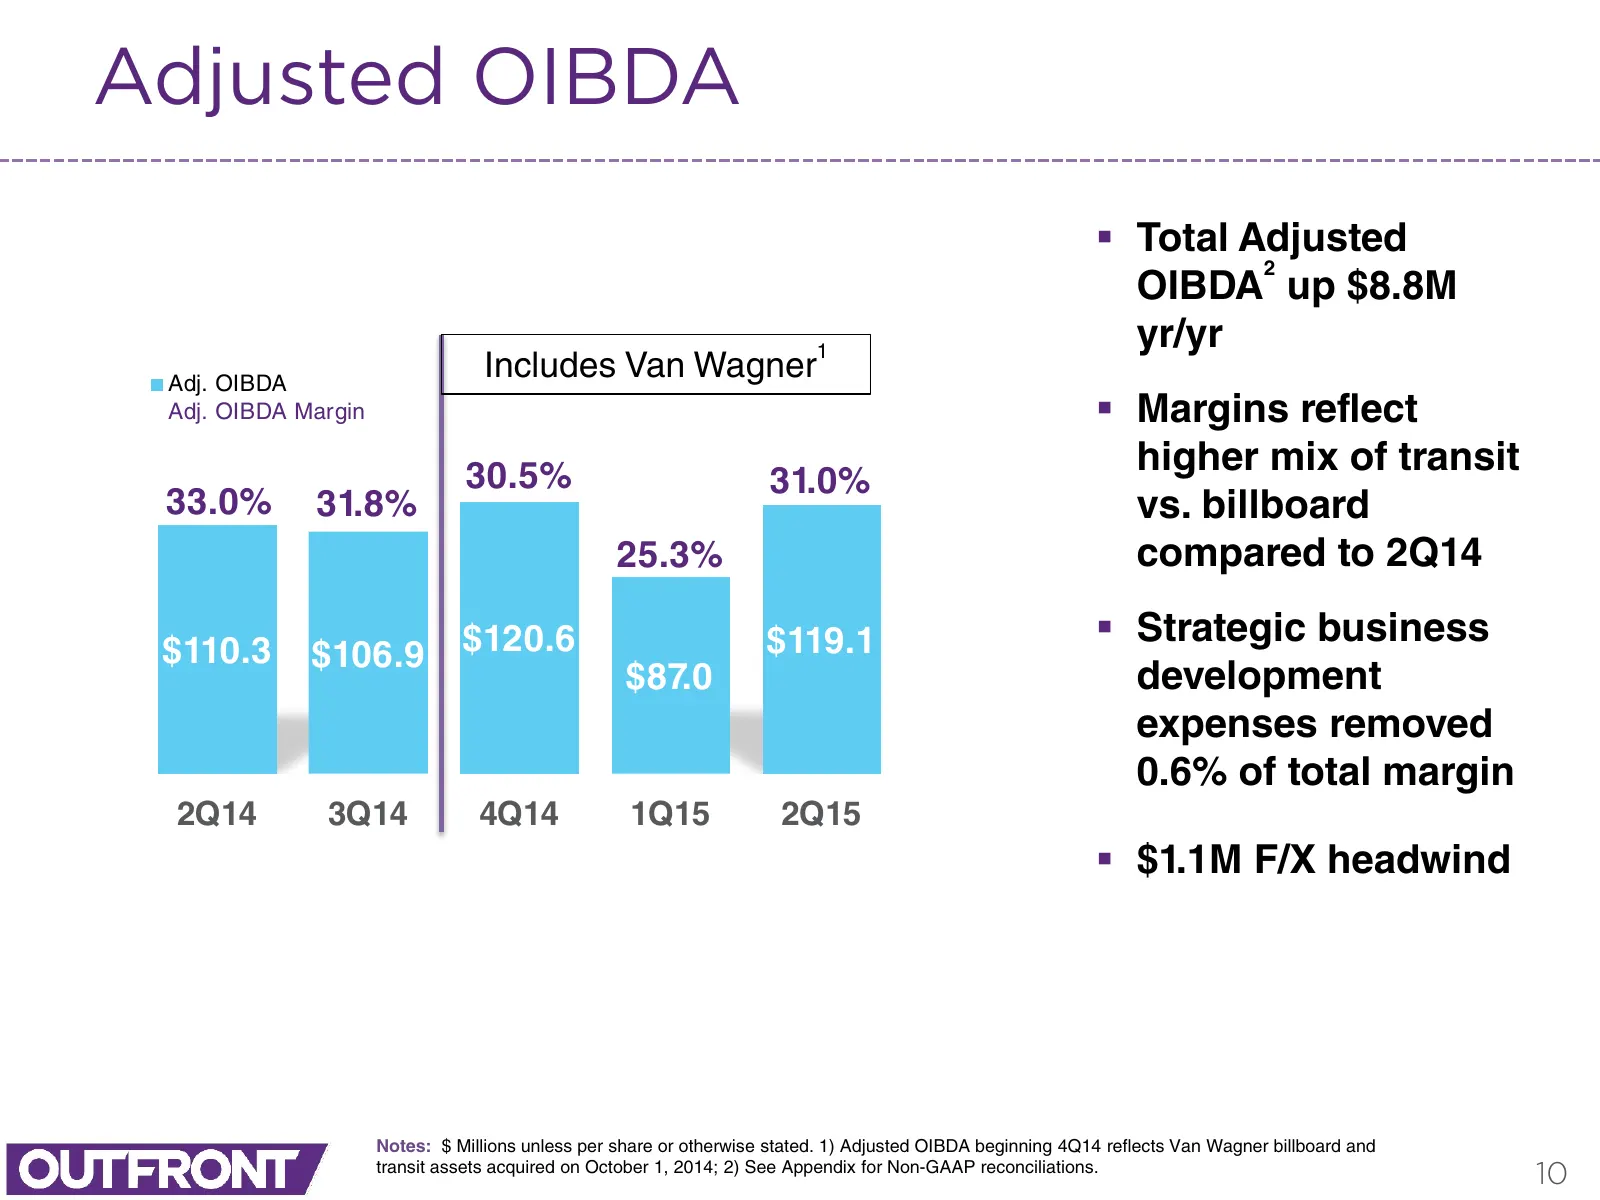
Adjusted OIBDA Total Adjusted 2 OIBDA up $8.8M 1 yr/yr Adj. OIBDA Includes Van Wagner Adj. OIBDA Margin Margins reflect 30.5% higher mix of transit 31.0% 33.0% 31.8% vs. billboard 25.3% compared to 2Q14 $120.6 $119.1 Strategic business $110.3 $106.9 $87.0 development expenses removed 0.6% of t
Slide 11: Capital Expenditures
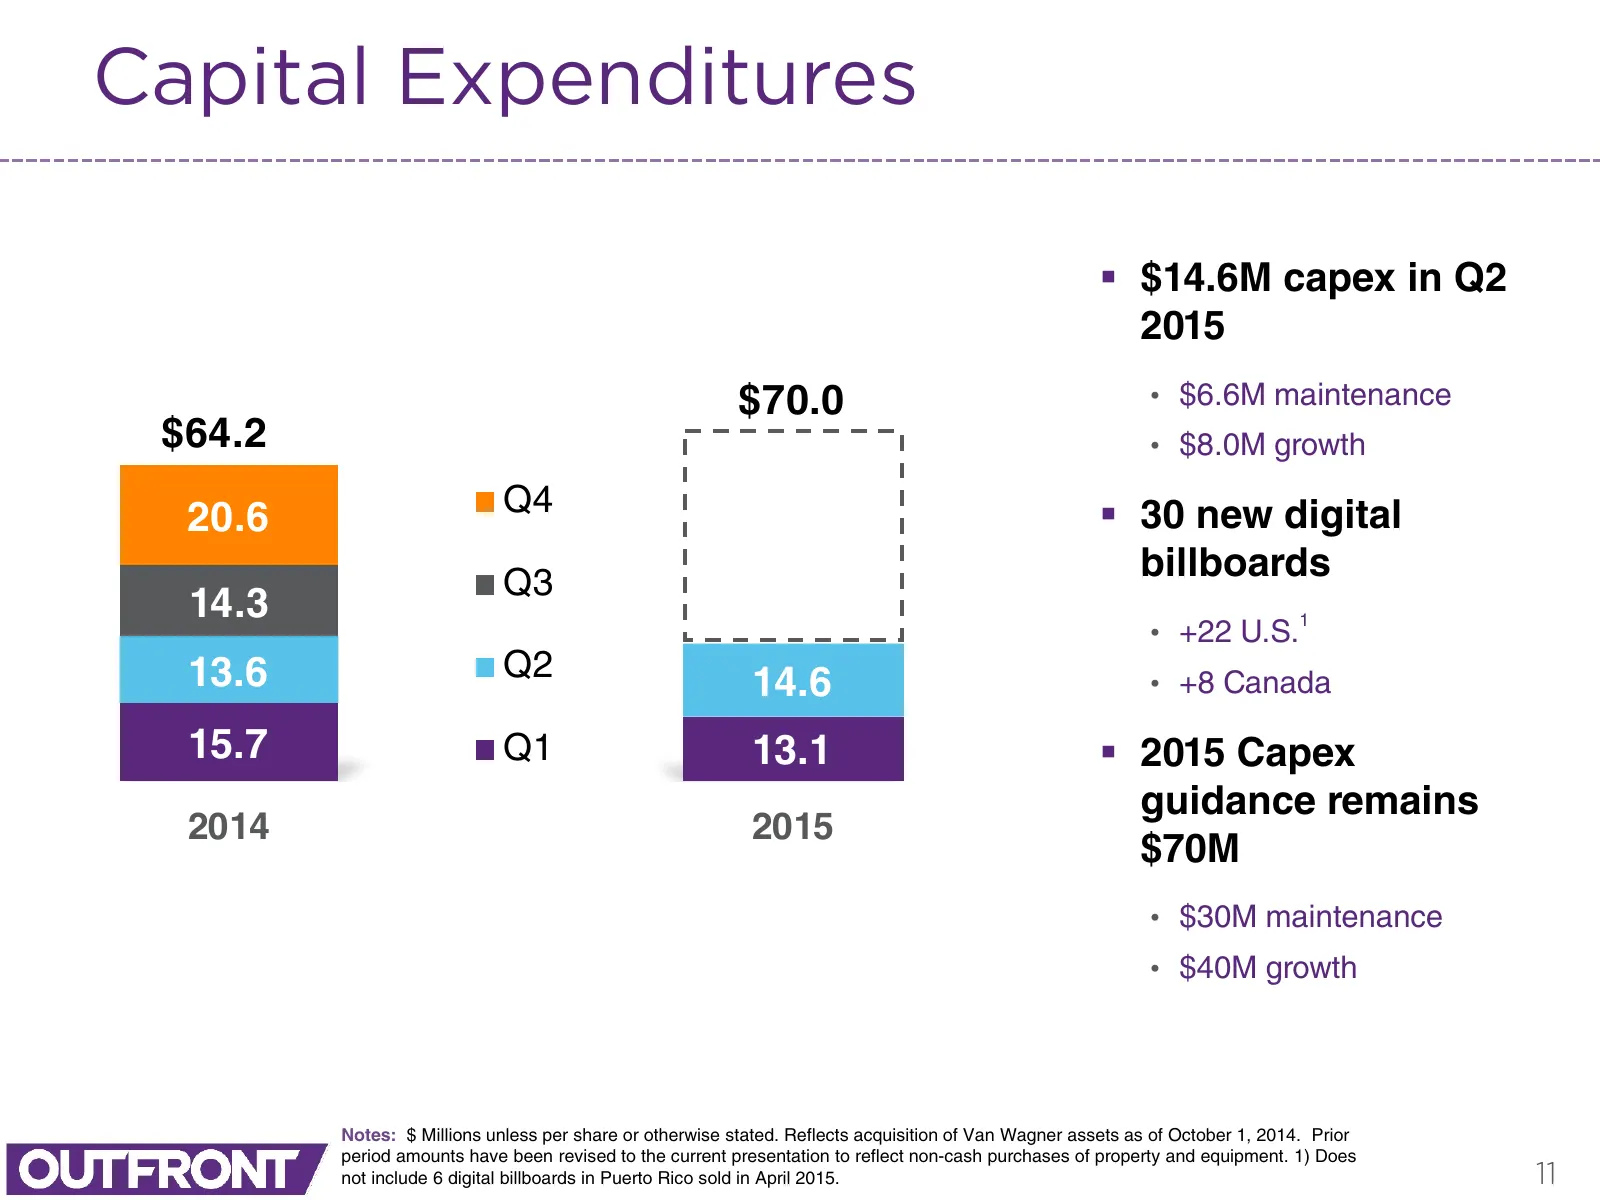
Capital Expenditures $14.6M capex in Q2 2015 $70.0 • $6.6M maintenance $64.2 • $8.0M growth 20.6 Q4 30 new digital Q3 billboards 14.3 1 • +22 U.S. 13.6 Q2 14.6 • +8 Canada 15.7 Q1 13.1 2015 Capex guidance remains 2014 2015 $70M • $30M maintenance • $40M growth Notes: $ Millions unless per shar
Slide 12: Cash Flow
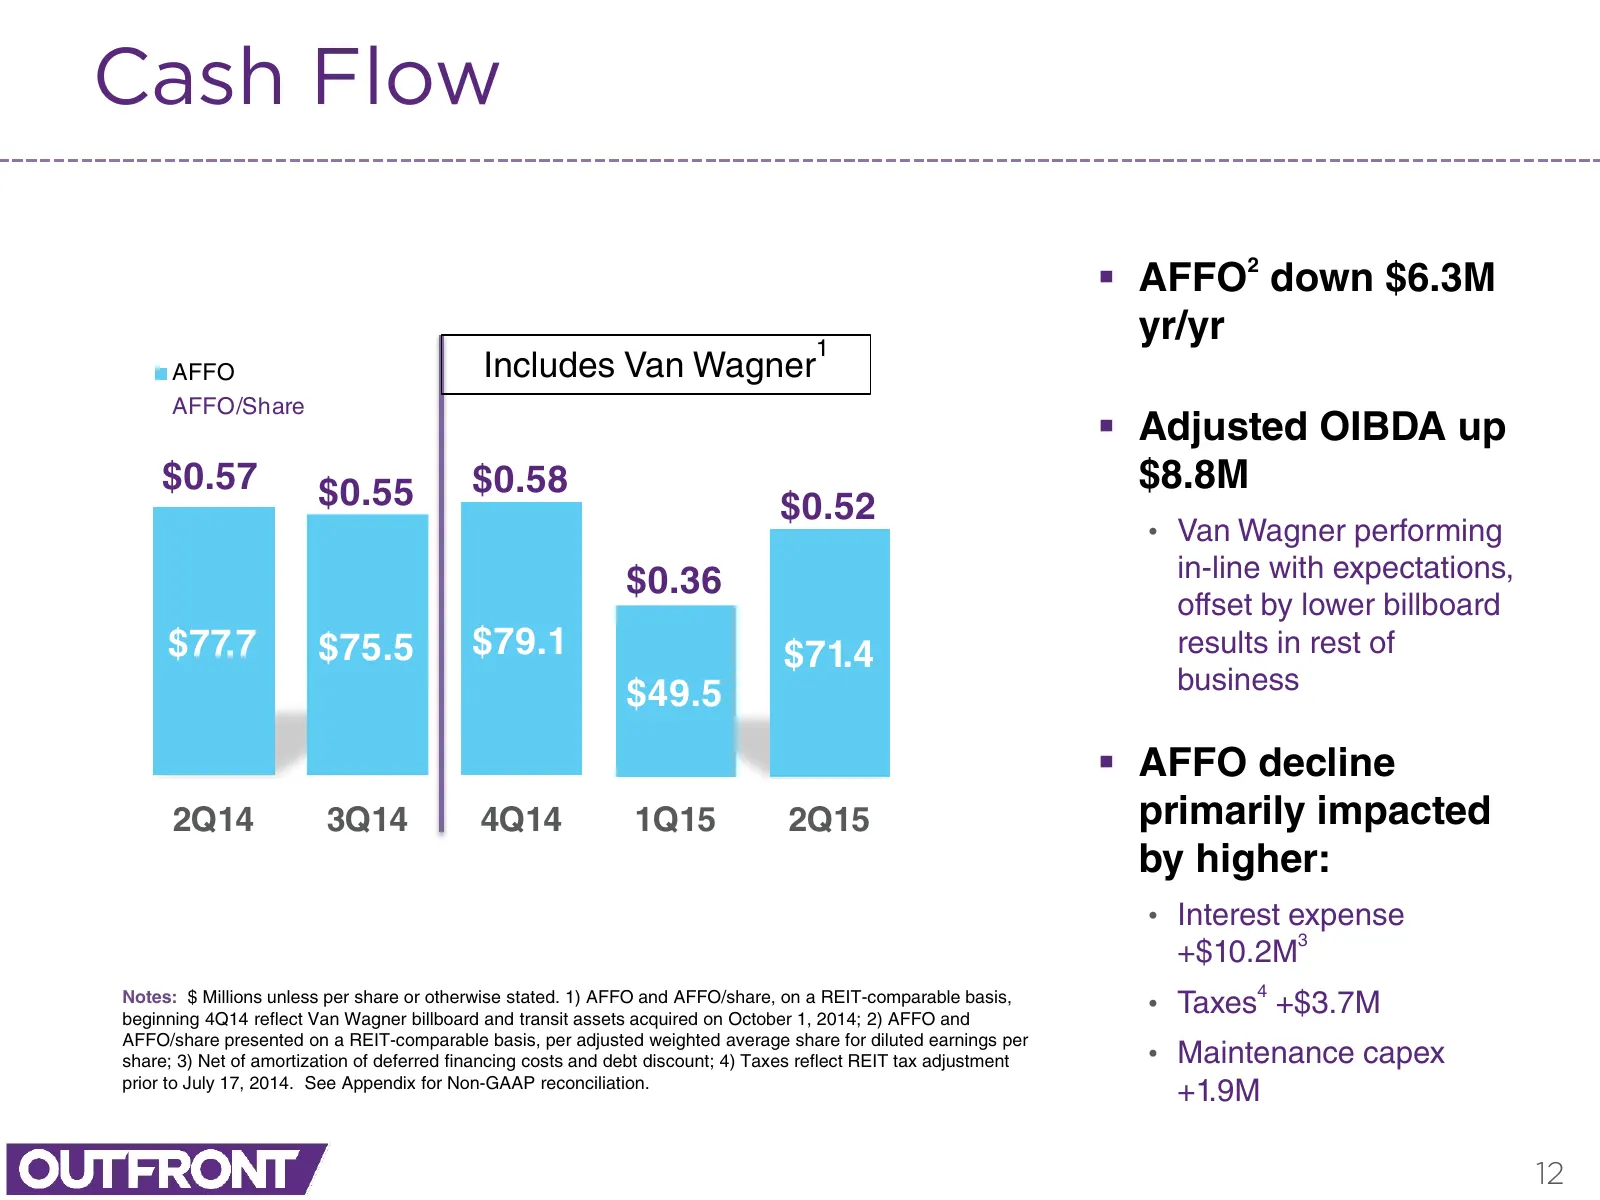
Cash Flow AFFO2 down $6.3M 1 yr/yr AFFO Includes Van Wagner AFFO/Share Adjusted OIBDA up $0.57 $0.55 $0.58 $8.8M $0.52 • Van Wagner performing $0.36 in-line with expectations, offset by lower billboard $77.7 $75.5 $79.1 $71.4 results in rest of $49.5 business AFFO decline 2Q14 3Q14 4Q14 1Q15 2
Slide 13: Dividends
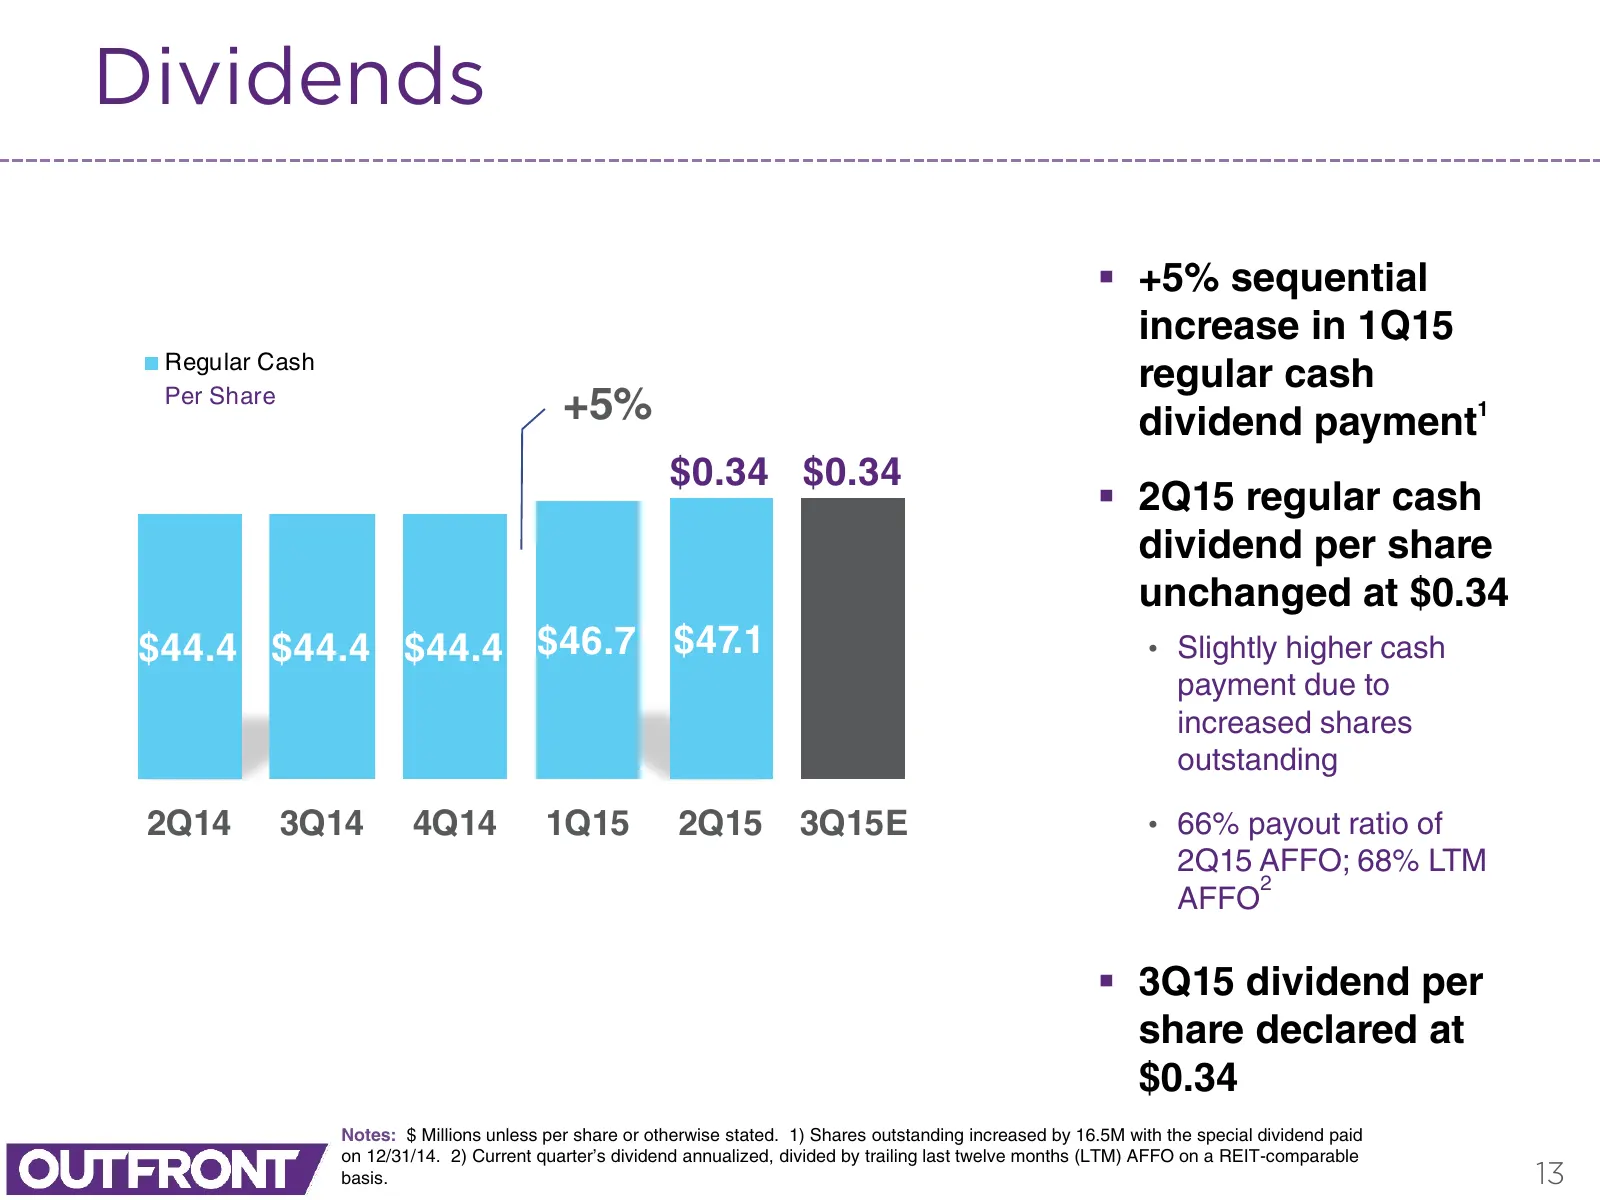
Dividends +5% sequential increase in 1Q15 Regular Cash regular cash Per Share +5% dividend payment1 $0.34 $0.34 2Q15 regular cash dividend per share unchanged at $0.34 $44.4 $44.4 $44.4 $46.7 $47.1 • Slightly higher cash payment due to increased shares outstanding 2Q14 3Q14 4Q14 1Q15 2Q15 3Q15E
Slide 14: Balance Sheet
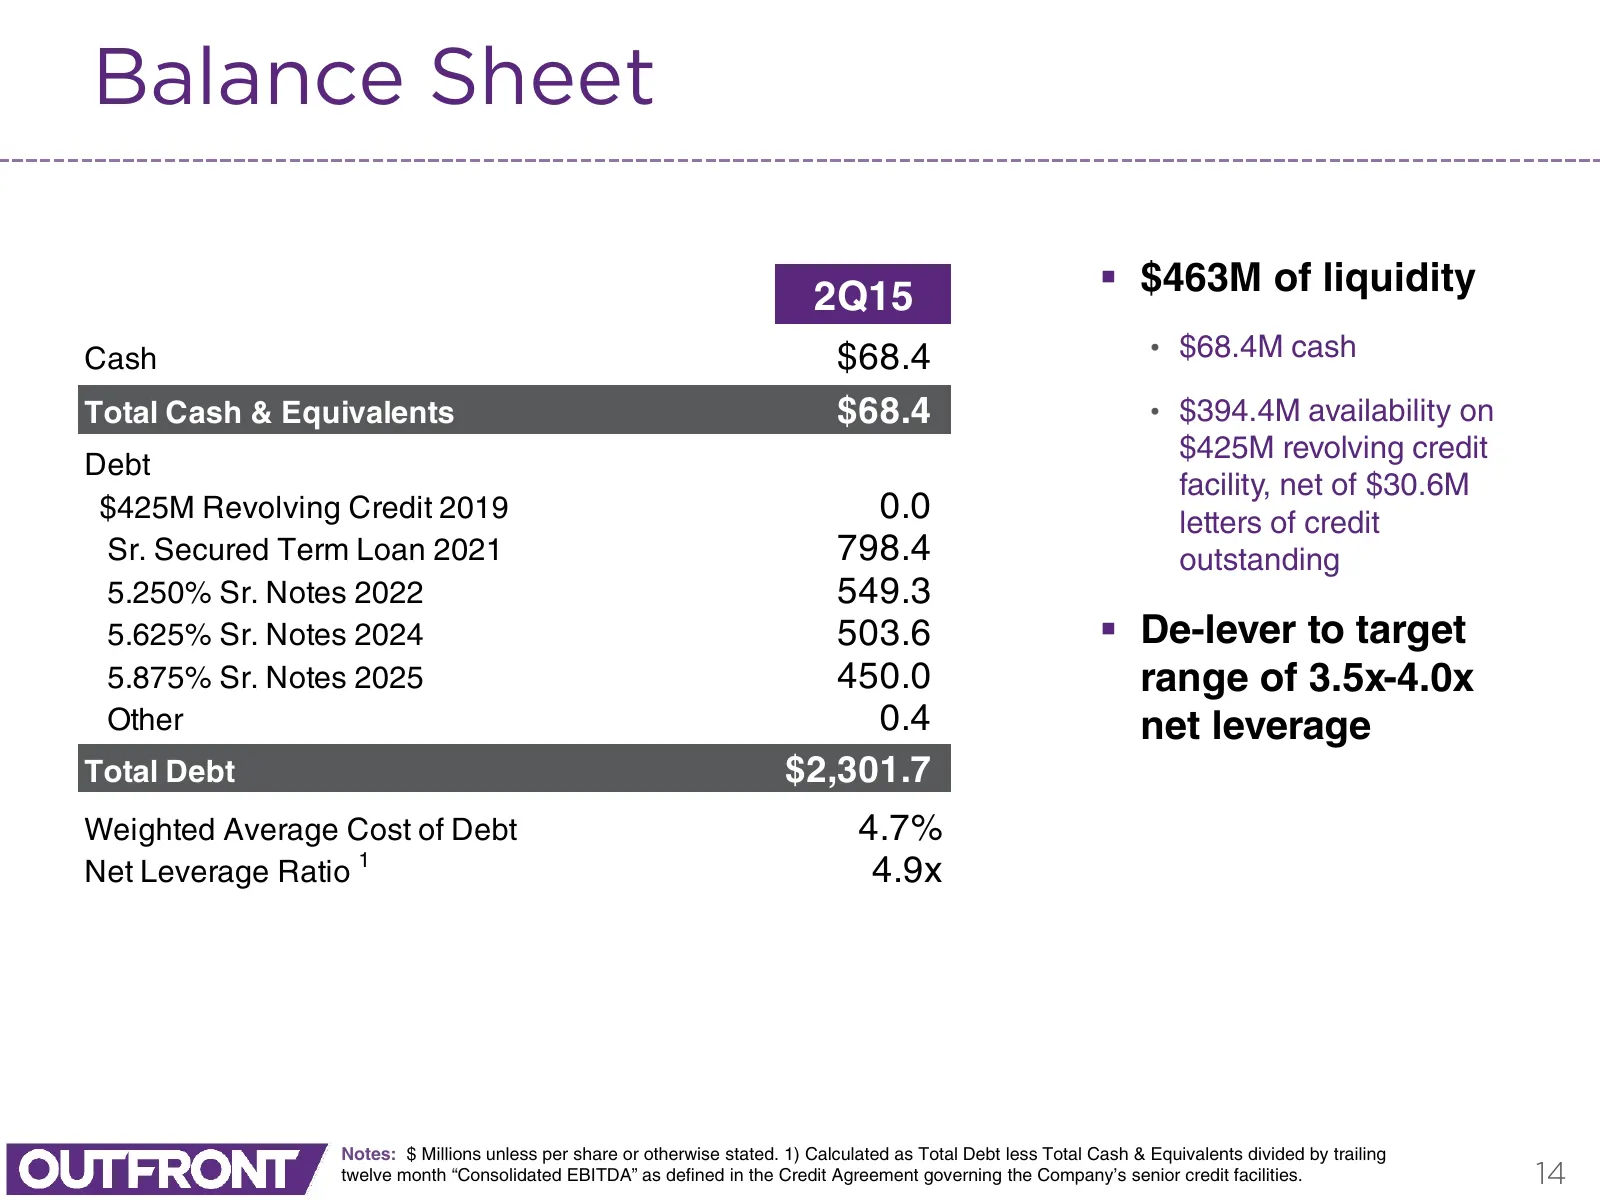
Balance Sheet 2Q15 $463M of liquidity Cash $68.4 • $68.4M cash Total Cash & Equivalents $68.4 • $394.4M availability on $425M revolving credit Debt facility, net of $30.6M $425M Revolving Credit 2019 0.0 letters of credit Sr. Secured Term Loan 2021 798.4 outstanding 5.250% Sr. Notes 2022 549.3 5.6

Slide 15: Jeremy Male, CEO
Jeremy Male CEO 15
Slide 16: Outlook: Q3 2015 revenue growth expectation
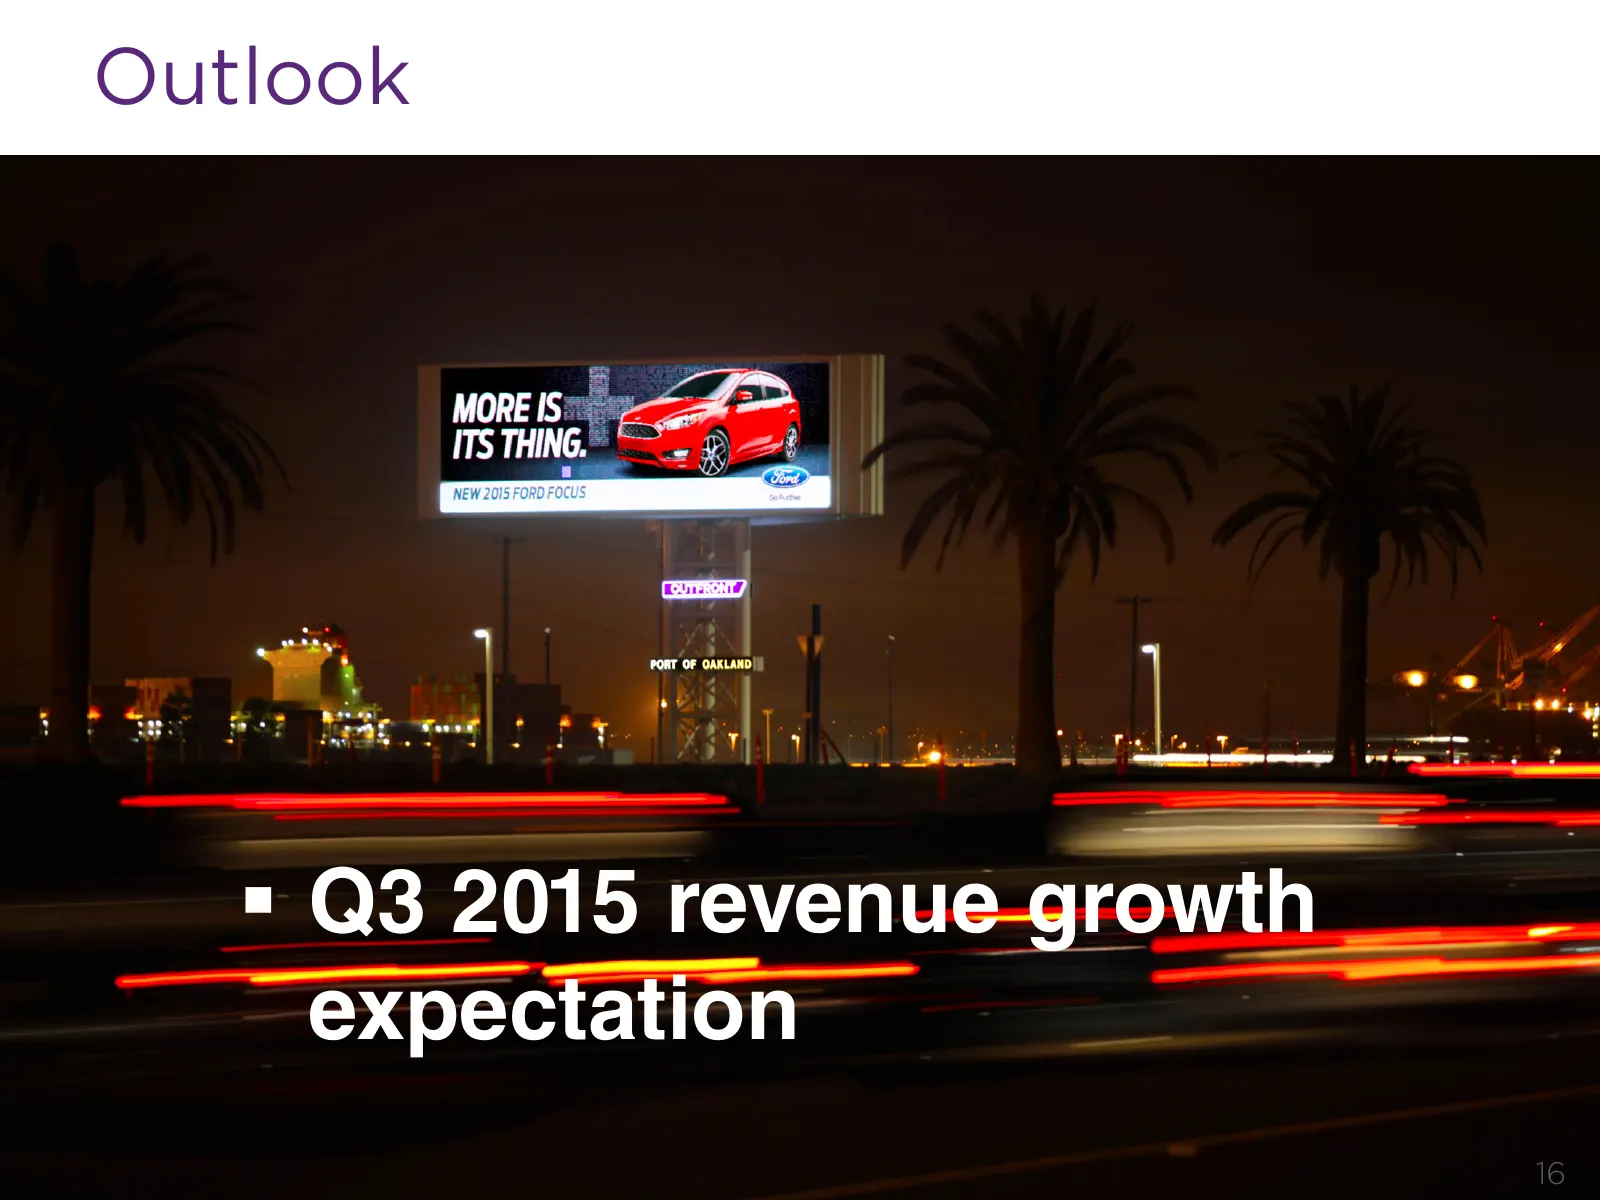
Outlook Q3 2015 revenue growth expectation 16
Slide 17: Appendix
Appendix 17
Slide 18: Acquisition Information
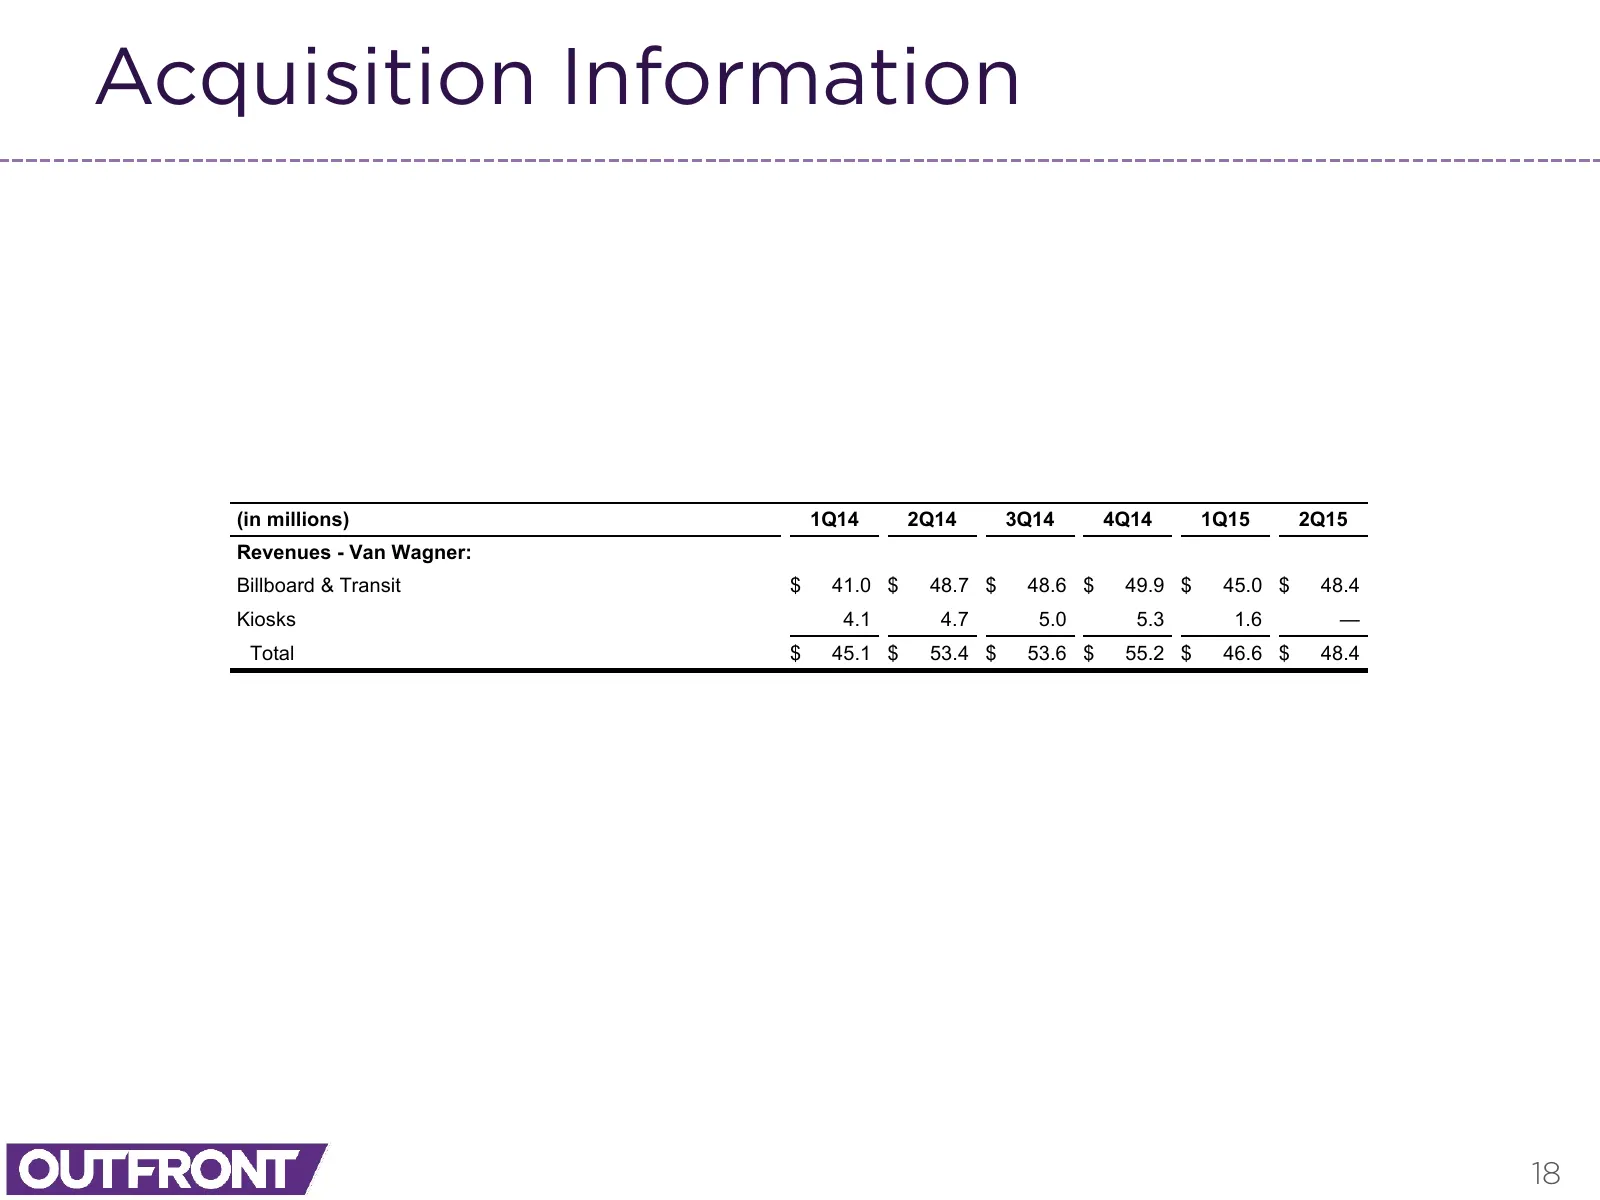
Acquisition Information (in millions) 1Q14 2Q14 3Q14 4Q14 1Q15 2Q15 Revenues - Van Wagner: Billboard & Transit $ 41.0 $ 48.7 $ 48.6 $ 49.9 $ 45.0 $ 48.4 Kiosks 4.1 4.7 5.0 5.3 1.6 — Total $ 45.1 $ 53.4 $ 53.6 $ 55.2 $ 46.6 $ 48.4 18
Slide 19: Non-GAAP Reconciliations
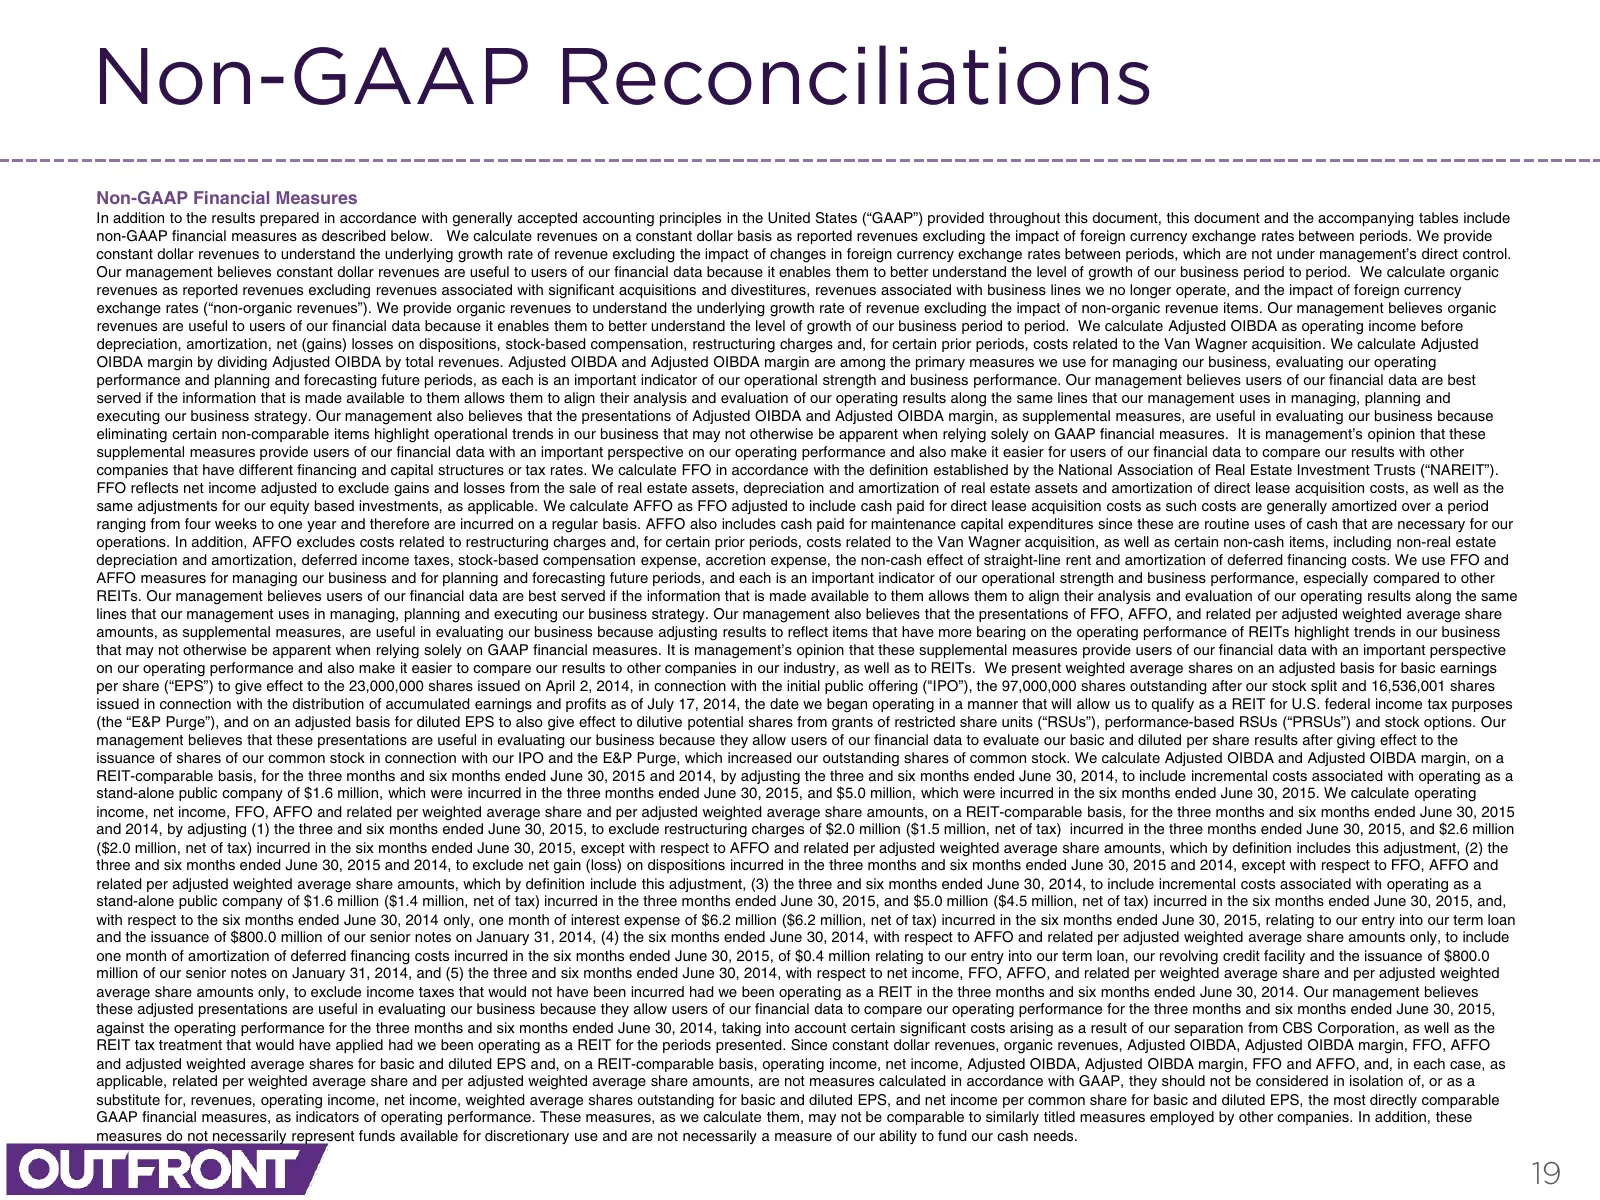
Non-GAAP Reconciliations Non-GAAP Financial Measures In addition to the results prepared in accordance with generally accepted accounting principles in the United States (“GAAP”) provided throughout this document, this document and the accompanying tables include non-GAAP financial measures as descr
Slide 20: Non-GAAP Reconciliations
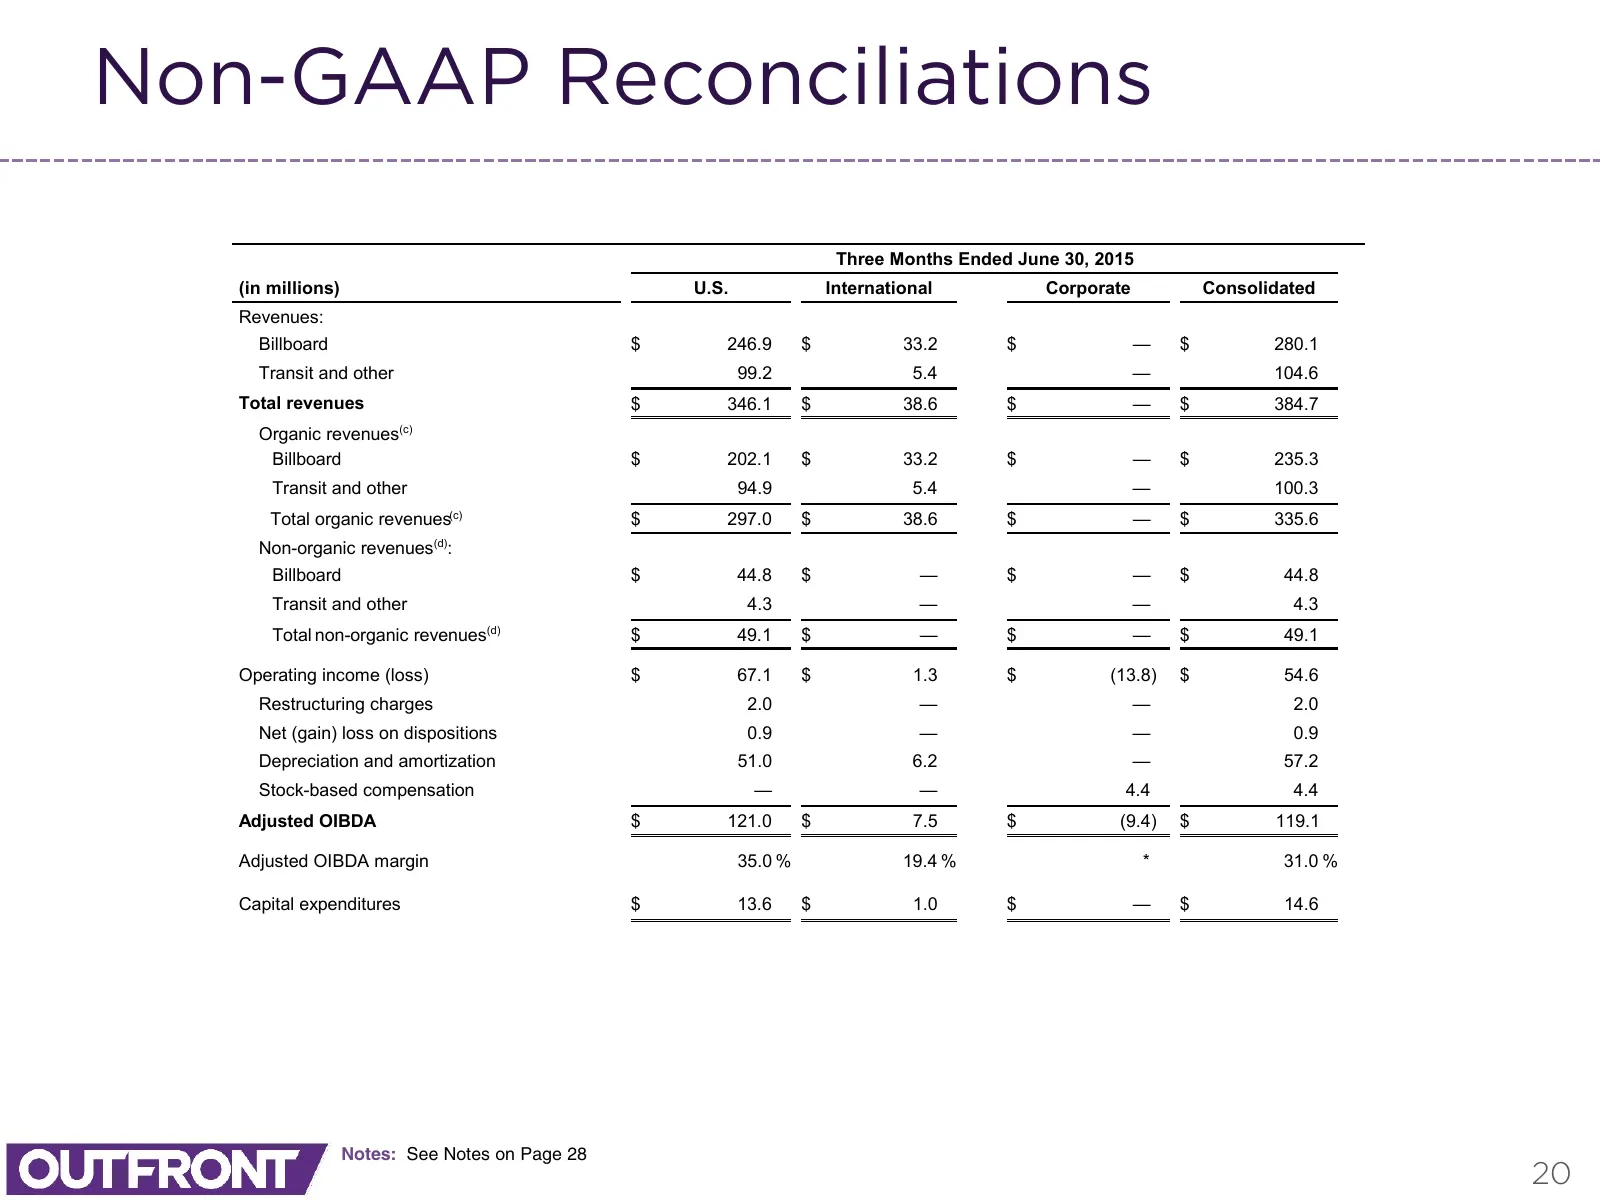
Non-GAAP Reconciliations Three Months Ended June 30, 2015 (in millions) U.S. International Corporate Consolidated Revenues: Billboard $ 246.9 $ 33.2 $ — $ 280.1 Transit and other 99.2 5.4 — 104.6 Total revenues $ 346.1 $ 38.6 $ — $ 384.7 Organic revenues(c) Billboard $ 202.1 $ 33.2 $ — $ 235.3 Trans
Slide 21: Non-GAAP Reconciliations
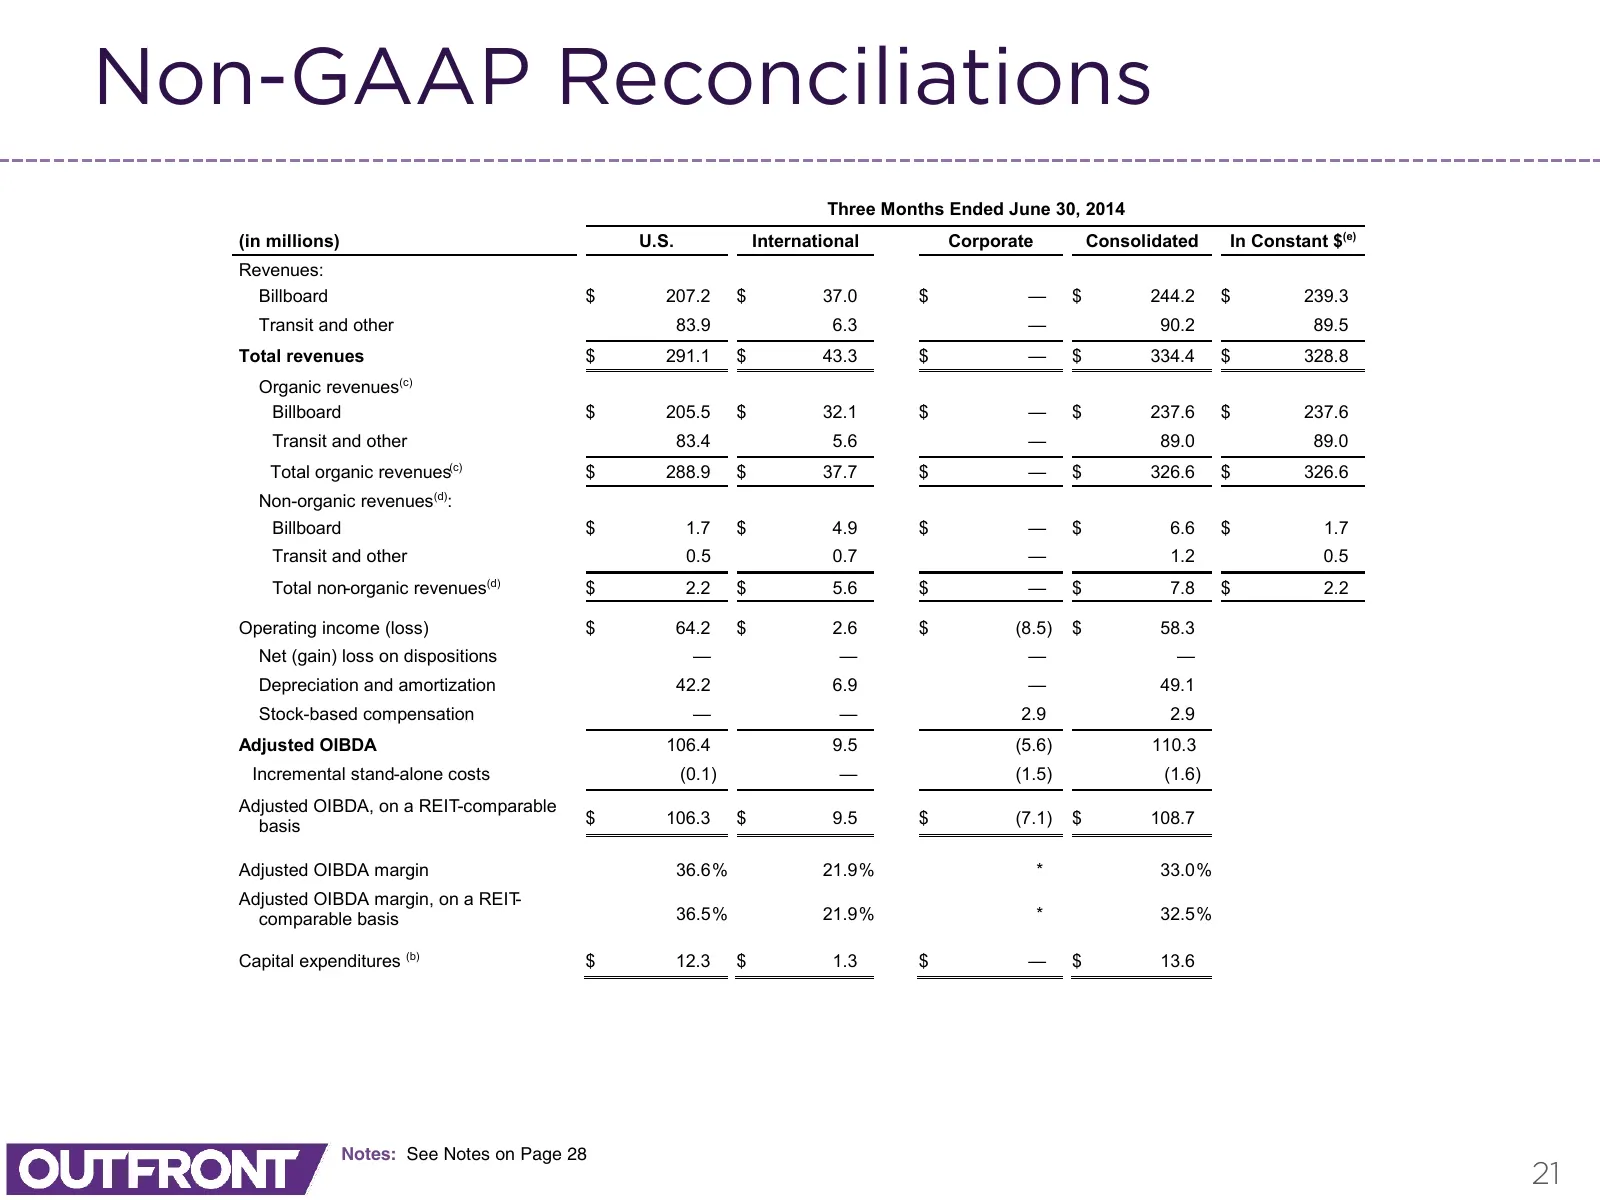
Non-GAAP Reconciliations Three Months Ended June 30, 2014 (in millions) U.S. International Corporate Consolidated In Constant $(e) Revenues: Billboard $ 207.2 $ 37.0 $ — $ 244.2 $ 239.3 Transit and other 83.9 6.3 — 90.2 89.5 Total revenues $ 291.1 $ 43.3 $ — $ 334.4 $ 328.8 Organic revenues(c) Billb
Slide 22: Non-GAAP Reconciliations
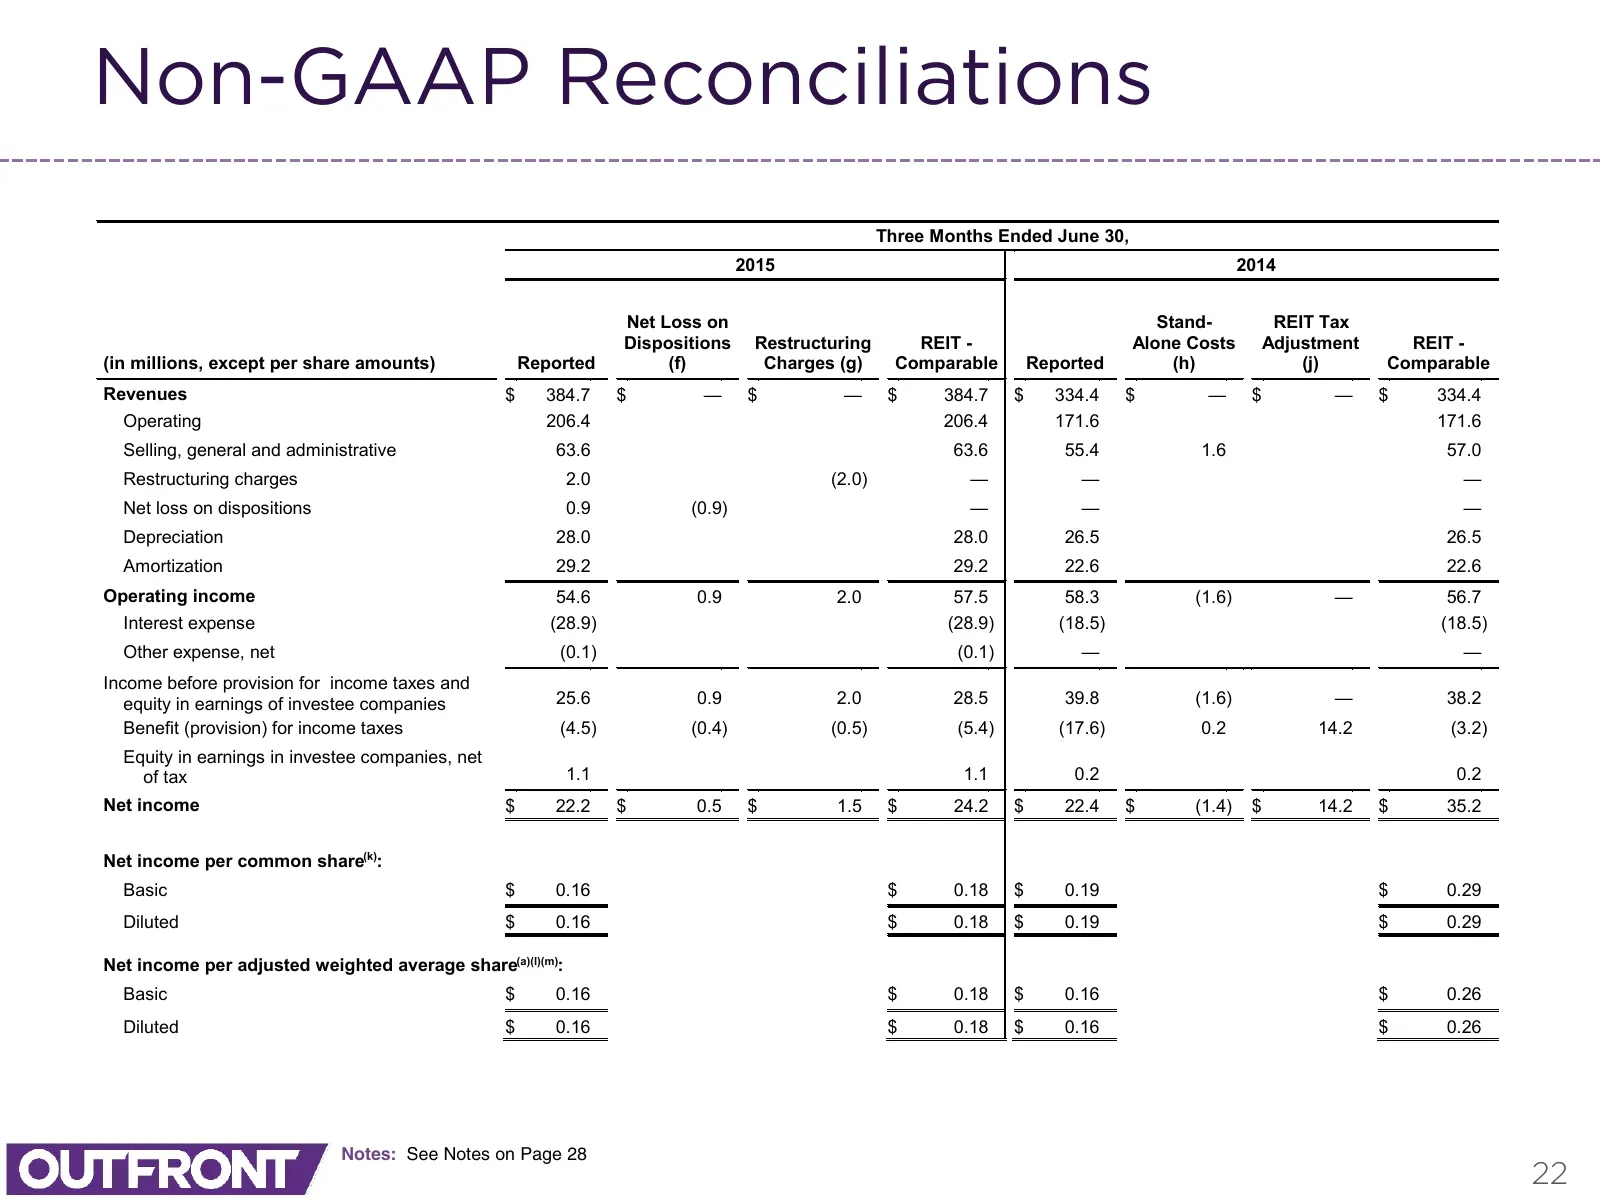
Non-GAAP Reconciliations Three Months Ended June 30, 2015 2014 Net Loss on Stand- REIT Tax Dispositions Restructuring REIT - Alone Costs Adjustment REIT - (in millions, except per share amounts) Reported (f) Charges (g) Comparable Reported (h) (j) Comparable Revenues $ 384.7 $ — $ — $ 384.7 $ 334.4
Slide 23: Non-GAAP Reconciliations
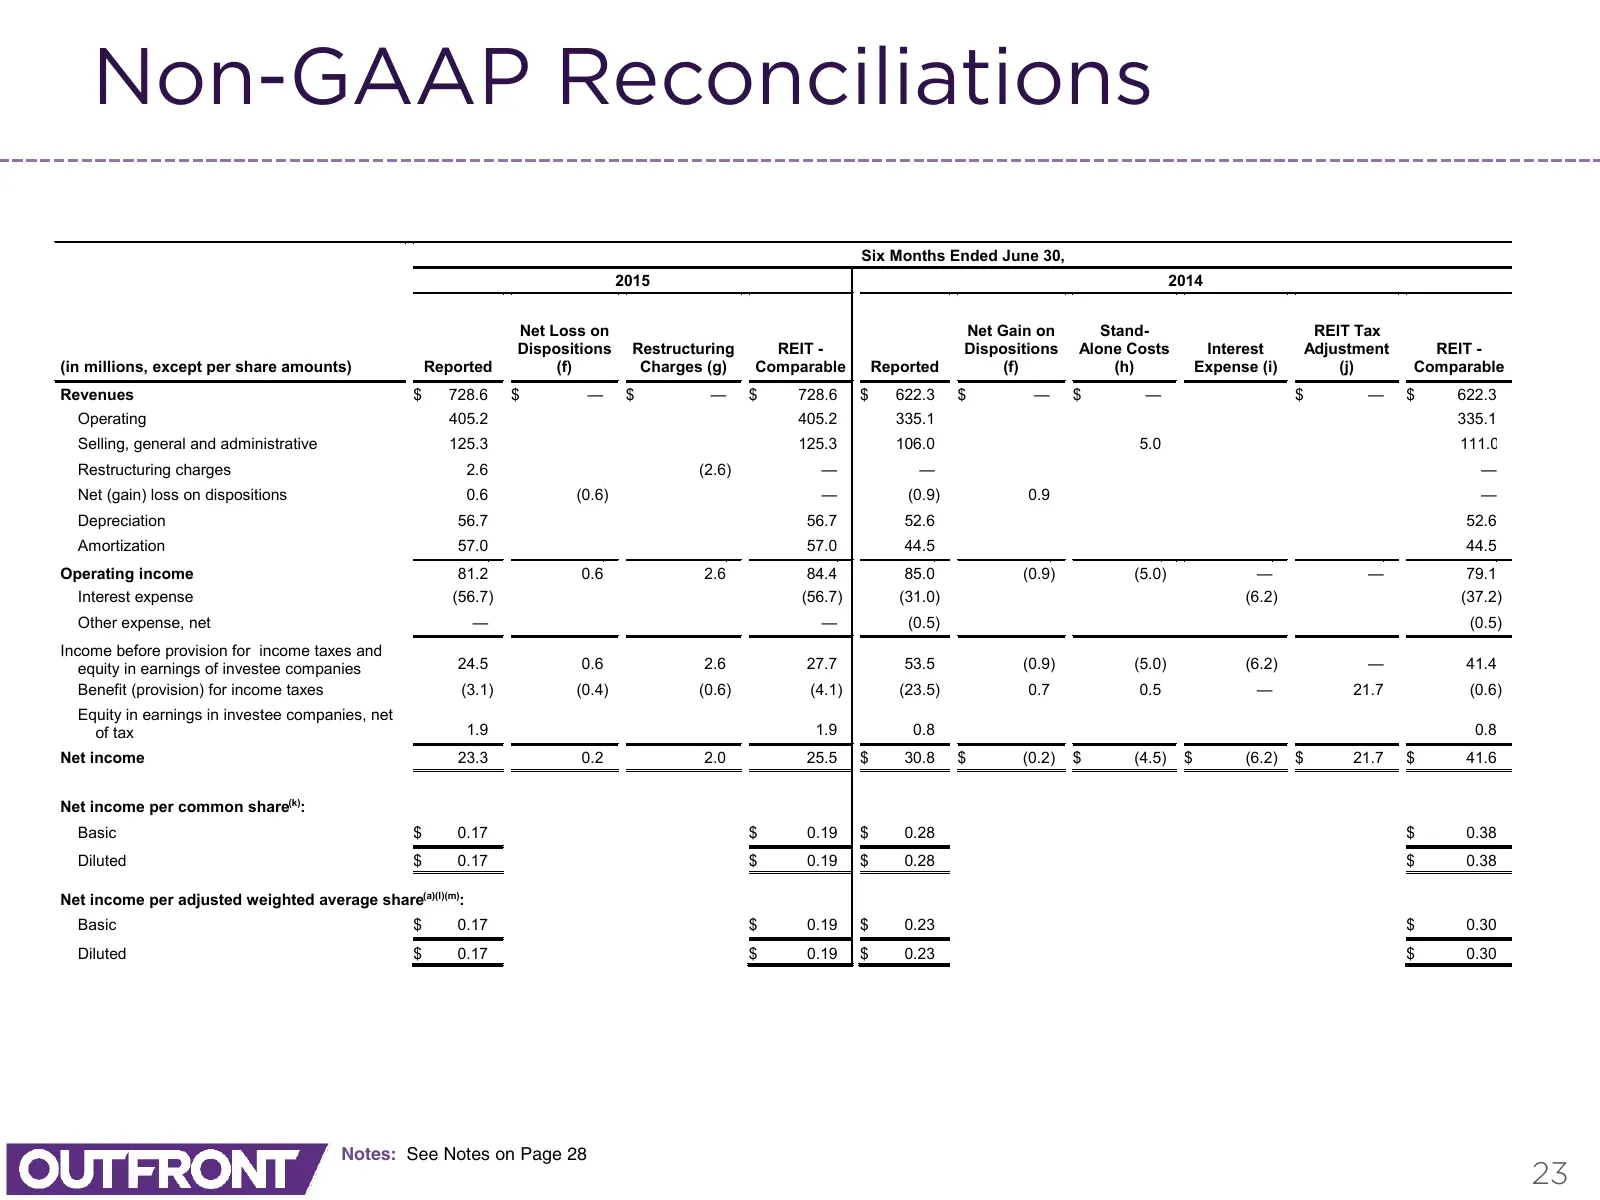
Non-GAAP Reconciliations Six Months Ended June 30, 2015 2014 Net Loss on Net Gain on Stand- REIT Tax Dispositions Restructuring REIT - Dispositions Alone Costs Interest Adjustment REIT - (in millions, except per share amounts) Reported (f) Charges (g) Comparable Reported (f) (h) Expense (i) (j) Comp
Slide 24: Non-GAAP Reconciliations
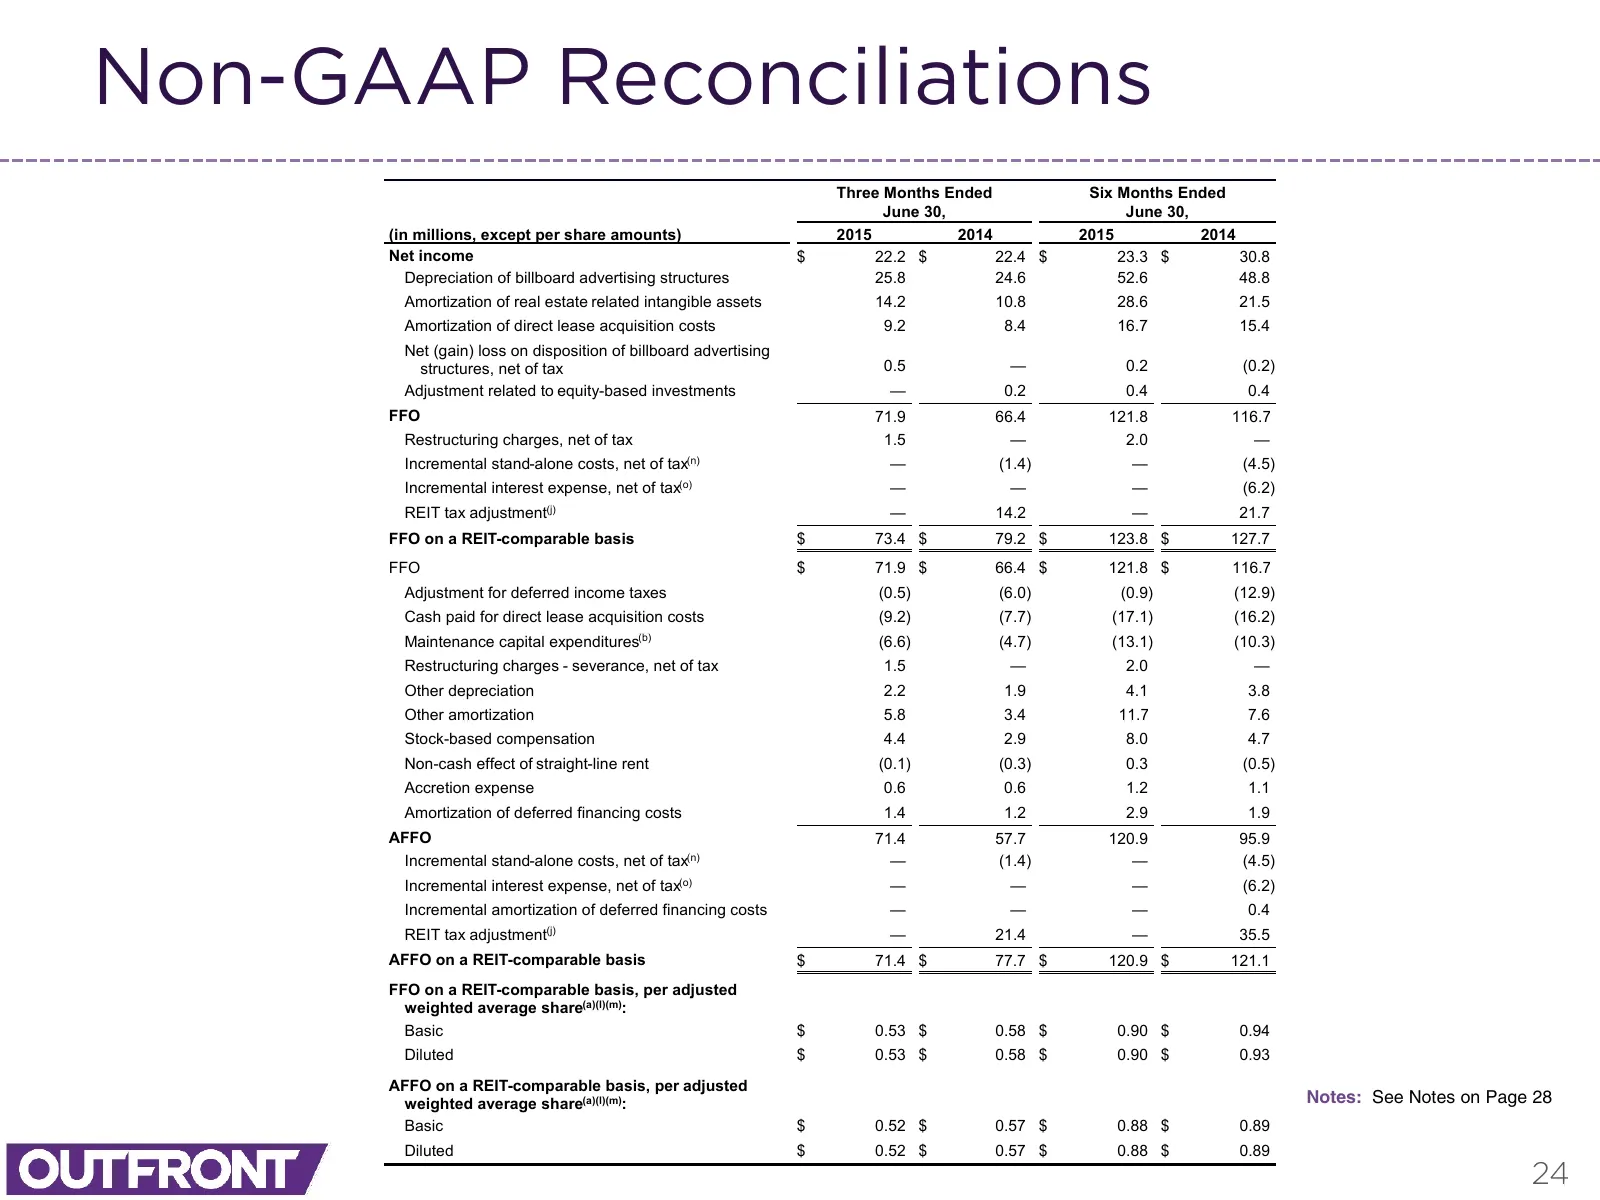
Non-GAAP Reconciliations Three Months Ended Six Months Ended June 30, June 30, (in millions, except per share amounts) 2015 2014 2015 2014 Net income $ 22.2 $ 22.4 $ 23.3 $ 30.8 Depreciation of billboard advertising structures 25.8 24.6 52.6 48.8 Amortization of real estate related intangible assets
Slide 25: Non-GAAP Reconciliations
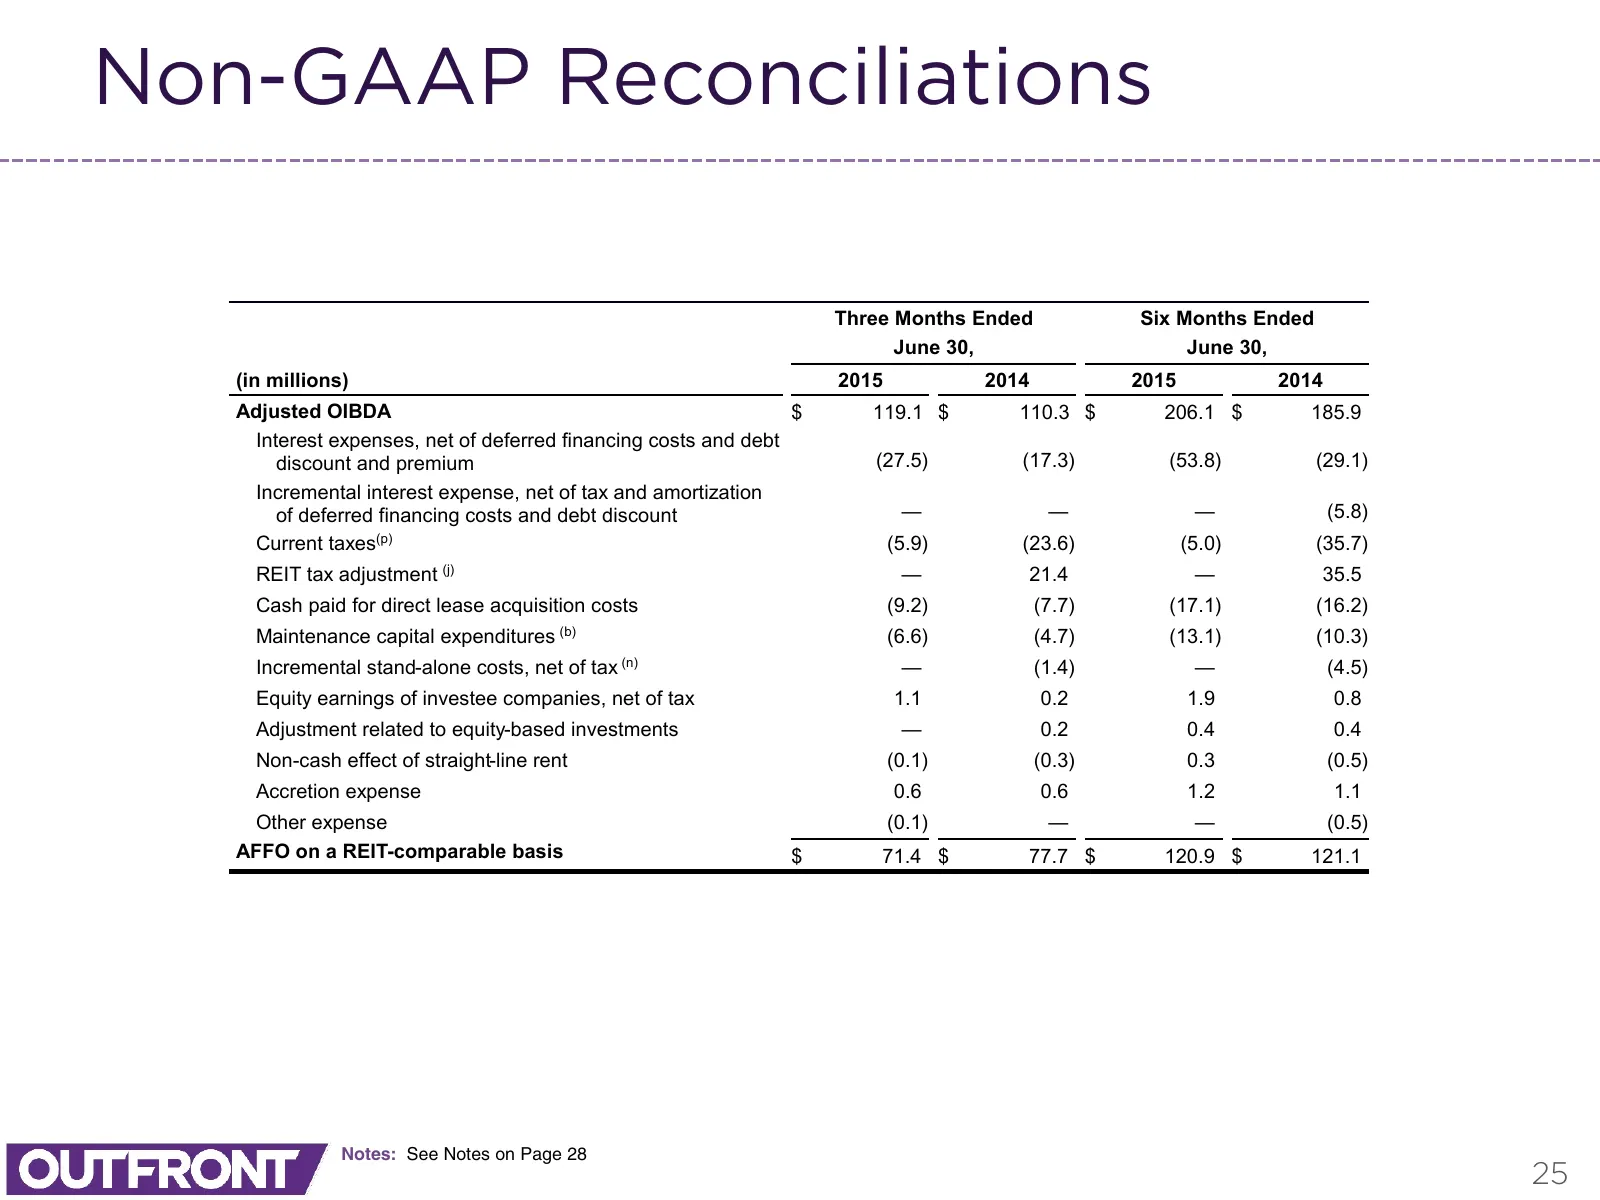
Non-GAAP Reconciliations Three Months Ended Six Months Ended June 30, June 30, (in millions) 2015 2014 2015 2014 Adjusted OIBDA $ 119.1 $ 110.3 $ 206.1 $ 185.9 Interest expenses, net of deferred financing costs and debt discount and premium (27.5) (17.3) (53.8) (29.1) Incremental interest expense, n
Slide 26: Non-GAAP Reconciliations
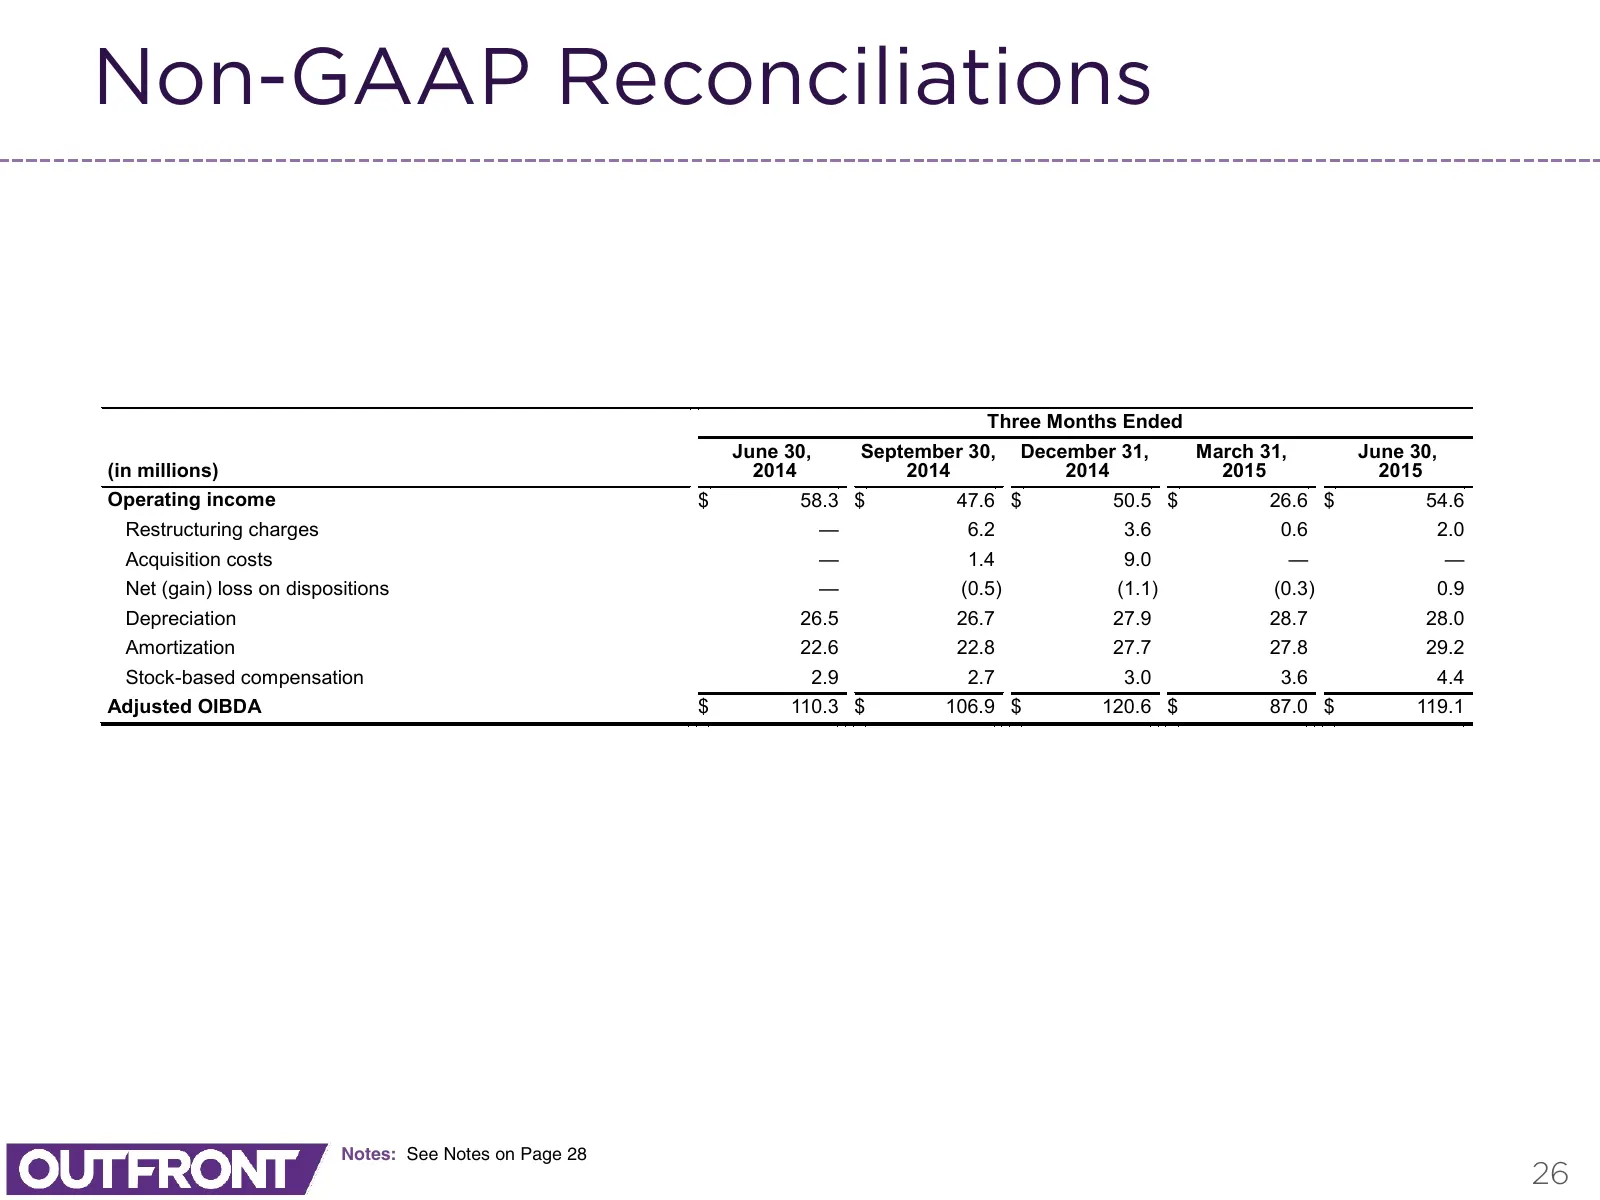
Non-GAAP Reconciliations Three Months Ended June 30, September 30, December 31, March 31, June 30, (in millions) 2014 2014 2014 2015 2015 Operating income $ 58.3 $ 47.6 $ 50.5 $ 26.6 $ 54.6 Restructuring charges — 6.2 3.6 0.6 2.0 Acquisition costs — 1.4 9.0 — — Net (gain) loss on dispositions — (0.5
Slide 27: Non-GAAP Reconciliations
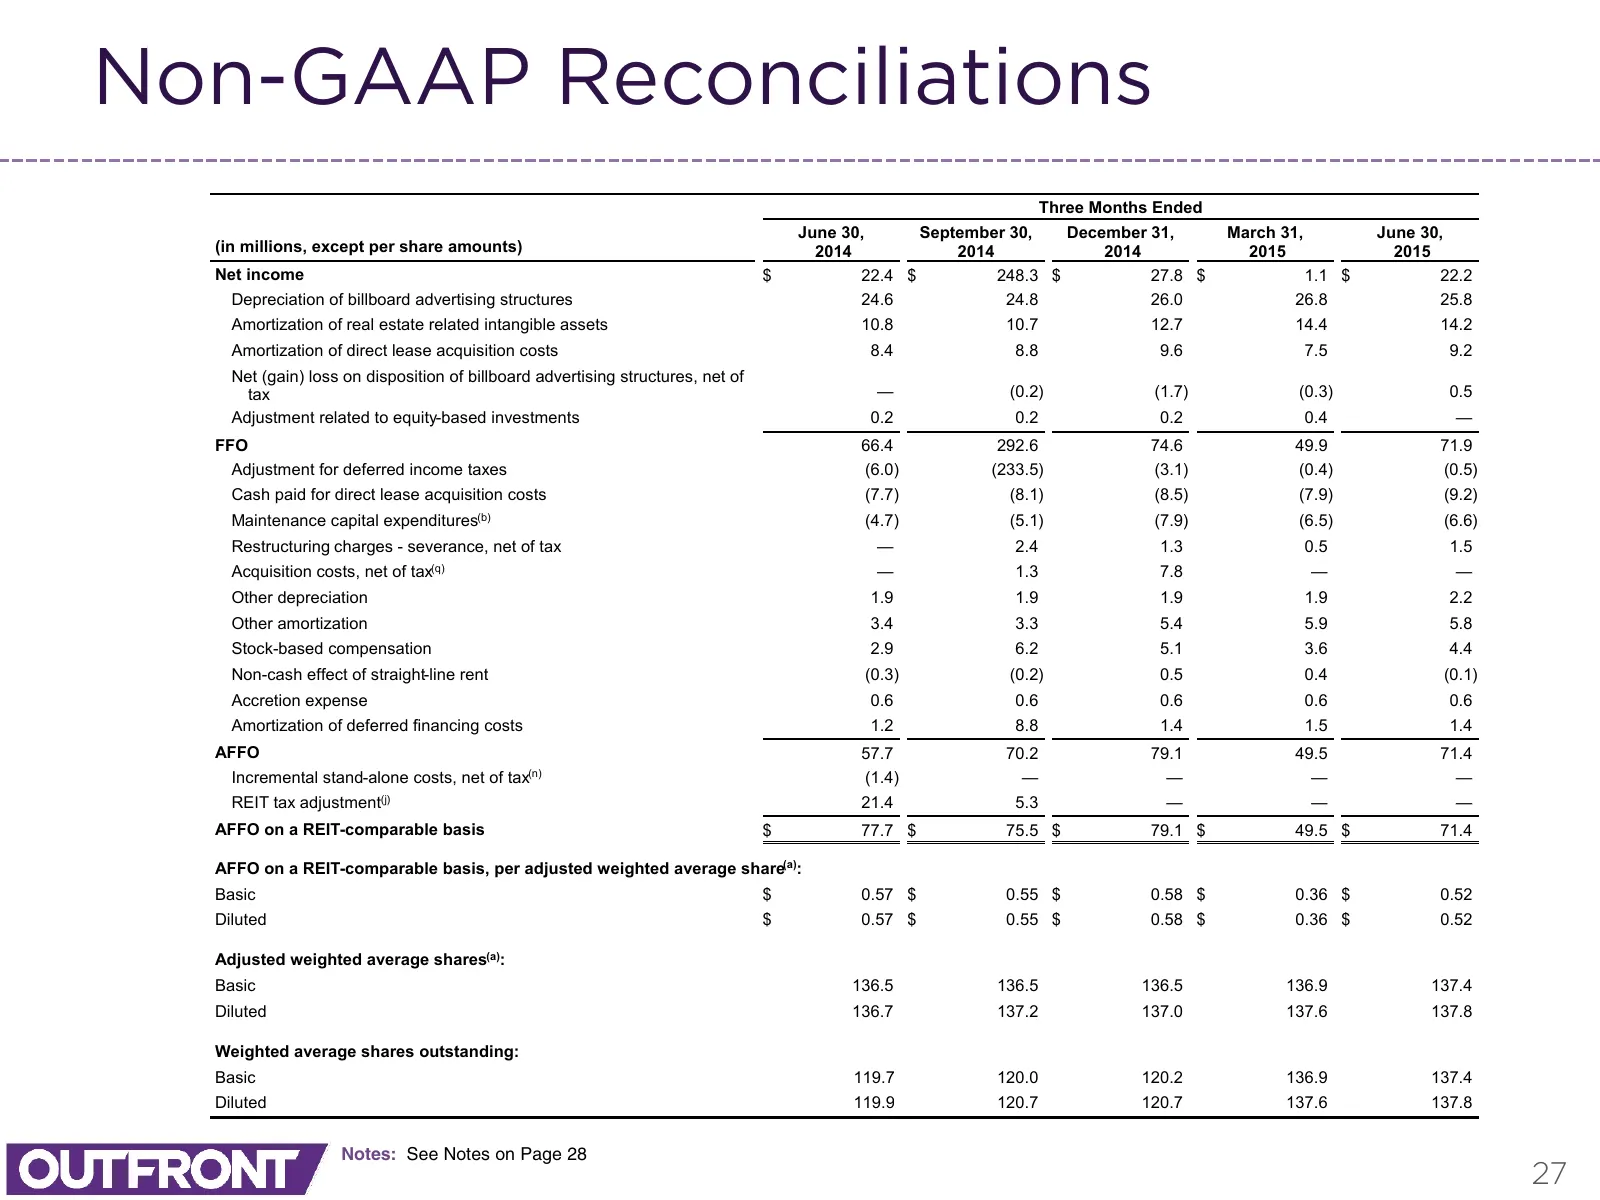
Non-GAAP Reconciliations Three Months Ended June 30, September 30, December 31, March 31, June 30, (in millions, except per share amounts) 2014 2014 2014 2015 2015 Net income $ 22.4 $ 248.3 $ 27.8 $ 1.1 $ 22.2 Depreciation of billboard advertising structures 24.6 24.8 26.0 26.8 25.8 Amortization of
Slide 28: Notes to Appendix Exhibits
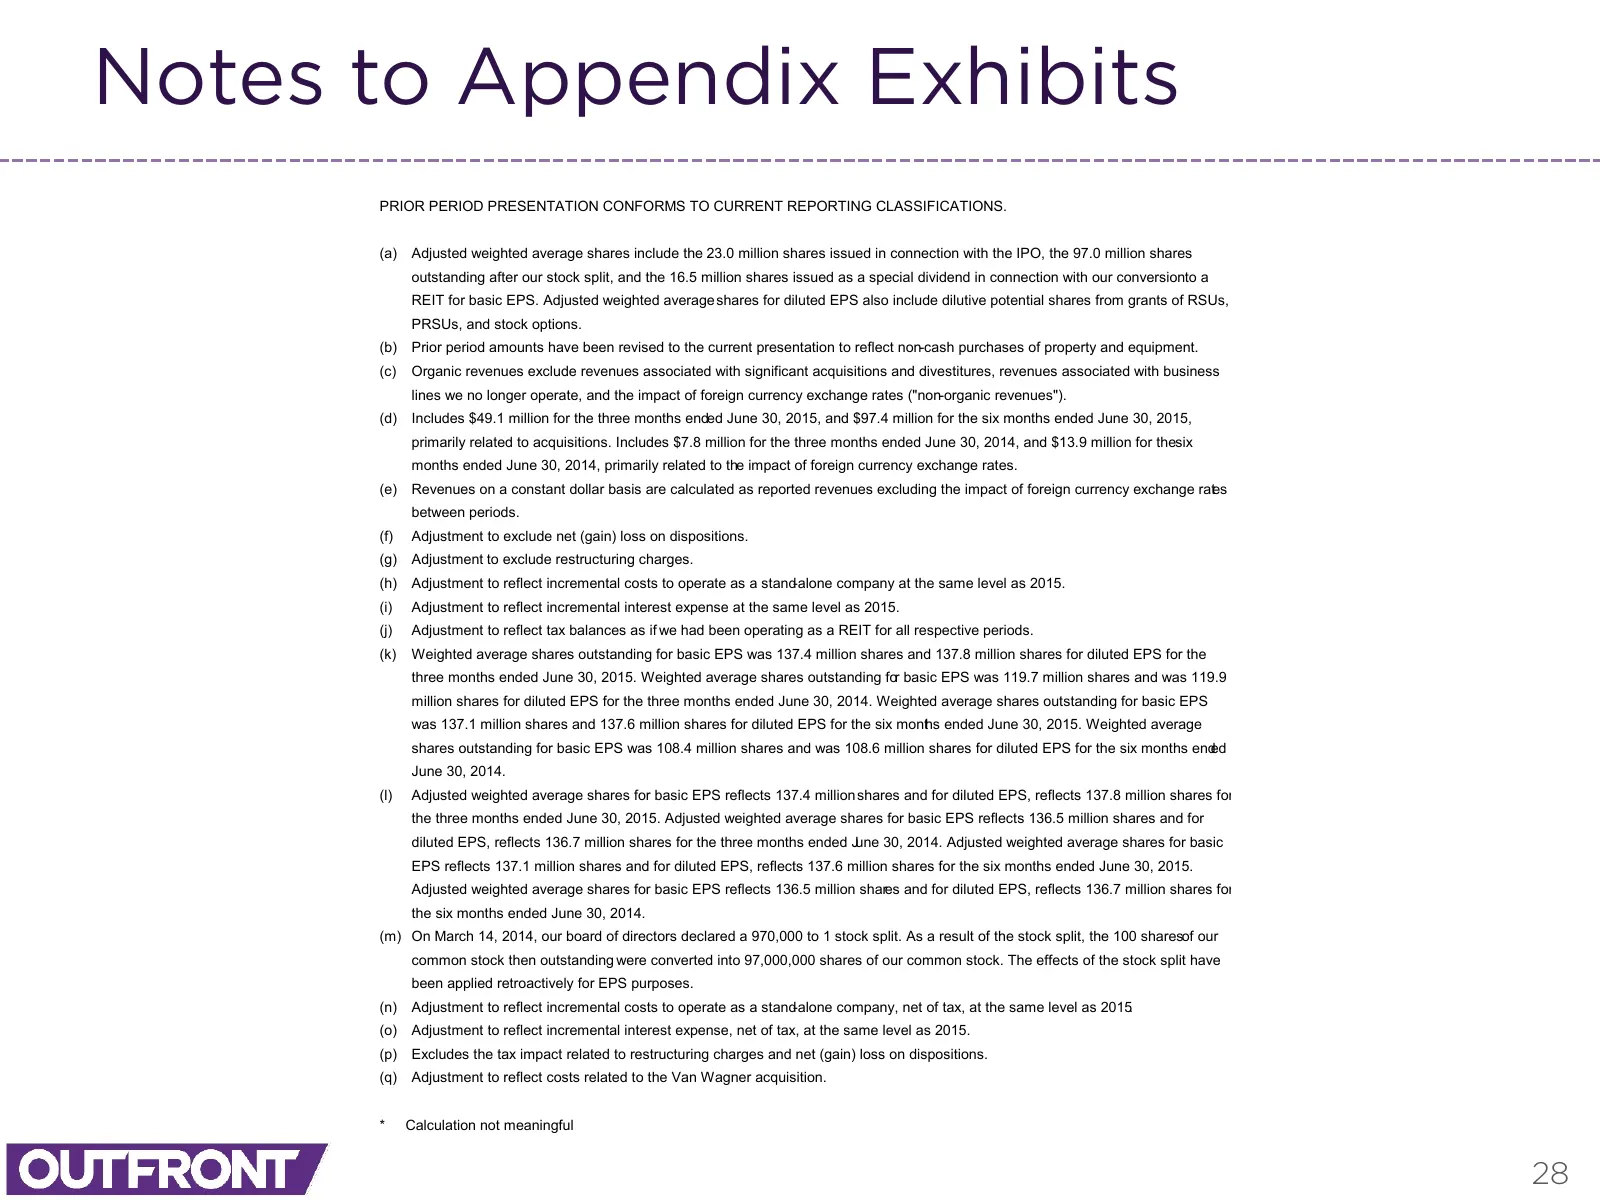
Notes to Appendix Exhibits PRIOR PERIOD PRESENTATION CONFORMS TO CURRENT REPORTING CLASSIFICATIONS. (a) Adjusted weighted average shares include the 23.0 million shares issued in connection with the IPO, the 97.0 million shares outstanding after our stock split, and the 16.5 million shares issued as

Slide 29: About OUTFRONT Media Inc.
About OUTFRONT Media Inc. OUTFRONT Media (NYSE: OUT), formerly CBS Outdoor, is one of the largest out-of-home media companies in the Americas and has a major presence in top markets throughout the United States, Canada, Mexico and South America. With billboard and transit properties, a prime asset f
Source: Internet Archive copy of investor.outfrontmedia.com
More decks from OUTFRONT Media Inc.
 Q3 2026 Earnings Presentation23 slides · Nov 5, 2026
 Q2 2026 Earnings Presentation23 slides · Aug 5, 2026
 Q1 2026 Earnings Presentation23 slides · May 7, 2026
 Q4 2025 Earnings Presentation24 slides · Feb 25, 2026
 Q3 2025 Earnings Presentation24 slides · Nov 6, 2025
 Q2 2025 Earnings Presentation26 slides · Aug 5, 2025