CITIC Capital Acquisition Corp
CITIC Capital Acquisition — SPAC Merger (November 2021)
34 slides from CITIC Capital Acquisition's SPAC merger presentation, Nov 2, 2021

Slide 1: Investor Presentation November 1, 2021
Investor Presentation November 1, 2021
Slide 2: Disclaimer
Disclaimer Disclaimer This presentation is provided for informational purposes only and has been prepared to assist interested parties in making their own evaluation with respect to a potential business combination (the “Proposed Business Combination”) between Quanergy Systems, Inc. (“Quanergy”) and
Slide 3: Today's agenda
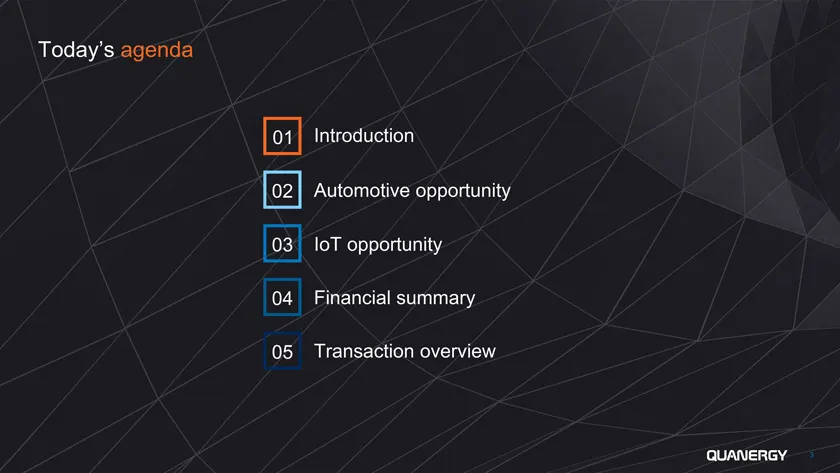
Today’s agenda 01 Introduction 02 Automotive opportunity 03 IoT opportunity 04 Financial summary 05 Transaction overview 3
Slide 4: CITIC Capital Acquisition Corp. and Quanergy: a winning team
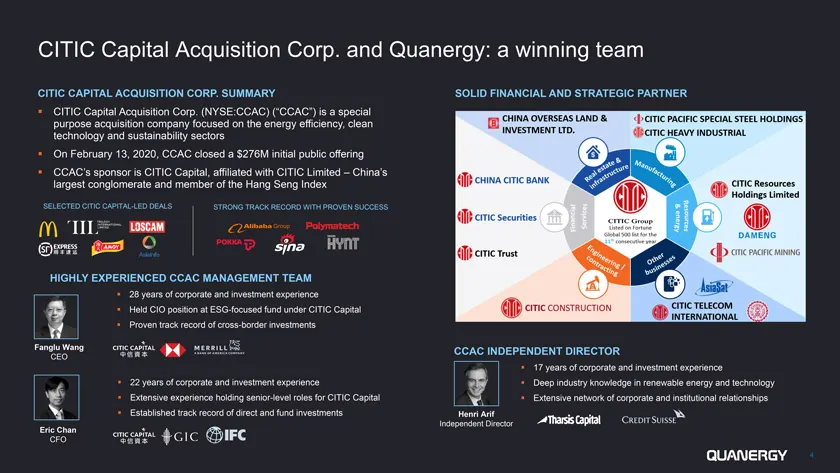
CITIC Capital Acquisition Corp. and Quanergy: a winning team CITIC CAPITAL ACQUISITION CORP. SUMMARY SOLID FINANCIAL AND STRATEGIC PARTNER CITIC Capital Acquisition Corp. (NYSE:CCAC) (“CCAC”) is a special purpose acquisition company focused on the energy efficiency, clean technology and sustainabili
Slide 5: Transaction overview
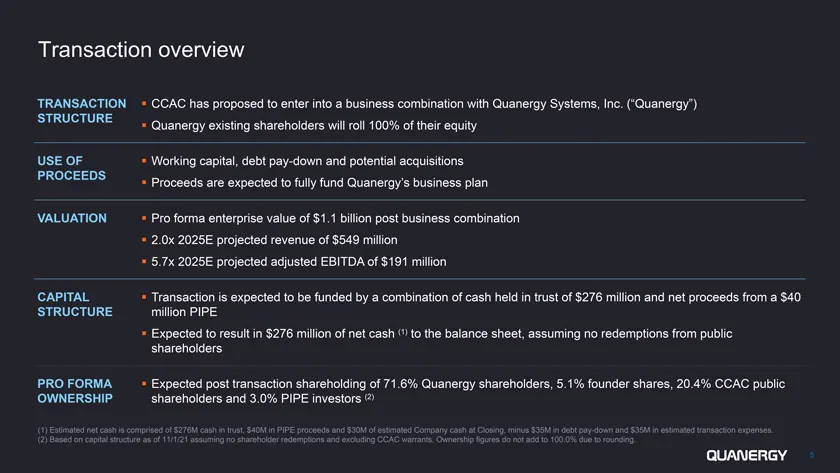
Transaction overview TRANSACTION CCAC has proposed to enter into a business combination with Quanergy Systems, Inc. (“Quanergy”) STRUCTURE Quanergy existing shareholders will roll 100% of their equity USE OF Working capital, debt pay-down and potential acquisitions PROCEEDS Proceeds are expected to
Slide 6: Investment highlights
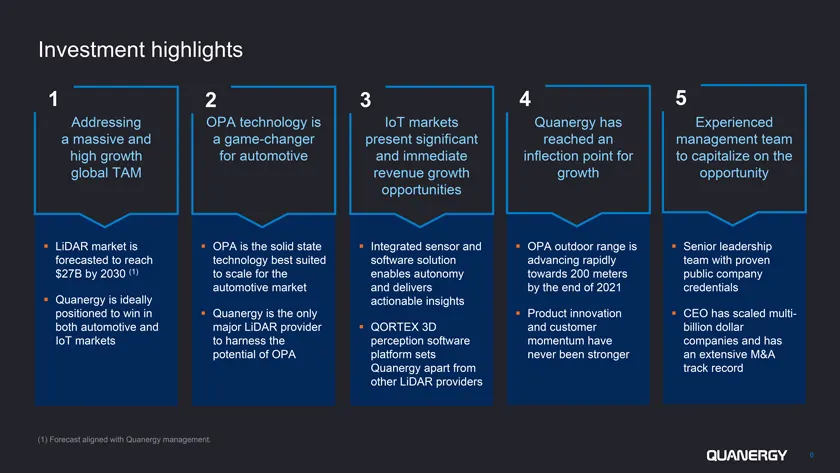
Investment highlights 1 2 3 4 5 Addressing OPA technology is IoT markets Quanergy has Experienced a massive and a game-changer present significant reached an management team high growth for automotive and immediate inflection point for to capitalize on the global TAM revenue growth growth opportunit
Slide 7: Experienced senior management team
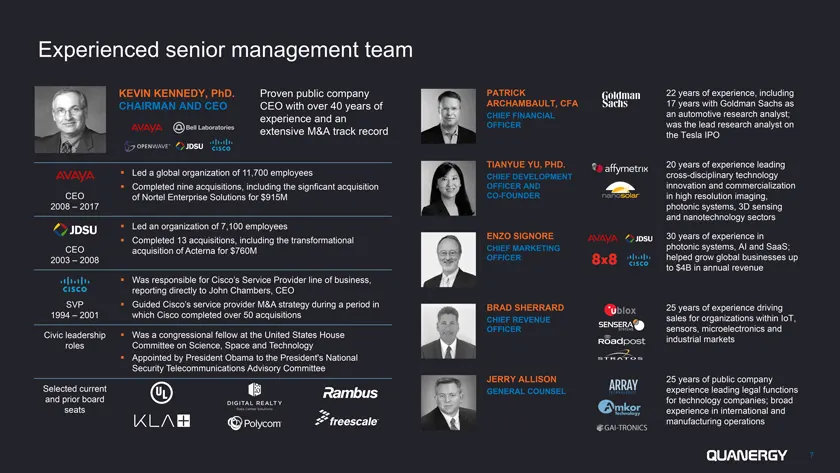
Experienced senior management team KEVIN KENNEDY, PhD. Proven public company PATRICK 22 years of experience, including CHAIRMAN AND CEO CEO with over 40 years of ARCHAMBAULT, CFA 17 years with Goldman Sachs as experience and an CHIEF FINANCIAL an automotive research analyst; OFFICER was the lead res
Slide 8: Quanergy – next-generation solid state LiDAR solutions
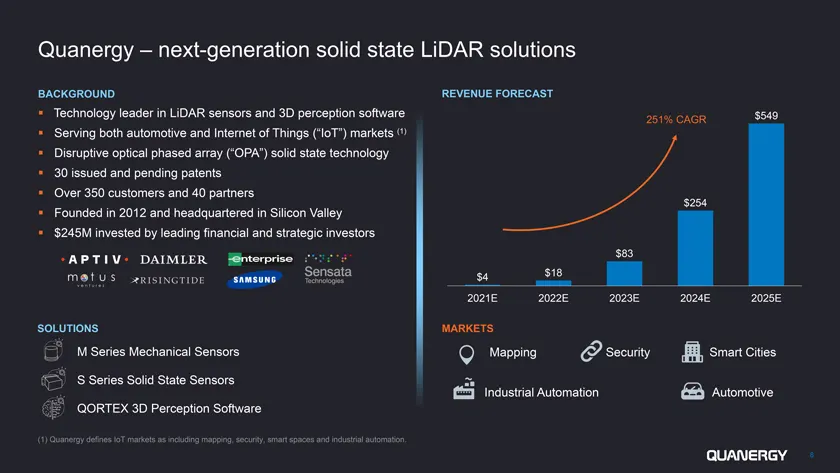
Quanergy – next-generation solid state LiDAR solutions BACKGROUND REVENUE FORECAST Technology leader in LiDAR sensors and 3D perception software $549 251% CAGR Serving both automotive and Internet of Things (“IoT”) markets (1) Disruptive optical phased array (“OPA”) solid state technology 30 issued
Slide 9: Quanergy addresses industry mega-trends
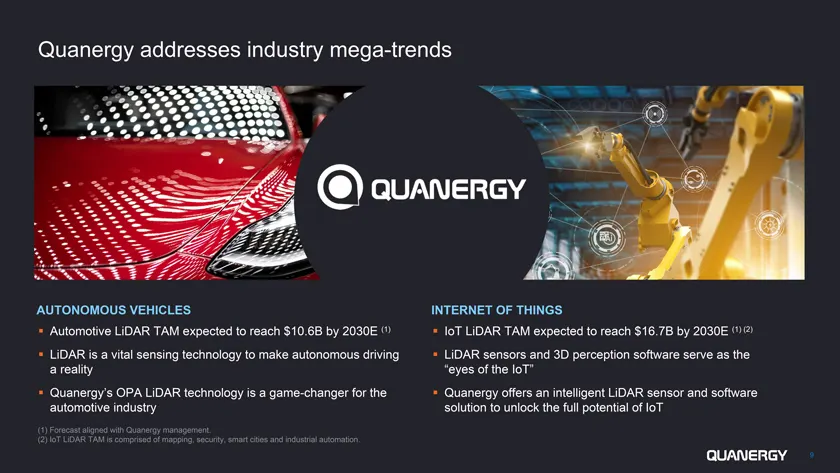
Quanergy addresses industry mega-trends AUTONOMOUS VEHICLES INTERNET OF THINGS Automotive LiDAR TAM expected to reach $10.6B by 2030E (1) IoT LiDAR TAM expected to reach $16.7B by 2030E (1) (2) LiDAR is a vital sensing technology to make autonomous driving LiDAR sensors and 3D perception software se
Slide 10: Today's agenda
Today’s agenda 01 Introduction 02 Automotive opportunity 03 IoT opportunity 04 Financial summary 05 Transaction overview 10
Slide 11: Opportunity for LiDAR in the automotive market
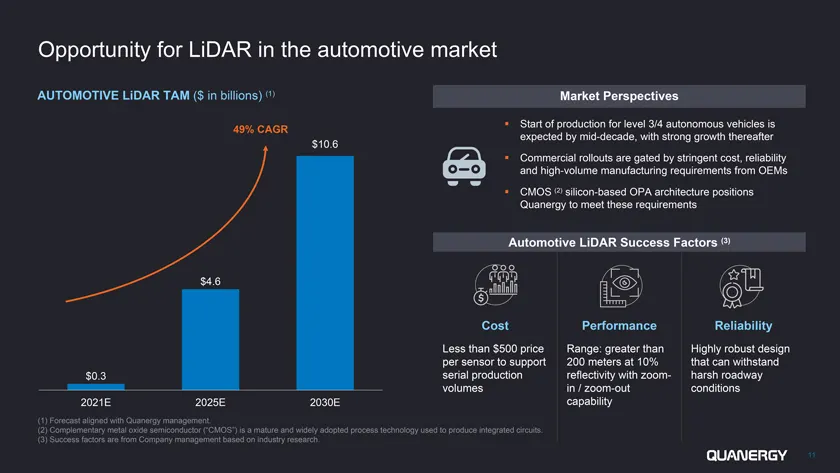
Opportunity for LiDAR in the automotive market AUTOMOTIVE LiDAR TAM ($ in billions) (1) Market Perspectives 49% CAGR Start of production for level 3/4 autonomous vehicles is expected by mid-decade, with strong growth thereafter $10.6 Commercial rollouts are gated by stringent cost, reliability and h
Slide 12: OPA – a next-generation solid-state LIDAR technology
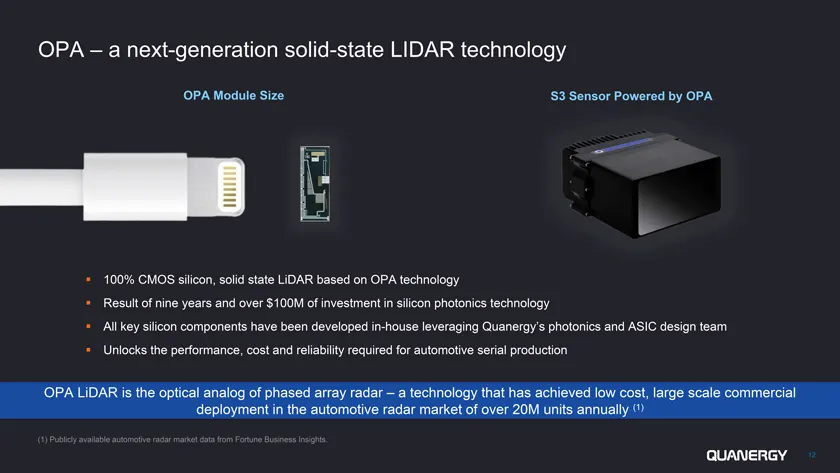
OPA – a next-generation solid-state LIDAR technology OPA Module Size S3 Sensor Powered by OPA 100% CMOS silicon, solid state LiDAR based on OPA technology Result of nine years and over $100M of investment in silicon photonics technology All key silicon components have been developed in-house leverag
Slide 13: Why OPA is expected to be a winning automotive LiDAR technology
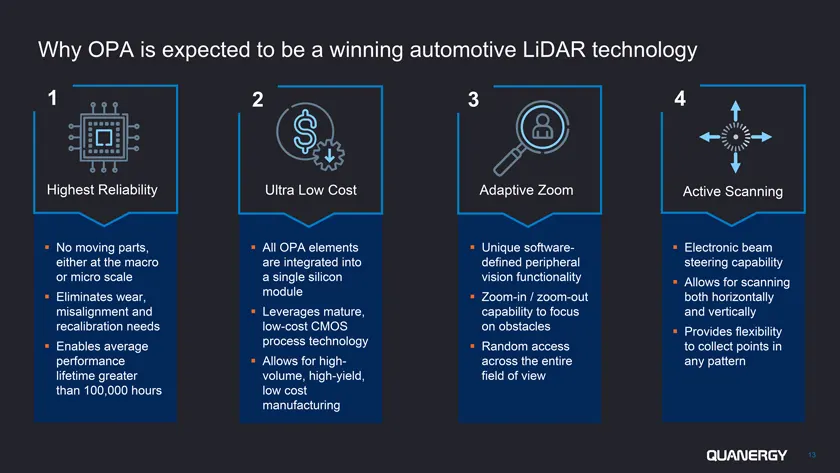
Why OPA is expected to be a winning automotive LiDAR technology 1 2 3 4 Highest Reliability Ultra Low Cost Adaptive Zoom Active Scanning No moving parts, All OPA elements Unique software- Electronic beam either at the macro are integrated into defined peripheral steering capability or micro scale a
Slide 14: OPA compared to other automotive LiDAR technologies
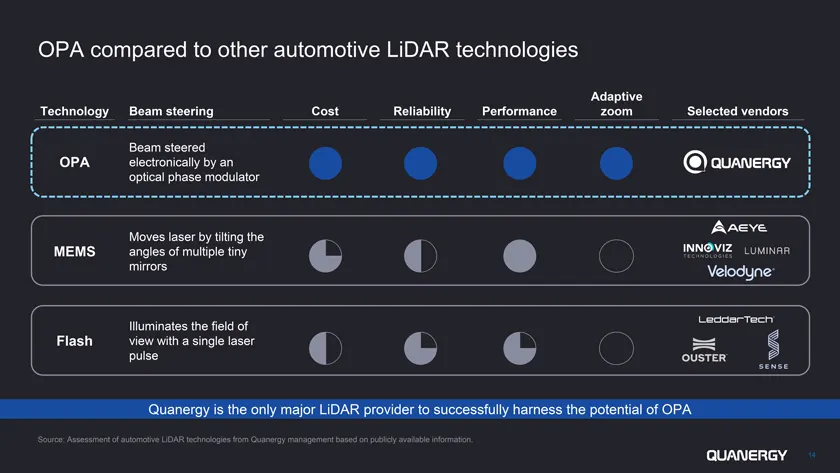
OPA compared to other automotive LiDAR technologies Adaptive Technology Beam steering Cost Reliability Performance zoom Selected vendors Beam steered OPA electronically by an optical phase modulator Moves laser by tilting the MEMS angles of multiple tiny mirrors Illuminates the field of Flash view w
Slide 15: OPA performance acceleration plan
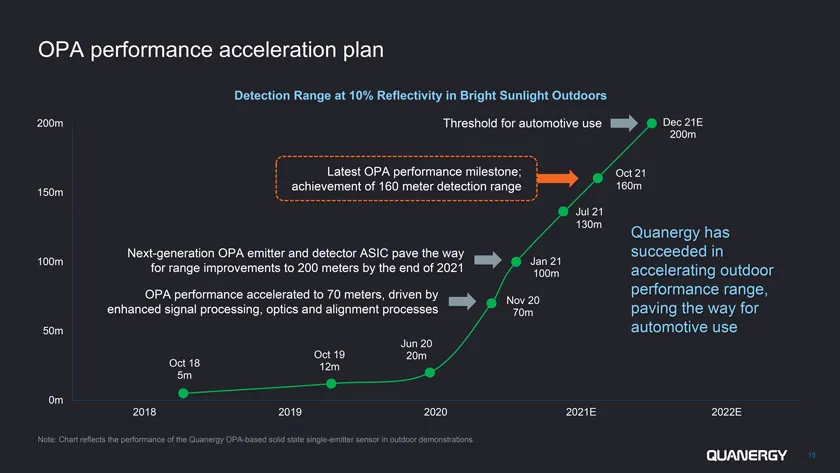
OPA performance acceleration plan Detection Range at 10% Reflectivity in Bright Sunlight Outdoors 200m Threshold for automotive use Dec 21E 200m Oct 21 160m 150m Jul 21 130m Quanergy has Next-generation OPA emitter and detector ASIC pave the way succeeded in 100m for range improvements to 200 meters
Slide 16: Alignment with automotive industry leaders
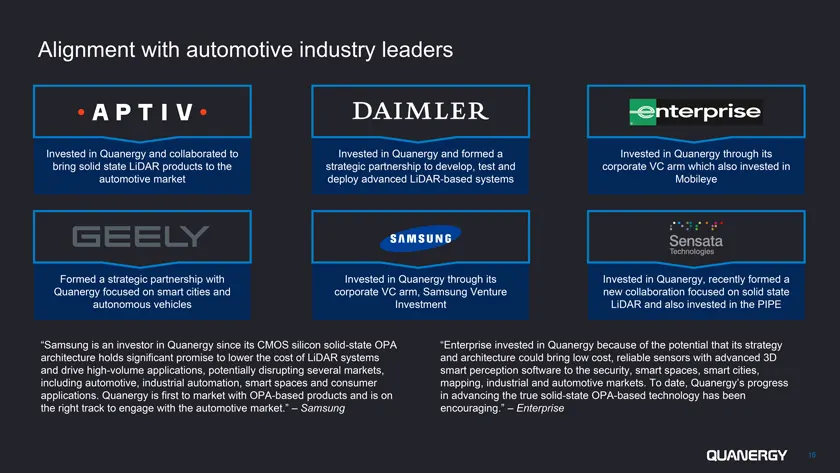
Alignment with automotive industry leaders Invested in Quanergy and collaborated to Invested in Quanergy and formed a Invested in Quanergy through its bring solid state LiDAR products to the strategic partnership to develop, test and corporate VC arm which also invested in automotive market deploy a
Slide 17: Today's agenda
Today’s agenda 01 Introduction 02 Automotive opportunity 03 IoT opportunity 04 Financial summary 05 Transaction overview 17
Slide 18: Opportunity for LiDAR and 3D perception in IoT markets
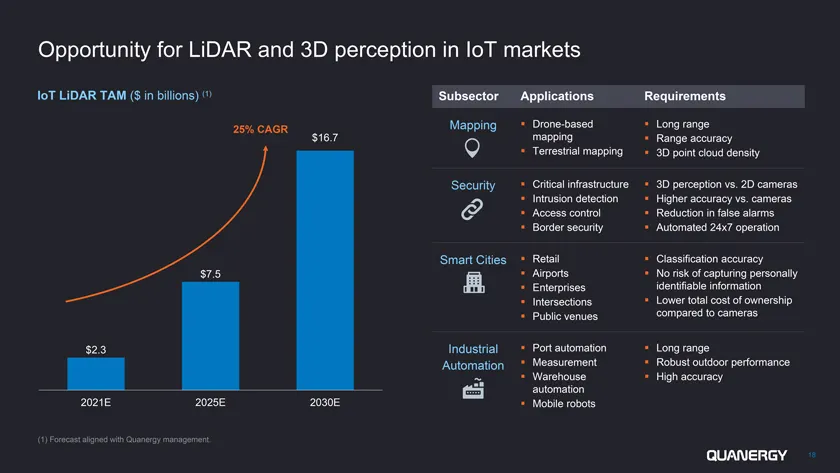
Opportunity for LiDAR and 3D perception in IoT markets IoT LiDAR TAM ($ in billions) (1) Subsector Applications Requirements 25% CAGR Mapping Drone-based Long range $16.7 mapping Range accuracy Terrestrial mapping 3D point cloud density Security Critical infrastructure 3D perception vs. 2D cameras I
Slide 19: Quanergy's IoT solutions deliver actionable insights
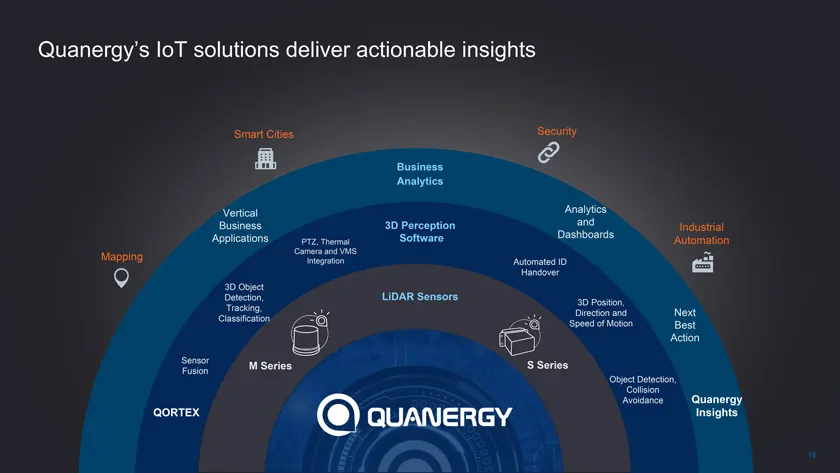
Quanergy’s IoT solutions deliver actionable insights Smart Cities Security Business Analytics Vertical Analytics Business 3D Perception and Industrial Applications Software Dashboards PTZ, Thermal Automation Mapping Camera and VMS Integration Automated ID Handover 3D Object Detection, LiDAR Sensors
Slide 20: Best-in-class 3D perception for IoT applications
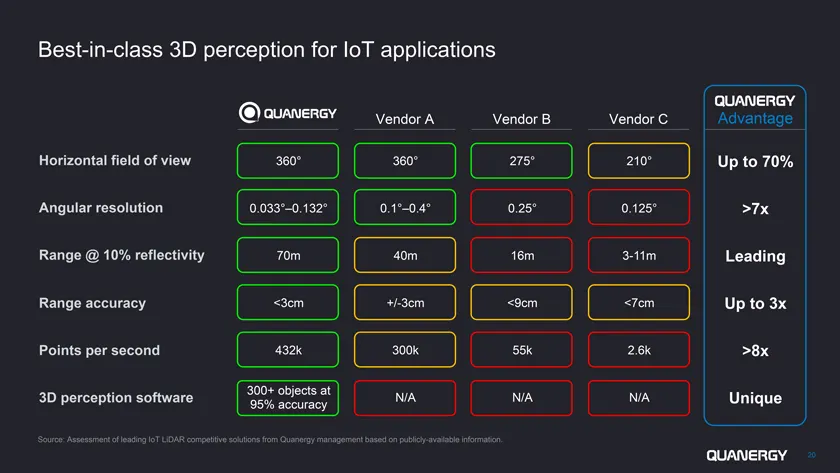
Best-in-class 3D perception for IoT applications Vendor A Vendor B Vendor C Advantage Horizontal field of view 360° 360° 275° 210° Up to 70% Angular resolution 0.033°–0.132° 0.1°–0.4° 0.25° 0.125° >7x Range @ 10% reflectivity 70m 40m 16m 3-11m Leading Range accuracy <3cm +/-3cm <9cm <7cm Up to 3x Po
Slide 21: Accelerating IoT innovation velocity
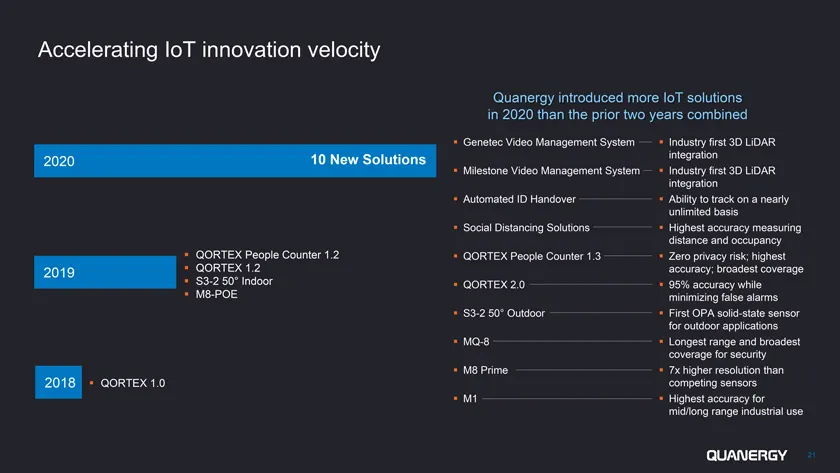
Accelerating IoT innovation velocity Quanergy introduced more IoT solutions in 2020 than the prior two years combined Genetec Video Management System Industry first 3D LiDAR 2020 10 New Solutions integration Milestone Video Management System Industry first 3D LiDAR integration Automated ID Handover
Slide 22: Quanergy IoT solutions in action
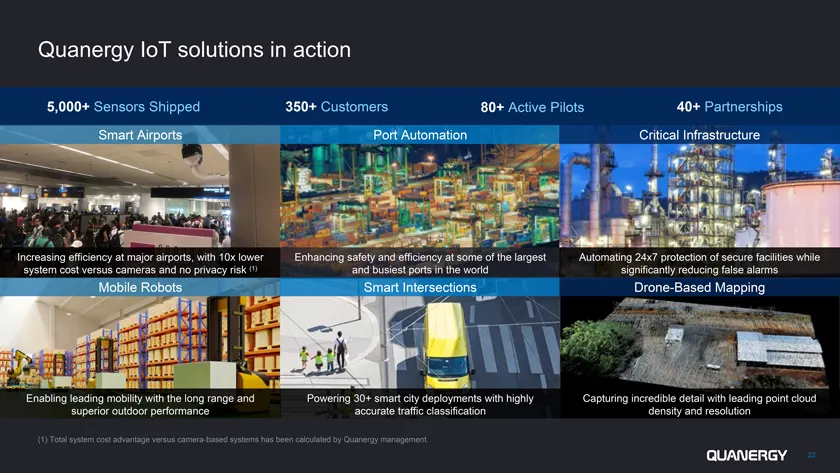
Quanergy IoT solutions in action 5,000+ Sensors Shipped 350+ Customers 80+ Active Pilots 40+ Partnerships Smart Airports Port Automation Critical Infrastructure Increasing efficiency at major airports, with 10x lower Enhancing safety and efficiency at some of the largest Automating 24x7 protection o
Slide 23: Target IoT ecosystem
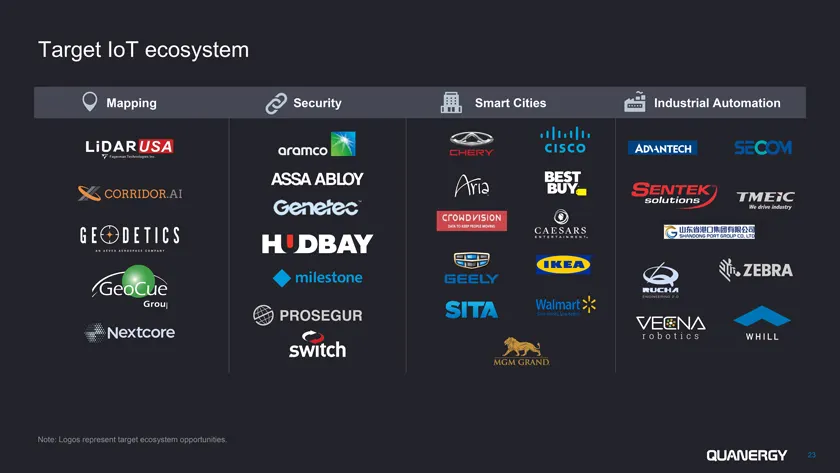
Target IoT ecosystem Mapping Security Smart Cities Industrial Automation Note: Logos represent target ecosystem opportunities. 23
Slide 24: Today's agenda
Today’s agenda 01 Introduction 02 Automotive opportunity 03 IoT opportunity 04 Financial summary 05 Transaction overview 24
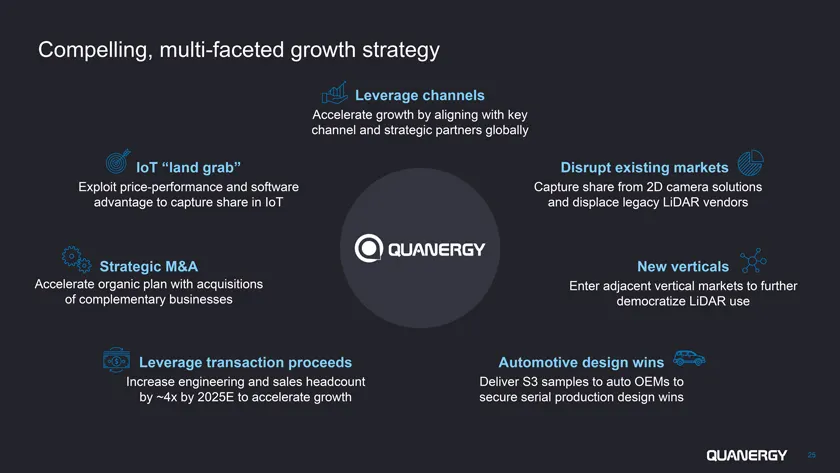
Slide 25: Compelling, multi-faceted growth strategy
Compelling, multi-faceted growth strategy Leverage channels Accelerate growth by aligning with key channel and strategic partners globally IoT “land grab” Disrupt existing markets Exploit price-performance and software Capture share from 2D camera solutions advantage to capture share in IoT and disp
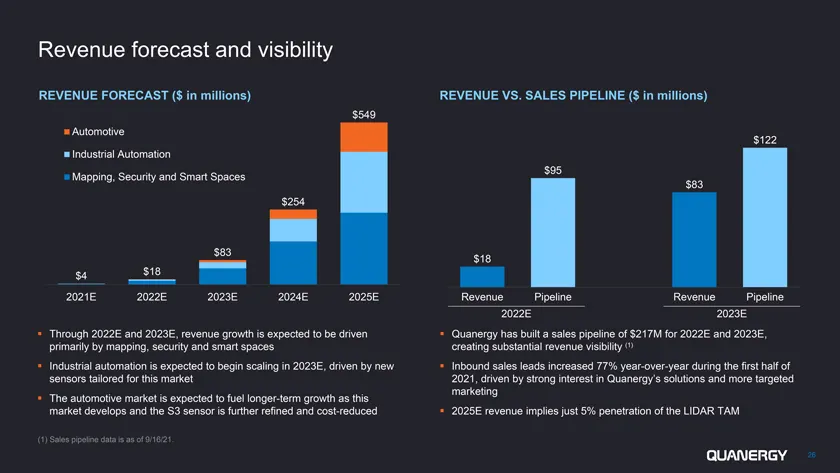
Slide 26: Revenue forecast and visibility
Revenue forecast and visibility REVENUE FORECAST ($ in millions) REVENUE VS. SALES PIPELINE ($ in millions) $549 Automotive $122 Industrial Automation $95 Mapping, Security and Smart Spaces $83 $254 $83 $18 $4 $18 2021E 2022E 2023E 2024E 2025E Revenue Pipeline Revenue Pipeline 2022E 2023E Through 20
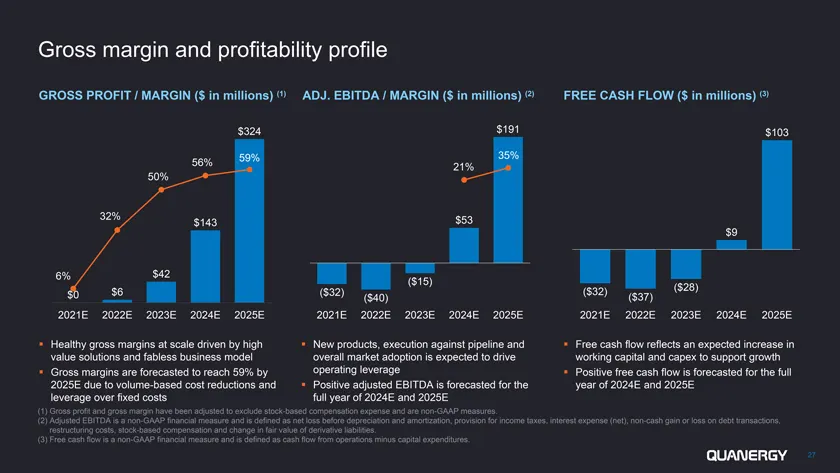
Slide 27: Gross margin and profitability profile
Gross margin and profitability profile GROSS PROFIT / MARGIN ($ in millions) (1) ADJ. EBITDA / MARGIN ($ in millions) (2) FREE CASH FLOW ($ in millions) (3) $324 $191 $103 59% 35% 56% 21% 50% 32% $53 $143 $9 6% $42 ($15) $6 ($32) ($32) ($28) $0 ($40) ($37) 2021E 2022E 2023E 2024E 2025E 2021E 2022E 2
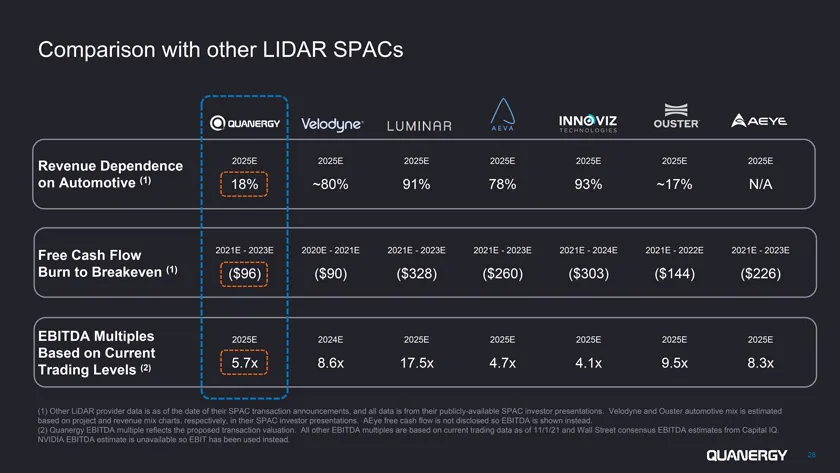
Slide 28: Comparison with other LIDAR SPACs
Comparison with other LIDAR SPACs Revenue Dependence 2025E 2025E 2025E 2025E 2025E 2025E 2025E on Automotive (1) ~80% 91% 78% 93% ~17% N/A Free Cash Flow 2021E—2023E 2020E—2021E 2021E—2023E 2021E—2023E 2021E—2024E 2021E—2022E 2021E—2023E Burn to Breakeven (1) ($90) ($328) ($260) ($303) ($144) ($226)
Slide 29: Today's agenda
Today’s agenda 01 Introduction 02 Automotive opportunity 03 IoT opportunity 04 Financial summary 05 Transaction overview 29
Slide 30: Transaction summary and pro forma ownership
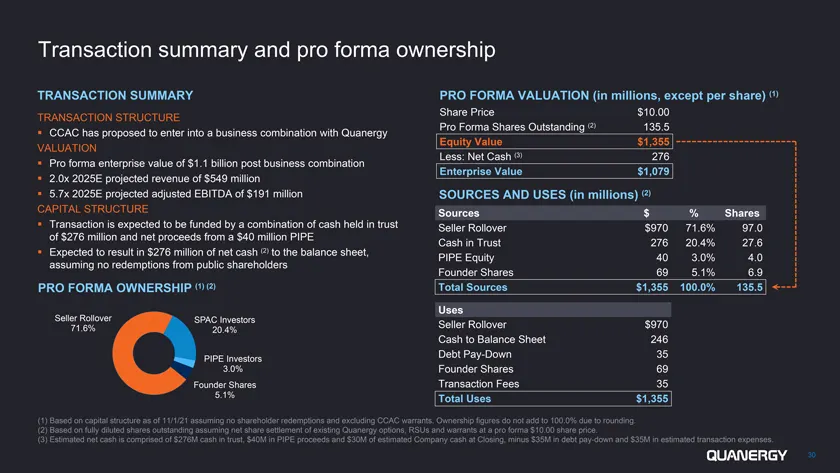
Transaction summary and pro forma ownership TRANSACTION SUMMARY PRO FORMA VALUATION (in millions, except per share) (1) Share Price $10.00 TRANSACTION STRUCTURE Pro Forma Shares Outstanding (2) 135.5 CCAC has proposed to enter into a business combination with Quanergy Equity Value $1,355 VALUATION L
Slide 31: Select peers operational benchmarking
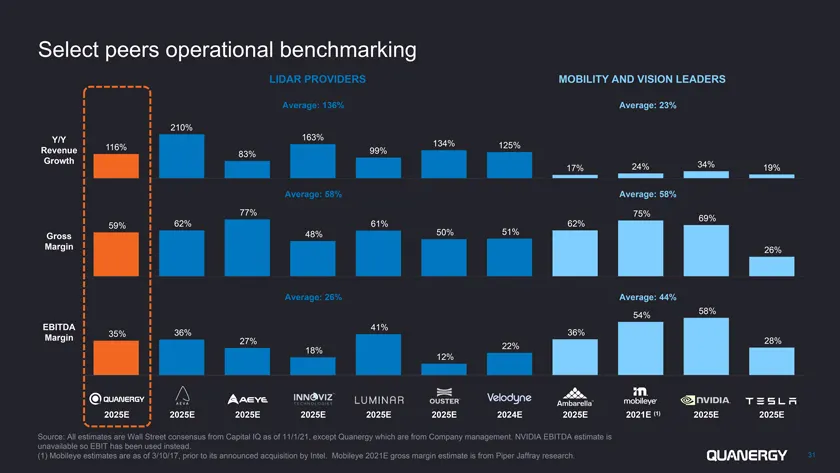
Select peers operational benchmarking LIDAR PROVIDERS MOBILITY AND VISION LEADERS Average: 136% Average: 23% 210% Y/Y 163% 116% 134% 125% Revenue 83% 99% Growth 34% 17% 24% 19% Average: 58% Average: 58% 77% 75% 69% 59% 62% 61% 62% Gross 48% 50% 51% Margin 26% Average: 26% Average: 44% 54% 58% EBITDA
Slide 32: Select peers valuation benchmarking
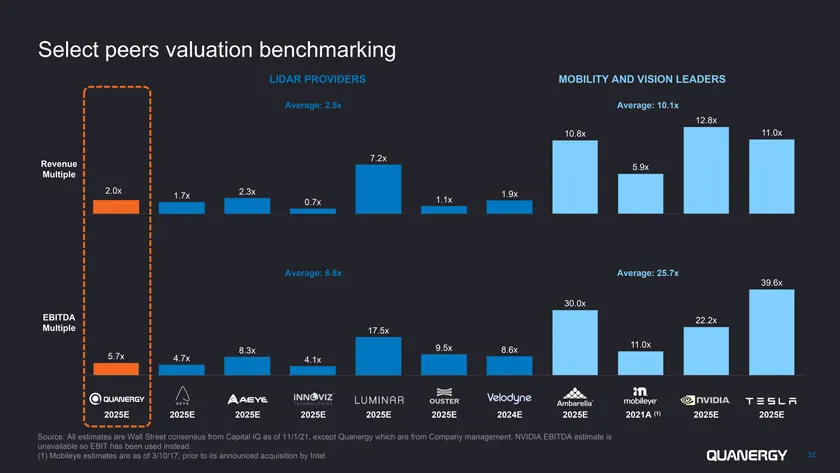
Select peers valuation benchmarking LIDAR PROVIDERS MOBILITY AND VISION LEADERS Average: 2.5x Average: 10.1x 12.8x 10.8x 11.0x 7.2x Revenue 5.9x Multiple 2.0x 2.3x 1.9x 1.7x 1.1x 0.7x Average: 8.8x Average: 25.7x 39.6x 30.0x EBITDA 22.2x Multiple 17.5x 9.5x 11.0x 8.3x 8.6x 5.7x 4.7x 4.1x 2025E 2025E
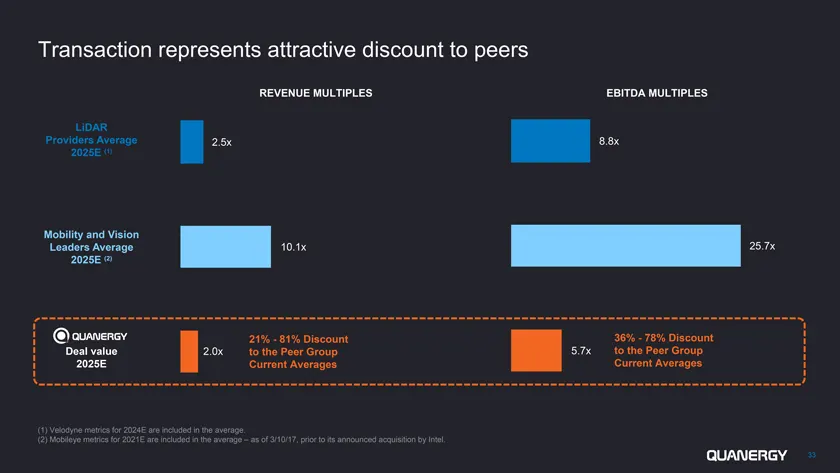
Slide 33: Transaction represents attractive discount to peers
Transaction represents attractive discount to peers REVENUE MULTIPLES EBITDA MULTIPLES LiDAR Providers Average 2.5x 8.8x 2025E (1) Mobility and Vision Leaders Average 10.1x 25.7x 2025E (2) 21%—81% Discount 36%—78% Discount Deal value 2.0x to the Peer Group 5.7x to the Peer Group 2025E Current Averag

Slide 34: @) quanercy
@) quanercy
Source: SEC EDGAR · 425 filed Nov 2, 2021