Sundance Energy — Sundance Energy Australia — Investor Presentation (August 2017)
20 slides from Sundance Energy's investor presentation, Aug 18, 2017

Slide 1: Disclaimers
Disclaimers This presentation has been prepared by Sundance Energy Australia Limited (ABN 76 112 202 883). Summary information This presentation contains summary information about Sundance and its activities current as at 7 August 2017 ("Information"). The Information in this presentation is subject
Slide 2: Executive Summary
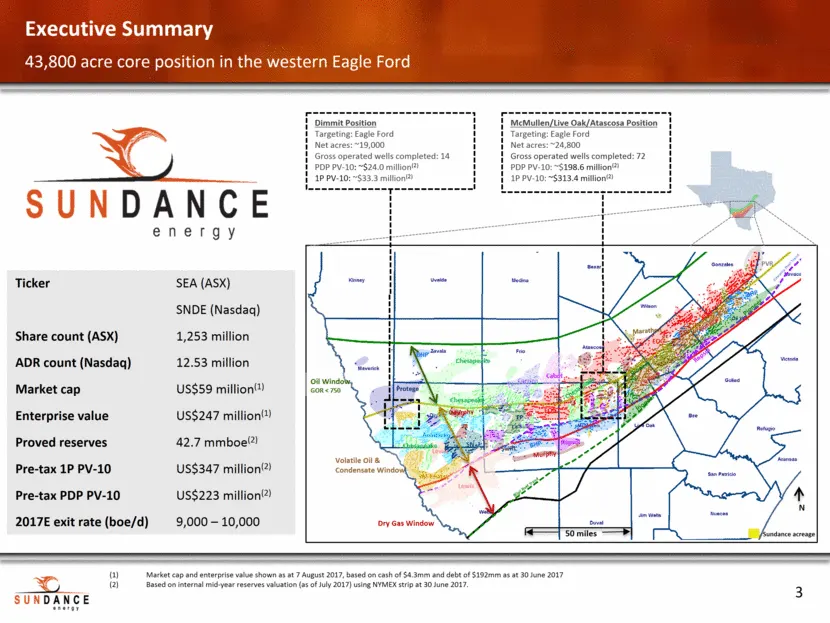
EOG EOG EOG Protege Chesapeake Murphy Anadarko SM-Energy Pioneer Pioneer Pioneer Conoco Conoco Cabot Chesapeake Chesapeake Repsol Repsol Marathon BHP BHP Chesapeake Marathon N Murphy Swift 50 miles Oil Window GOR < 750 Volatile Oil & Condensate Window Dry Gas Window Carrizo PVR Sundance acreage Lewi
Slide 3: Evolution In The Eagle Ford – Building Critical Mass
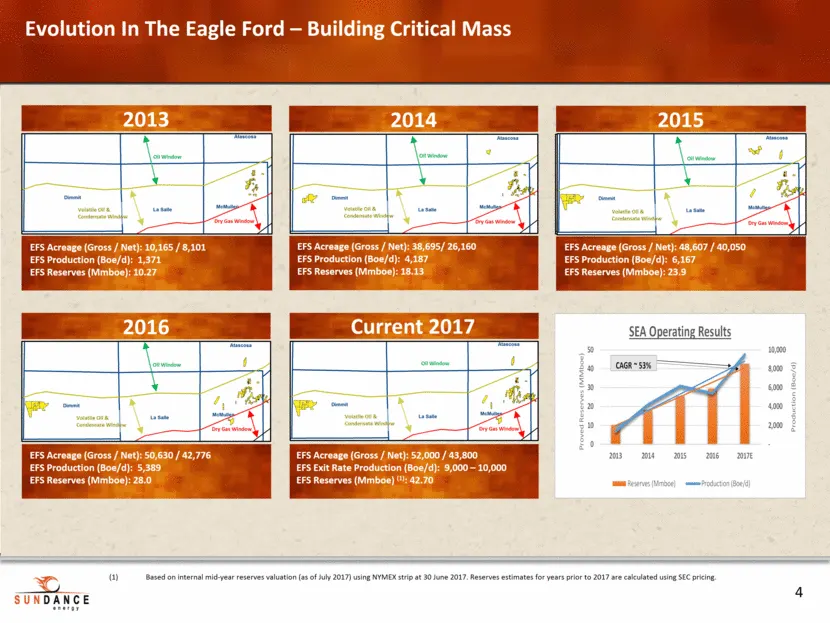
Evolution In The Eagle Ford – Building Critical Mass 2013 2014 EFS Acreage (Gross / Net): 10,165 / 8,101 EFS Production (Boe/d): 1,371 EFS Reserves (Mmboe): 10.27 EFS Acreage (Gross / Net): 38,695/ 26,160 EFS Production (Boe/d): 4,187 EFS Reserves (Mmboe): 18.13 2015 EFS Acreage (Gross / Net): 48,60
Slide 4: Pure play Eagle Ford aggregator
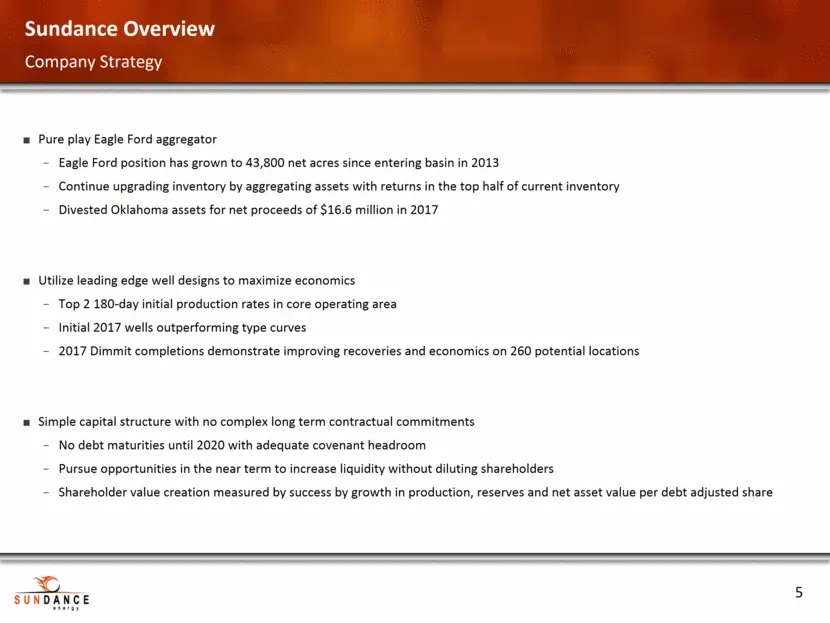
Pure play Eagle Ford aggregator Eagle Ford position has grown to 43,800 net acres since entering basin in 2013 Continue upgrading inventory by aggregating assets with returns in the top half of current inventory Divested Oklahoma assets for net proceeds of $16.6 million in 2017 Utilize leading edge
Slide 5: Drilling completed for 2017
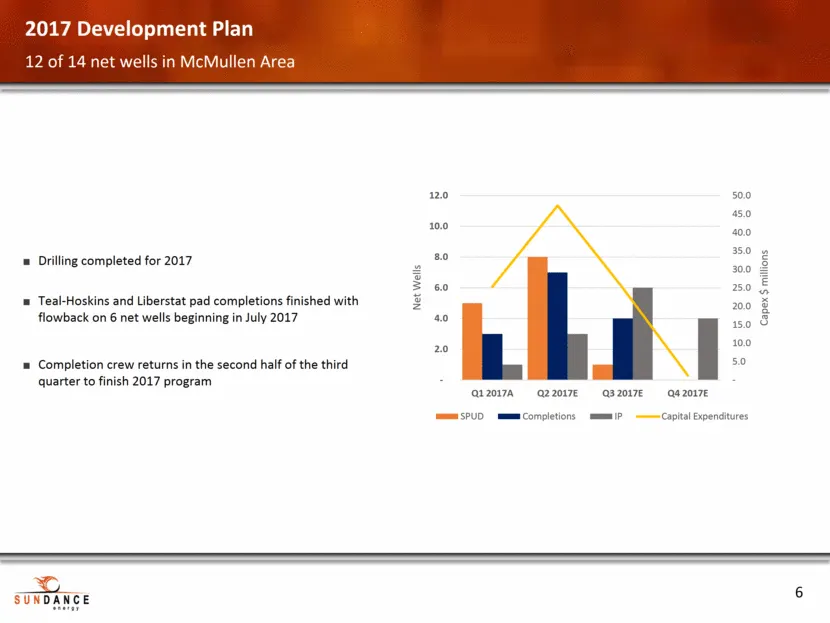
Drilling completed for 2017 Teal-Hoskins and Liberstat pad completions finished with flowback on 6 net wells beginning in July 2017 Completion crew returns in the second half of the third quarter to finish 2017 program 2017 Development Plan 12 of 14 net wells in McMullen Area - 5.0 10.0 15.0 20.0 25
Slide 6: 2017 Development Plan: production growth
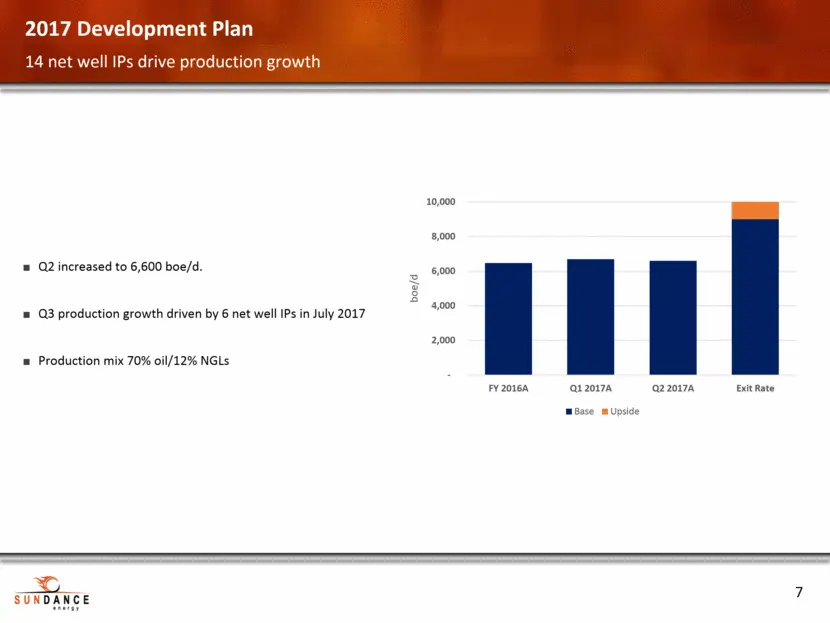
Q2 increased to 6,600 boe/d. Q3 production growth driven by 6 net well IPs in July 2017 Production mix 70% oil/12% NGLs 2017 Development Plan 14 net well IPs drive production growth - 2,000 4,000 6,000 8,000 10,000 FY 2016A Q1 2017A Q2 2017A Exit Rate boe/d Base Upside
Slide 7: 2017 Development Plan: YTD well results outperforming type curves
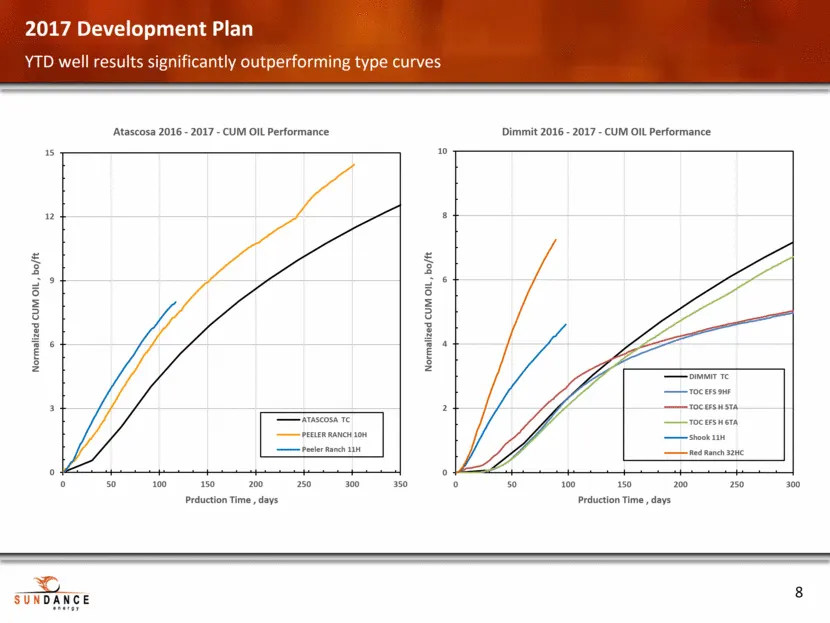
2017 Development Plan YTD well results significantly outperforming type curves 0 3 6 9 12 15 0 50 100 150 200 250 300 350 Normalized CUM OIL , bo/ft Prduction Time , days Atascosa 2016 - 2017 - CUM OIL Performance ATASCOSA TC PEELER RANCH 10H Peeler Ranch 11H 0 2 4 6 8 10 0 50 100 150 200 250 300 No
Slide 8: 2017 Development Plan: YTD well results outperforming type curves
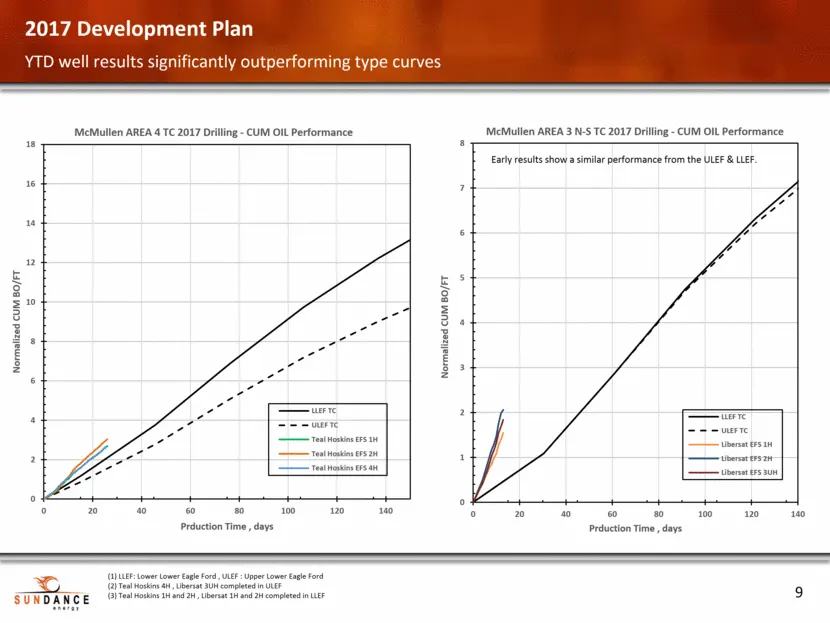
2017 Development Plan YTD well results significantly outperforming type curves LLEF: Lower Lower Eagle Ford , ULEF : Upper Lower Eagle Ford Teal Hoskins 4H , Libersat 3UH completed in ULEF Teal Hoskins 1H and 2H , Libersat 1H and 2H completed in LLEF Early results show a similar performance from the
Slide 9: 2017 Development Plan Cost structure
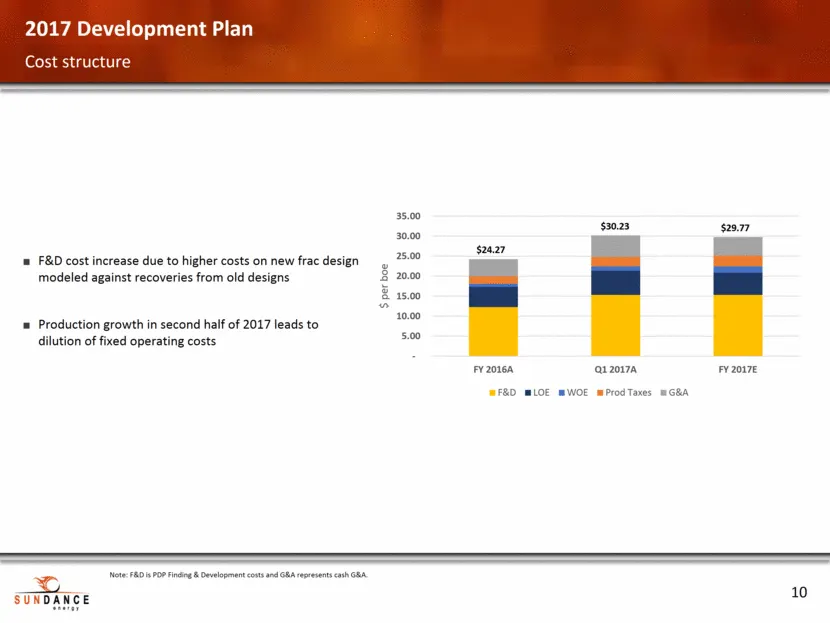
2017 Development Plan Cost structure Note: F&D is PDP Finding & Development costs and G&A represents cash G&A. F&D cost increase due to higher costs on new frac design modeled against recoveries from old designs Production growth in second half of 2017 leads to dilution of fixed operating costs - 5.
Slide 10: Overview of Vitol Revenue Advance Facility
Key Benefits / Features $30MM revenue advance repaid through delivery of oil production Addresses near-term liquidity constraints, allowing for execution of 2017 business plan Principal balance is repaid at a rate of $20/bbl in Q4 ’17, and $25/bbl in Q1 ’18 Continue to receive market price for crude
Slide 11: Balance Sheet & Hedges
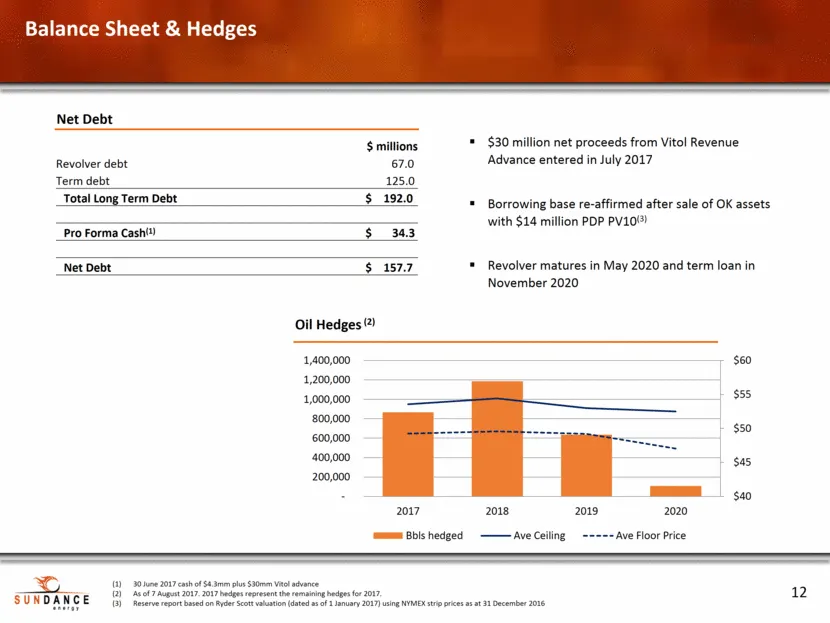
Balance Sheet & Hedges Net Debt 30 June 2017 cash of $4.3mm plus $30mm Vitol advance As of 7 August 2017. 2017 hedges represent the remaining hedges for 2017. Reserve report based on Ryder Scott valuation (dated as of 1 January 2017) using NYMEX strip prices as at 31 December 2016 Oil Hedges (2) $ m
Slide 12: McMullen, Atascosa and Live Oak Counties Asset Overview
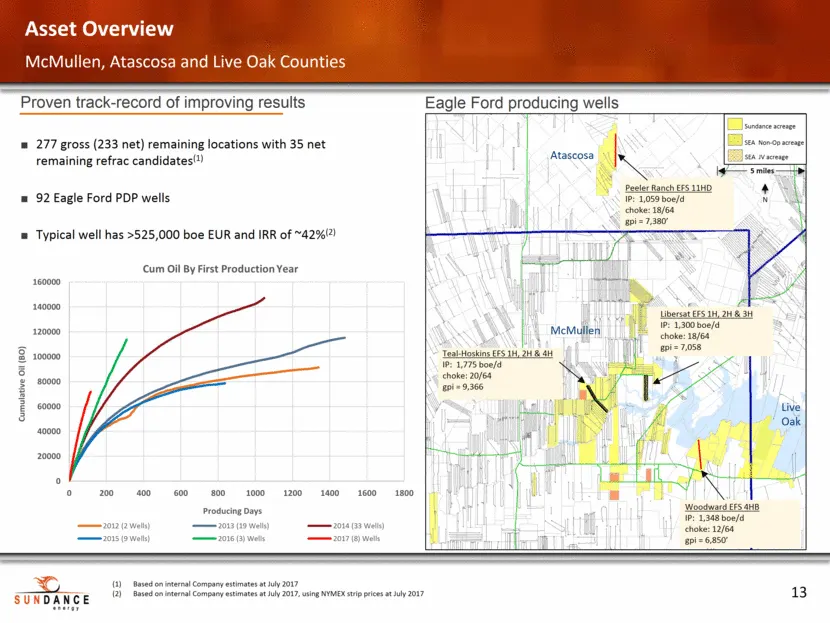
277 gross (233 net) remaining locations with 35 net remaining refrac candidates(1) 92 Eagle Ford PDP wells Typical well has >525,000 boe EUR and IRR of ~42%(2) McMullen, Atascosa and Live Oak Counties Asset Overview Proven track-record of improving results Eagle Ford producing wells N 5 miles Atasco
Slide 13: Dimmit County Asset Overview
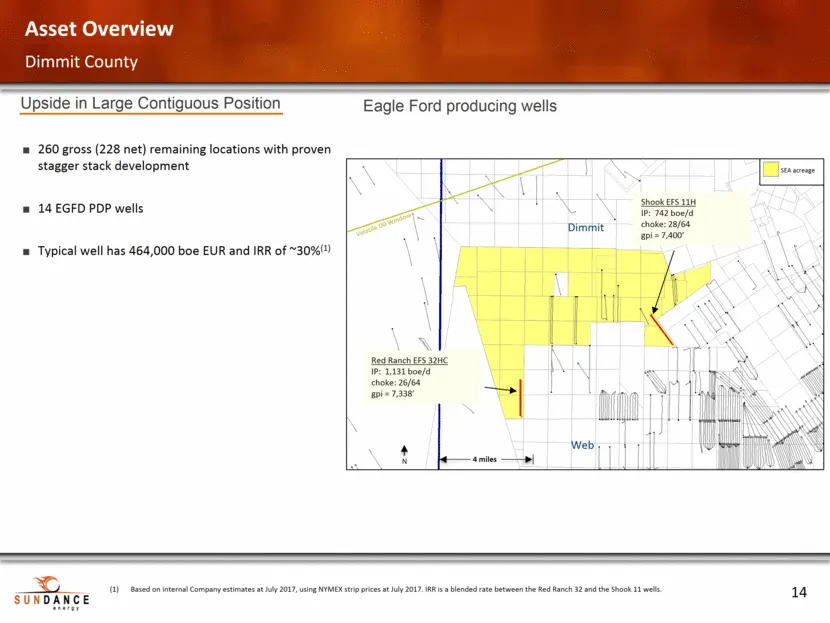
Dimmit County Asset Overview Upside in Large Contiguous Position Eagle Ford producing wells 260 gross (228 net) remaining locations with proven stagger stack development 14 EGFD PDP wells Typical well has 464,000 boe EUR and IRR of ~30%(1) N 4 miles Dimmit Volatile Oil Window SEA acreage Web Red Ran
Slide 14: Eagle Ford Inventory Analysis
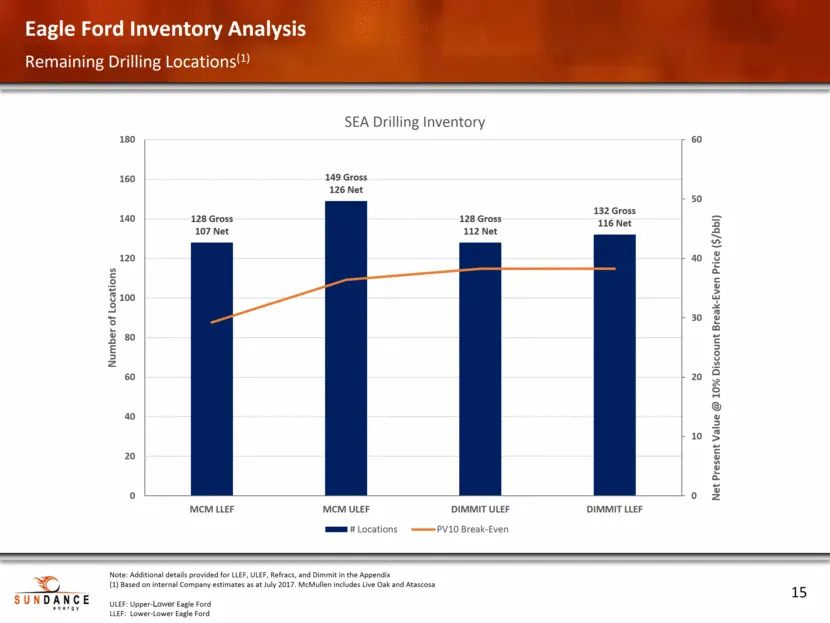
Eagle Ford Inventory Analysis Remaining Drilling Locations(1) Note: Additional details provided for LLEF, ULEF, Refracs, and Dimmit in the Appendix (1) Based on internal Company estimates as at July 2017. McMullen includes Live Oak and Atascosa ULEF: Upper-Lower Eagle Ford LLEF: Lower-Lower Eagle Fo
Slide 15: Summary
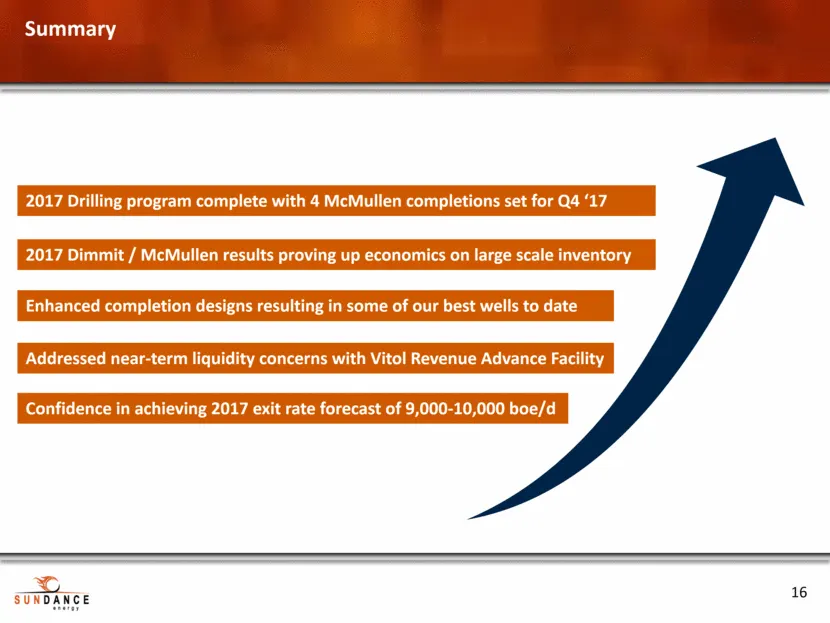
Summary 2017 Dimmit / McMullen results proving up economics on large scale inventory Enhanced completion designs resulting in some of our best wells to date Confidence in achieving 2017 exit rate forecast of 9,000-10,000 boe/d 2017 Drilling program complete with 4 McMullen completions set for Q4 ‘17
Slide 16: Appendix
Appendix
Slide 17: Management team
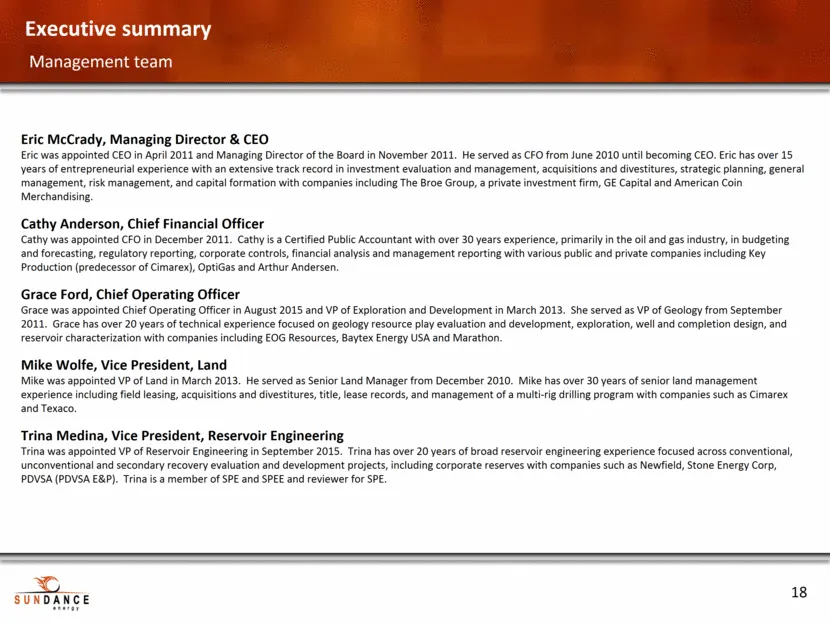
Executive summary Management team Eric McCrady, Managing Director & CEO Eric was appointed CEO in April 2011 and Managing Director of the Board in November 2011. He served as CFO from June 2010 until becoming CEO. Eric has over 15 years of entrepreneurial experience with an extensive track record in
Slide 18: Board of Directors
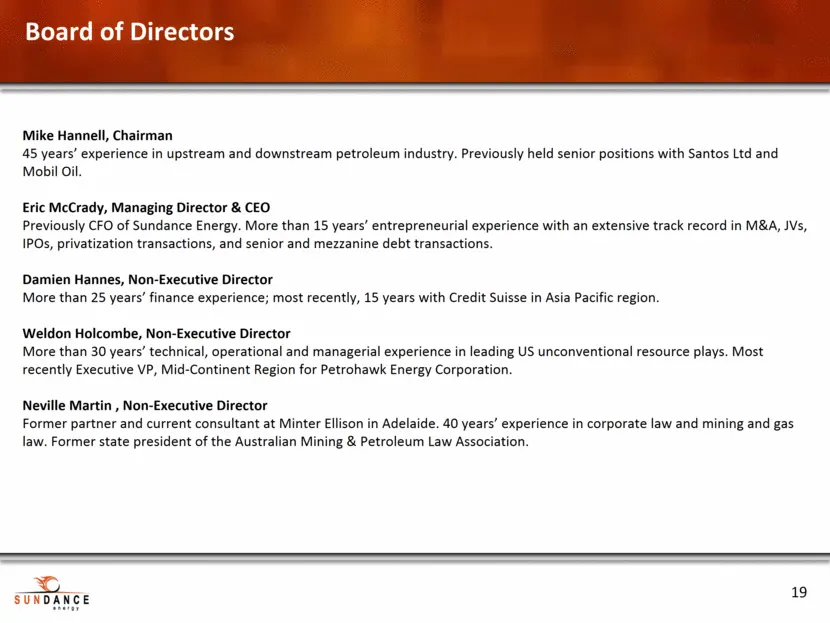
Board of Directors Mike Hannell, Chairman 45 years’ experience in upstream and downstream petroleum industry. Previously held senior positions with Santos Ltd and Mobil Oil. Eric McCrady, Managing Director & CEO Previously CFO of Sundance Energy. More than 15 years’ entrepreneurial experience with a
Slide 19: Hedge Summary
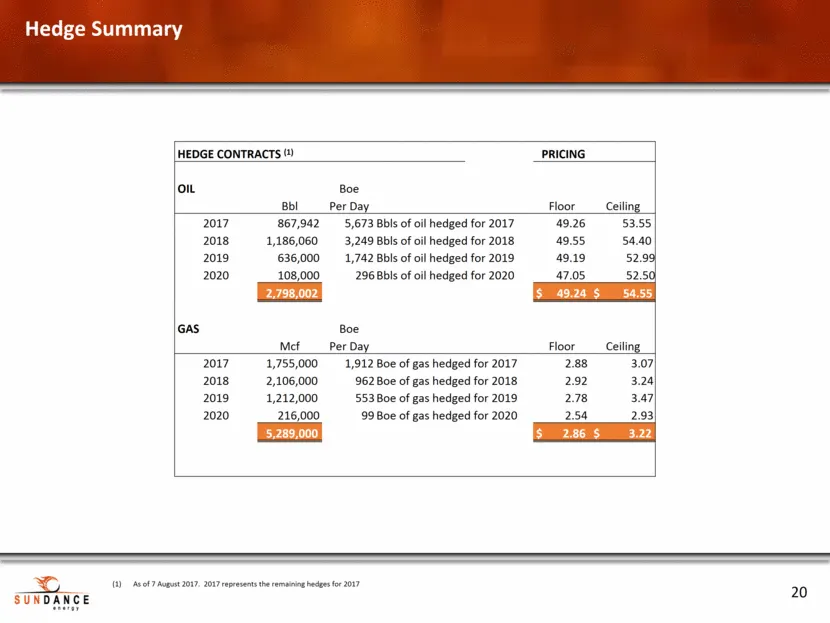
Hedge Summary As of 7 August 2017. 2017 represents the remaining hedges for 2017 HEDGE CONTRACTS (1) PRICING OIL Boe Bbl Per Day Floor Ceiling 2017 867,942 5,673 Bbls of oil hedged for 2017 49.26 53.55 2018 1,186,060 3,249 Bbls of oil hedged for 2018 49.55 54.40 2019 636,000 1,742 Bbls of oil hedged
Slide 20: Hedge Summary
Hedge Summary HEDGE CONTRACTS () PRICING ‘on Boe Bbl__Per Day 2017 {867,942 5,673 Bbls of oil hedged for 2017 2018 «1,186,060 3,249 Bbls of oll hedged for 2018 2019 636,000 1,742 Bbls of oil hedged for 2019 2020 108,000 296 BbIs of oll hedged for 2020, Gas Boe Mcf___ Per Day Floor Ceiling _| 2017 1,
Source: SEC EDGAR · 6-K filed Aug 18, 2017
More decks from Sundance Energy Inc
 Investor Presentation (February 2020)25 slides · Feb 10, 2020
 Sundance Energy Australia — Q3 2019 Earnings Presentation24 slides · Nov 18, 2019
 Sundance Energy Australia — Q2 2019 Earnings Presentation25 slides · Aug 16, 2019
 Sundance Energy Australia — Investor Presentation (July 2019)19 slides · Jul 24, 2019
 Sundance Energy Australia — Investor Presentation (June 2019)16 slides · Jun 3, 2019
 Sundance Energy Australia — Q1 2019 Earnings Presentation17 slides · May 21, 2019