United Financial Bancorp — Rockville Financial — Sterne Agee Conference 2012
38 slides from United Financial Bancorp's conference presentation, Feb 13, 2012
Slide 1: Investor Update – Sterne Agee Conference
Transition NASDAQ RCKB February •Global Values 13, Select Success 2012Market Investor Update –Sterne Agee Conference
Slide 2: Forward Looking Statements
Forward This expectations looking “plans,” are forward-looking on after With THRD. behalf not Presentation the regard the The statements. “estimates,” date Looking ofonly data to us of the presentations in our means statement. presented forward-looking contains this Statements management Forward-loo
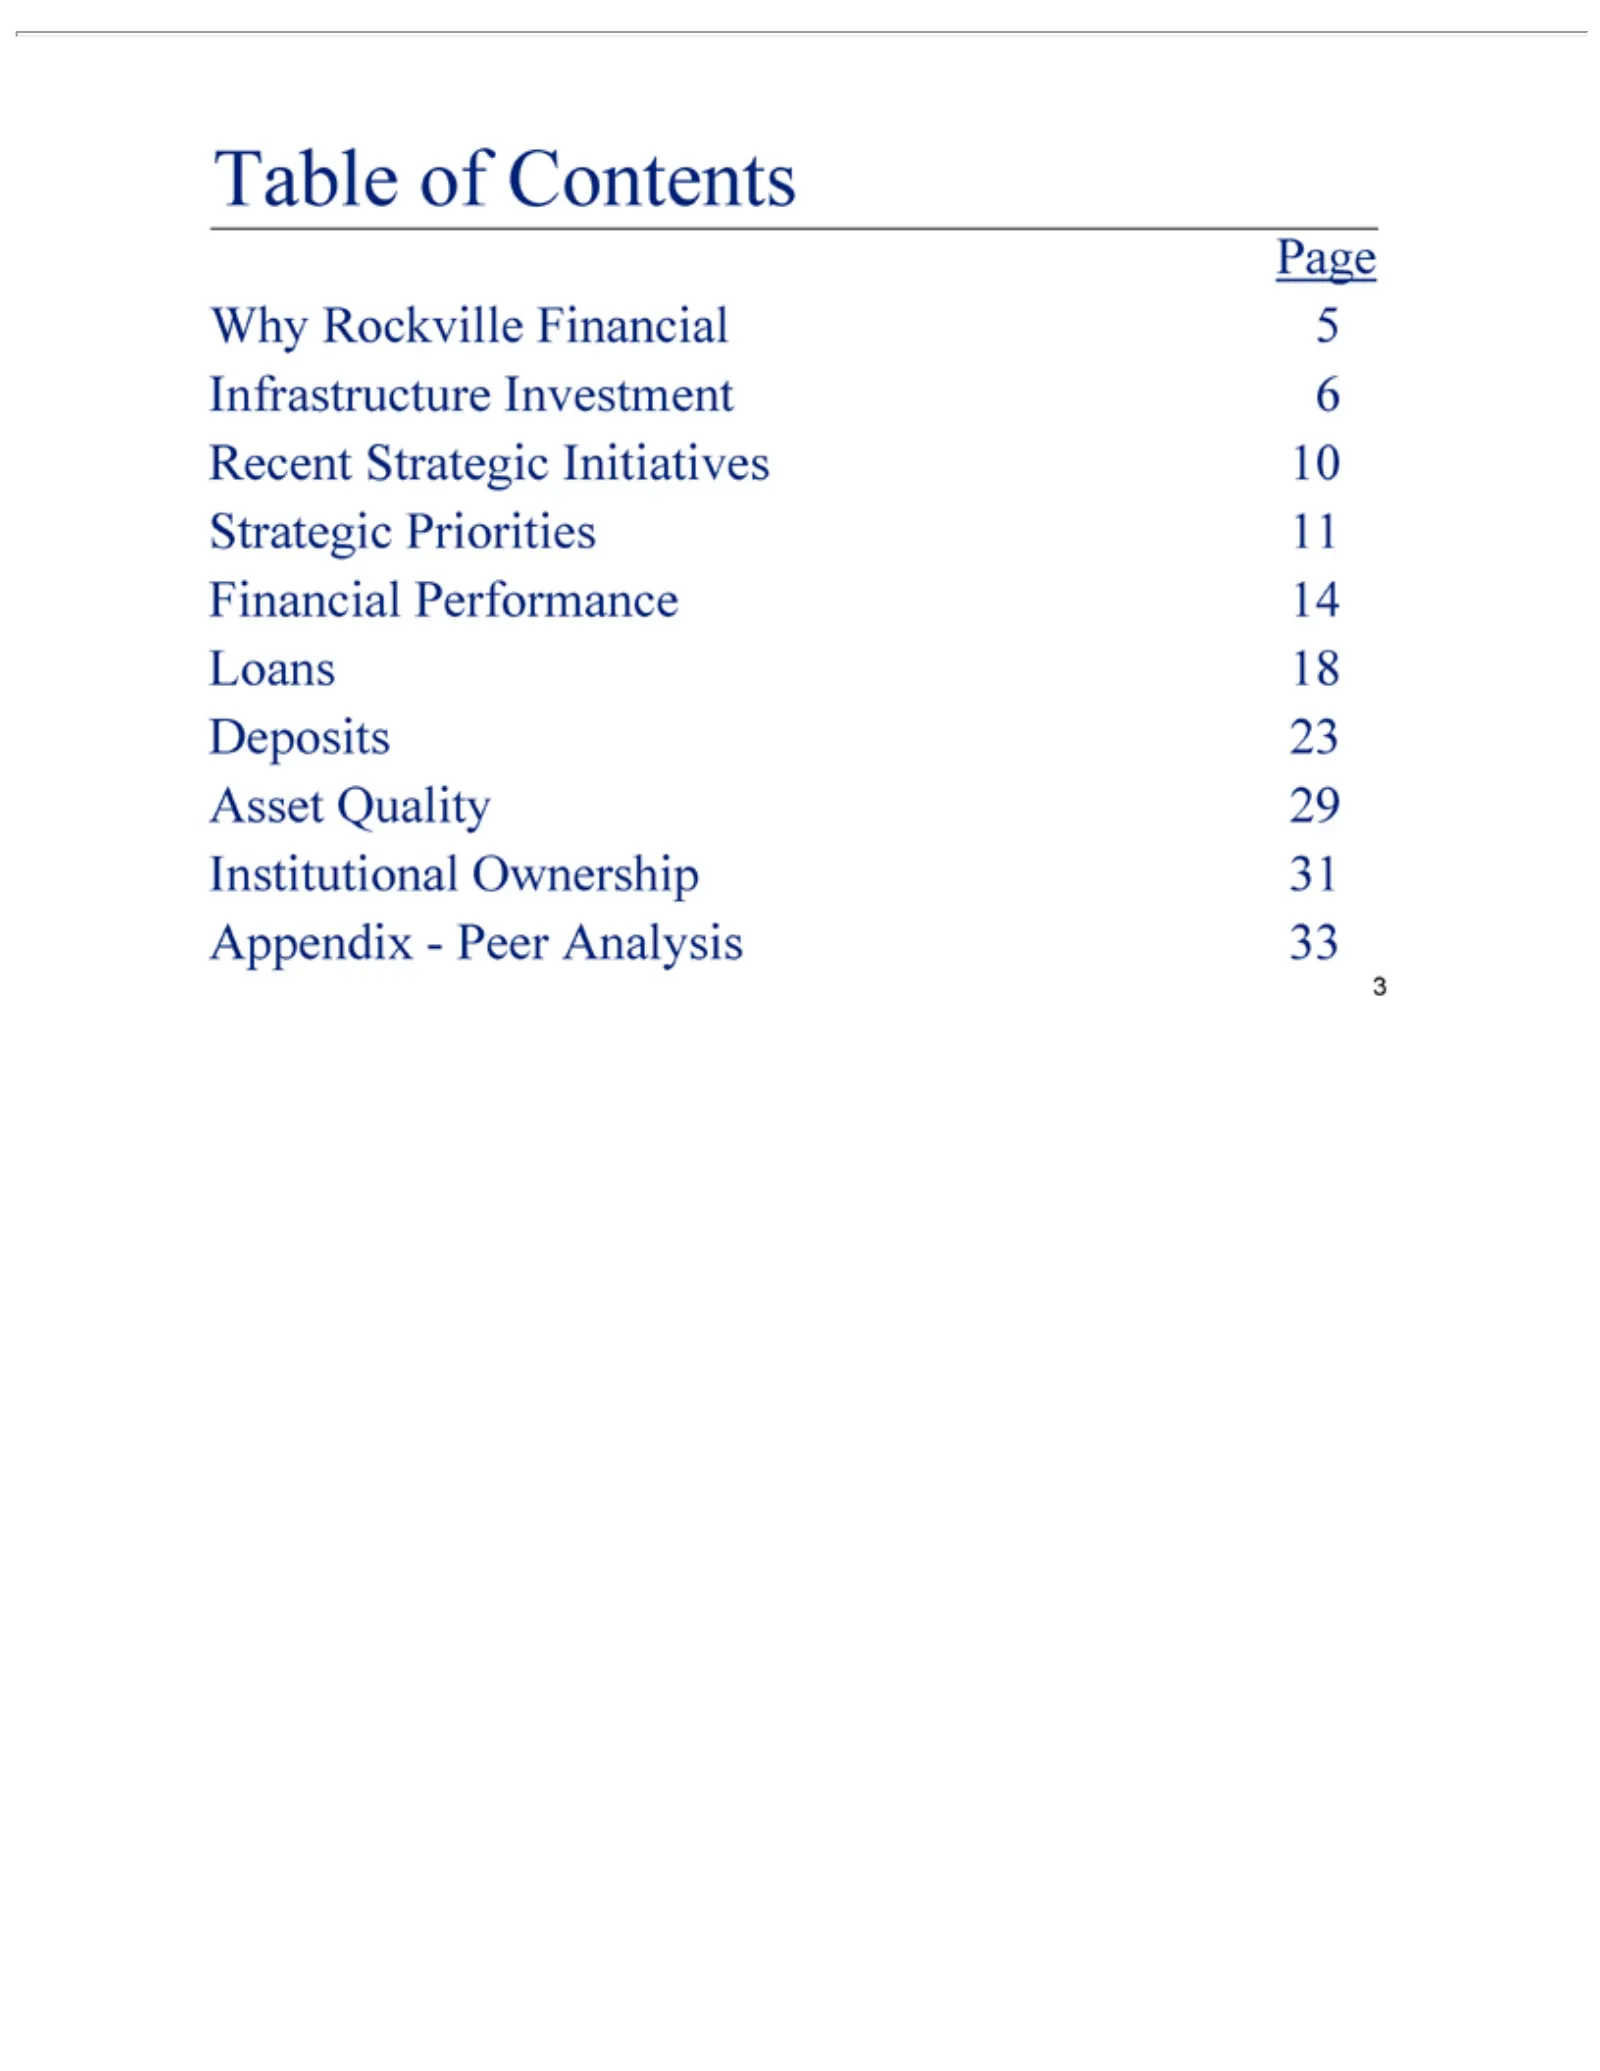
Slide 3: Table of Contents
TableRockville Why Page Infrastructure Recent Strategic Financial Loans Deposits Asset Institutional Appendix—Peer of Quality 18Strategic Contents 23 Priorities Performance Ownership Investment 29Financial Initiatives Analysis 11 14315633 10
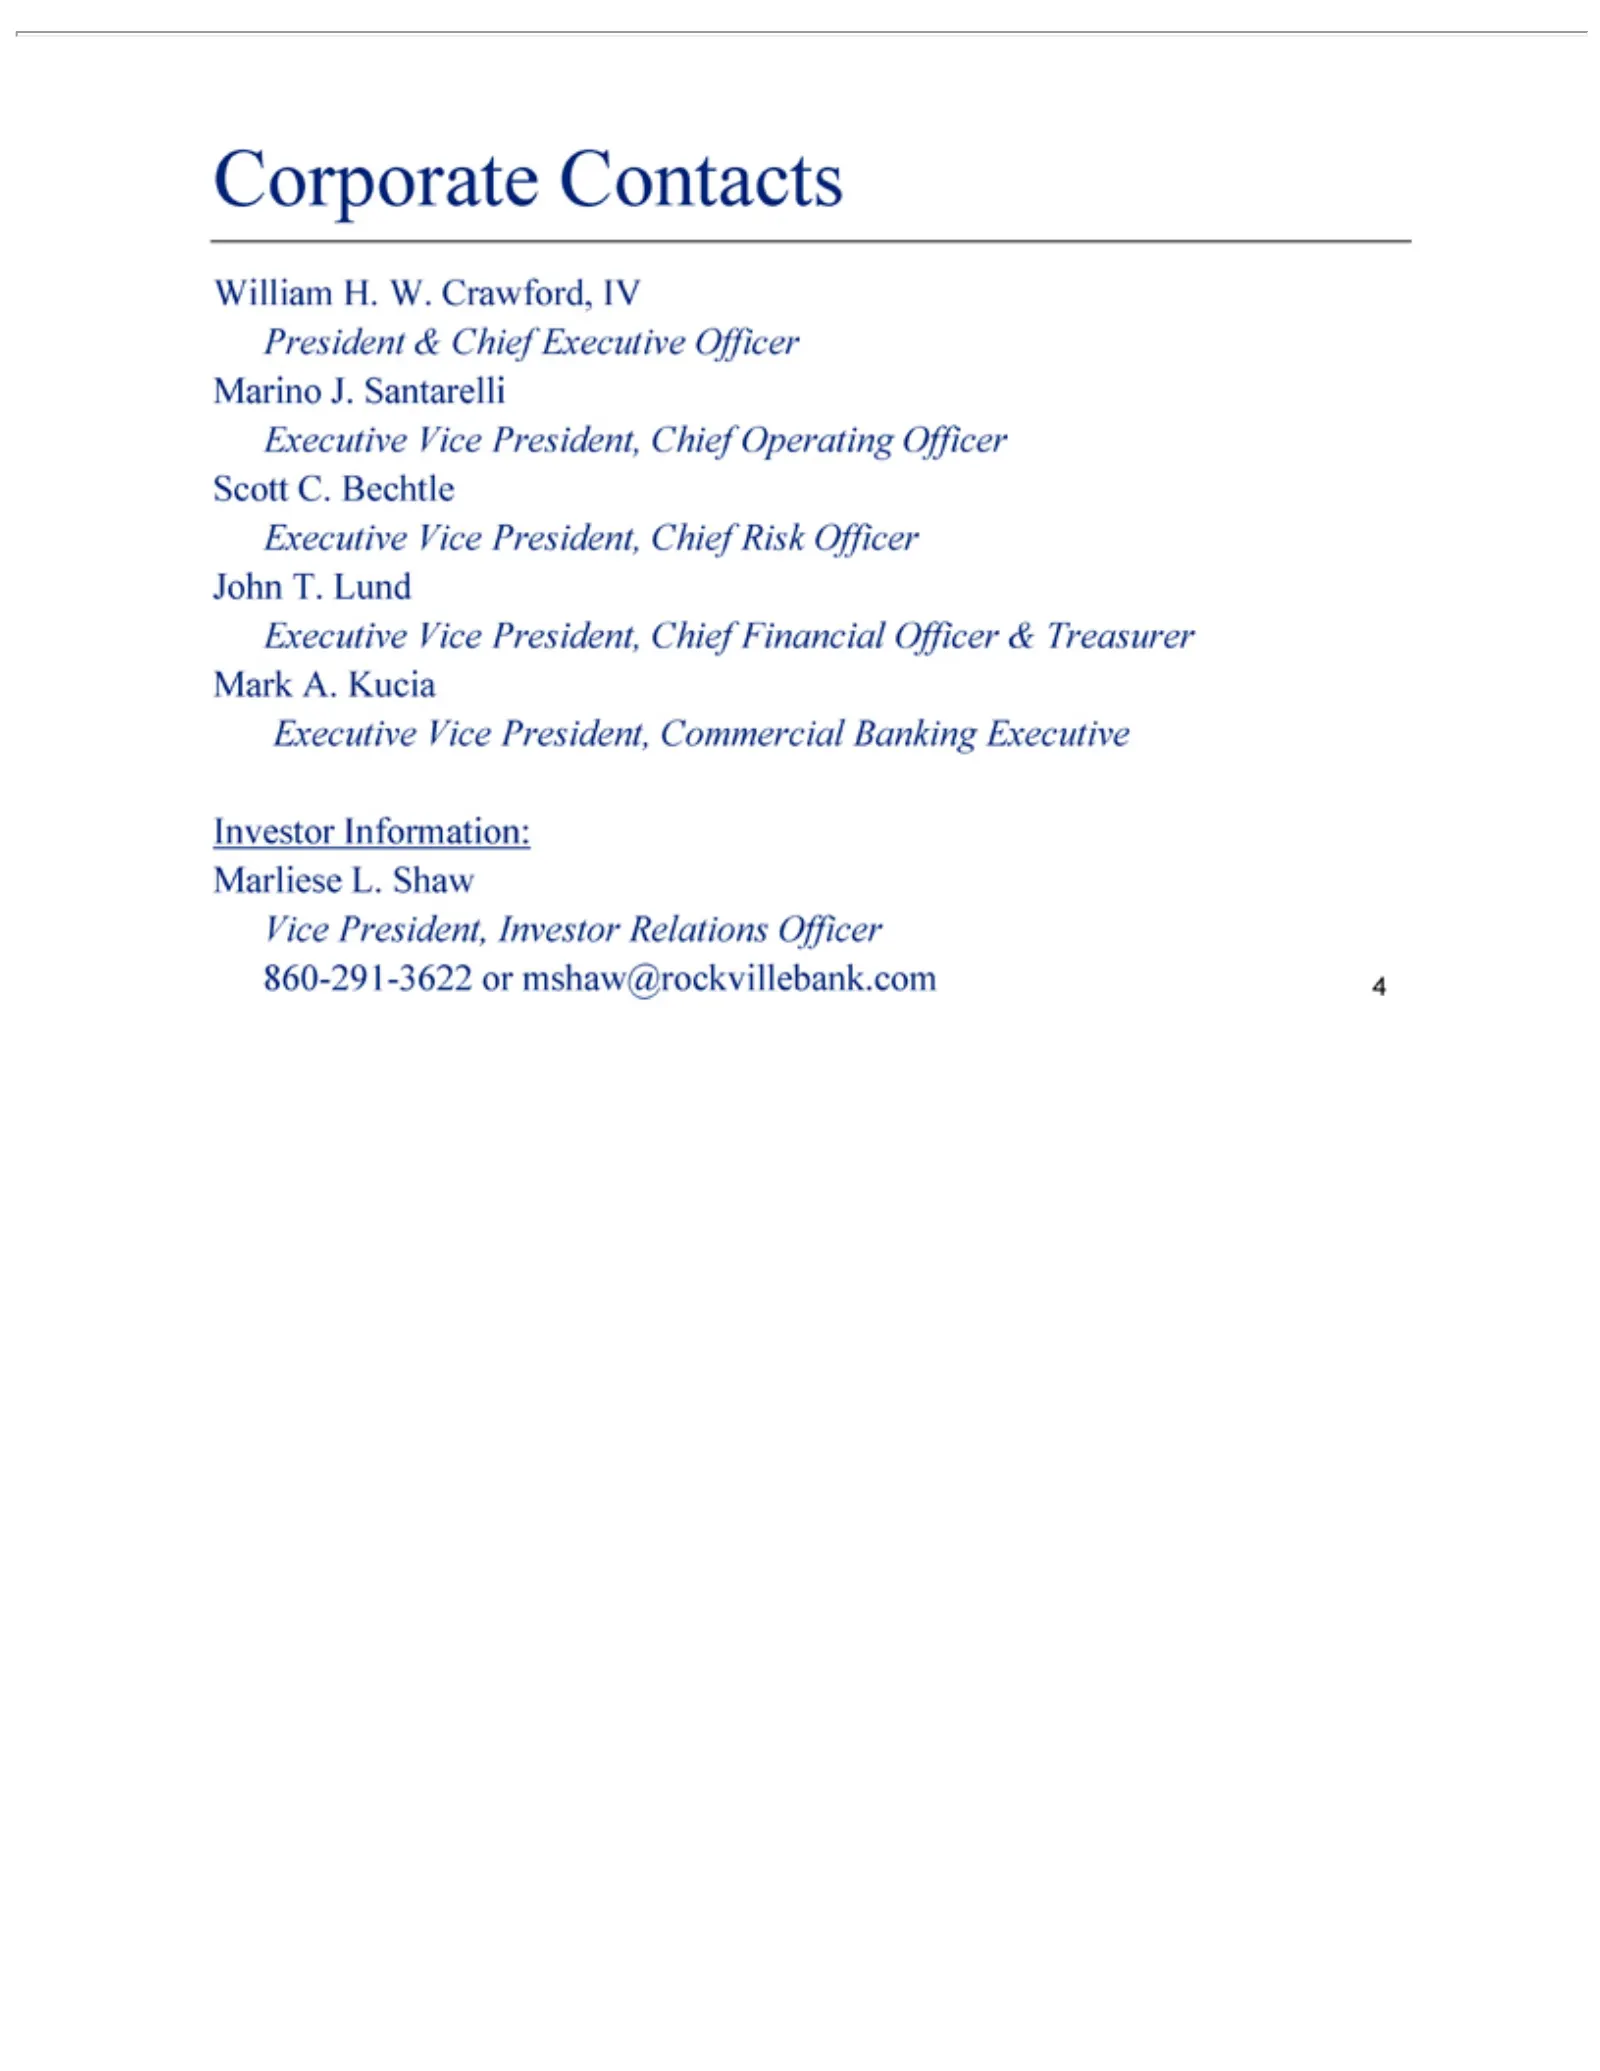
Slide 4: Corporate Information and Investor Contacts
Corporate William President Marino Scott John Mark Executive Investor Vice President, T. C. A.Lund J.Bechtle H. Information: Kucia & Santarelli Vice Contacts W. Chief Crawford, Investor President, Executive Marliese Relations IV Chief Commercial Officer L.Financial Operating Risk Shaw Officer Office
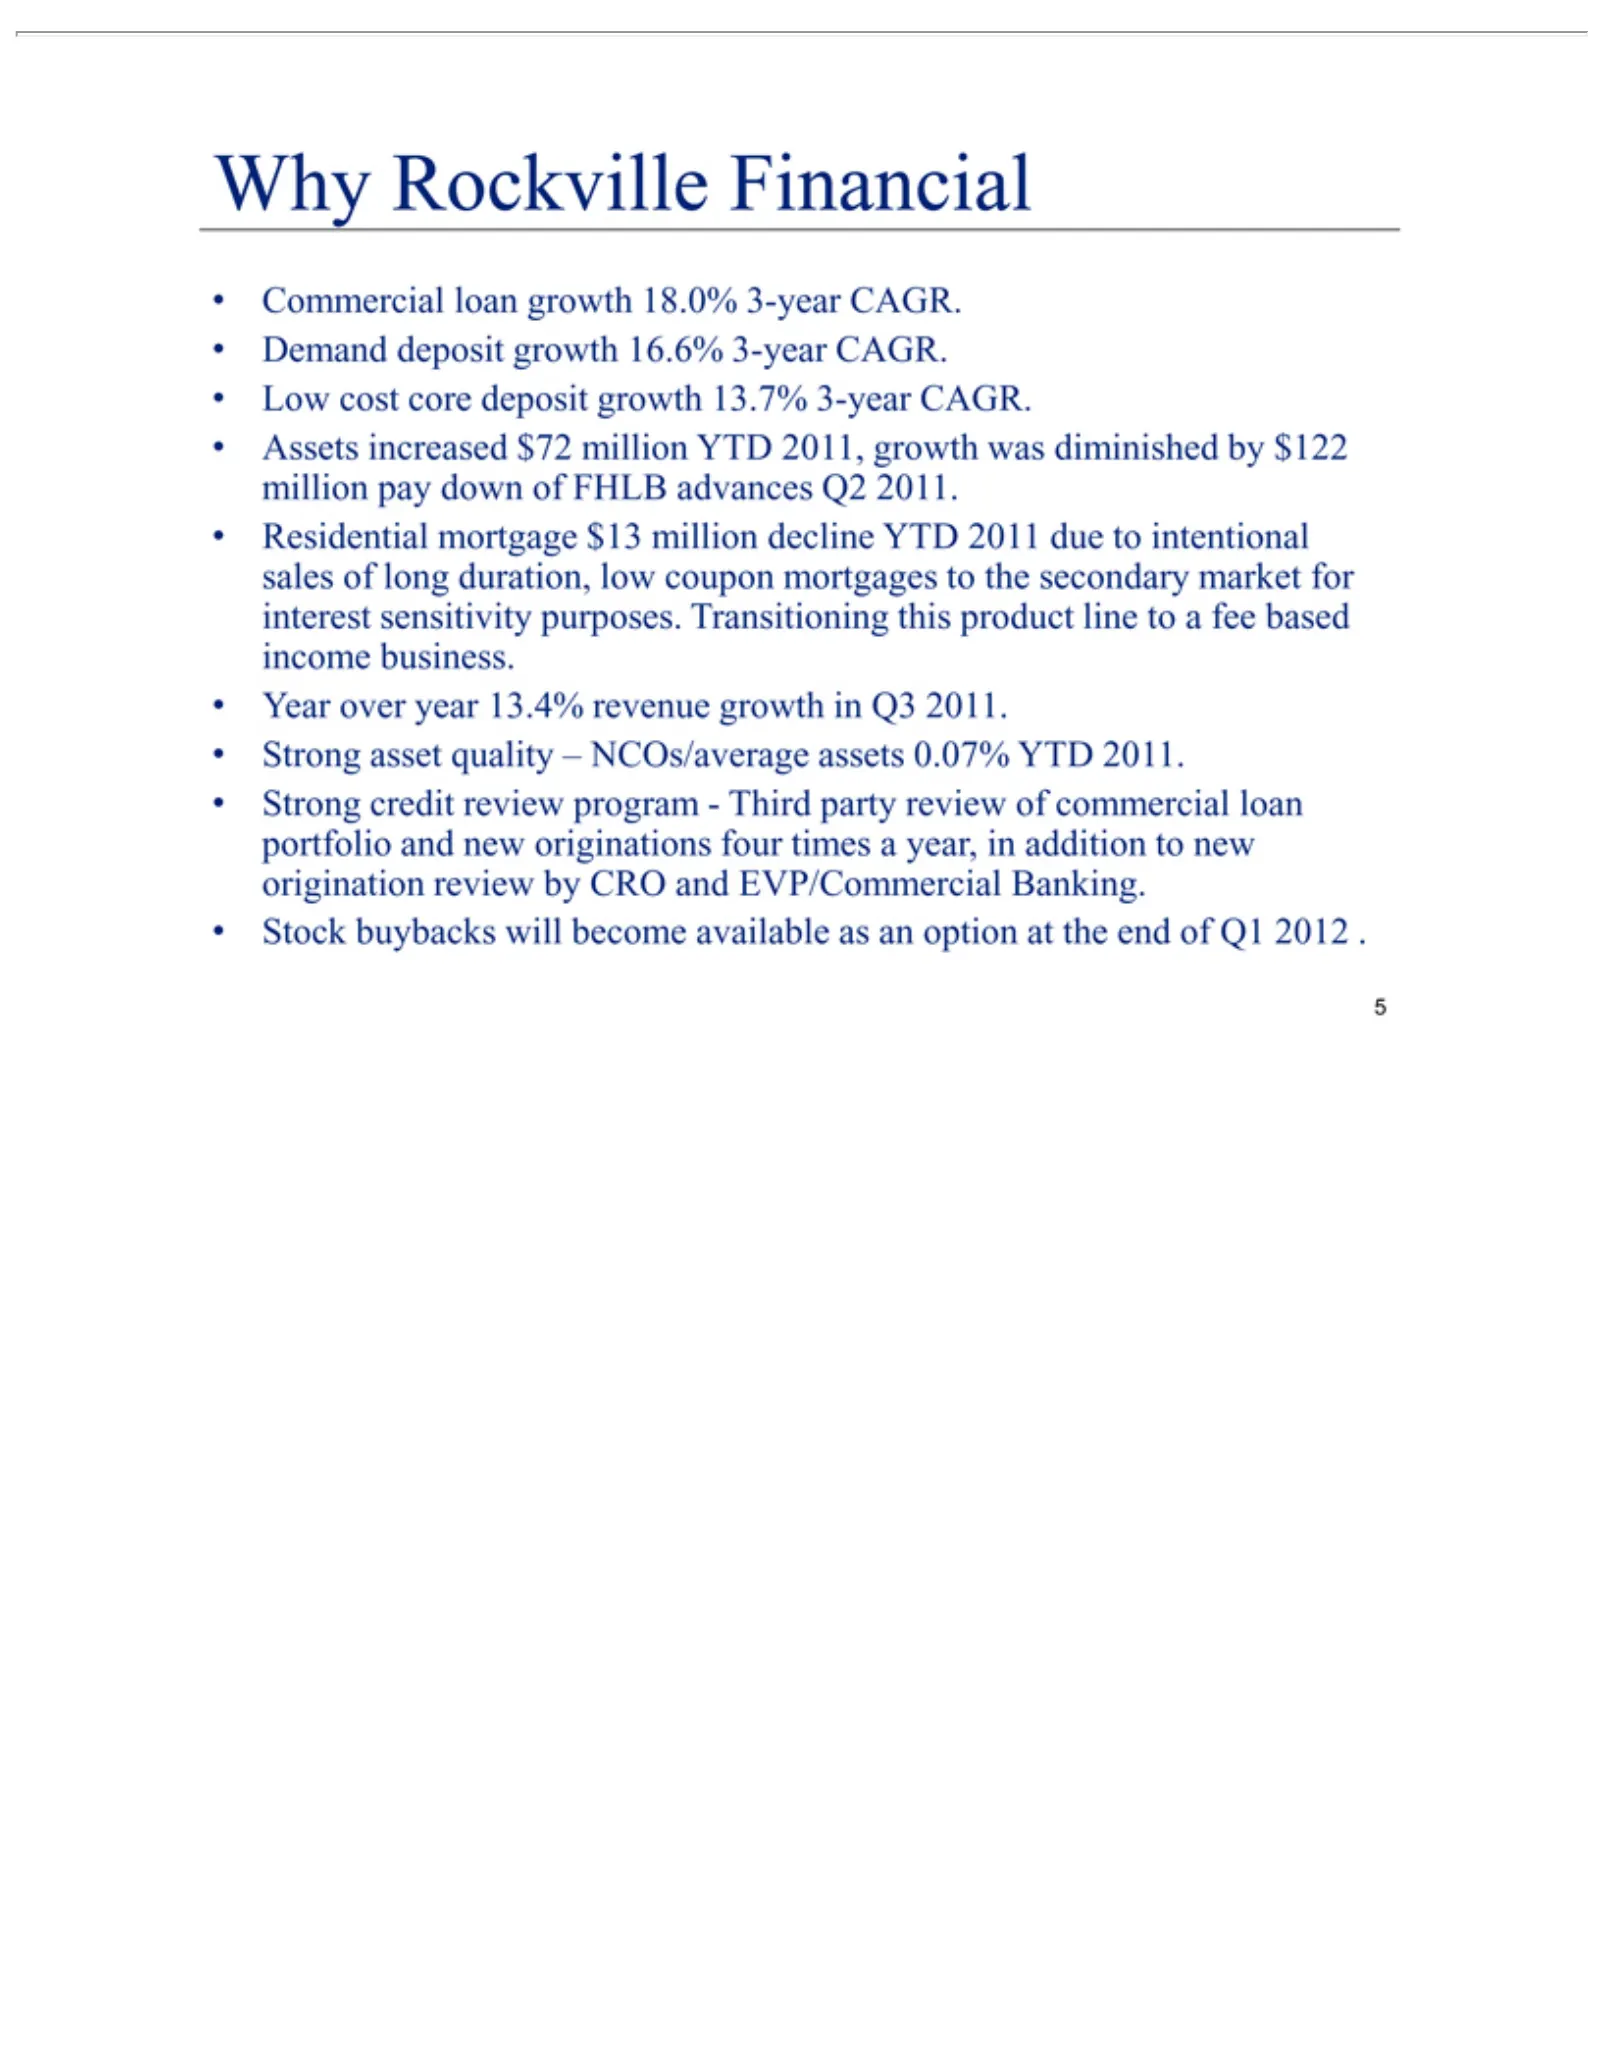
Slide 5: Why Invest in Rockville Financial
Why cost Commercial Demand Low Assets Residential product Year Strong Stockover Rockville buybacks increased asset credit line deposit core year mortgage to quality loan review deposit a13.4% Financial will fee growth $72 growth –NCOs/average based become program—Third million $13 revenue growth 16.
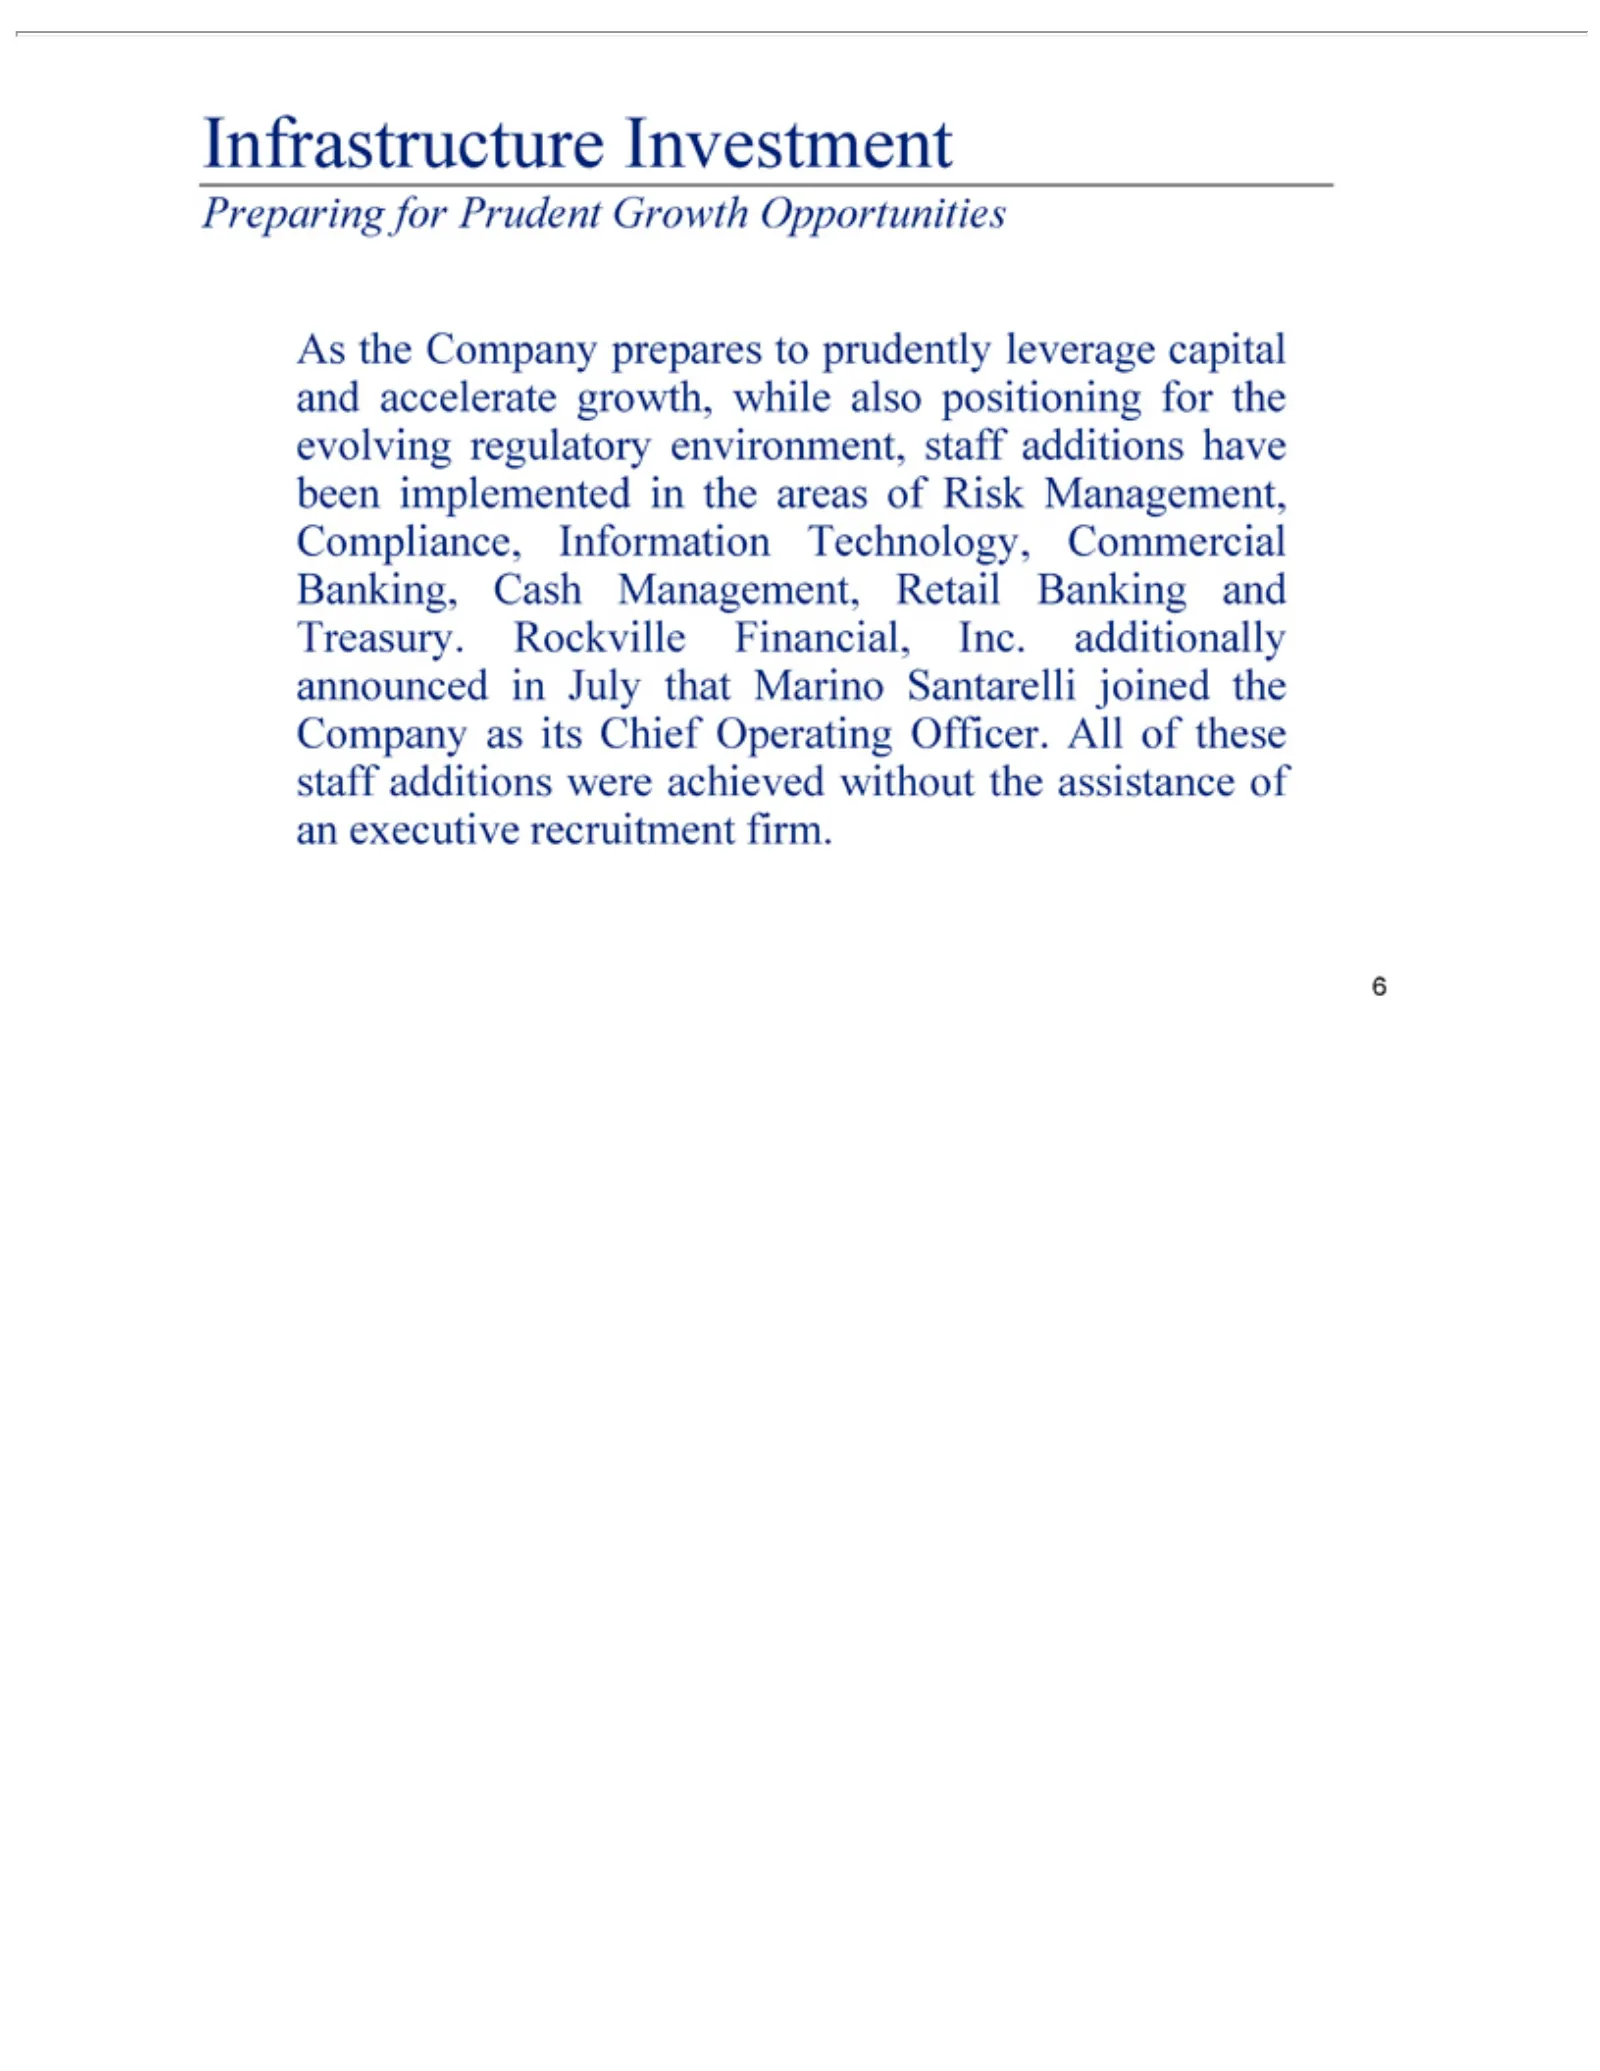
Slide 6: Infrastructure: Preparing for Prudent Growth
Infrastructure Preparing As Risk Santarelli theManagement, Company joined for Prudent Investment the prepares Compliance, Company Growth to prudently Opportunities asInformation its Chief leverage Operating Technology, capital Officer. andCommercial accelerate All of these growth, Banking, staff whi
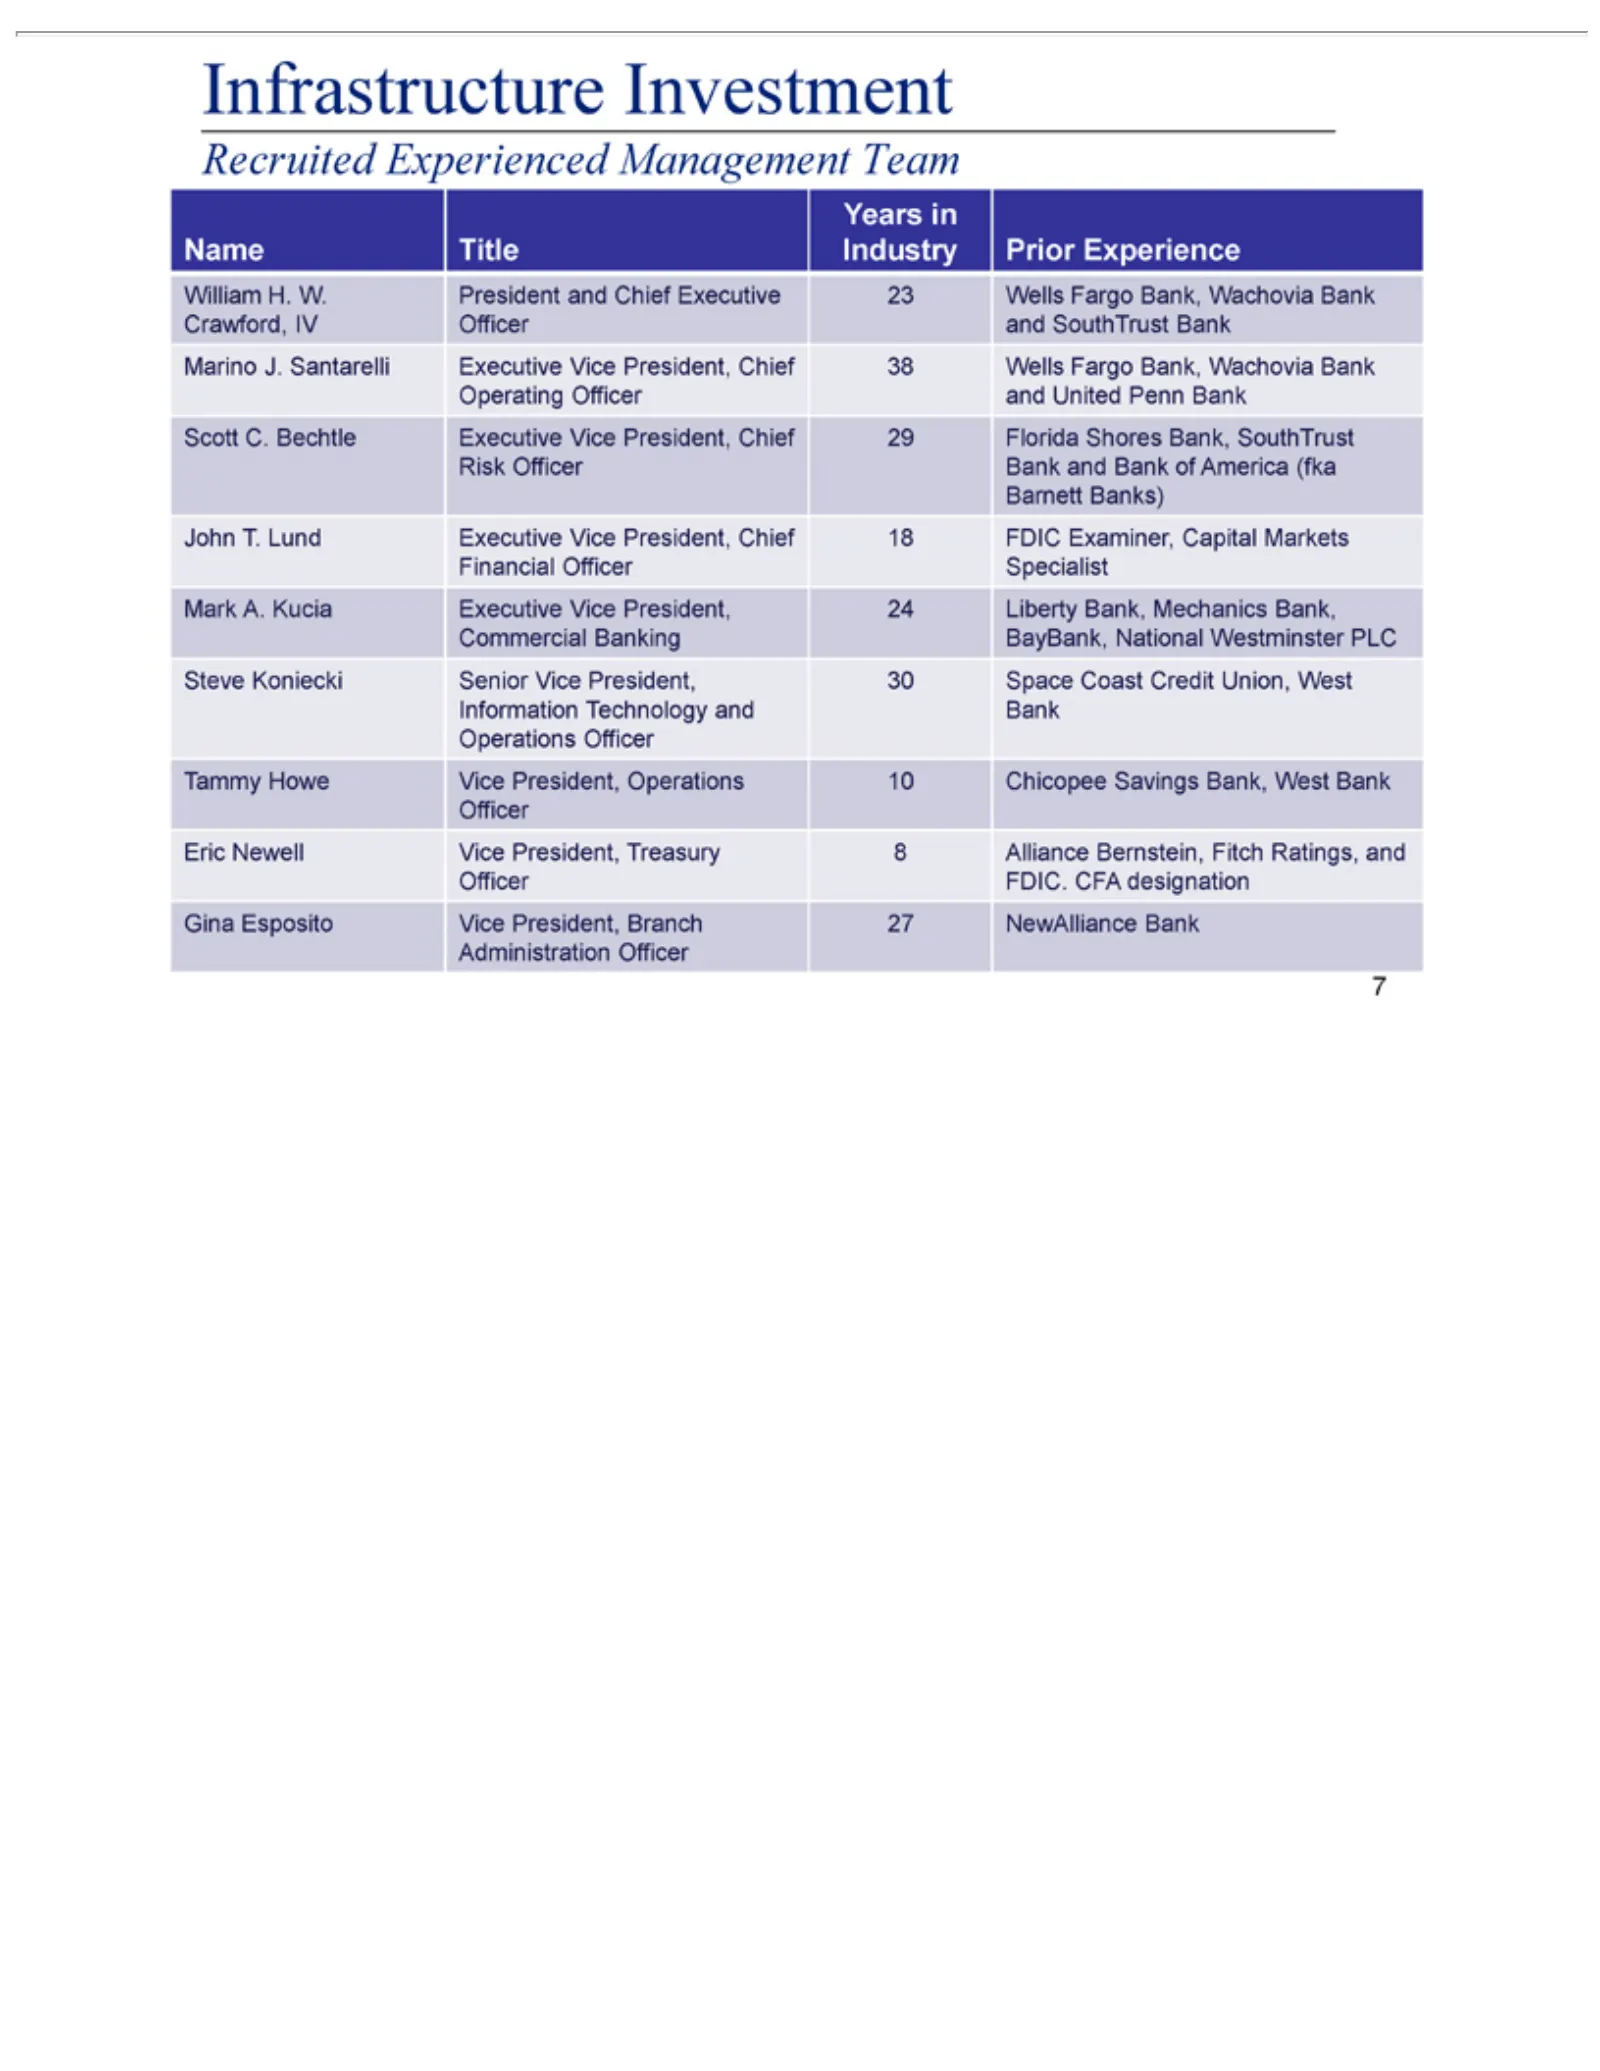
Slide 7: Infrastructure: Recruited Experienced Industry Team
Infrastructure Recruited Years Name William Crawford, Marino Operating Scott Risk Barnett John Financial Mark Commercial Steve Information Operations Tammy Eric Officer Gina Administration Newell Officer T. Esposito C. A. Koniecki in Title FDIC. Lund Banks) J. Howe Bechtle H. Kucia Officer Santarell
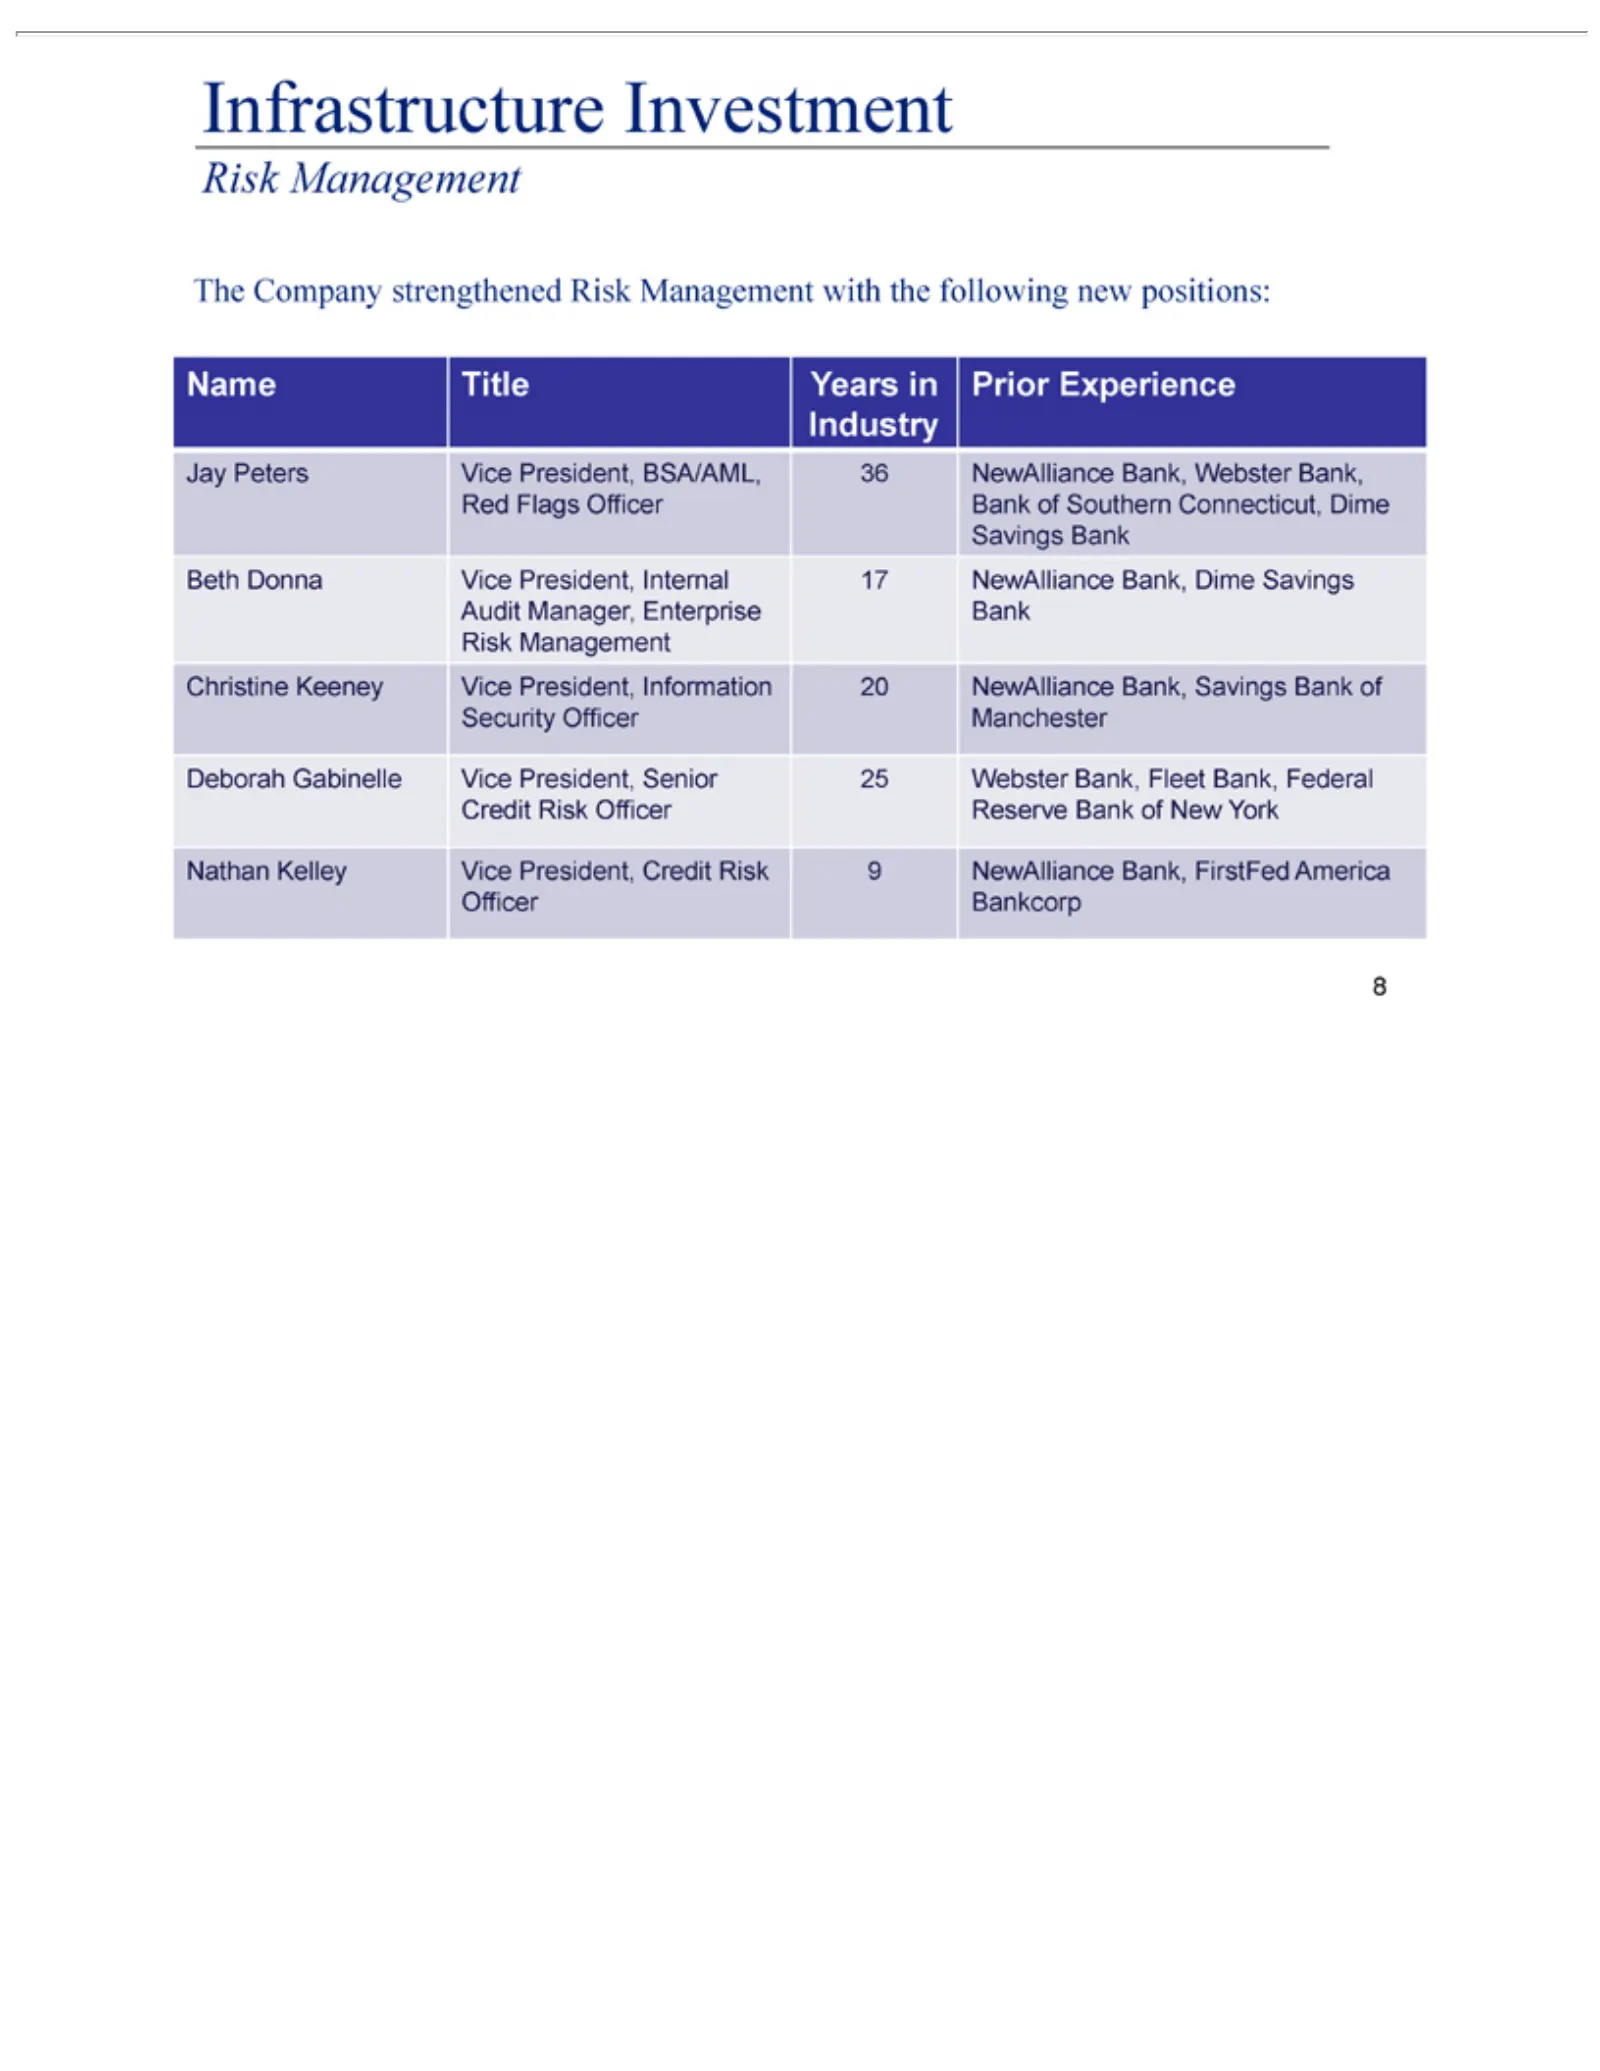
Slide 8: Infrastructure: Strengthened Risk Management
Infrastructure The Name Jay Industry Red Savings Beth Audit Risk Christine Security Deborah Credit Nathan Officer Peters Company Flags Management Donna Manager, Title Risk Bankcorp Kelley Bank Officer Gabinelle Keeney Vice Officer Years Officer Vice Investment strengthened Vice President, Enterprise
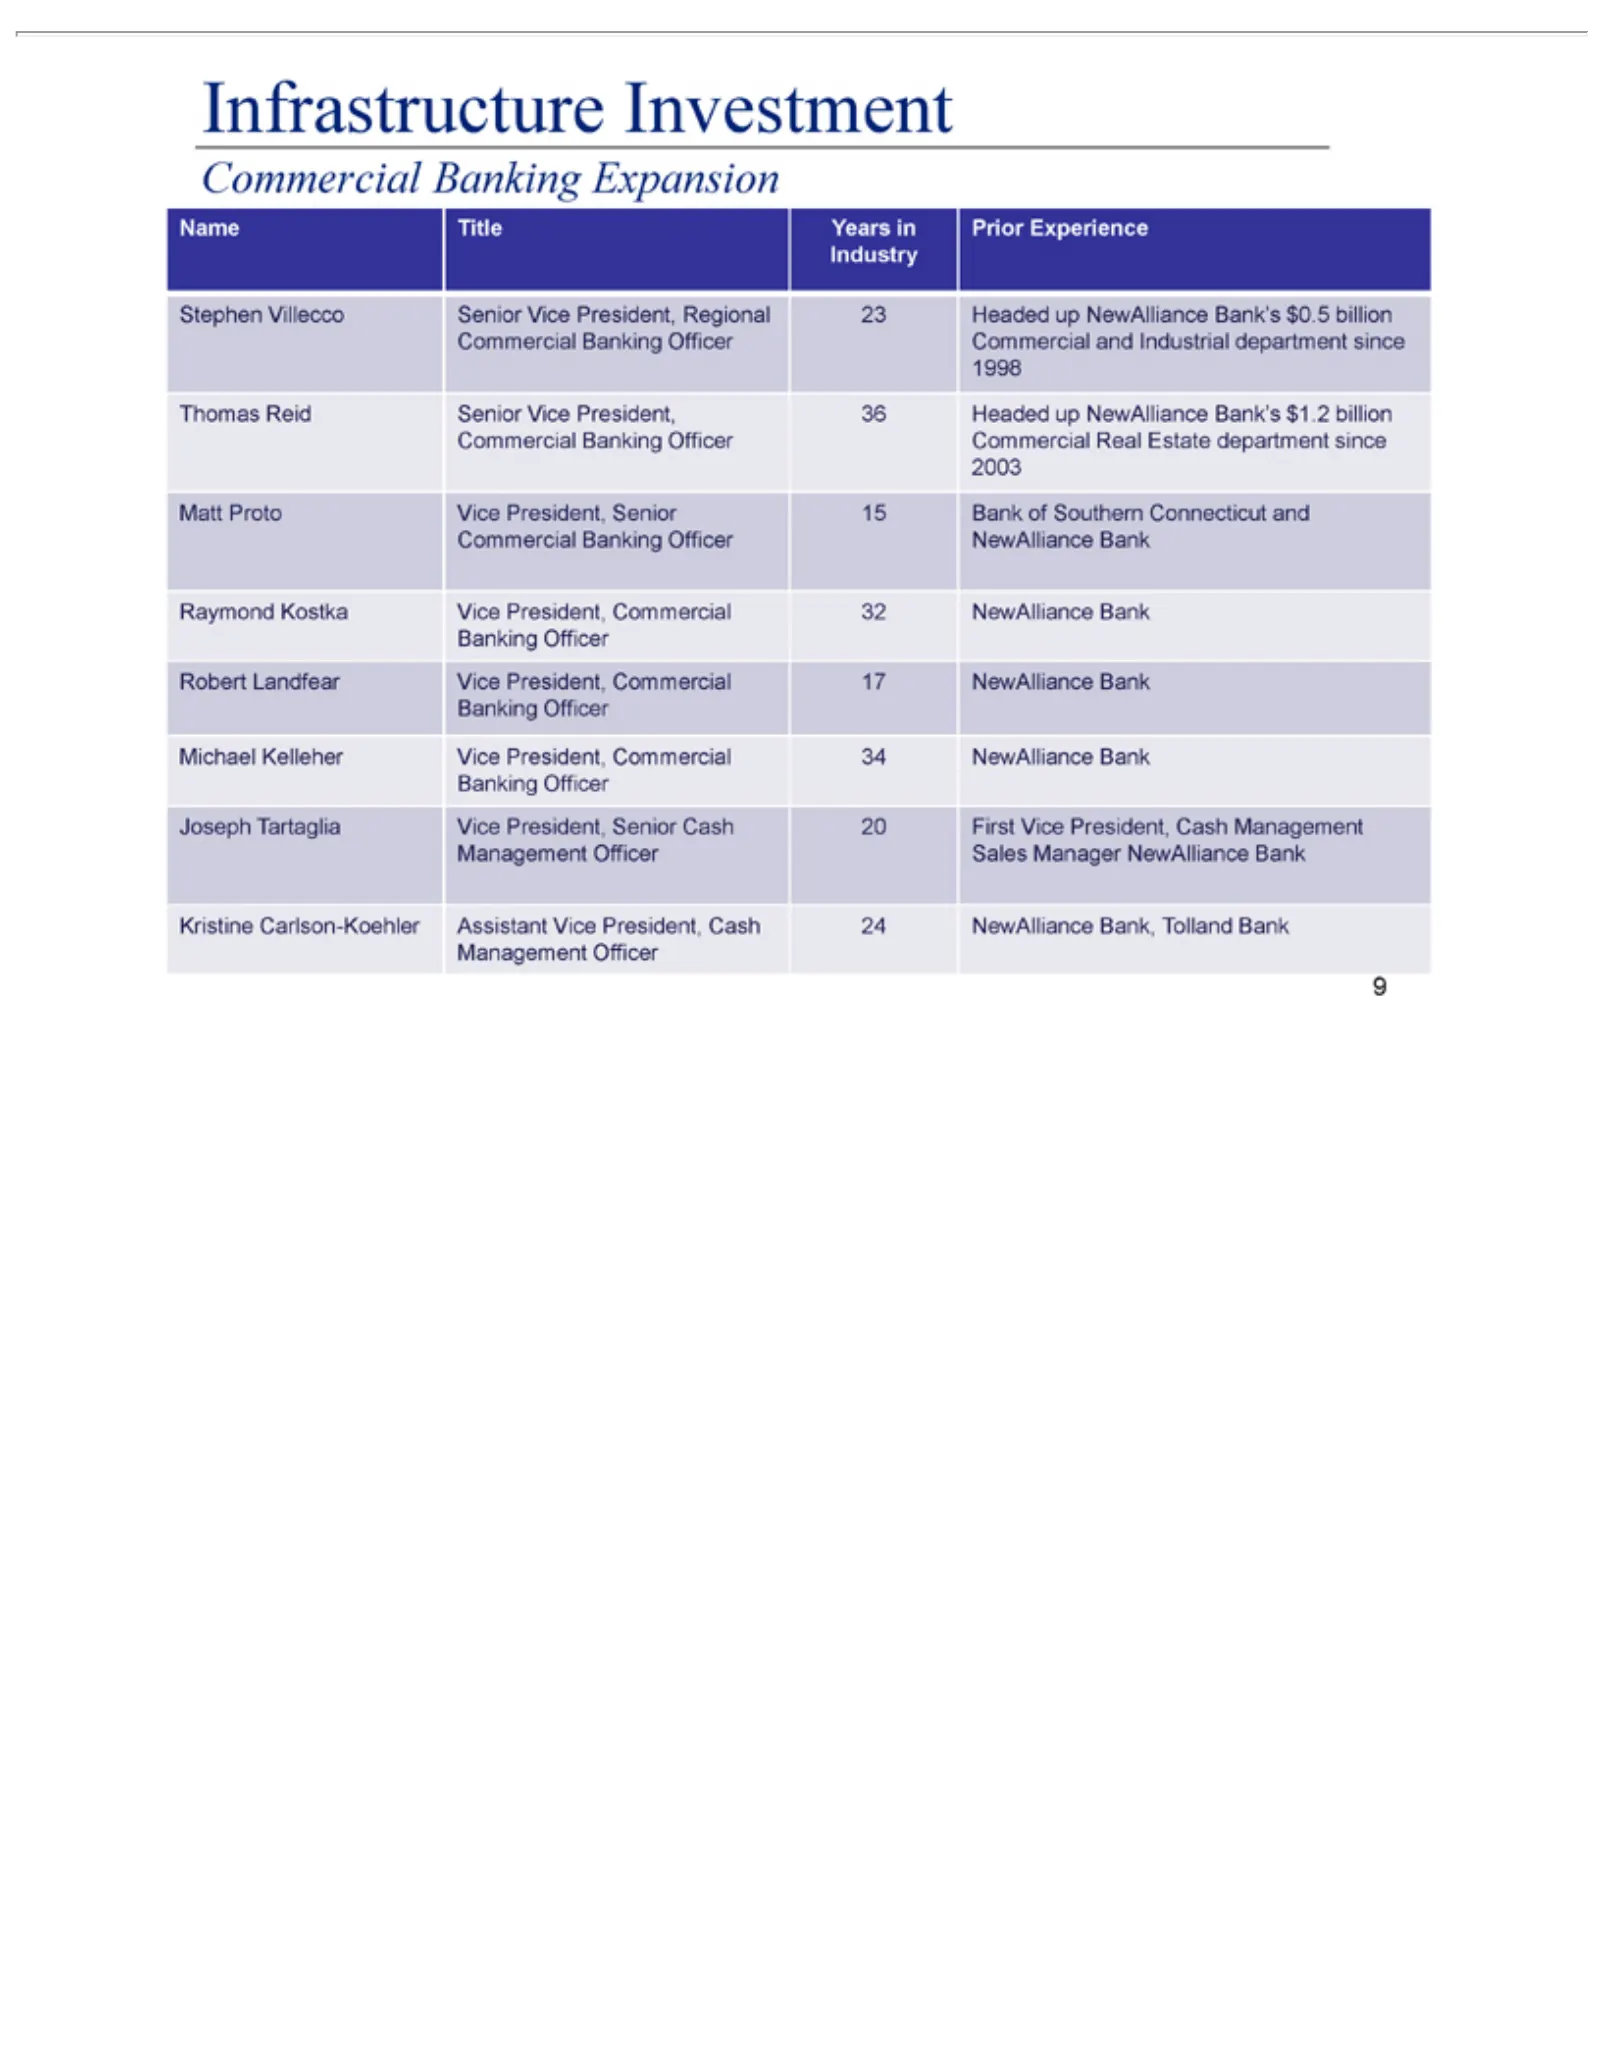
Slide 9: Infrastructure: Commercial Banking Team
Infrastructure Name Stephen Industry Thomas 1998 Matt 2003 Commercial Raymond Robert Michael Banking Joseph Kristine Management Proto Title Tartaglia Landfear Villecco Reid Carlson-Koehler Kelleher Officer Kostka Vice Years Banking Officer Senior Investment President, Vice Senior in Vice Prior Vice
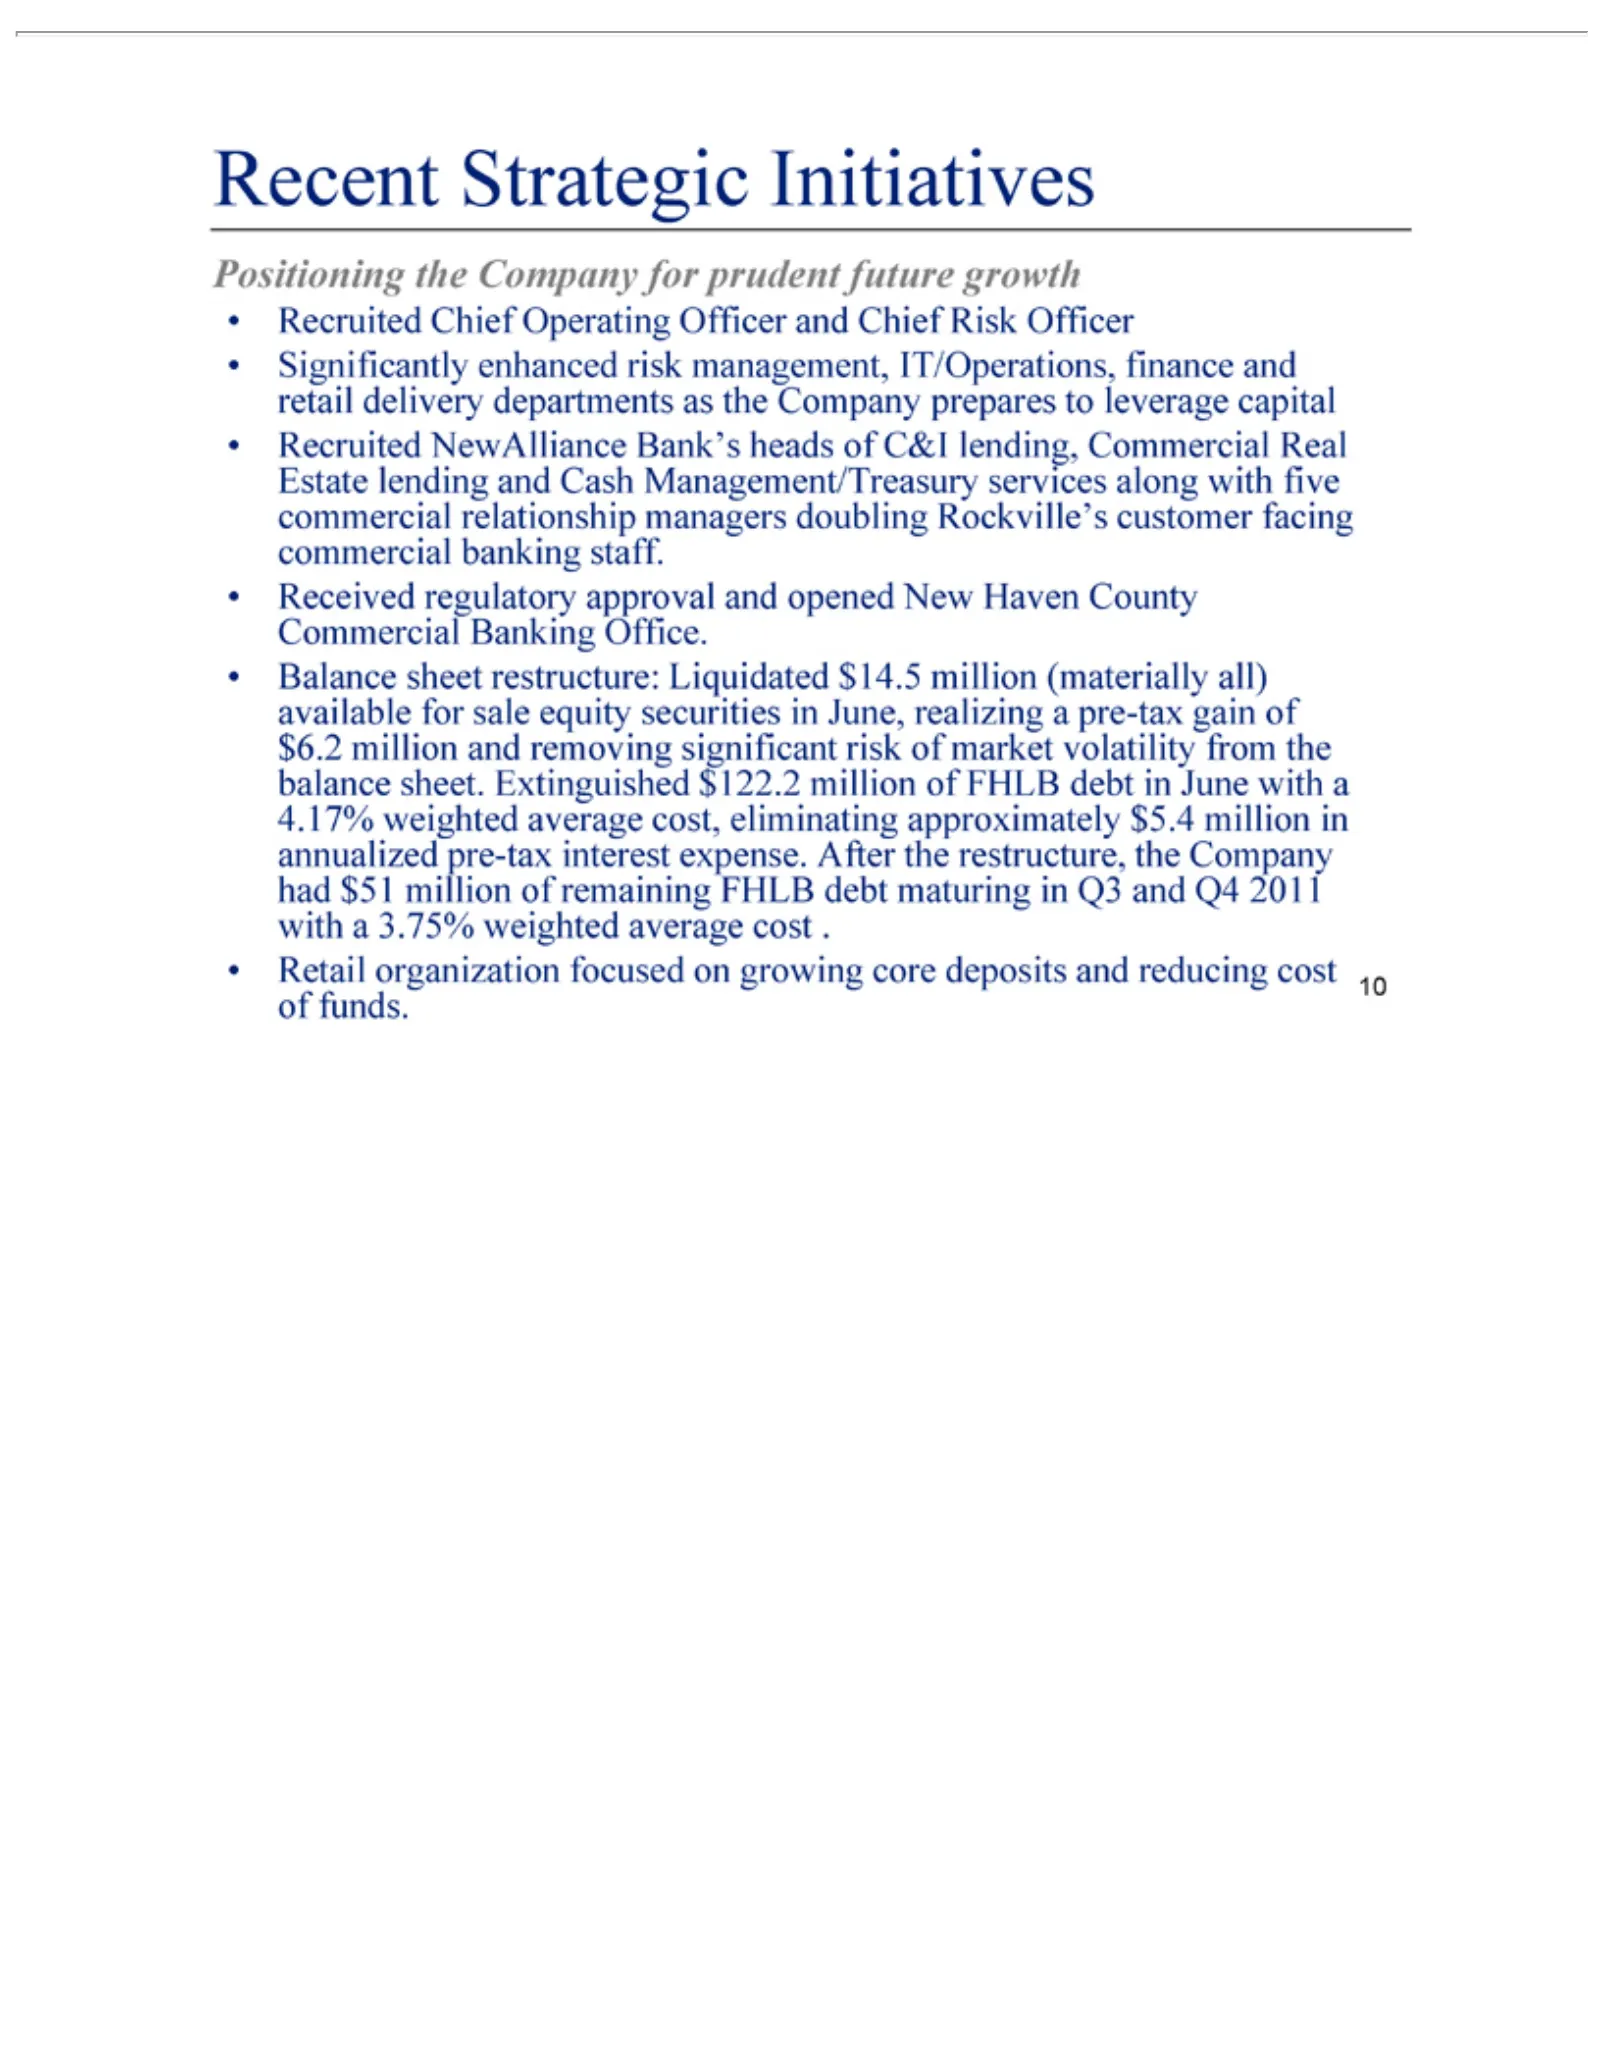
Slide 10: Recent Strategic Initiatives
Recent Positioning volatility •expense. Significantly Recruited Received Balance Retail Strategic organization After from sheet regulatory Chief New theenhanced the Company restructure: Alliance Initiatives Operating restructure, balance focused approval risk for Bank’s sheet. Liquidated Officer man
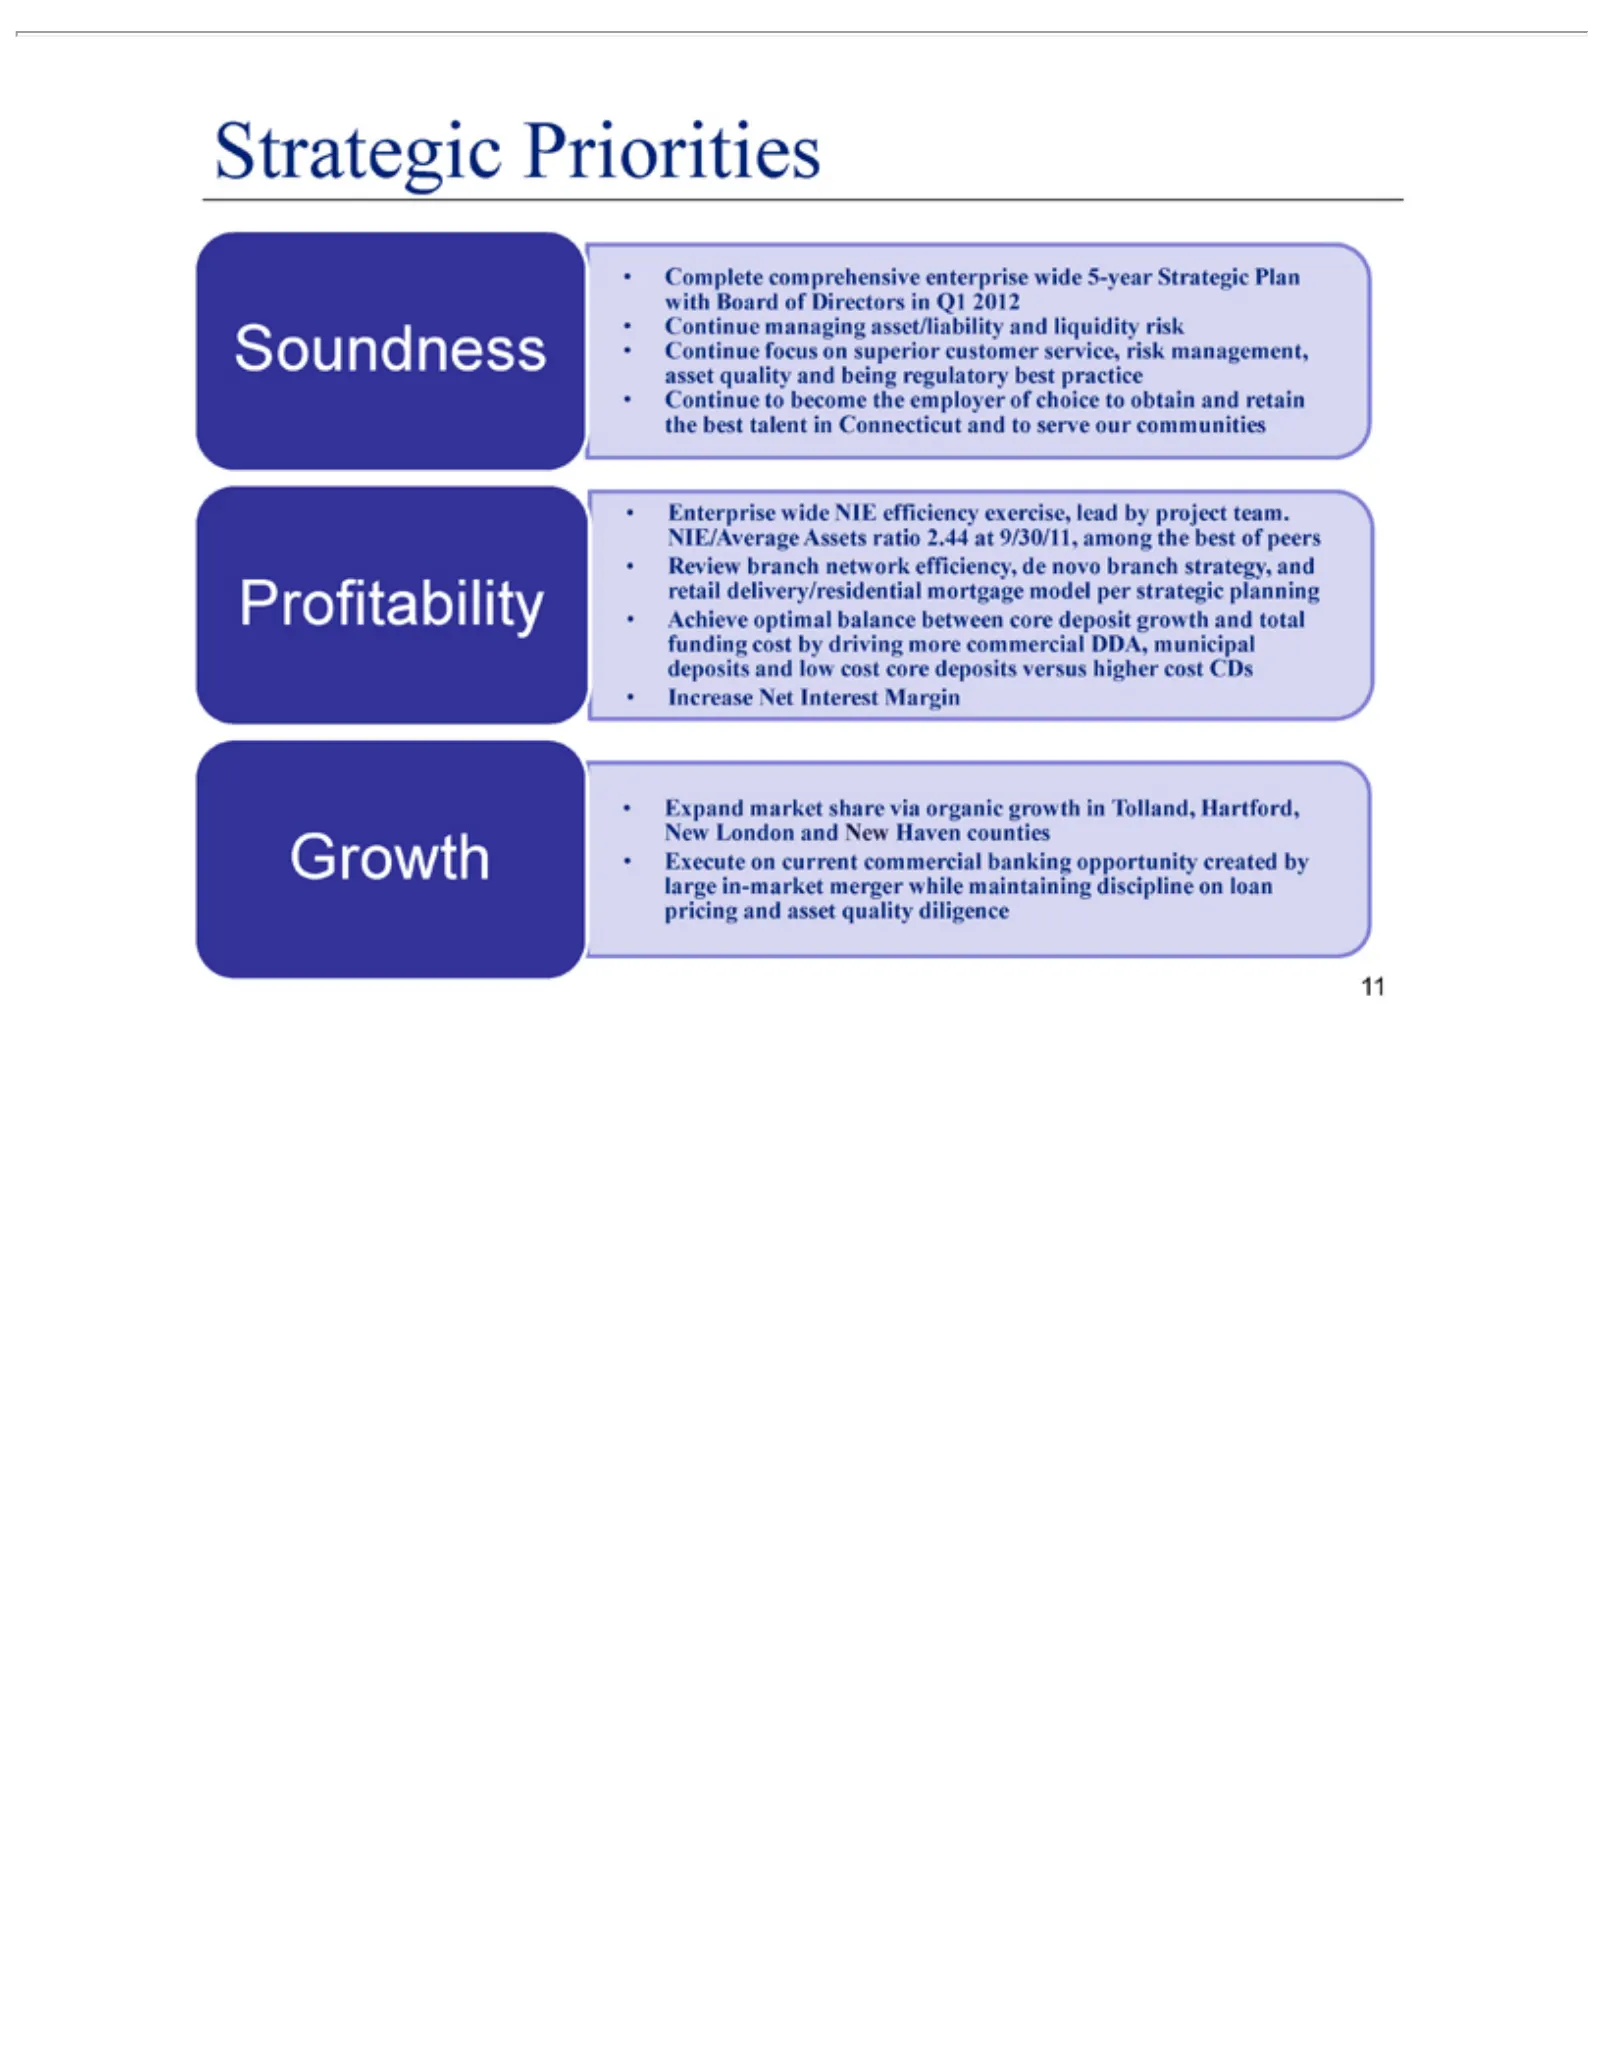
Slide 11: Strategic Priorities
Strategic Soundness with asset the Profitability NIE/Average retail funding deposits Growth •New large pricing Achieve Continue Review Increase Execute best Board London quality in-market delivery/residential and •talent cost and Priorities branch Expand on optimal Net managing focus to •of asset •C
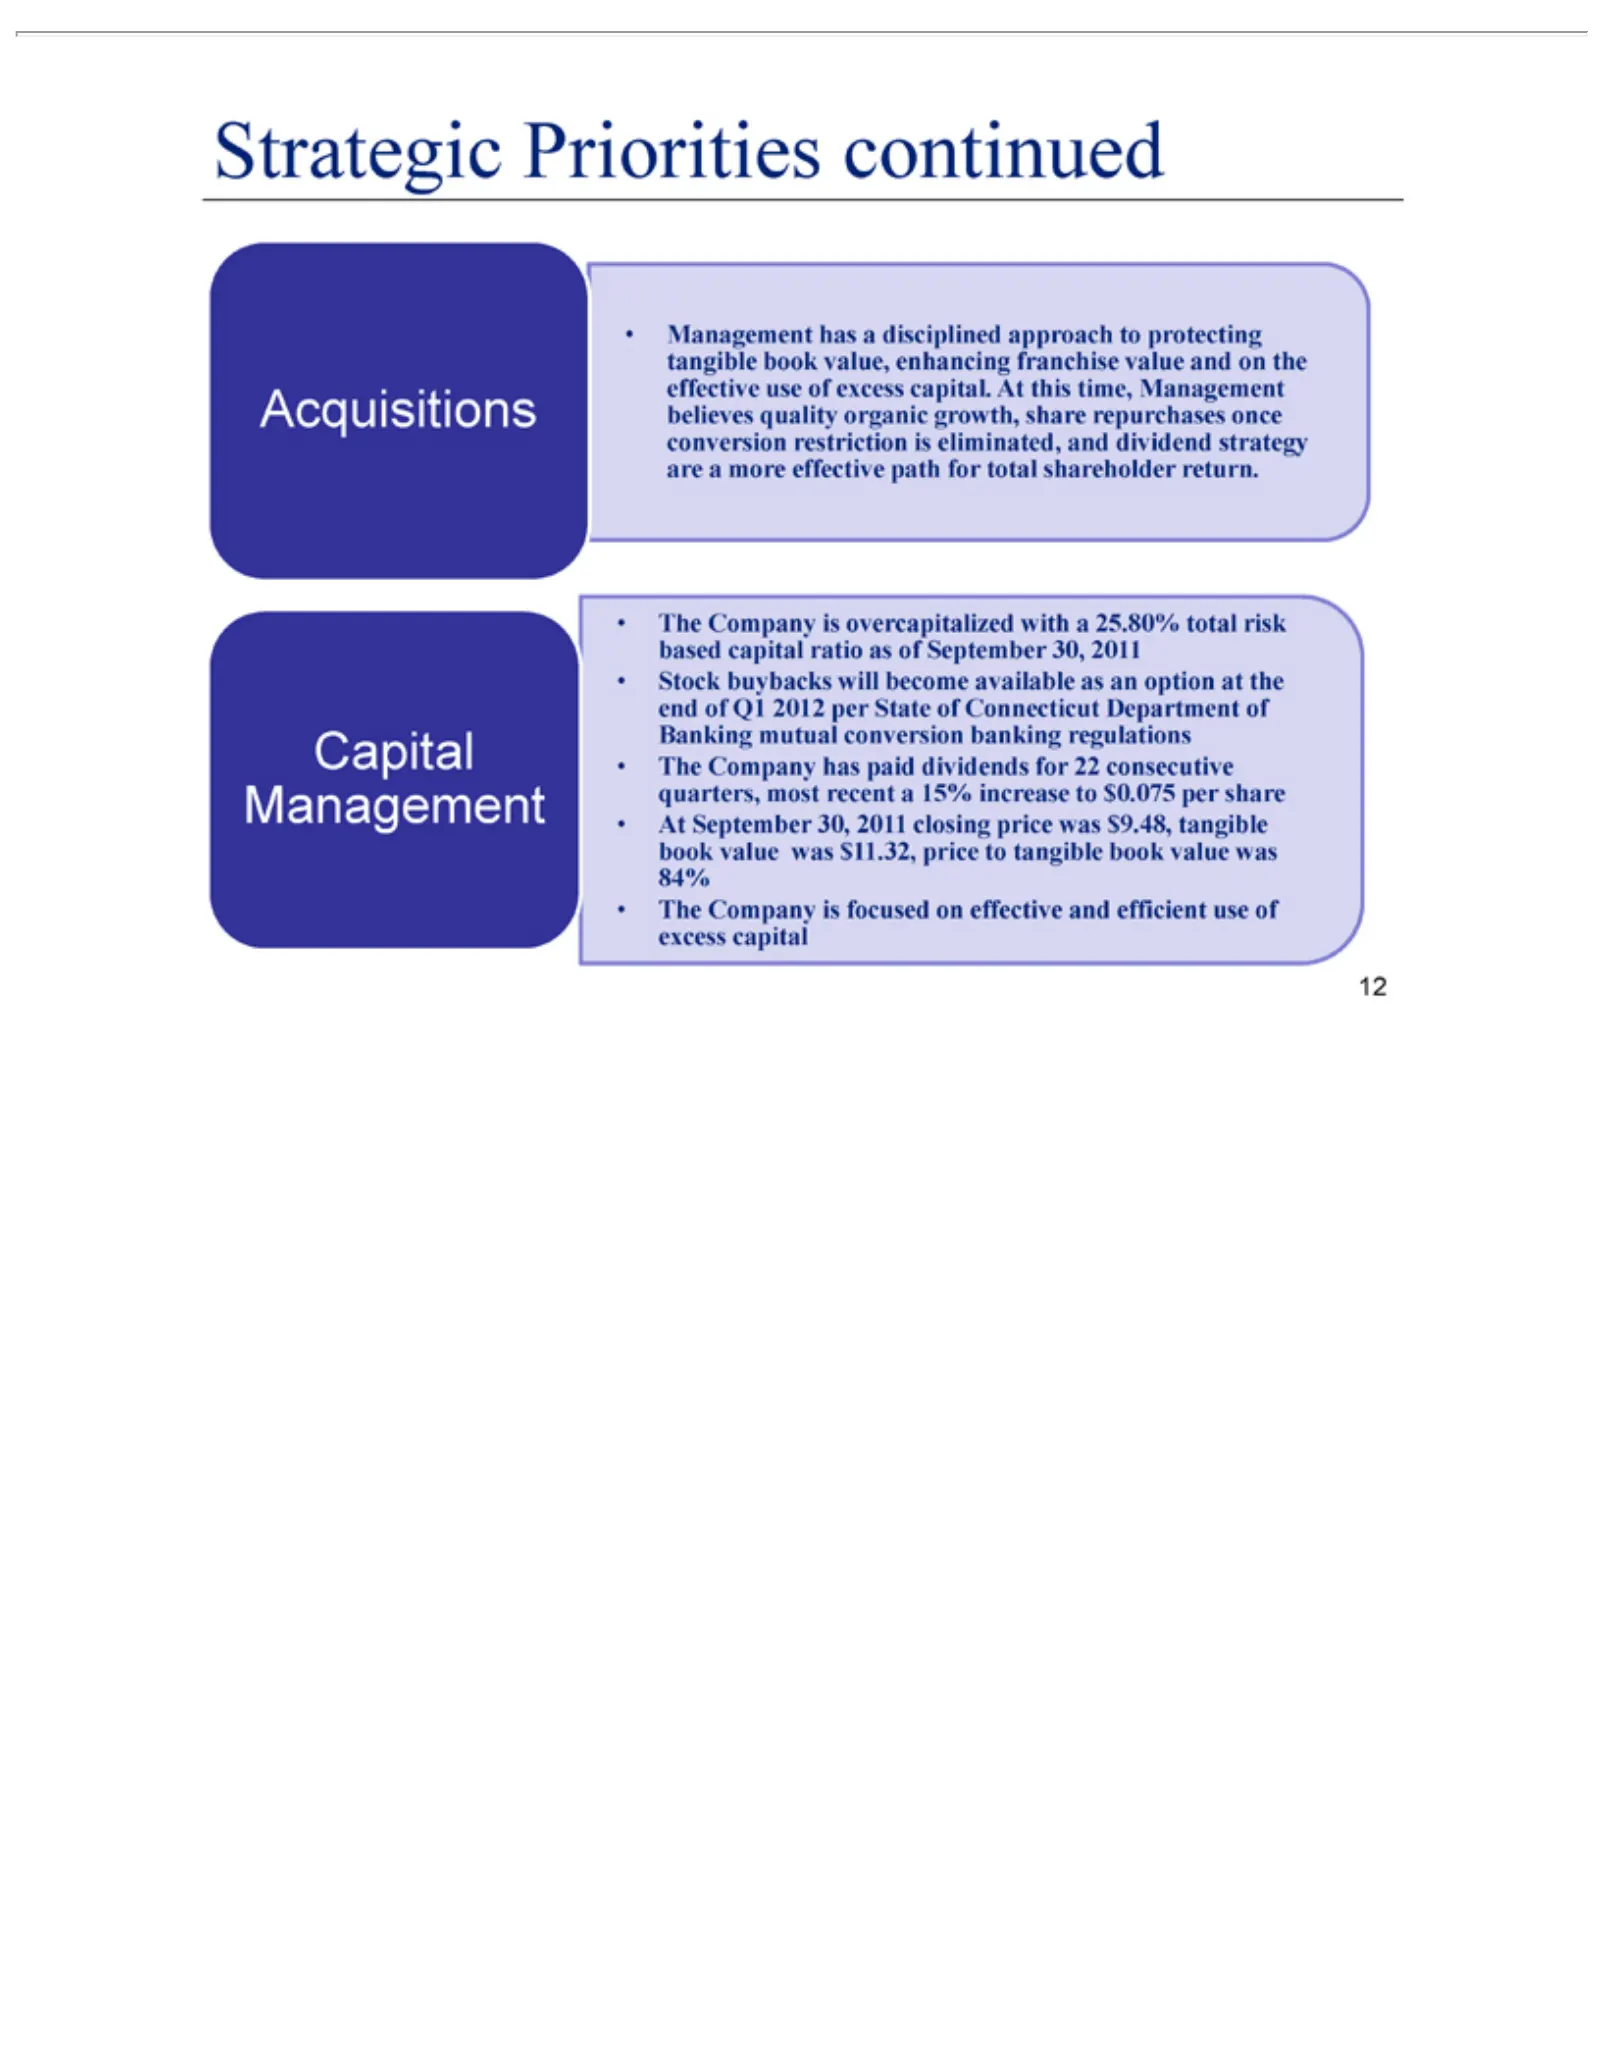
Slide 12: Strategic Priorities: Capital Management
Strategic Acquisitions tangible effective believes conversion are Management Capital based end Banking quarters, •book 84% excess At The Stock aof September more value Company capital Q1 capital buybacks book quality mutual most use Priorities 2012 effective restriction was •of ratio •value, Managem
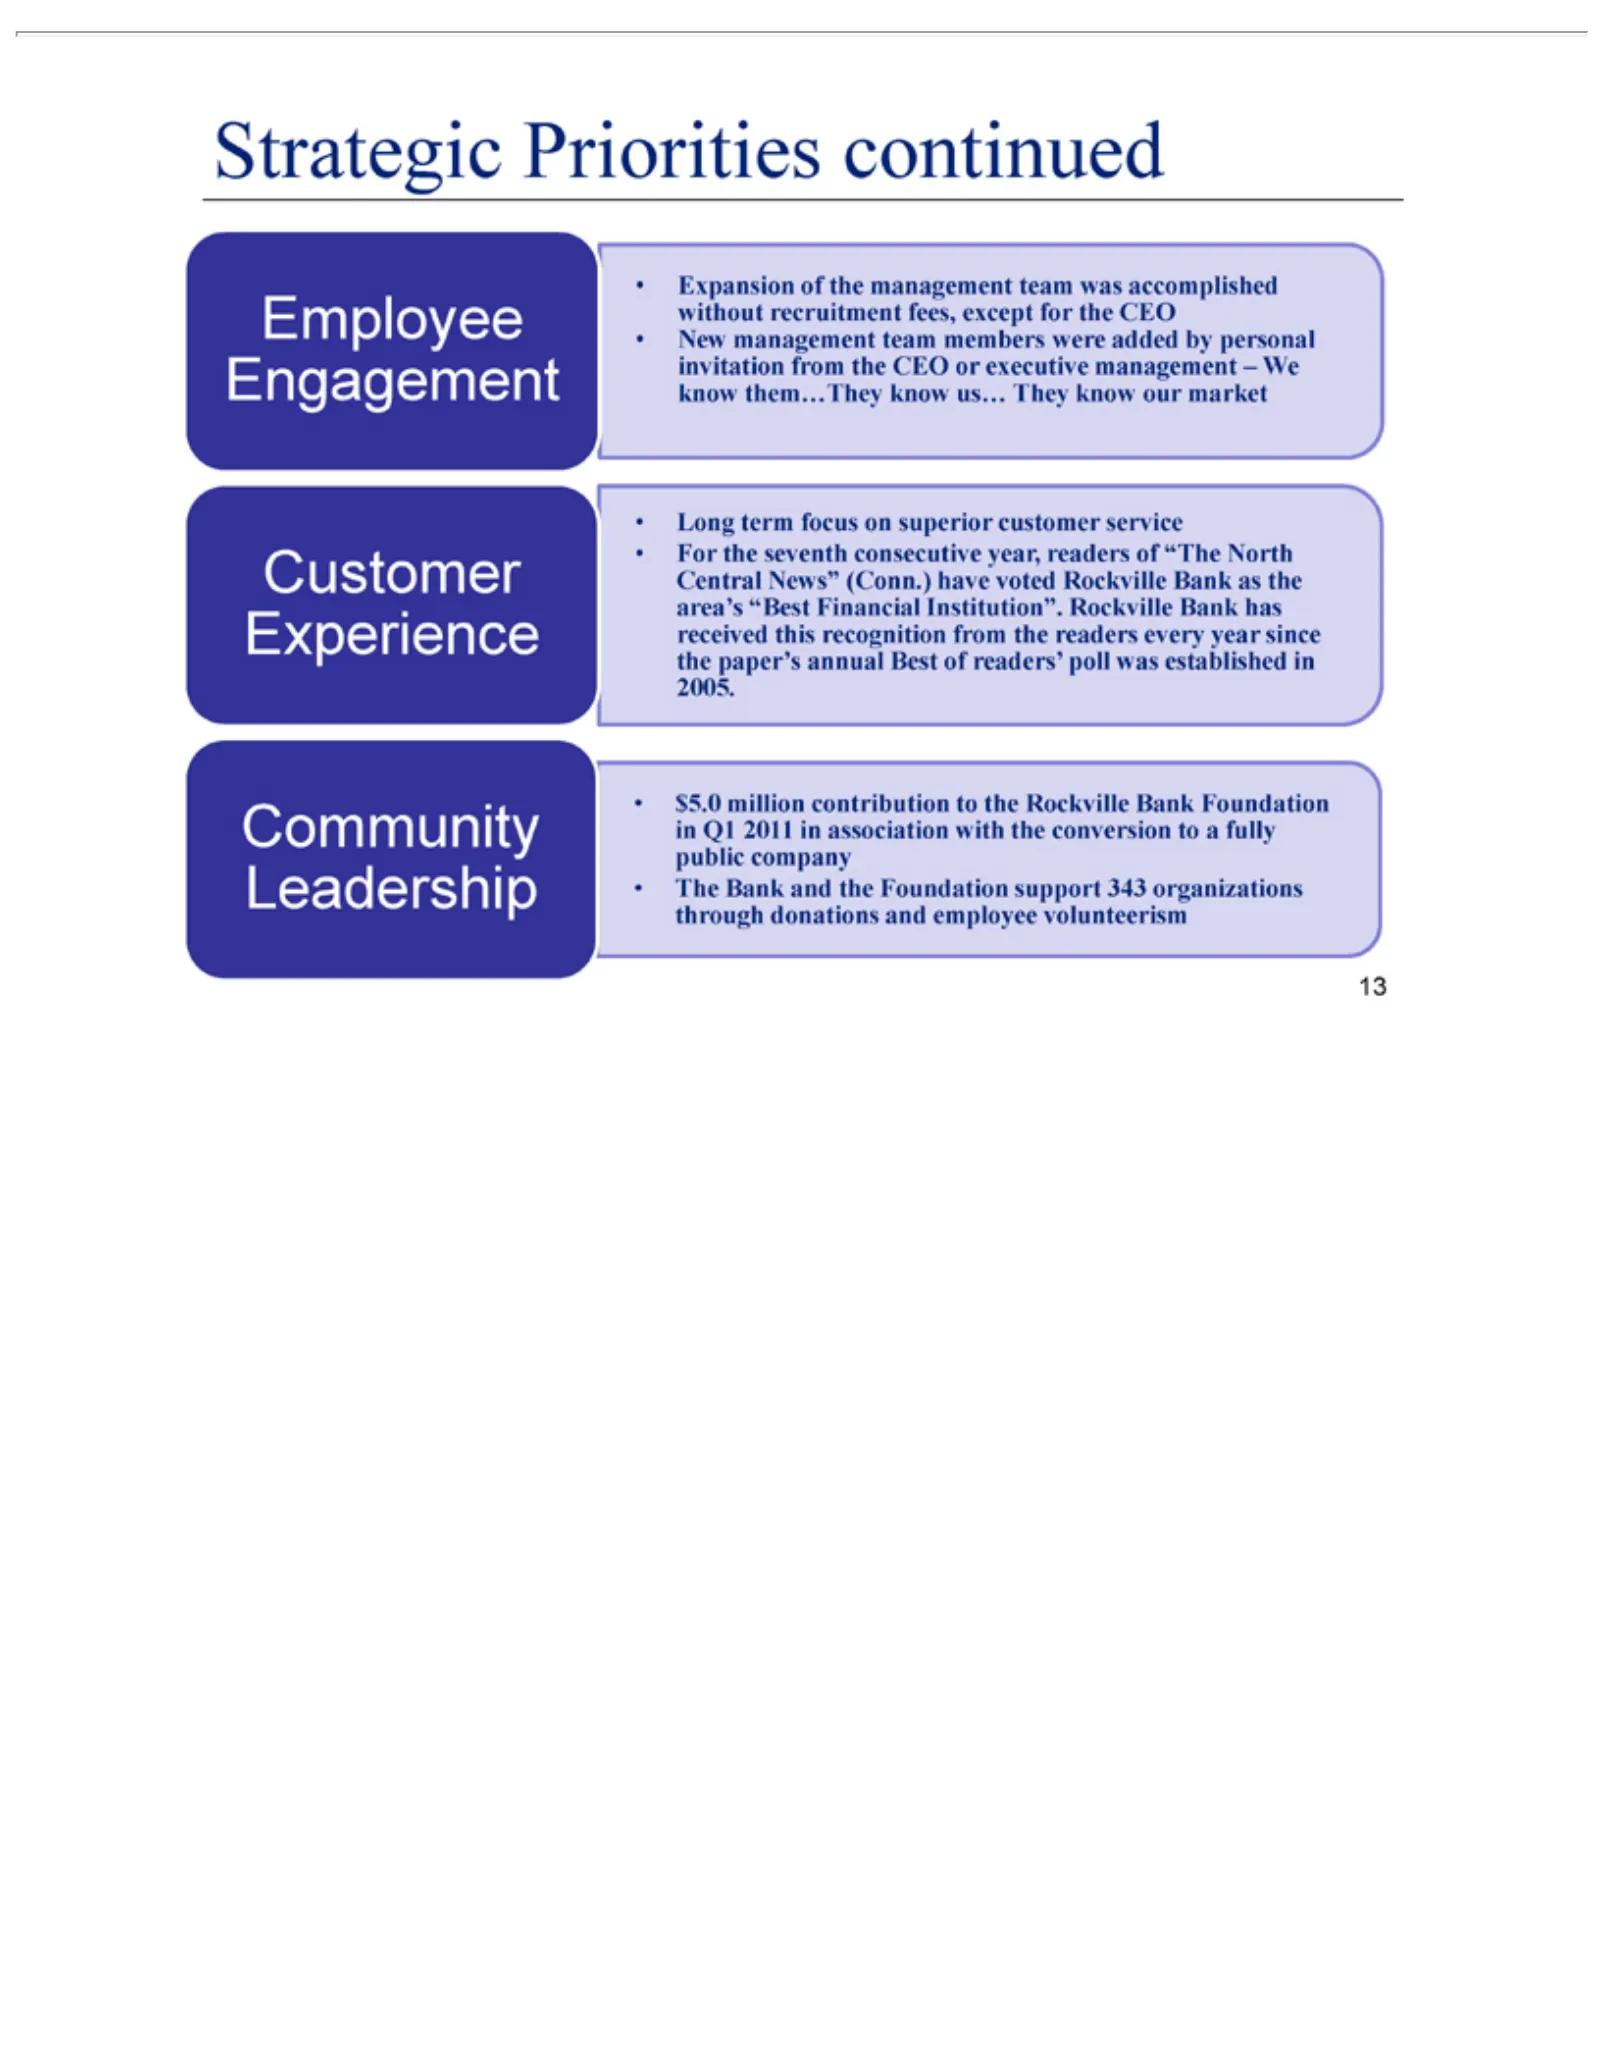
Slide 13: Strategic Priorities: Engagement
Strategic Engagement Employee invitation know Experience Customer received the Community in •public through The Expansion New Long For $5.0 Q1 paper’s the Bank them…They 2011 million management company term donations area’s seventh Priorities from annual in and Leadership focus ofcontribution associ
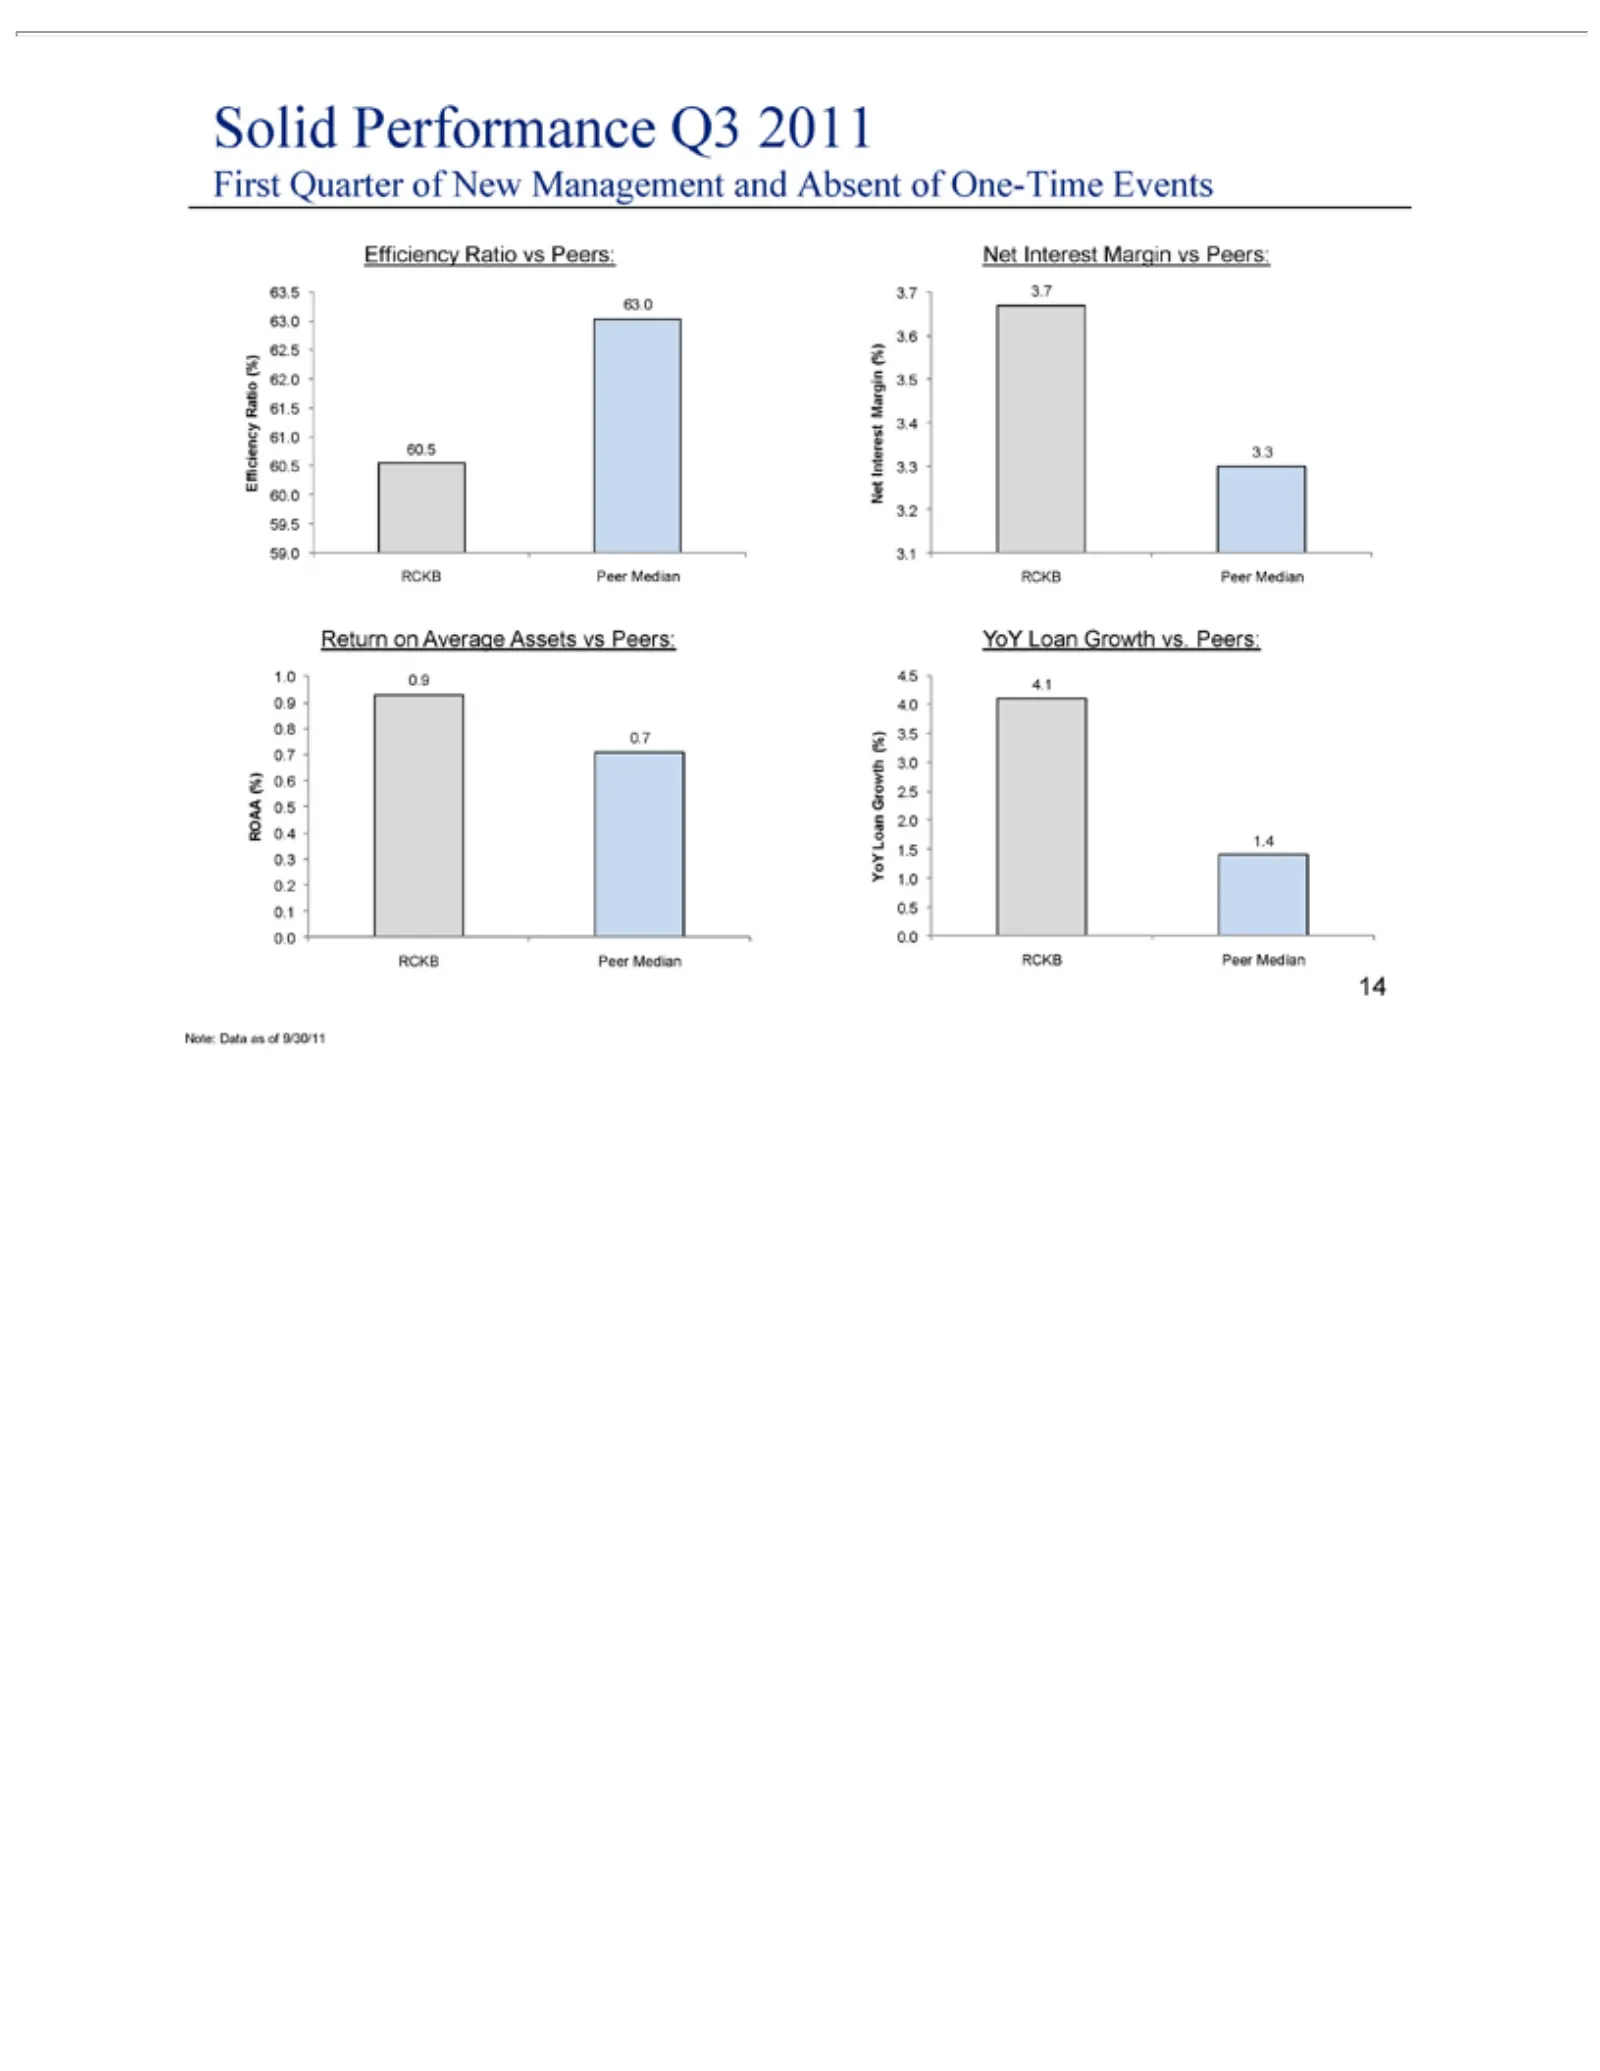
Slide 14: Solid First Quarter Performance vs Peers
Solid First 63.5 Ratio 62.0 62.5 Efficiency 60.5 59.0 59.5 Net 3.7 3.6 Interest 3.3 3.4 3.1 3.2 Return 0.7 0.8 0.9 ROAA 0.1 0.2 0.3 YoY (%) 4.0 4.1 4.5 Growth 3.0 Loan 2.0 RCKB 0.0 0.5 1.0 3.7 0.9 Interest Margin 0.6 3.5 63.0 Loan Quarter 1.4 Performance 61.5 on Peer 0.4 3.3 2.5 YoY 63.0 Average Gro
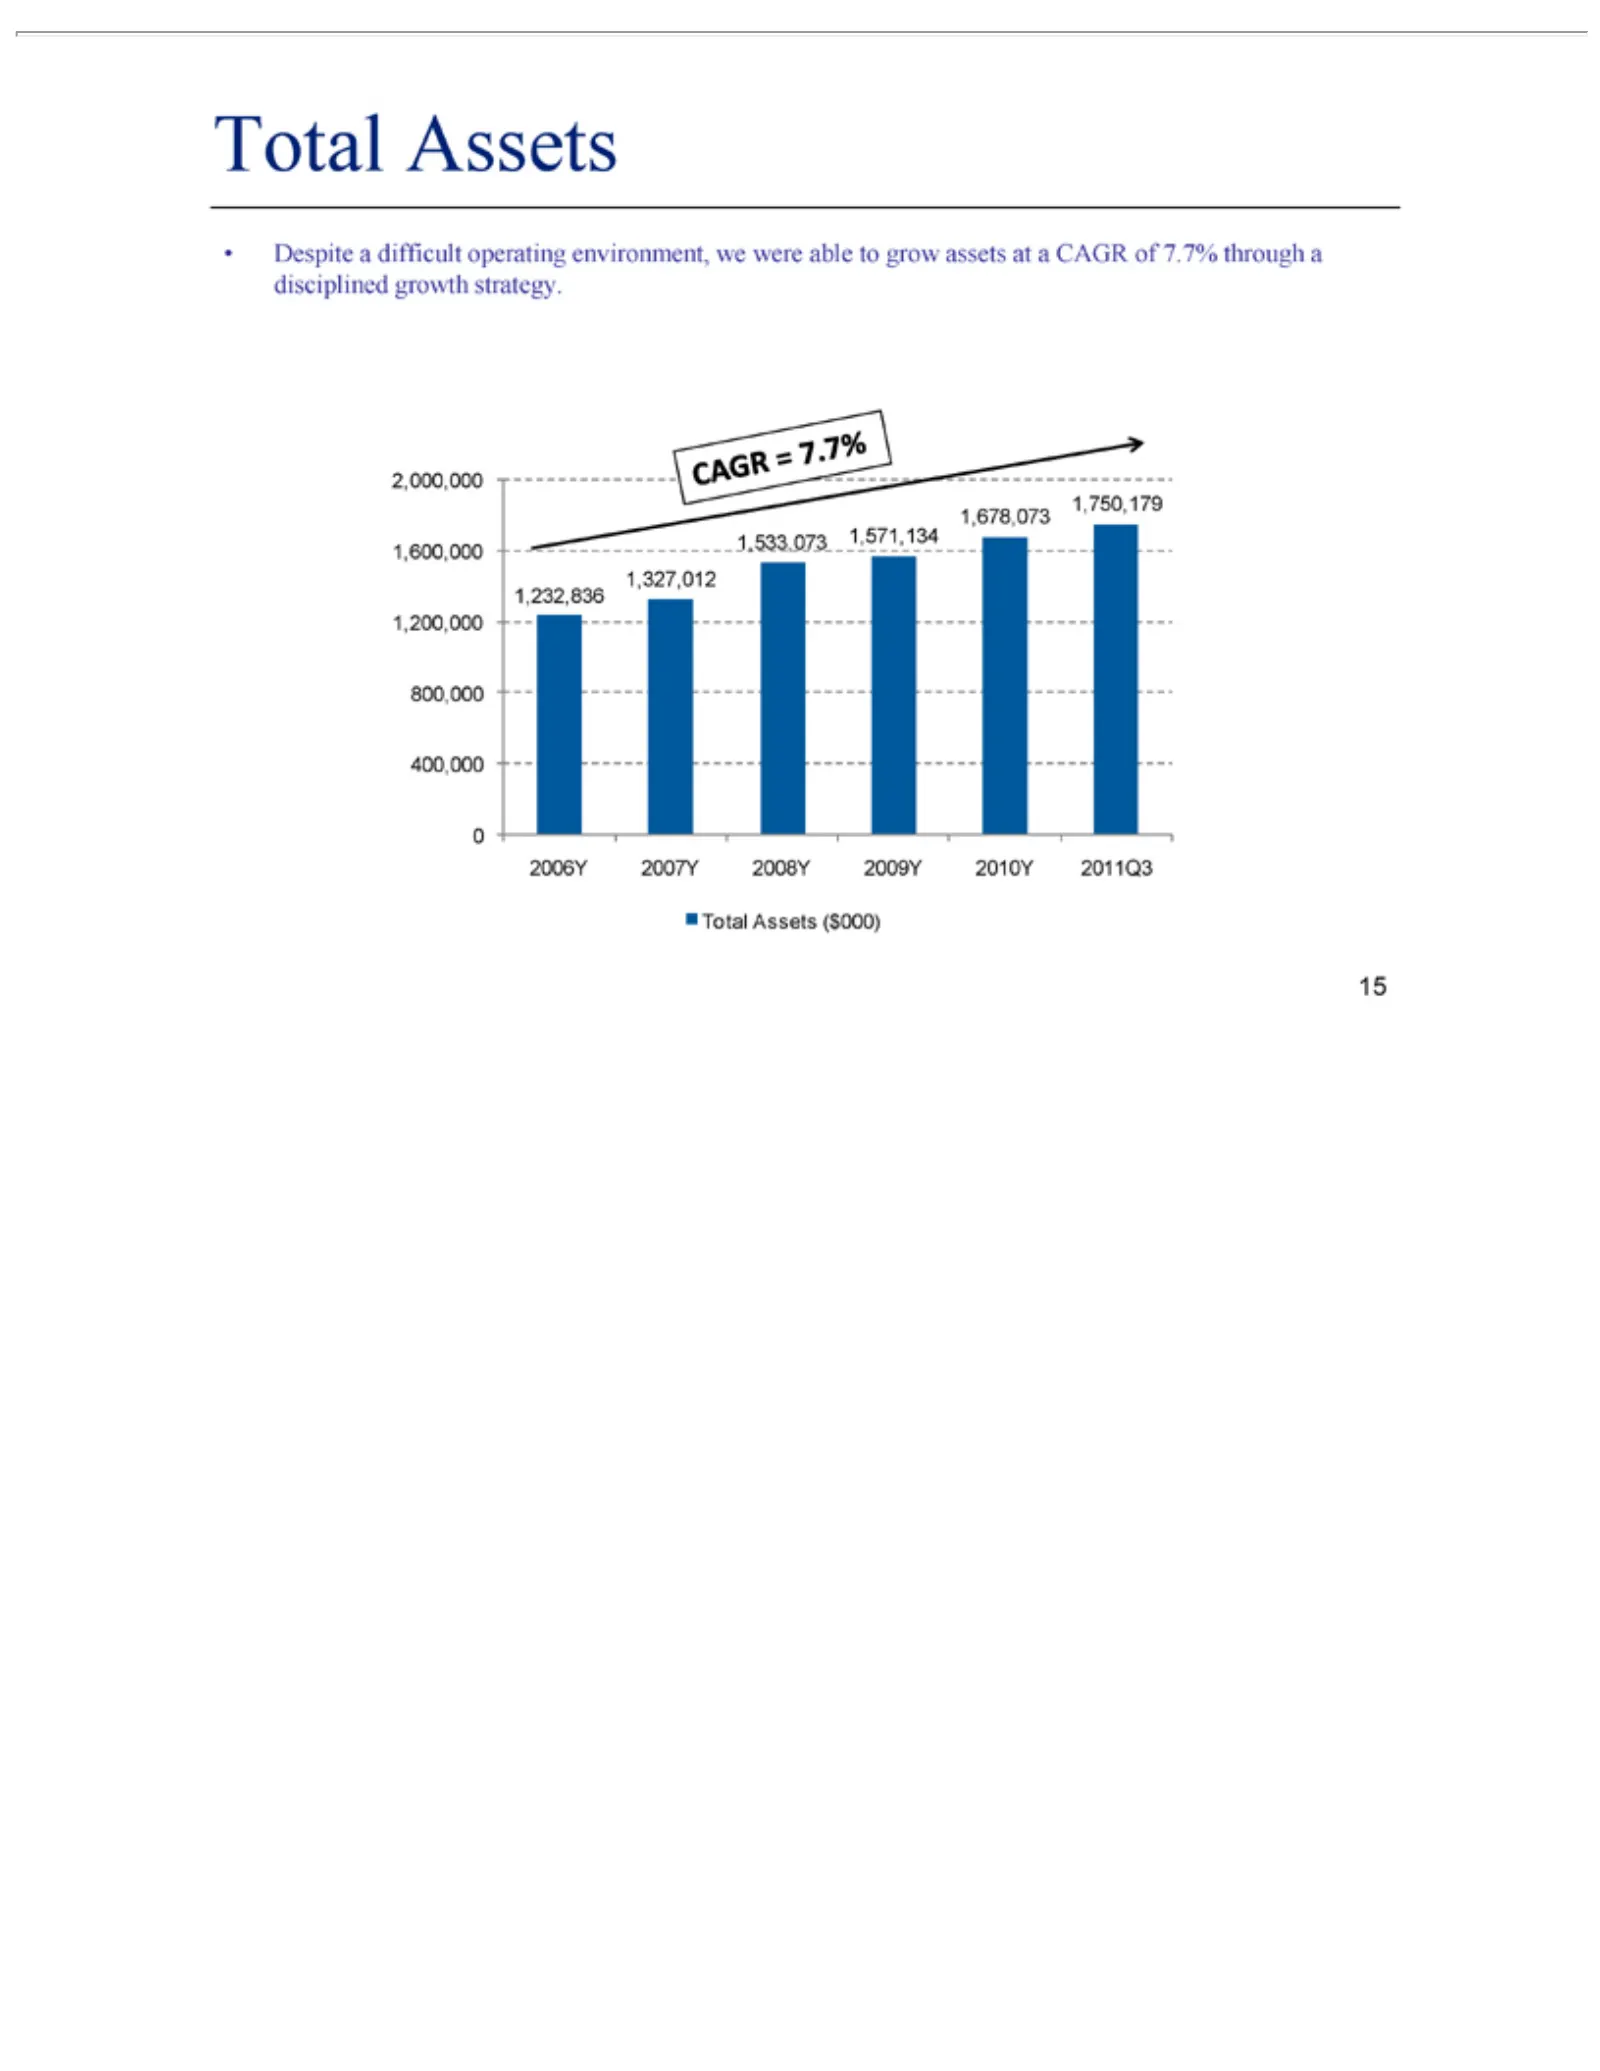
Slide 15: Total Assets Growth
• 006Y 1,750,179 2,000,000 2 0 400,000 800,000 Total Despite Assets 2007Y a1,678,073 difficult ($000) 2008Y operating 1,533,073 2009Y 2010Y environment, 1,571,134 2011Q3 1,600,000 we were able 1,327,012 to grow 1,232,836 assets at1,200,000 a CAGR of 7.7% through a disciplined growth strategy.
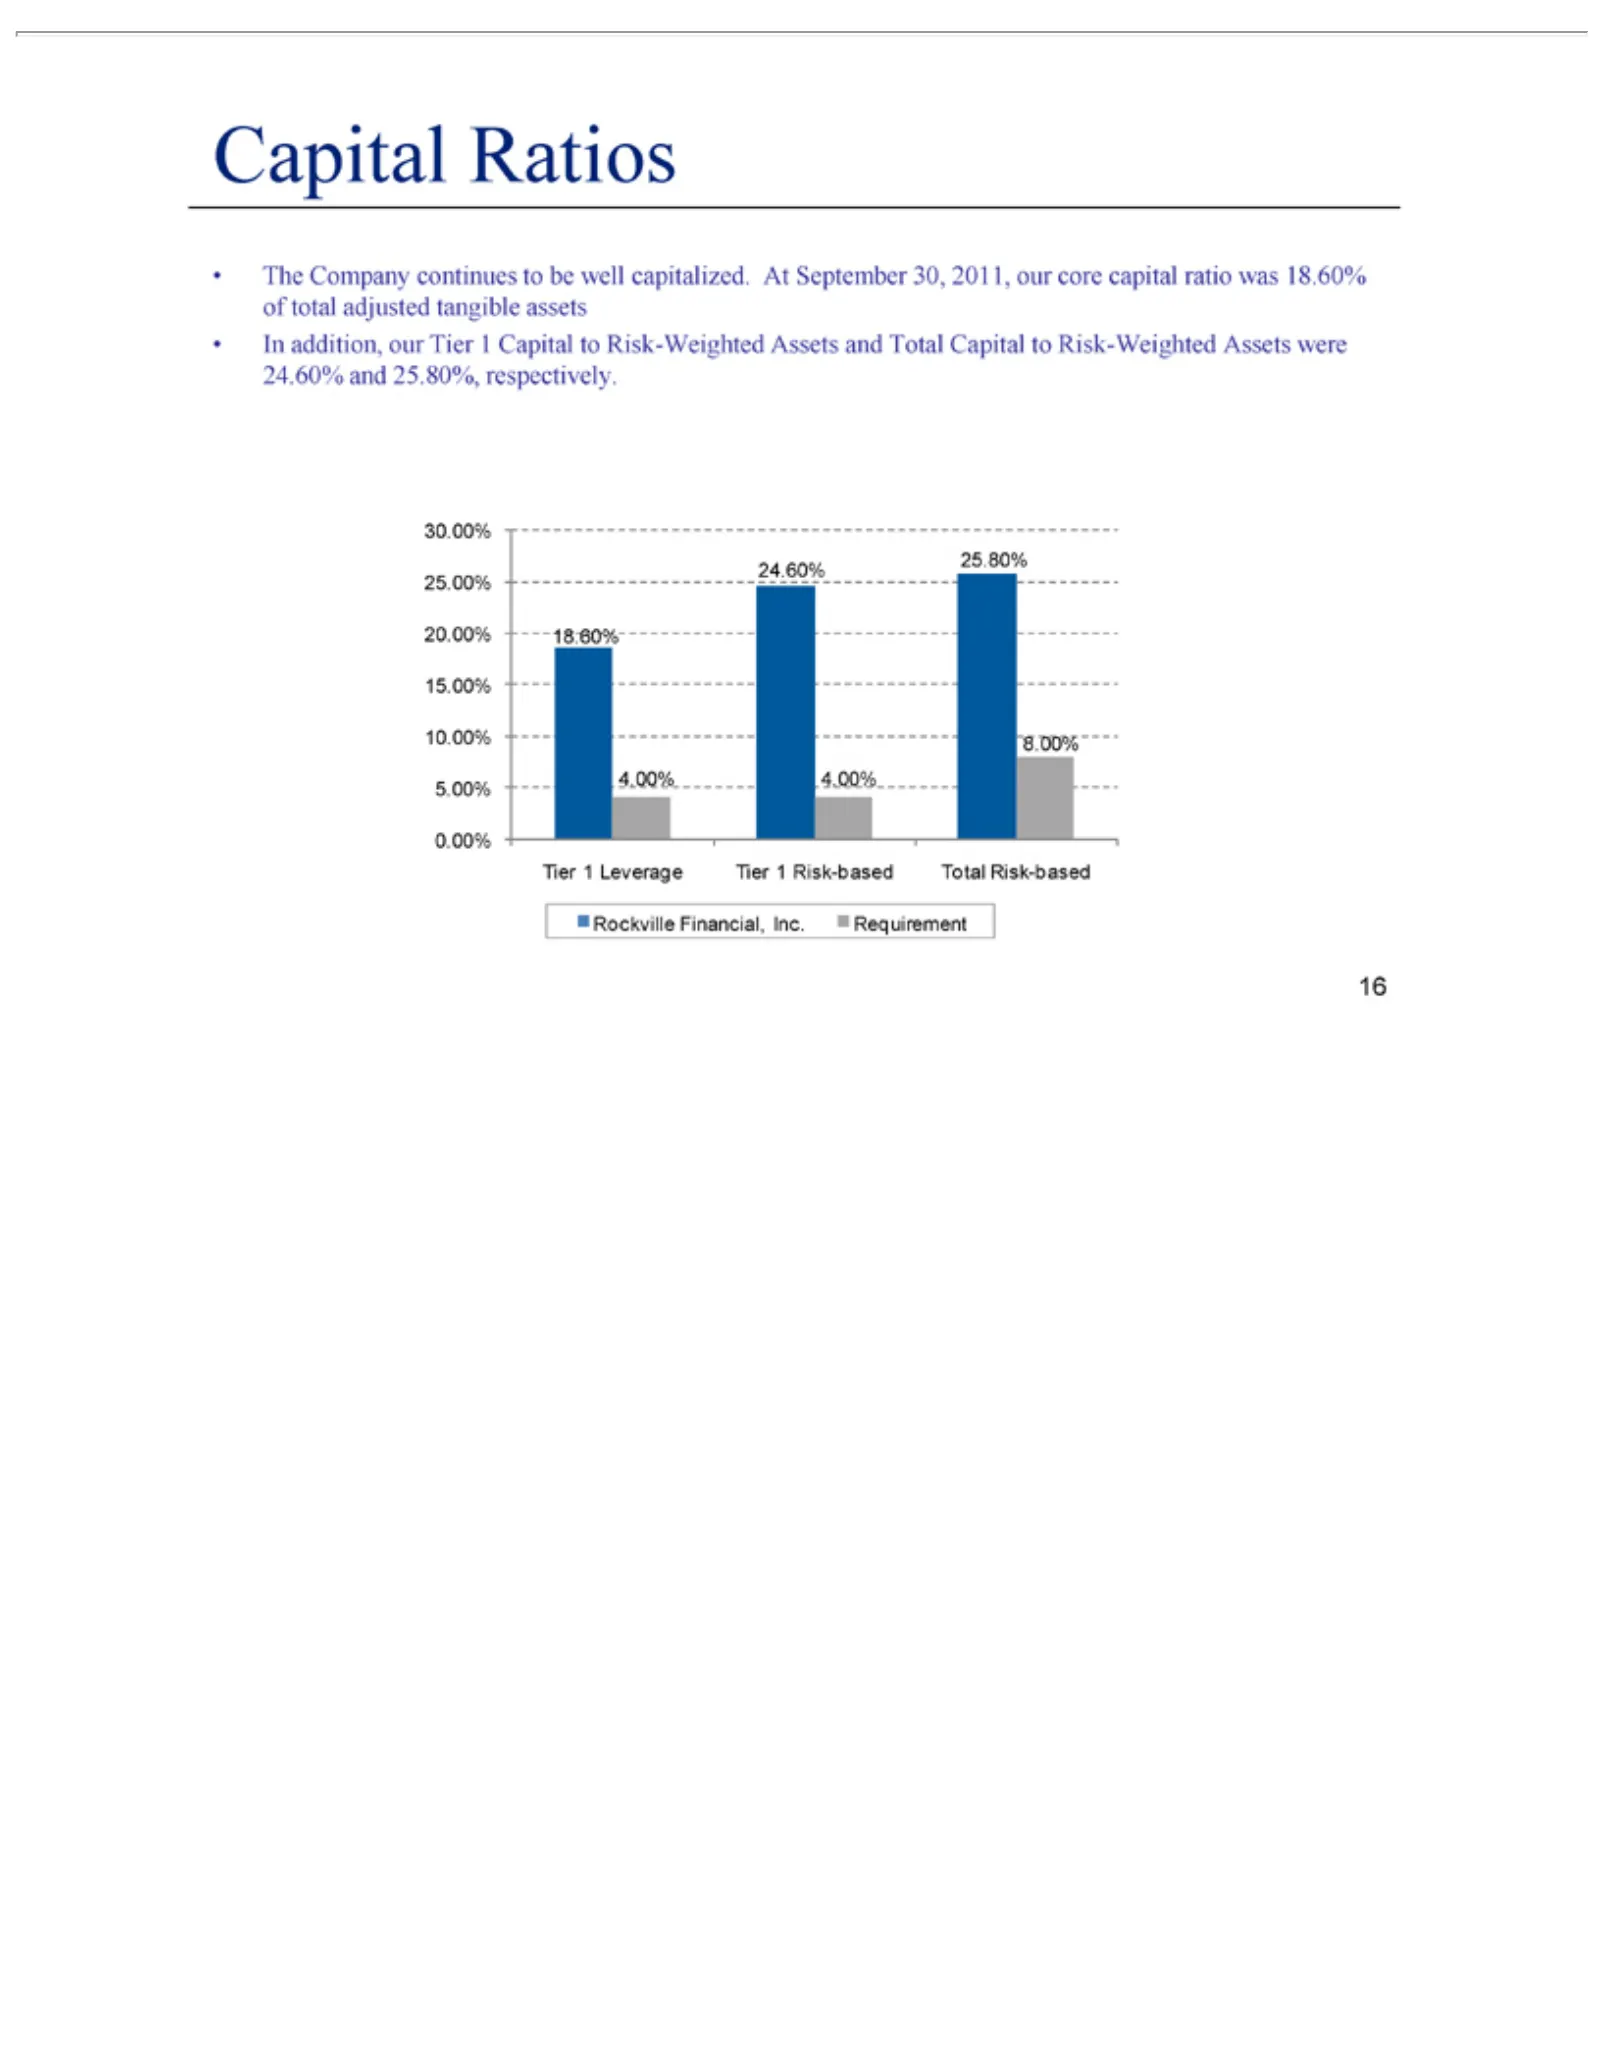
Slide 16: Capital Ratios
•Capital 25.80% 30.00% 20.00% 10.00% 15.00% Tier 0.00% Rockville The In addition, 1Company Leverage Ratios 24.60% 18.60% 8.00% Financial, our 4.00% continues Tier 25.00% TierInc. 114.00% Risk-based Capital Requirement to be 5.00% to well Risk-Weighted Total capitalized. Risk-based At Assets Septembe
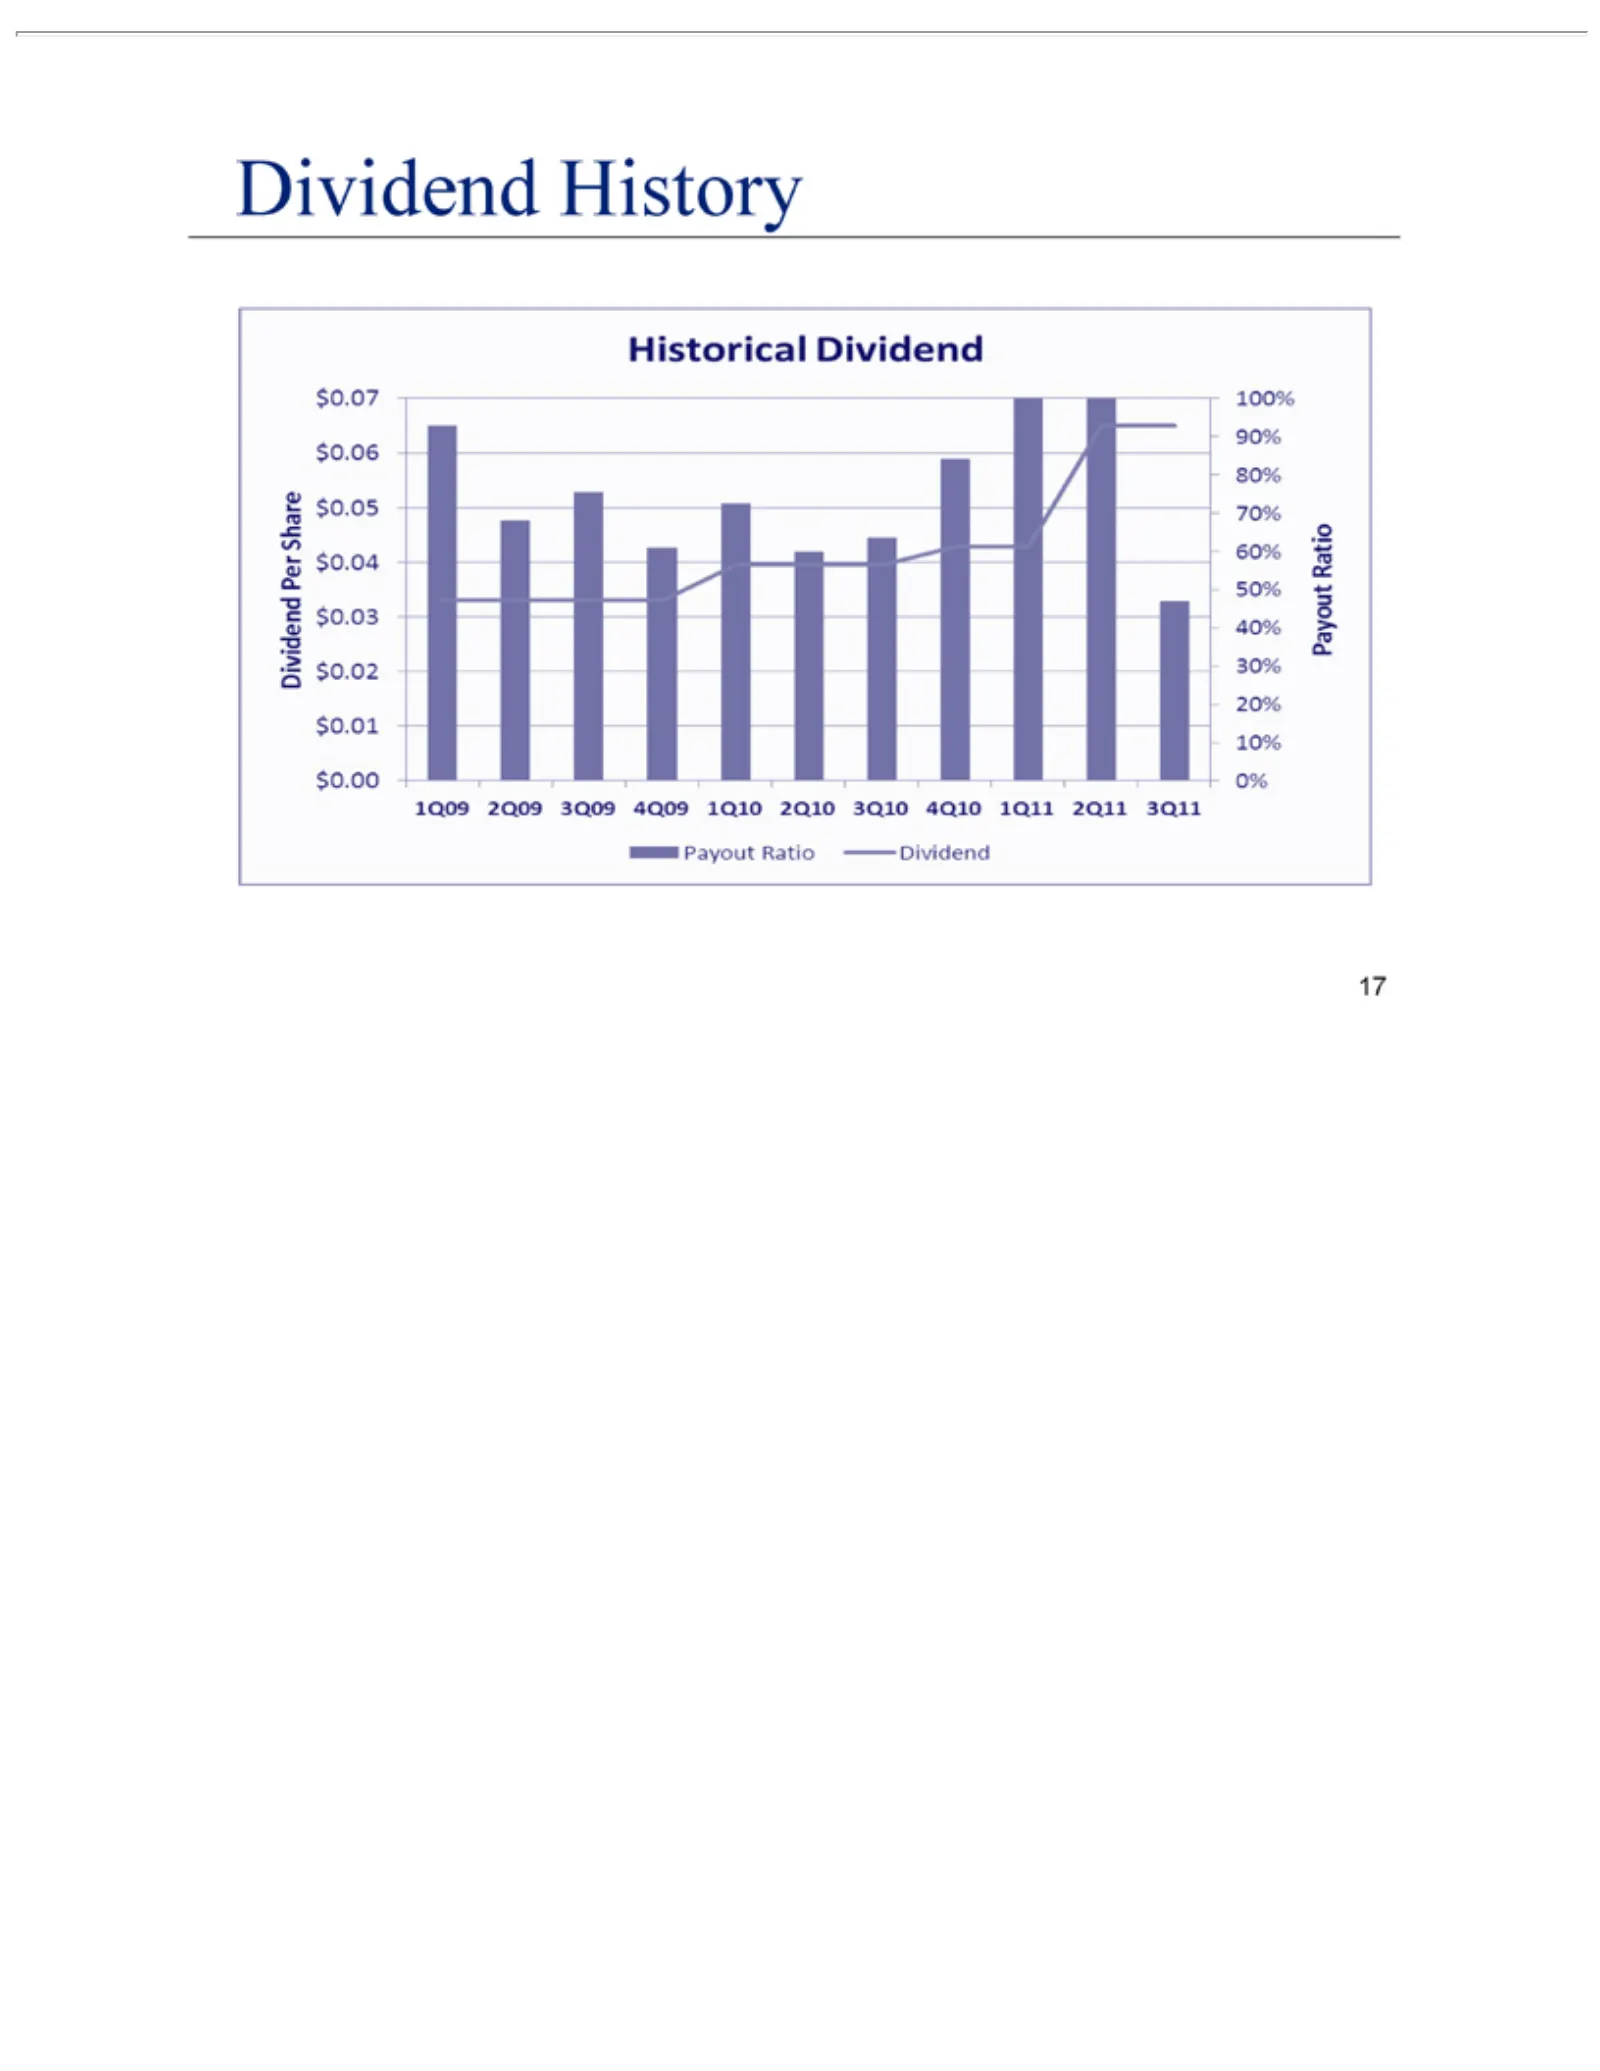
Slide 17: Dividend History
Dividend History Historical Dividend $0.07 + 100% + 90% $0.06 + 80% £ so.0s | 70% = B $0.04 poe | 50% 5 $0.03 | 40% = | & $0.02 | 30% | 20% $0.01 Ses $0.00 + + 09% 1Q09 2Q09 3Q09 4Q09 19010 2Q10 3Q10 4Q10 1Q11 2Q11 3Q11 SE Payout Ratio Dividend Payout Ratio
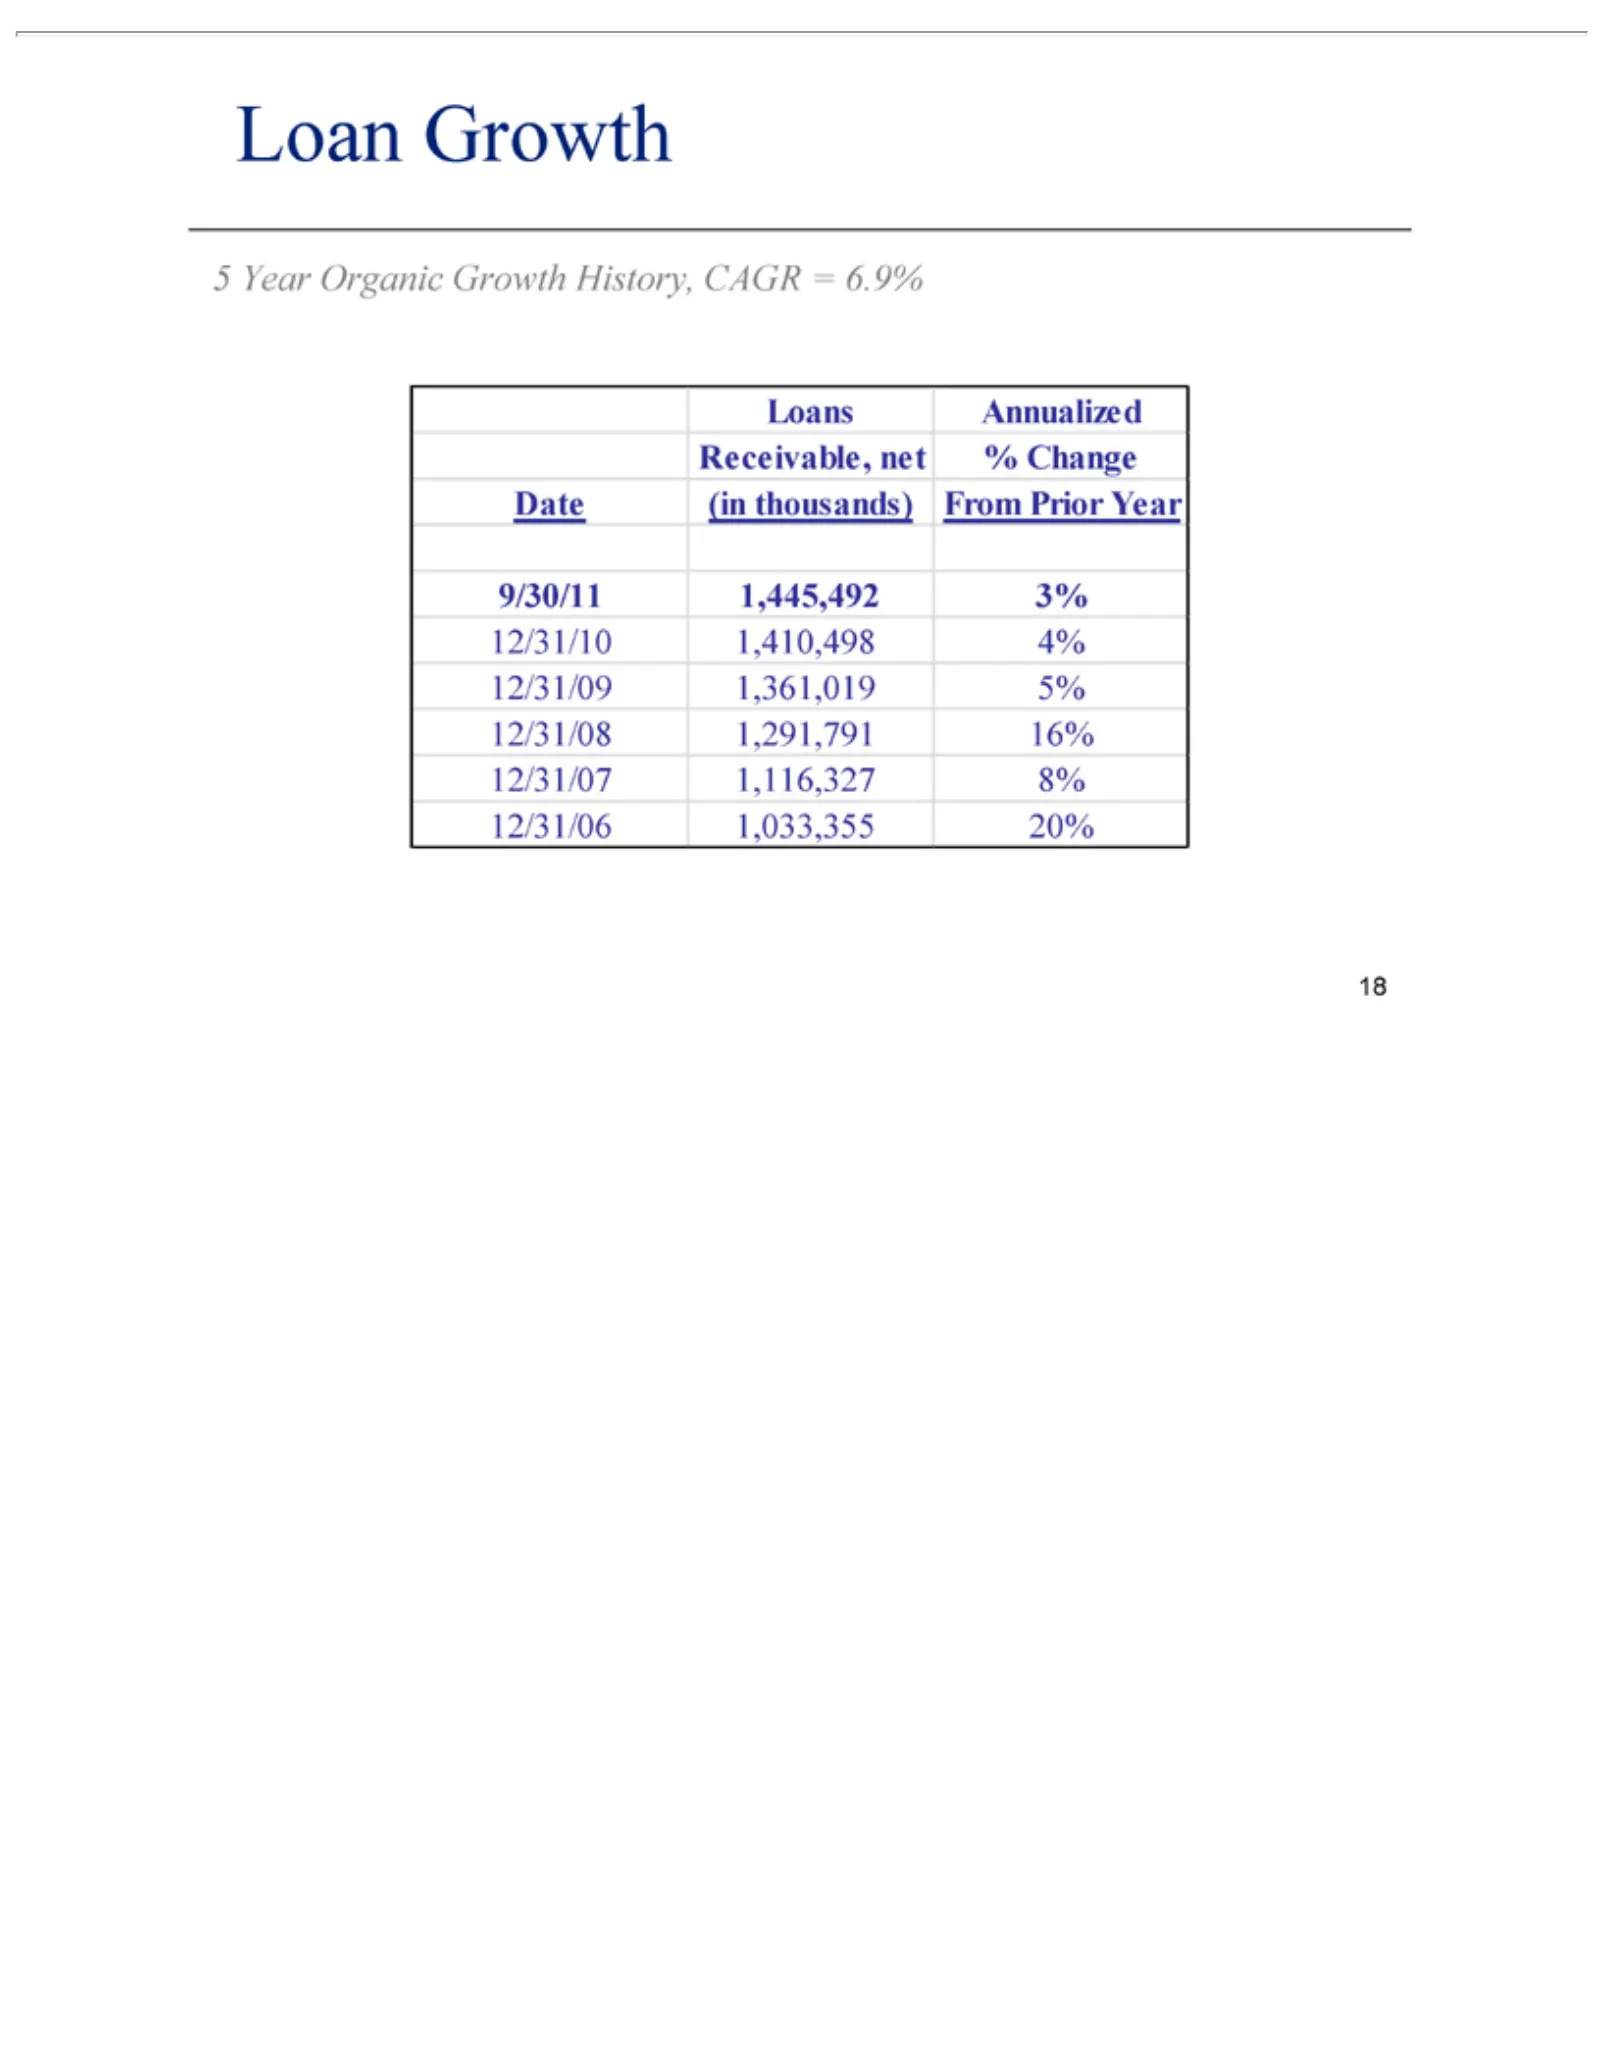
Slide 18: Loan Growth
Loan Growth 5 12/31/10 Loans 9/30/11 Year Organic Annualized 1,445,492 1,410,498 Growth History, Receivable, 3% 4% 12/31/09 CAGR net1,361,019 % Change = 12/31/08 5% 6.9% Date (in thousands) 1,291,791 From 16%Prior 12/31/07 Year 1,116,327 8% 12/31/06 1,033,355 20%
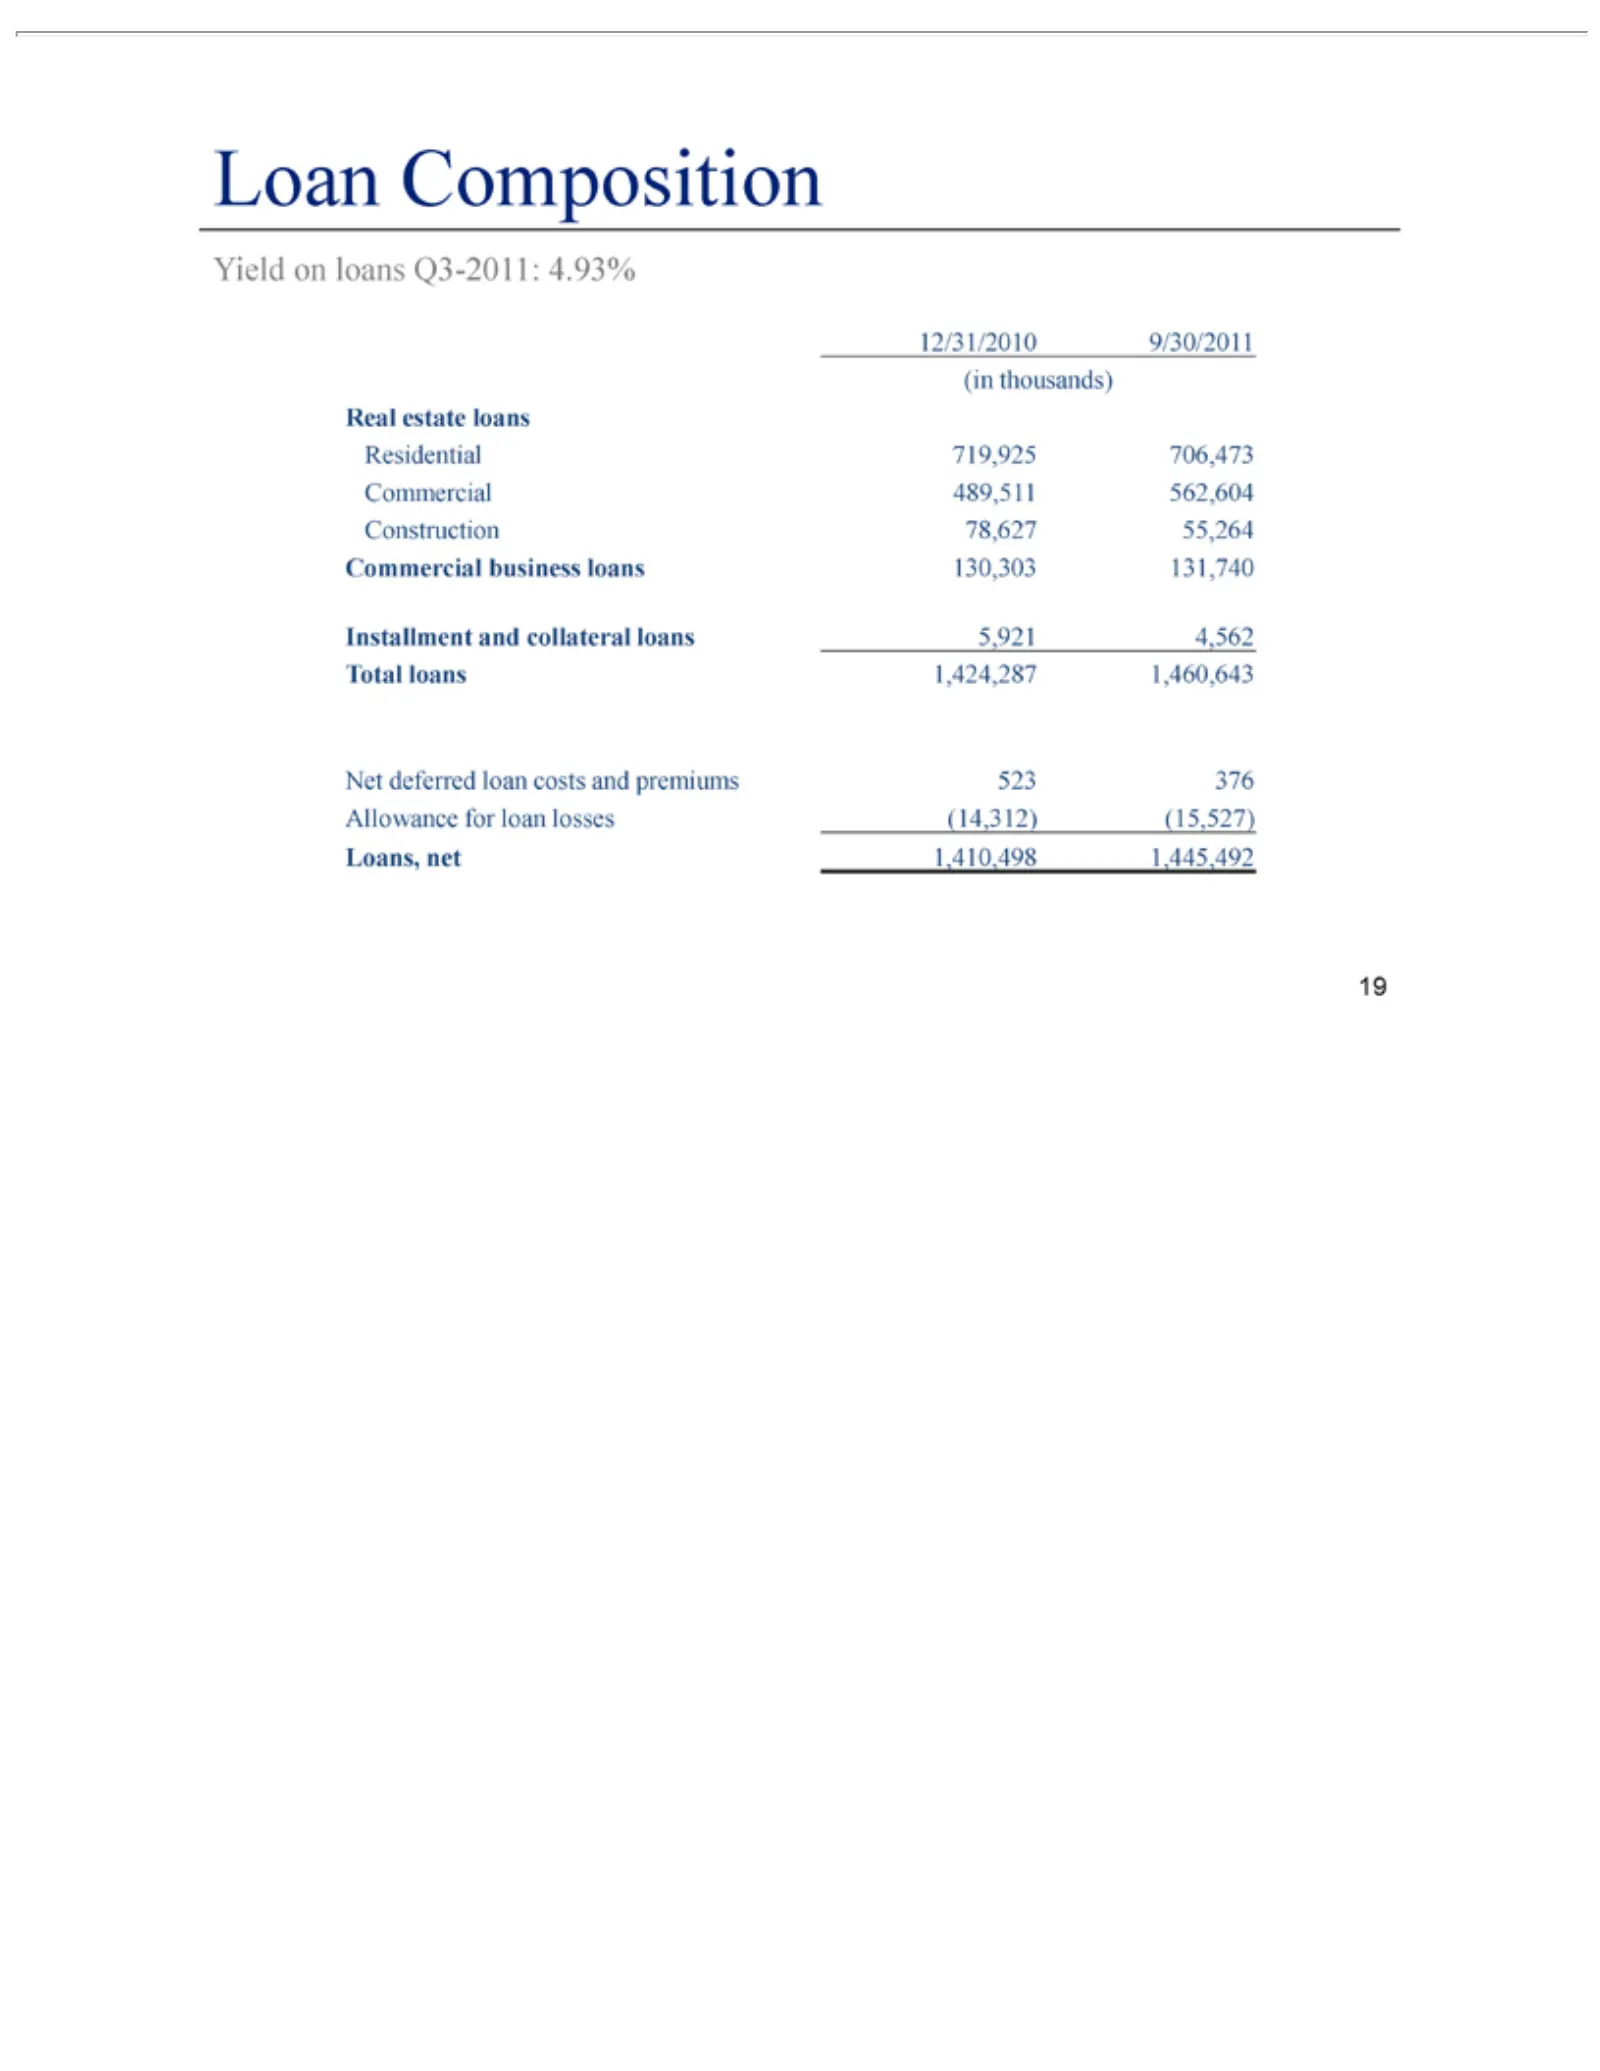
Slide 19: Loan Composition and Yield
Loandeferred Yield 12/31/2010 Real Residential Commercial Installment Total Net estate loans Composition on loans loans 1,424,287 and 719,925 9/30/2011 business loan Q3-2011: collateral costs 706,473 loans 1,460,643 (in and 4.93% loans thousands) premiums 130,303 Commercial 5,921131,740 4,562 523489
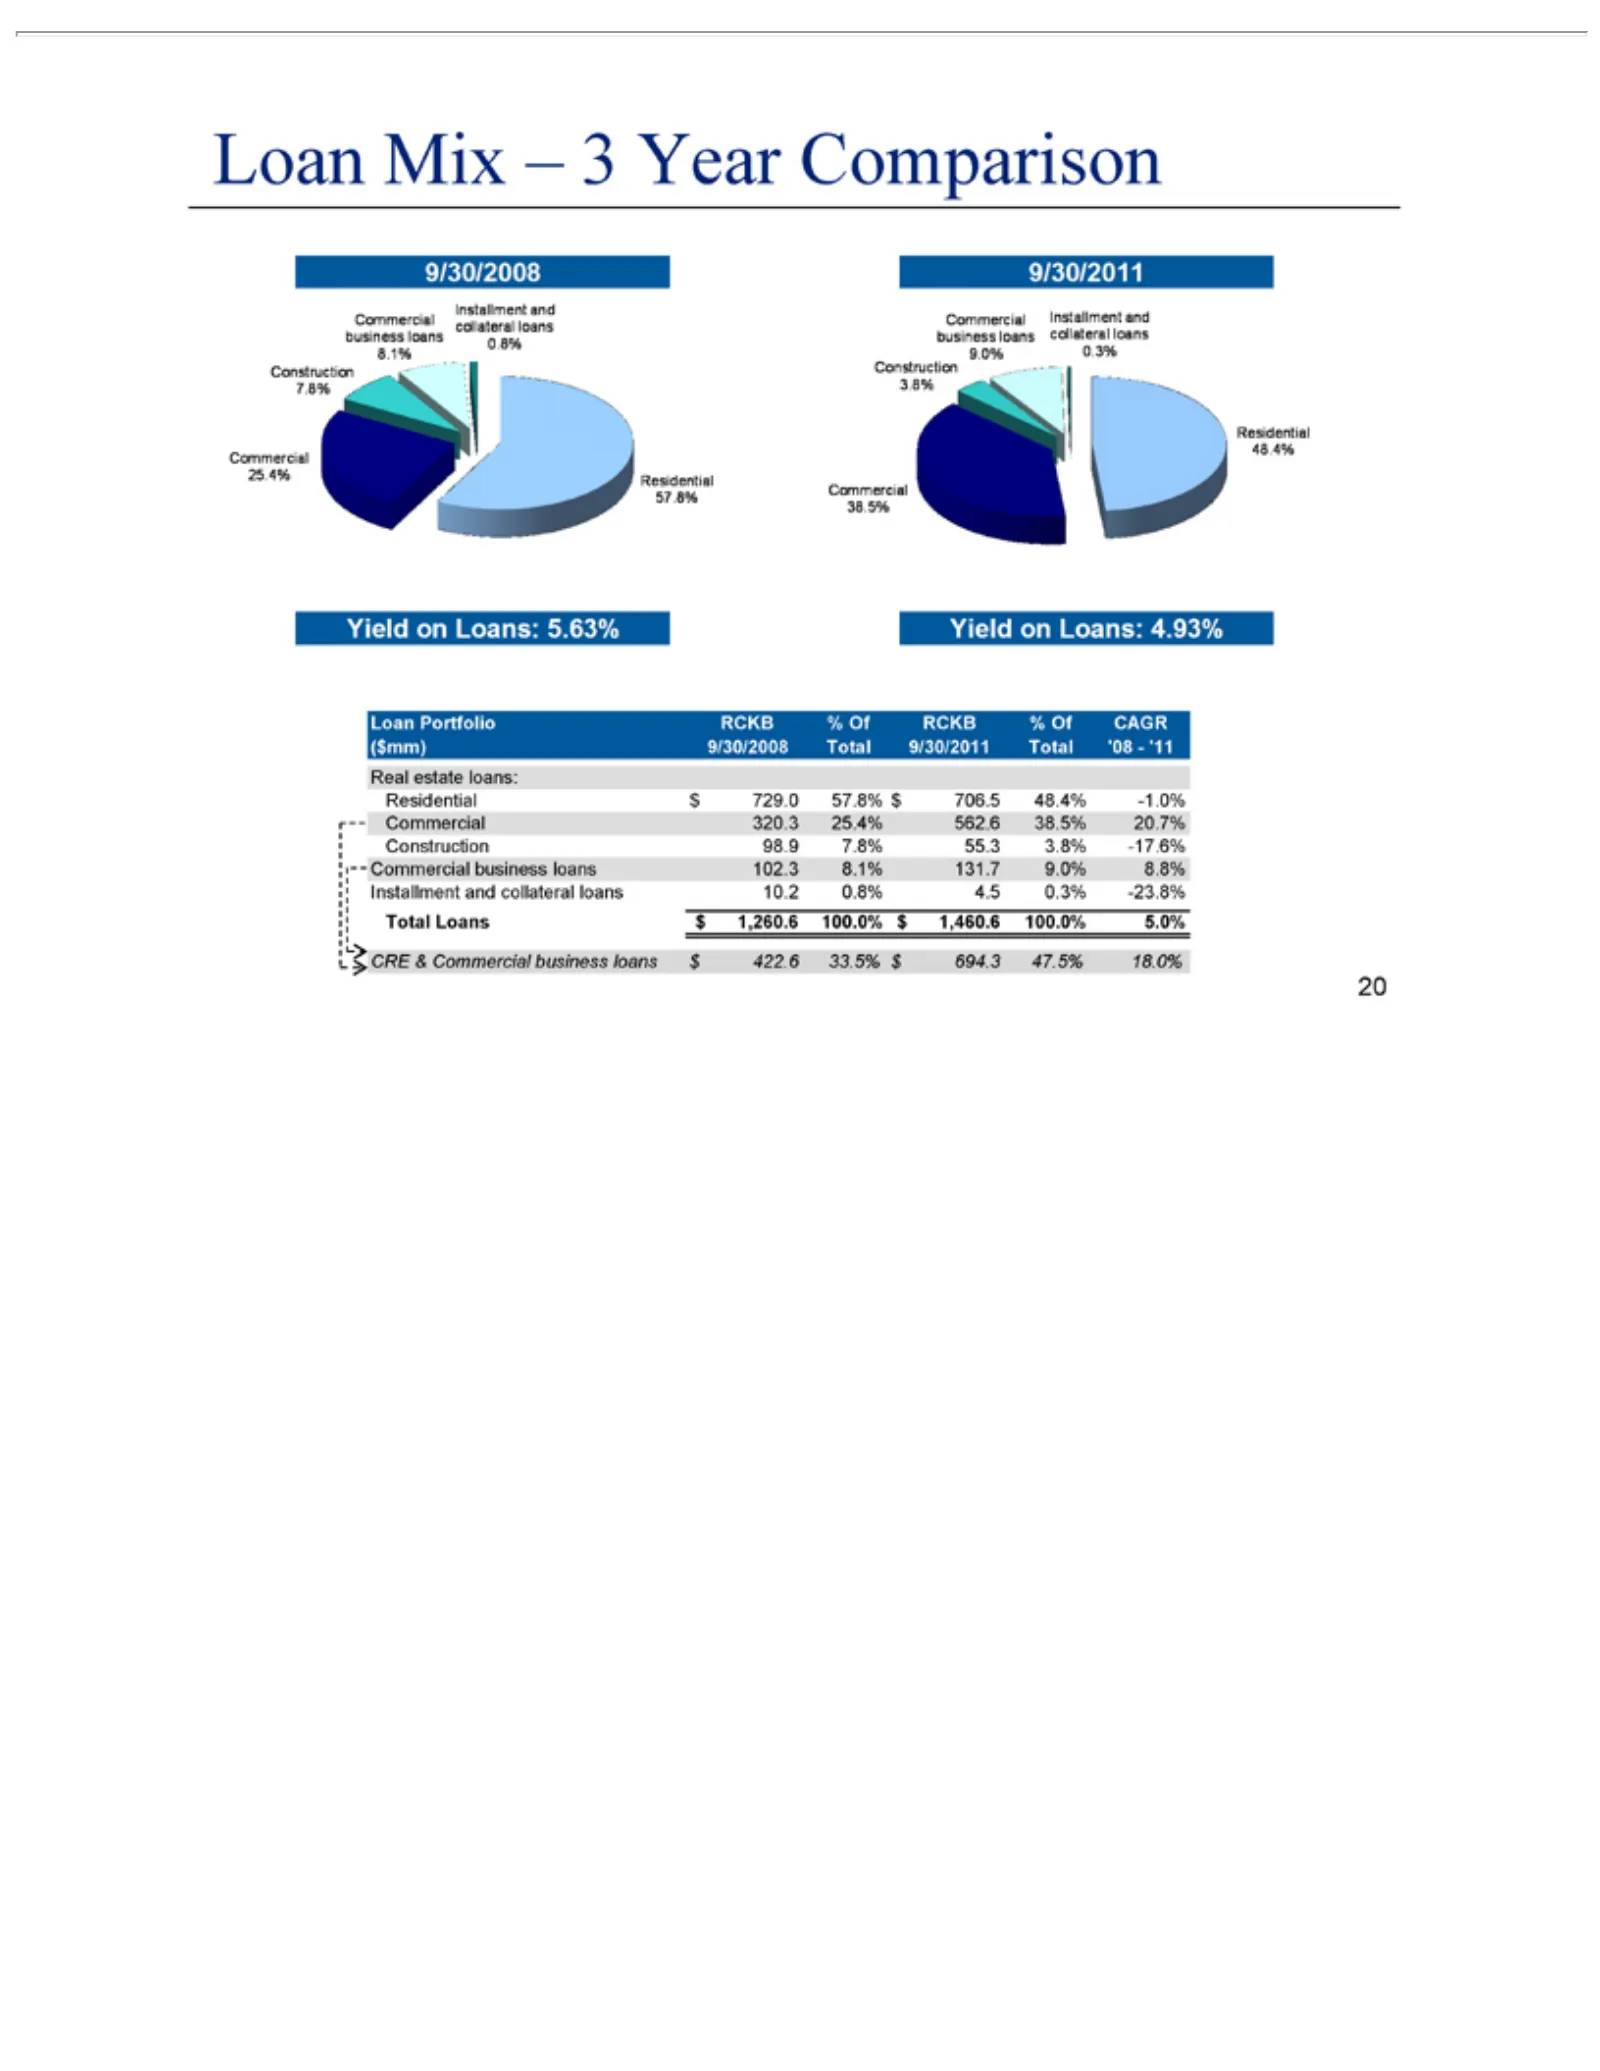
Slide 20: Loan Portfolio Mix and Comparison
Loanestate Real Residential Installment Total CRE & Loans Mix Portfolio Commercial –loans: and $3$729.0 Year 1,260.6 RCKB collateral Comparison 57.8% business 100.0% % Ofloans $ RCKB 706.5 loans $10.2 1,460.6 48.4% $% 0.8% 422.6 Of100.0% CAGR -1.0% 4.5 33.5% 0.3% Commercial 5.0% ($mm) $-23.8% 694.3
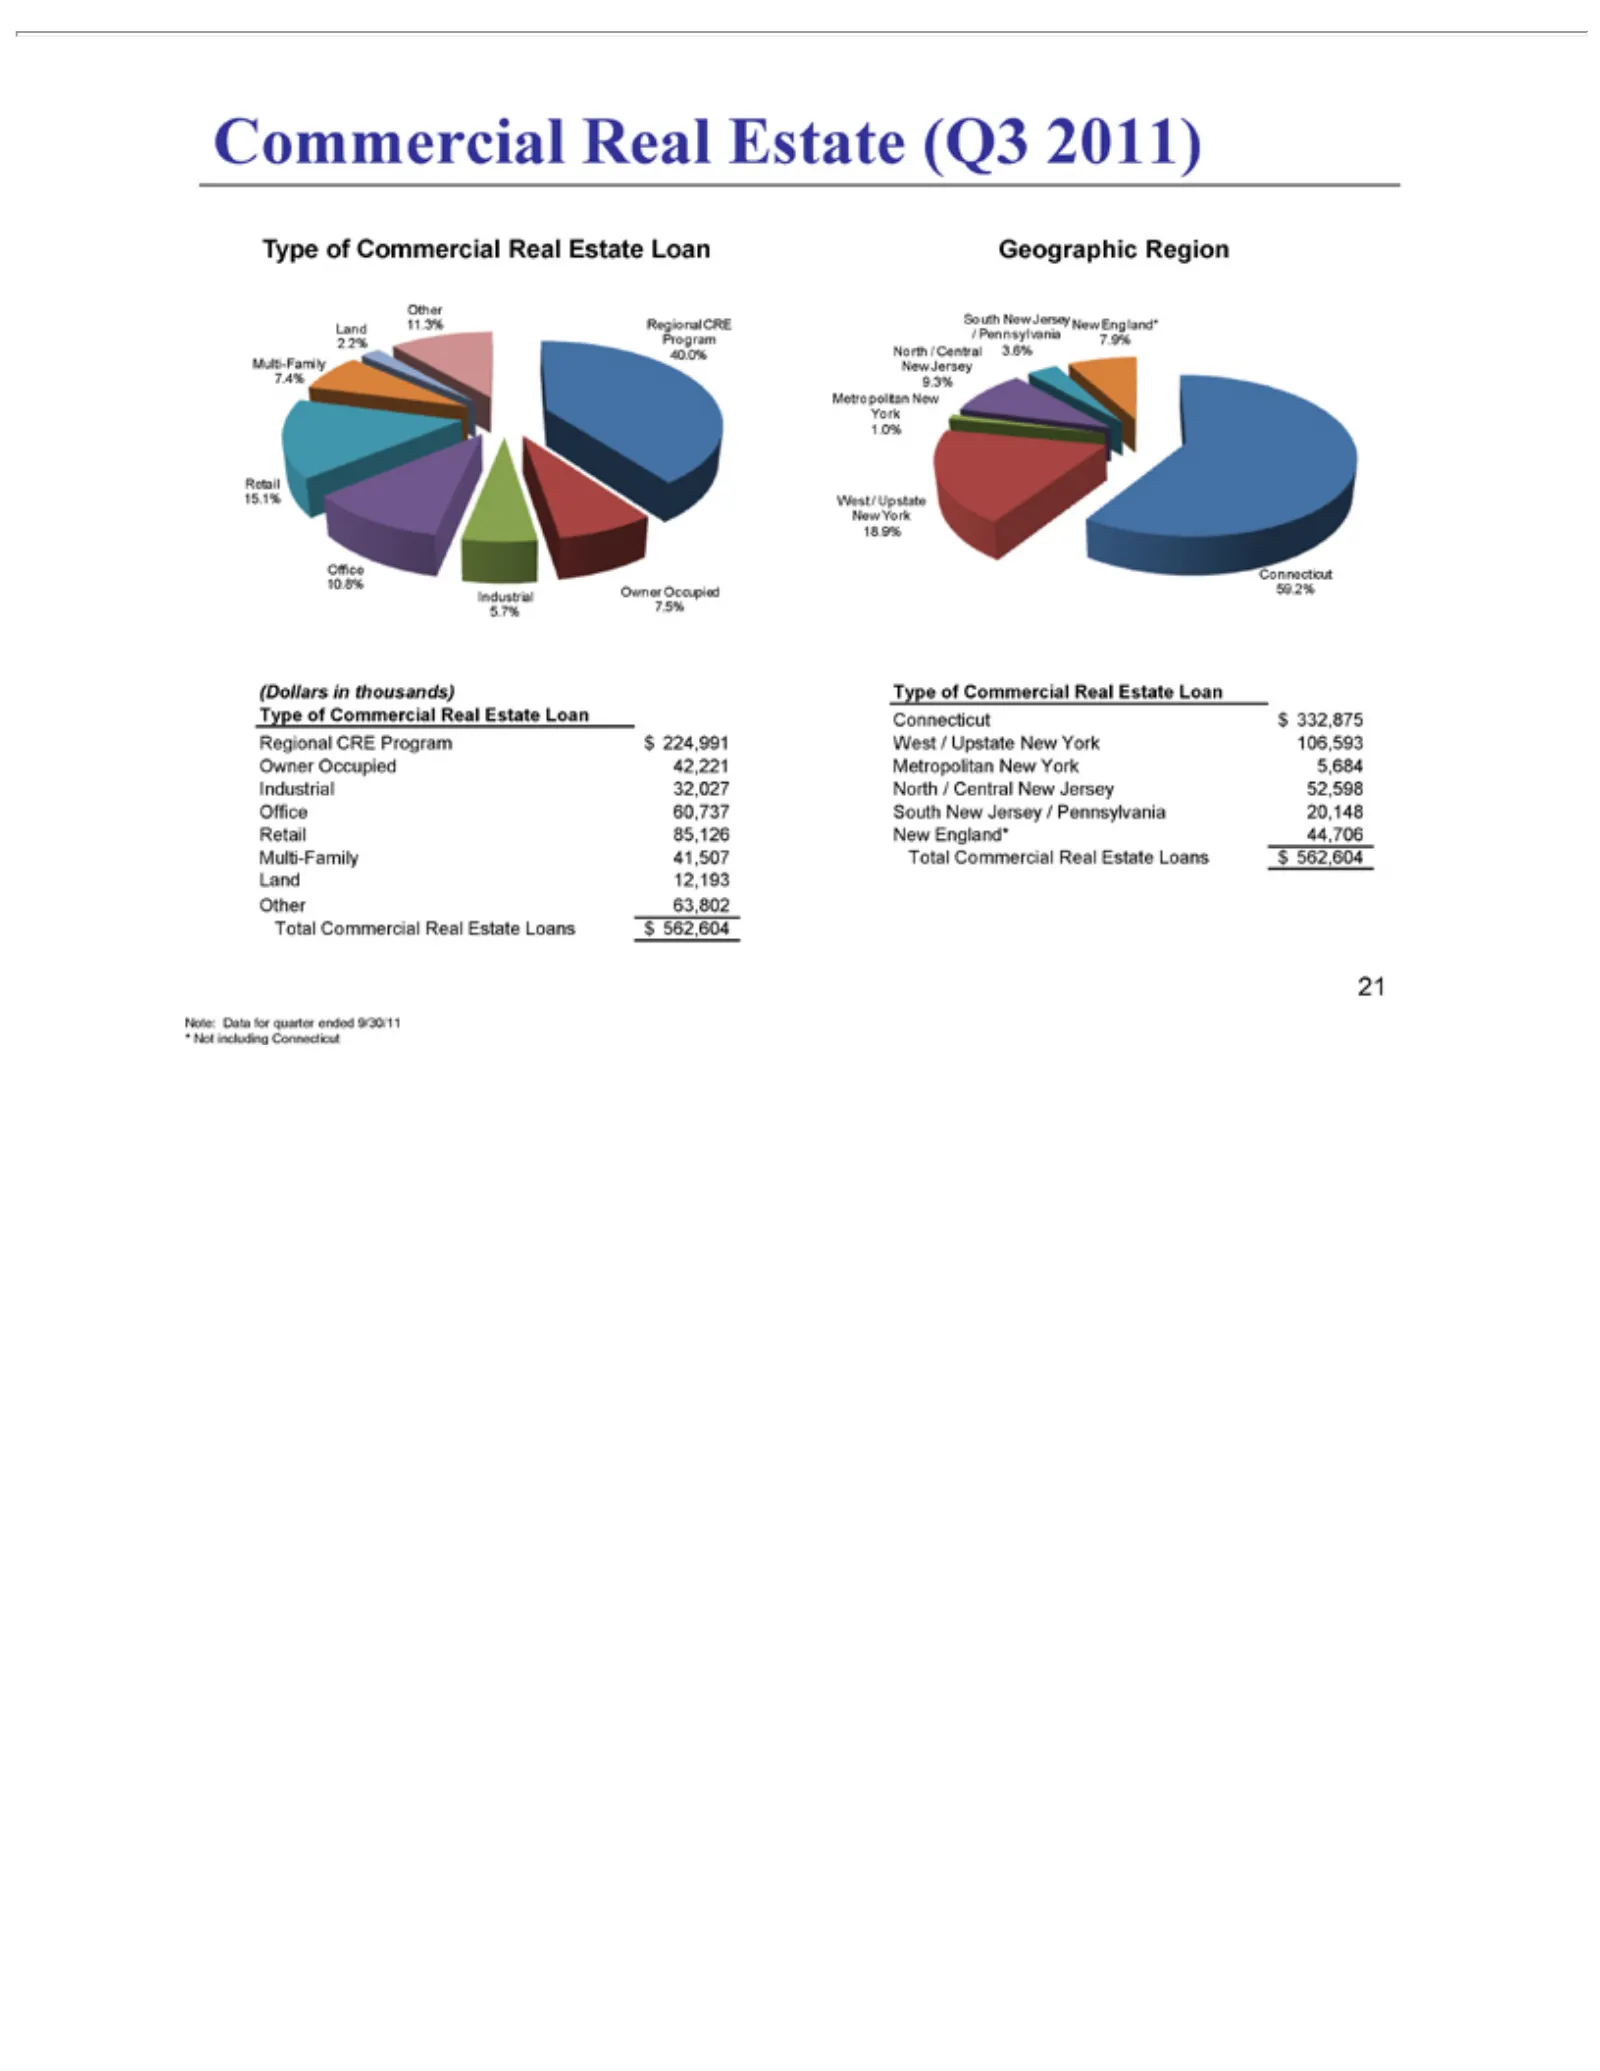
Slide 21: Commercial Real Estate Portfolio
Commercial Other Program 8. Upstate (Dollars Type 32,027 562,604 Multi-Family of South North New Commercial Land in New thousands) New Real York /12,193 Jersey Central 50% Jersey/ Estate Owner Real /New Other Pennsylvania Type New (Q3 New Occupied Estate Jersey 63,802 of Jersey 2011) England* Commer
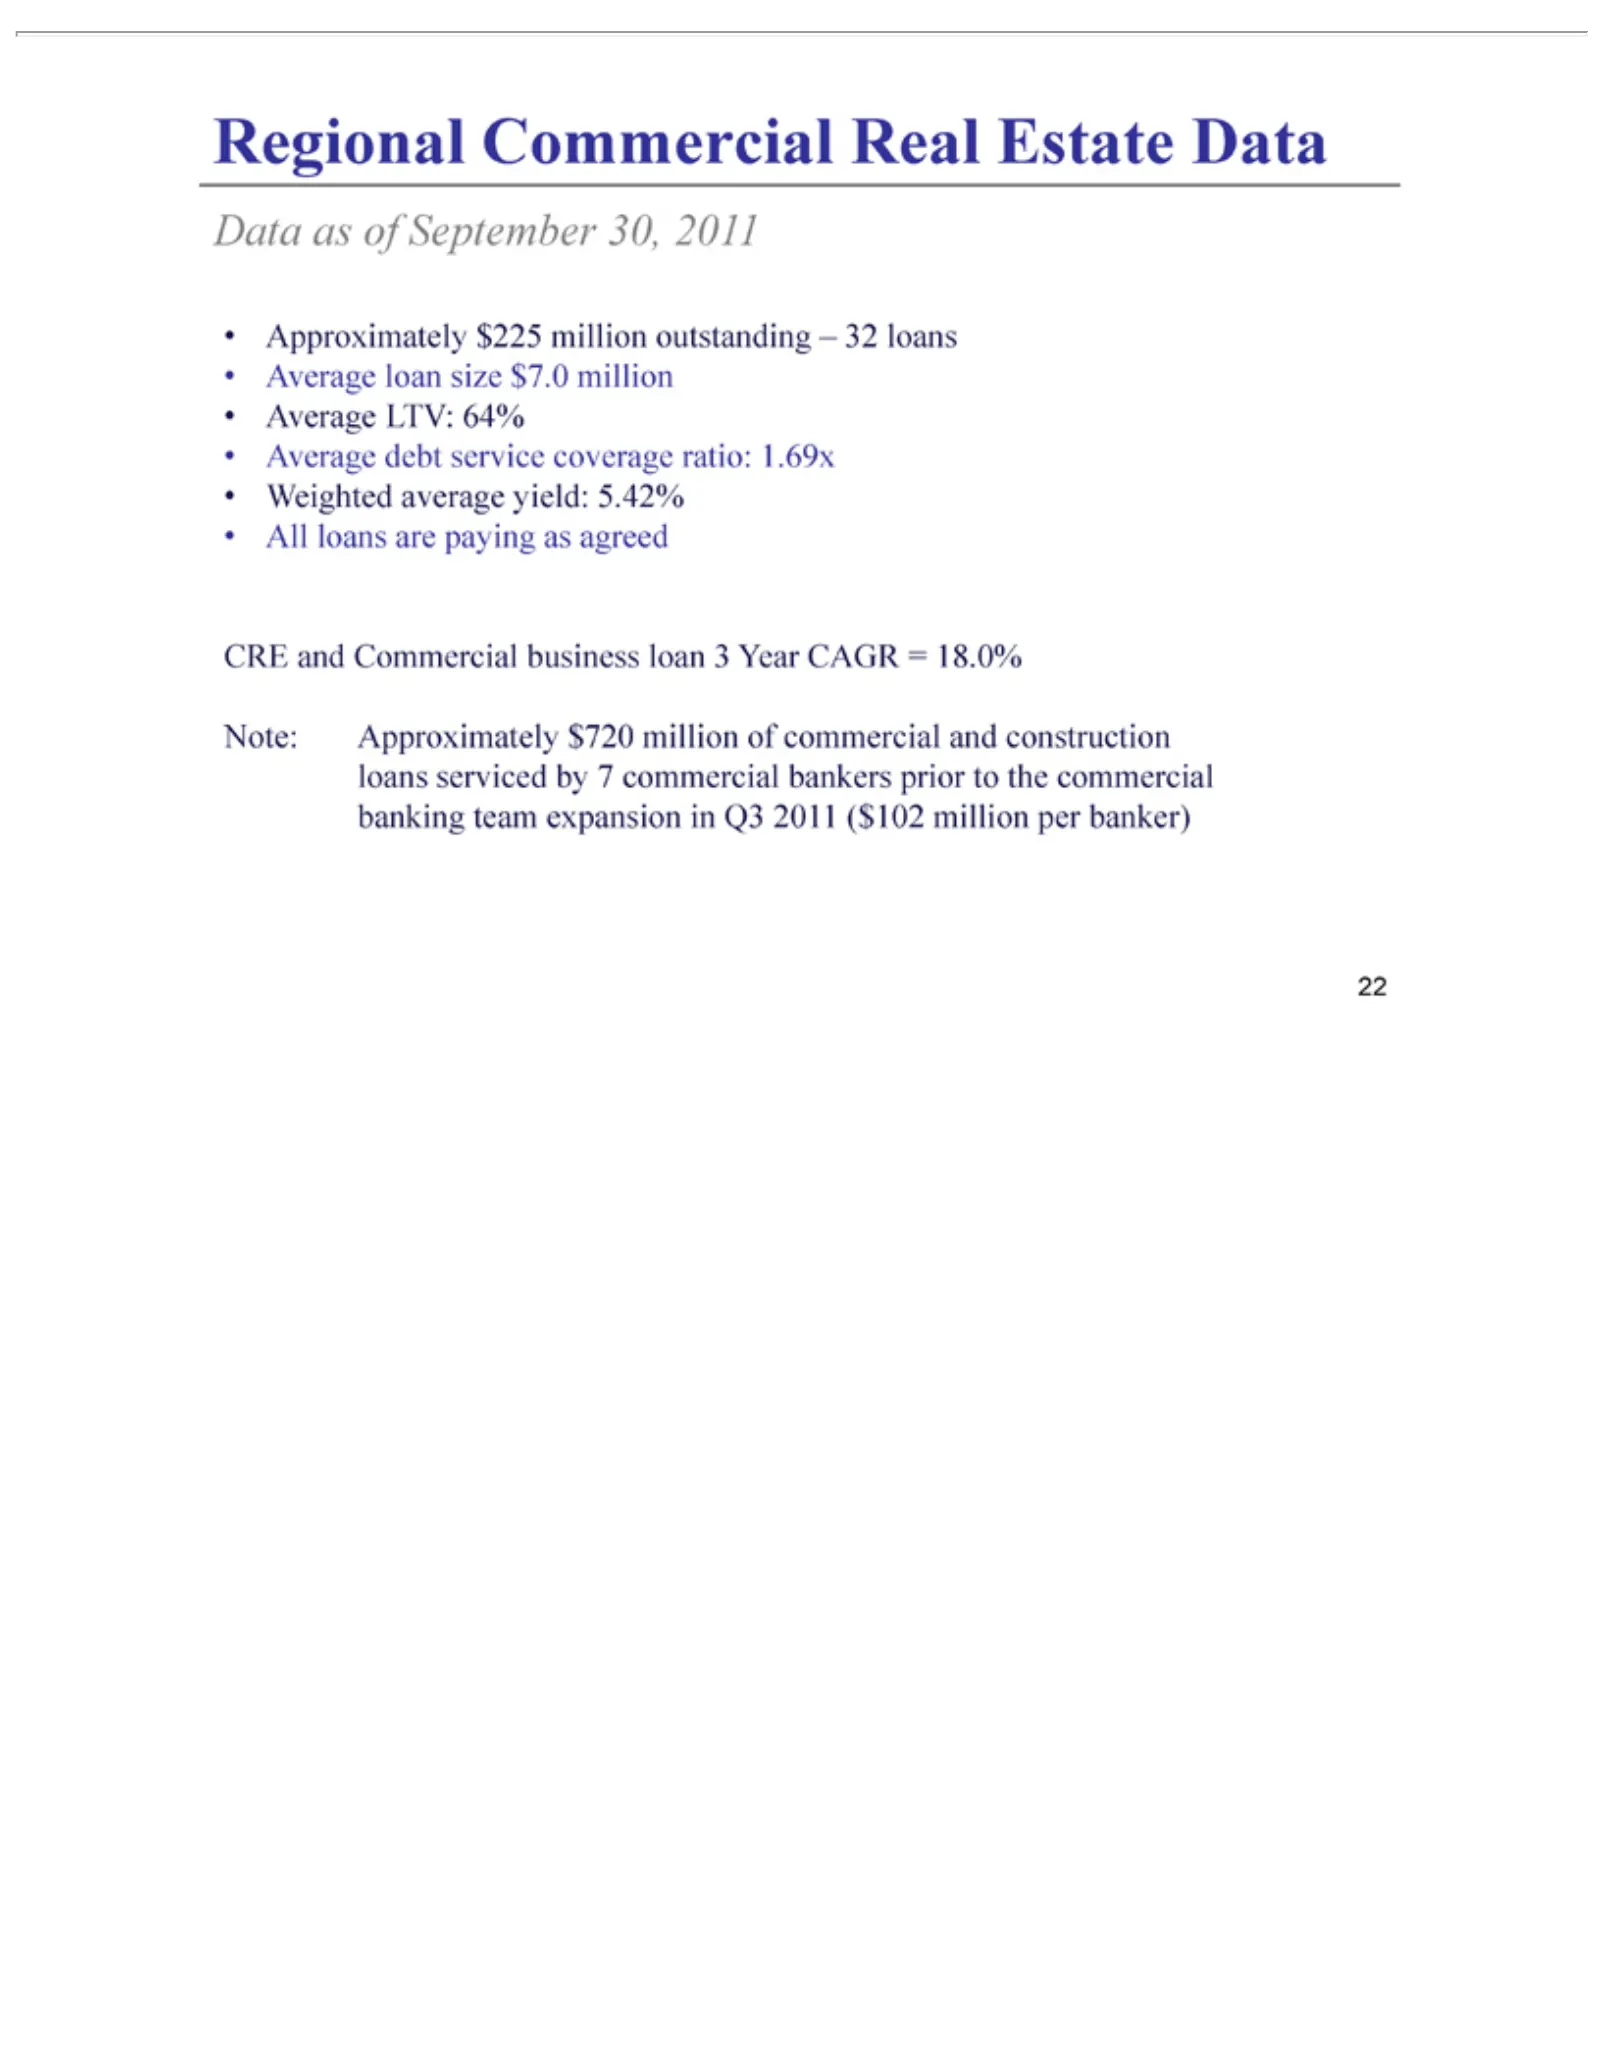
Slide 22: Regional CRE Data
Regional •Data CRE Note: Approximately Average All Weighted loans as and Approximately ofCommercial loan LTV: debt September are average paying size service 64% $225 $7.0 yield: $720 30, as Real business million coverage million agreed 2011 5.42% million Estate outstanding loan ratio: Data of3commer
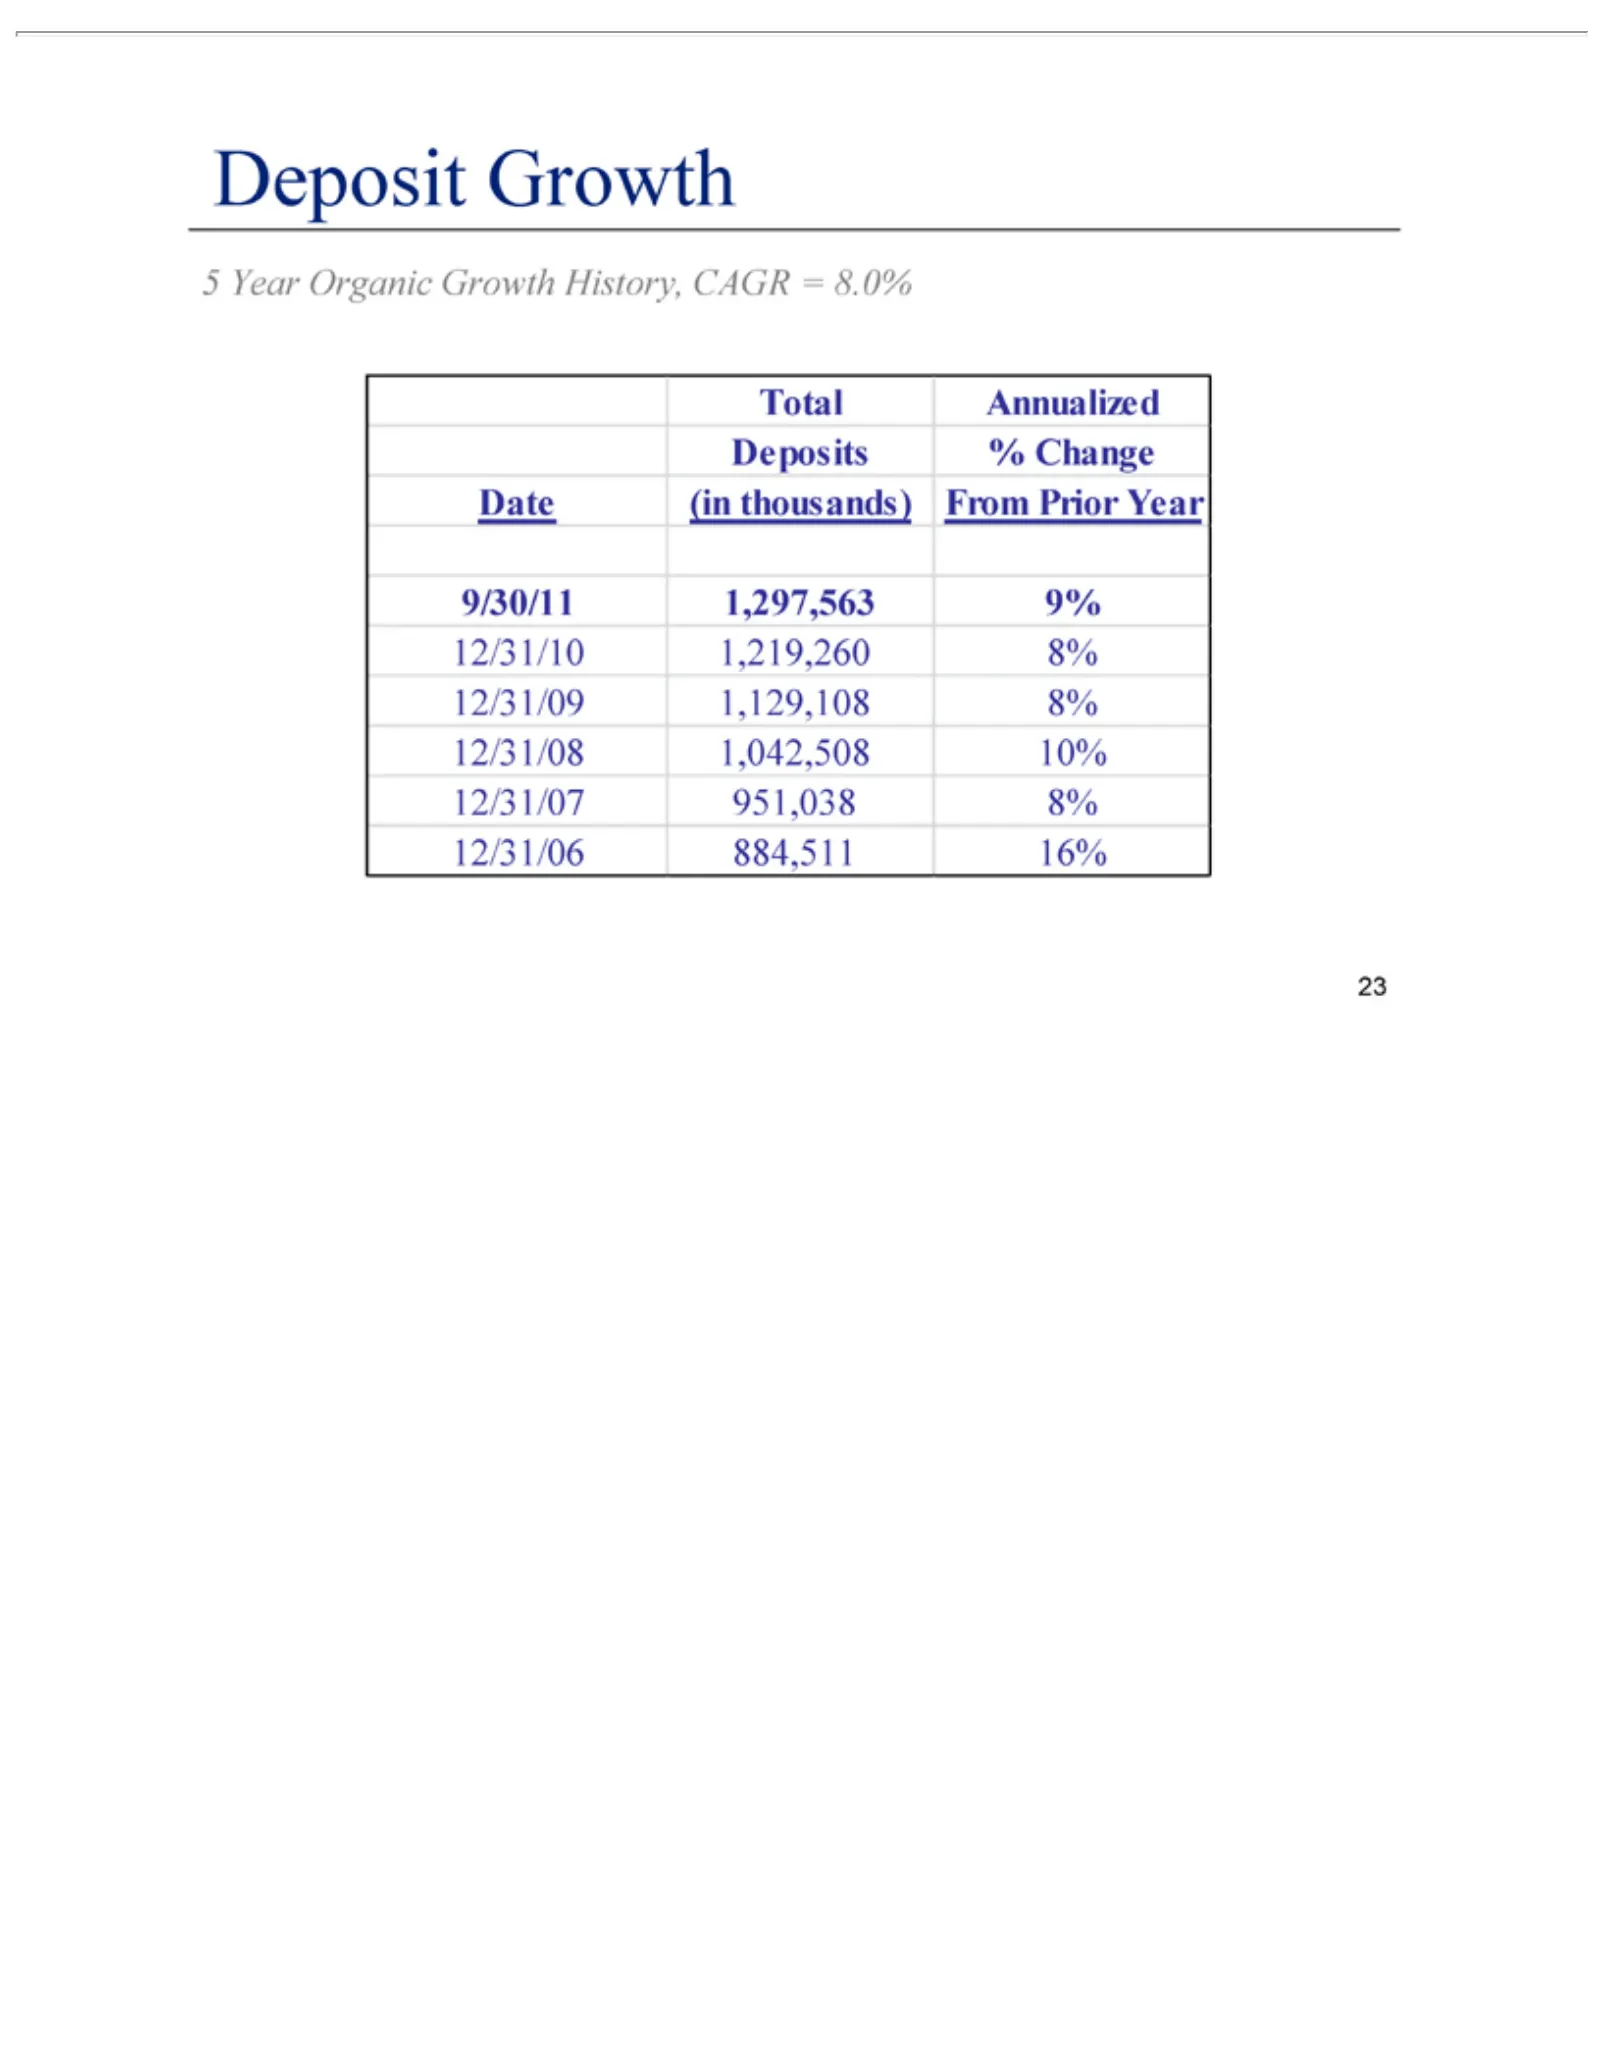
Slide 23: Deposit Growth
Deposit 5 12/31/10 Total 9/30/11 Year Growth Organic Annualized 1,297,563 1,219,260 Growth Deposits 9% 8% History, 12/31/09 % Change CAGR 1,129,108 Date (in 8% =thousands) 8.0% 12/31/08 1,042,508 From Prior10% Year12/31/07 951,038 8% 12/31/06 884,511 16%
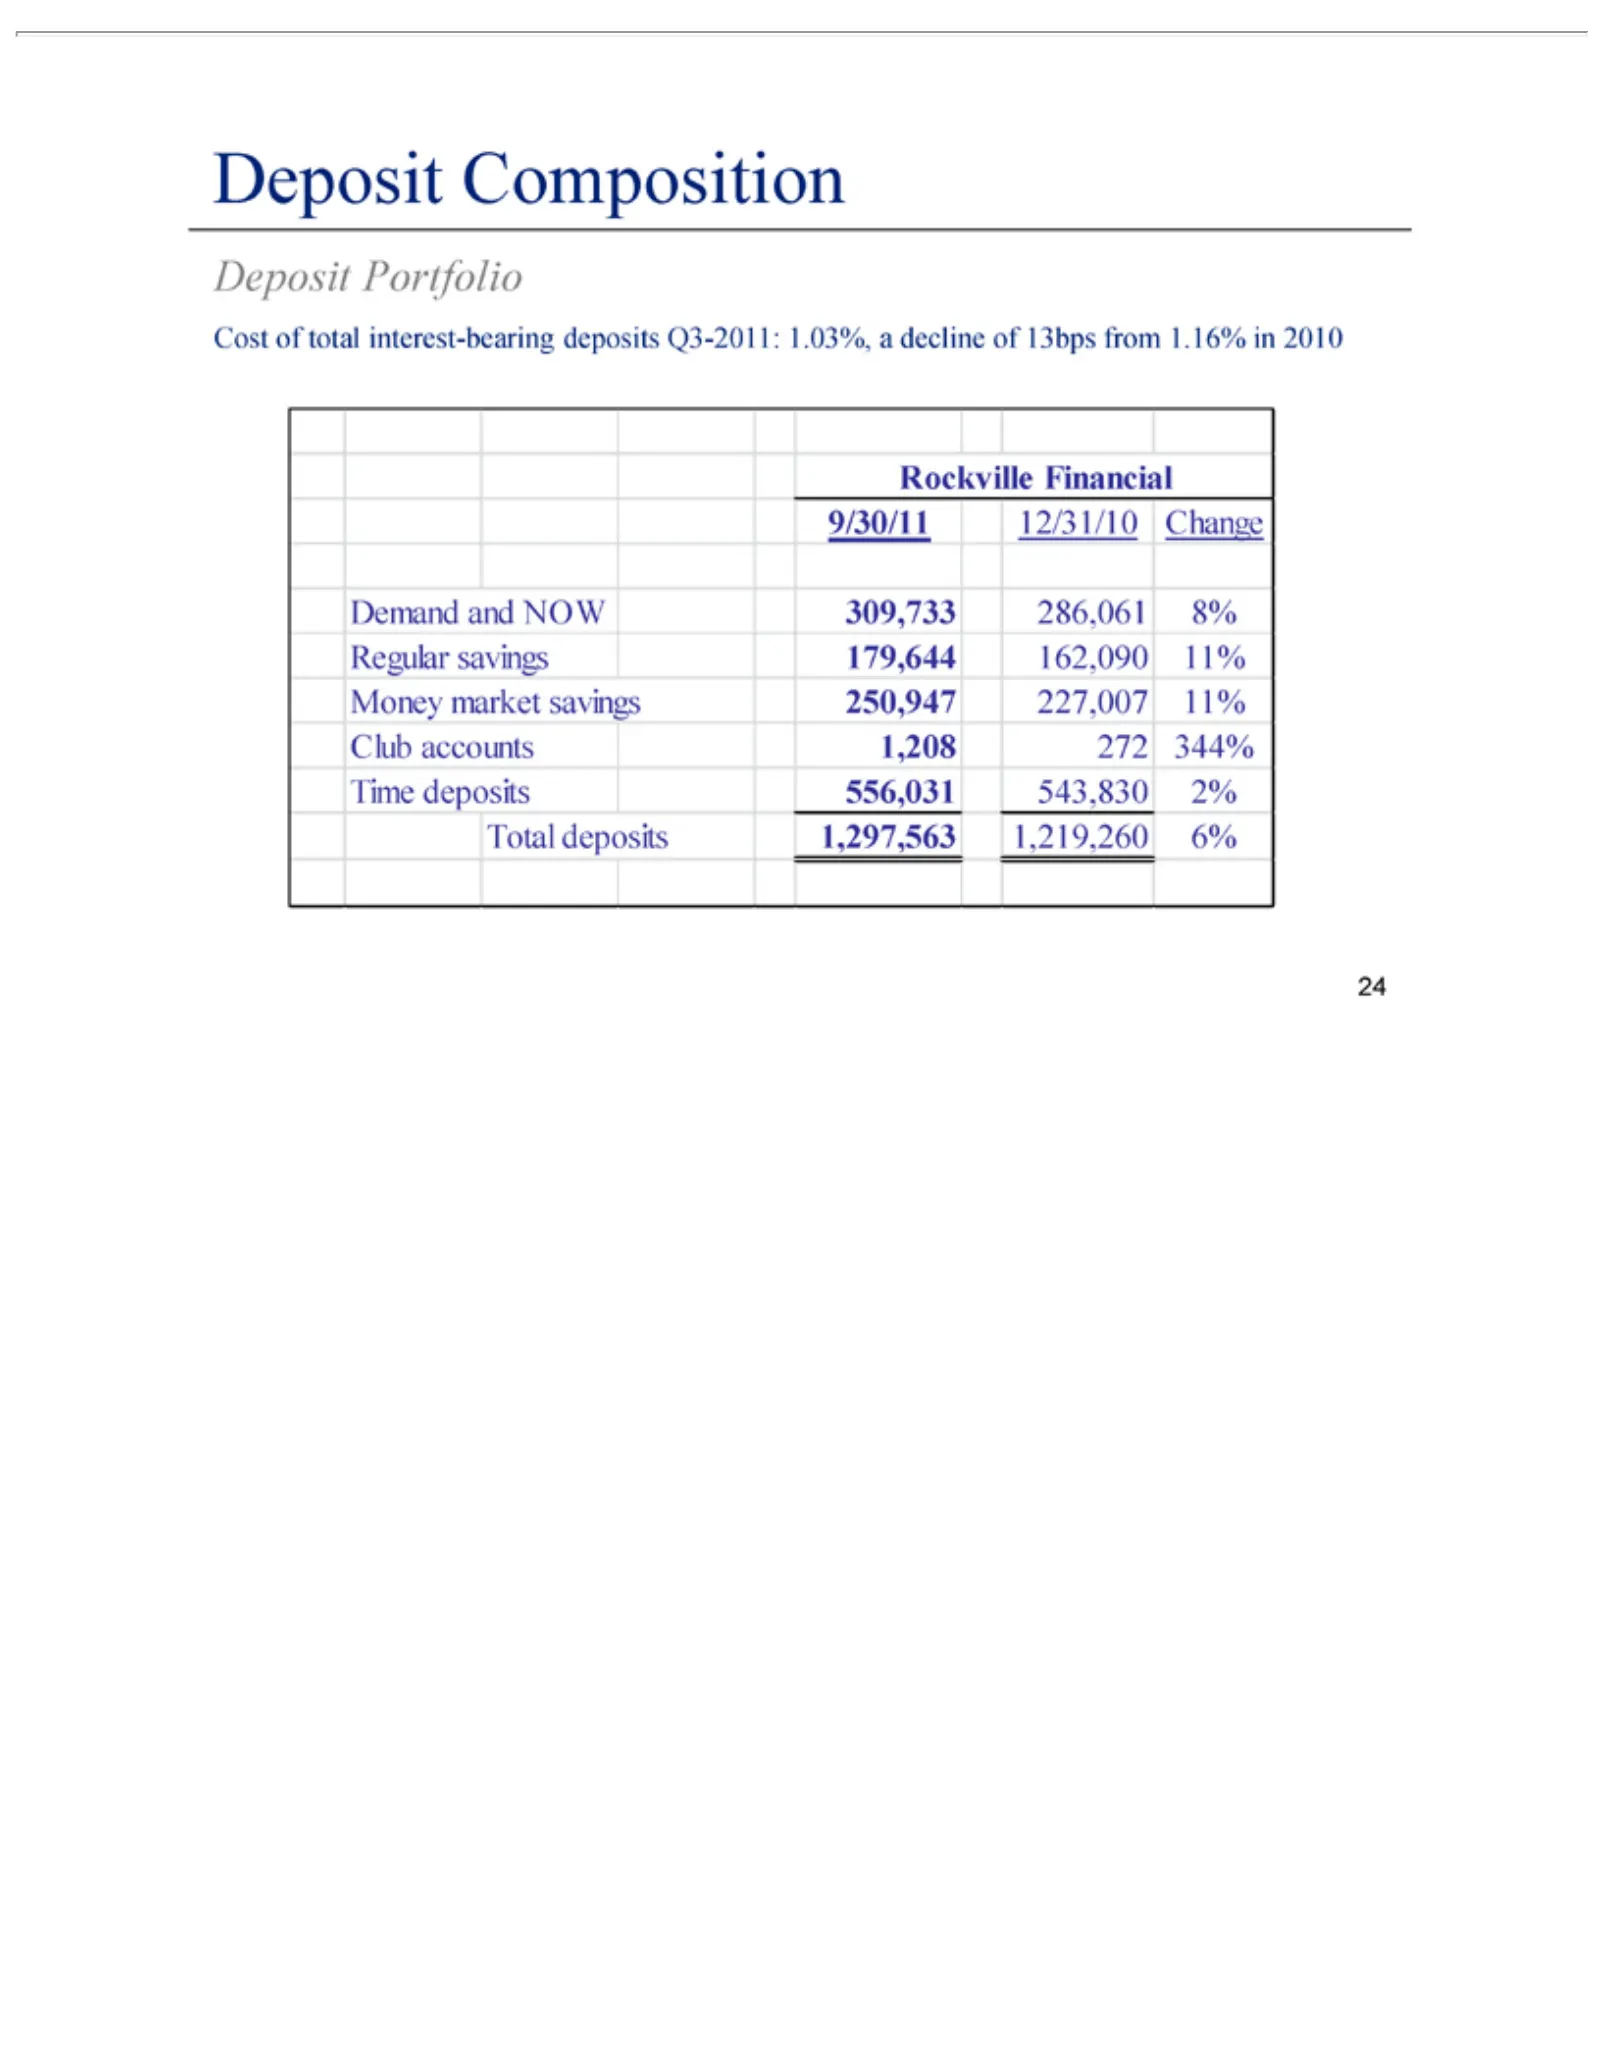
Slide 24: Deposit Composition and Cost
Deposit Cost Rockville Demand deposits of total Composition Portfolio 1,297,563 and Financial interest-bearing NOW 1,219,260 309,733 9/30/11 12/31/10 286,061 deposits 6% 8% Change Q3-2011: Regular1.03%, savings a decline 179,644of162,090 13bps from 11% 1.16% Moneyinmarket 2010 savings 250,947 227,00
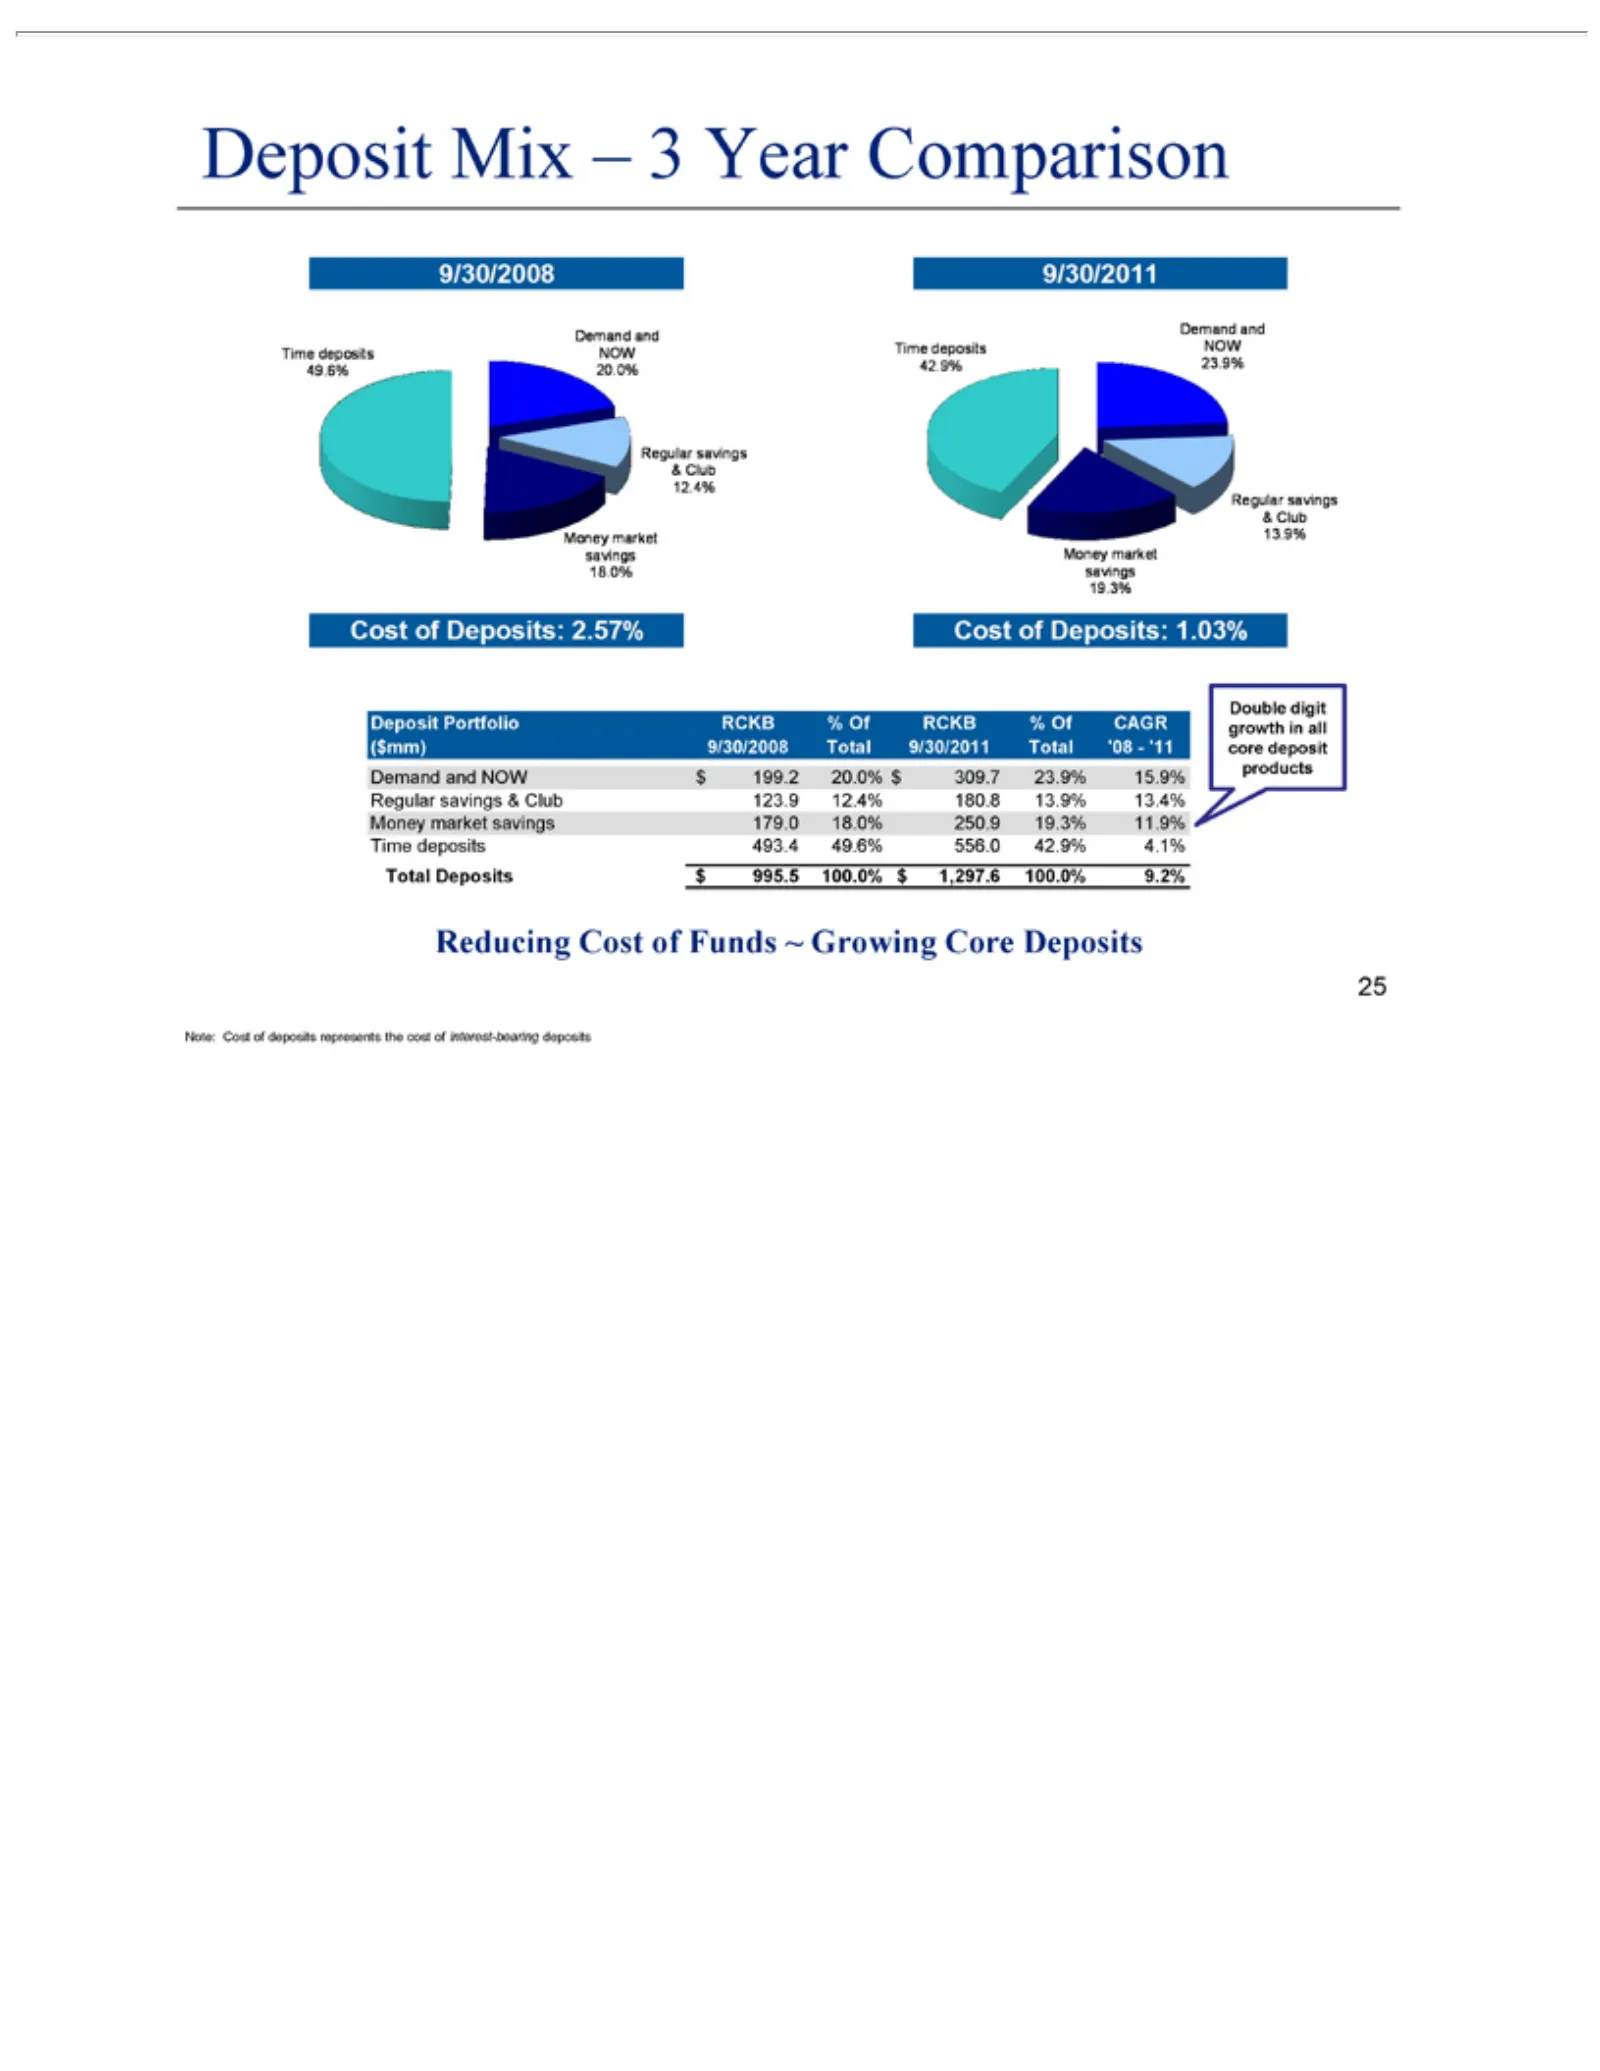
Slide 25: Deposit Mix and Cost of Funds
Deposit Demand 49.6% Total Reducing Deposits 556.0 Mix Portfolio and Cost –NOW 42.9% 3$ofYear 995.5 RCKB Funds $4.1% 199.2 Comparison 100.0% ~%Growing 20.0% Of RCKB $ 1,297.6 $Core 309.7 % Of 100.0% Deposits 23.9% CAGR9.2% 15.9% Double Regular digit growth savingsin&all Club ($mm) 123.9 9/30/2008 12
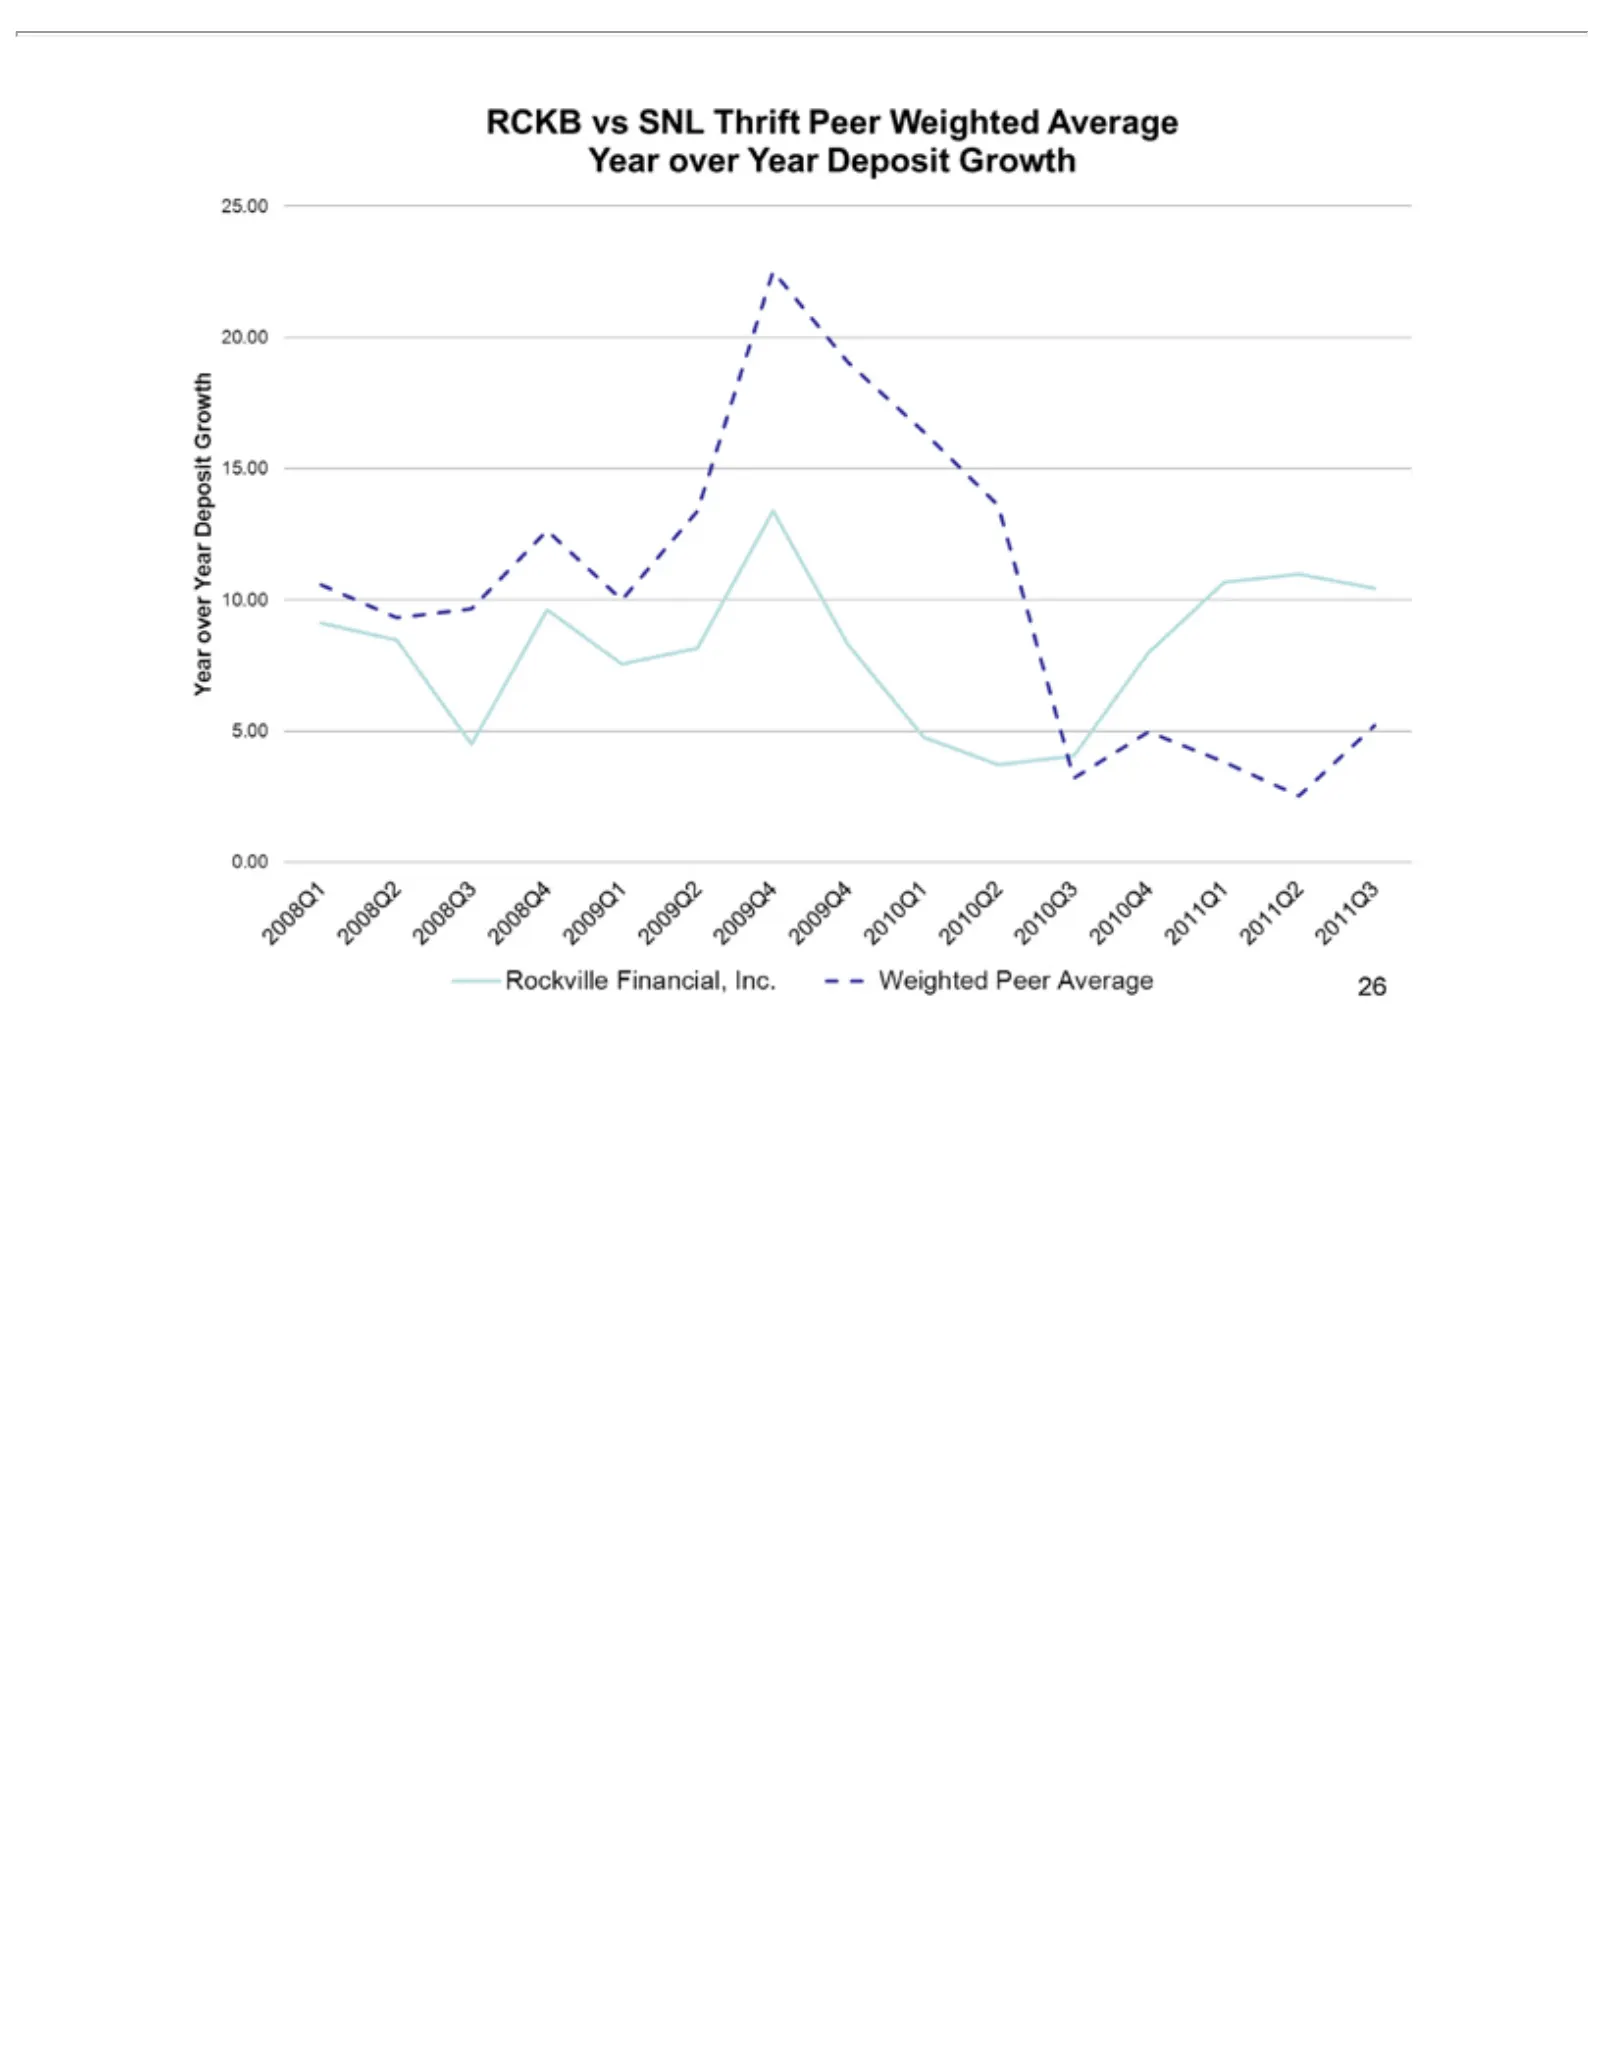
Slide 26: Deposit Growth vs SNL Thrift Peer
RCKB Year over VSYear SNLDeposit Thrift Peer Growth Weighted Average
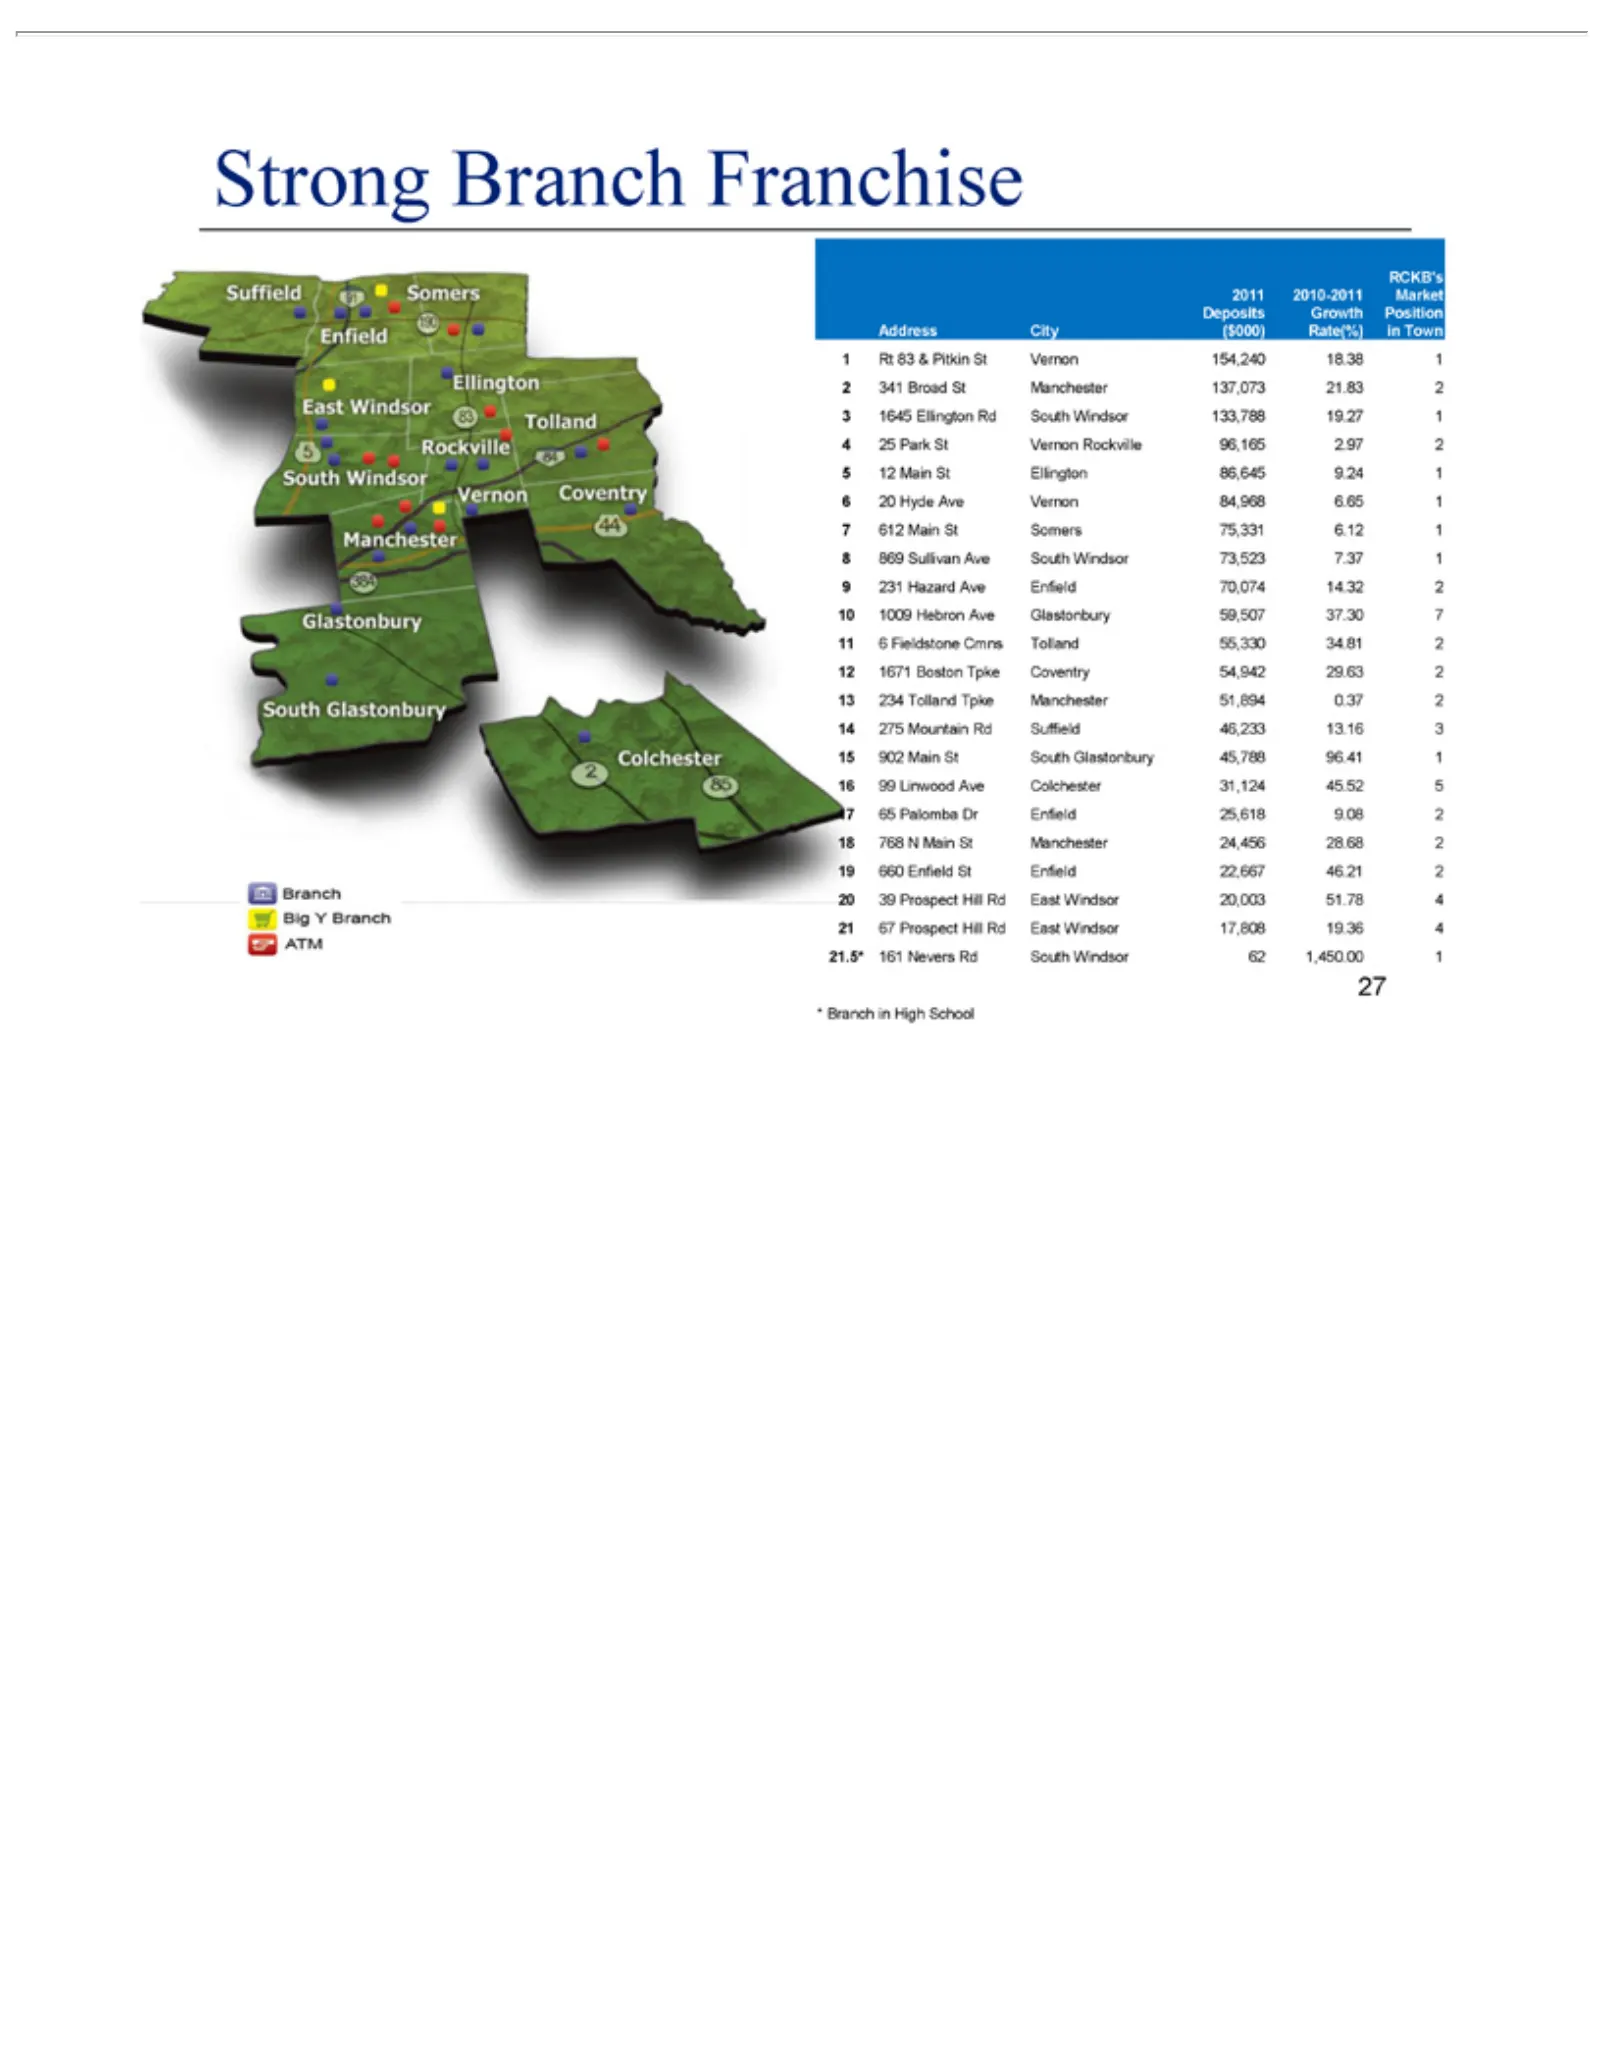
Slide 27: Strong Branch Franchise
Strong RCKB’s 1 2 3 Branch Rt2011 341 164583 &2010-2011 Franchise BroadPitkin St Ellington St Vernon Market Manchester RdSouth South 154,240 Deposits 137,073 Windsor 118.38 Growth 21.83 133,788 122 19.27 Position Address City ($000) Rate(%) in Town 4 5 6 231 7 8 9 10 11 12 13 14 15 16 17 18 19 20 21
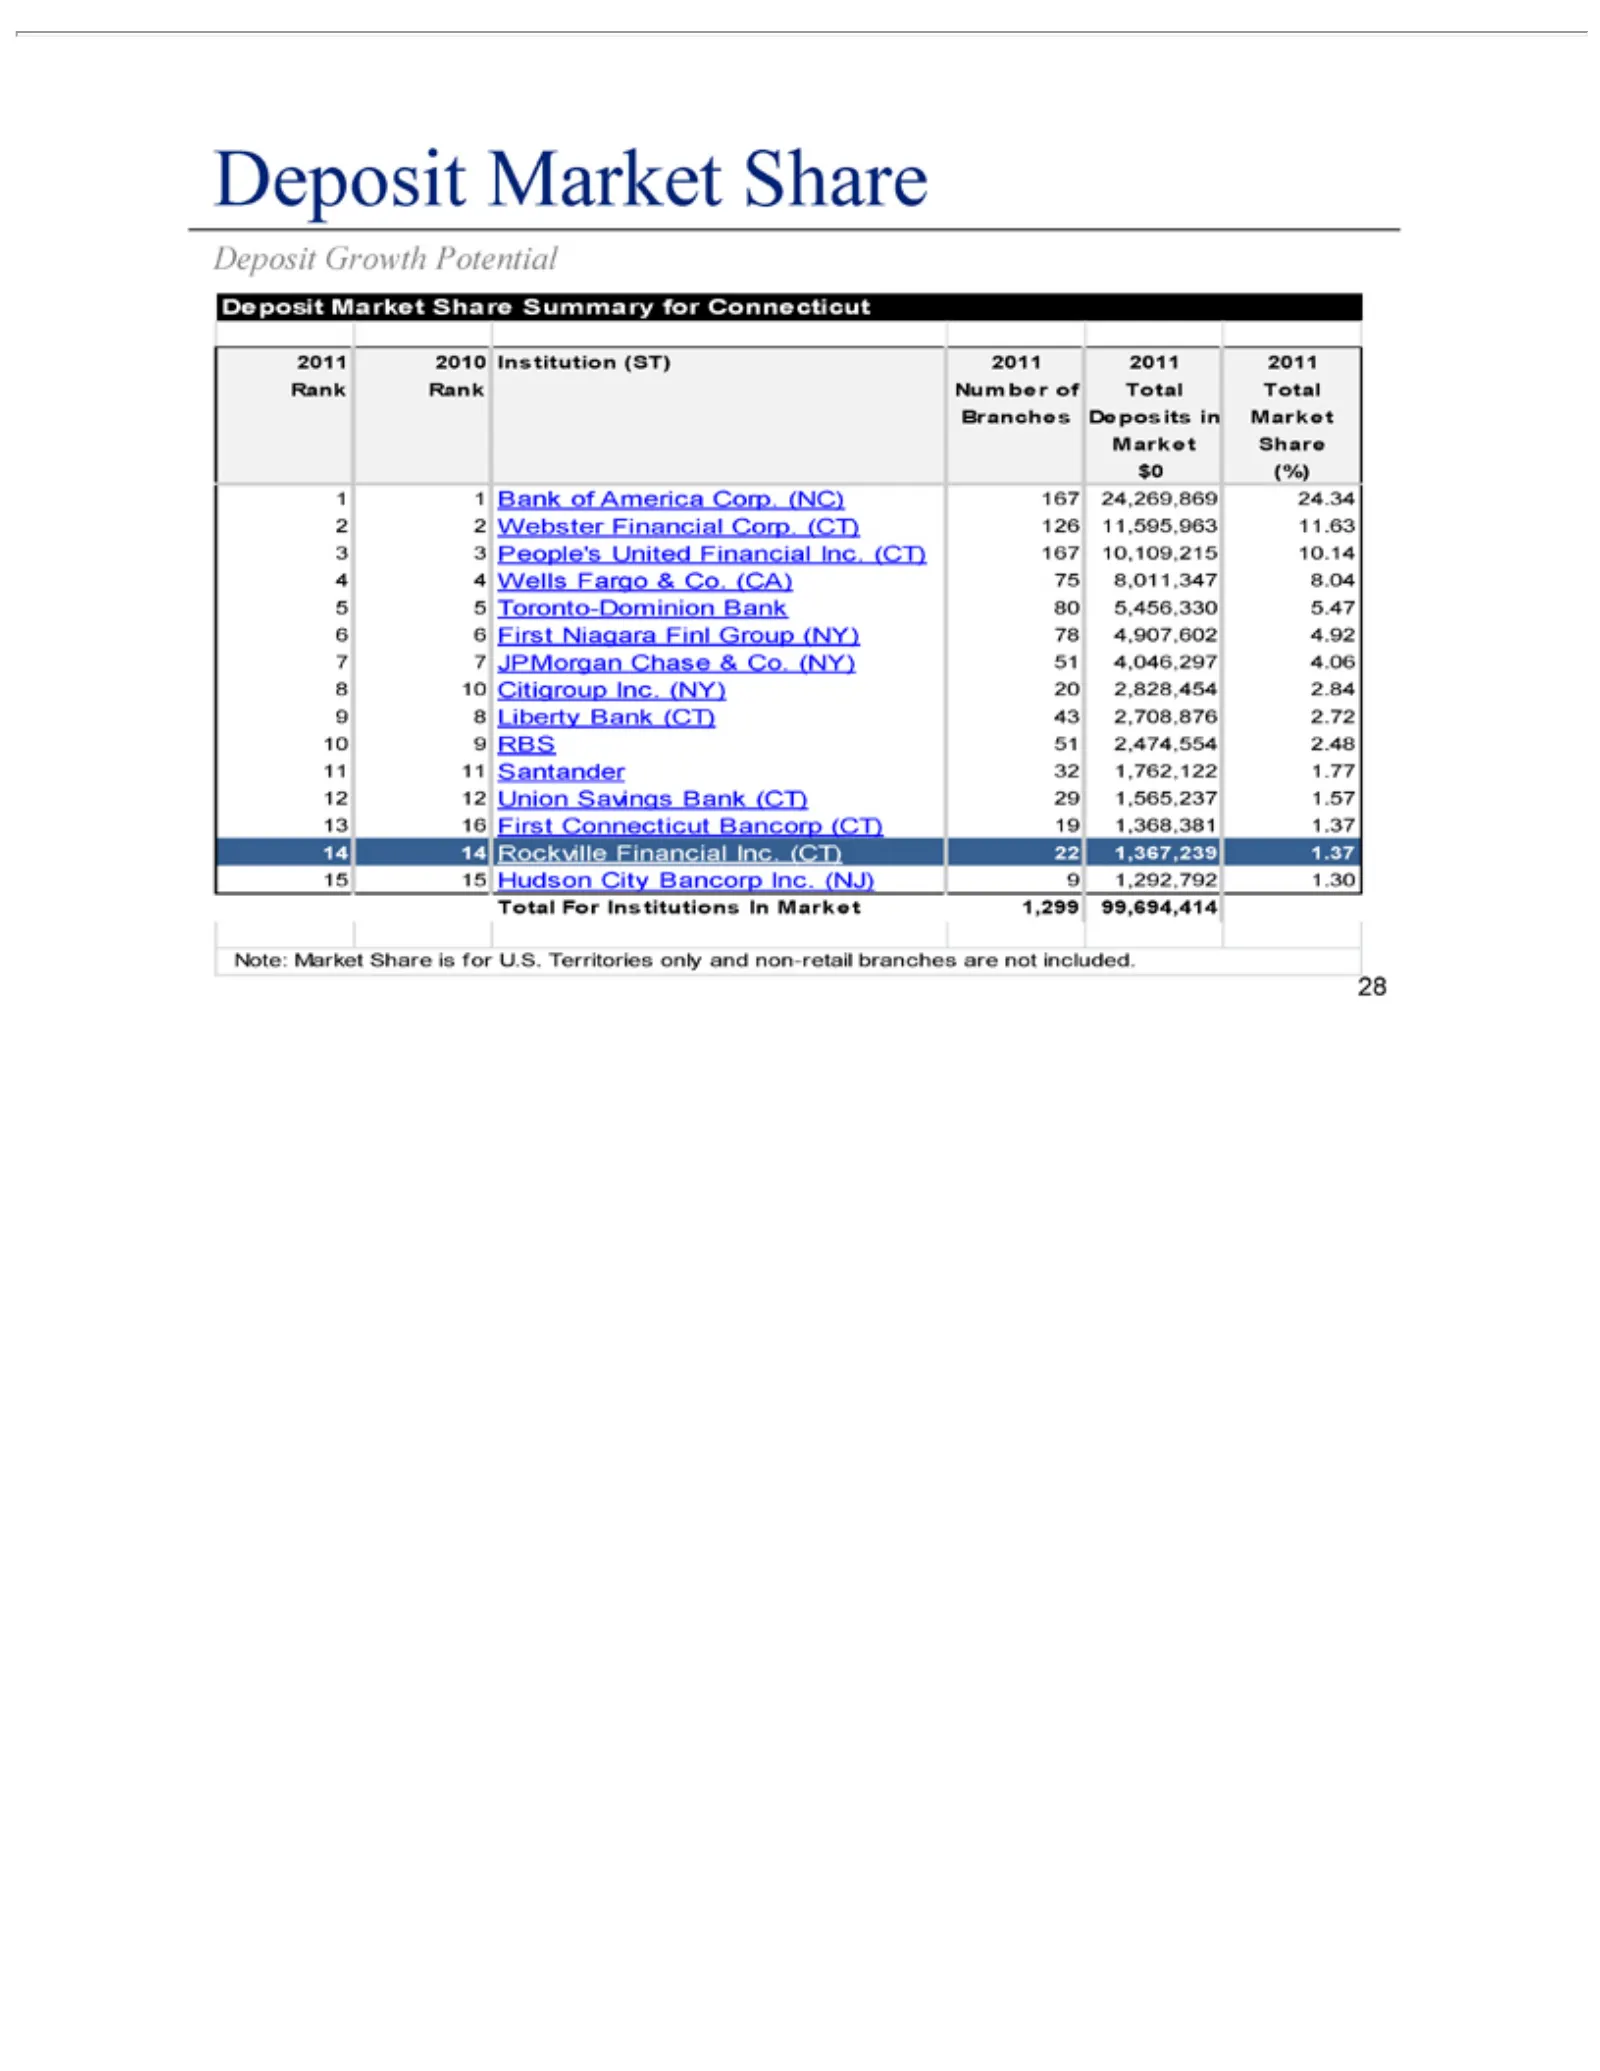
Slide 28: Deposit Market Share and Growth Potential
Deposit 2011 1 2 3 4 5 2010 5432110 Growth Market Bank Institution Websterof People’s Wells Share Potential America (ST) Summary Financial United Fargo Toronto-Dominion& Co.2011 Corp. Corp.2011 for Financial (CA) Bank (NC) Connecticut (CT) 75 2011 Inc. 80 167 126 (CT)Rank 24,269,869 8,011,347 Rank 1
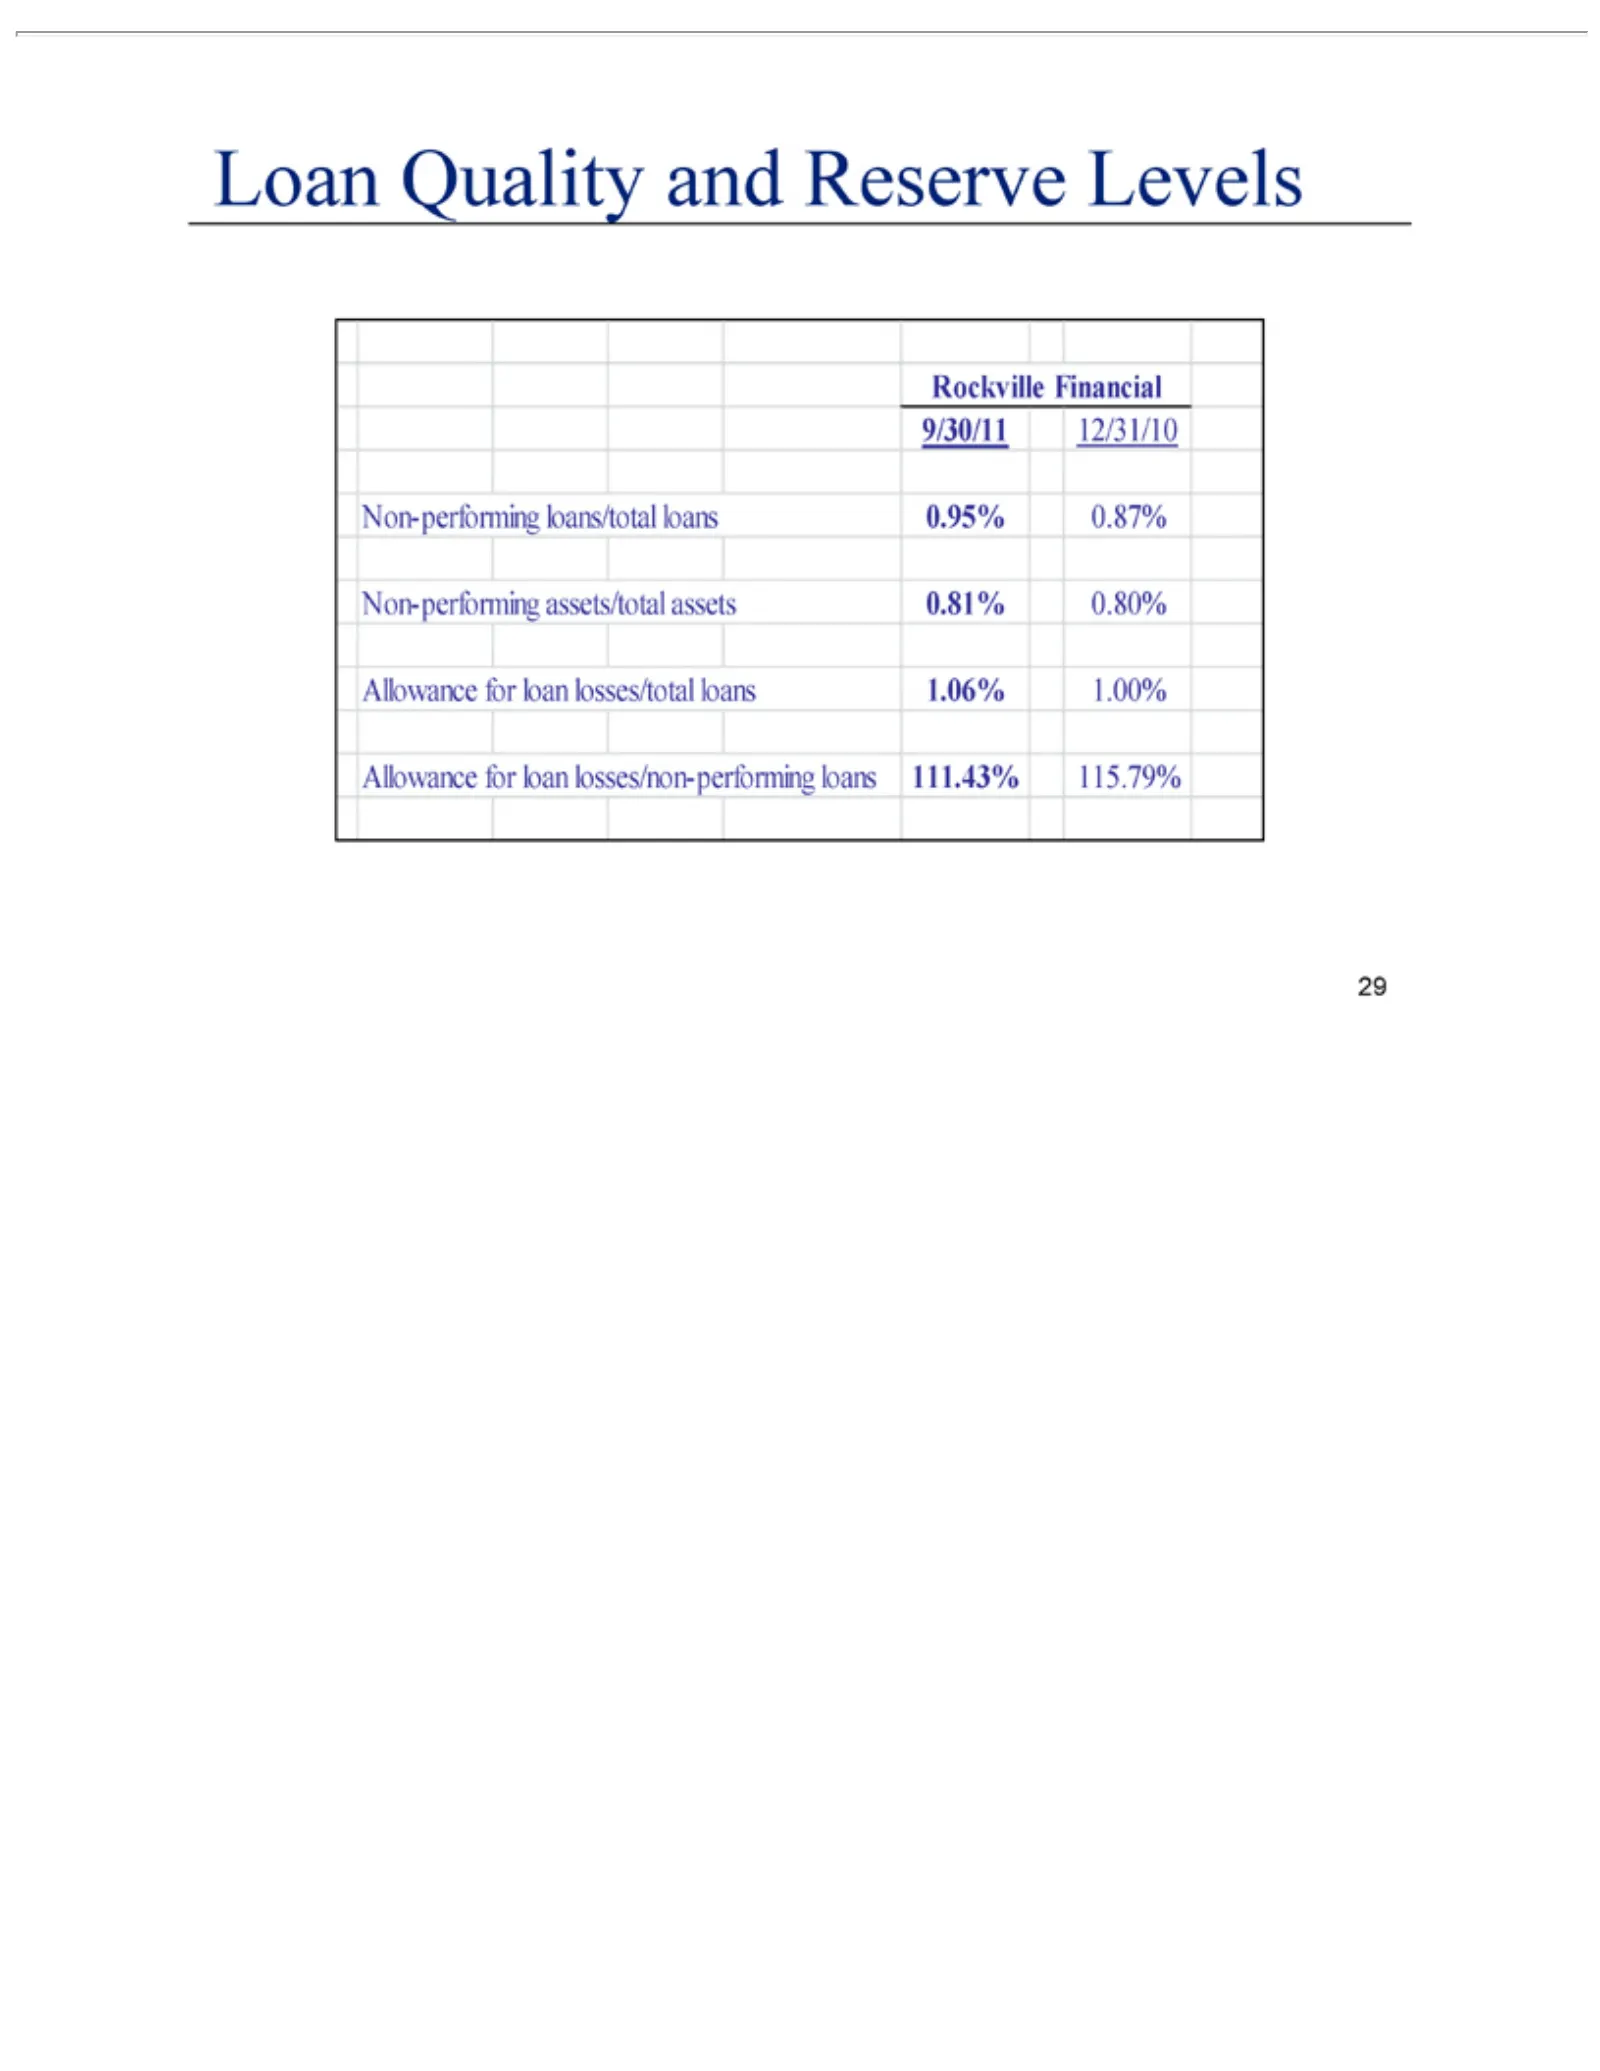
Slide 29: Loan Quality and Reserve Levels
Loan Quality Rockville Non-performing 111.43% 115.79% Financial andloans/total Reserve 9/30/11Levels loans 12/31/10 0.95% 0.87% Non-performing assets/total assets 0.81% 0.80% Allowance for loan losses/total loans 1.06% 1.00% Allowance for loan losses/non-performing loans
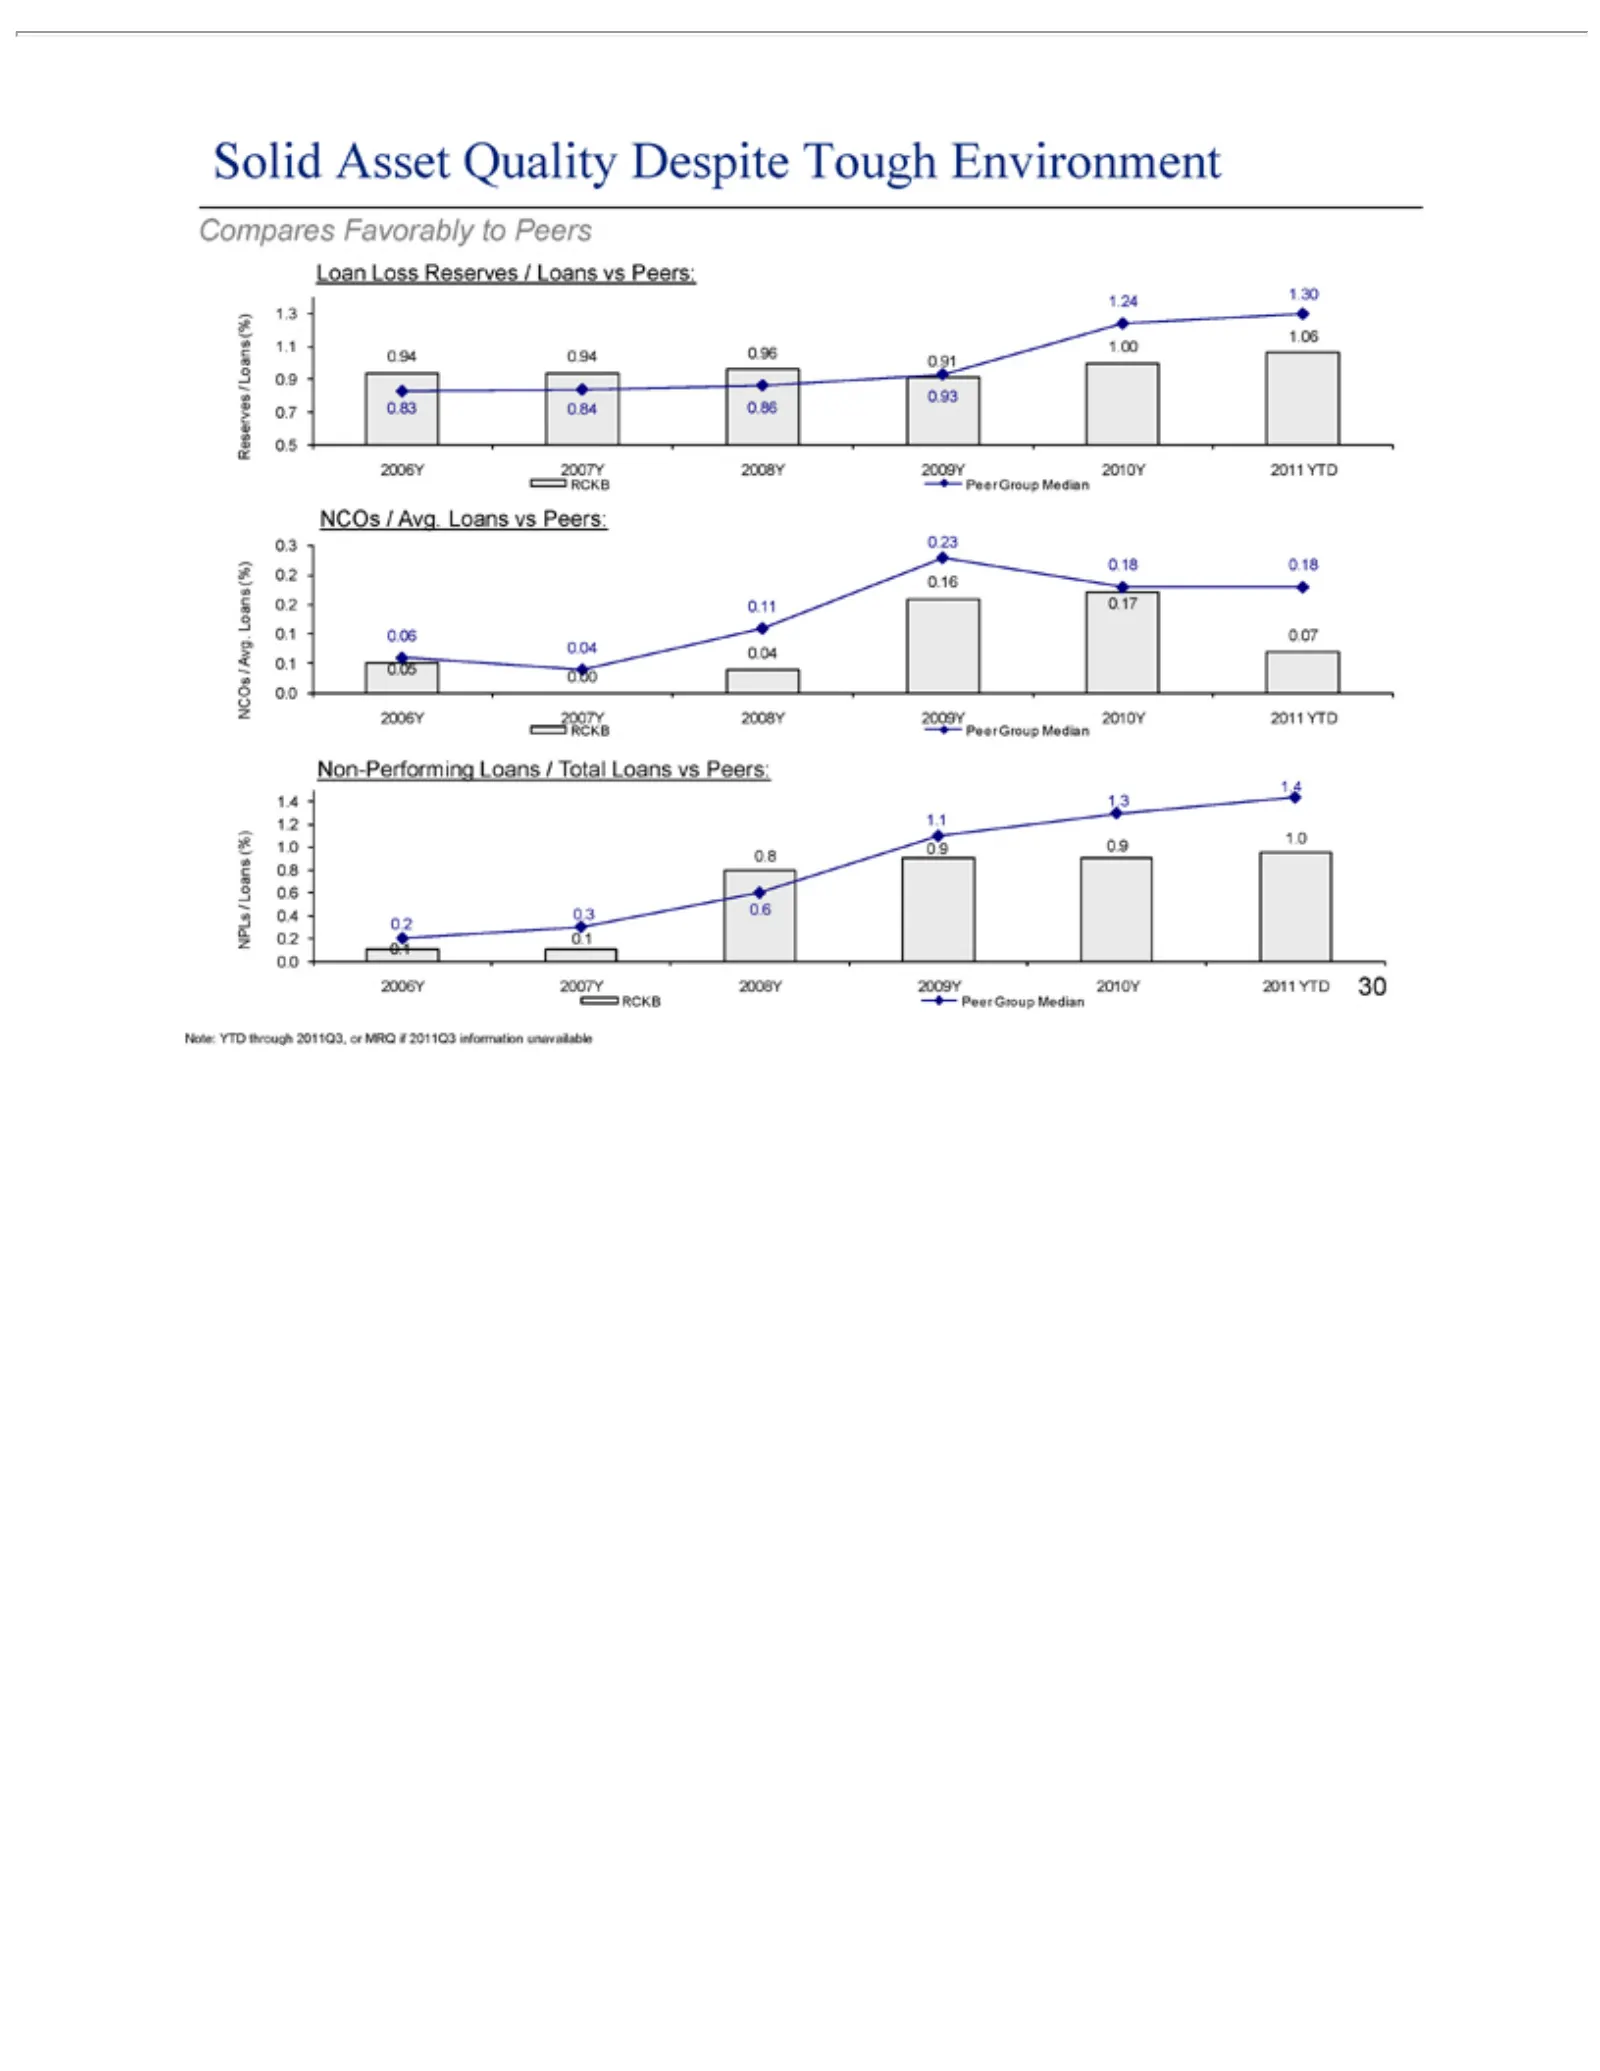
Slide 30: Solid Asset Quality Compares Favorably to Peers
Solid Compares Loan 1.30 (%) 0.94 0.9 0.7 0.93 NCOs 0.3 0.18 Loans /.0.16 0.00 Non-Performing 1.3 1.2 1.4 1.0 0.8 0.4 NPLs 0.2 0.0 2006Y 0.10.1 /1.24 0.83 0.23 1.4 1.1 (%) Loans 0.3 1.1 0.94 0.18 0.06 NCOs 0.05 Loss Asset 0.2 0.91 0.2 /2007Y 0.6 Avg. 1.00 1.0 0.84 0.96 (%) 0.07 0.1 0.11 0.6 Favorabl
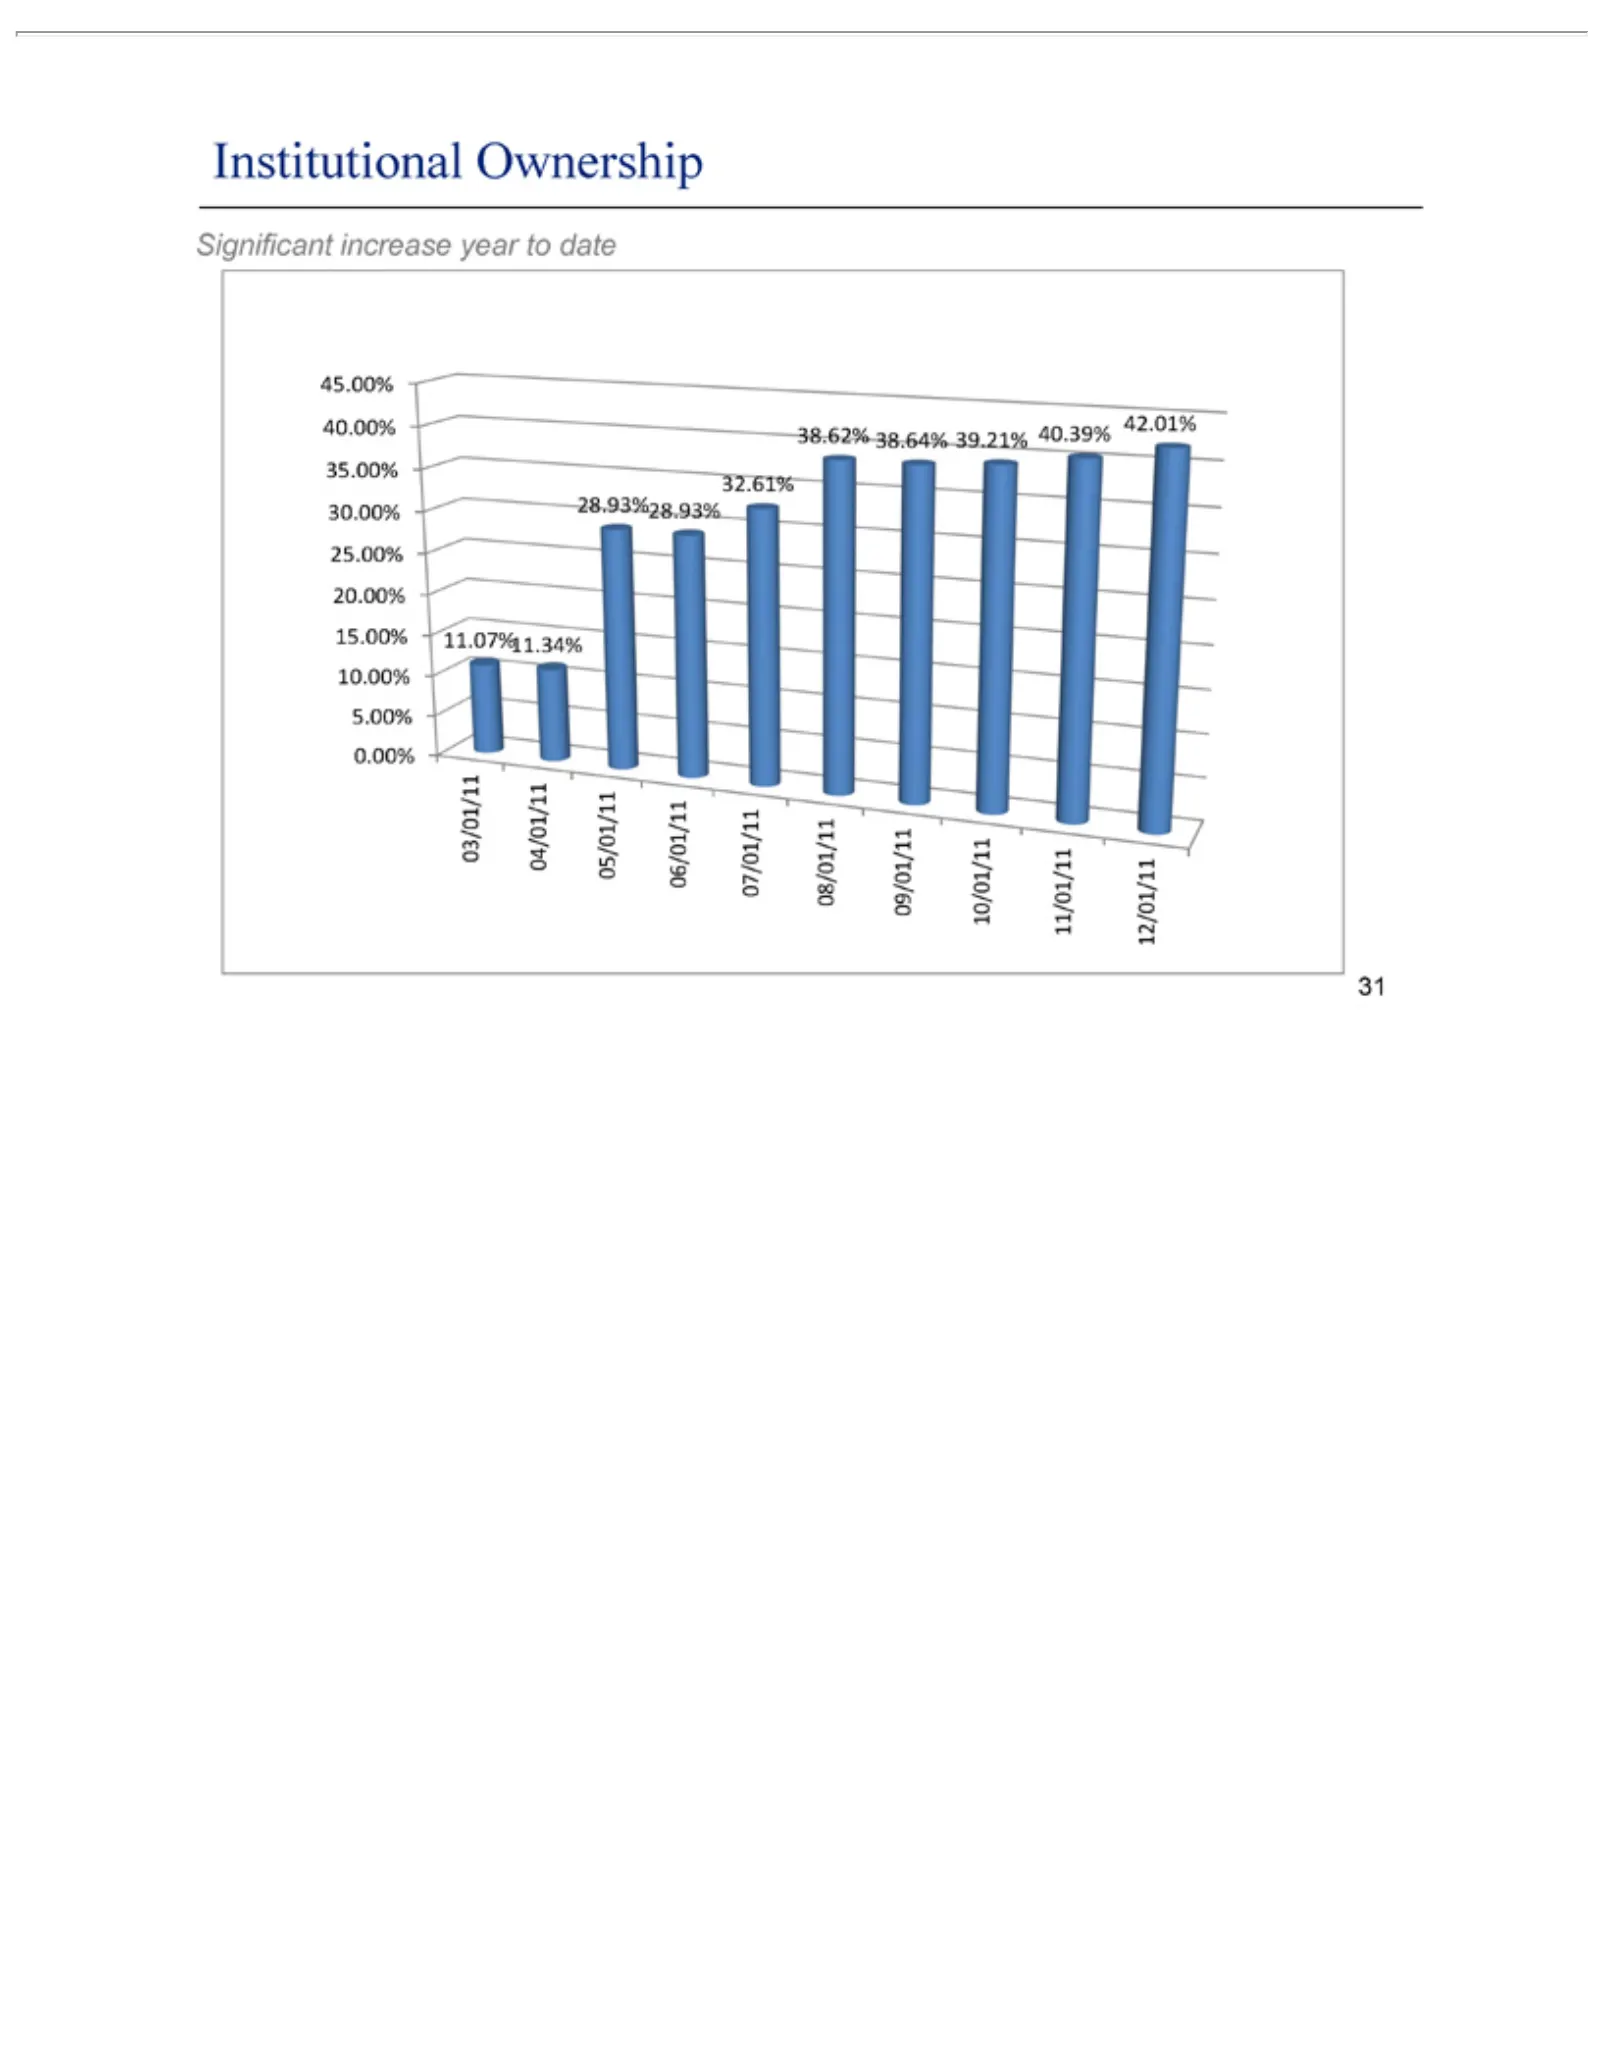
Slide 31: Significant Increase in Institutional Ownership
Institutional Significant 40.00% 45.00% 15.00% 20.00% 03/01/11 0.00% 5.00% 08/01/11 42.01% 11.07%11.34% 04/01/11 09/01/11 increase Ownership 38.62% 05/01/11 10/01/11 year10.00% 38.64% to date 06/01/11 11/01/11 39.21% 12/01/11 07/01/11 40.39% 35.00% 32.61% 30.00% 28.93%28.93% 25.00%
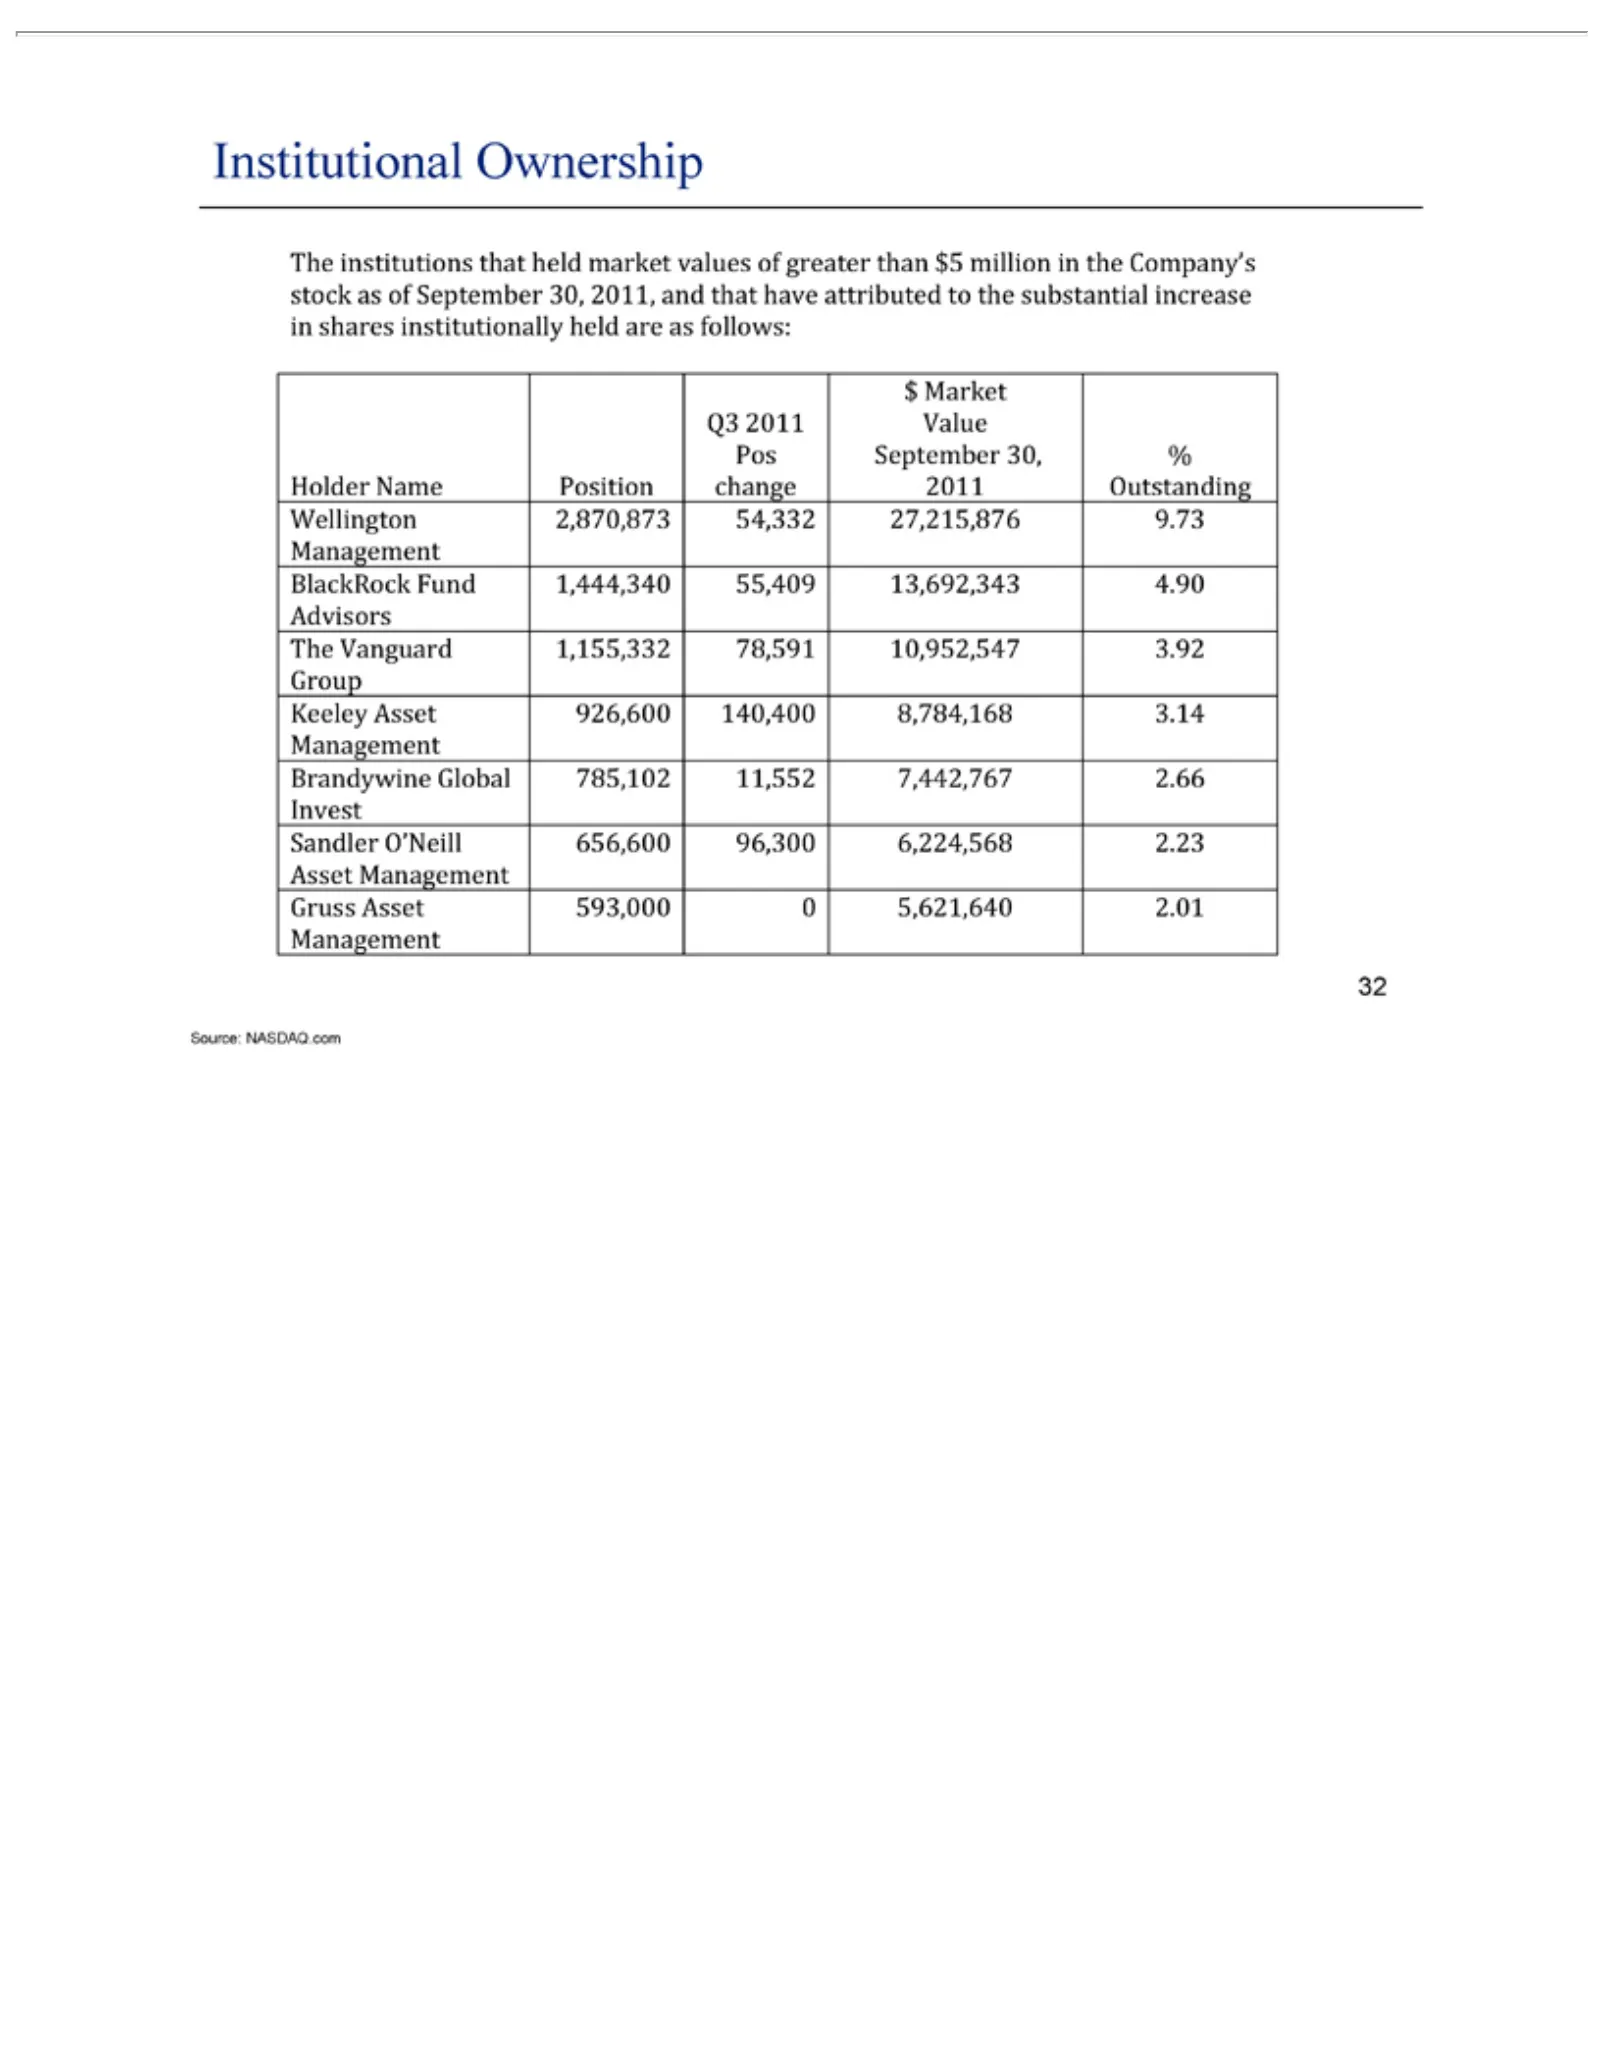
Slide 32: Institutional Ownership: Largest Holders
Institutional The $ 13,692,343 Invest Market institutions Sandler Q34.90 Ownership 2011 O’Neill that Advisors Value held 656,600 Pos market TheSeptember Vanguard 96,300 stock as 6,224,568 30, 1,155,332 of September % Holder 2.23 78,591 Name Asset 30, 10,952,547 2011, Management Position and that cha
Slide 33: Appendix
APPENDIX
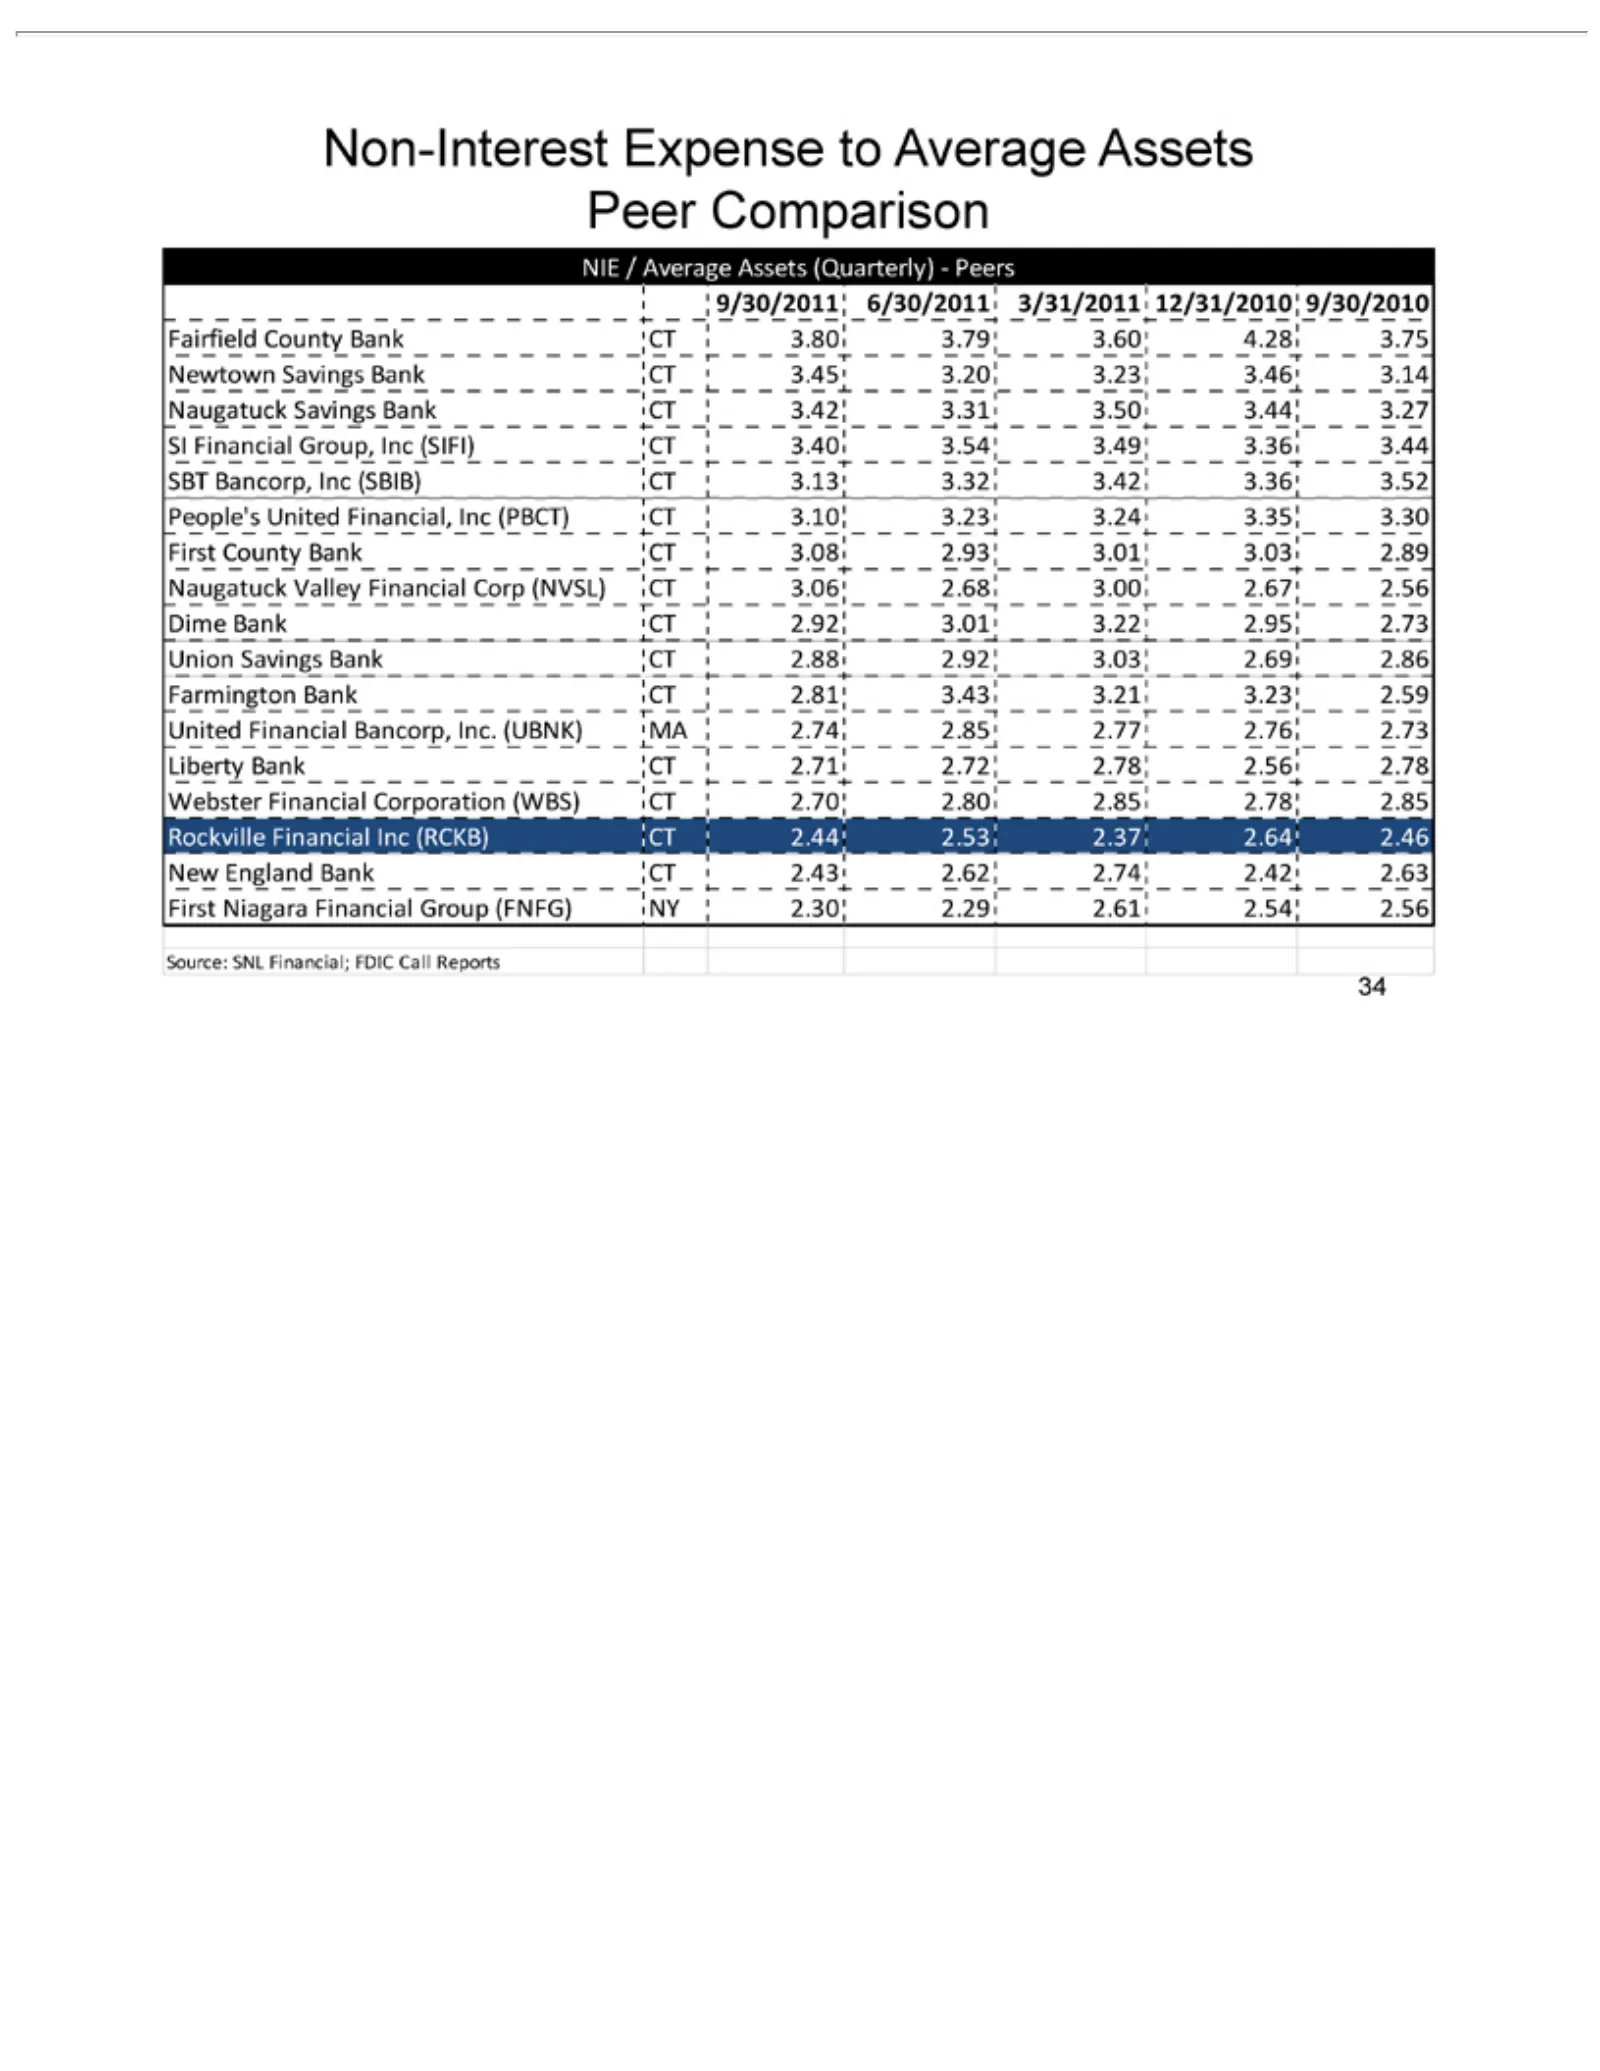
Slide 34: Non-Interest Expense to Average Assets Peer Comparison
Non-Interest NIE 9/30/2011 Fairfield 3.54 Naugatuck 3.23 Rockville Source: /2.59 3.49 Average SNL County 3.36 United Financial 6/30/2011 Valley Expense Financial; Assets 3.44 Bank Financial Financial SBT Inc 3/31/2011 (Quarterly)—Peers toCT (RCKB) FDIC Average Bancorp, 3.80 Bancorp, Corp Call 3.79 1
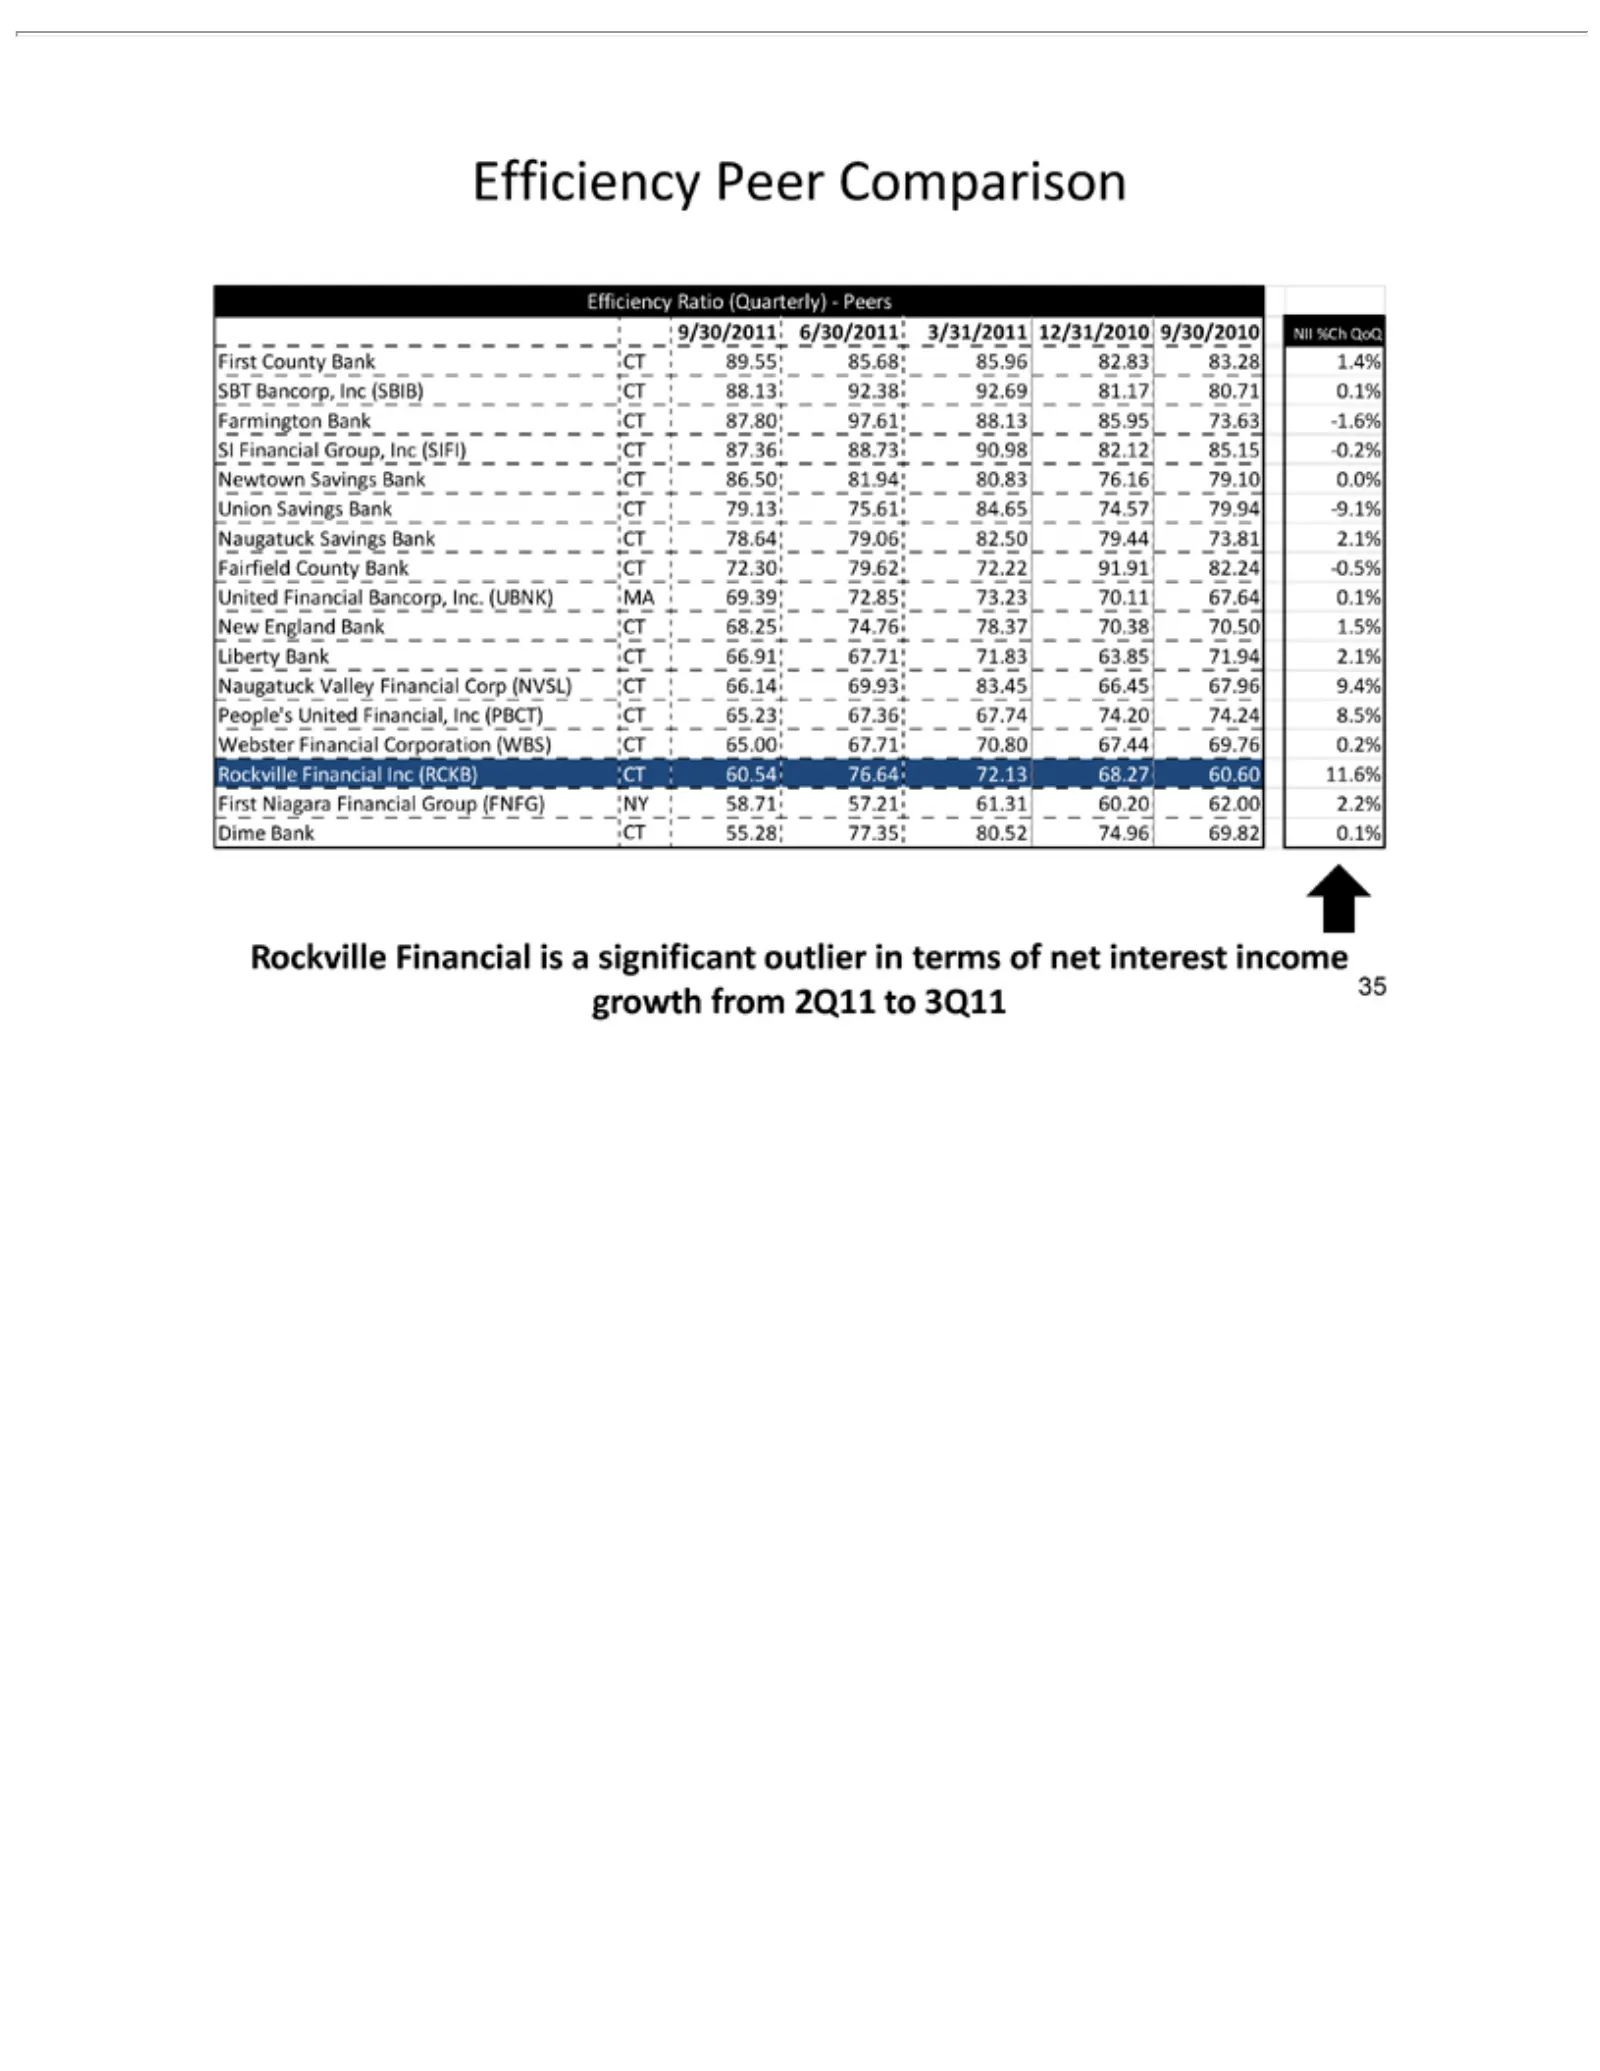
Slide 35: Efficiency Ratio Peer Comparison
Efficiency 9/30/2011 Farmington Union United Naugatuck (WBS) 2.2% Rockville growth 35 Dime Savings Financial CT from Financial 6/30/2011 Peer Ratio Valley 65.00 Bank Bank 2Q11 Bank Comparison (Quarterly)—Peers Bancorp, 67.71 CT CT Financial toisCT 3/31/2011 55.28 3Q11 87.80 a 70.80 significant 79.13
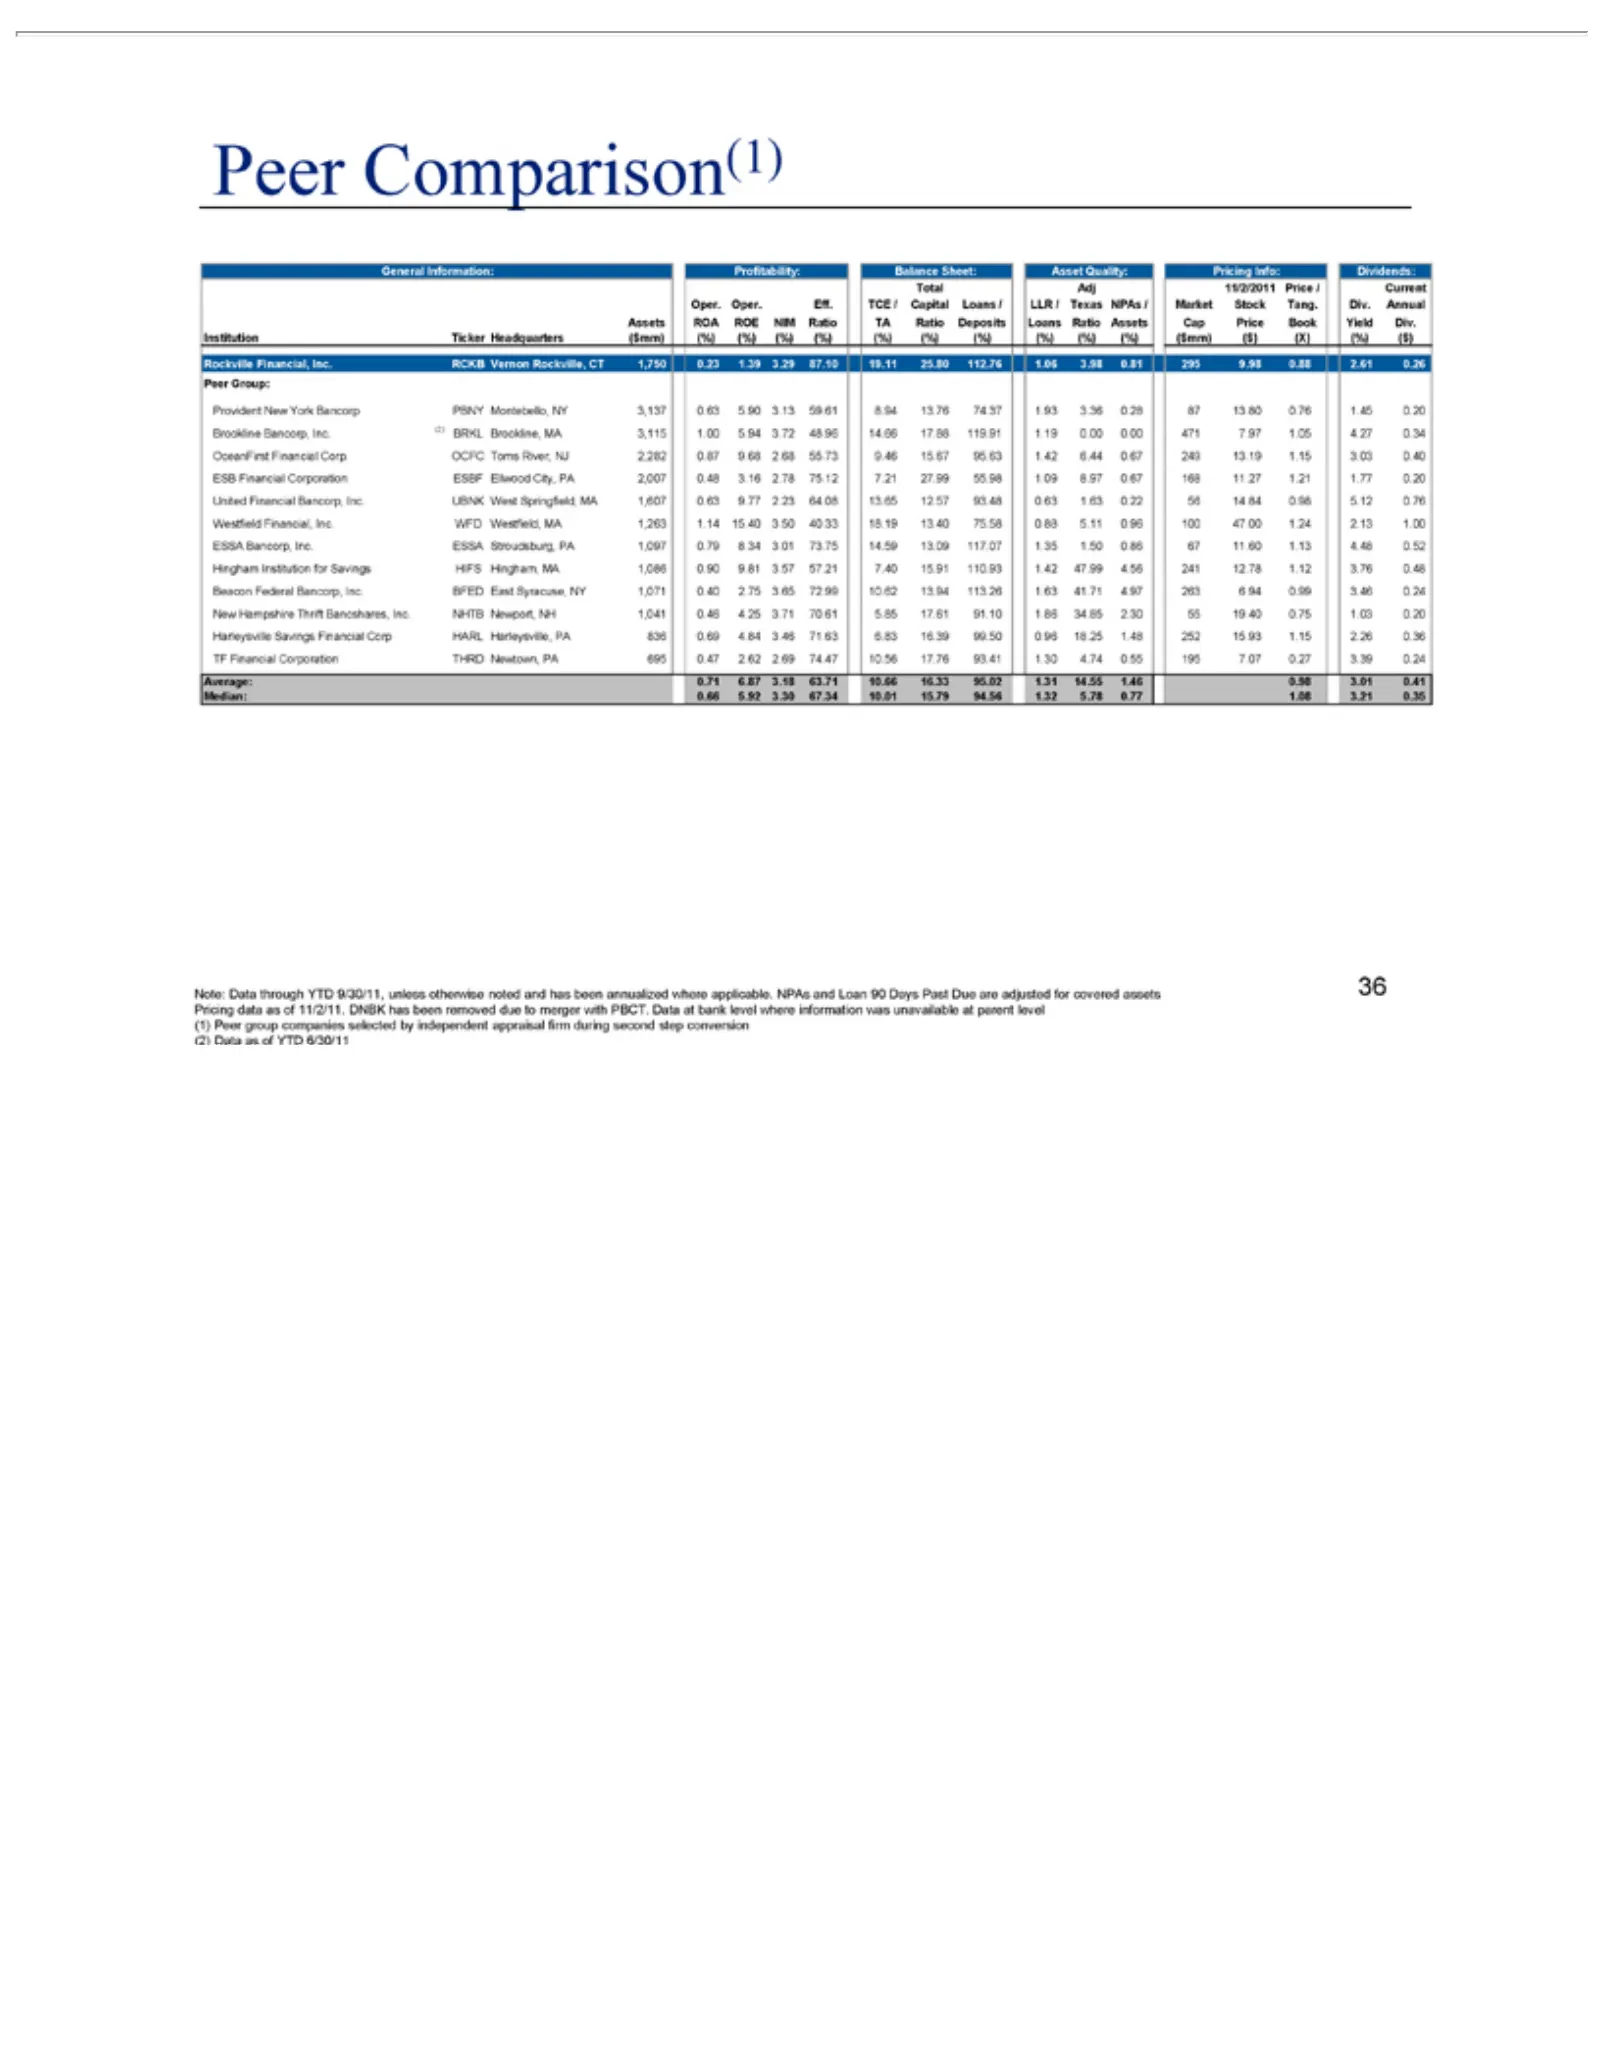
Slide 36: Peer Comparison
Peer 2.62 General Tang. Institution Rockville Provident 1.00 13.19 ESB 1,607 47.00 Hingham, 113.26 Harleysville 0.47 Average: Note: DNBK second5.94 Comparison(1) Financial Data Div. 1.15 0.63 1.24 1.63 step has Information: 0.71 3.72 2.69 Financial, New MA Ticker Annual 3.03 9.77 2.13 through been c
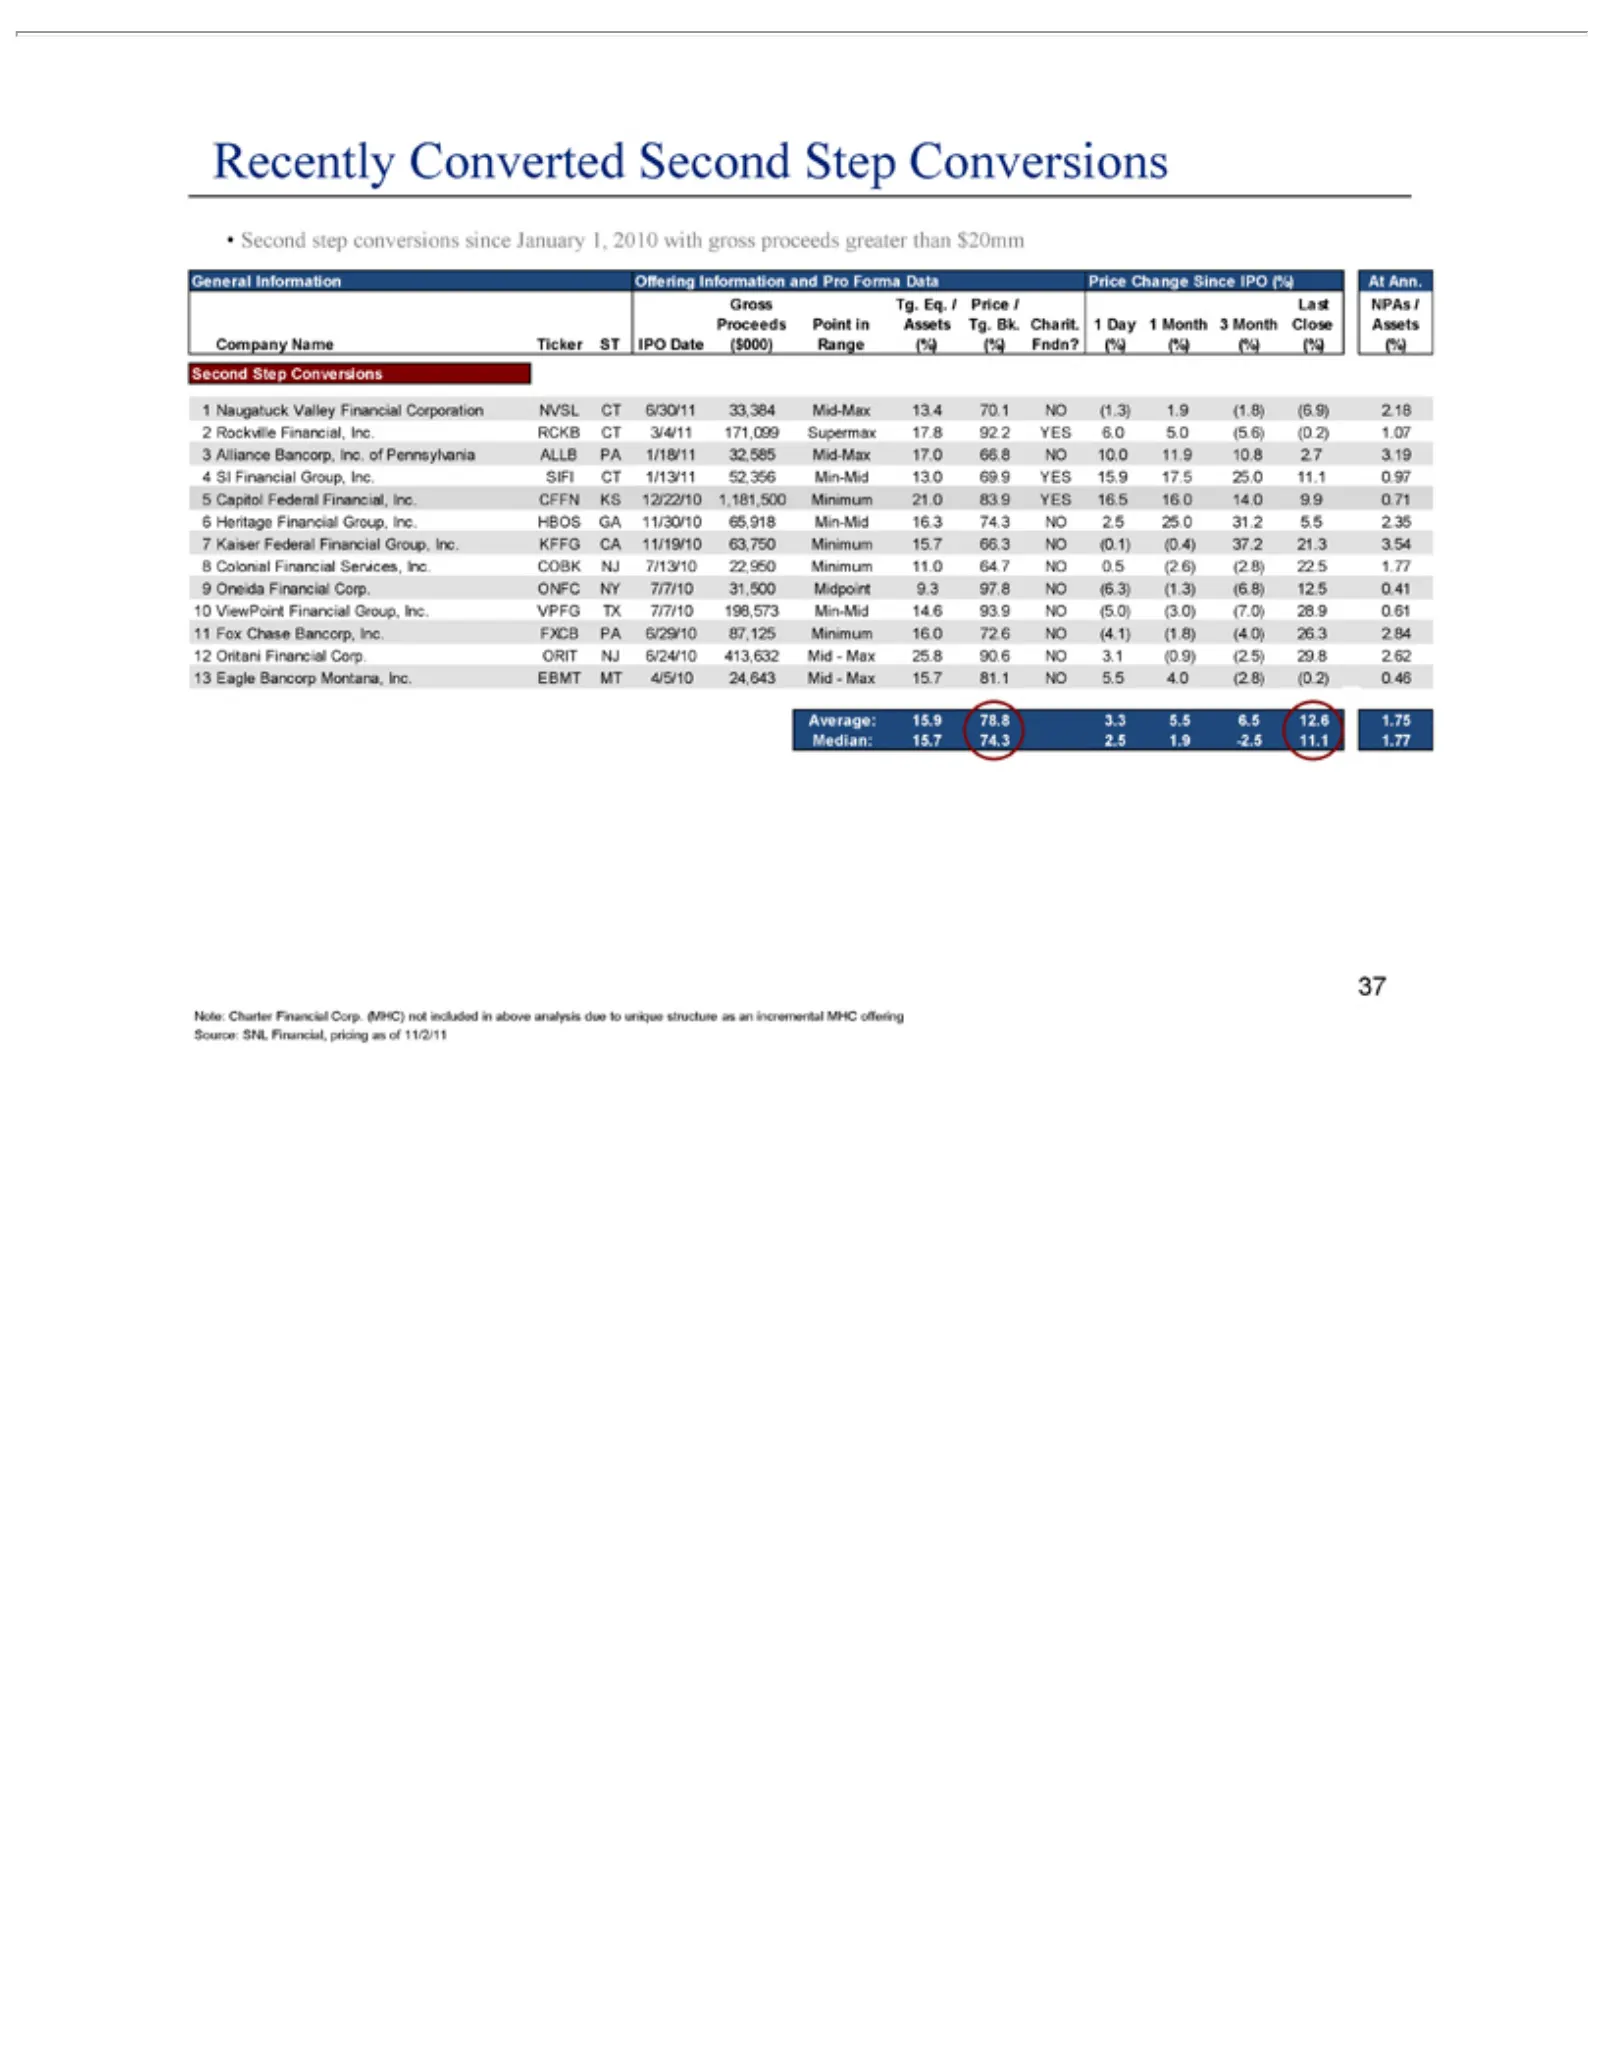
Slide 37: Recently Converted Second Step Conversions
•Recently General Month 1 6 Second 2 3 4 5 Close Naugatuck Information step Converted Assets conversions Rockville Alliance SI Capitol Heritage Valley Second Company Offering Bancorp, Financial Group, Federal Financial since Financial, Step Inc.Information Inc.Name ofJanuary Inc. Financial, Financia
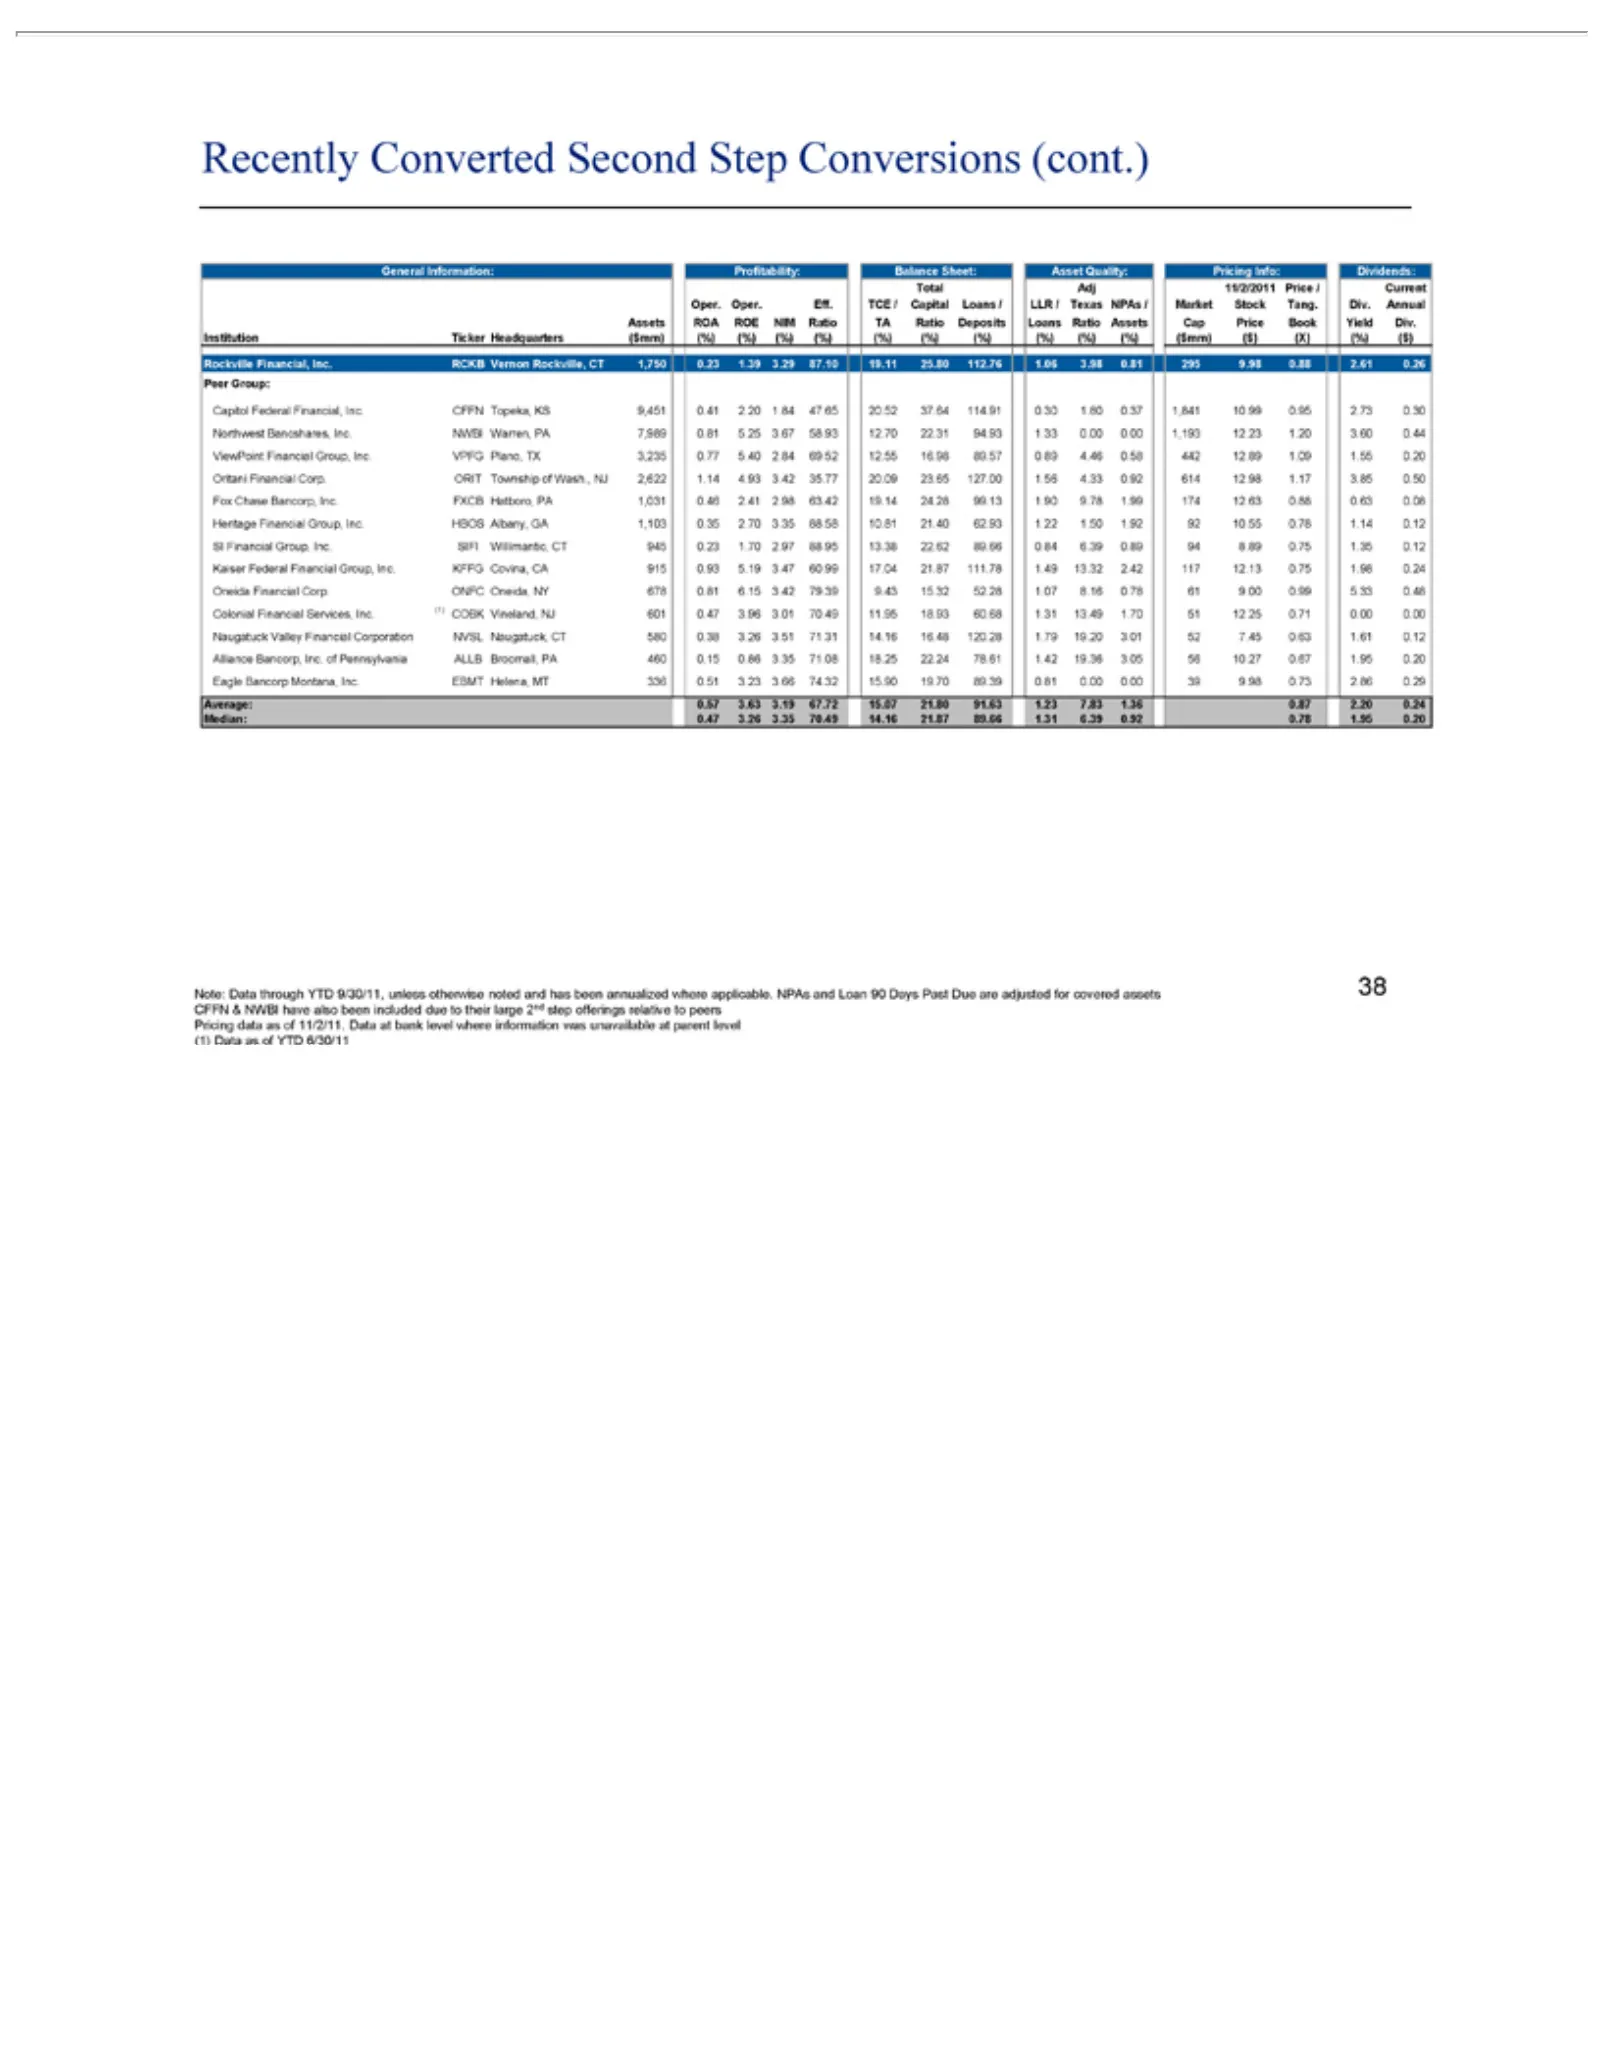
Slide 38: Recently Converted Institutions Comparison
Recently General Tang. Institution Rockville Capitol 5.25 1.09 PA 1.92 KFFG Oneida 3.01 7.45 Alliance Eagle Average: Note: included (1) 1,031 3.67 1.55 92 70.49 0.63 Data Div. Bancorp Covina, Financial Federal Data 10.55 Information: Bancorp, due Converted 0.57 0.46 58.93 0.20 1.61 Financial, Ticker
Source: SEC EDGAR · 8-K filed Feb 13, 2012
More decks from United Financial Bancorp Inc
 Merger or Acquisition (July 2019)10 slides · Jul 15, 2019
 Shareholder Meeting (May 2019)14 slides · May 13, 2019
 Q1 2019 Earnings Presentation27 slides · Apr 16, 2019
 Q4 2018 Earnings Presentation26 slides · Jan 22, 2019
 Q3 2018 Earnings Presentation25 slides · Oct 16, 2018
 Q2 2018 Earnings Presentation25 slides · Jul 17, 2018