NuStar Energy LP — 2022 Wells Fargo Midstream and Utility Symposium
35 slides from NuStar Energy LP's conference presentation, Dec 7, 2022
Slide 1: 2022 Wells Fargo Midstream and Utility Symposium
2022 Wells Fargo Midstream and Utility Symposium December 7-8, 2022
Slide 2: Forward-Looking Statements
2 Statements contained in this presentation other than statements of historical fact are forward-looking statements. While these forward-looking statements, and any assumptions upon which they are based, are made in good faith and reflect our current judgment regarding the direction of our business,
Slide 3: Our Solid Third Quarter Results Once Again Demonstrated the Strength and Resilience of Our Business
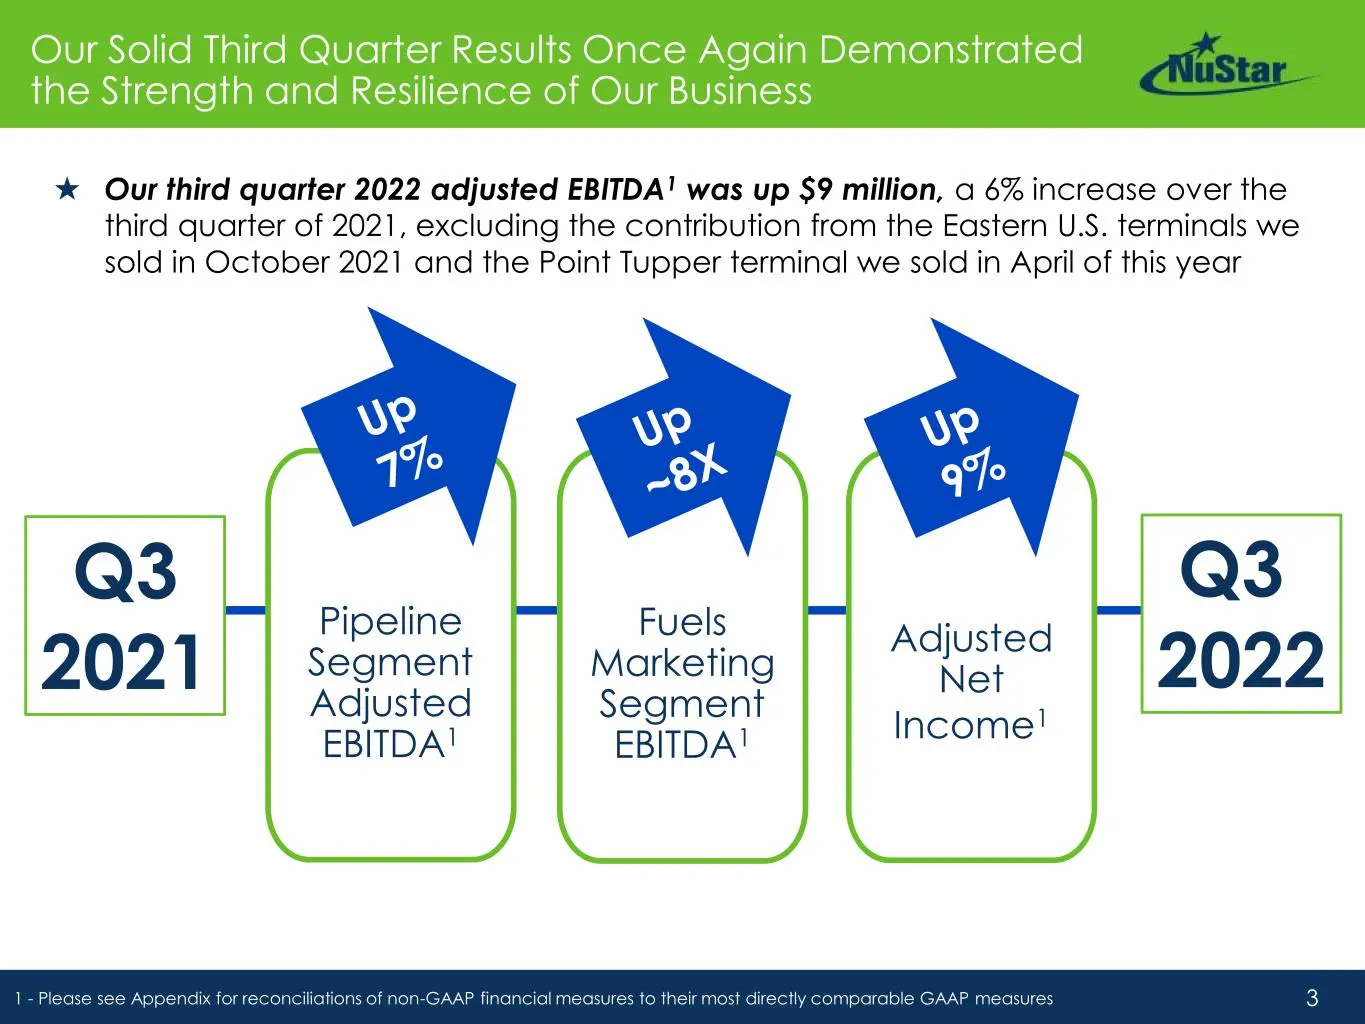
3 Our Solid Third Quarter Results Once Again Demonstrated the Strength and Resilience of Our Business 1 - Please see Appendix for reconciliations of non-GAAP financial measures to their most directly comparable GAAP measures ★ Our third quarter 2022 adjusted EBITDA1 was up $9 million, a 6% increase
Slide 4: Optimizing Our Business to Maximize Internally Generated Cash Flows
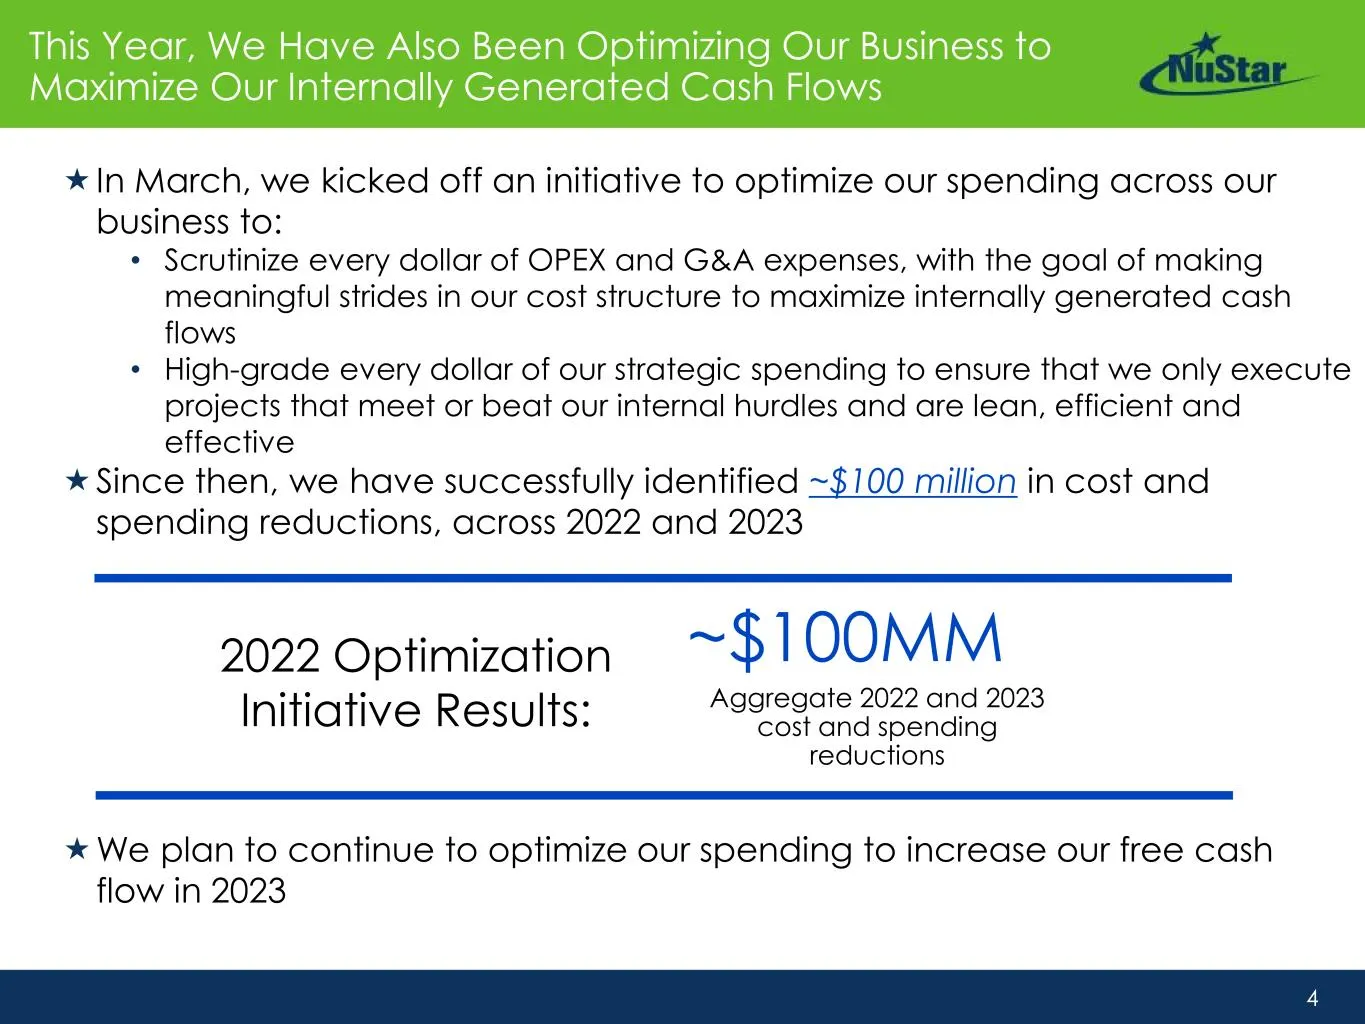
4 This Year, We Have Also Been Optimizing Our Business to Maximize Our Internally Generated Cash Flows In March, we kicked off an initiative to optimize our spending across our business to: • Scrutinize every dollar of OPEX and G&A expenses, with the goal of making meaningful strides in our cost s
Slide 5: Our 3Q 2022 Debt Ratio Demonstrates the Strength of Our Business
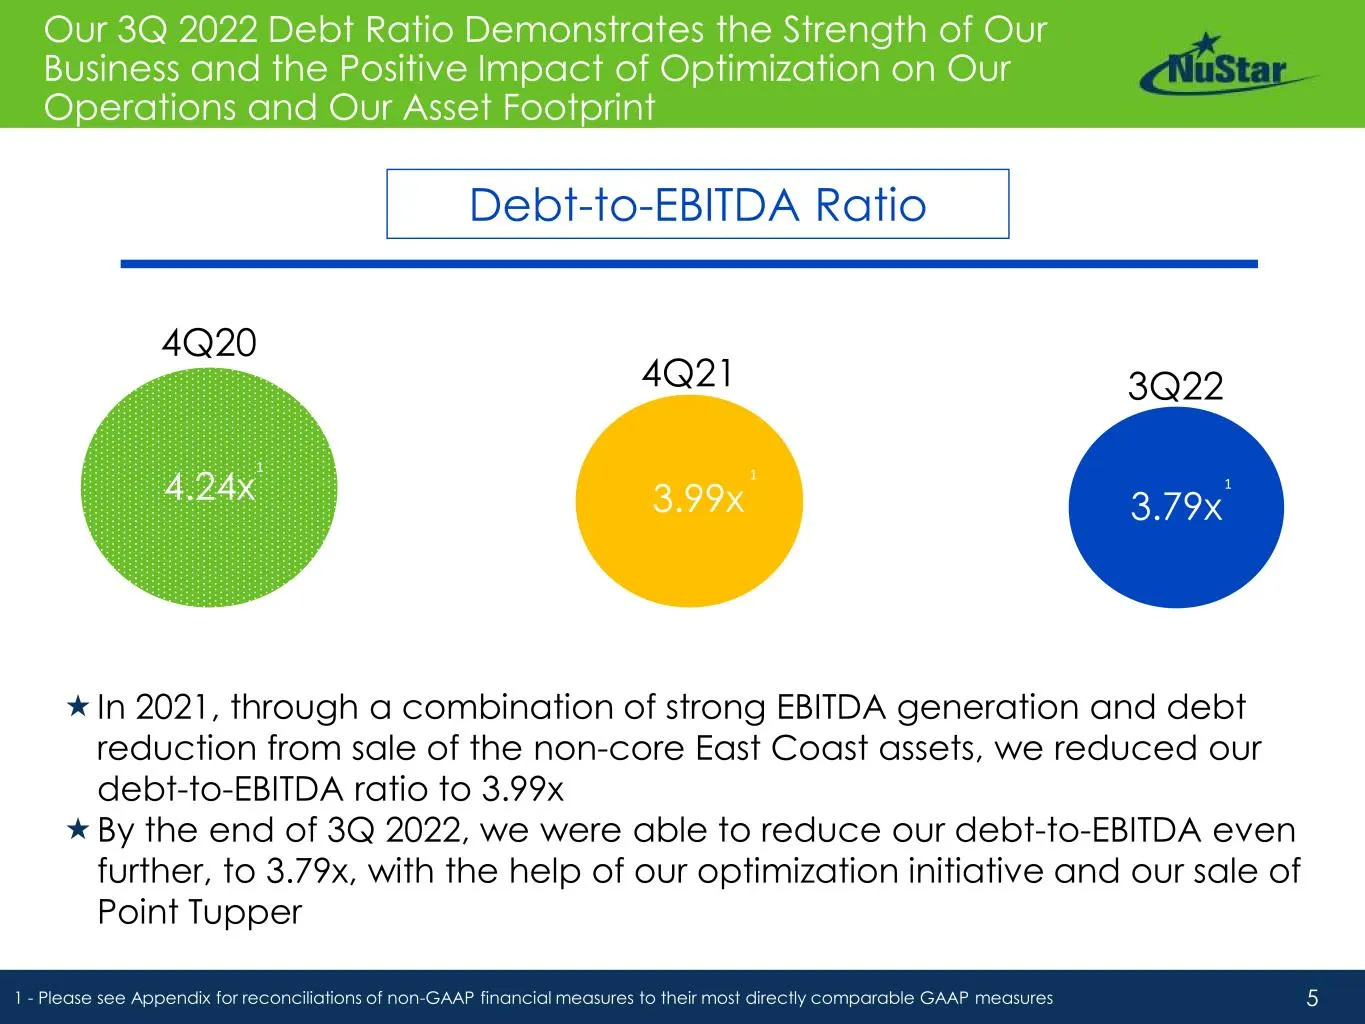
5 Our 3Q 2022 Debt Ratio Demonstrates the Strength of Our Business and the Positive Impact of Optimization on Our Operations and Our Asset Footprint 1 - Please see Appendix for reconciliations of non-GAAP financial measures to their most directly comparable GAAP measures 1 1 1 1 1 Debt-to-EBITDA Rat
Slide 6: NuStar is on Target to Deliver a Solid Full-Year 2022
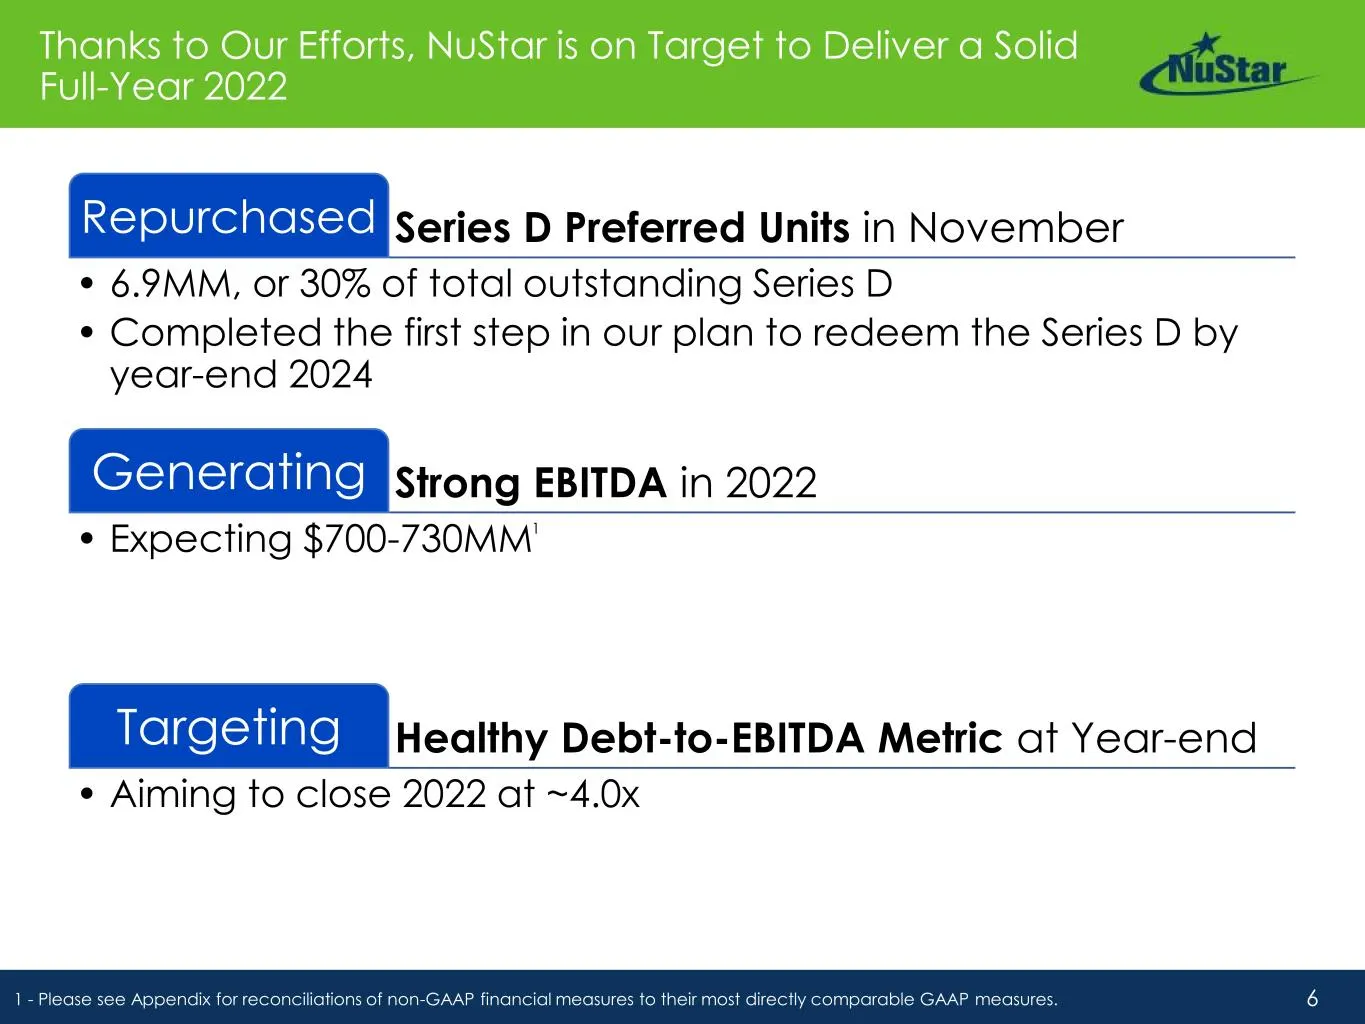
6 Thanks to Our Efforts, NuStar is on Target to Deliver a Solid Full-Year 2022 1 - Please see Appendix for reconciliations of non-GAAP financial measures to their most directly comparable GAAP measures. Series D Preferred Units in NovemberRepurchased • 6.9MM, or 30% of total outstanding Series D • C
Slide 7: Strategic Capital Program Focused on Our Core Asset Footprint
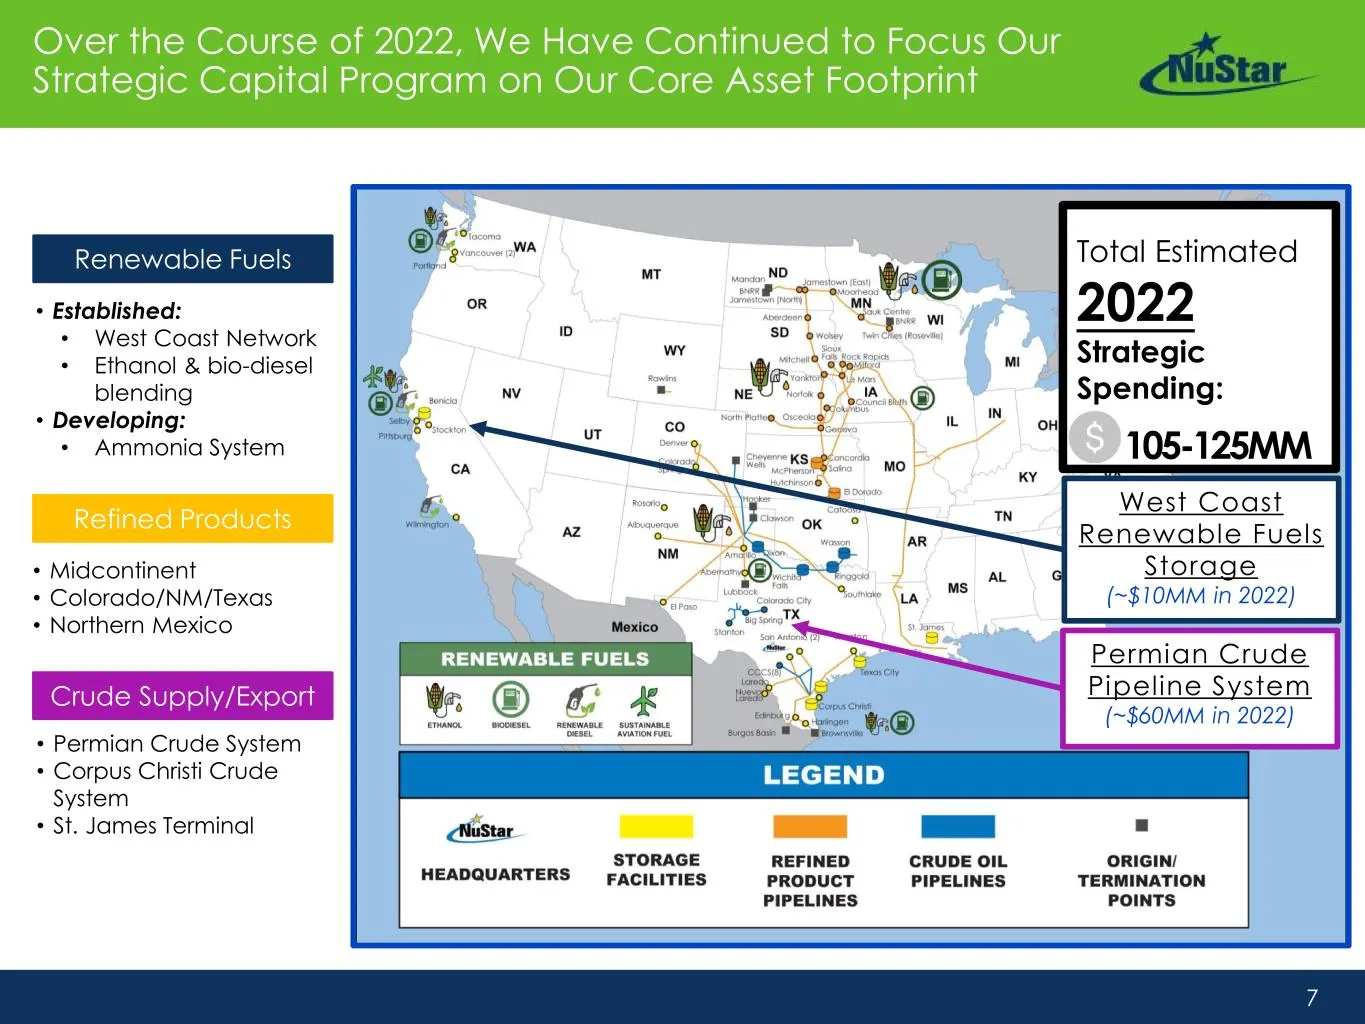
7 Over the Course of 2022, We Have Continued to Focus Our Strategic Capital Program on Our Core Asset Footprint Crude Supply/Export Renewable Fuels Refined Products • Permian Crude System • Corpus Christi Crude System • St. James Terminal • Midcontinent • Colorado/NM/Texas • Northern Mexico • Establ
Slide 8: Carbon Emissions Reduction Goals Generate Growing Demand for NuStar's Midstream Logistics
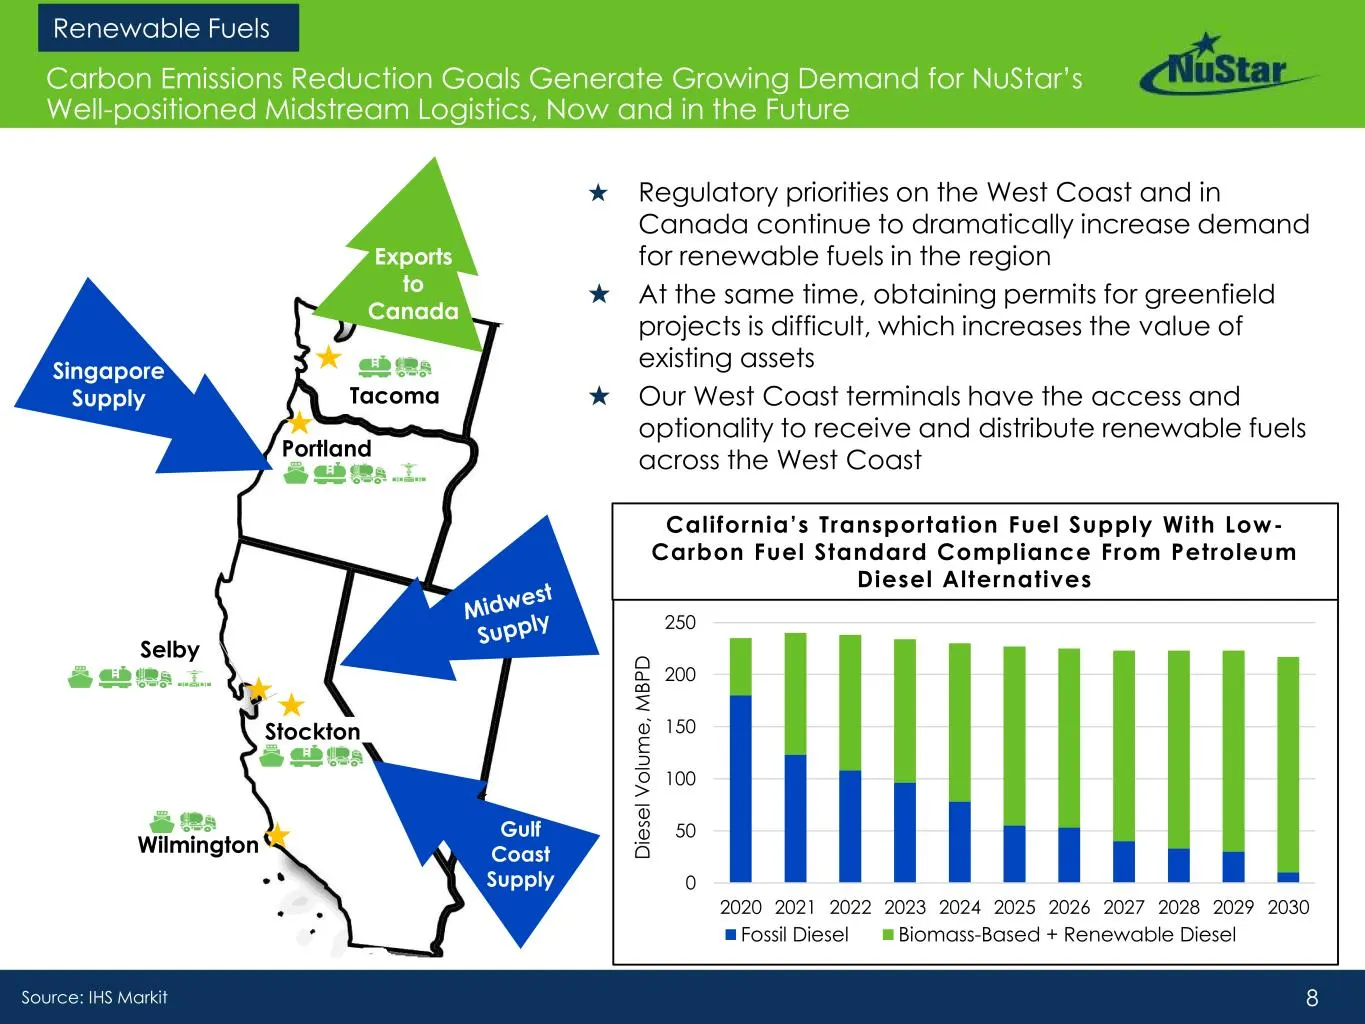
8 Carbon Emissions Reduction Goals Generate Growing Demand for NuStar’s Well-positioned Midstream Logistics, Now and in the Future Stockton Selby Wilmington Gulf Coast Supply Singapore Supply Exports to Canada Tacoma Portland ★ Regulatory priorities on the West Coast and in Canada continue to dramat
Slide 9: Significant and Growing Proportion of the Region's Renewable Fuels Supply
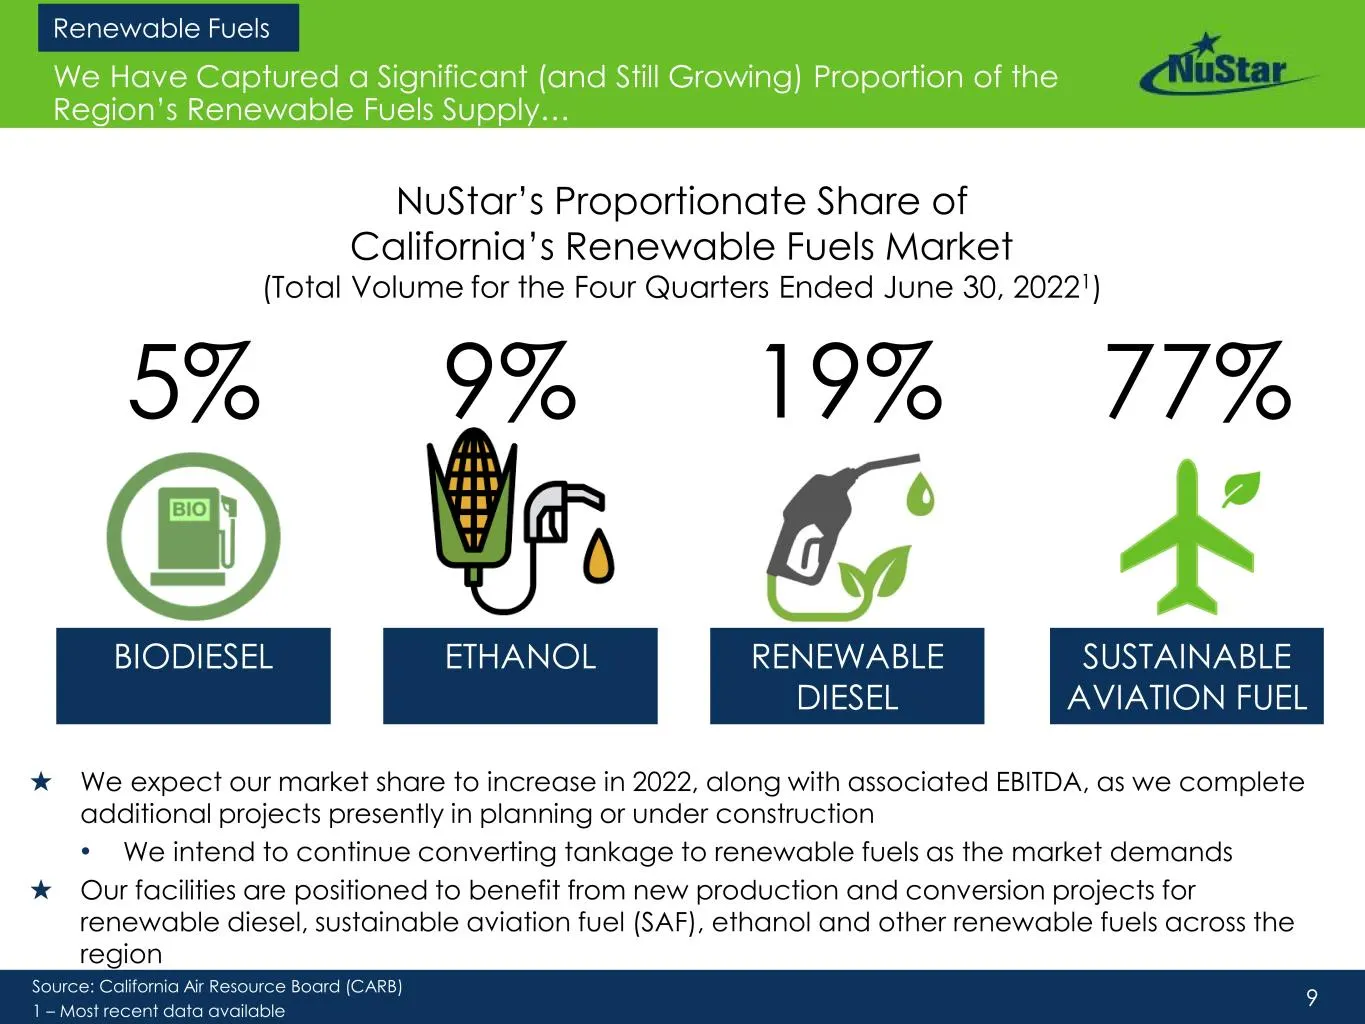
9 ★ We expect our market share to increase in 2022, along with associated EBITDA, as we complete additional projects presently in planning or under construction • We intend to continue converting tankage to renewable fuels as the market demands ★ Our facilities are positioned to benefit from new pro
Slide 10: Partnering With Key Customers to Develop Our Renewable Fuels Network
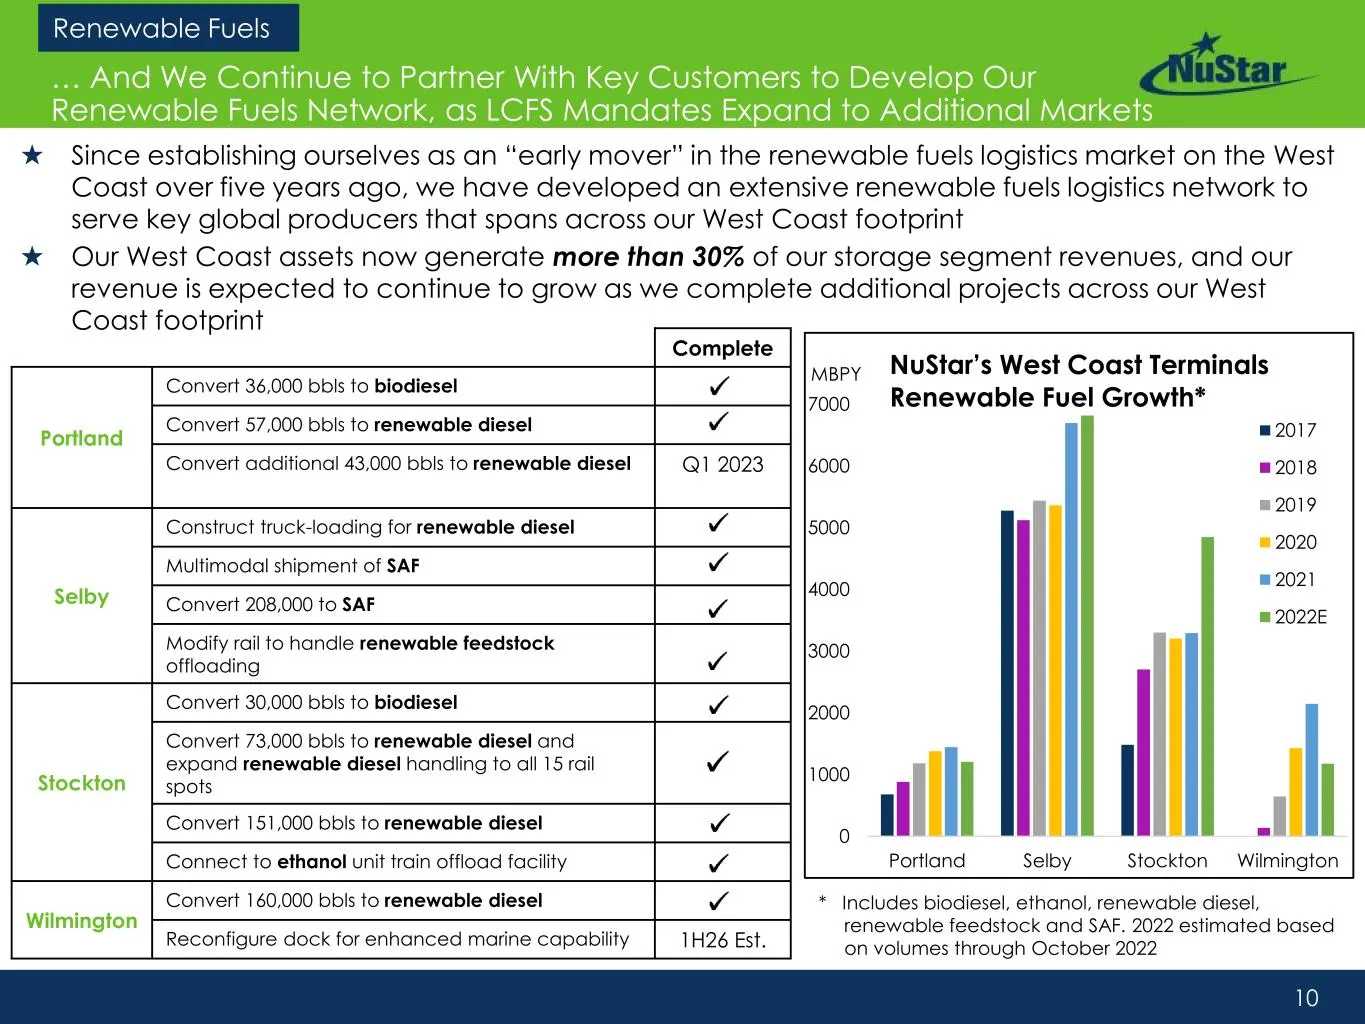
10 0 1000 2000 3000 4000 5000 6000 7000 Portland Selby Stockton Wilmington NuStar’s West Coast Terminals Renewable Fuel Growth* 2017 2018 2019 2020 2021 2022E … And We Continue to Partner With Key Customers to Develop Our Renewable Fuels Network, as LCFS Mandates Expand to Additional Markets Complet
Slide 11: Ammonia Offers Significant Greening Opportunities
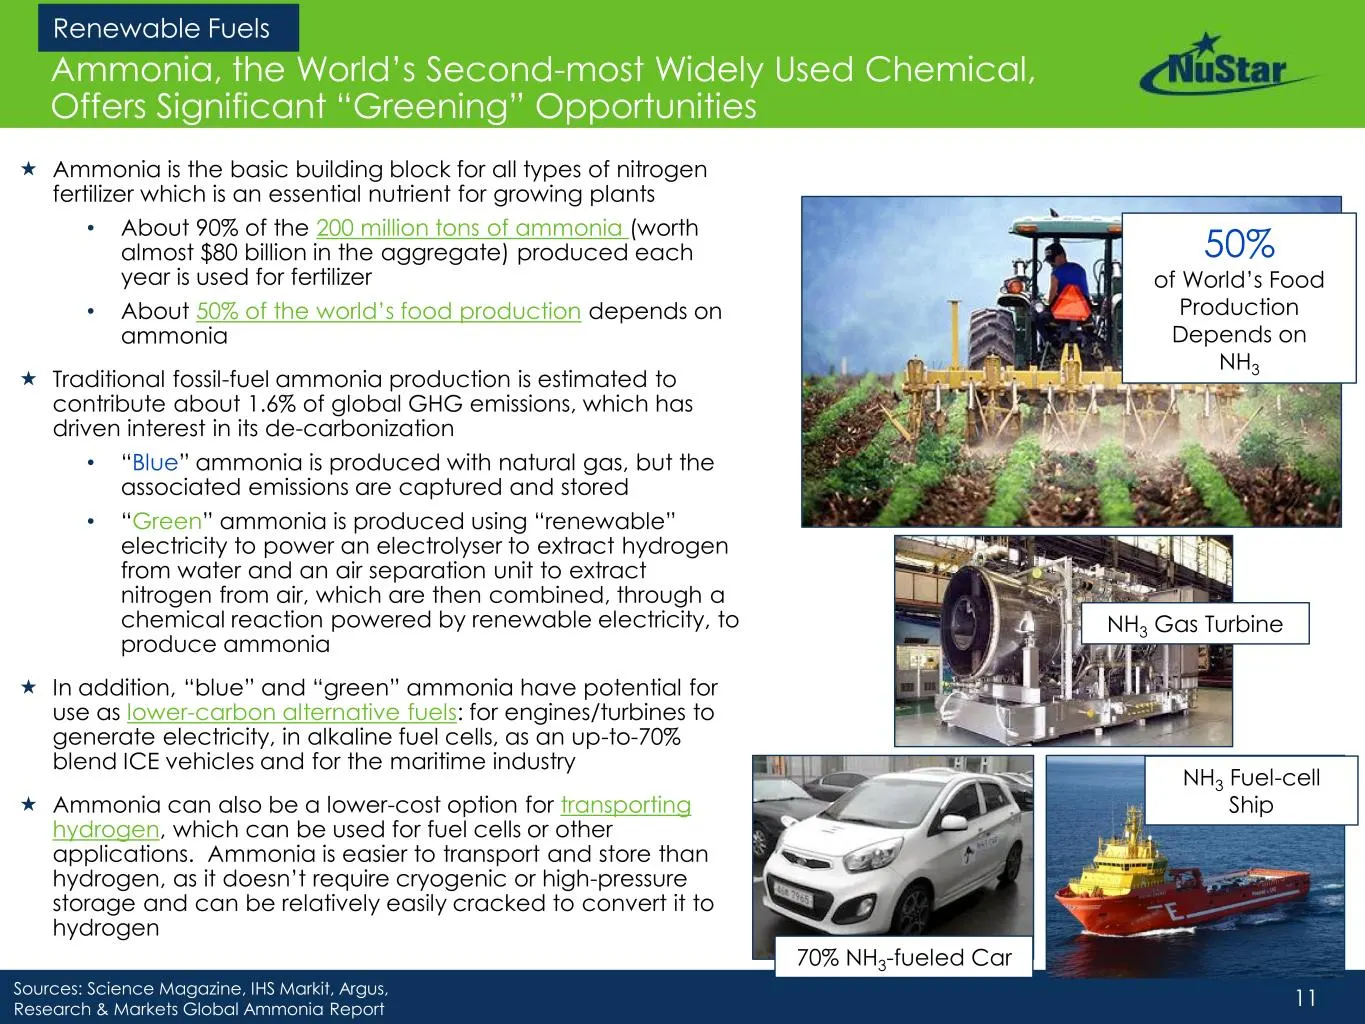
11 Ammonia, the World’s Second-most Widely Used Chemical, Offers Significant “Greening” Opportunities Ammonia is the basic building block for all types of nitrogen fertilizer which is an essential nutrient for growing plants • About 90% of the 200 million tons of ammonia (worth almost $80 billion
Slide 12: Developing Opportunities for Our Ammonia System
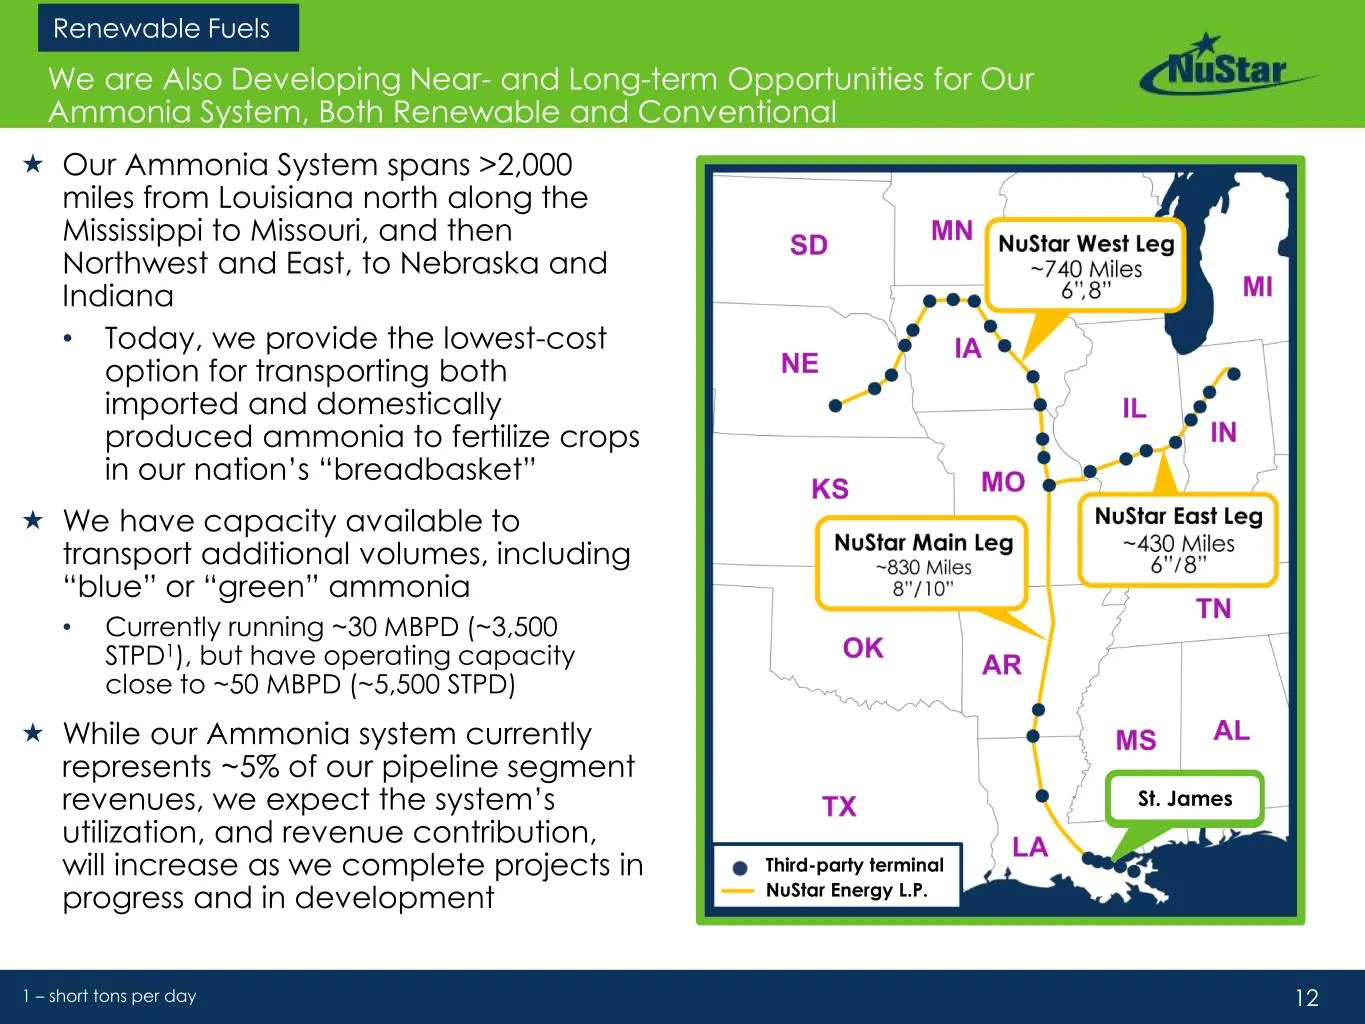
12 Our Ammonia System spans >2,000 miles from Louisiana north along the Mississippi to Missouri, and then Northwest and East, to Nebraska and Indiana • Today, we provide the lowest-cost option for transporting both imported and domestically produced ammonia to fertilize crops in our nation’s “brea
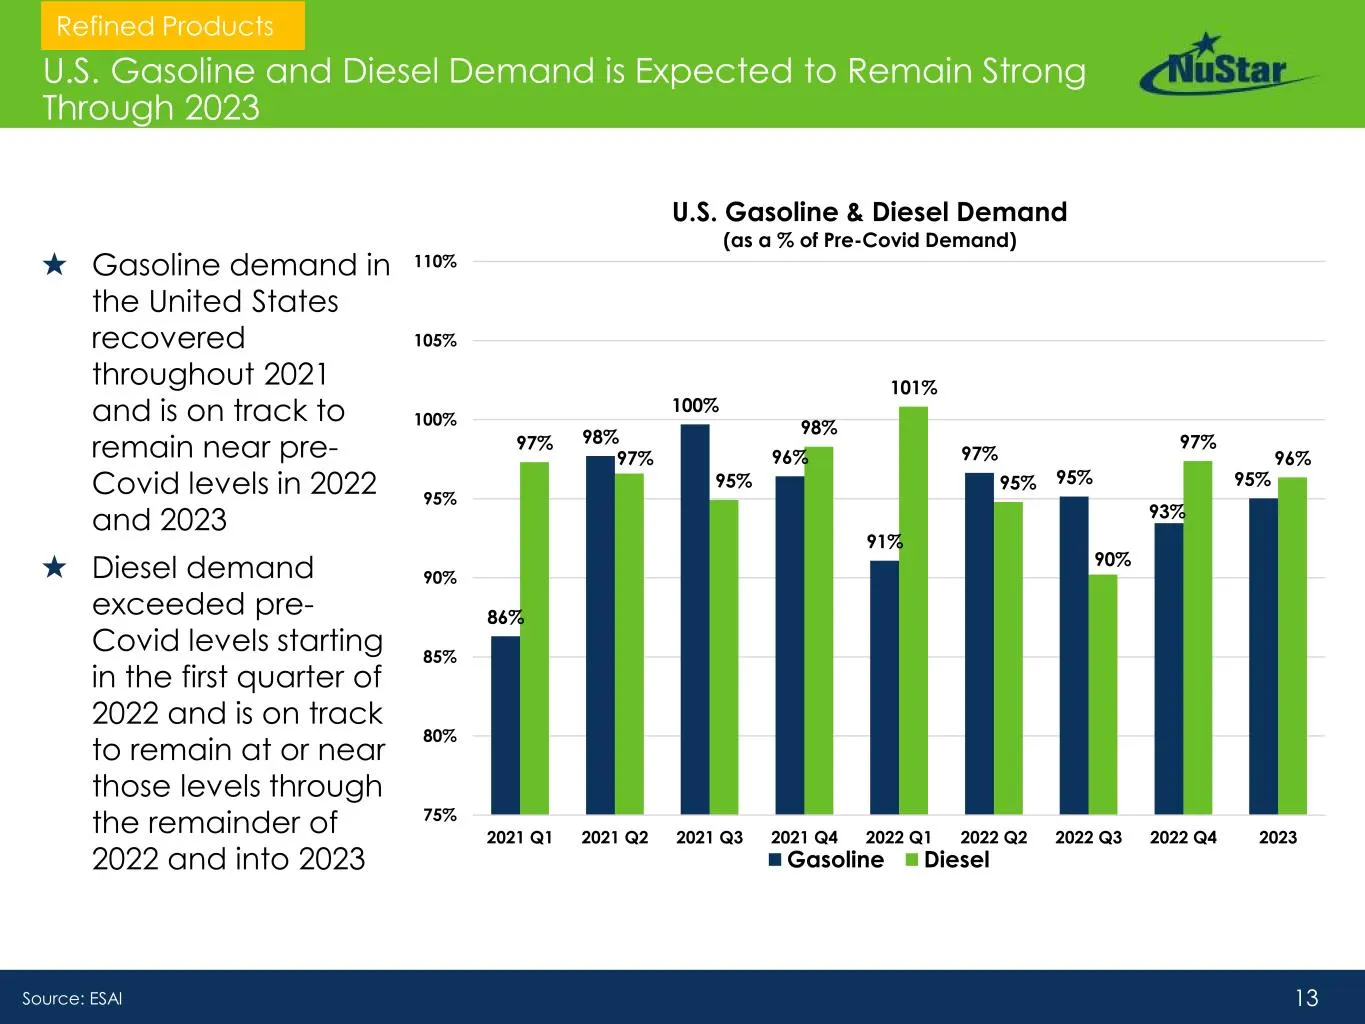
Slide 13: U.S. Gasoline and Diesel Demand Expected to Remain Strong Through 2023
13 U.S. Gasoline and Diesel Demand is Expected to Remain Strong Through 2023 ★ Gasoline demand in the United States recovered throughout 2021 and is on track to remain near pre- Covid levels in 2022 and 2023 ★ Diesel demand exceeded pre- Covid levels starting in the first quarter of 2022 and is on t
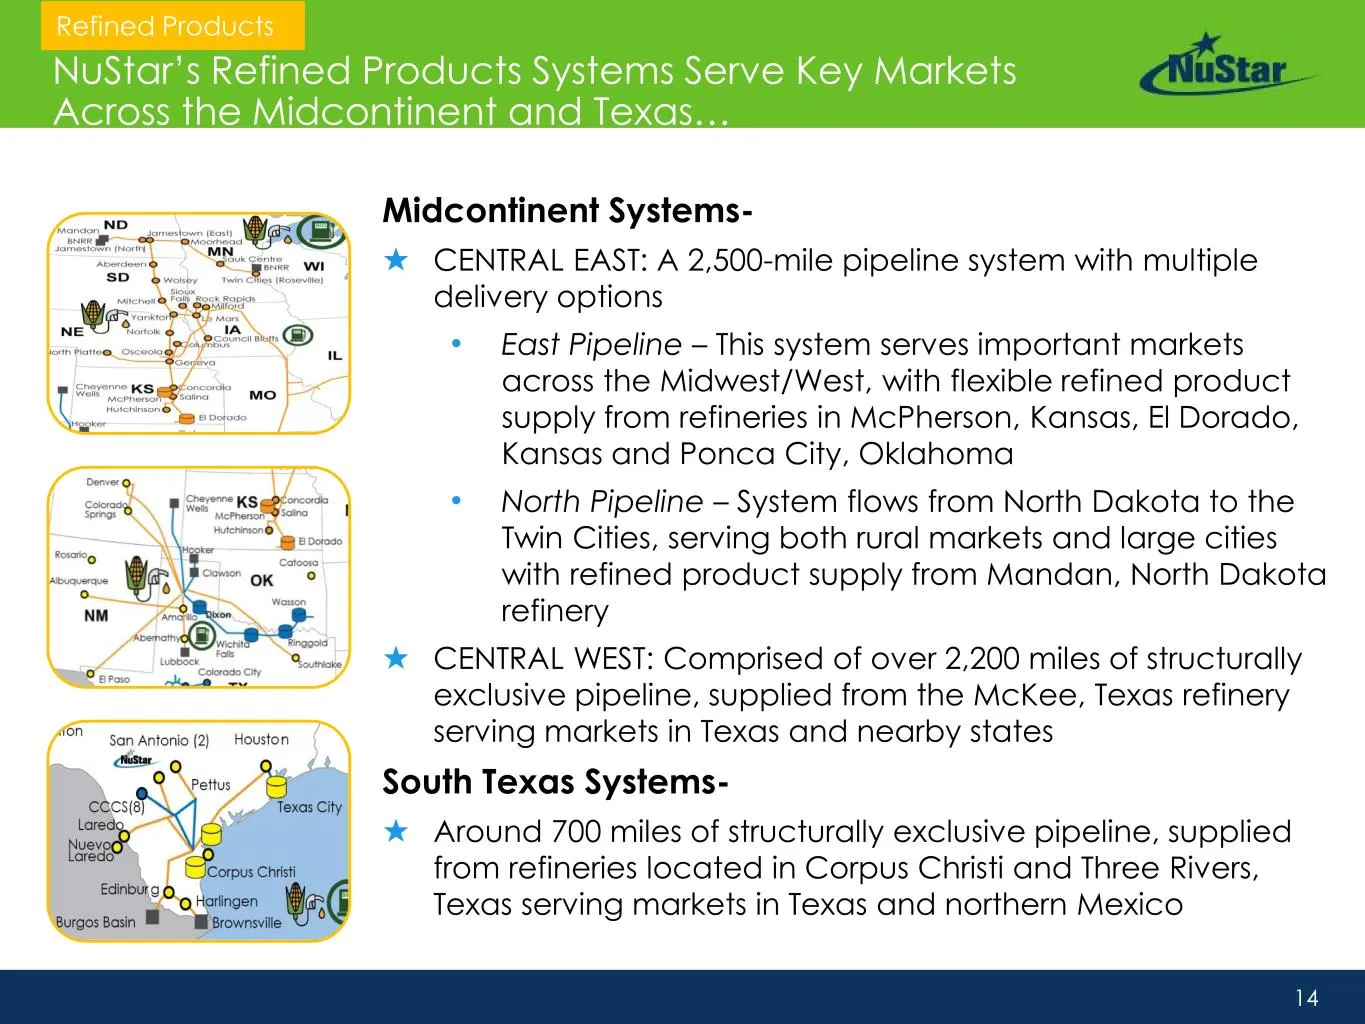
Slide 14: NuStar's Refined Products Systems Serve Key Markets
14 NuStar’s Refined Products Systems Serve Key Markets Across the Midcontinent and Texas… Midcontinent Systems- ★ CENTRAL EAST: A 2,500-mile pipeline system with multiple delivery options • East Pipeline – This system serves important markets across the Midwest/West, with flexible refined product su
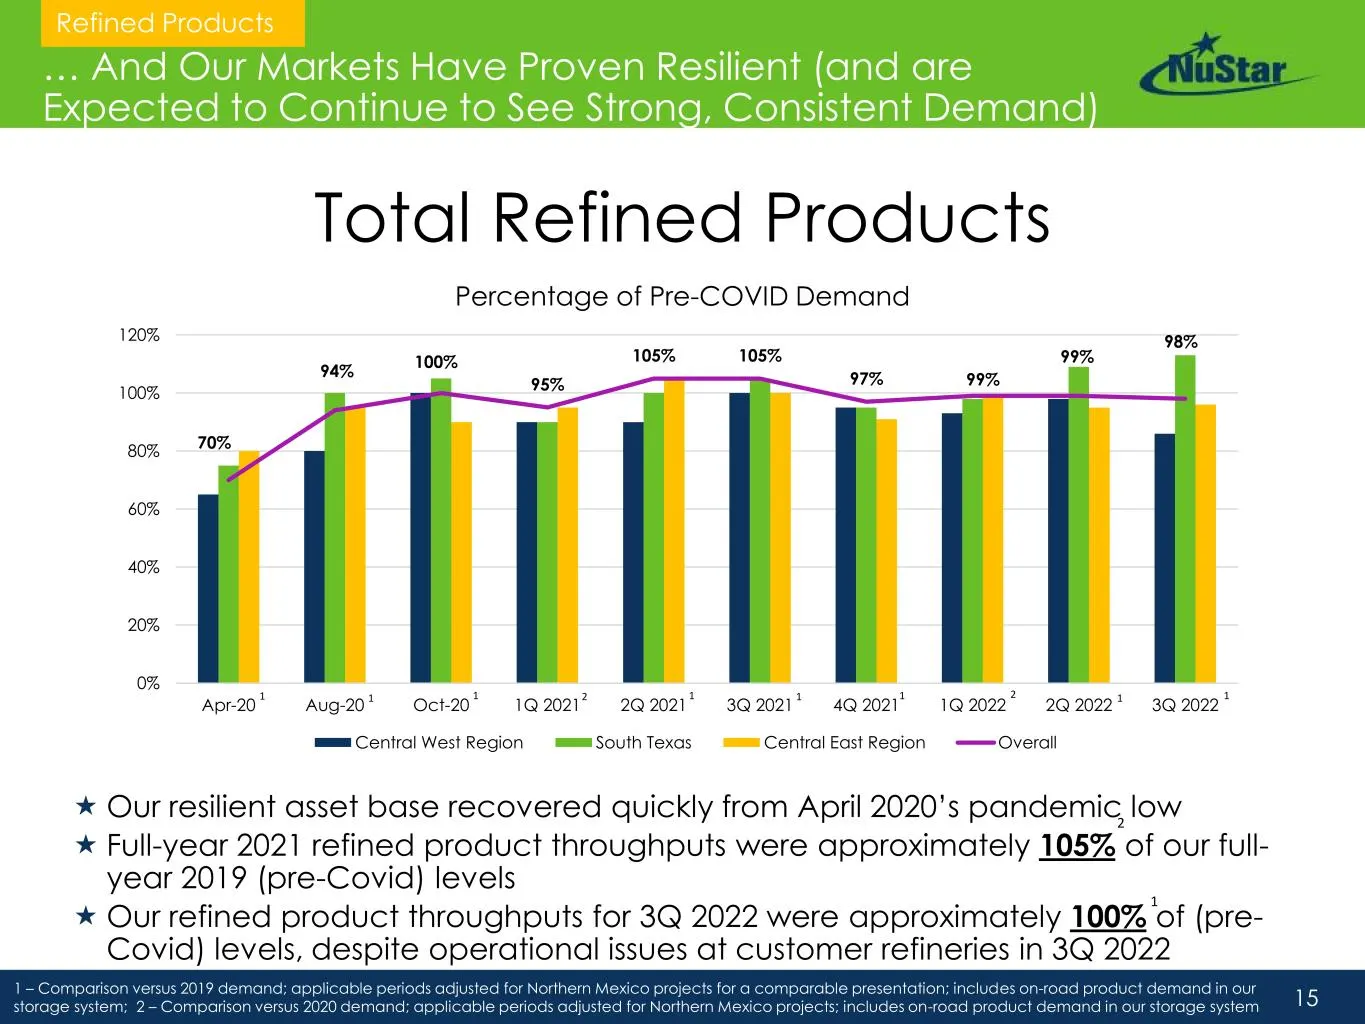
Slide 15: Our Markets Have Proven Resilient
15 70% 94% 100% 95% 105% 105% 97% 99% 99% 98% 0% 20% 40% 60% 80% 100% 120% Apr-20 Aug-20 Oct-20 1Q 2021 2Q 2021 3Q 2021 4Q 2021 1Q 2022 2Q 2022 3Q 2022 Percentage of Pre-COVID Demand Central West Region South Texas Central East Region Overall 1 … And Our Markets Have Proven Resilient (and are Expect
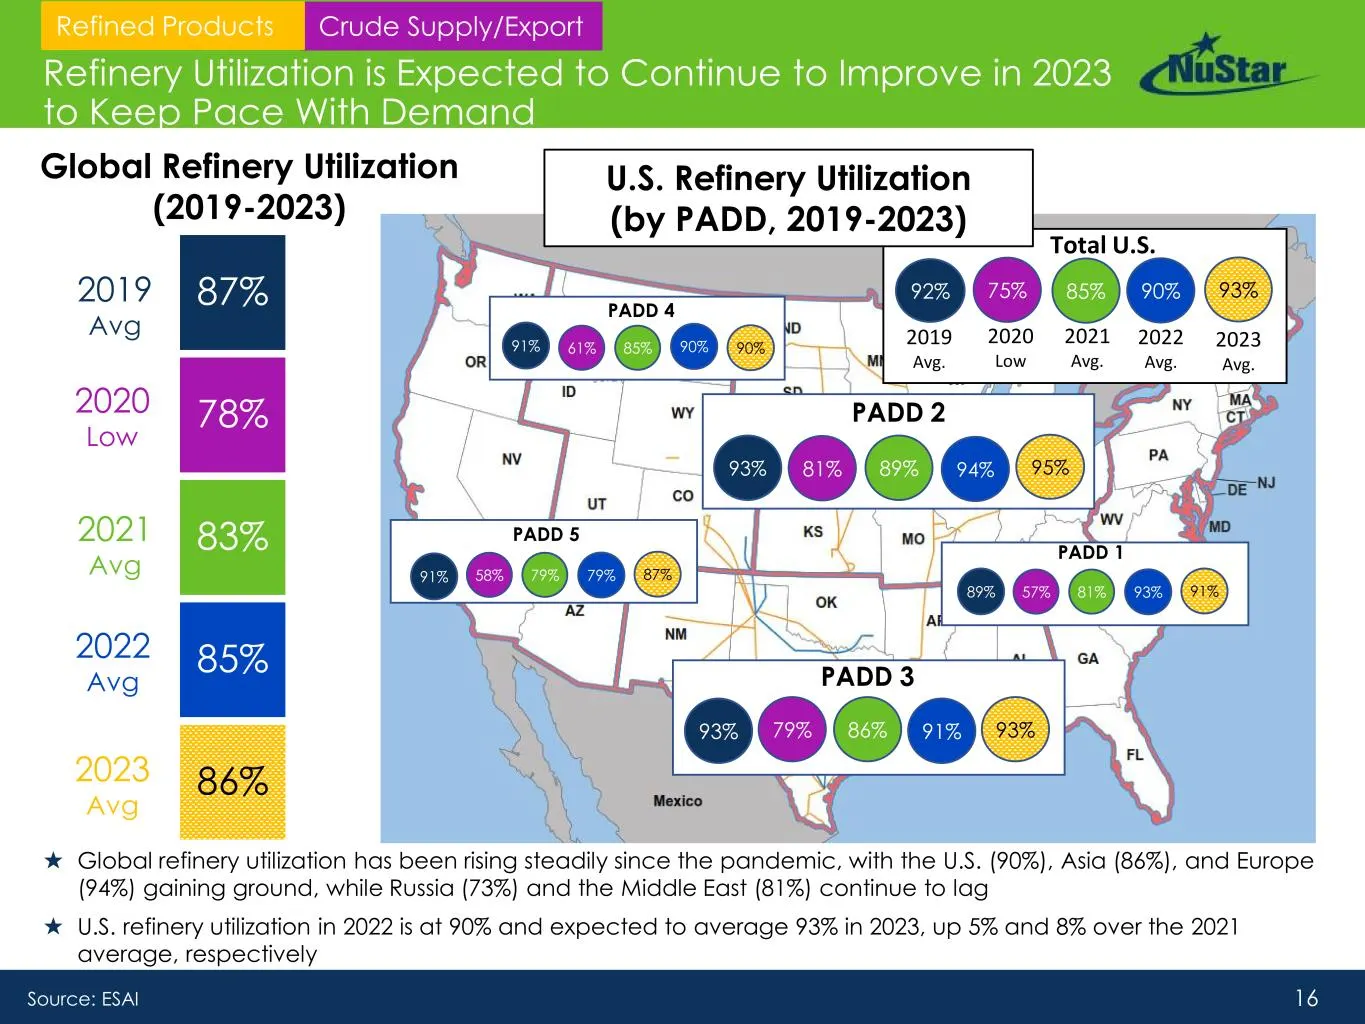
Slide 16: Refinery Utilization Expected to Continue to Improve in 2023
16 Refinery Utilization is Expected to Continue to Improve in 2023 to Keep Pace With Demand Source: ESAI 93% 81% 89% PADD 2 91% 61% 85% PADD 4 93% 79% PADD 3 86% 2020 Low 2021 Avg. 92% 75% 85% 2019 Avg. Total U.S. 90% 91% 94% 90% 93% 90% 95% 93% 89% 57% 4 79% 86% 54% 76% 87% 86% PADD 5 91% 58% 79% 7
Slide 17: Permian Basin Leading the U.S. Shale Rebound
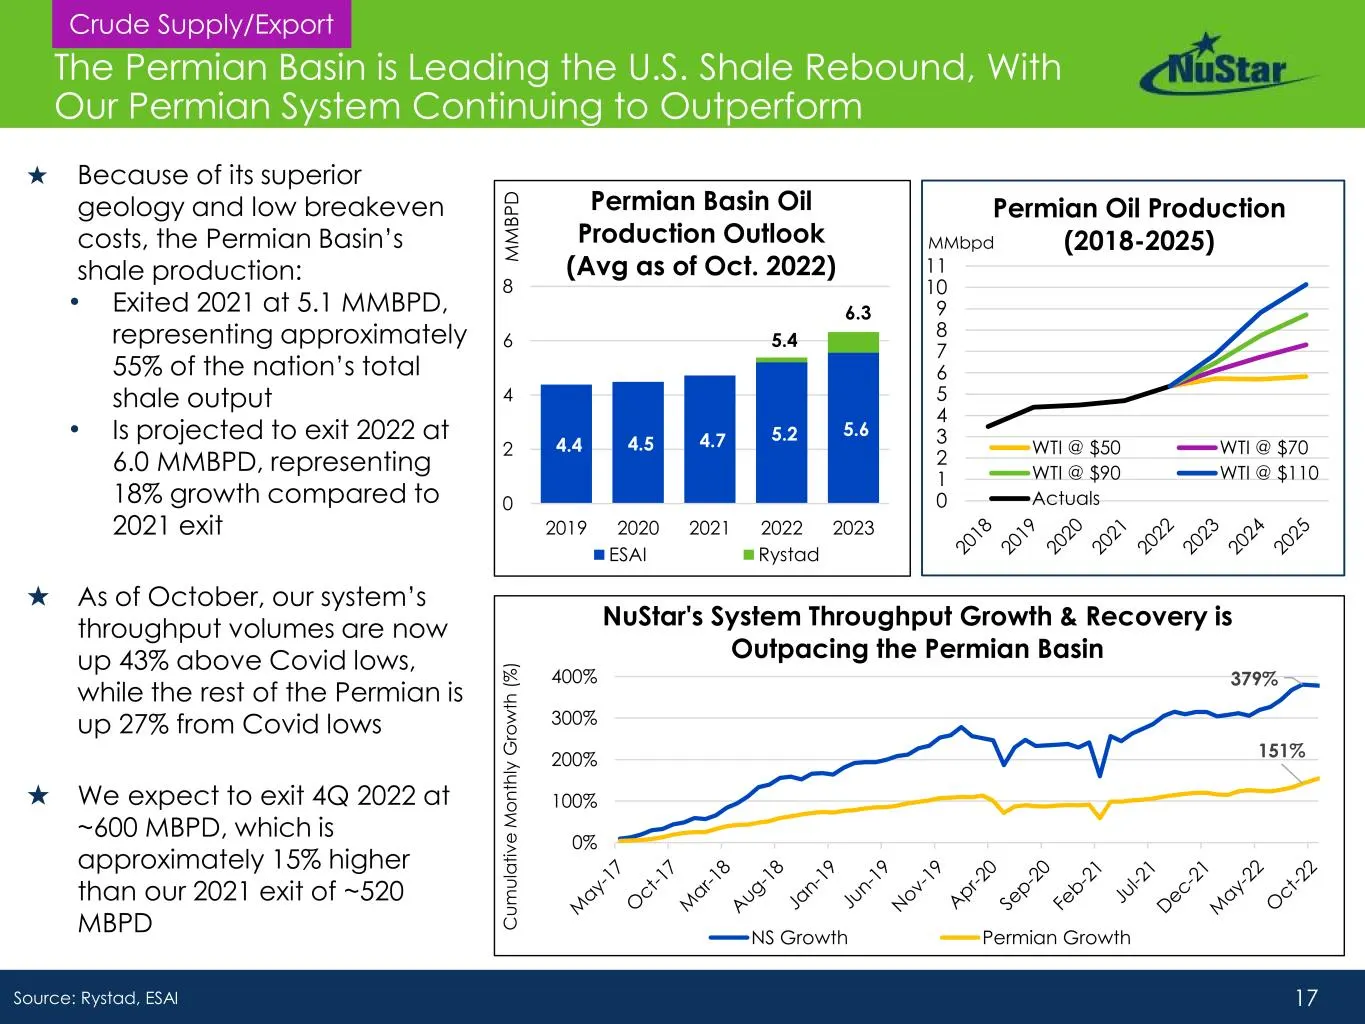
17 The Permian Basin is Leading the U.S. Shale Rebound, With Our Permian System Continuing to Outperform ★ Because of its superior geology and low breakeven costs, the Permian Basin’s shale production: • Exited 2021 at 5.1 MMBPD, representing approximately 55% of the nation’s total shale output • Is
Slide 18: Our Core of the Core Location Has Attracted Top-tier Customers
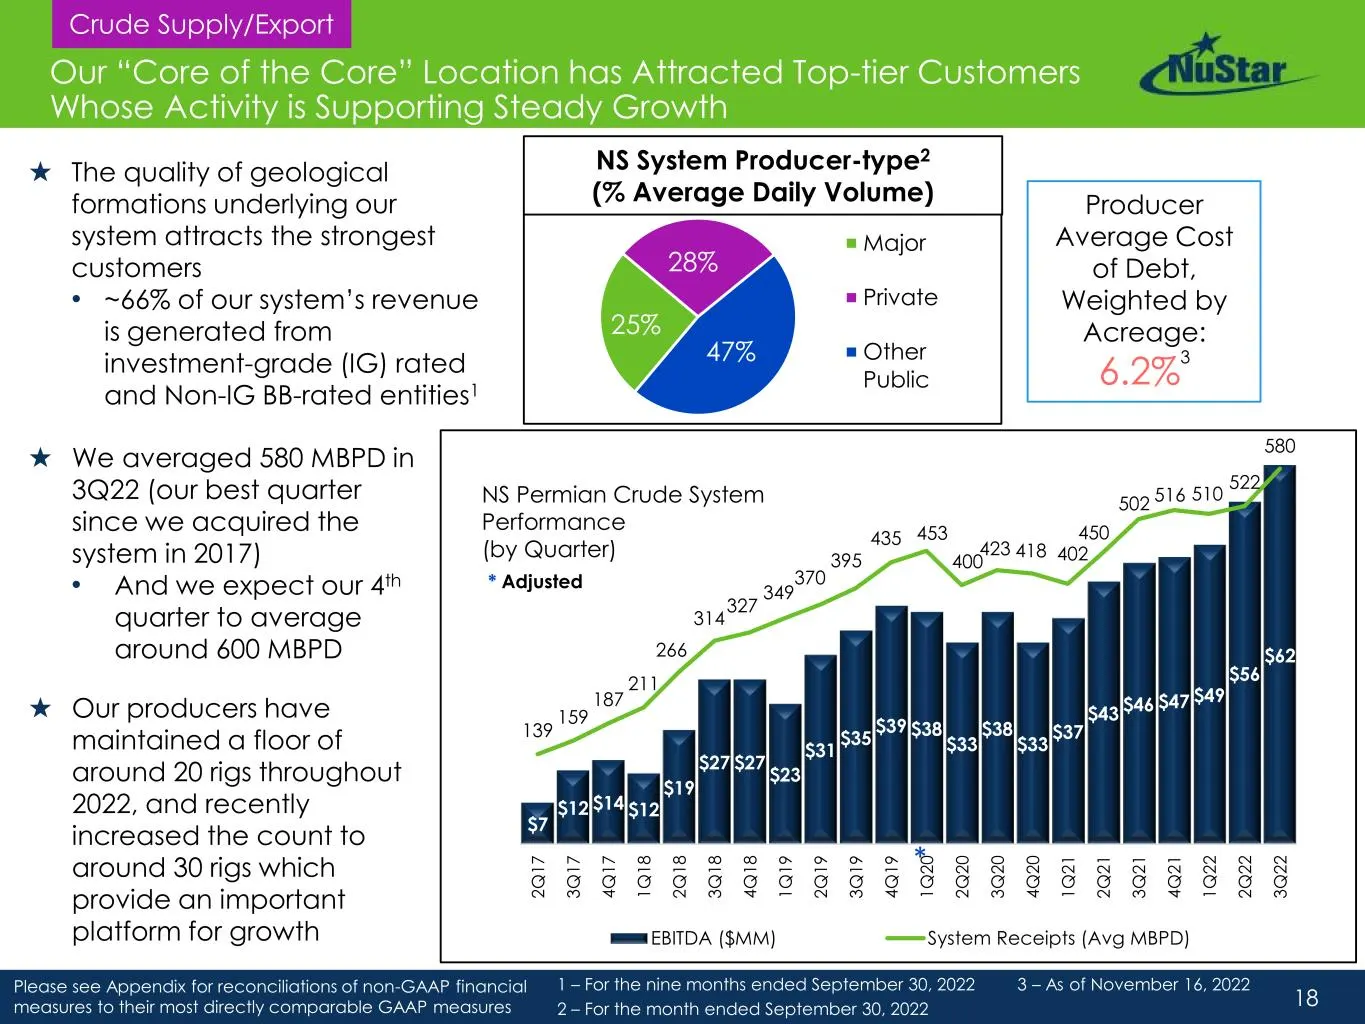
18 Please see Appendix for reconciliations of non-GAAP financial measures to their most directly comparable GAAP measures Our “Core of the Core” Location has Attracted Top-tier Customers Whose Activity is Supporting Steady Growth ★ The quality of geological formations underlying our system attracts
Slide 19: Producers in the Basin Remain Committed to Permian Growth
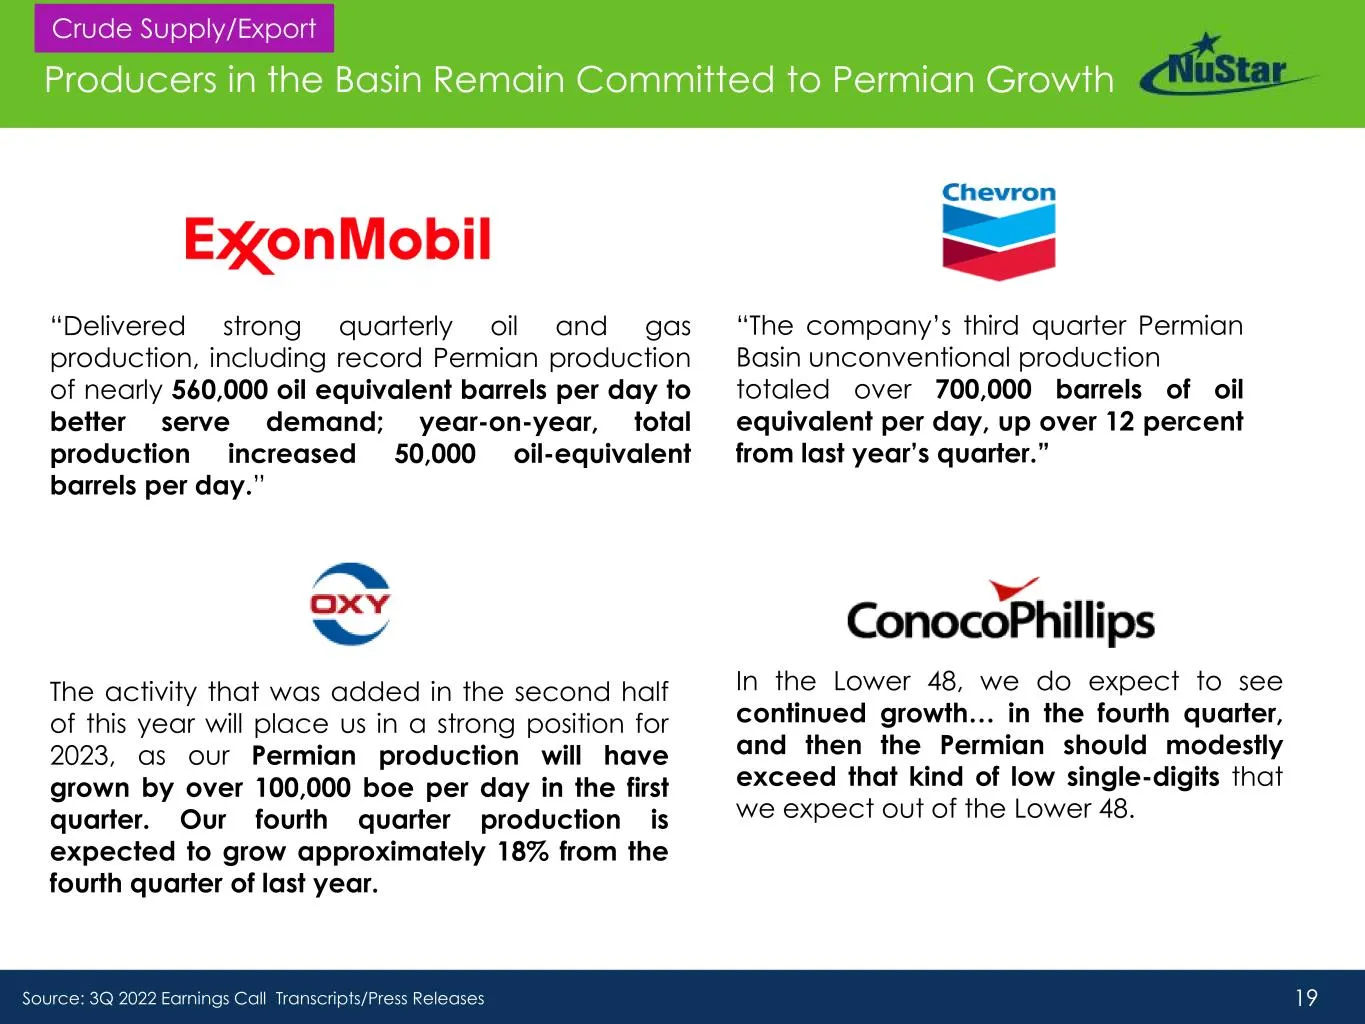
19 Producers in the Basin Remain Committed to Permian Growth “Delivered strong quarterly oil and gas production, including record Permian production of nearly 560,000 oil equivalent barrels per day to better serve demand; year-on-year, total production increased 50,000 oil-equivalent barrels per day
Slide 20: Investing in Our Permian System in Pace With Producers' Growth
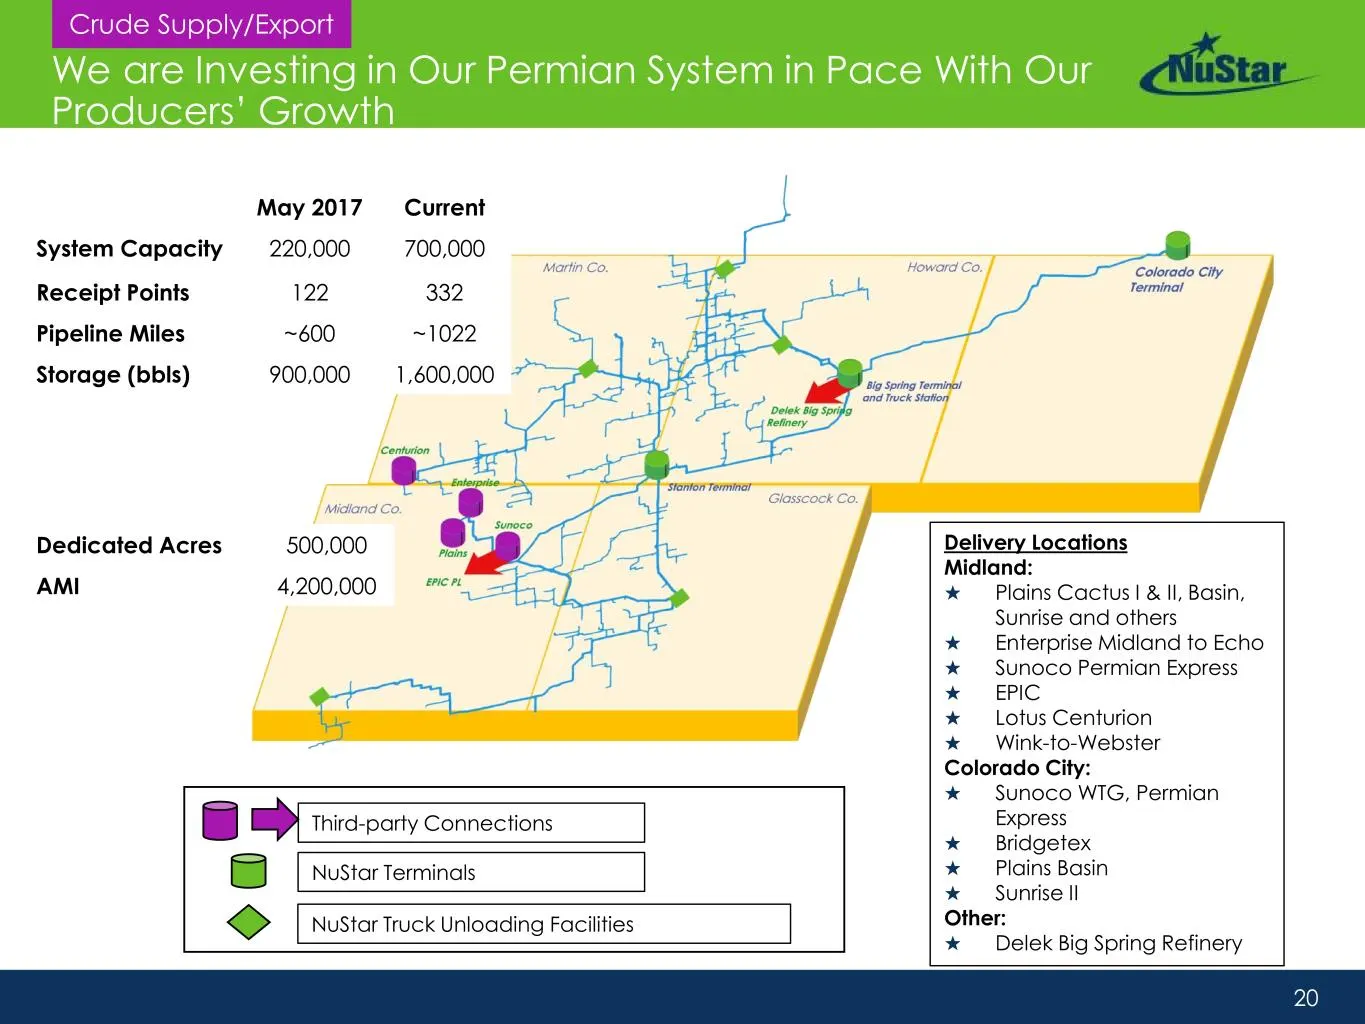
20 We are Investing in Our Permian System in Pace With Our Producers’ Growth Dedicated Acres 500,000 AMI 4,200,000 May 2017 Current System Capacity 220,000 700,000 Receipt Points 122 332 Pipeline Miles ~600 ~1022 Storage (bbls) 900,000 1,600,000 Third-party Connections NuStar Terminals NuStar Truck
Slide 21: Corpus Christi Expected to Be the Export Hub Best Positioned for Growth
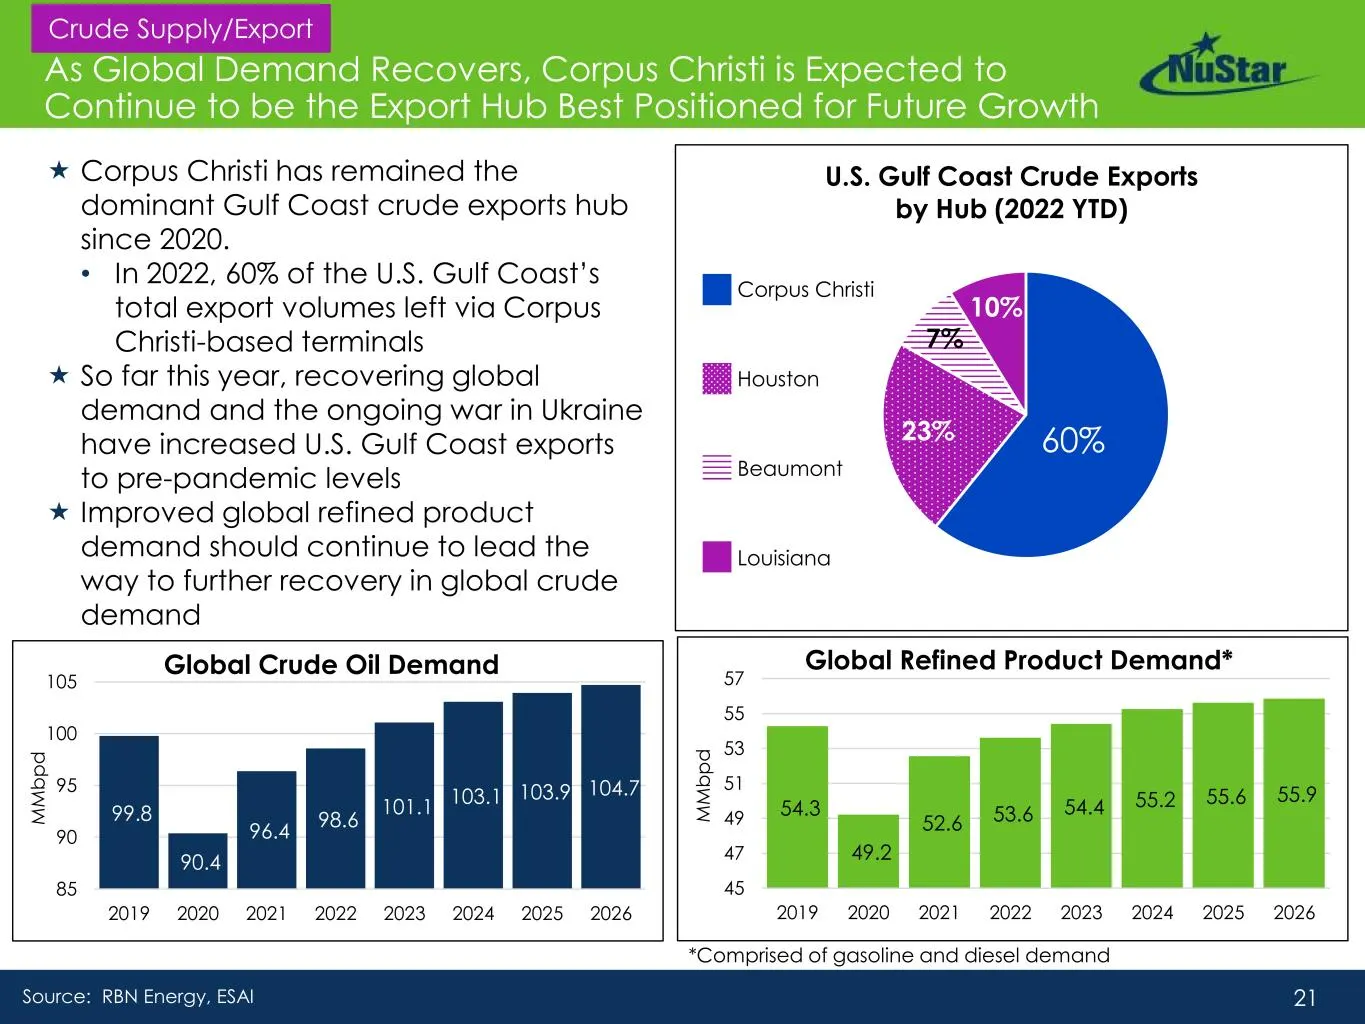
21 99.8 90.4 96.4 98.6 101.1 103.1 103.9 104.7 85 90 95 100 105 2019 2020 2021 2022 2023 2024 2025 2026 M M b p d As Global Demand Recovers, Corpus Christi is Expected to Continue to be the Export Hub Best Positioned for Future Growth Corpus Christi has remained the dominant Gulf Coast crude expor
Slide 22: Corpus Christi Crude System MVCs Provide Strength and Stability
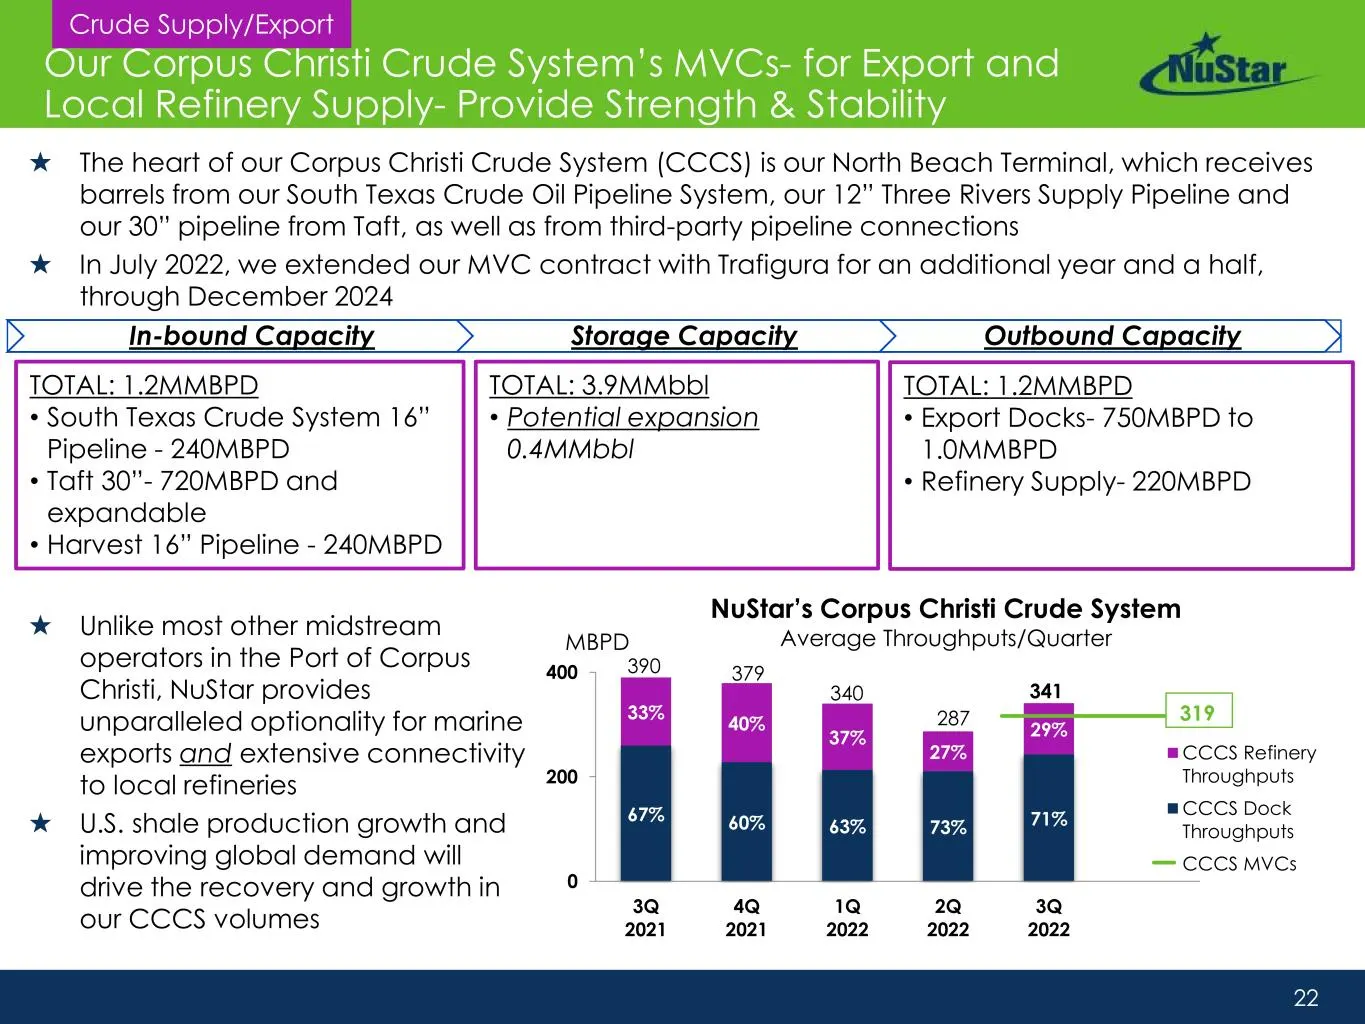
22 67% 60% 63% 73% 71% 33% 40% 37% 27% 29% 0 200 400 3Q 2021 4Q 2021 1Q 2022 2Q 2022 3Q 2022 2024 MBPD CCCS Refinery Throughputs CCCS Dock Throughputs CCCS MVCs NuStar’s Corpus Christi Crude System Average Throughputs/Quarter 319 341 390 379 340 287 Our Corpus Christi Crude System’s MVCs- for Export
Slide 23: NuStar's Strategic Priorities
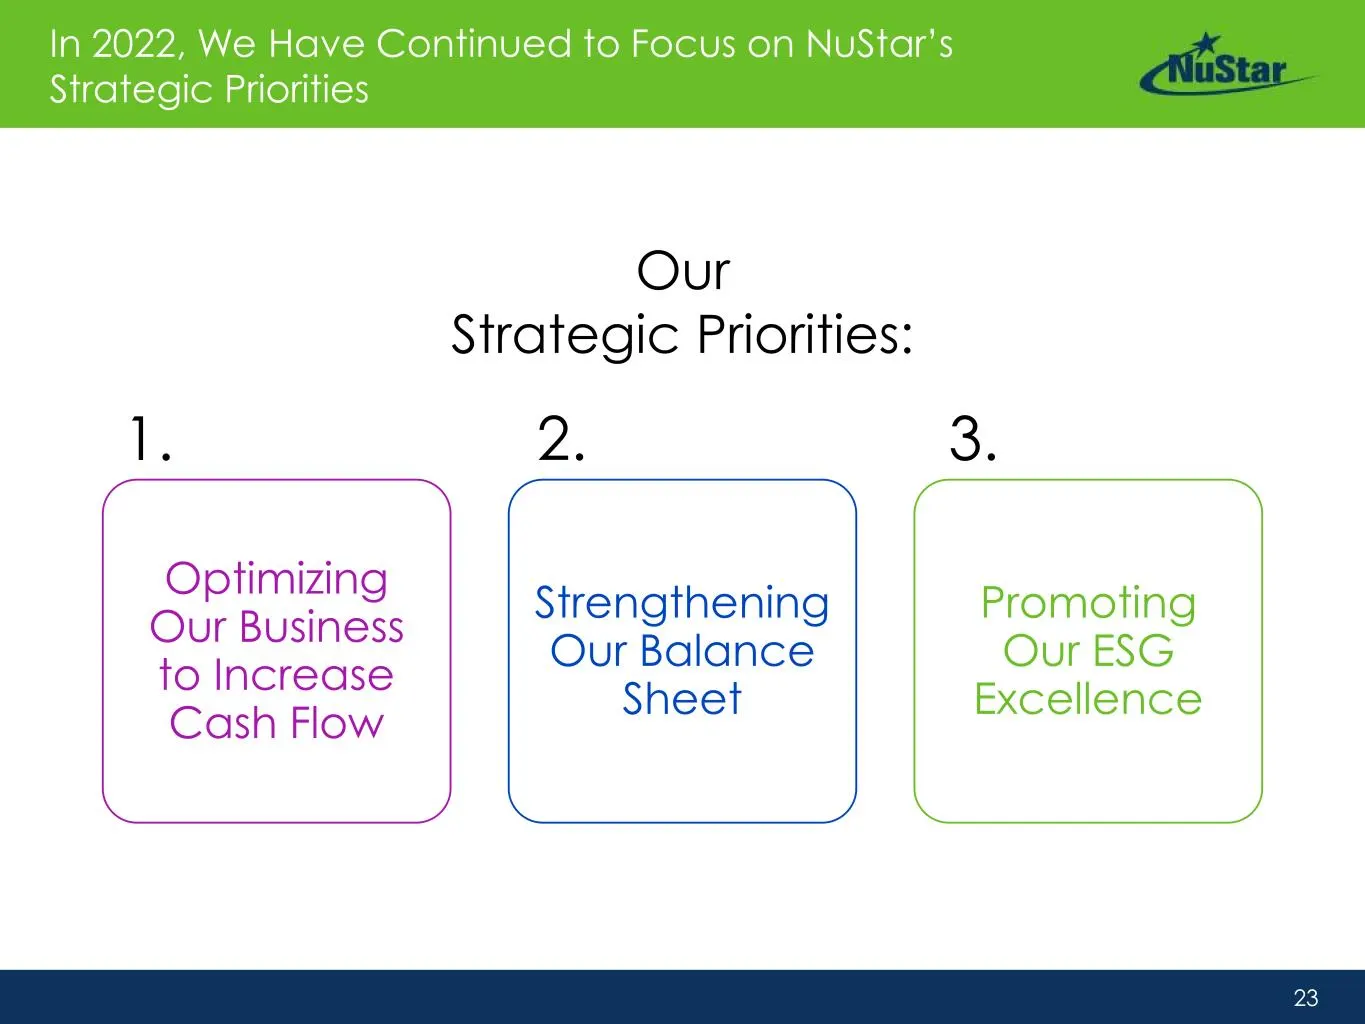
23 In 2022, We Have Continued to Focus on NuStar’s Strategic Priorities Optimizing Our Business to Increase Cash Flow Strengthening Our Balance Sheet Promoting Our ESG Excellence Our Strategic Priorities: 1. 2. 3.
Slide 24: Appendix
Appendix <ifistar_ Big Springs, TX
Slide 25: NuStar By-the-numbers
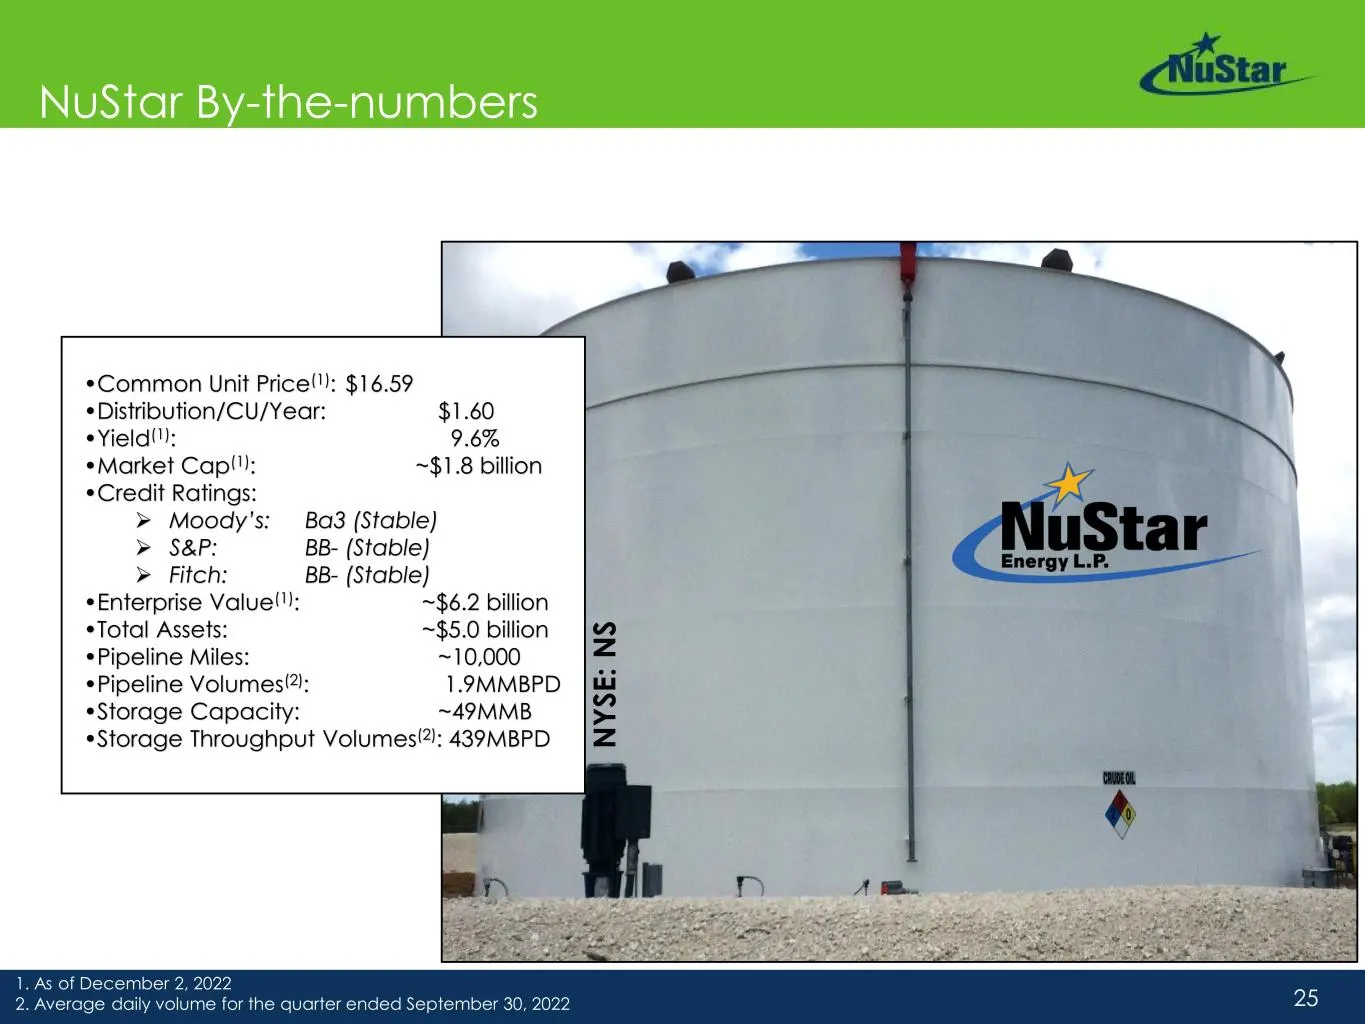
25 NuStar By-the-numbers N Y S E : N S •Common Unit Price(1): $16.59 •Distribution/CU/Year: $1.60 •Yield(1): 9.6% •Market Cap(1): ~$1.8 billion •Credit Ratings: ➢ Moody’s: Ba3 (Stable) ➢ S&P: BB- (Stable) ➢ Fitch: BB- (Stable) •Enterprise Value(1): ~$6.2 billion •Total Assets: ~$5.0 billion •Pipelin
Slide 26: NuStar Sustainability Highlights
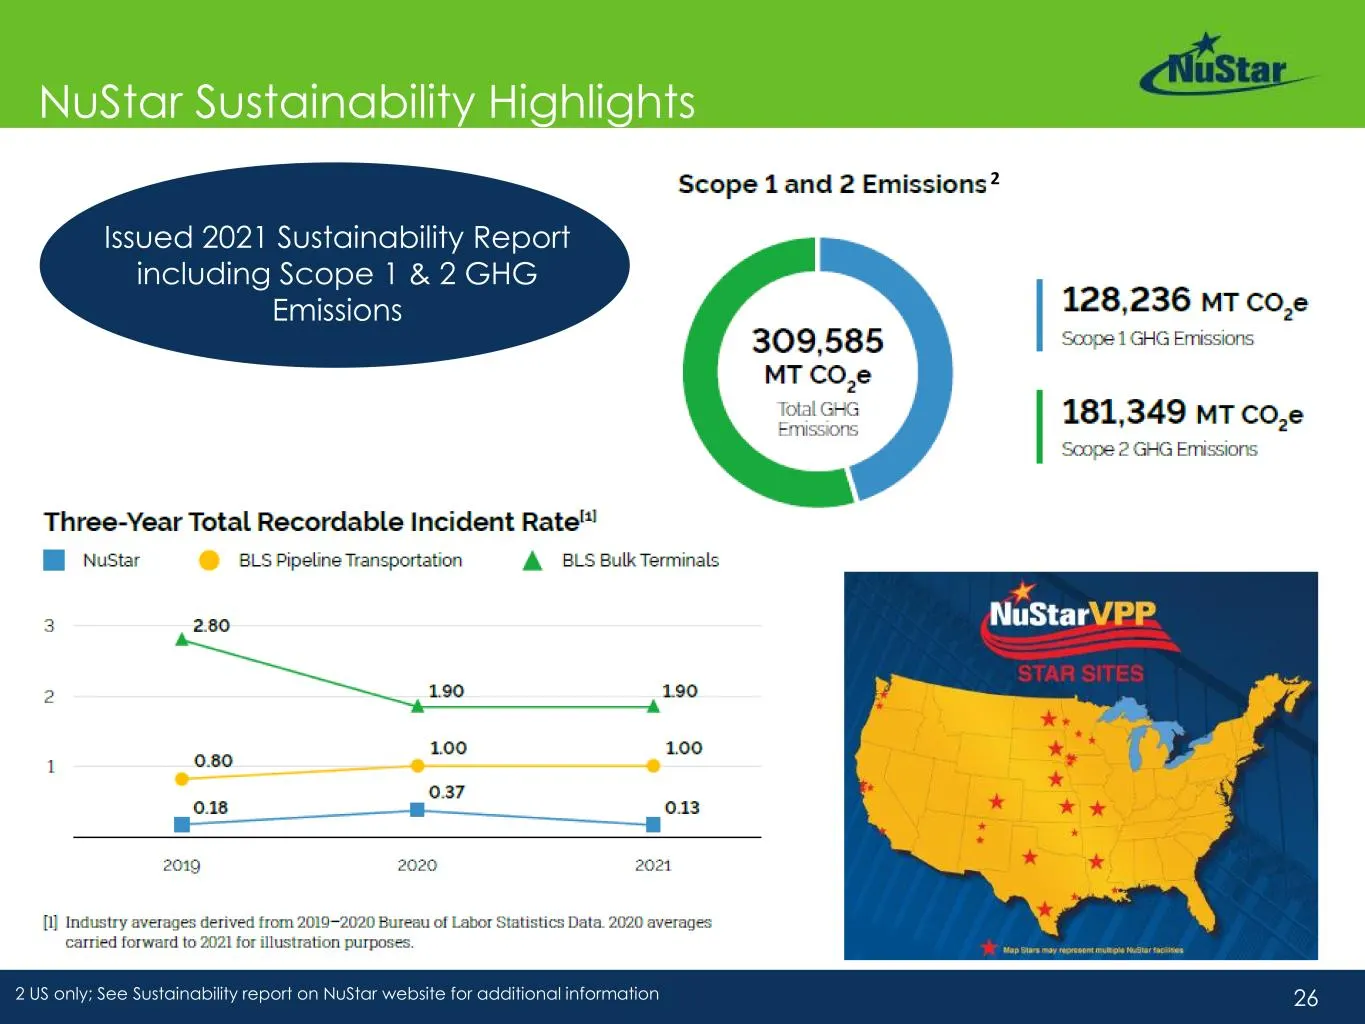
26 NuStar Sustainability Highlights Issued 2021 Sustainability Report including Scope 1 & 2 GHG Emissions 2 US only; See Sustainability report on NuStar website for additional information 2
Slide 27: Long-term Commitments From Creditworthy Customers
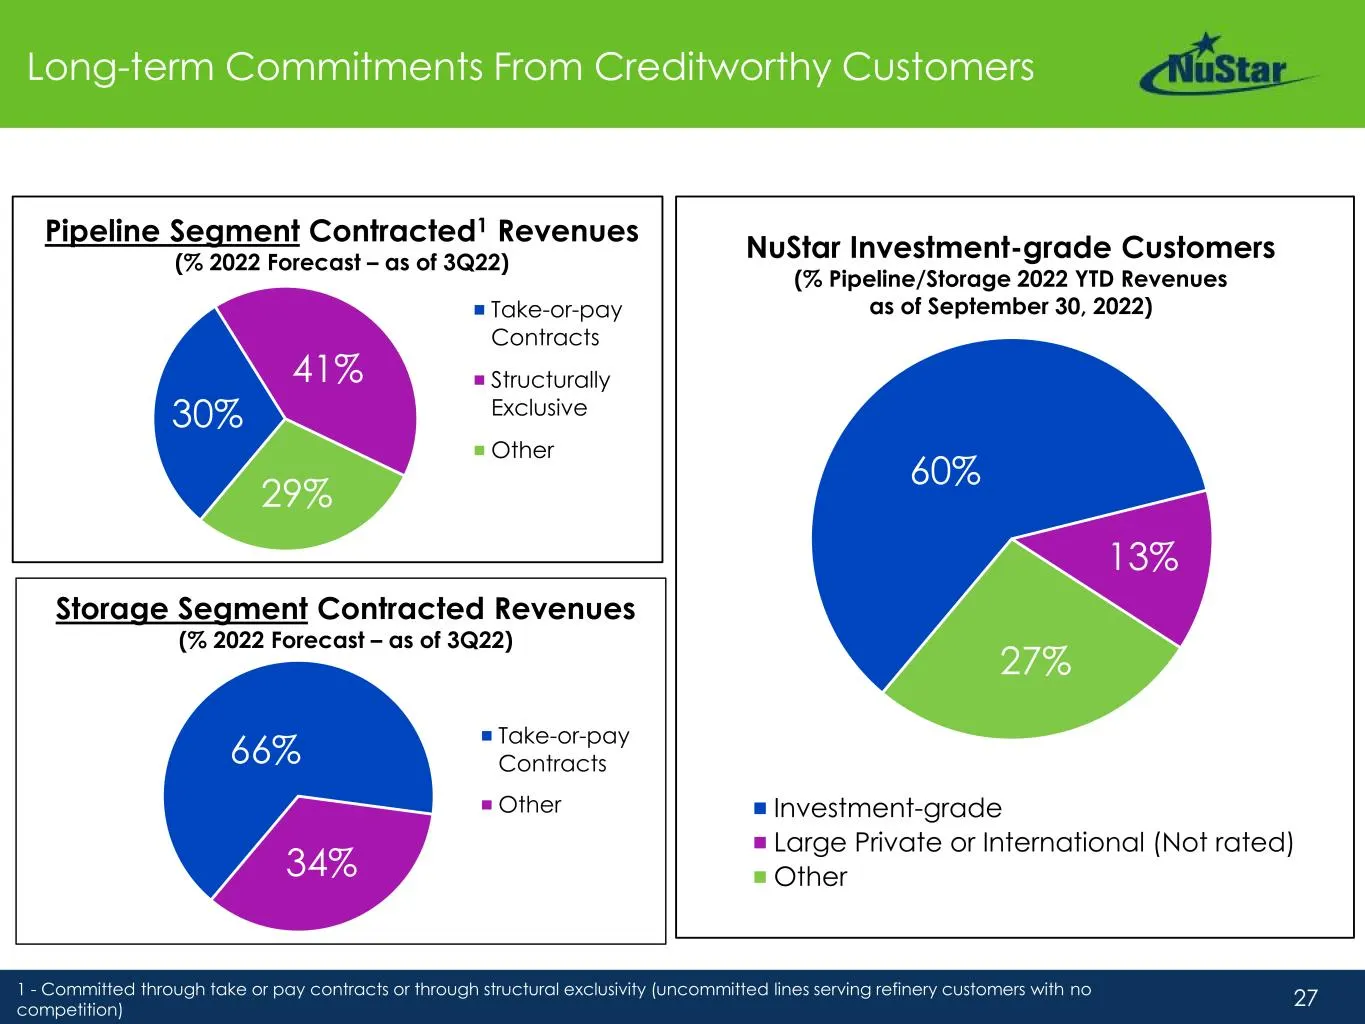
27 Long-term Commitments From Creditworthy Customers 60% 13% 27% Investment-grade Large Private or International (Not rated) Other NuStar Investment-grade Customers (% Pipeline/Storage 2022 YTD Revenues as of September 30, 2022) 30% 41% 29% Take-or-pay Contracts Structurally Exclusive Other Pipeline
Slide 28: Liquidity and Debt Maturity Schedule
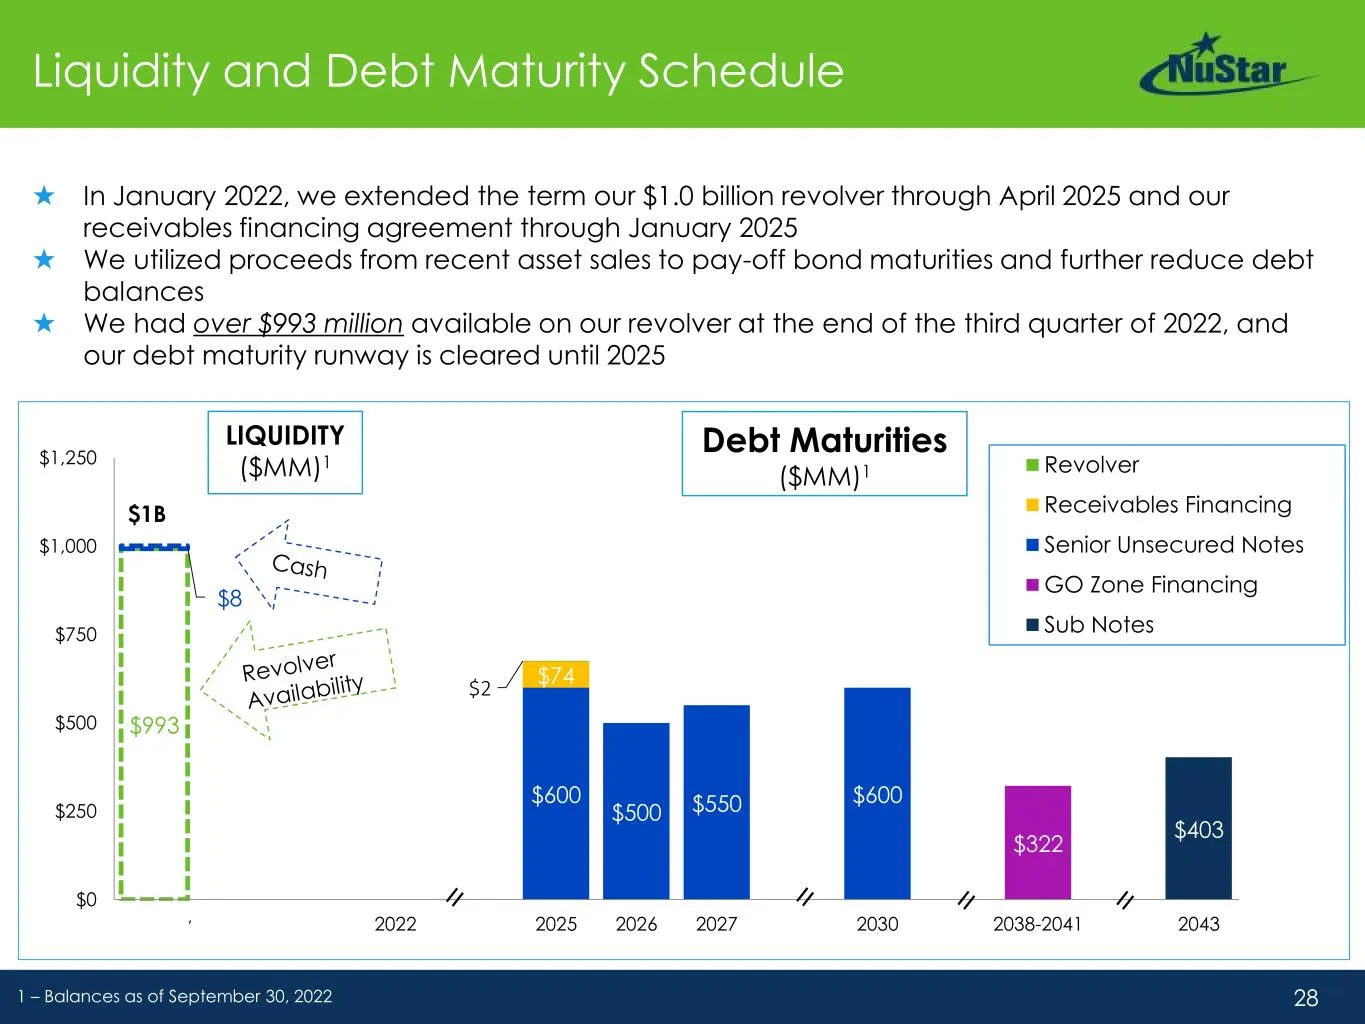
28 $993 $403 $322 $600 $500 $550 $600 $74 $2 $8 $0 $250 $500 $750 $1,000 $1,250 Liquidity 2022 2023-2024 2025 2026 2027 2028-2029 2030 2038-2041 2043 Revolver Receivables Financing Senior Unsecured Notes GO Zone Financing Sub Notes $1B LIQUIDITY ($MM)1 Liquidity and Debt Maturity Schedule ★ In Janua
Slide 29: Capital Structure as of September 30, 2022
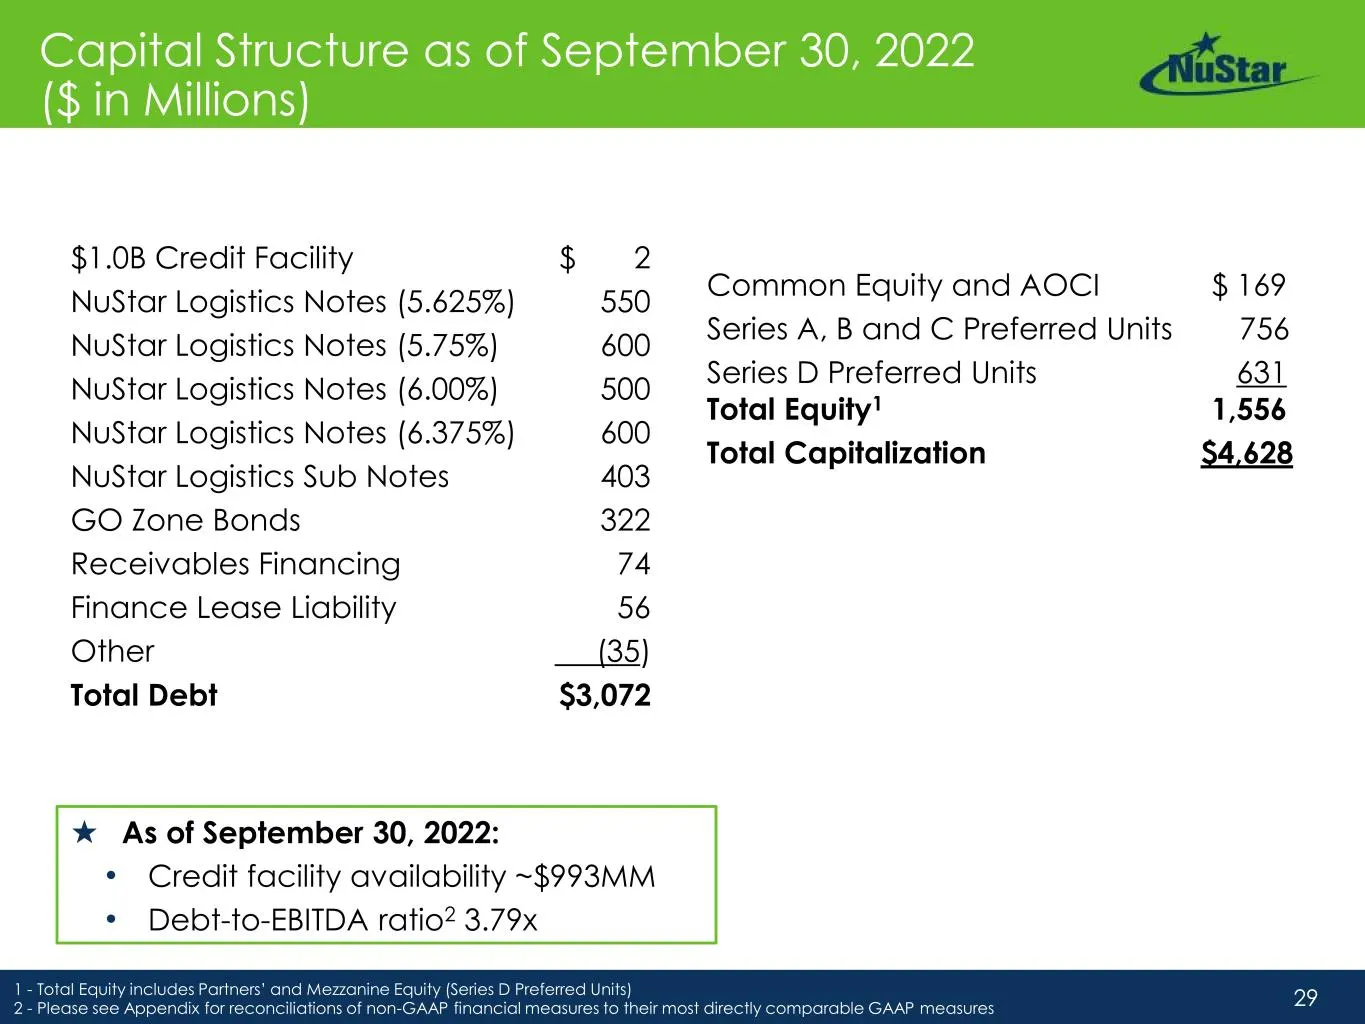
29 Capital Structure as of September 30, 2022 ($ in Millions) $1.0B Credit Facility $ 2 NuStar Logistics Notes (5.625%) 550 NuStar Logistics Notes (5.75%) 600 NuStar Logistics Notes (6.00%) 500 NuStar Logistics Notes (6.375%) 600 NuStar Logistics Sub Notes 403 GO Zone Bonds 322 Receivables Financing
Slide 30: Reconciliation of Non-GAAP Financial Information
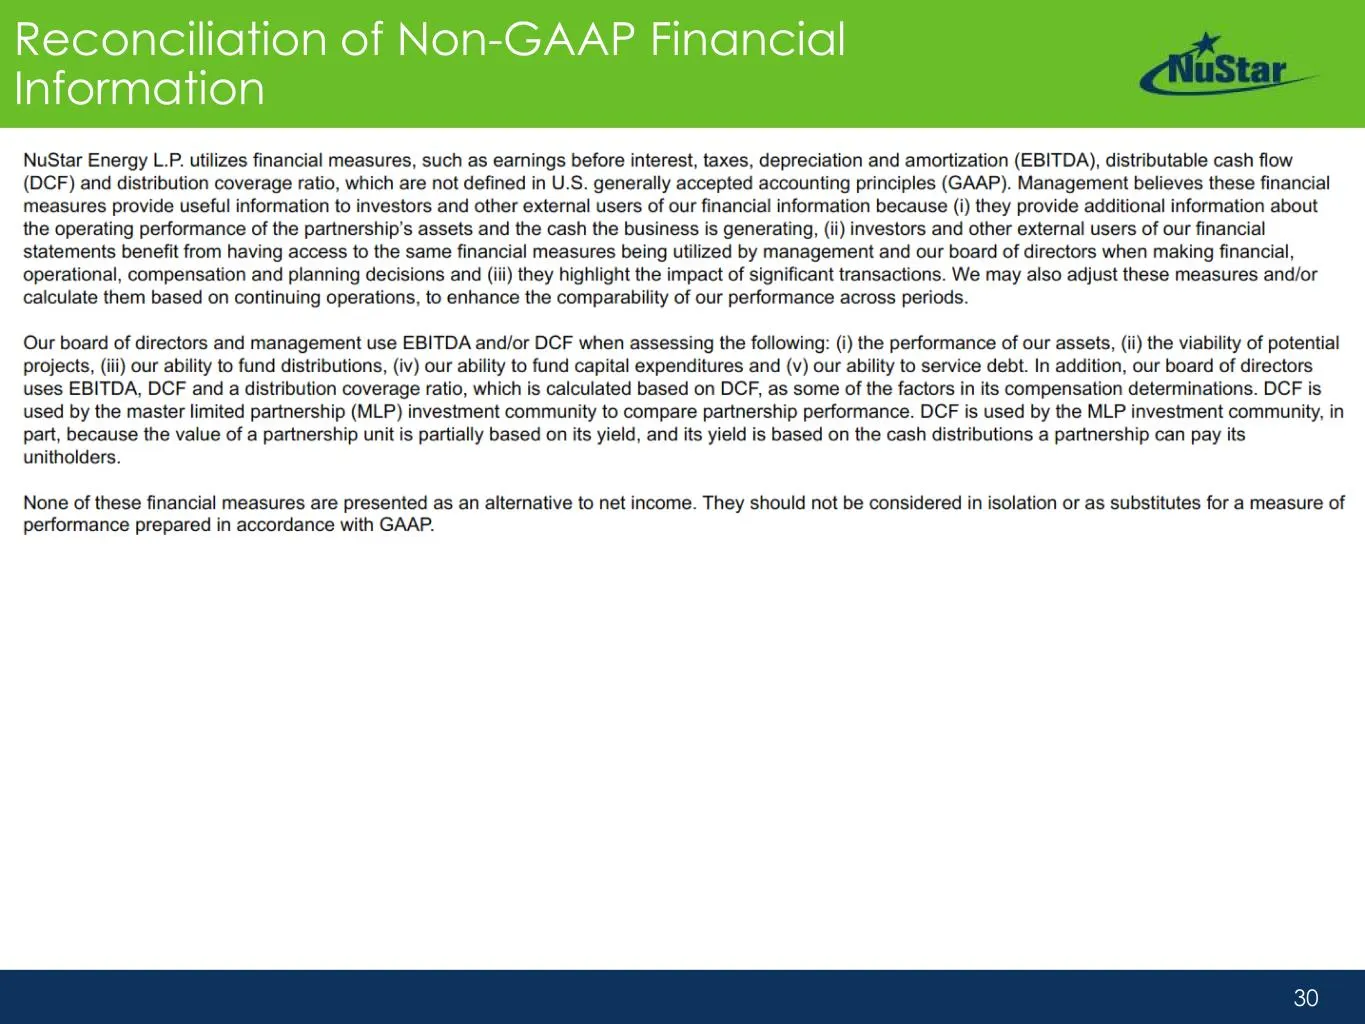
30 Reconciliation of Non-GAAP Financial Information
Slide 31: Reconciliation of Non-GAAP Financial Information (continued)
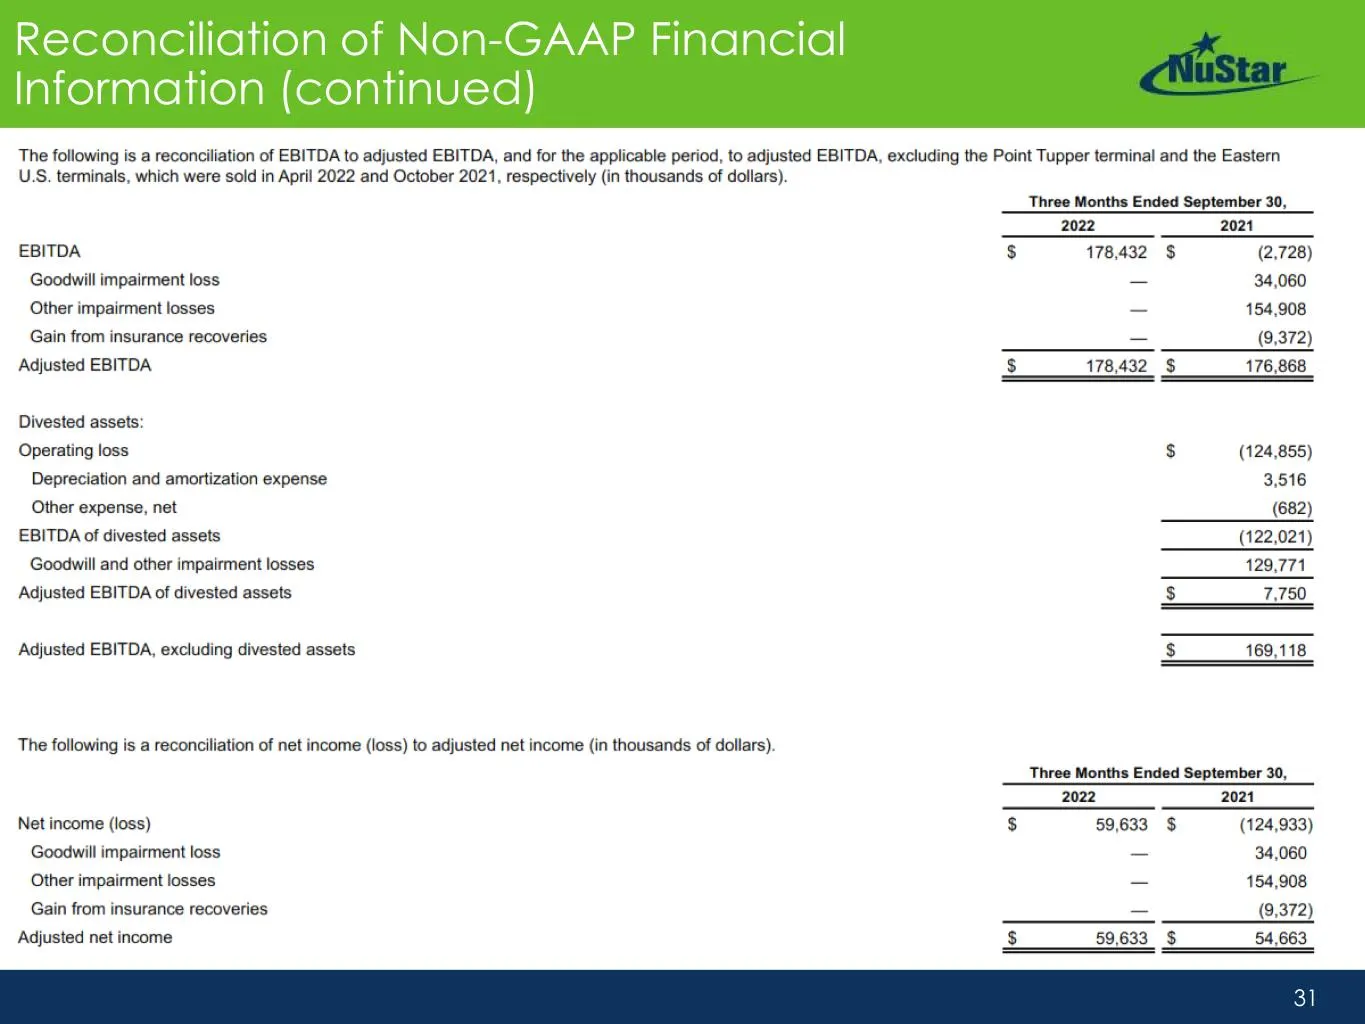
31 Reconciliation of Non-GAAP Financial Information (continued)
Slide 32: Reconciliation of Non-GAAP Financial Information (continued)
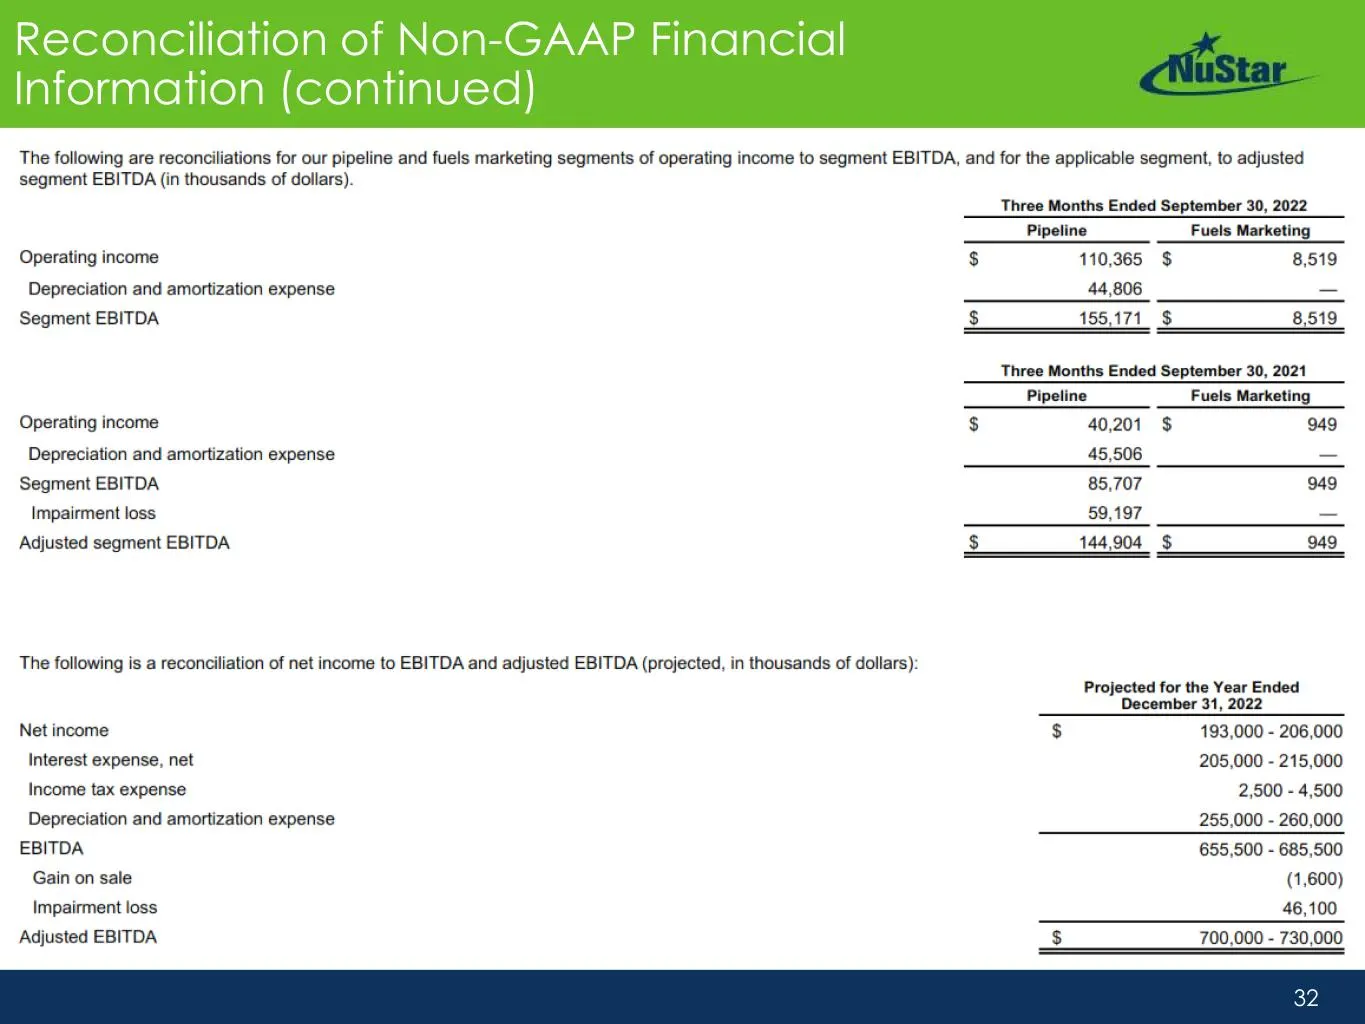
32 Reconciliation of Non-GAAP Financial Information (continued)
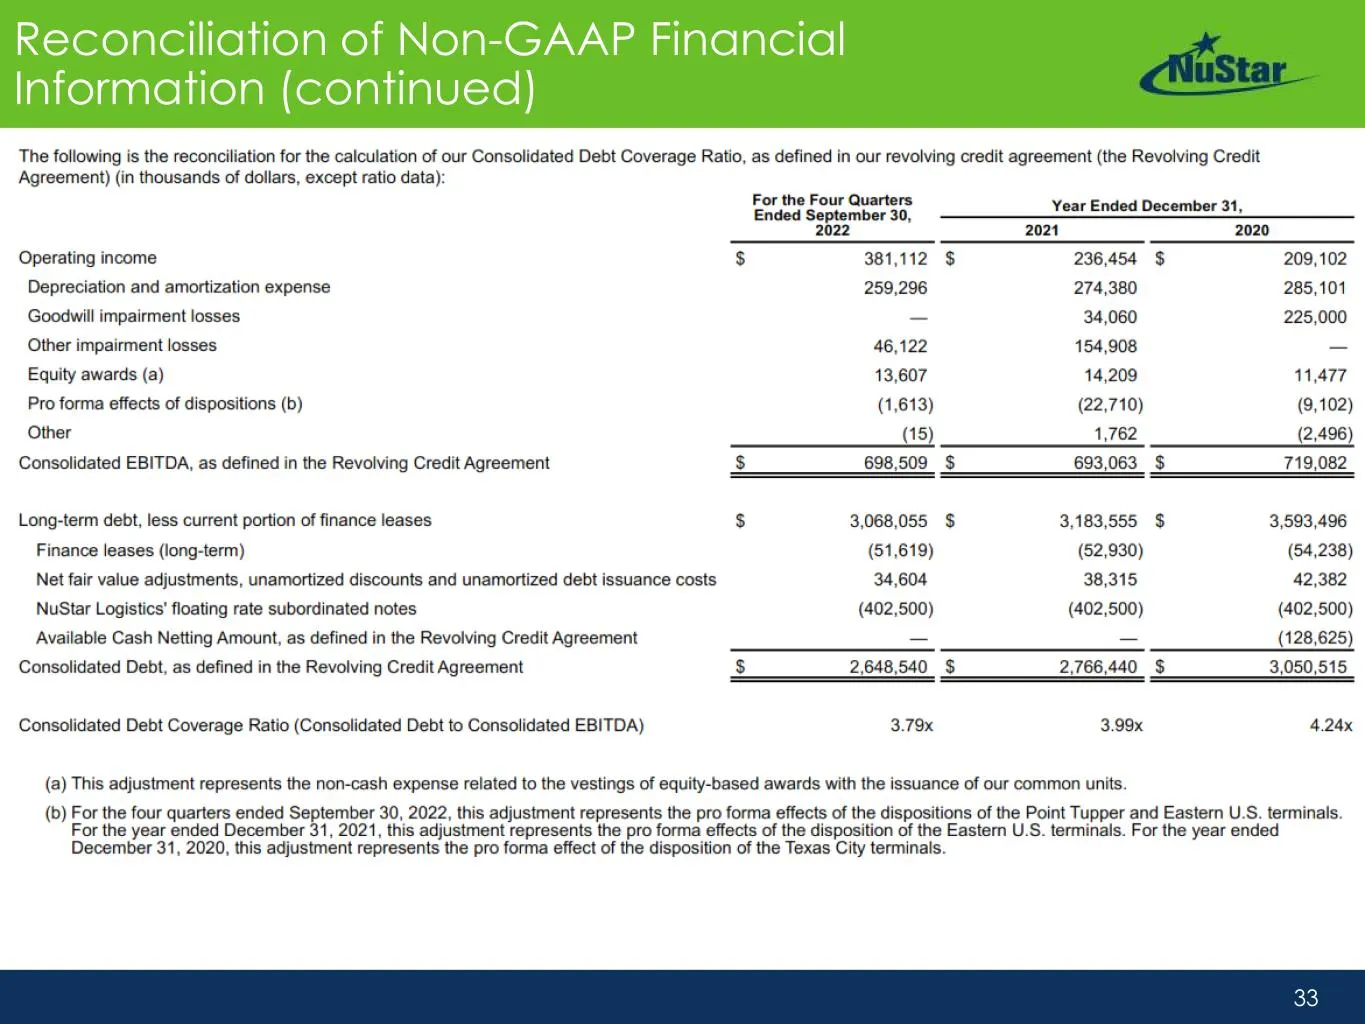
Slide 33: Reconciliation of Non-GAAP Financial Information (continued)
33 Reconciliation of Non-GAAP Financial Information (continued)
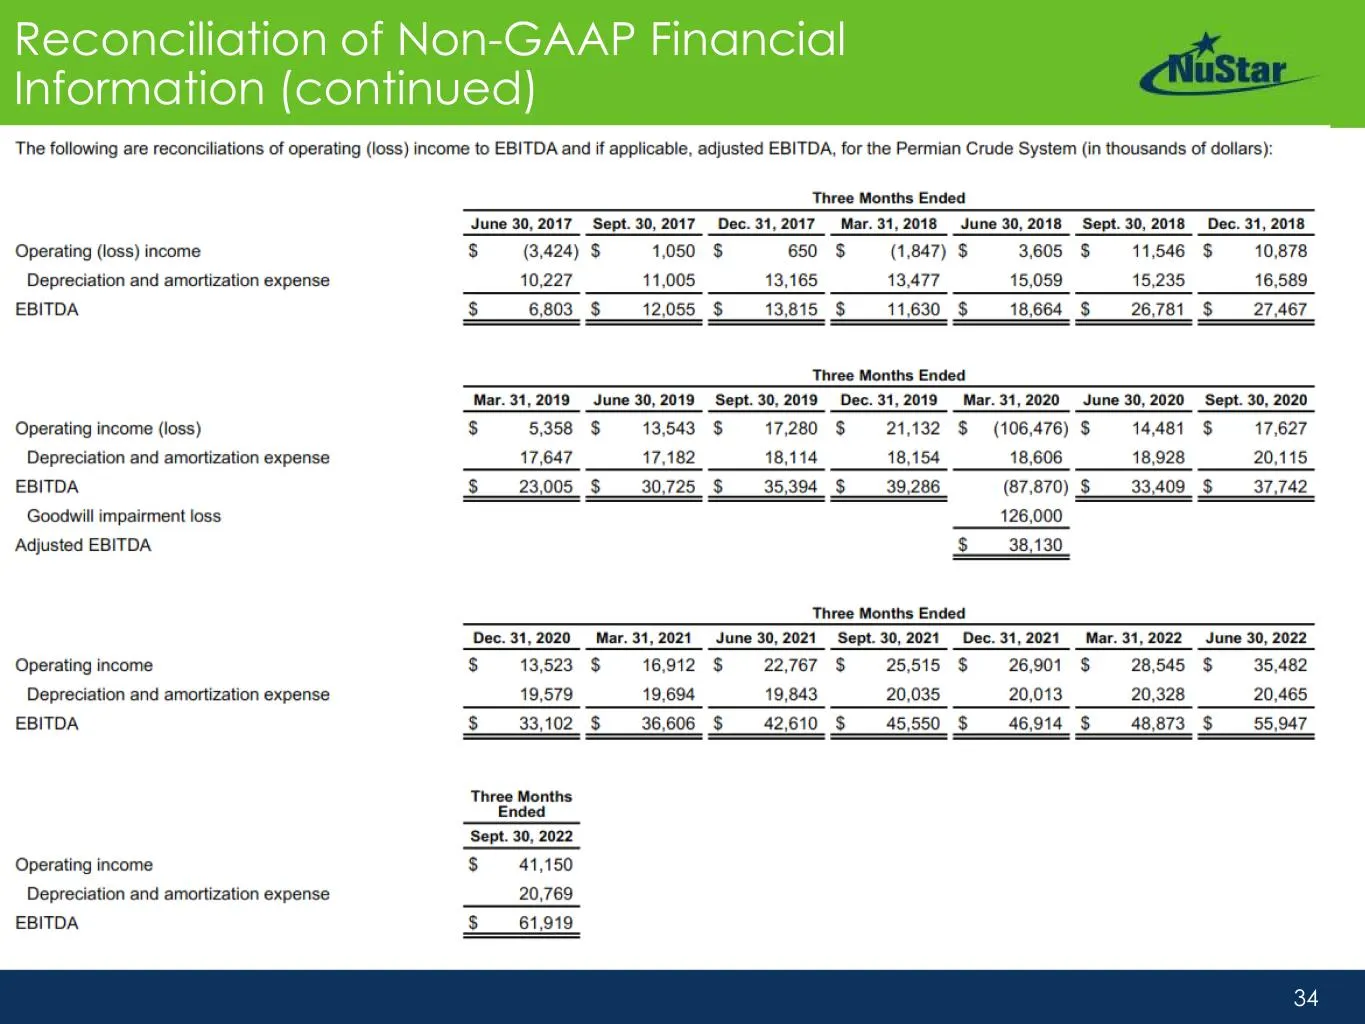
Slide 34: Reconciliation of Non-GAAP Financial Information (continued)
34 Reconciliation of Non-GAAP Financial Information (continued)
Slide 35: NuStar Contact Information
35 NuStar Contact Information INVESTOR RELATIONS And for additional information about corporate sustainability at NuStar, visit https://sustainability.nustarenergy.com/ SUSTAINABILITY (210) 918-INVR (4687) InvestorRelations@NuStarEnergy.com Sustainability@NuStarEnergy.com
Source: SEC EDGAR · 8-K filed Dec 7, 2022
More decks from NuStar Energy LP
 Merger or Acquisition (January 2024)14 slides · Jan 22, 2024
 Investor Presentation (December 2023)35 slides · Dec 5, 2023
 Raymond James Virtual Energy Supply Chain Conference 2023; Pickering Energy Partners TE&MF36 slides · Sep 19, 2023
 Barclays CEO Energy-Power Conference 202336 slides · Sep 6, 2023
 Citi One-on-One Midstream/Energy Infrastructure Conference 202336 slides · Aug 22, 2023
 8th Annual J.P. Morgan Energy, Power & Renewables Conference 202336 slides · Jun 21, 2023