Waste Services — Credit Suisse Engineering & Environmental Services Conference 2007
29 slides from Waste Services's conference presentation, Jun 7, 2007
Slide 1: Waste Services, Inc. Credit Suisse Engineering & Environmental Services Conference
Waste Services, Inc. Credit Suisse Engineering & Environmental Services Conference June 7, 2007 Setting the Standard In Waste Collection Disposal Recycling
Slide 2: Safe Harbor for Forward-Looking Statements
Safe Harbor for Forward-Looking Statements Certain matters discussed in this presentation are "forward-looking statements" within the meaning of Section 27A of the Securities Act of 1933 and Section 21E of the Securities Exchange Act of 1934. These statements describe the company's future plans, obj
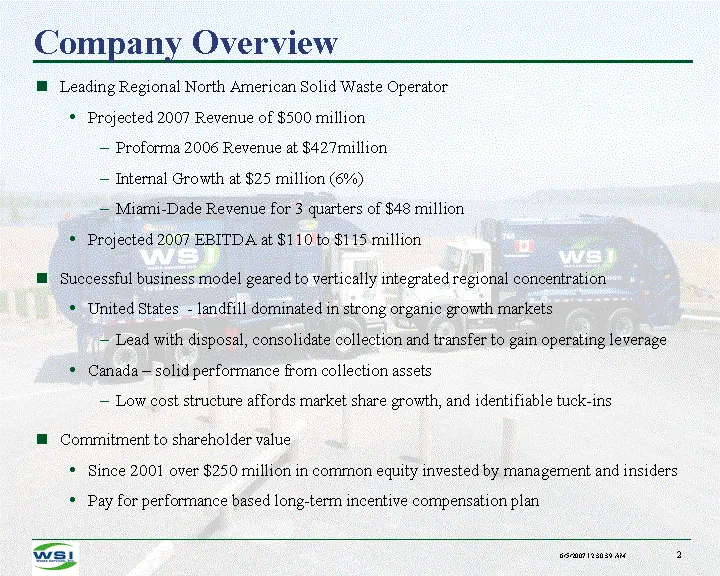
Slide 3: Company Overview
Company Overview Leading Regional North American Solid Waste Operator Projected 2007 Revenue of $500 million Proforma 2006 Revenue at $427million Internal Growth at $25 million (6%) Miami-Dade Revenue for 3 quarters of $48 million Projected 2007 EBITDA at $110 to $115 million Successful business mod
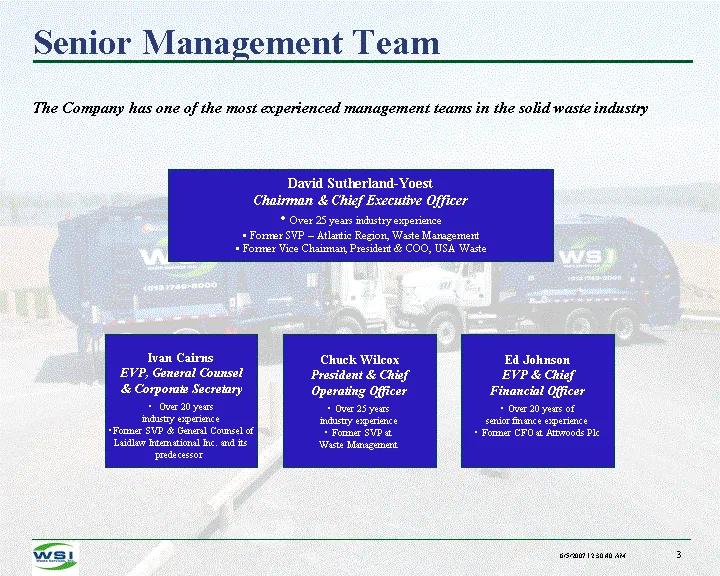
Slide 4: Senior Management Team
Senior Management Team The Company has one of the most experienced management teams in the solid waste industry David Sutherland-Yoest Chairman & Chief Executive Officer Over 25 years industry experience Former SVP - Atlantic Region, Waste Management Former Vice Chairman, President & COO, USA Waste
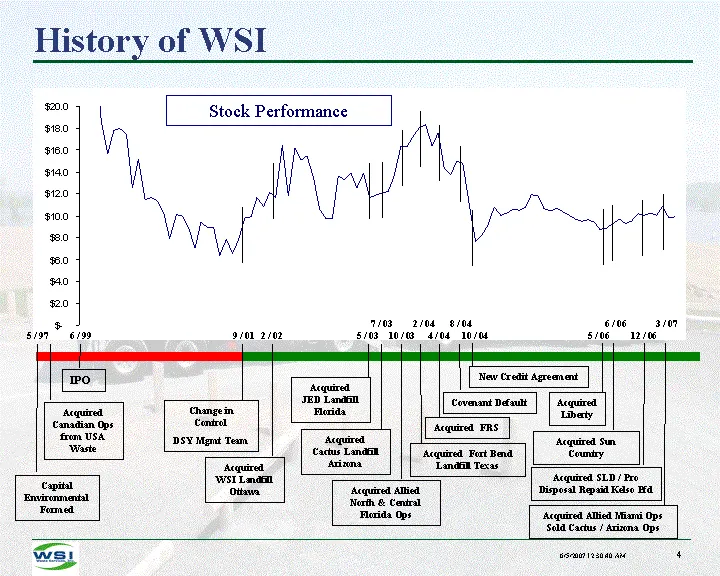
Slide 5: History of WSI Stock Performance
History of WSI Stock Performance Capital Environmental Formed 5 / 97 Acquired Canadian Ops from USA Waste 6 / 99 IPO Change in Control DSY Mgmt Team 9 / 01 Acquired WSI Landfill Ottawa Acquired JED Landfill Florida Acquired Cactus Landfill Arizona Acquired Fort Bend Landfill Texas 2 / 02 5 / 03 7 /
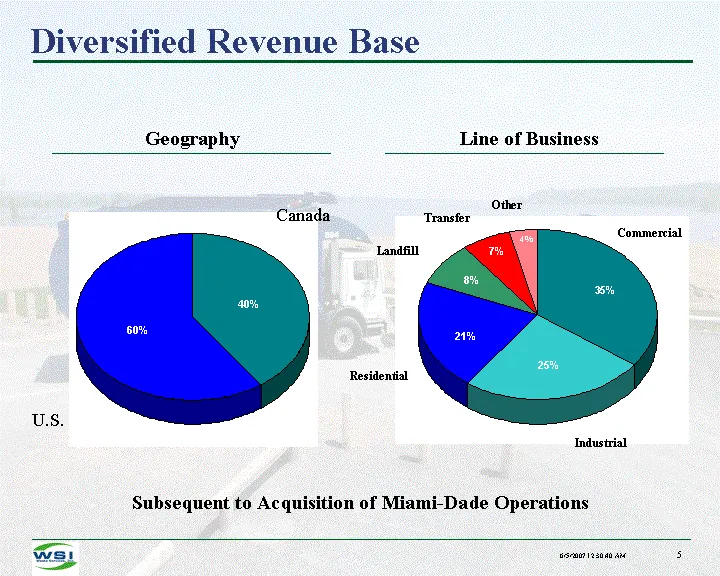
Slide 6: Diversified Revenue Base
Diversified Revenue Base Geography Line of Business Subsequent to Acquisition of Miami-Dade Operations Canada U.S. Commercial Landfill Residential Industrial Transfer Other
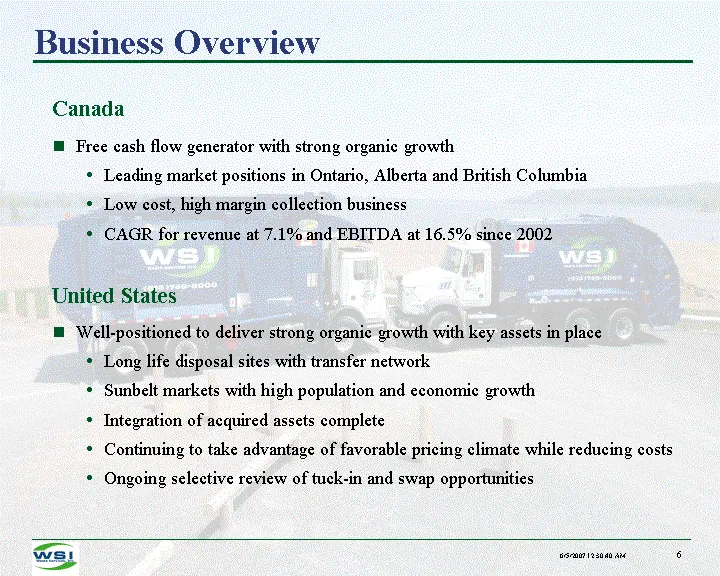
Slide 7: Business Overview
Business Overview Canada Free cash flow generator with strong organic growth Leading market positions in Ontario, Alberta and British Columbia Low cost, high margin collection business CAGR for revenue at 7.1% and EBITDA at 16.5% since 2002 United States Well-positioned to deliver strong organic gro
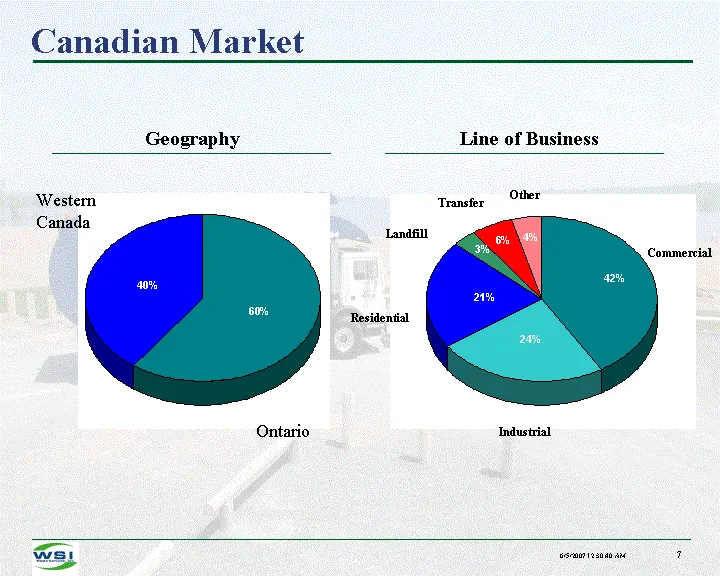
Slide 8: Canadian Market
Canadian Market Geography Line of Business Western Canada Ontario Commercial Landfill Residential Industrial Transfer Other
Slide 9: Canadian Strategy
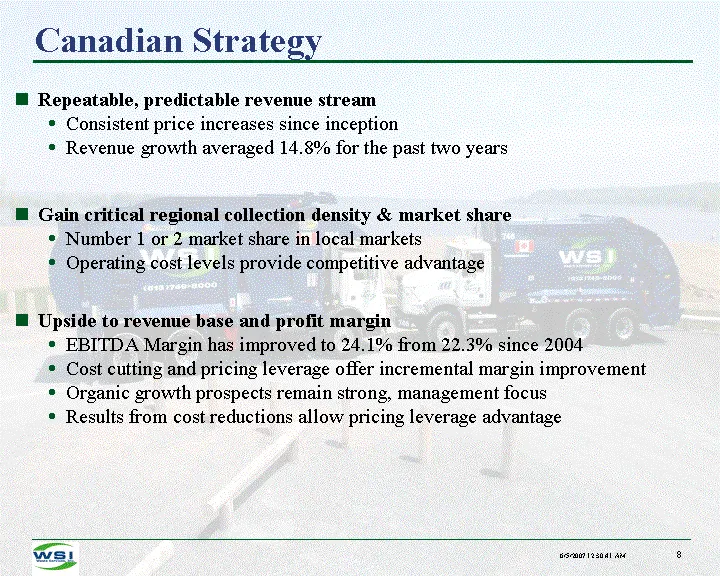
Canadian Strategy Repeatable, predictable revenue stream Consistent price increases since inception Revenue growth averaged 14.8% for the past two years Gain critical regional collection density & market share Number 1 or 2 market share in local markets Operating cost levels provide competitive adva
Slide 10: Canada Operations - Eastern Canada
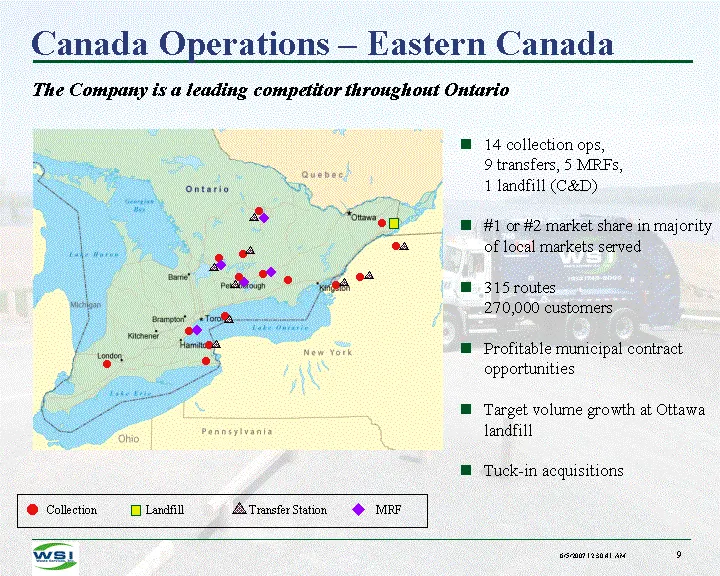
Canada Operations - Eastern Canada 14 collection ops, 9 transfers, 5 MRFs, 1 landfill (C&D) #1 or #2 market share in majority of local markets served 315 routes 270,000 customers Profitable municipal contract opportunities Target volume growth at Ottawa landfill Tuck-in acquisitions Collection Trans
Slide 11: Canada Operations - Western Canada
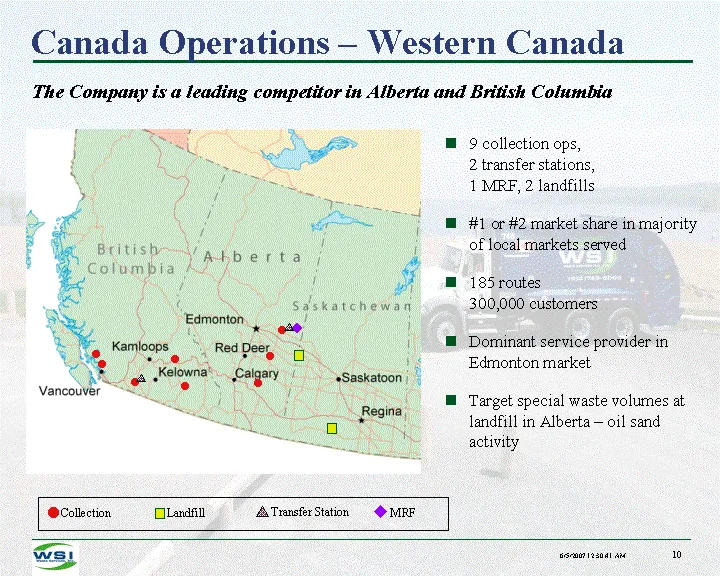
Canada Operations - Western Canada The Company is a leading competitor in Alberta and British Columbia Collection Transfer Station Landfill ? MRF ? ? ? ? ? ? ? ? ? ? 9 collection ops, 2 transfer stations, 1 MRF, 2 landfills #1 or #2 market share in majority of local markets served 185 routes 300,000
Slide 12: United States Market
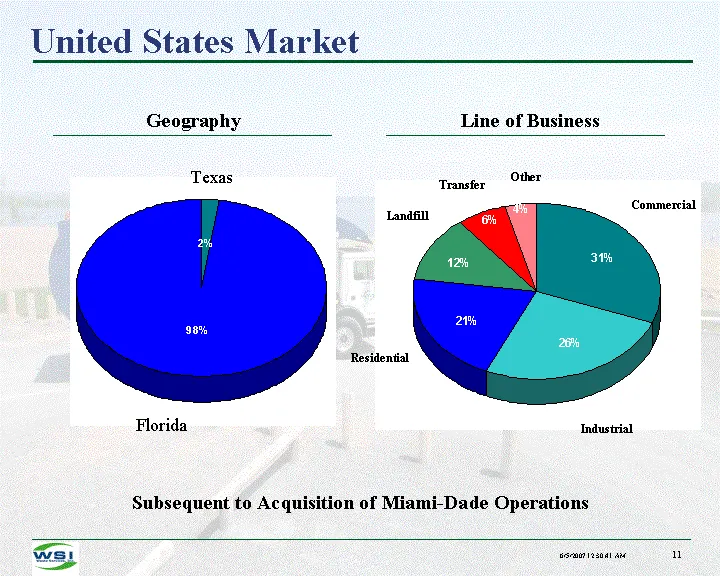
United States Market Geography Line of Business Subsequent to Acquisition of Miami-Dade Operations Texas Florida Commercial Landfill Residential Industrial Transfer Other
Slide 13: United States Strategy
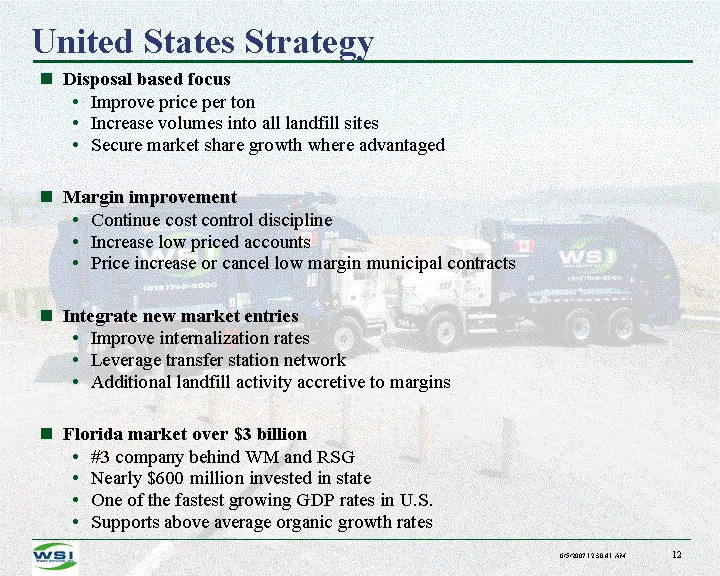
United States Strategy Disposal based focus Improve price per ton Increase volumes into all landfill sites Secure market share growth where advantaged Margin improvement Continue cost control discipline Increase low priced accounts Price increase or cancel low margin municipal contracts Integrate ne
Slide 14: Florida Operations
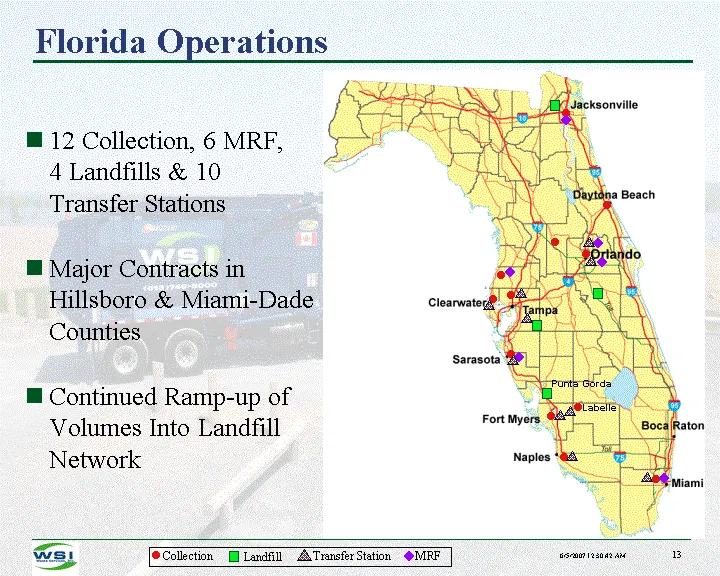
Florida Operations Transfer Station MRF ? ? Collection Landfill ? ? ? ? ? ? ? ? ? ? ? ? ? ? ? ? ? ? 12 Collection, 6 MRF, 4 Landfills & 10 Transfer Stations Major Contracts in Hillsboro & Miami-Dade Counties Continued Ramp-up of Volumes Into Landfill Network Punta Gorda Labelle
Slide 15: North Florida Operations
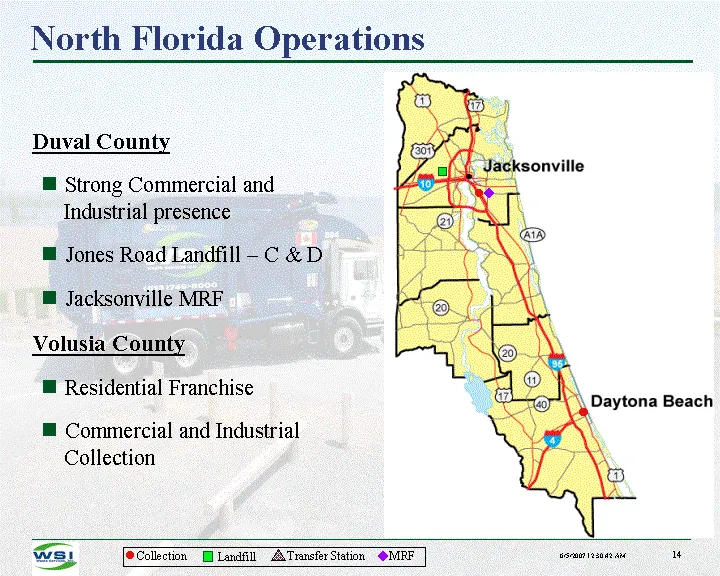
North Florida Operations Transfer Station Landfill ? ? Collection Duval County Strong Commercial and Industrial presence Jones Road Landfill - C & D Jacksonville MRF Volusia County Residential Franchise Commercial and Industrial Collection ? ? ? MRF
Slide 16: Central Florida Operations
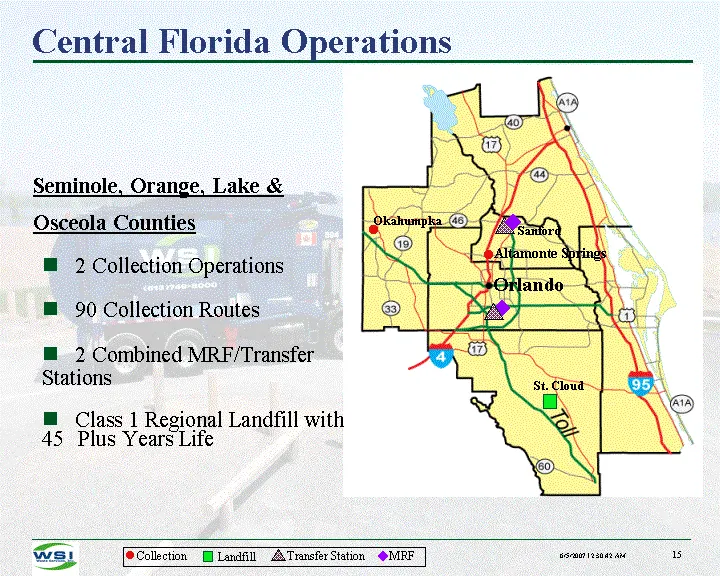
Central Florida Operations Seminole, Orange, Lake & Osceola Counties 2 Collection Operations 90 Collection Routes 2 Combined MRF/Transfer Stations Class 1 Regional Landfill with 45 Plus Years Life Transfer Station Landfill ? ? Collection MRF ? ? ? ? Sanford Altamonte Springs Okahumpka St. Cloud Orla
Slide 17: Florida Gulf Operations
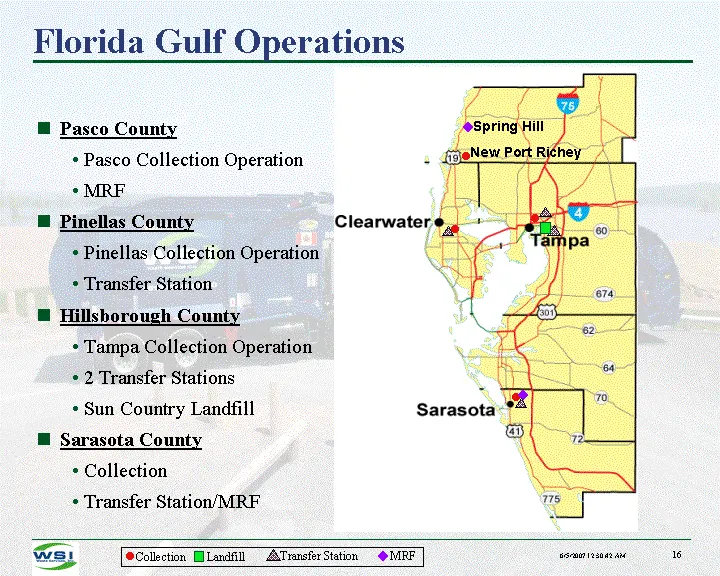
Florida Gulf Operations ? ? ? ? ? Transfer Station Landfill MRF ? Collection ? Pasco County Pasco Collection Operation MRF Pinellas County Pinellas Collection Operation Transfer Station Hillsborough County Tampa Collection Operation 2 Transfer Stations Sun Country Landfill Sarasota County Collection
Slide 18: South Florida Operations
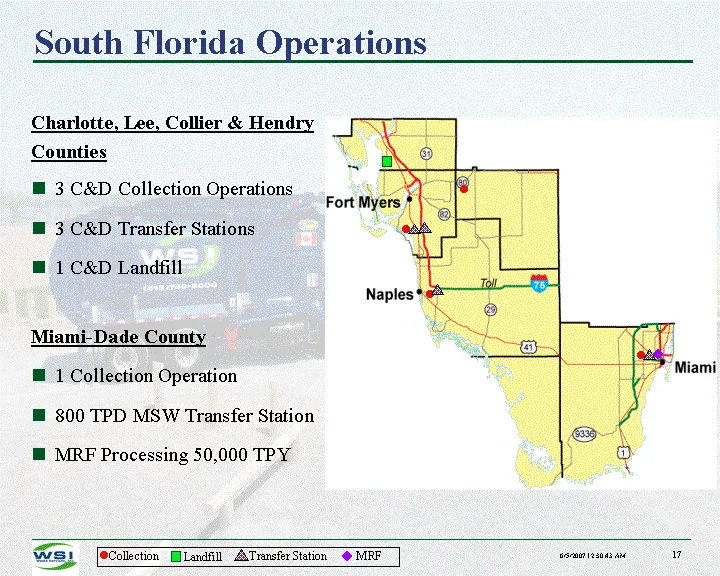
South Florida Operations Transfer Station Landfill MRF ? ? Collection Charlotte, Lee, Collier & Hendry Counties 3 C&D Collection Operations 3 C&D Transfer Stations 1 C&D Landfill Miami-Dade County 1 Collection Operation 800 TPD MSW Transfer Station MRF Processing 50,000 TPY ? ? ? ? ?
Slide 19: Operating Initiatives
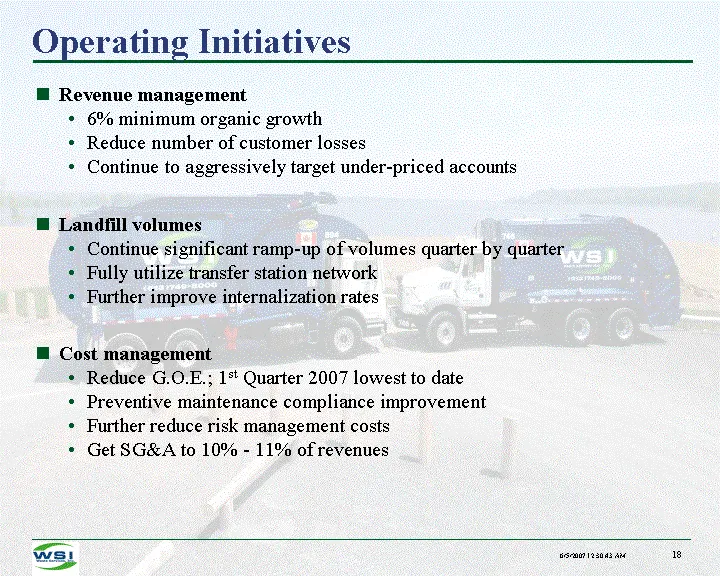
Operating Initiatives Revenue management 6% minimum organic growth Reduce number of customer losses Continue to aggressively target under-priced accounts Landfill volumes Continue significant ramp-up of volumes quarter by quarter Fully utilize transfer station network Further improve internalization
Slide 20: Key Operating Trends: Strong Price Increase Results
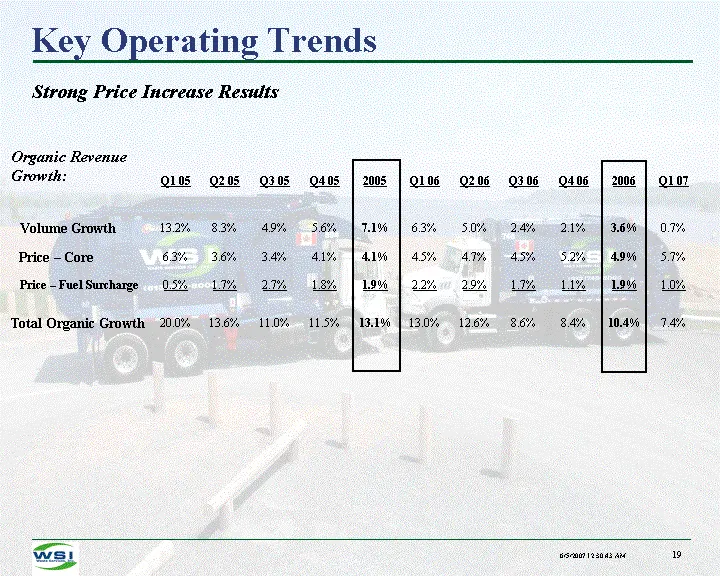
Key Operating Trends Strong Price Increase Results Organic Revenue Growth: Q1 05 Q2 05 Q3 05 Q4 05 2005 Q1 06 Q2 06 Q3 06 Q4 06 2006 Q1 07 Volume Growth 13.2% 8.3% 4.9% 5.6% 7.1% 6.3% 5.0% 2.4% 2.1% 3.6% 0.7% Price - Core 6.3% 3.6% 3.4% 4.1% 4.1% 4.5% 4.7% 4.5% 5.2% 4.9% 5.7% Price - Fuel Surcharge
Slide 21: Key Operating Trends: Consistent Improvement in Performance
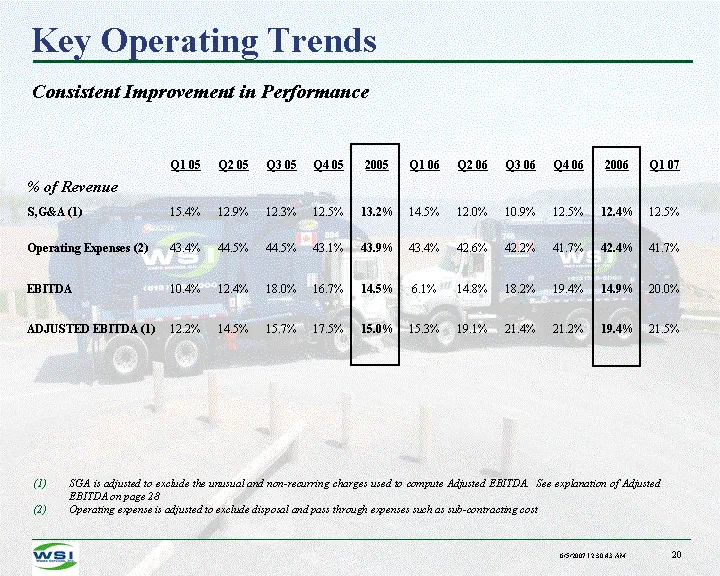
Key Operating Trends Consistent Improvement in Performance Q1 05 Q2 05 Q3 05 Q4 05 2005 Q1 06 Q2 06 Q3 06 Q4 06 2006 Q1 07 % of Revenue S,G&A (1) 15.4% 12.9% 12.3% 12.5% 13.2% 14.5% 12.0% 10.9% 12.5% 12.4% 12.5% Operating Expenses (2) 43.4% 44.5% 44.5% 43.1% 43.9% 43.4% 42.6% 42.2% 41.7% 42.4% 41.7%
Slide 22: Finance
FINANCE
Slide 23: Financial Summary
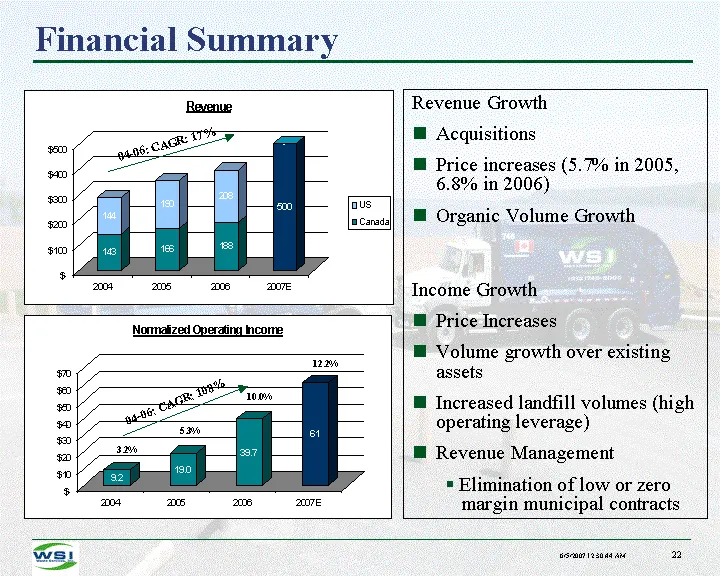
Financial Summary 04-06: CAGR: 17% 04-06: CAGR: 108% Revenue Growth Acquisitions Price increases (5.7% in 2005, 6.8% in 2006) Organic Volume Growth Income Growth Price Increases Volume growth over existing assets Increased landfill volumes (high operating leverage) Revenue Management Elimination of
Slide 24: Road Map to Profits
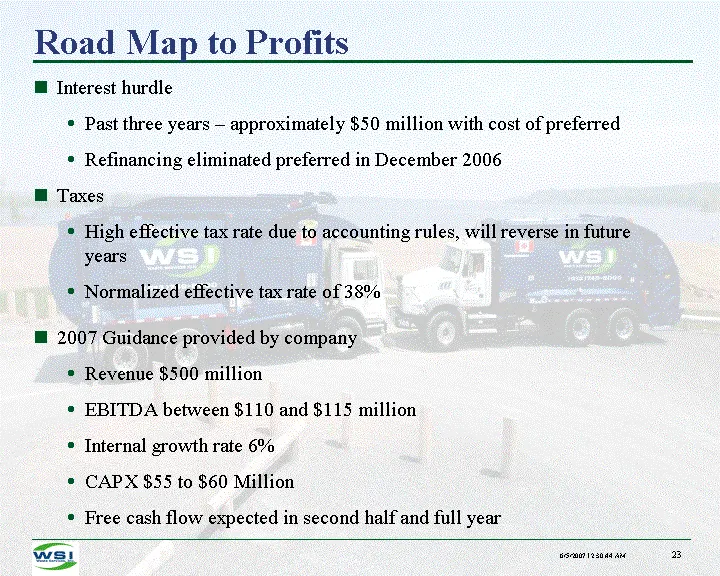
Road Map to Profits Interest hurdle Past three years - approximately $50 million with cost of preferred Refinancing eliminated preferred in December 2006 Taxes High effective tax rate due to accounting rules, will reverse in future years Normalized effective tax rate of 38% 2007 Guidance provided by
Slide 25: LTM Financial Summary
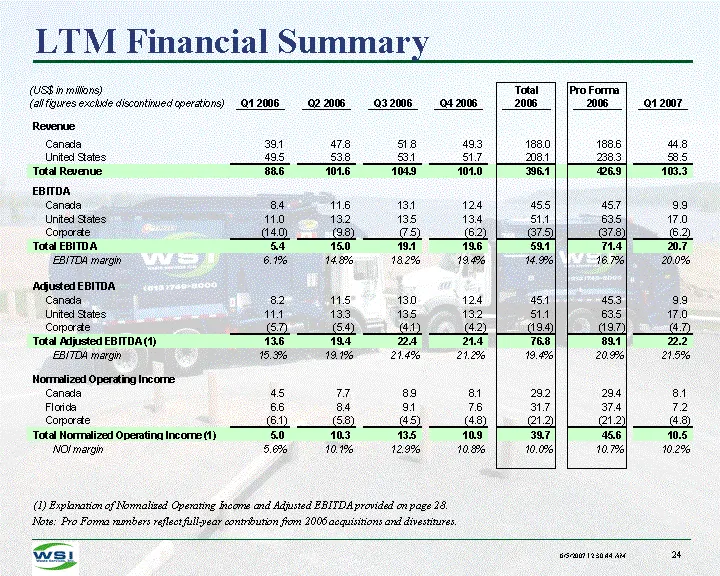
LTM Financial Summary (1) Explanation of Normalized Operating Income and Adjusted EBITDA provided on page 28. Note: Pro Forma numbers reflect full-year contribution from 2006 acquisitions and divestitures.
Slide 26: Capitalization and Credit Statistics
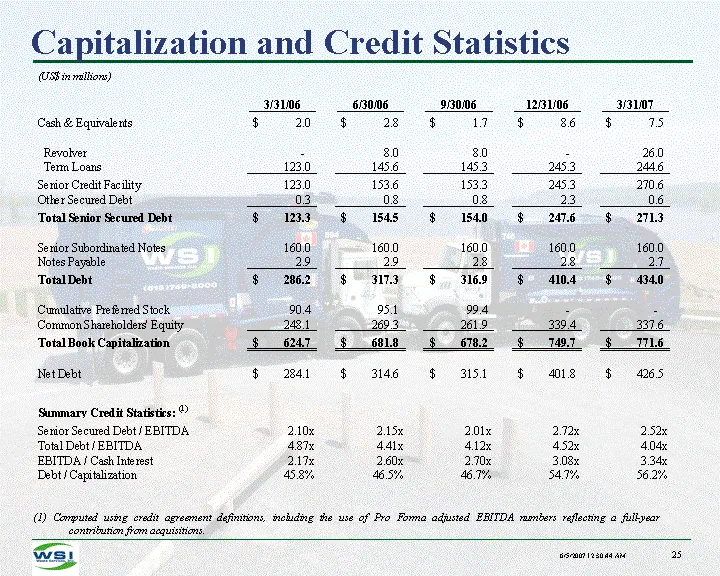
Capitalization and Credit Statistics (1) Computed using credit agreement definitions, including the use of Pro Forma adjusted EBITDA numbers reflecting a full-year contribution from acquisitions.
Slide 27: Key Investment Themes
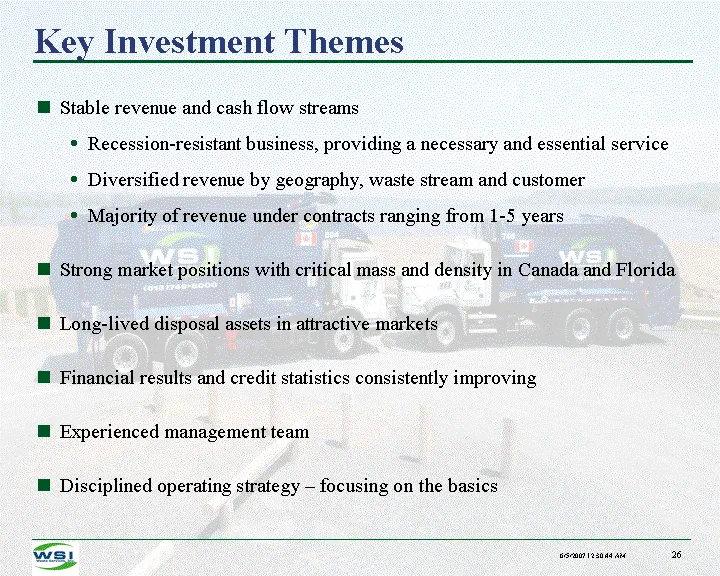
Key Investment Themes Stable revenue and cash flow streams Recession-resistant business, providing a necessary and essential service Diversified revenue by geography, waste stream and customer Majority of revenue under contracts ranging from 1-5 years Strong market positions with critical mass and d
Slide 28: Appendix: Reconciliation with Reported Net Loss
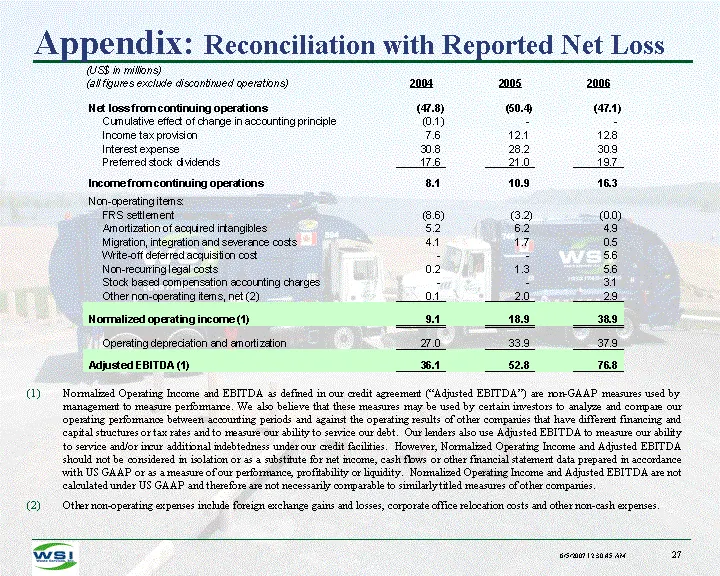
Appendix: Reconciliation with Reported Net Loss Normalized Operating Income and EBITDA as defined in our credit agreement ("Adjusted EBITDA") are non-GAAP measures used by management to measure performance. We also believe that these measures may be used by certain investors to analyze and compare o
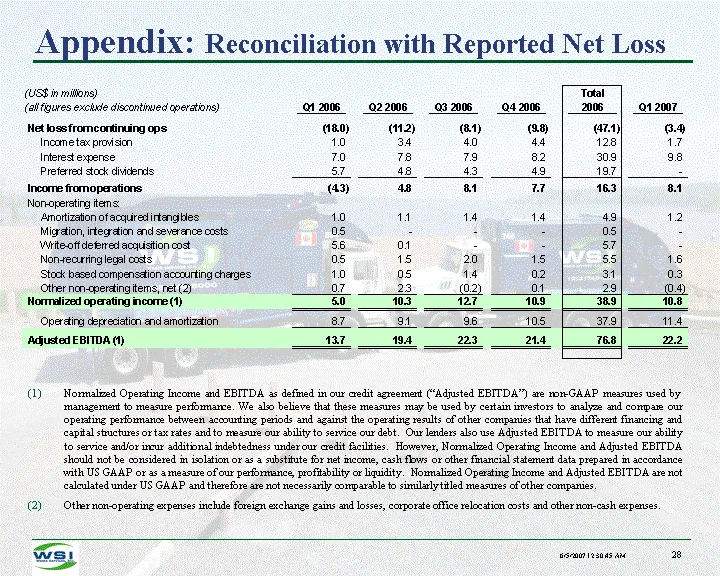
Slide 29: Normalized Operating Income and EBITDA Reconciliation
Normalized Operating Income and EBITDA as defined in our credit agreement ("Adjusted EBITDA") are non-GAAP measures used by management to measure performance. We also believe that these measures may be used by certain investors to analyze and compare our operating performance between accounting peri
Source: SEC EDGAR · 8-K filed Jun 7, 2007
More decks from Waste Services Inc
 Investor Presentation (December 2008)39 slides · Dec 3, 2008
 Investor Presentation (August 2008)26 slides · Aug 7, 2008
 Investor Presentation (November 2006)21 slides · Nov 28, 2006
 Investor Presentation (October 2006)17 slides · Oct 23, 2006
 Investor Presentation (May 2006)21 slides · May 17, 2006
 Investor Presentation (March 2006)20 slides · Mar 15, 2006