Sundance Energy — Sundance Energy Australia — Investor Presentation (June 2018)
38 slides from Sundance Energy's investor presentation, Jun 7, 2018
Slide 1: Important Notice and Disclaimer
Disclaimers Important Notice and Disclaimer IMPORTANT: You are advised to read the following carefully before making any use of the information contained in this presentation. Except as required by law, no representation or warranty, express or implied, is made by Sundance or any of the Sundance Rel
Slide 2: Disclaimers: Industry Data and Forward-Looking Statements
Disclaimers Industry data Certain market and industry data used in connection with this presentation, including in relation to other companies in Sundance’s peer group, may have been obtained from public filings, research, surveys or studies conducted by third parties, including industry or general
Slide 3: Disclaimers: Proved and Probable Reserves
Disclaimers Proved and probable reserves Ryder Scott Company, L.P. (Ryder Scott) has prepared an independent estimate of the proved and probable reserves, future production and income attributable to leasehold interests within the recently closed acquisition of 21,900 net acres for sale by Pioneer N
Slide 4: Table of Contents
Table of Contents Section: Executive Summary Recent Results & Activity Transaction & Asset Overview Appendix: Capital Structure & Financial Overview Technical Overview Reserve Estimate Assumptions Glossary All dollar values contained in this document are expressed in U.S. dollars unless otherwise st
Slide 5: Table of Contents
Table of Contents .@ Section: 1. Executive Summary 2. Recent Results & Activity 3. Transaction & Asset Overview Appendix: L Capital Structure & Financial Overview MN Technical Overview Il. Reserve Estimate Assumptions IV. Glossary All dollar values contained in this document are expressed in U.S. do
Slide 6: Sundance Energy – A Leading Pure Play Eagle Ford Producer
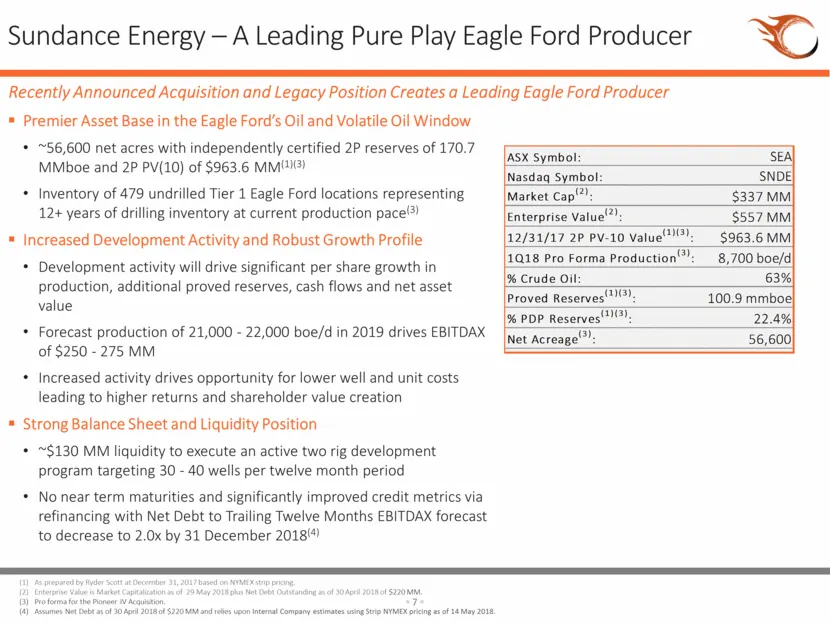
Sundance Energy – A Leading Pure Play Eagle Ford Producer Premier Asset Base in the Eagle Ford’s Oil and Volatile Oil Window ~56,600 net acres with independently certified 2P reserves of 170.7 MMboe and 2P PV(10) of $963.6 MM(1)(3) Inventory of 479 undrilled Tier 1 Eagle Ford locations representing
Slide 7: Sundance Energy – Investment Highlights
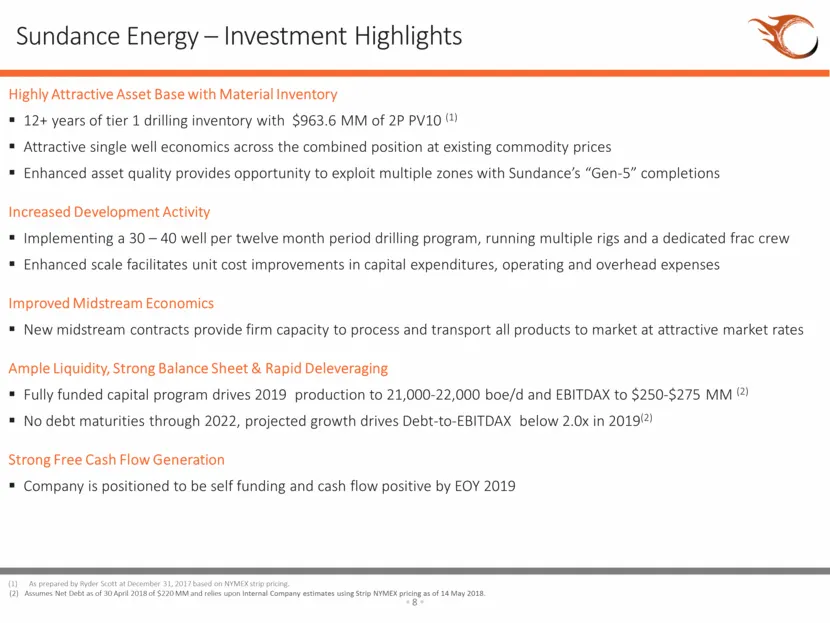
Sundance Energy – Investment Highlights Highly Attractive Asset Base with Material Inventory 12+ years of tier 1 drilling inventory with $963.6 MM of 2P PV10 (1) Attractive single well economics across the combined position at existing commodity prices Enhanced asset quality provides opportunity to
Slide 8: 2018 and 2019 Summary Guidance
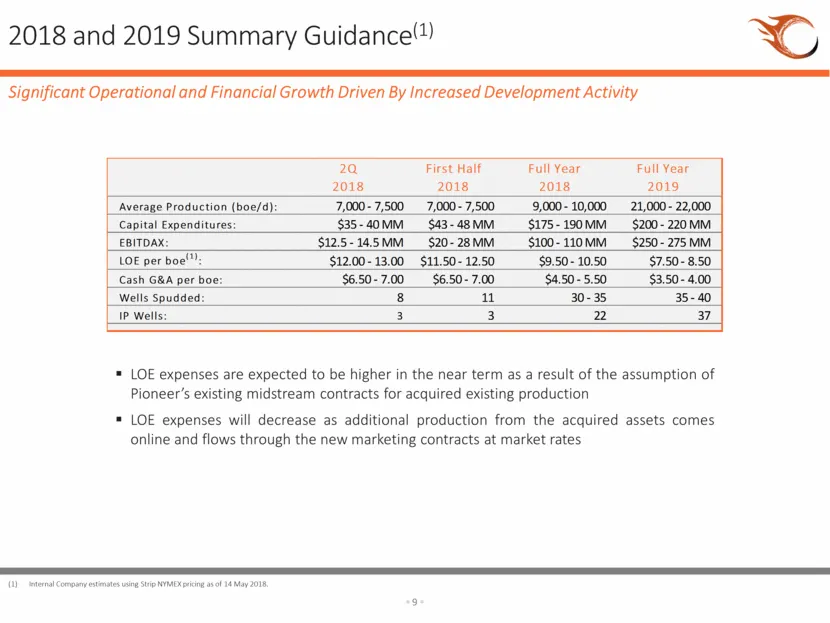
2018 and 2019 Summary Guidance(1) Significant Operational and Financial Growth Driven By Increased Development Activity LOE expenses are expected to be higher in the near term as a result of the assumption of Pioneer’s existing midstream contracts for acquired existing production LOE expenses will d
Slide 9: 2018 and 2019 Summary Guidance
2018 and 2019 Summary Guidance Significant Operational and Financial Growth Driven By Increased Development Activity 20 First Halt Full Year Full Year 2018 2018 2018 2019 ‘Average Production (boe/d): 7,000- 7,500 __7,000- 7,500 ___9,000- 10,000 __21,000- 22,000 Capital Expenditures: $35-40MM___$43-4
Slide 10: First Quarter 2018 Operational & Financial Results
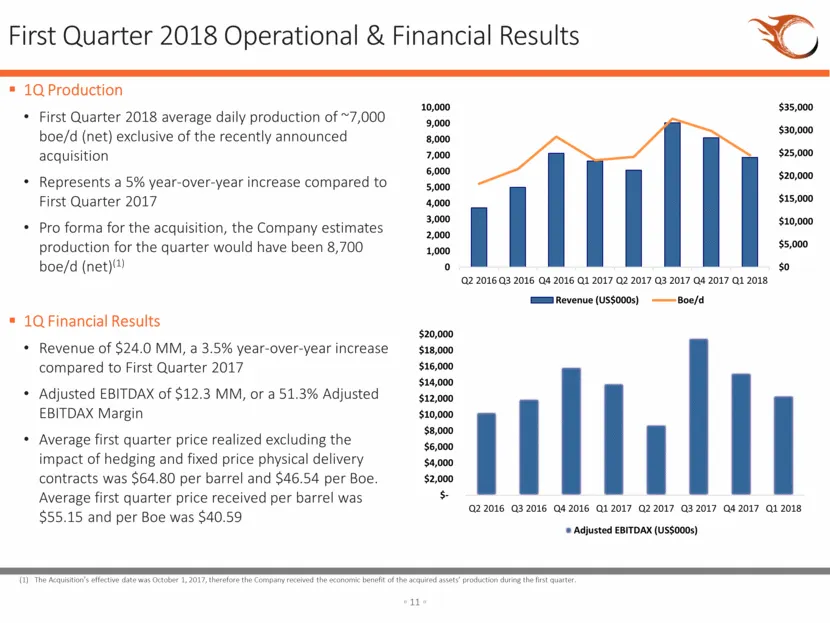
First Quarter 2018 Operational & Financial Results 1Q Production First Quarter 2018 average daily production of ~7,000 boe/d (net) exclusive of the recently announced acquisition Represents a 5% year-over-year increase compared to First Quarter 2017 Pro forma for the acquisition, the Company estimat
Slide 11: Second Quarter 2018 Development Activities
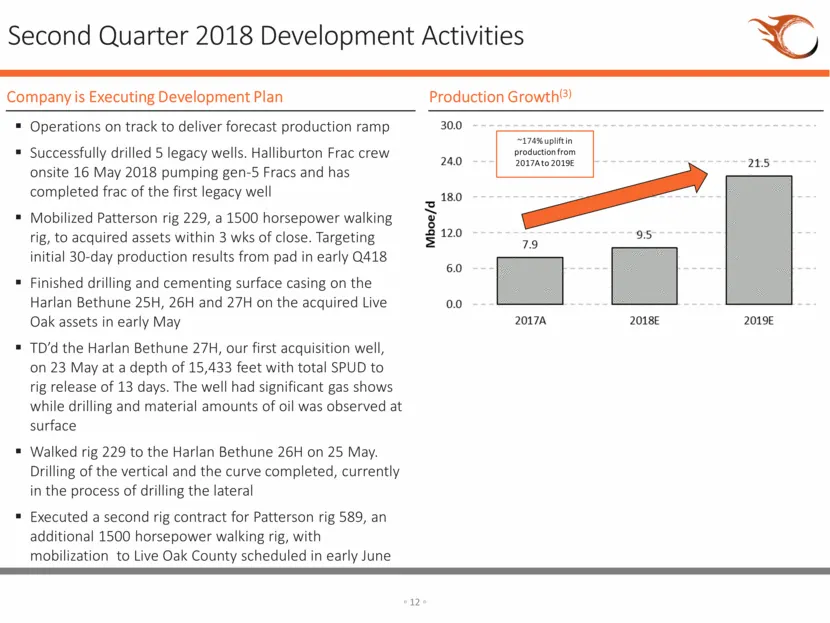
Second Quarter 2018 Development Activities Operations on track to deliver forecast production ramp Successfully drilled 5 legacy wells. Halliburton Frac crew onsite 16 May 2018 pumping gen-5 Fracs and has completed frac of the first legacy well Mobilized Patterson rig 229, a 1500 horsepower walking
Slide 12: Transaction & Asset Overview
Transaction & Asset Overview
Slide 13: Pioneer Joint Venture Acquisition Overview
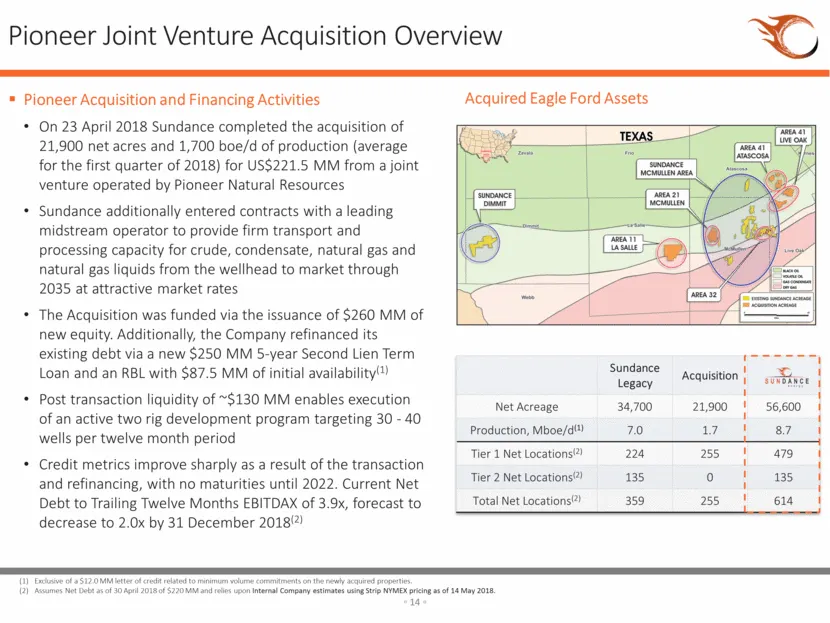
Pioneer Joint Venture Acquisition Overview Pioneer Acquisition and Financing Activities On 23 April 2018 Sundance completed the acquisition of 21,900 net acres and 1,700 boe/d of production (average for the first quarter of 2018) for US$221.5 MM from a joint venture operated by Pioneer Natural Resou
Slide 14: Acquired Assets Overview
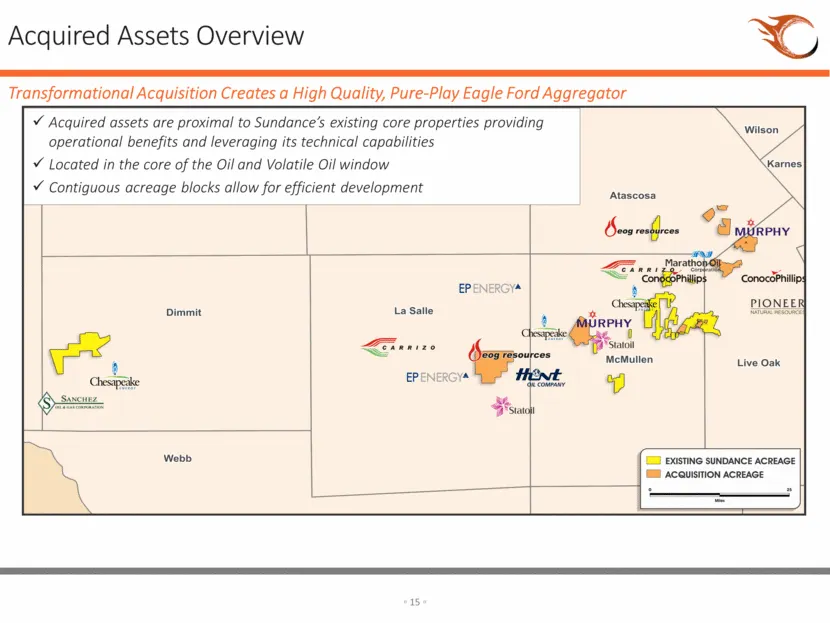
Acquired Assets Overview Transformational Acquisition Creates a High Quality, Pure-Play Eagle Ford Aggregator Acquired assets are proximal to Sundance’s existing core properties providing operational benefits and leveraging its technical capabilities Located in the core of the Oil and Volatile Oil w
Slide 15: Growing Sundance's Inventory
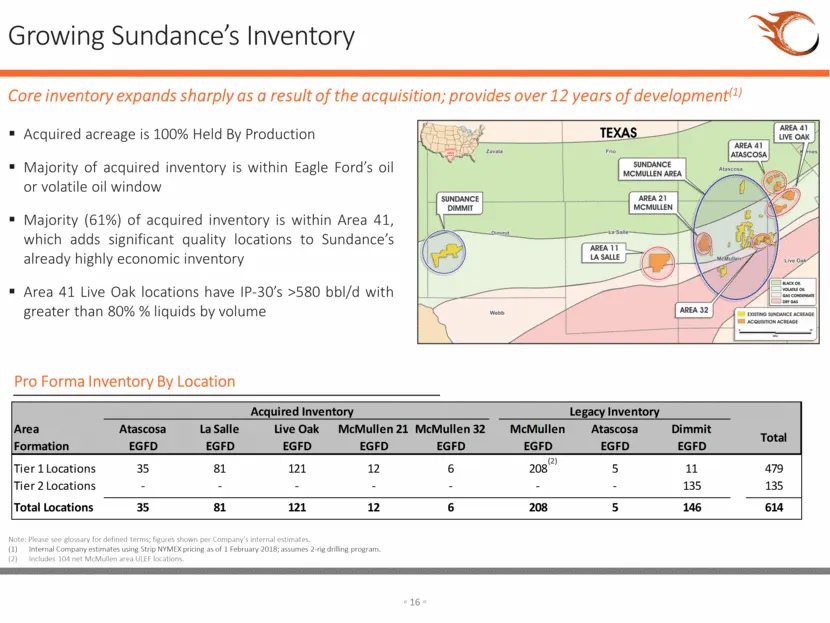
Growing Sundance’s Inventory Acquired acreage is 100% Held By Production Majority of acquired inventory is within Eagle Ford’s oil or volatile oil window Majority (61%) of acquired inventory is within Area 41, which adds significant quality locations to Sundance’s already highly economic inventory A
Slide 16: Highly Economic Inventory Additions
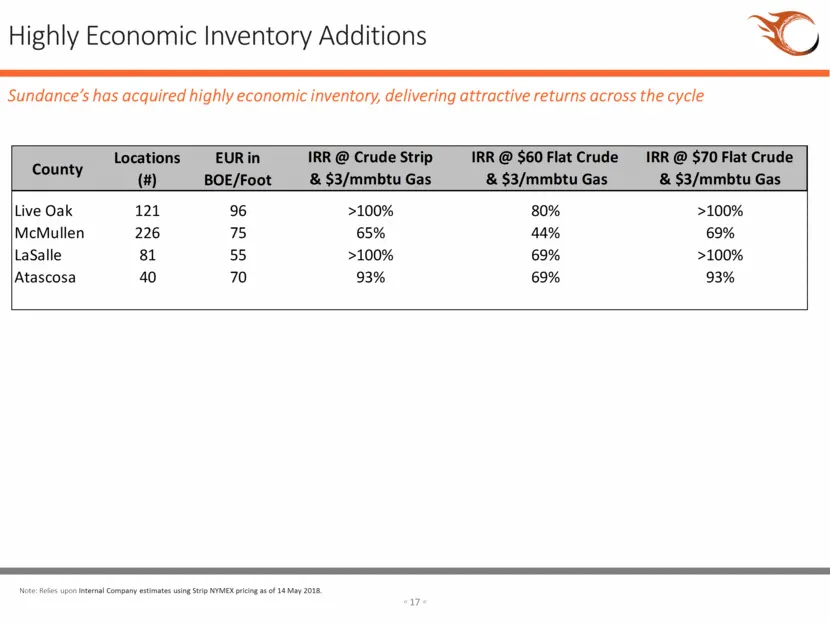
Highly Economic Inventory Additions Sundance’s has acquired highly economic inventory, delivering attractive returns across the cycle Note: Relies upon Internal Company estimates using Strip NYMEX pricing as of 14 May 2018. County Locations (#) EUR in BOE/Foot IRR @ Crude Strip & $3/mmbtu Gas IRR @
Slide 17: Operations – Continued Improvements Drive Production Growth
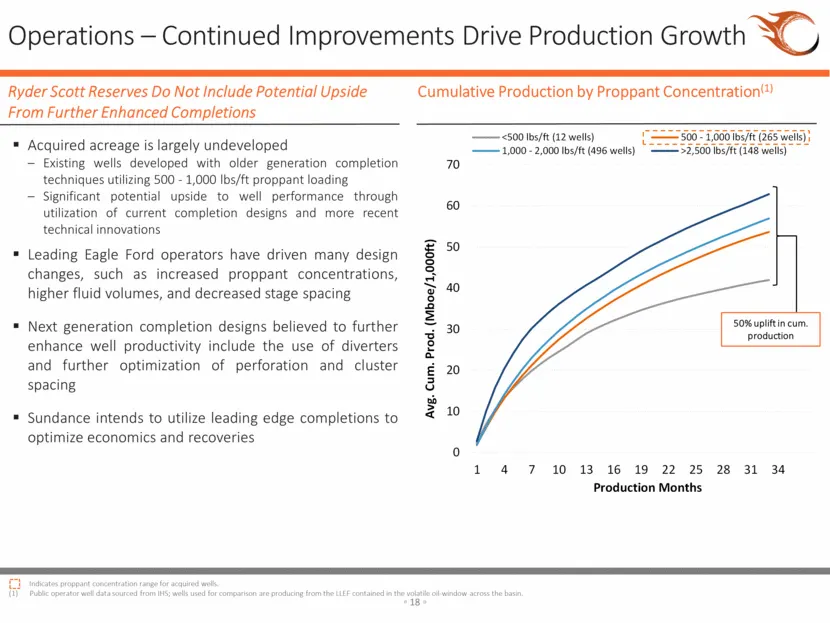
Operations – Continued Improvements Drive Production Growth Acquired acreage is largely undeveloped Existing wells developed with older generation completion techniques utilizing 500 - 1,000 lbs/ft proppant loading Significant potential upside to well performance through utilization of current compl
Slide 18: Investment Highlights
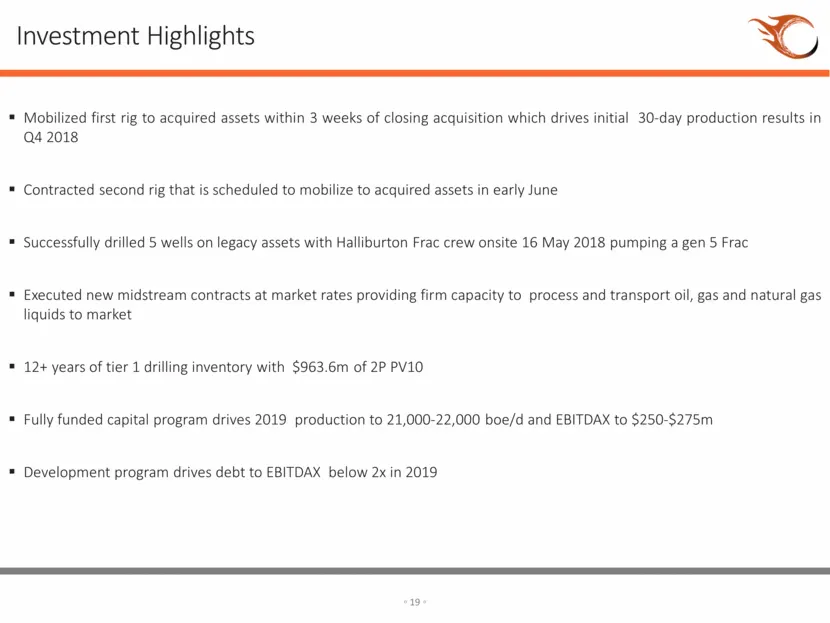
Investment Highlights Mobilized first rig to acquired assets within 3 weeks of closing acquisition which drives initial 30-day production results in Q4 2018 Contracted second rig that is scheduled to mobilize to acquired assets in early June Successfully drilled 5 wells on legacy assets with Hallibu
Slide 19: Appendix I Capital Structure & Financial Overview
Appendix I Capital Structure & Financial Overview
Slide 20: Debt Financing Overview
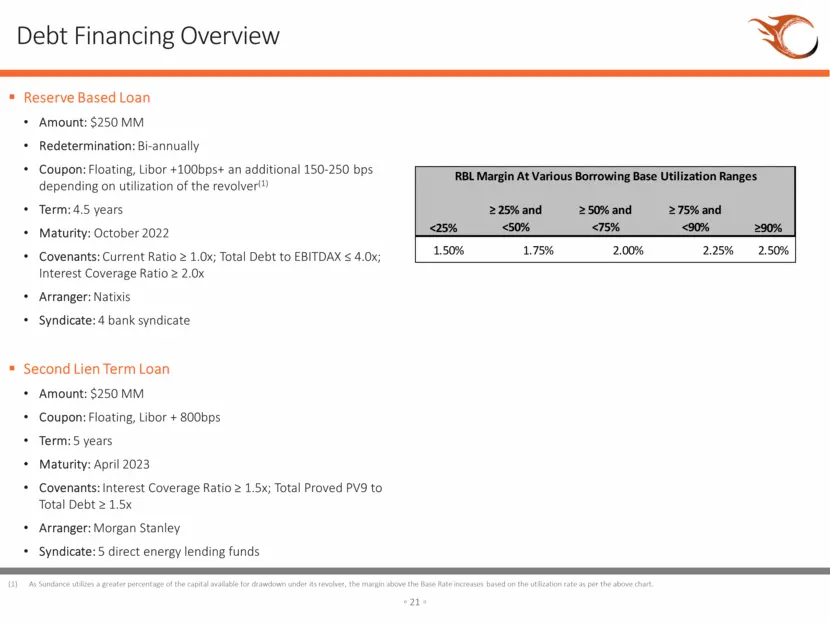
Debt Financing Overview Reserve Based Loan Amount: $250 MM Redetermination: Bi-annually Coupon: Floating, Libor +100bps+ an additional 150-250 bps depending on utilization of the revolver(1) Term: 4.5 years Maturity: October 2022 Covenants: Current Ratio > 1.0x; Total Debt to EBITDAX < 4.0x; Interes
Slide 21: Risk Management Overview – Commodity Price Hedging
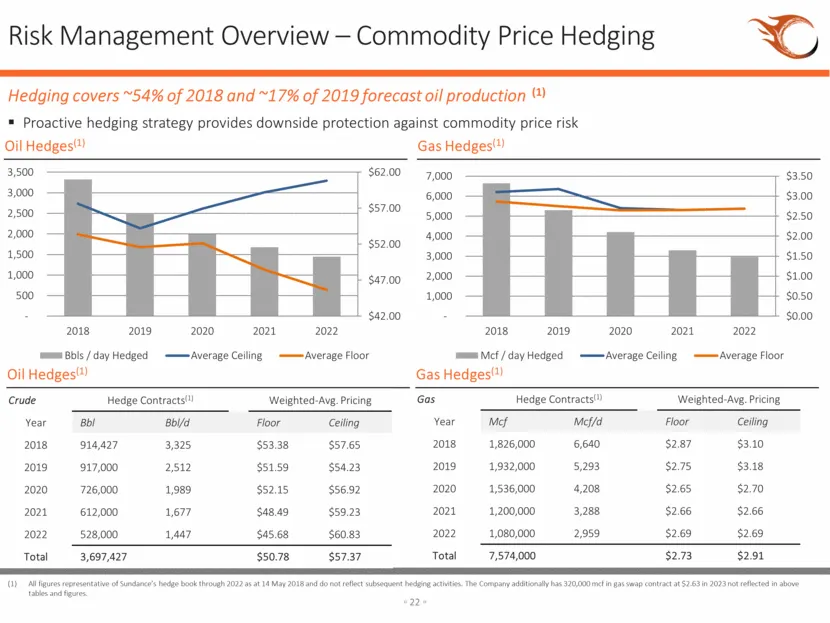
Gas Hedge Contracts(1) Weighted-Avg. Pricing Year Mcf Mcf/d Floor Ceiling 2018 1,826,000 6,640 $2.87 $3.10 2019 1,932,000 5,293 $2.75 $3.18 2020 1,536,000 4,208 $2.65 $2.70 2021 1,200,000 3,288 $2.66 $2.66 2022 1,080,000 2,959 $2.69 $2.69 Total 7,574,000 $2.73 $2.91 Gas Hedges(1) Risk Management Ove
Slide 22: Risk Management Overview – Three Way Collar Explanation
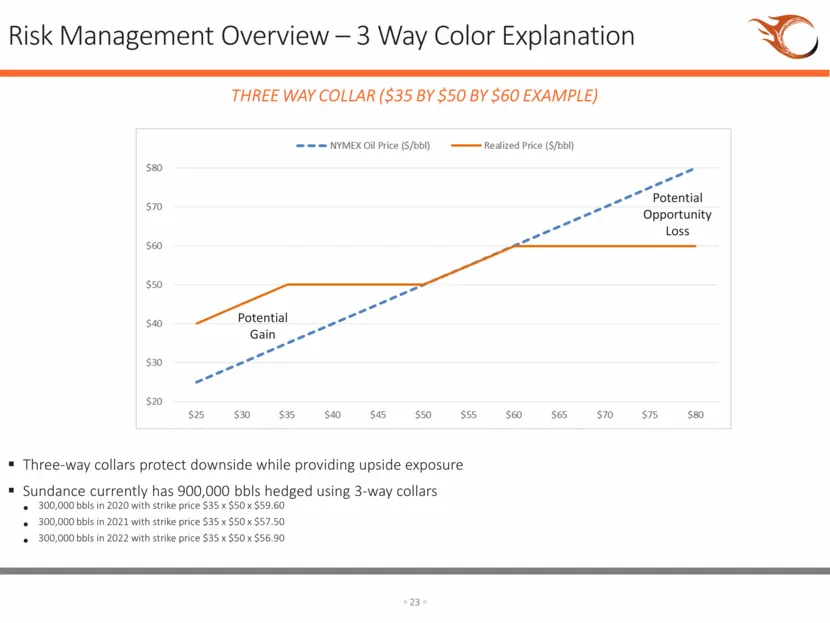
Risk Management Overview – 3 Way Color Explanation THREE WAY COLLAR ($35 BY $50 BY $60 EXAMPLE) Three-way collars protect downside while providing upside exposure Sundance currently has 900,000 bbls hedged using 3-way collars 300,000 bbls in 2020 with strike price $35 x $50 x $59.60 300,000 bbls in
Slide 23: Financial Results for First Quarter 2018
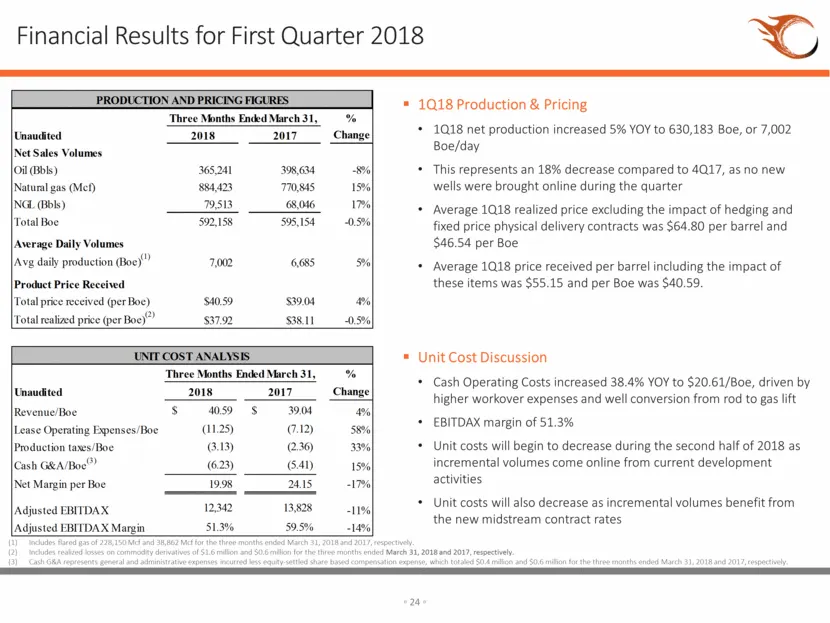
Financial Results for First Quarter 2018 Includes flared gas of 228,150 Mcf and 38,862 Mcf for the three months ended March 31, 2018 and 2017, respectively. Includes realized losses on commodity derivatives of $1.6 million and $0.6 million for the three months ended March 31, 2018 and 2017, respecti
Slide 24: Financial Results for First Quarter 2018 (cont'd)
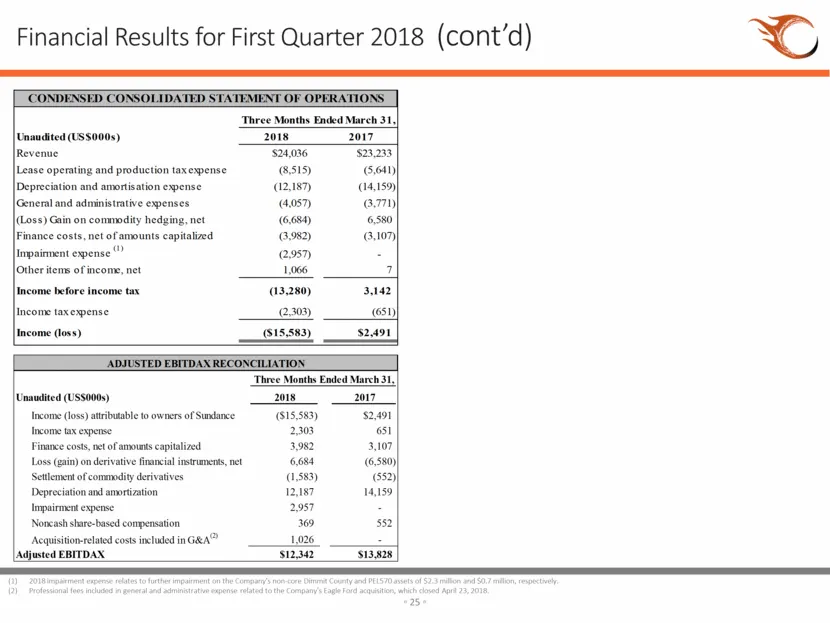
Financial Results for First Quarter 2018 (cont’d) 2018 impairment expense relates to further impairment on the Company's non-core Dimmit County and PEL570 assets of $2.3 million and $0.7 million, respectively. Professional fees included in general and administrative expense related to the Company's
Slide 25: Financial Results for First Quarter 2018 (cont'd)
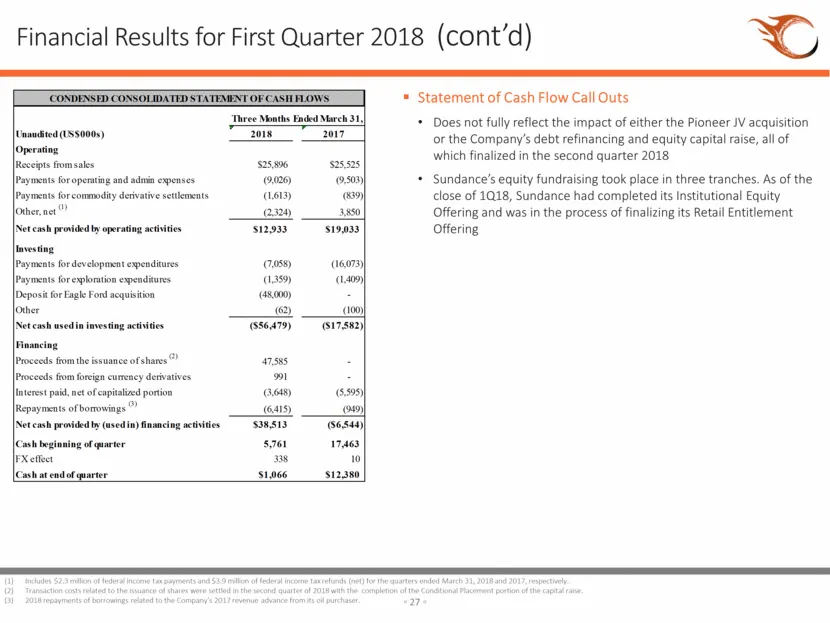
Financial Results for First Quarter 2018 (cont’d) Includes $48.0 million nonrefundable deposit made in connection with the Company's Eagle Ford acquisition, which closed on April 23, 2018. The Company's Dimmit County Eagle Ford assets (and related liabilities) were classified as held for sale as of
Slide 26: Appendix II Technical Overview
Appendix II Technical Overview
Slide 27: Thick Eagle Ford Section Across Position
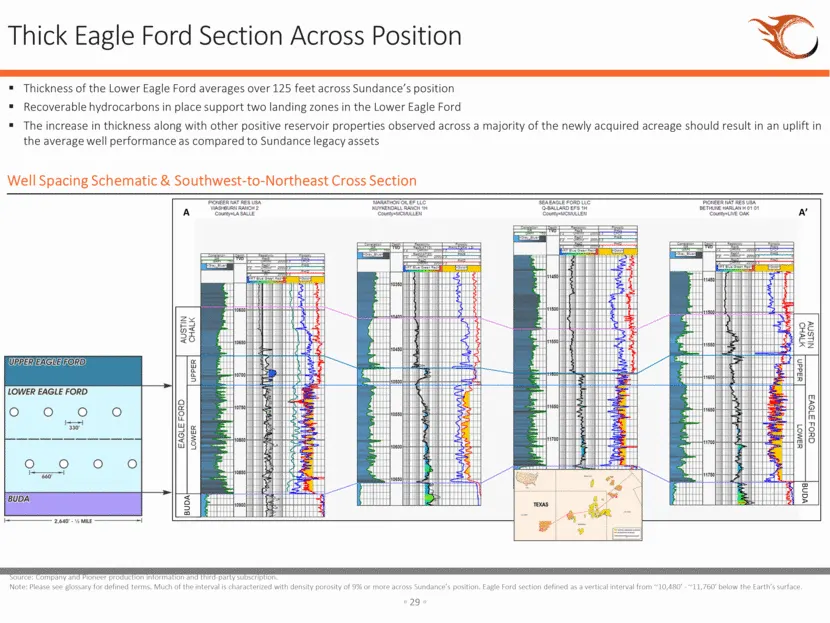
Thick Eagle Ford Section Across Position Thickness of the Lower Eagle Ford averages over 125 feet across Sundance’s position Recoverable hydrocarbons in place support two landing zones in the Lower Eagle Ford The increase in thickness along with other positive reservoir properties observed across a
Slide 28: Area Live Oak – LEF – Single Well Assumptions
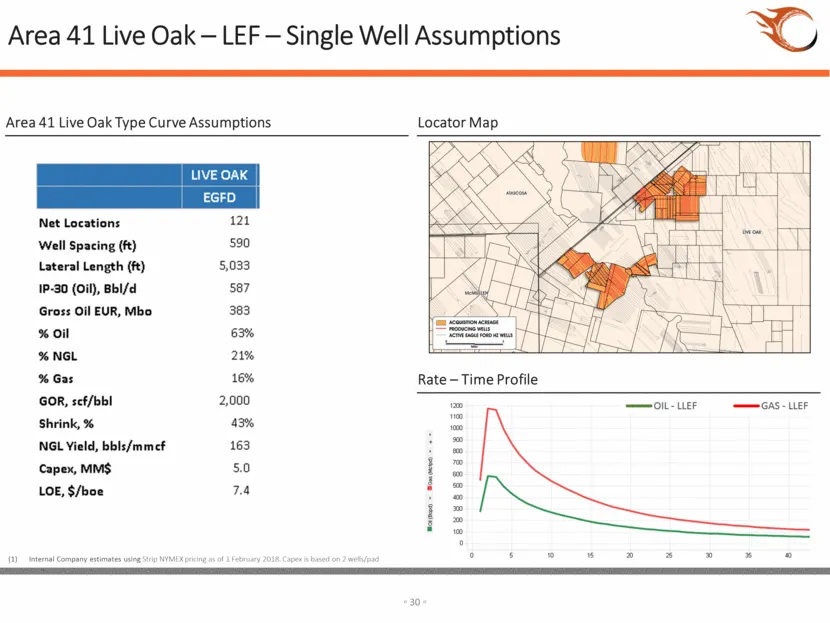
Area 41 Live Oak – LEF – Single Well Assumptions Locator Map Area 41 Live Oak Type Curve Assumptions Rate – Time Profile Internal Company estimates using Strip NYMEX pricing as of 1 February 2018. Capex is based on 2 wells/pad
Slide 29: Area Atascosa – LEF – Single Well Assumptions
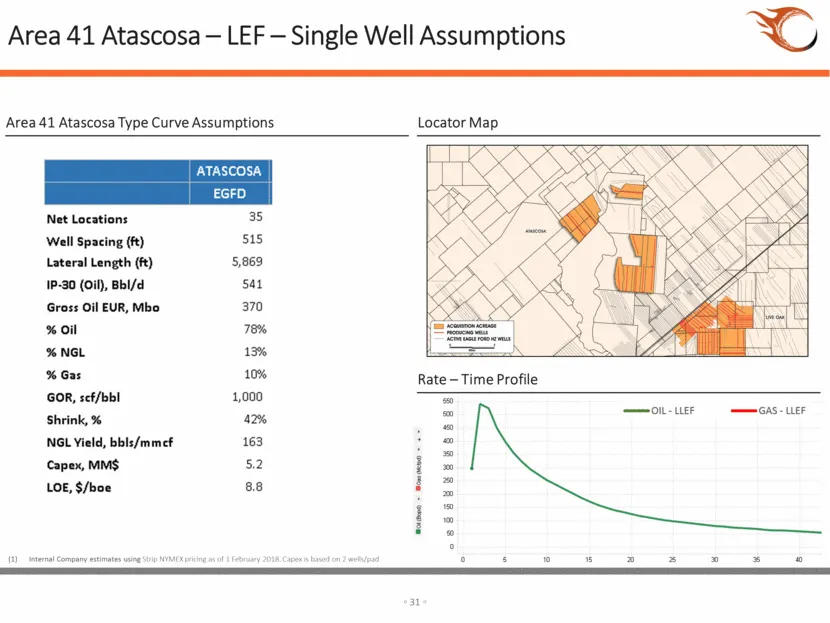
Area 41 Atascosa – LEF – Single Well Assumptions Locator Map Rate – Time Profile Area 41 Atascosa Type Curve Assumptions Internal Company estimates using Strip NYMEX pricing as of 1 February 2018. Capex is based on 2 wells/pad
Slide 30: Area La Salle – LEF – Single Well Assumptions
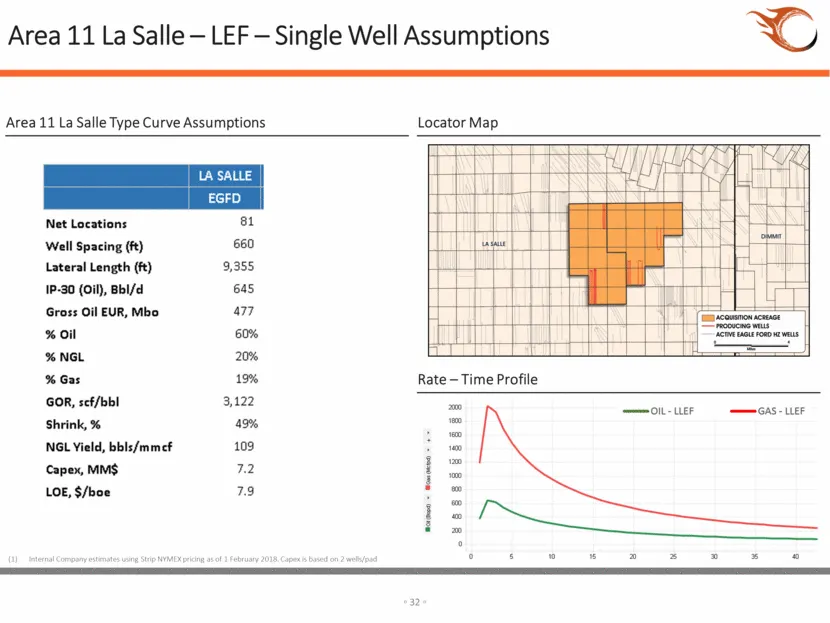
Area 11 La Salle – LEF – Single Well Assumptions Locator Map Rate – Time Profile Area 11 La Salle Type Curve Assumptions Internal Company estimates using Strip NYMEX pricing as of 1 February 2018. Capex is based on 2 wells/pad
Slide 31: Area McMullen – LEF – Single Well Assumptions
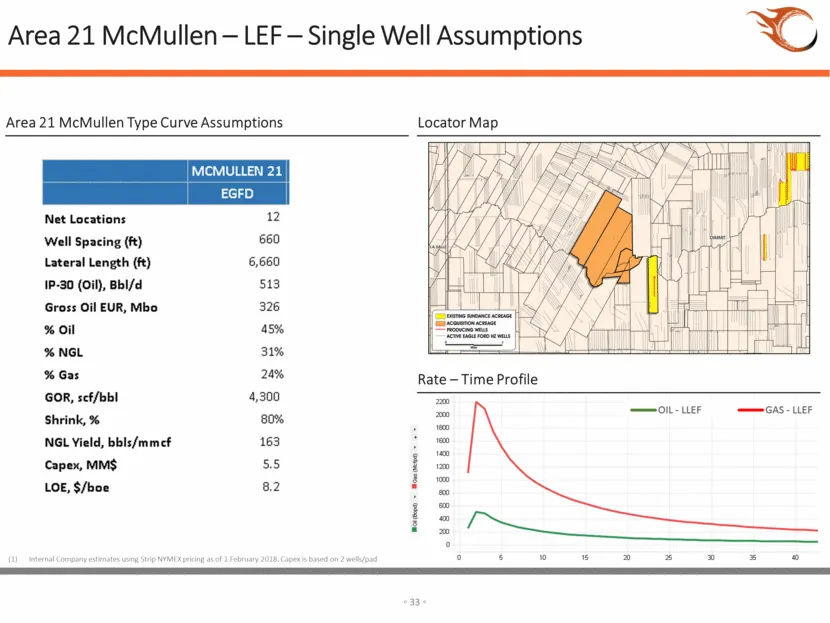
Area 21 McMullen – LEF – Single Well Assumptions Locator Map Rate – Time Profile Area 21 McMullen Type Curve Assumptions Internal Company estimates using Strip NYMEX pricing as of 1 February 2018. Capex is based on 2 wells/pad
Slide 32: SEA Dimmit – Single Well Assumptions
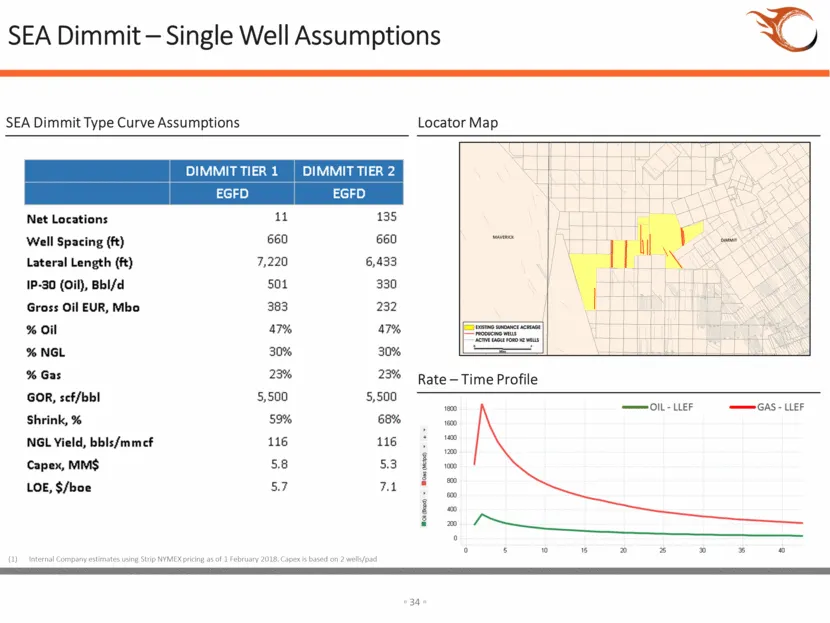
SEA Dimmit – Single Well Assumptions Locator Map Rate – Time Profile SEA Dimmit Type Curve Assumptions MAVERICK DIMMIT Internal Company estimates using Strip NYMEX pricing as of 1 February 2018. Capex is based on 2 wells/pad
Slide 33: SEA McMullen – Single Well Assumptions
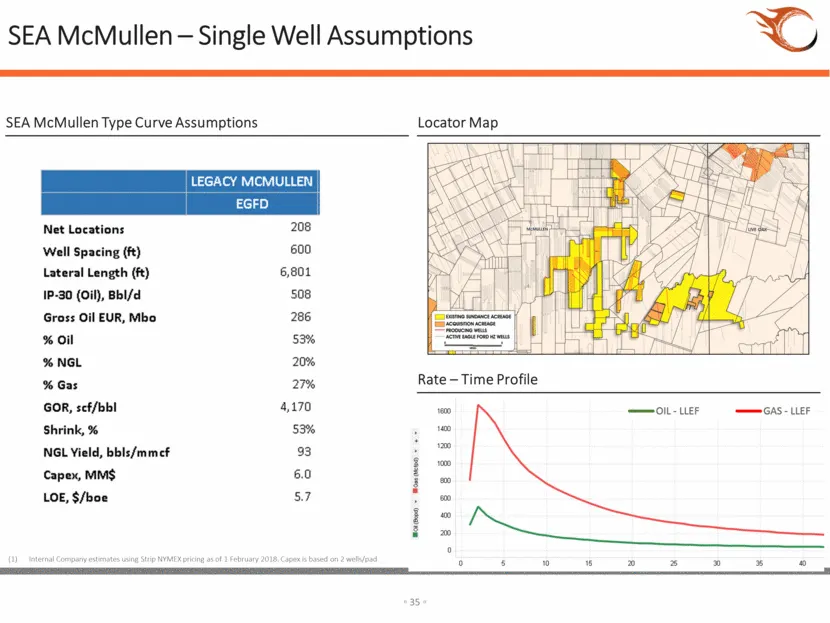
SEA McMullen – Single Well Assumptions Locator Map Rate – Time Profile SEA McMullen Type Curve Assumptions Internal Company estimates using Strip NYMEX pricing as of 1 February 2018. Capex is based on 2 wells/pad
Slide 34: Appendix III Reserve Estimate Assumptions
Appendix III Reserve Estimate Assumptions
Slide 35: Underlying Assumptions for Reserve PV(10) Estimates
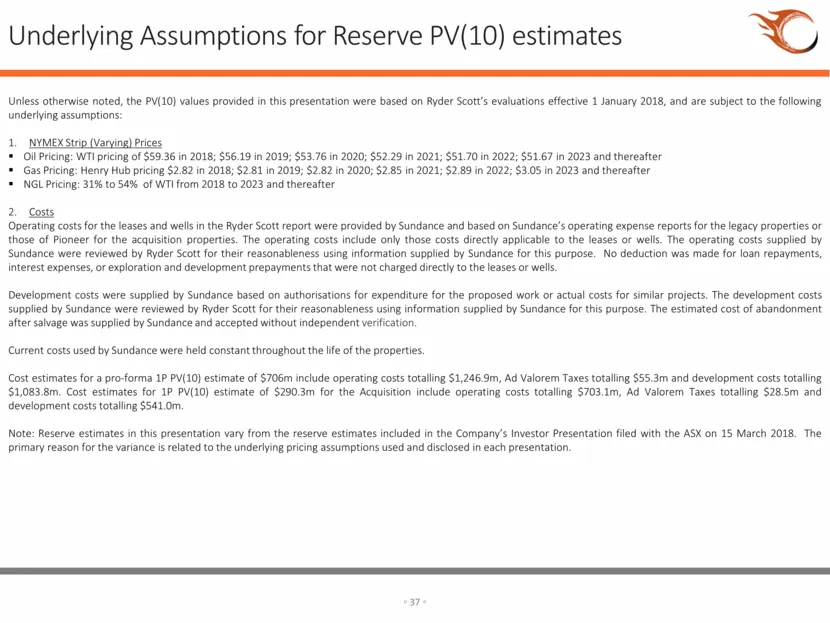
Underlying Assumptions for Reserve PV(10) estimates Unless otherwise noted, the PV(10) values provided in this presentation were based on Ryder Scott’s evaluations effective 1 January 2038, and are subject to the folowing Lnderiying assumptions: 1. NYMEXStrip (Varying) Prices = Oil Pricing: WTI pric
Slide 36: Glossary
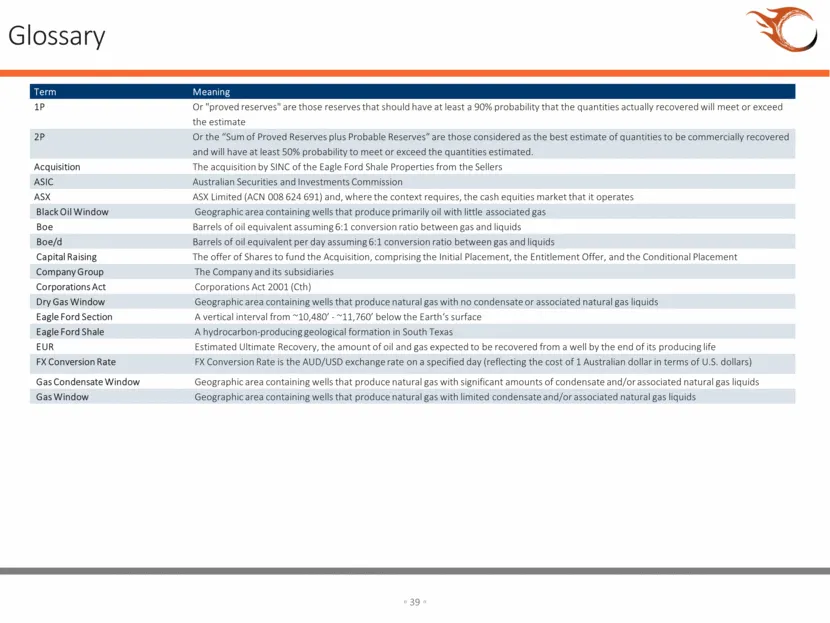
Glossary Term Meaning 1P Or "proved reserves" are those reserves that should have at least a 90% probability that the quantities actually recovered will meet or exceed the estimate 2P Or the “Sum of Proved Reserves plus Probable Reserves” are those considered as the best estimate of quantities to be
Slide 37: Glossary
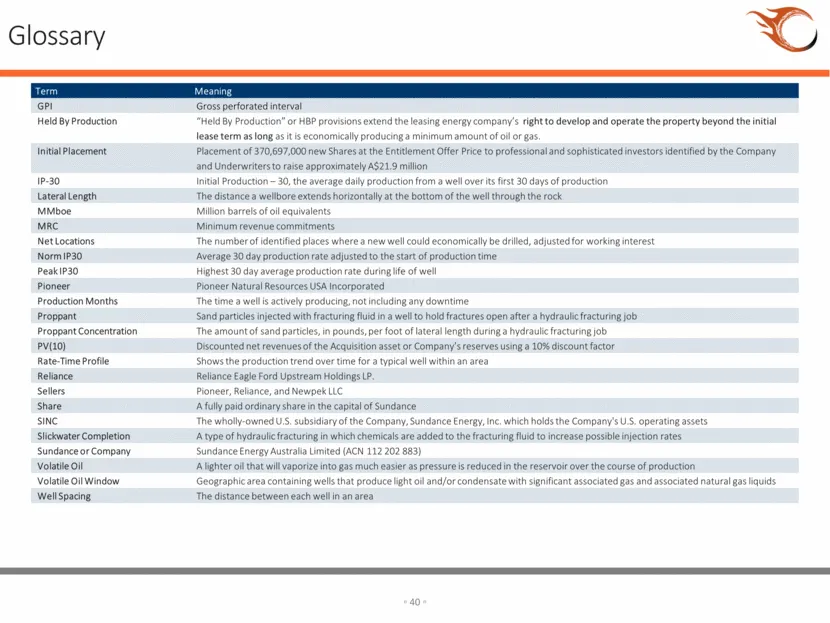
Glossary Term Meaning GPI Gross perforated interval Held By Production “Held By Production” or HBP provisions extend the leasing energy company’s right to develop and operate the property beyond the initial lease term as long as it is economically producing a minimum amount of oil or gas. Initial Pl
Slide 38: Glossary
Glossary PI Held By Production InitatPlacement 130 Latealtength MMtboe MRC NetLocatons NormiP30 eakiP30 Pioneer Production Months Proppant Proppant Concentration Pvao) Rate-Time Profile Reliance Seles Share sinc Slikwater Completion Sundance or Company Volatile oi! Volatile Ol Window Wellspacing Gro
Source: SEC EDGAR · 6-K filed Jun 7, 2018
More decks from Sundance Energy Inc
 Investor Presentation (February 2020)25 slides · Feb 10, 2020
 Sundance Energy Australia — Q3 2019 Earnings Presentation24 slides · Nov 18, 2019
 Sundance Energy Australia — Q2 2019 Earnings Presentation25 slides · Aug 16, 2019
 Sundance Energy Australia — Investor Presentation (July 2019)19 slides · Jul 24, 2019
 Sundance Energy Australia — Investor Presentation (June 2019)16 slides · Jun 3, 2019
 Sundance Energy Australia — Q1 2019 Earnings Presentation17 slides · May 21, 2019