Green Bancorp — Gulf South Bank Conference 2017
32 slides from Green Bancorp's conference presentation, May 8, 2017
Slide 1: Gulf South Bank Conference
Gulf South Bank Conference NASDAQ: GNBC May 2017
Slide 2: Safe Harbor
Safe Harbor The following information contains, or may be deemed to contain, "forward-looking statements" (as defined in the U.S. Private Securities Litigation Reform Act of 1995) giving Green Bancorp, Inc.’s (“Green Bancorp”) expectations or predictions of future financial or business performance o
Slide 3: Non-GAAP Financial Information
Non-GAAP Financial Information This document includes the presentation of both GAAP (generally accepted accounting principles) and non-GAAP financial measures. Green Bancorp’s management uses certain non−GAAP financial measures to evaluate its performance and believes that the presentation of non-GA
Slide 4: Company Snapshot
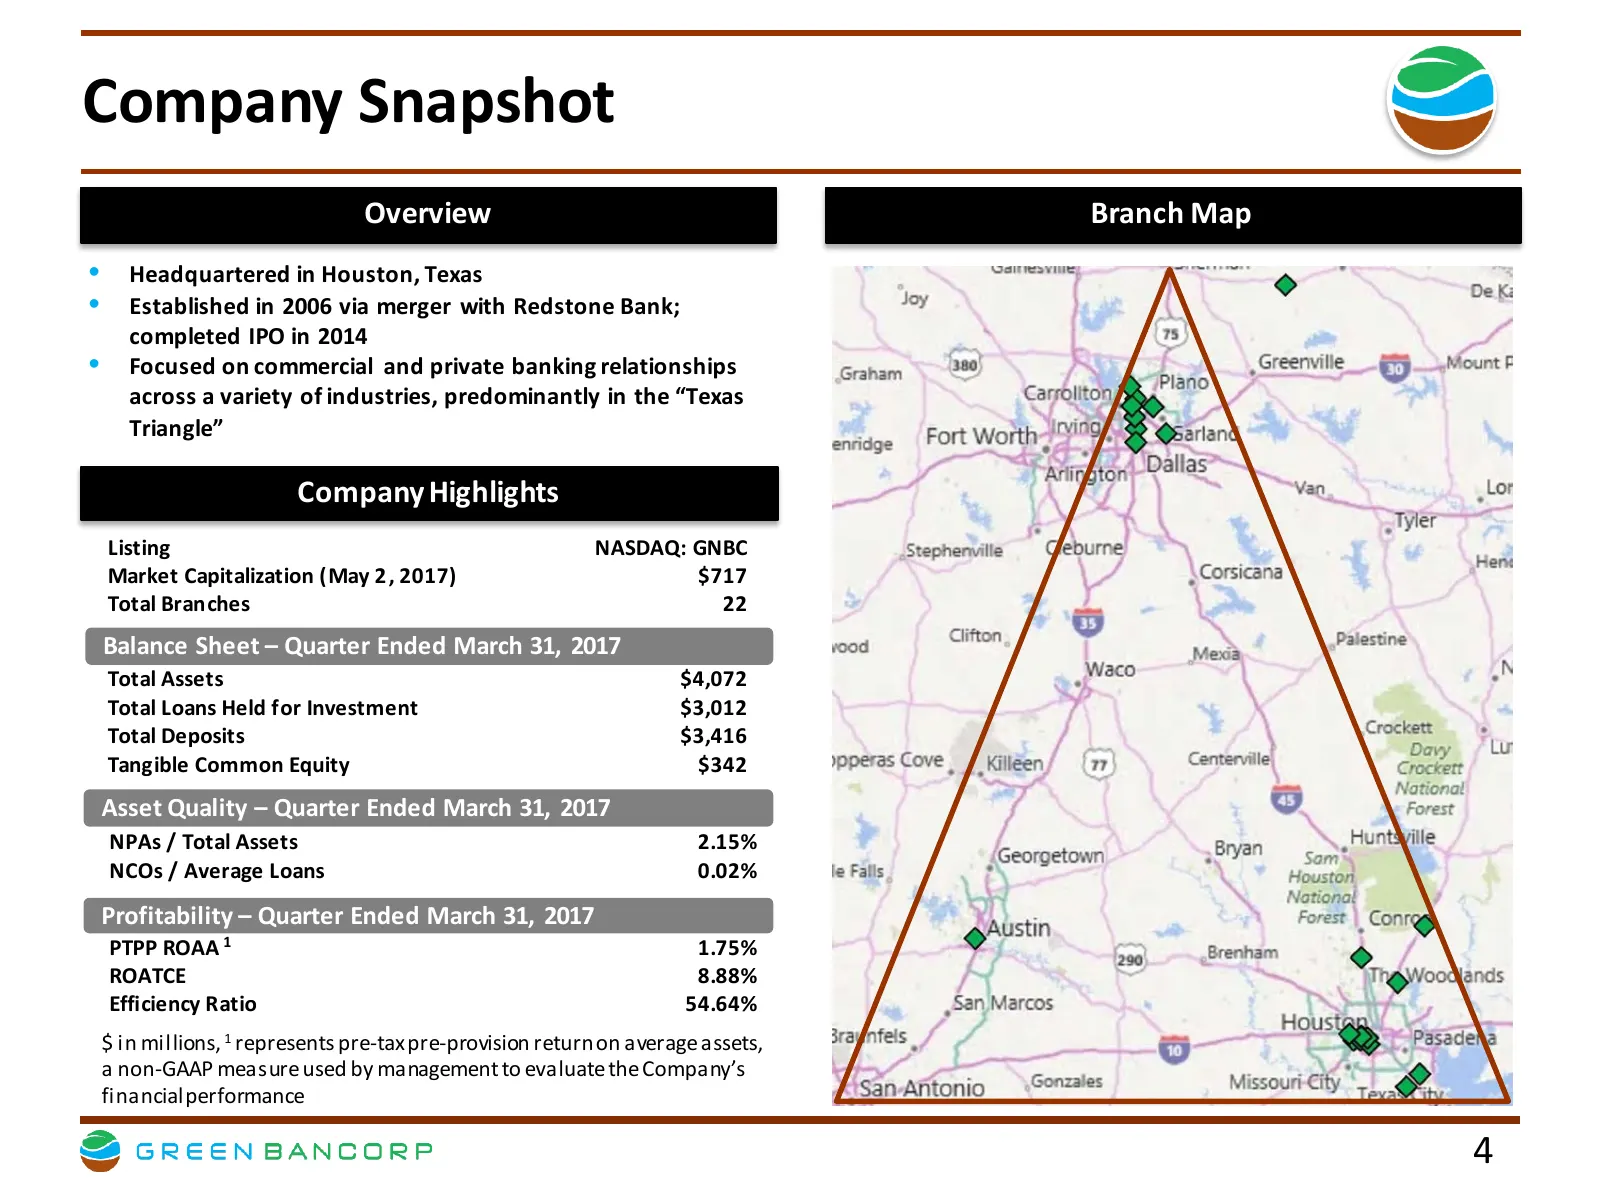
Company Snapshot Overview Branch Map • Headquartered in Houston, Texas • Established in 2006 via merger with Redstone Bank; completed IPO in 2014 • Focused on commercial and private banking relationships across a variety of industries, predominantly in the “Texas Triangle” Company Highlights Listing
Slide 5: First Quarter 2017 Highlights
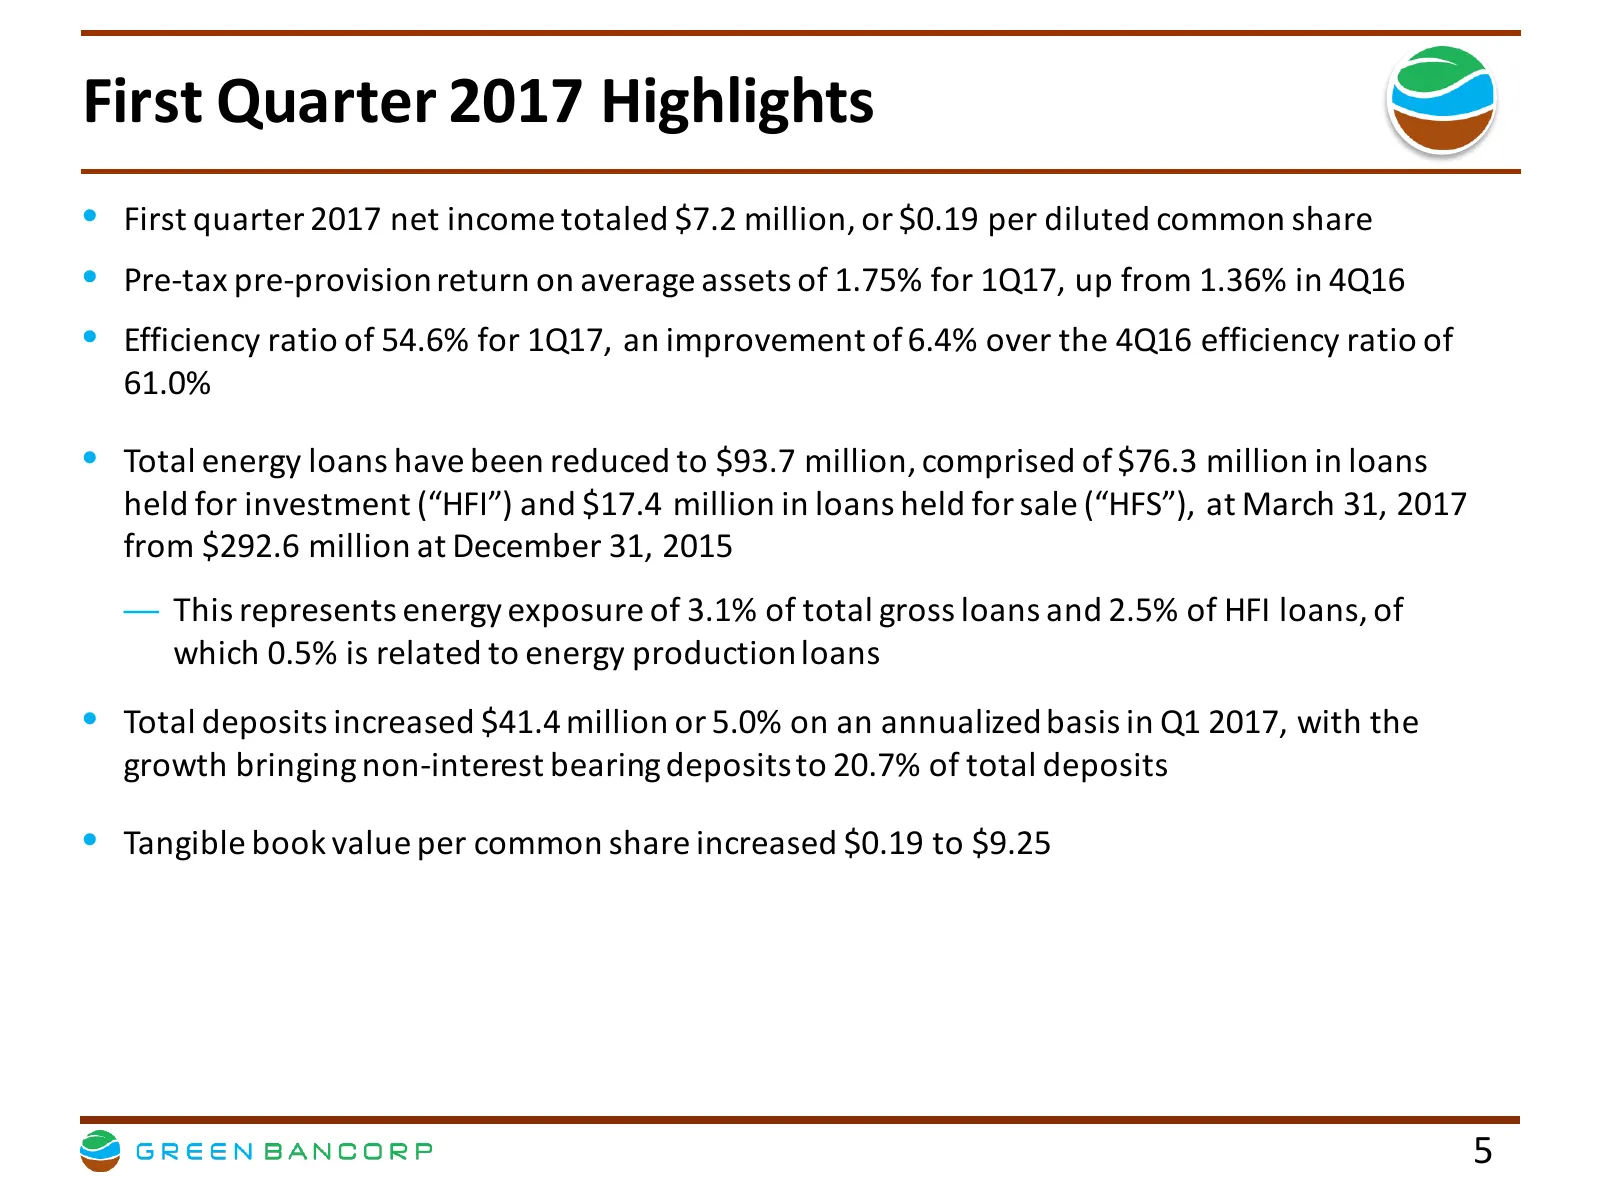
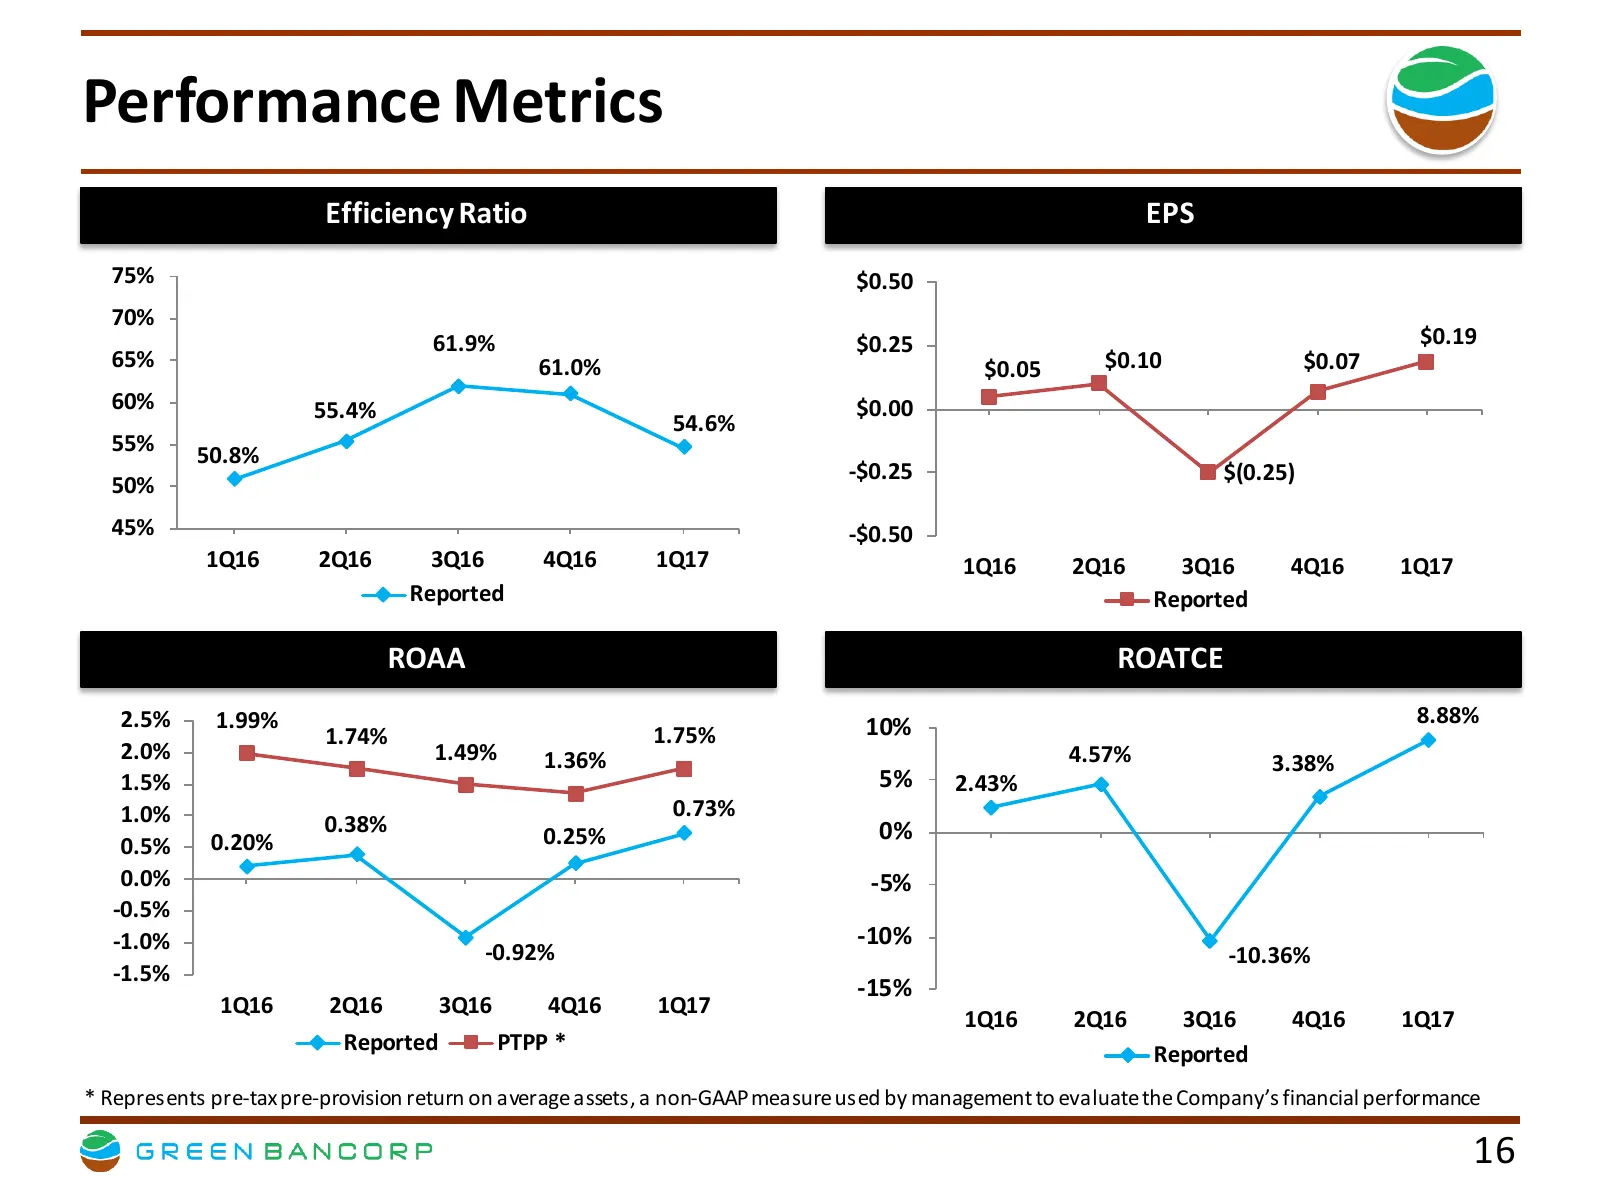
First Quarter 2017 Highlights • First quarter 2017 net income totaled $7.2 million, or $0.19 per diluted common share • Pre-tax pre-provision return on average assets of 1.75% for 1Q17, up from 1.36% in 4Q16 • Efficiency ratio of 54.6% for 1Q17, an improvement of 6.4% over the 4Q16 efficiency ratio
Slide 6: Pre-Tax Pre-Provision Adjusted Net Income
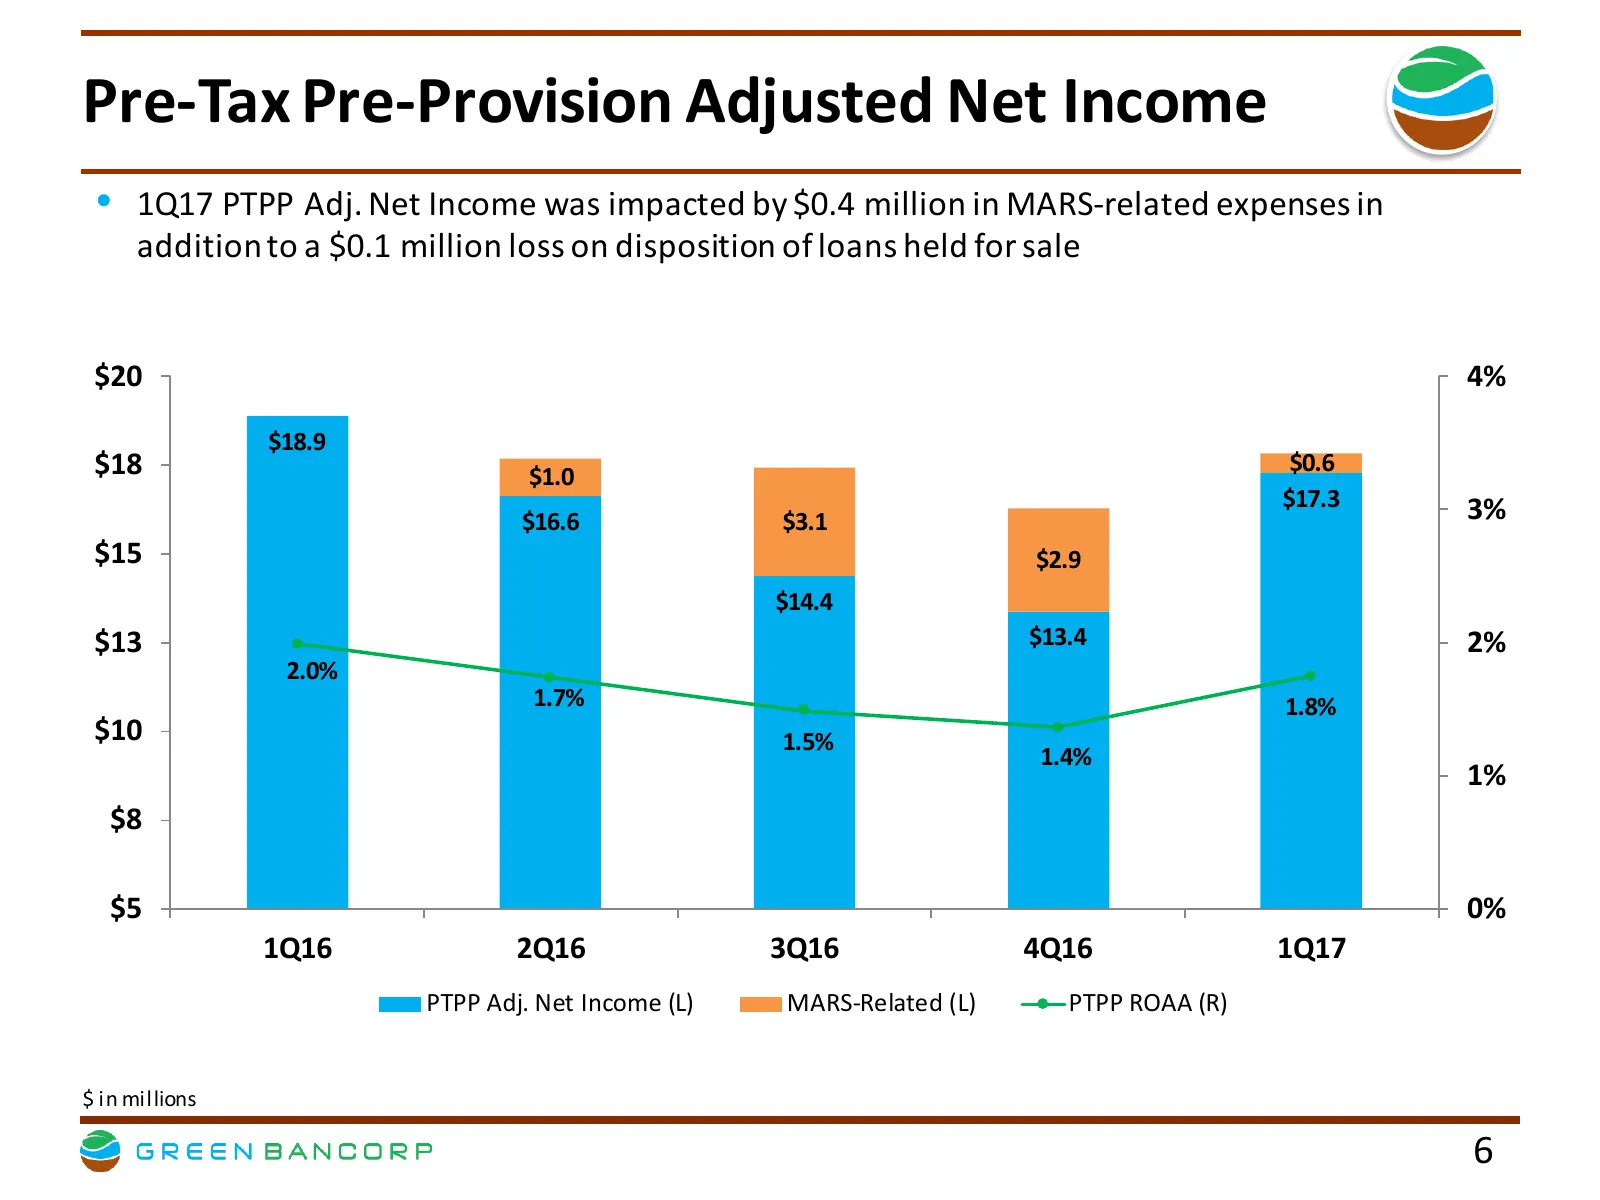
Pre-Tax Pre-Provision Adjusted Net Income • 1Q17 PTPP Adj. Net Income was impacted by $0.4 million in MARS-related expenses in addition to a $0.1 million loss on disposition of loans held for sale $20 4% $18.9 $18 $1.0 $0.6 $17.3 3% $16.6 $3.1 $15 $2.9 $14.4 $13 $13.4 2% 2.0% 1.7% 1.8% $10 1.5% 1.4%
Slide 7: Investment Highlights
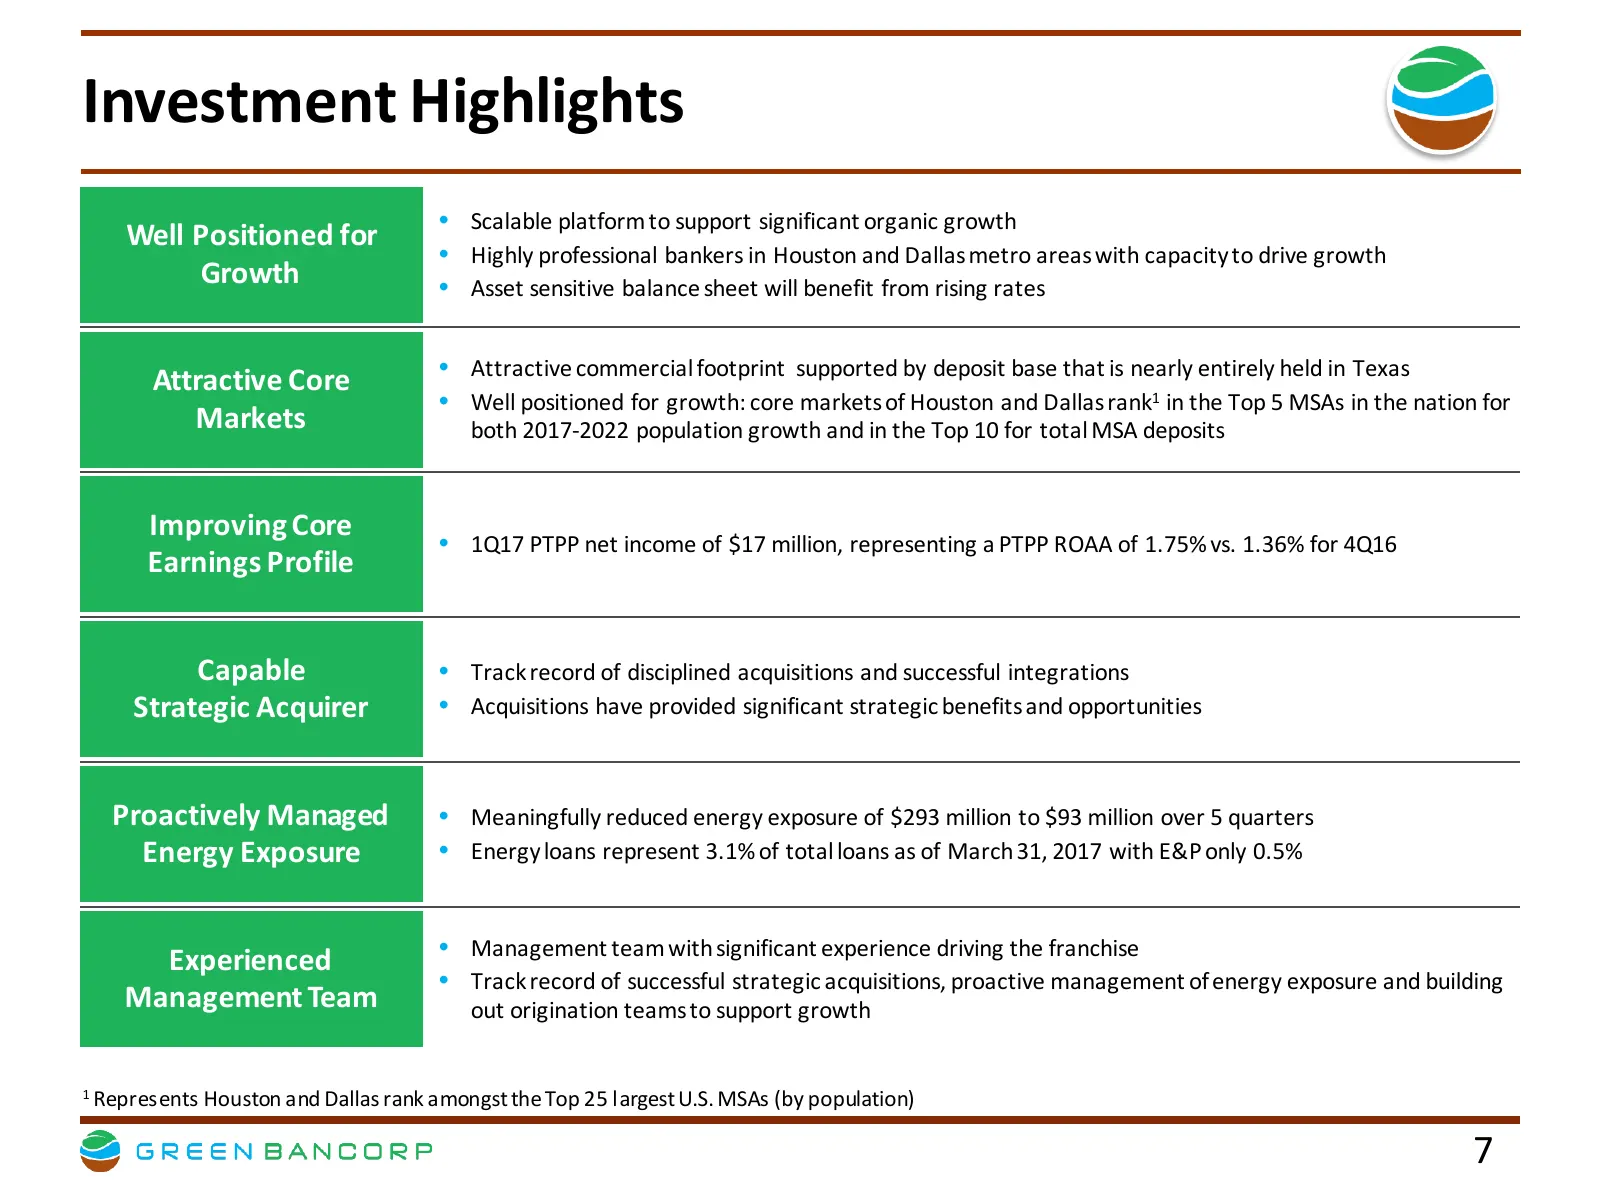
Investment Highlights • Scalable platform to support significant organic growth Well Positioned for • Highly professional bankers in Houston and Dallas metro areas with capacity to drive growth Growth • Asset sensitive balance sheet will benefit from rising rates Attractive Core • Attractive commerc
Slide 8: Scalable Platform with Attractive Growth Profile
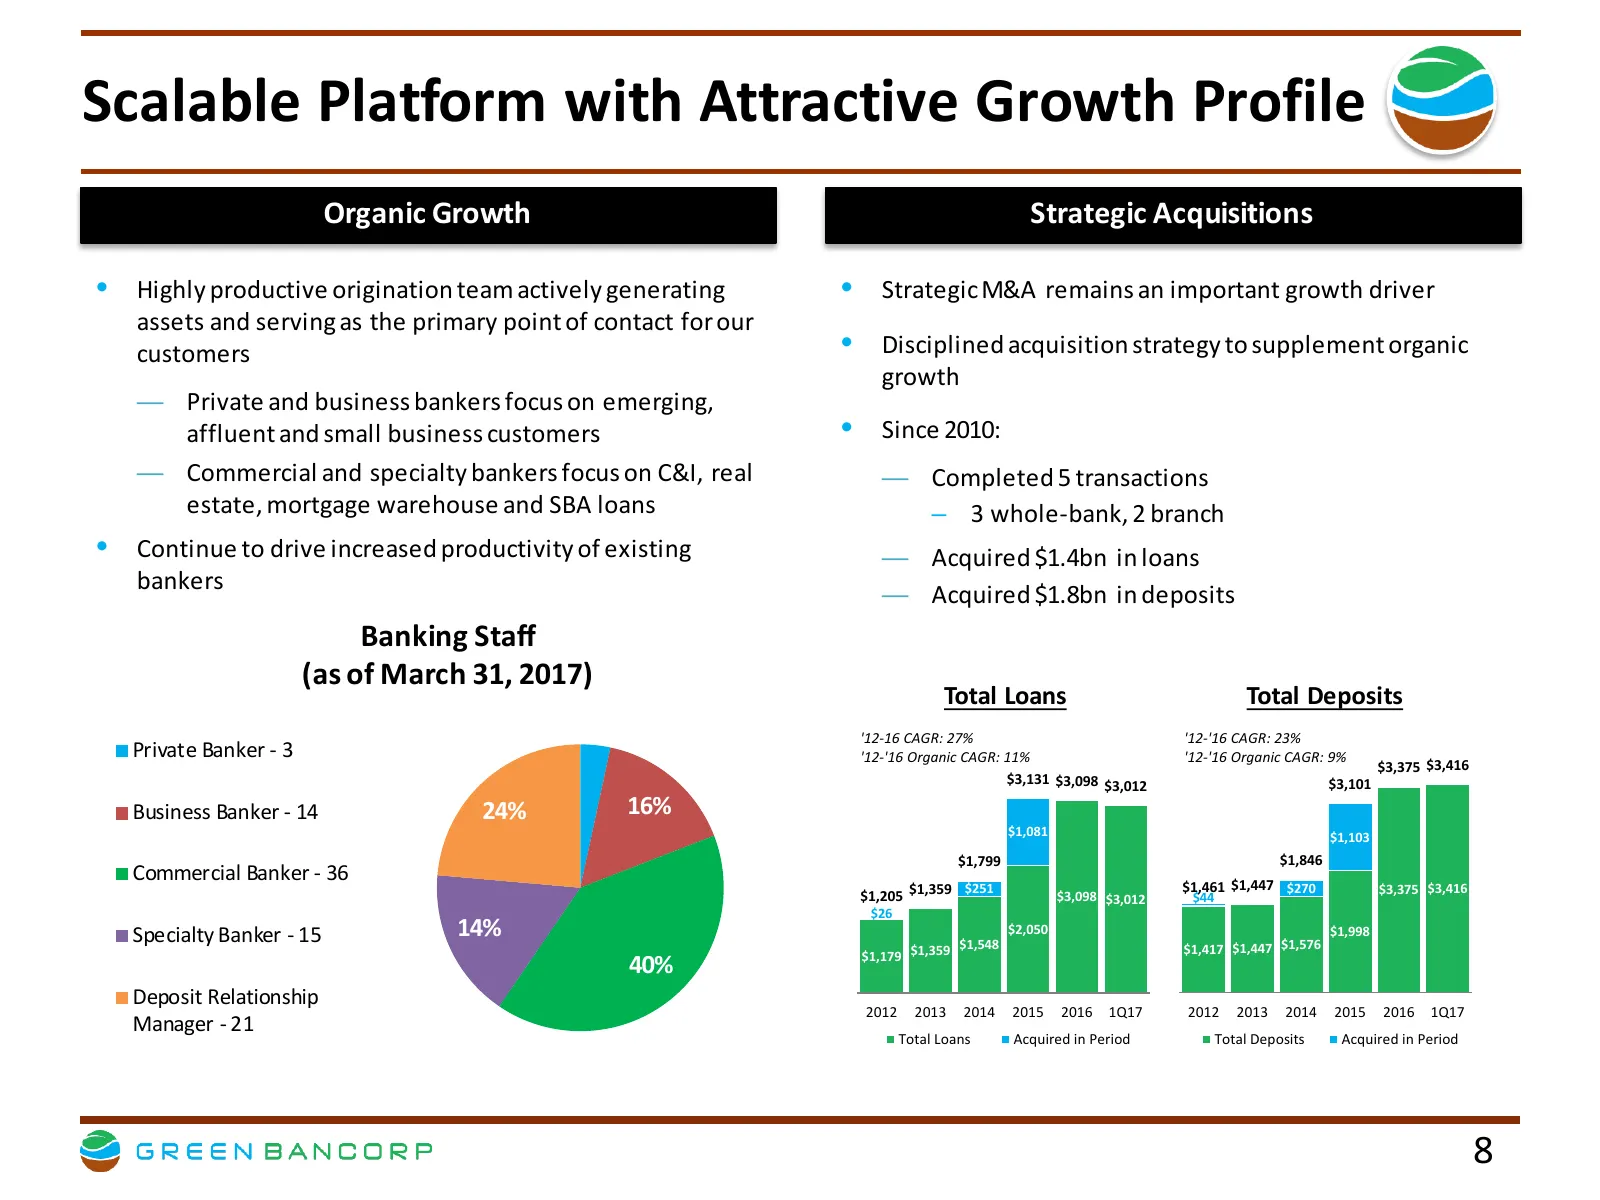
Scalable Platform with Attractive Growth Profile Organic Growth Strategic Acquisitions • Highly productive origination team actively generating • Strategic M&A remains an important growth driver assets and serving as the primary point of contact for our customers • Disciplined acquisition strategy t
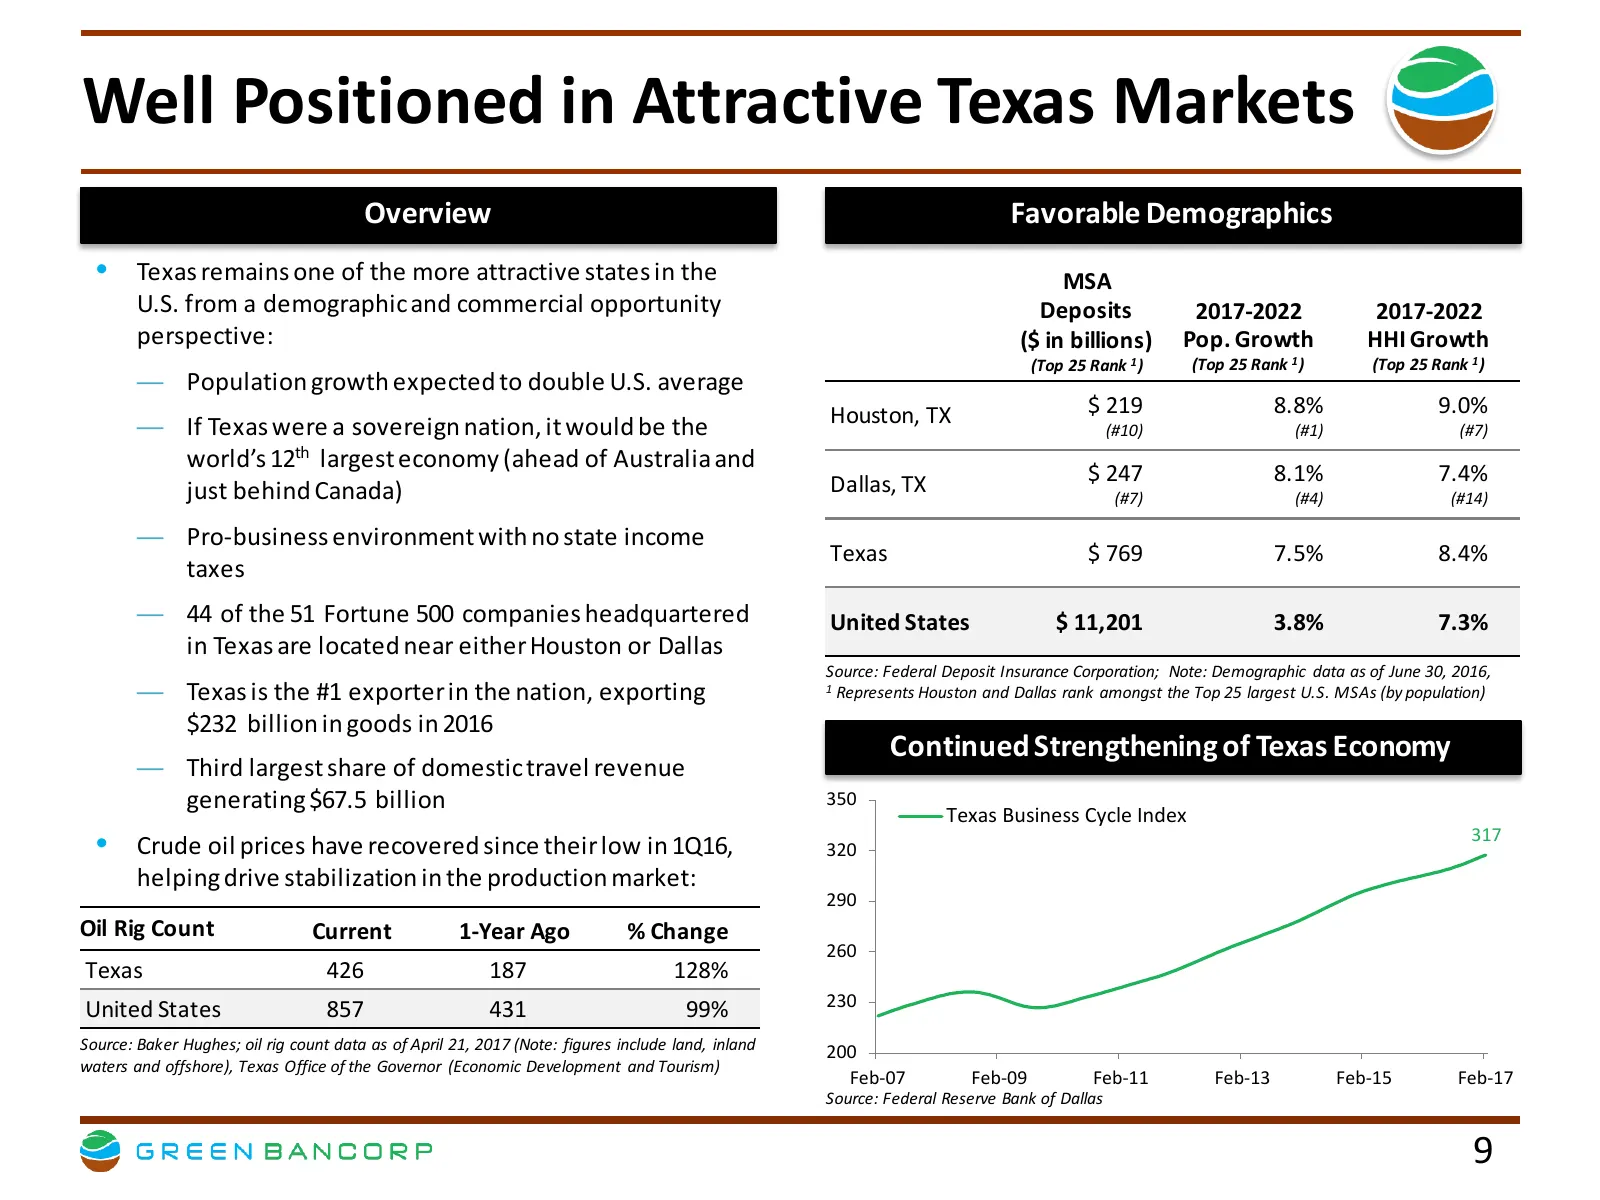
Slide 9: Well Positioned in Attractive Texas Markets
Well Positioned in Attractive Texas Markets Overview Favorable Demographics • Texas remains one of the more attractive states in the MSA U.S. from a demographic and commercial opportunity Deposits 2017-2022 2017-2022 perspective: ($ in billions) Pop. Growth HHI Growth (Top 25 Rank 1 ) (Top 25 Rank 1
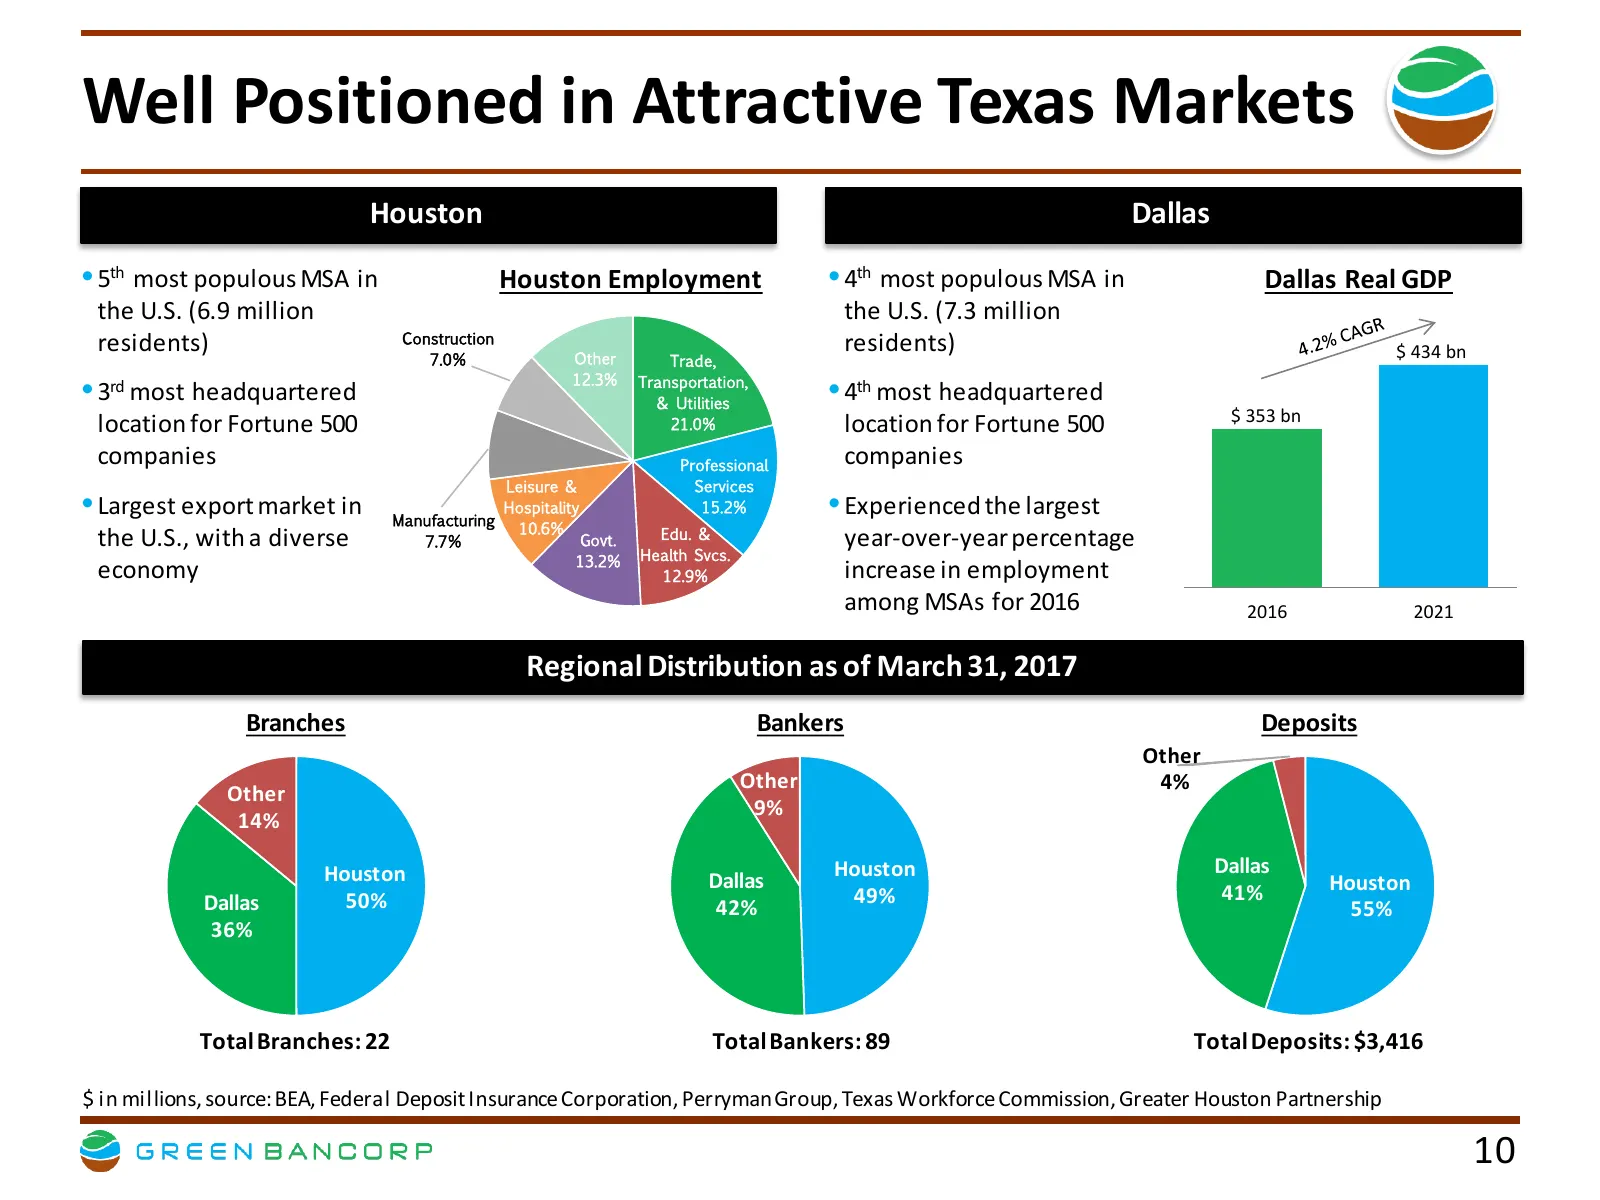
Slide 10: Well Positioned in Attractive Texas Markets
Well Positioned in Attractive Texas Markets Houston Dallas • 5th most populous MSA in Houston Employment • 4th most populous MSA in Dallas Real GDP the U.S. (6.9 million the U.S. (7.3 million residents) Construction Other residents) $ 434 bn 7.0% Trade, 12.3% Transportation, • 3rd most headquarte
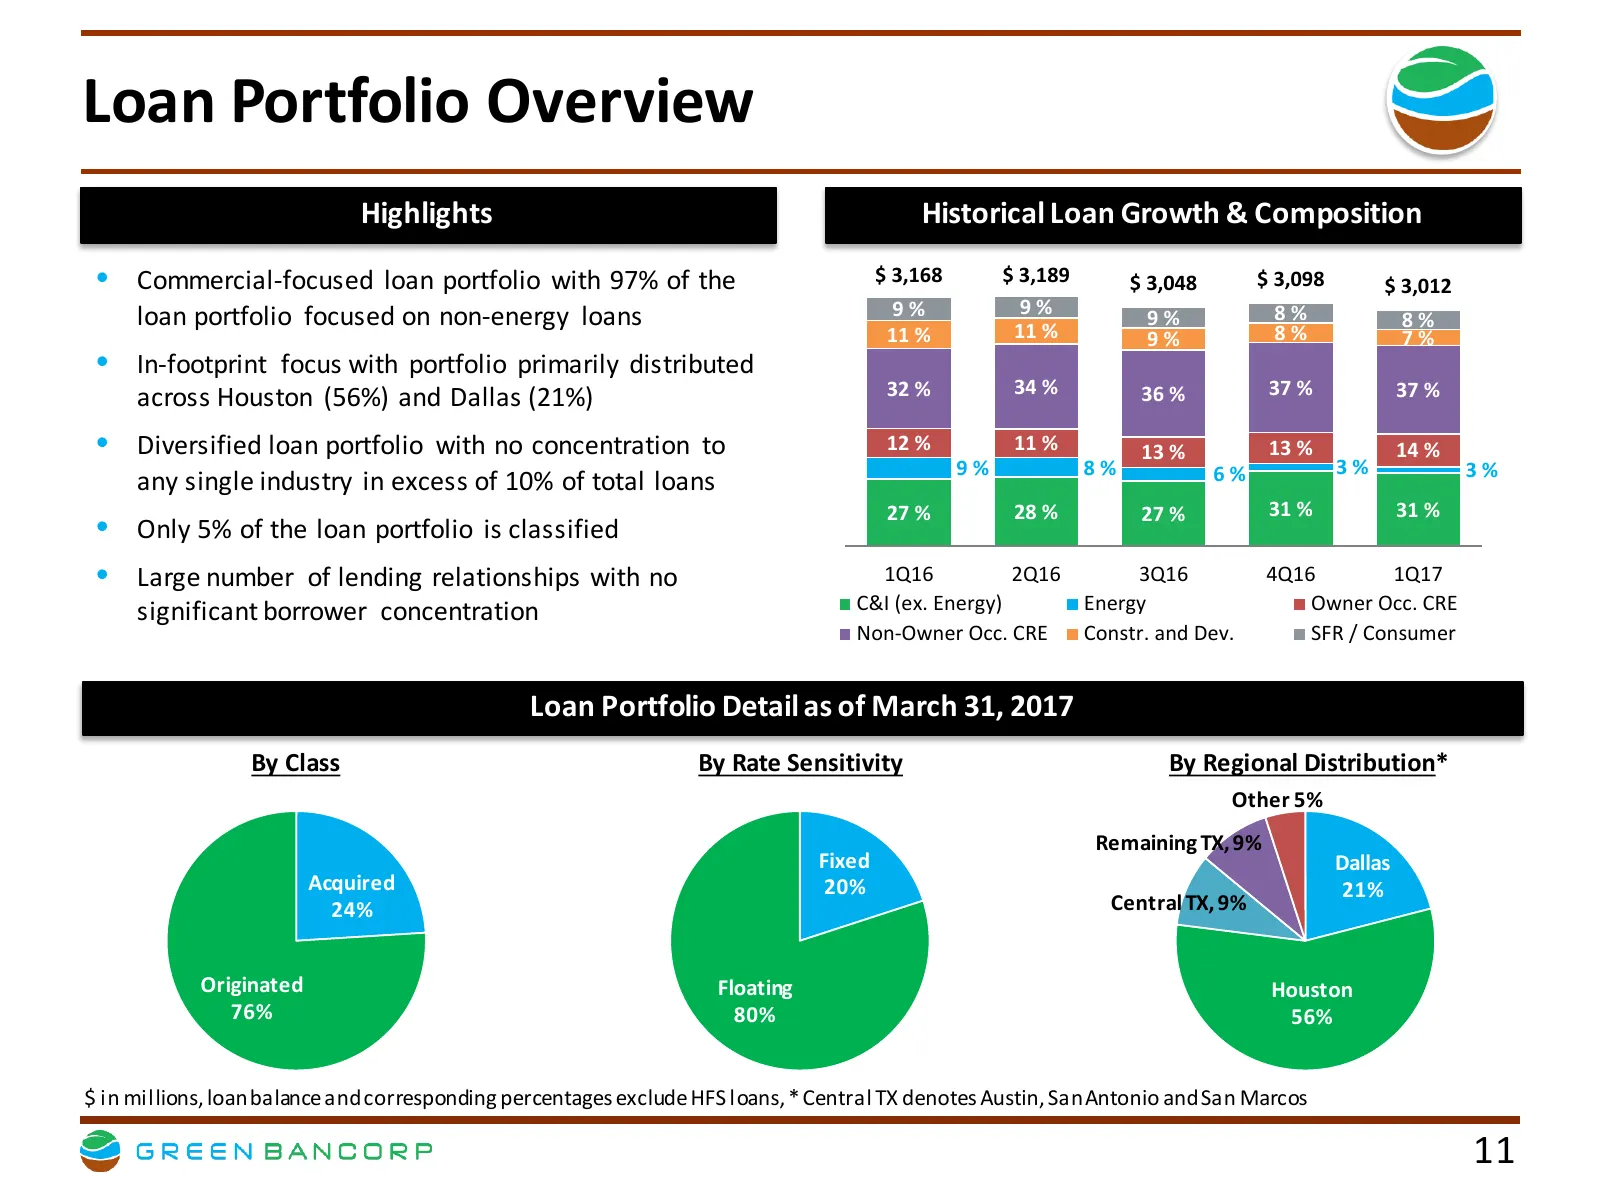
Slide 11: Loan Portfolio Overview
Loan Portfolio Overview Highlights Historical Loan Growth & Composition • Commercial-focused loan portfolio with 97% of the $ 3,168 $ 3,189 $ 3,048 $ 3,098 $ 3,012 loan portfolio focused on non-energy loans 9% 9% 9% 8% 8% 11 % 11 % 9% 8% 7% • In-footprint focus with portfolio primarily distributed 3
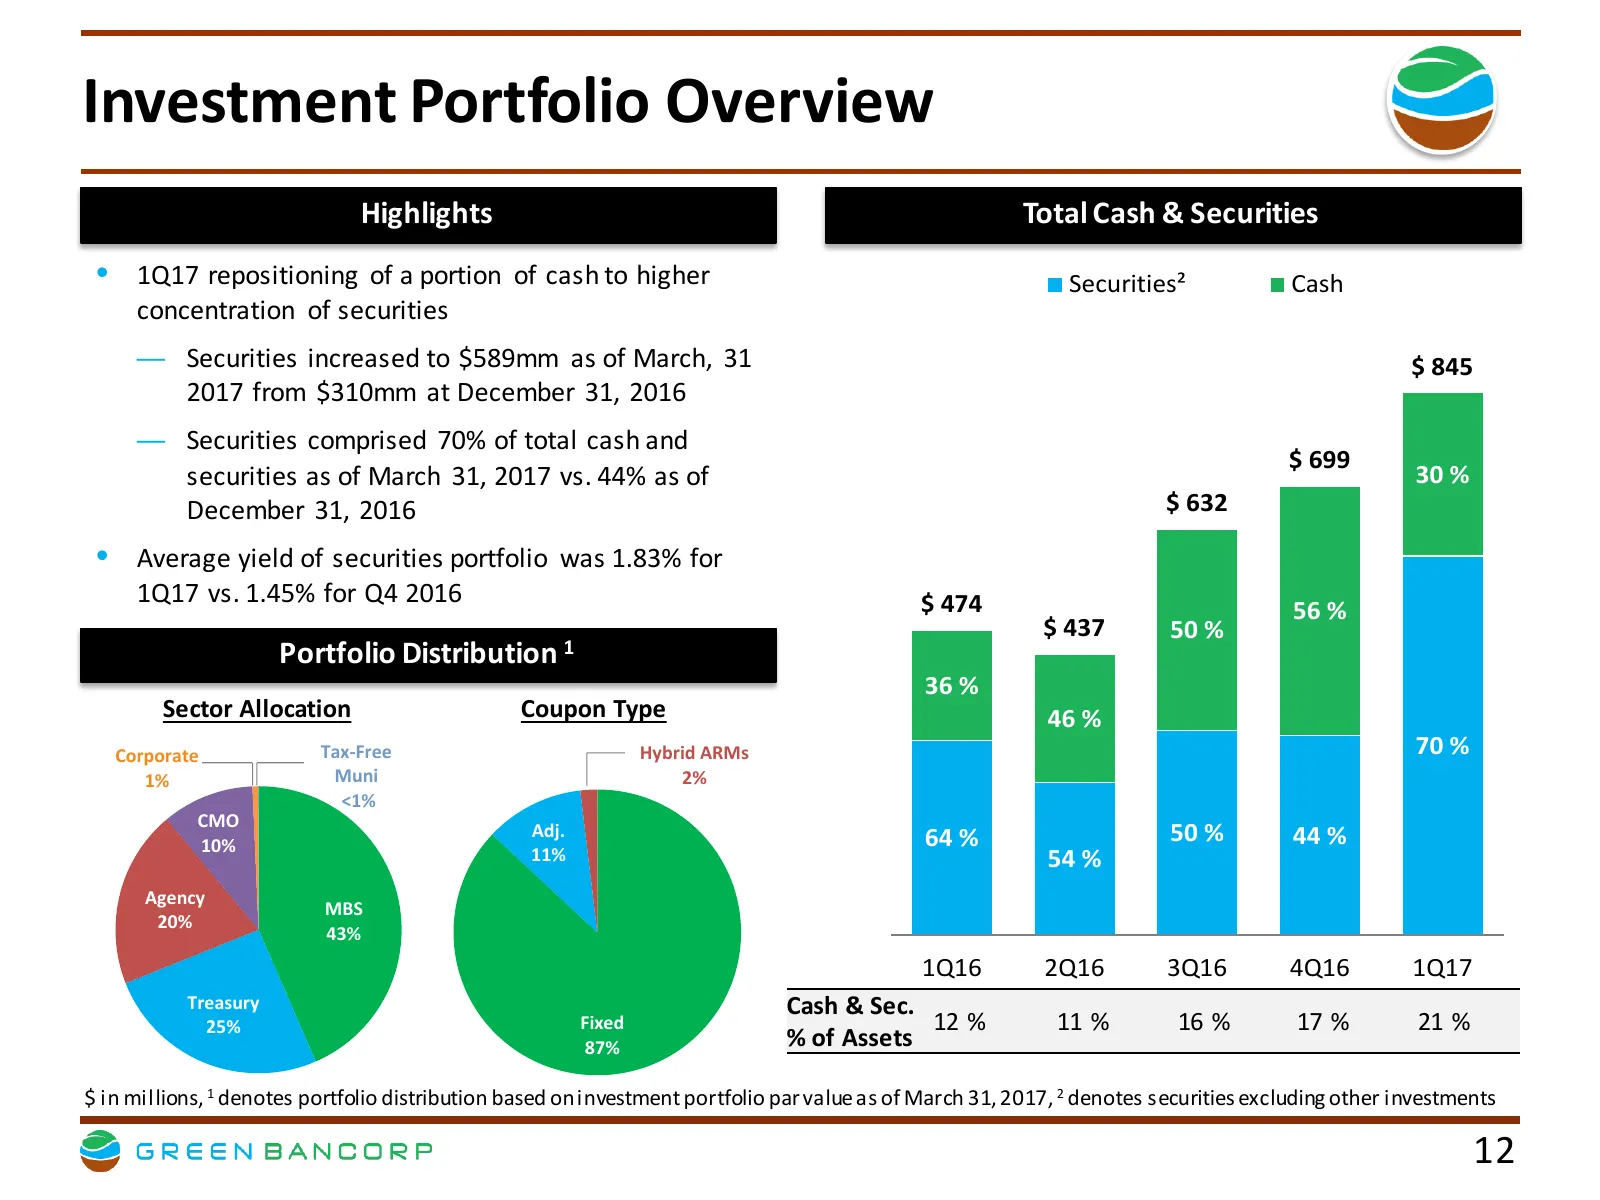
Slide 12: Investment Portfolio Overview
Investment Portfolio Overview Highlights Total Cash & Securities • 1Q17 repositioning of a portion of cash to higher Securities² Cash concentration of securities — Securities increased to $589mm as of March, 31 $ 845 2017 from $310mm at December 31, 2016 — Securities comprised 70% of total cash and
Slide 13: Deposits & Liquidity
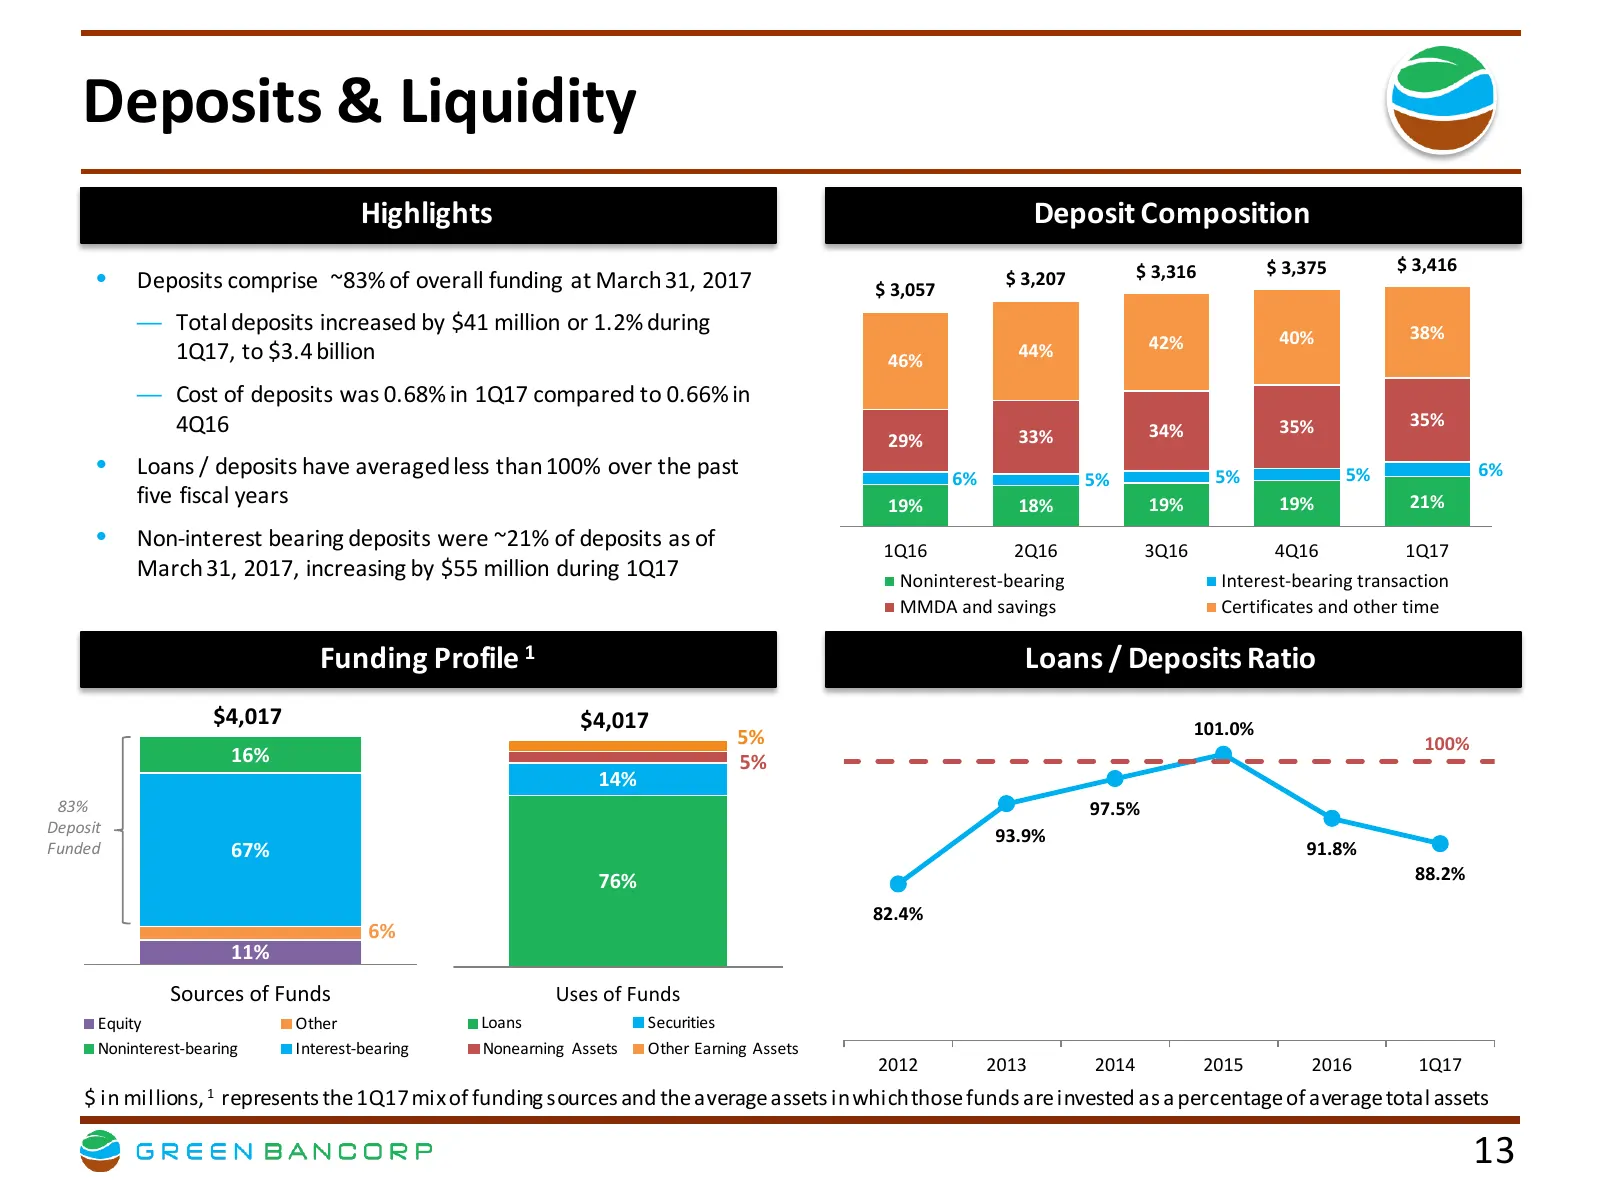
Deposits & Liquidity Highlights Deposit Composition $ 3,316 $ 3,375 $ 3,416 • Deposits comprise ~83% of overall funding at March 31, 2017 $ 3,057 $ 3,207 — Total deposits increased by $41 million or 1.2% during 38% 42% 40% 1Q17, to $3.4 billion 46% 44% — Cost of deposits was 0.68% in 1Q17 compared t
Slide 14: Asset Quality Reflects Improving Risk Profile
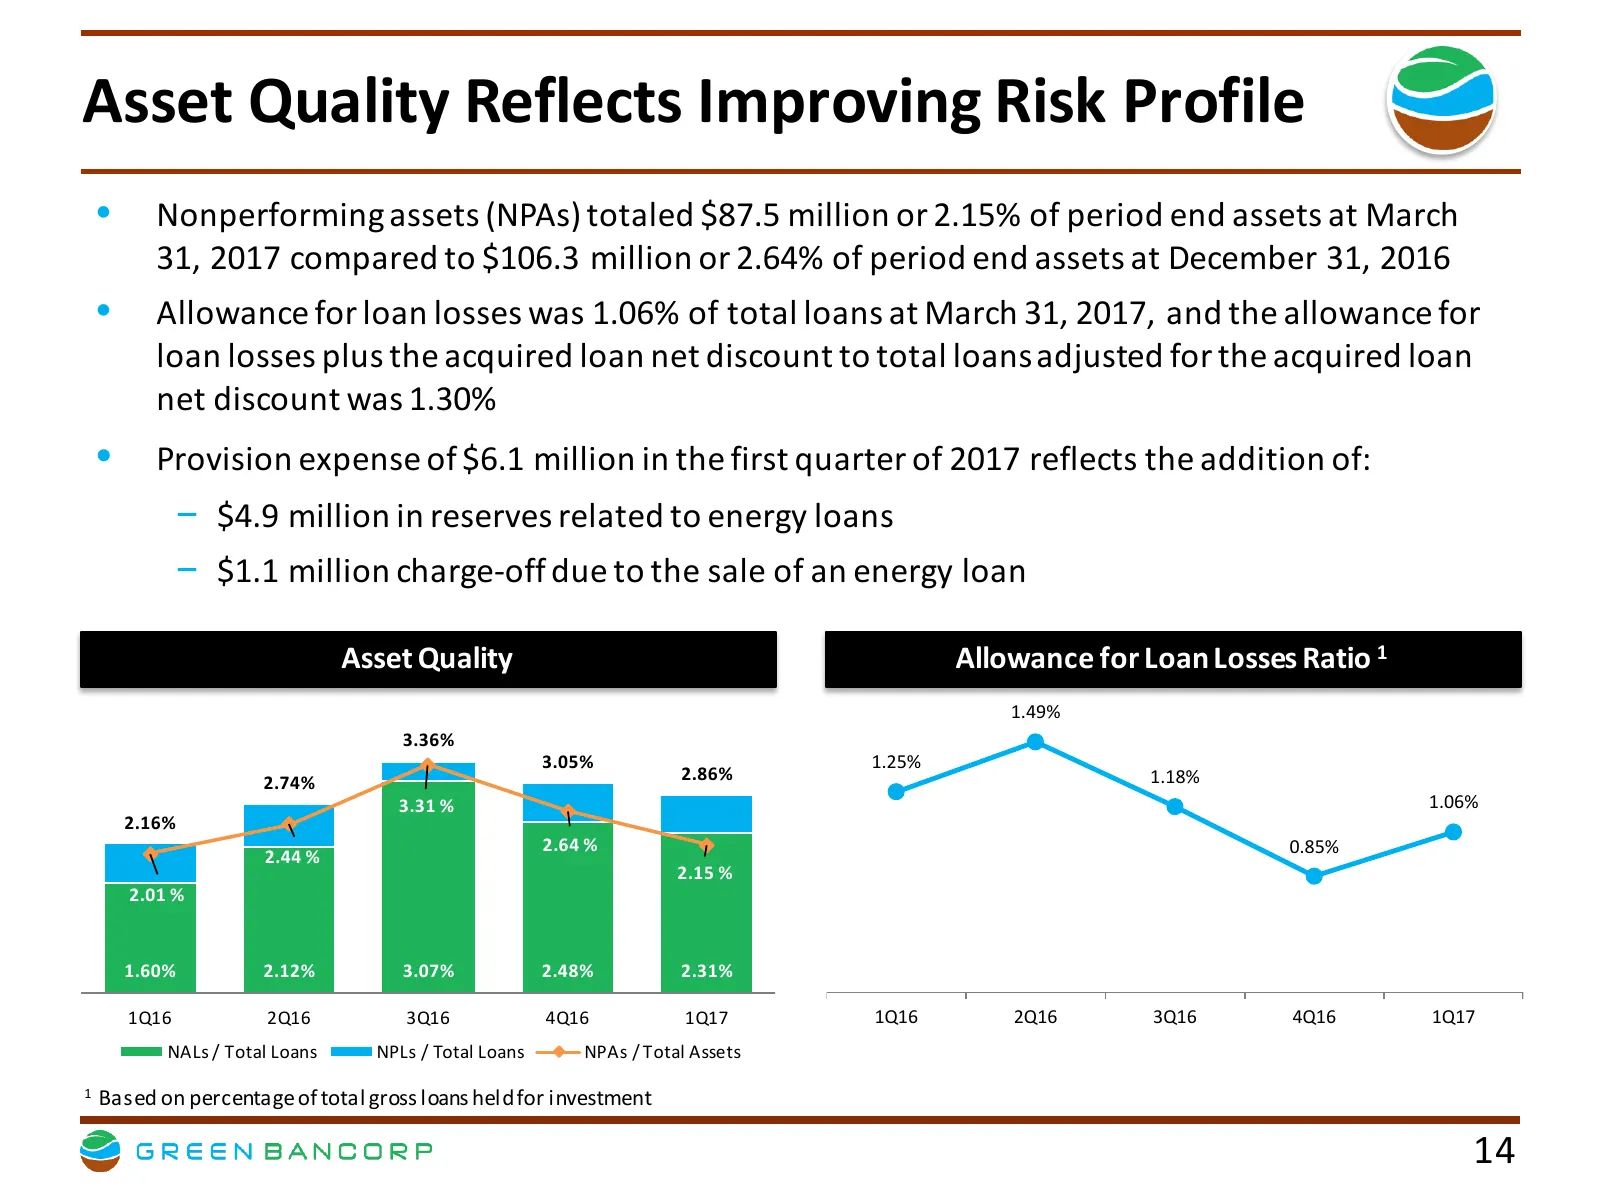
Asset Quality Reflects Improving Risk Profile • Nonperforming assets (NPAs) totaled $87.5 million or 2.15% of period end assets at March 31, 2017 compared to $106.3 million or 2.64% of period end assets at December 31, 2016 • Allowance for loan losses was 1.06% of total loans at March 31, 2017, and
Slide 15: Overview of Energy Portfolio Progress
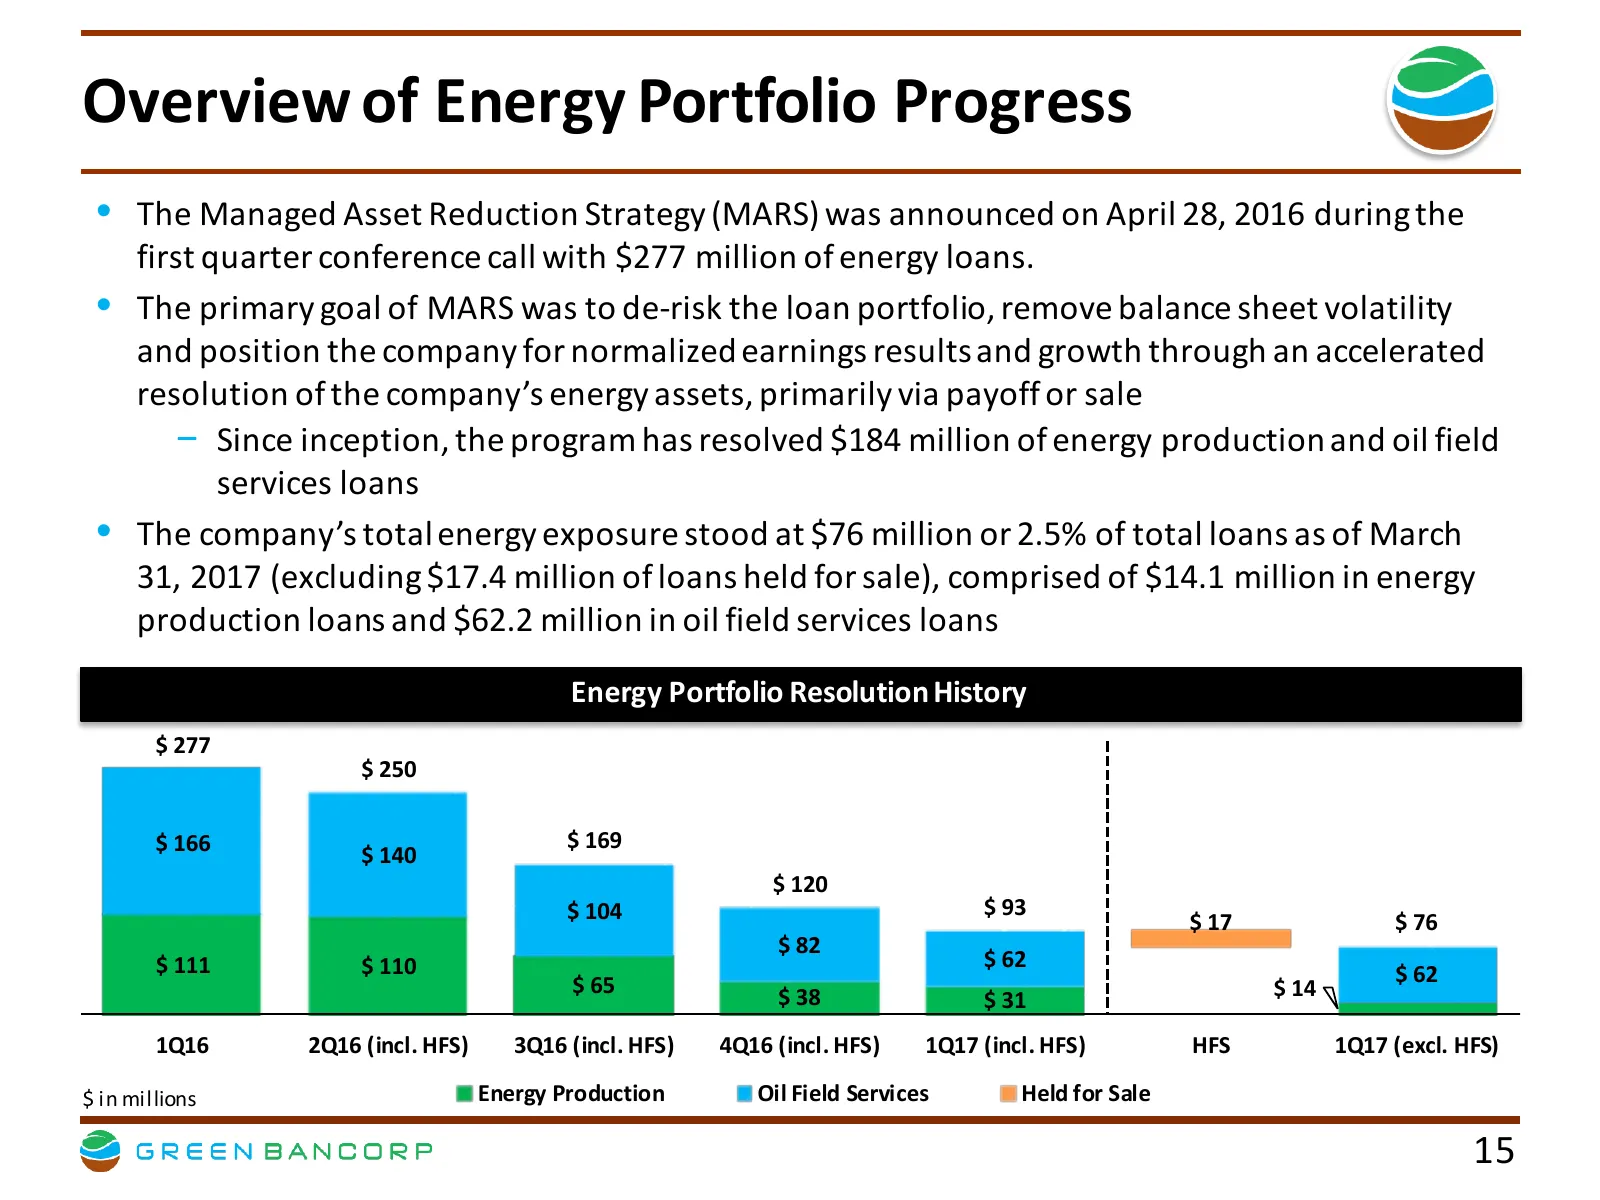
Overview of Energy Portfolio Progress • The Managed Asset Reduction Strategy (MARS) was announced on April 28, 2016 during the first quarter conference call with $277 million of energy loans. • The primary goal of MARS was to de-risk the loan portfolio, remove balance sheet volatility and position t
Slide 16: Performance Metrics
Performance Metrics Efficiency Ratio EPS 75% $0.50 70% 61.9% $0.25 $0.19 65% 61.0% $0.05 $0.10 $0.07 60% 55.4% $0.00 54.6% 55% 50.8% -$0.25 $(0.25) 50% 45% -$0.50 1Q16 2Q16 3Q16 4Q16 1Q17 1Q16 2Q16 3Q16 4Q16 1Q17 Reported Reported ROAA ROATCE 2.5% 1.99% 10% 8.88% 1.74% 1.75% 2.0% 1.49% 1.36% 4.57% 3
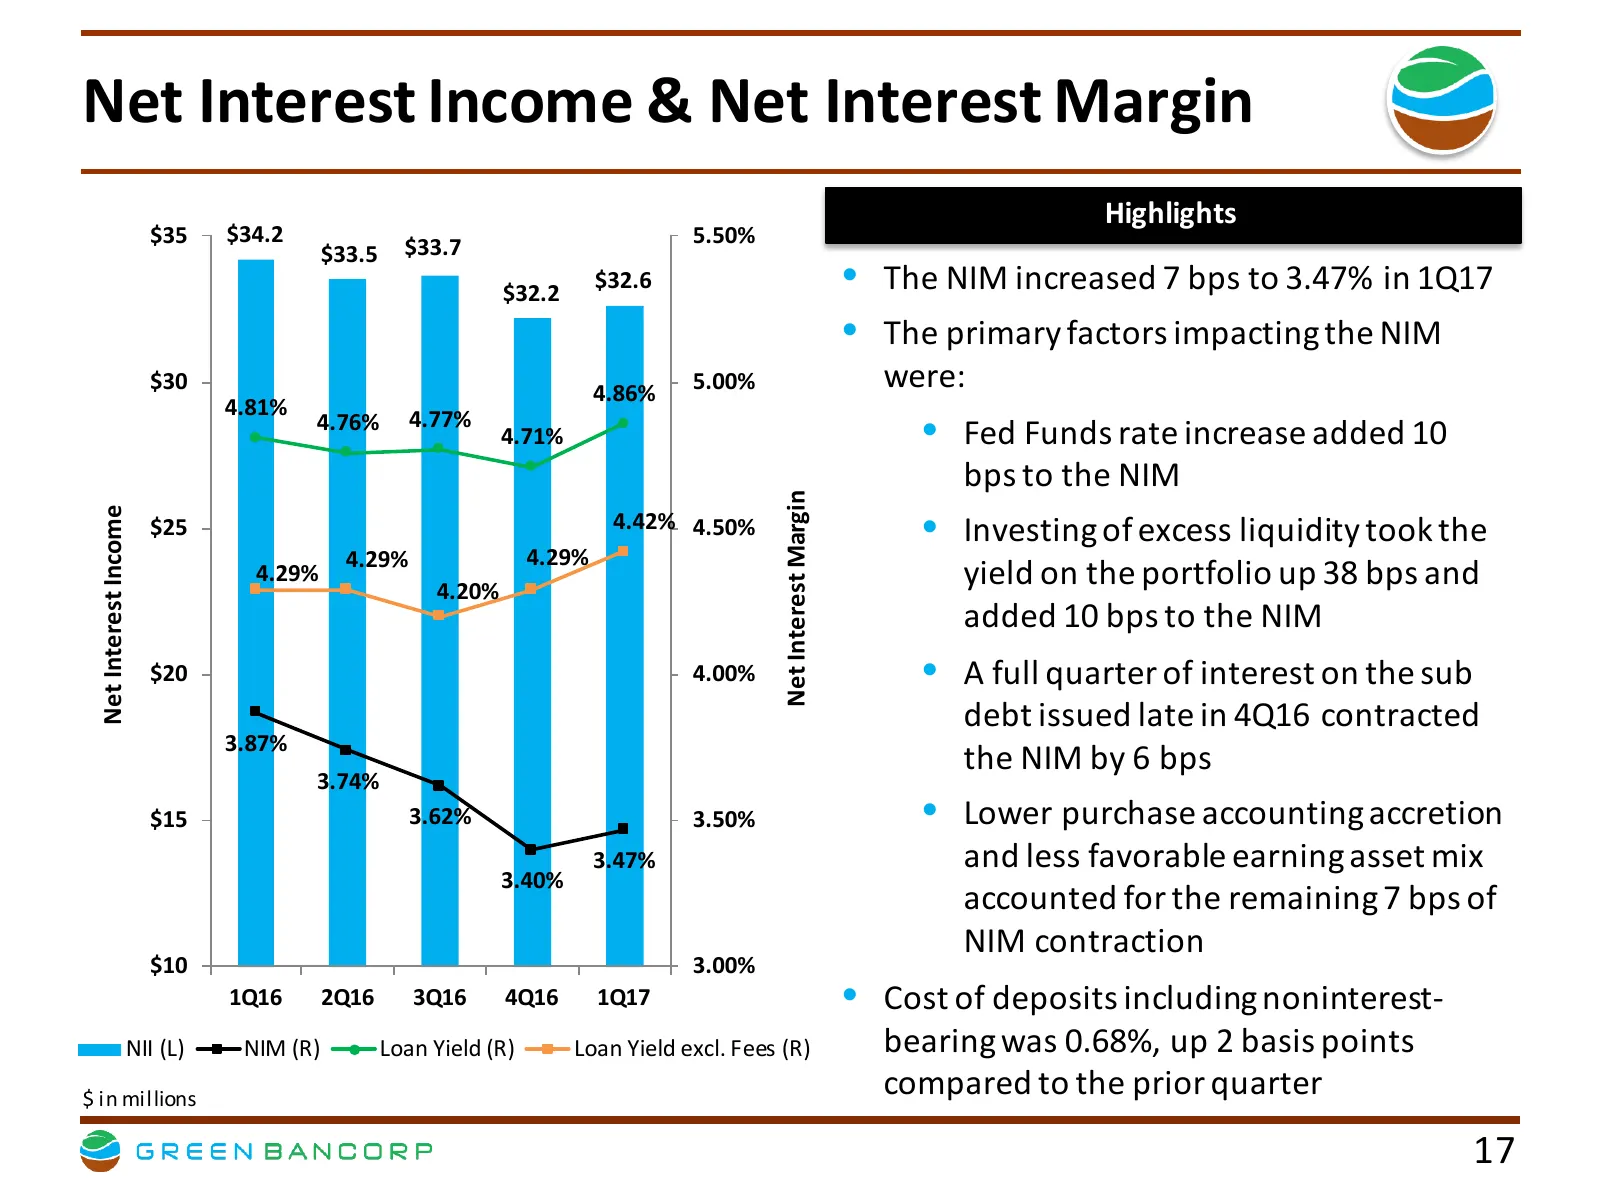
Slide 17: Net Interest Income & Net Interest Margin
Net Interest Income & Net Interest Margin Highlights $35 $34.2 5.50% $33.5 $33.7 $32.2 $32.6 • The NIM increased 7 bps to 3.47% in 1Q17 • The primary factors impacting the NIM $30 4.86% 5.00% were: 4.81% 4.77% 4.76% 4.71% • Fed Funds rate increase added 10 bps to the NIM Net Interest Margin Net Inte
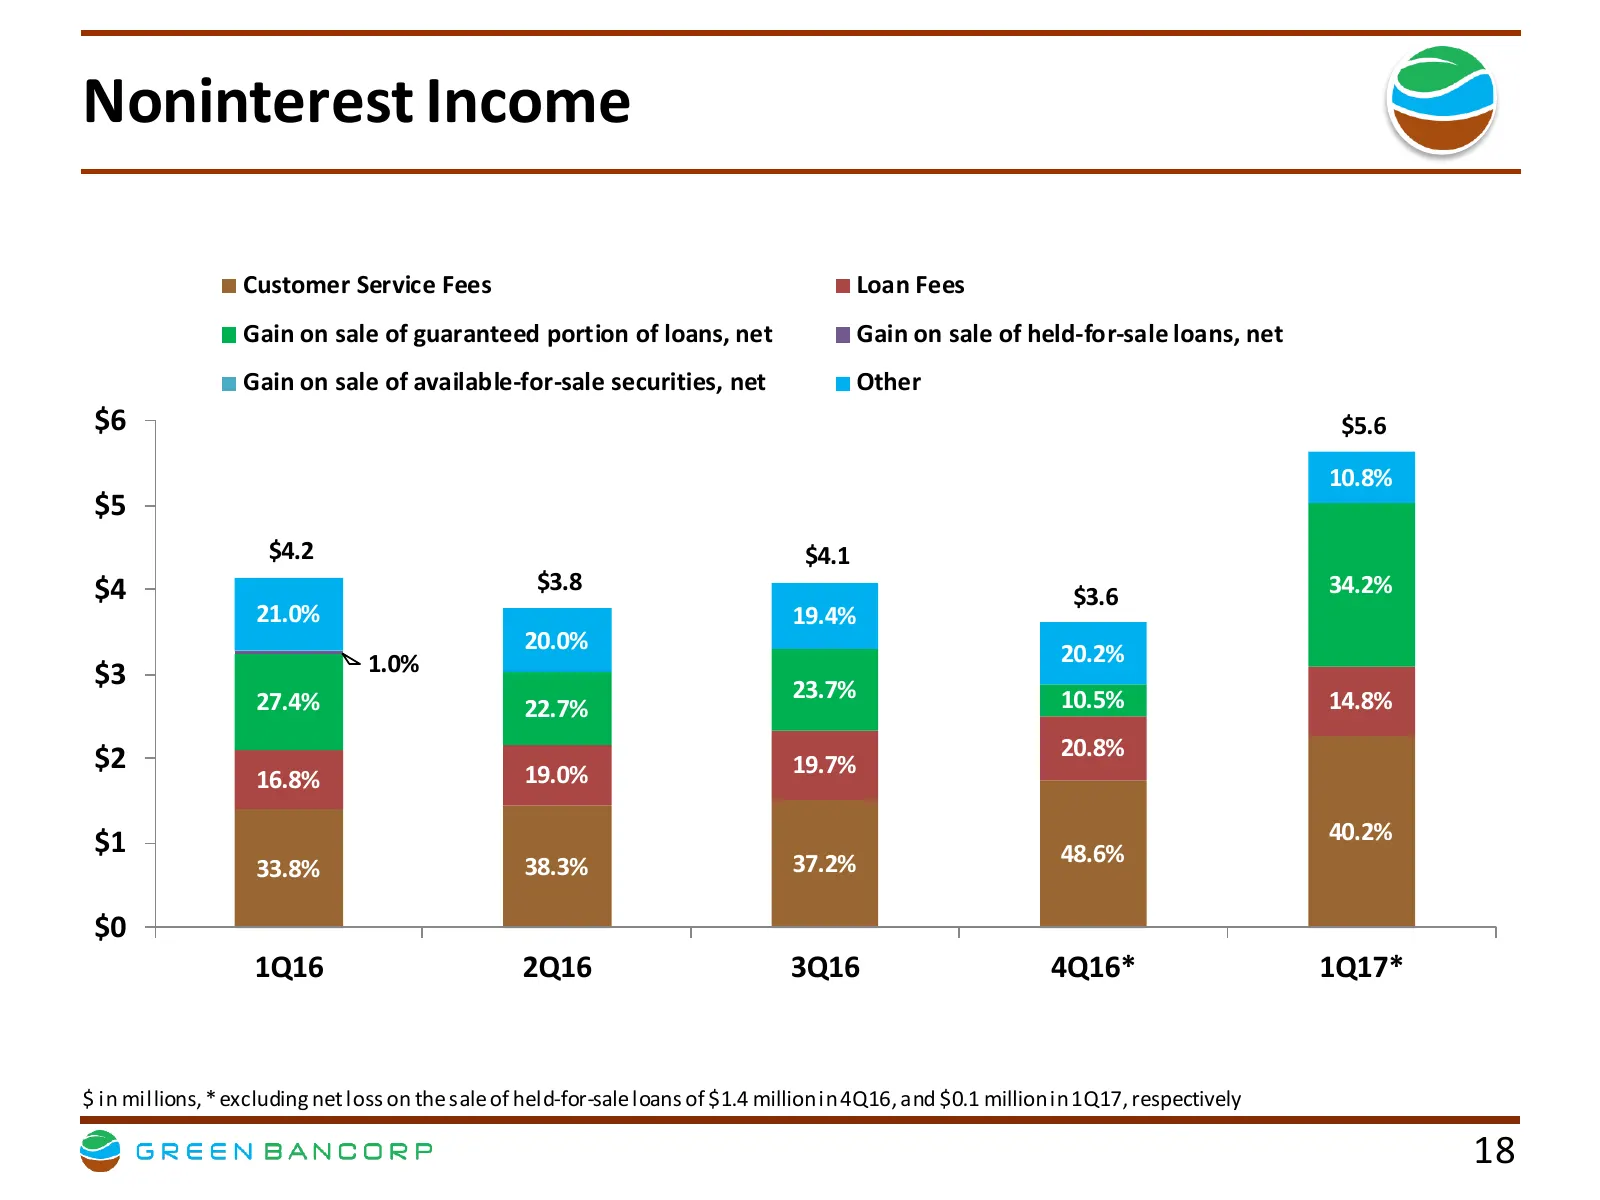
Slide 18: Noninterest Income
Noninterest Income Customer Service Fees Loan Fees Gain on sale of guaranteed portion of loans, net Gain on sale of held-for-sale loans, net Gain on sale of available-for-sale securities, net Other $6 $5.6 10.8% $5 $4.2 $4.1 $4 $3.8 34.2% $3.6 21.0% 19.4% 20.0% 20.2% $3 1.0% 27.4% 23.7% 10.5% 14.8%
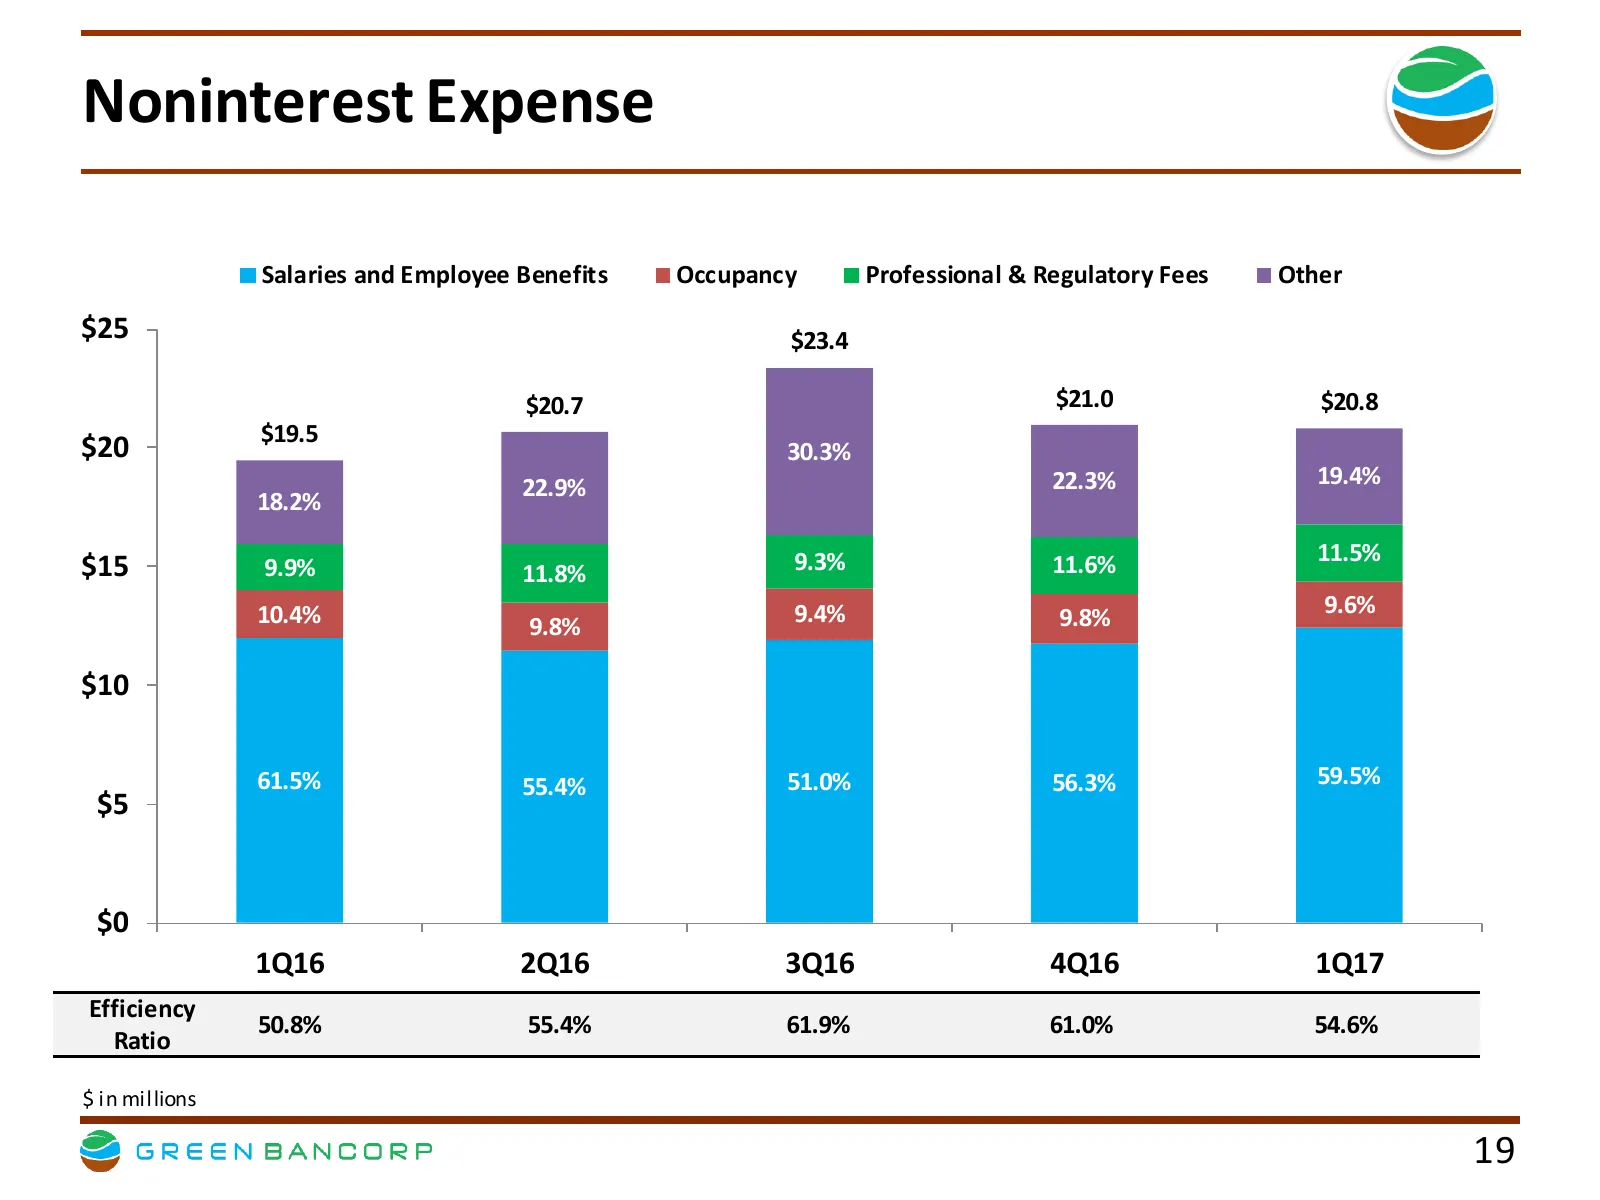
Slide 19: Noninterest Expense
Noninterest Expense Salaries and Employee Benefits Occupancy Professional & Regulatory Fees Other $25 $23.4 $20.7 $21.0 $20.8 $19.5 $20 30.3% 22.9% 22.3% 19.4% 18.2% 9.3% 11.5% $15 9.9% 11.8% 11.6% 10.4% 9.4% 9.6% 9.8% 9.8% $10 61.5% 55.4% 51.0% 56.3% 59.5% $5 $0 1Q16 2Q16 3Q16 4Q16 1Q17 Efficiency
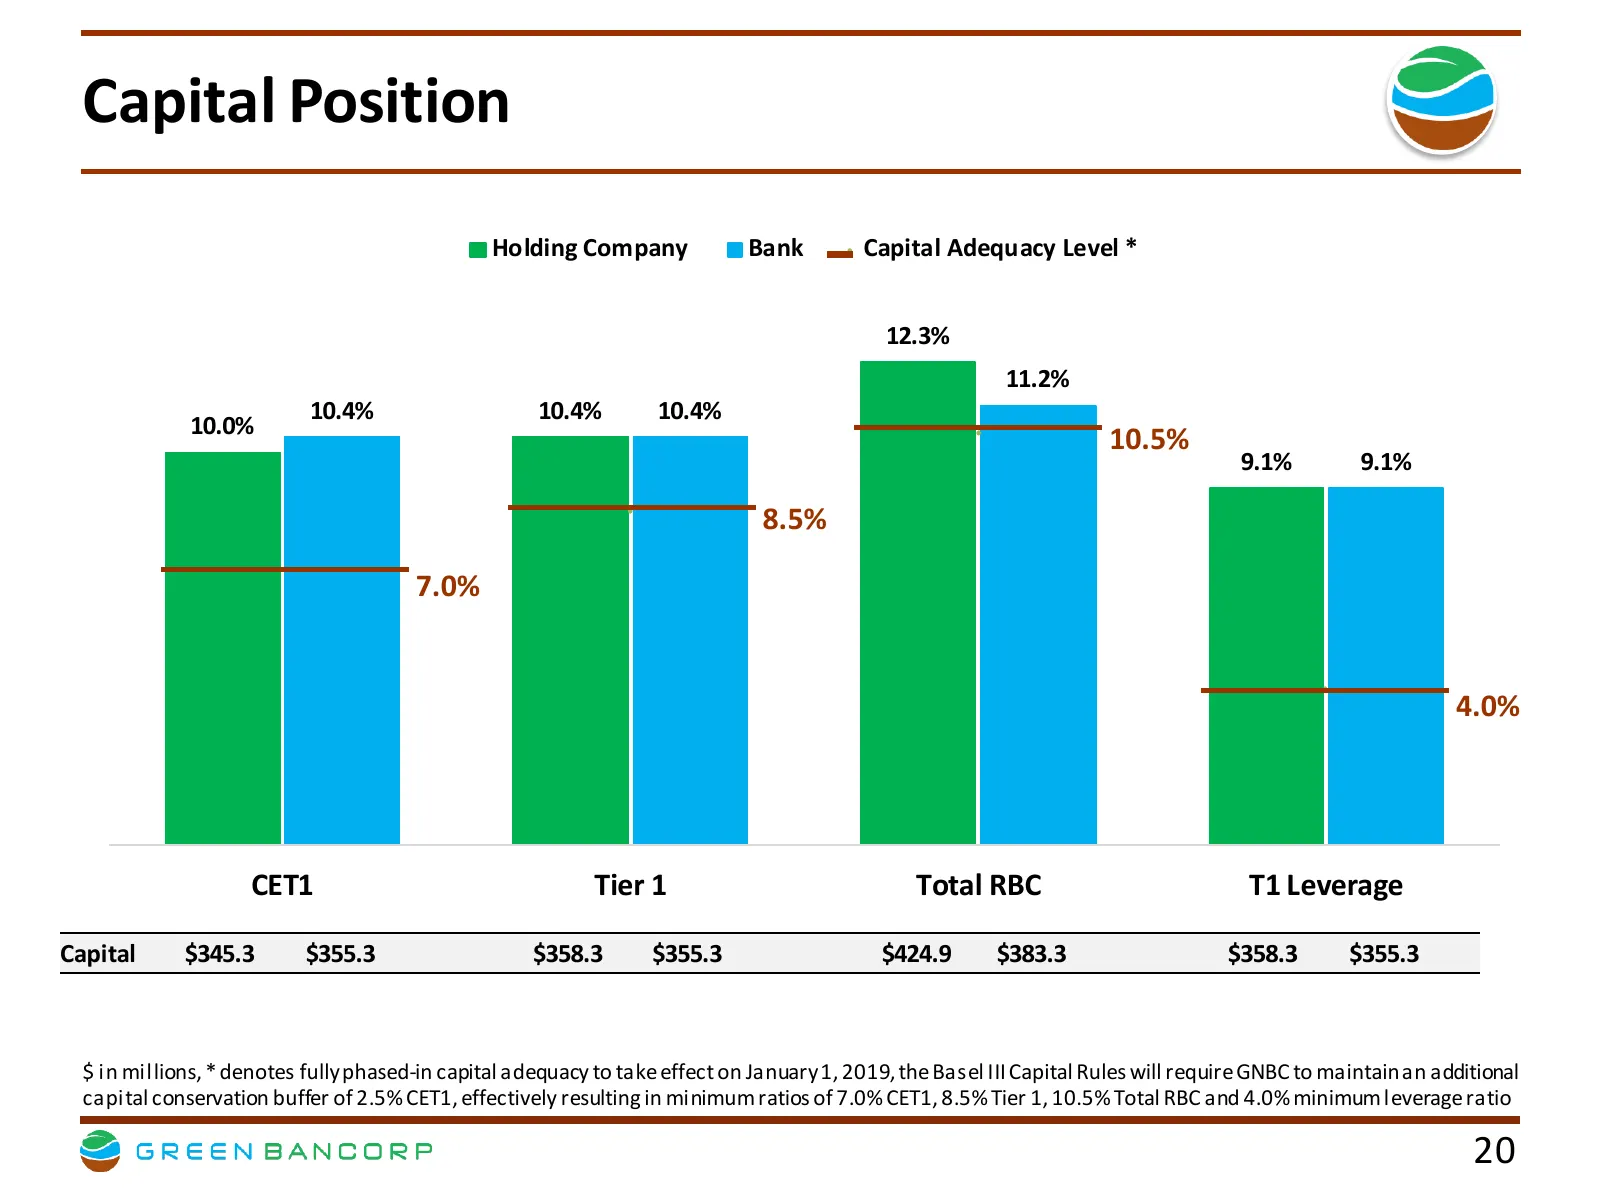
Slide 20: Capital Position
Capital Position Holding Company Bank Capital Adequacy Level * 12.3% 11.2% 10.4% 10.4% 10.4% 10.0% 10.5% 9.1% 9.1% 8.5% 7.0% 4.0% CET1 Tier 1 Total RBC T1 Leverage Capital $345.3 $355.3 $358.3 $355.3 $424.9 $383.3 $358.3 $355.3 $ in millions, * denotes fully phased-in capital adequacy to take effect
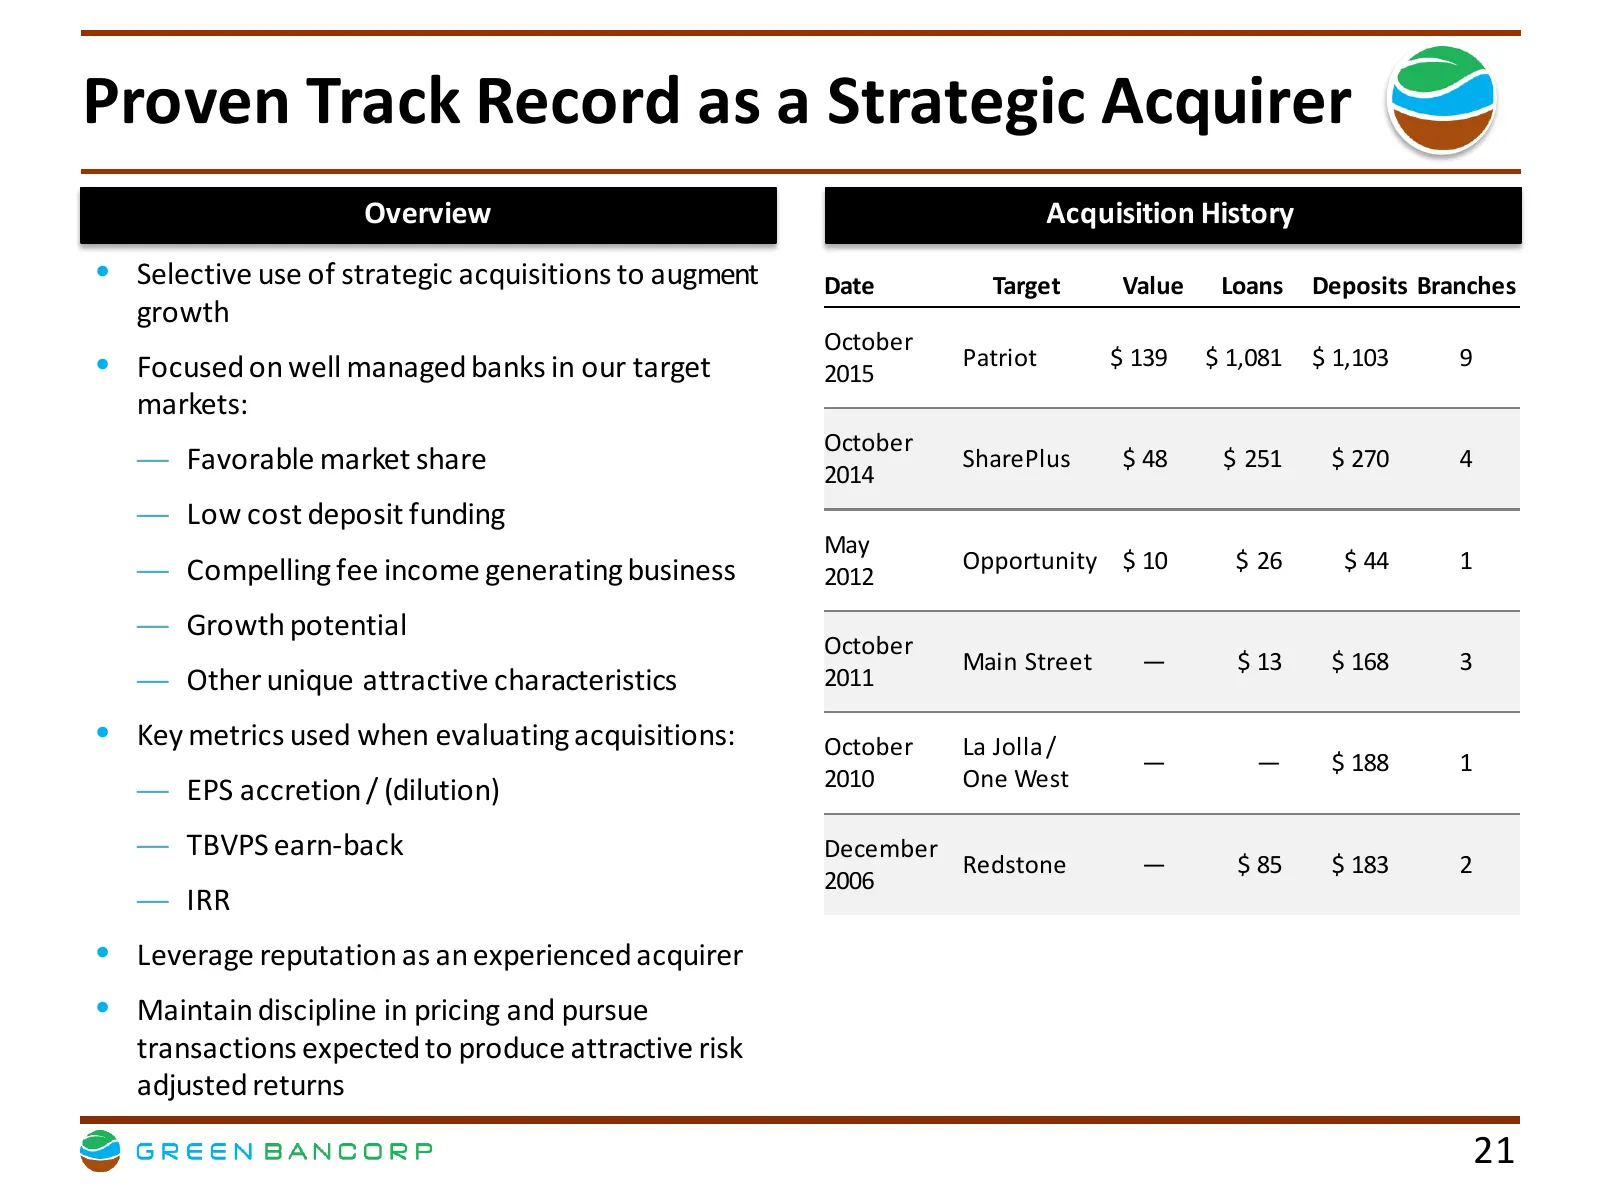
Slide 21: Proven Track Record as a Strategic Acquirer
Proven Track Record as a Strategic Acquirer Overview Acquisition History • Selective use of strategic acquisitions to augment Date Target Value Loans Deposits Branches growth October • Focused on well managed banks in our target Patriot $ 139 $ 1,081 $ 1,103 9 2015 markets: October — Favorable marke
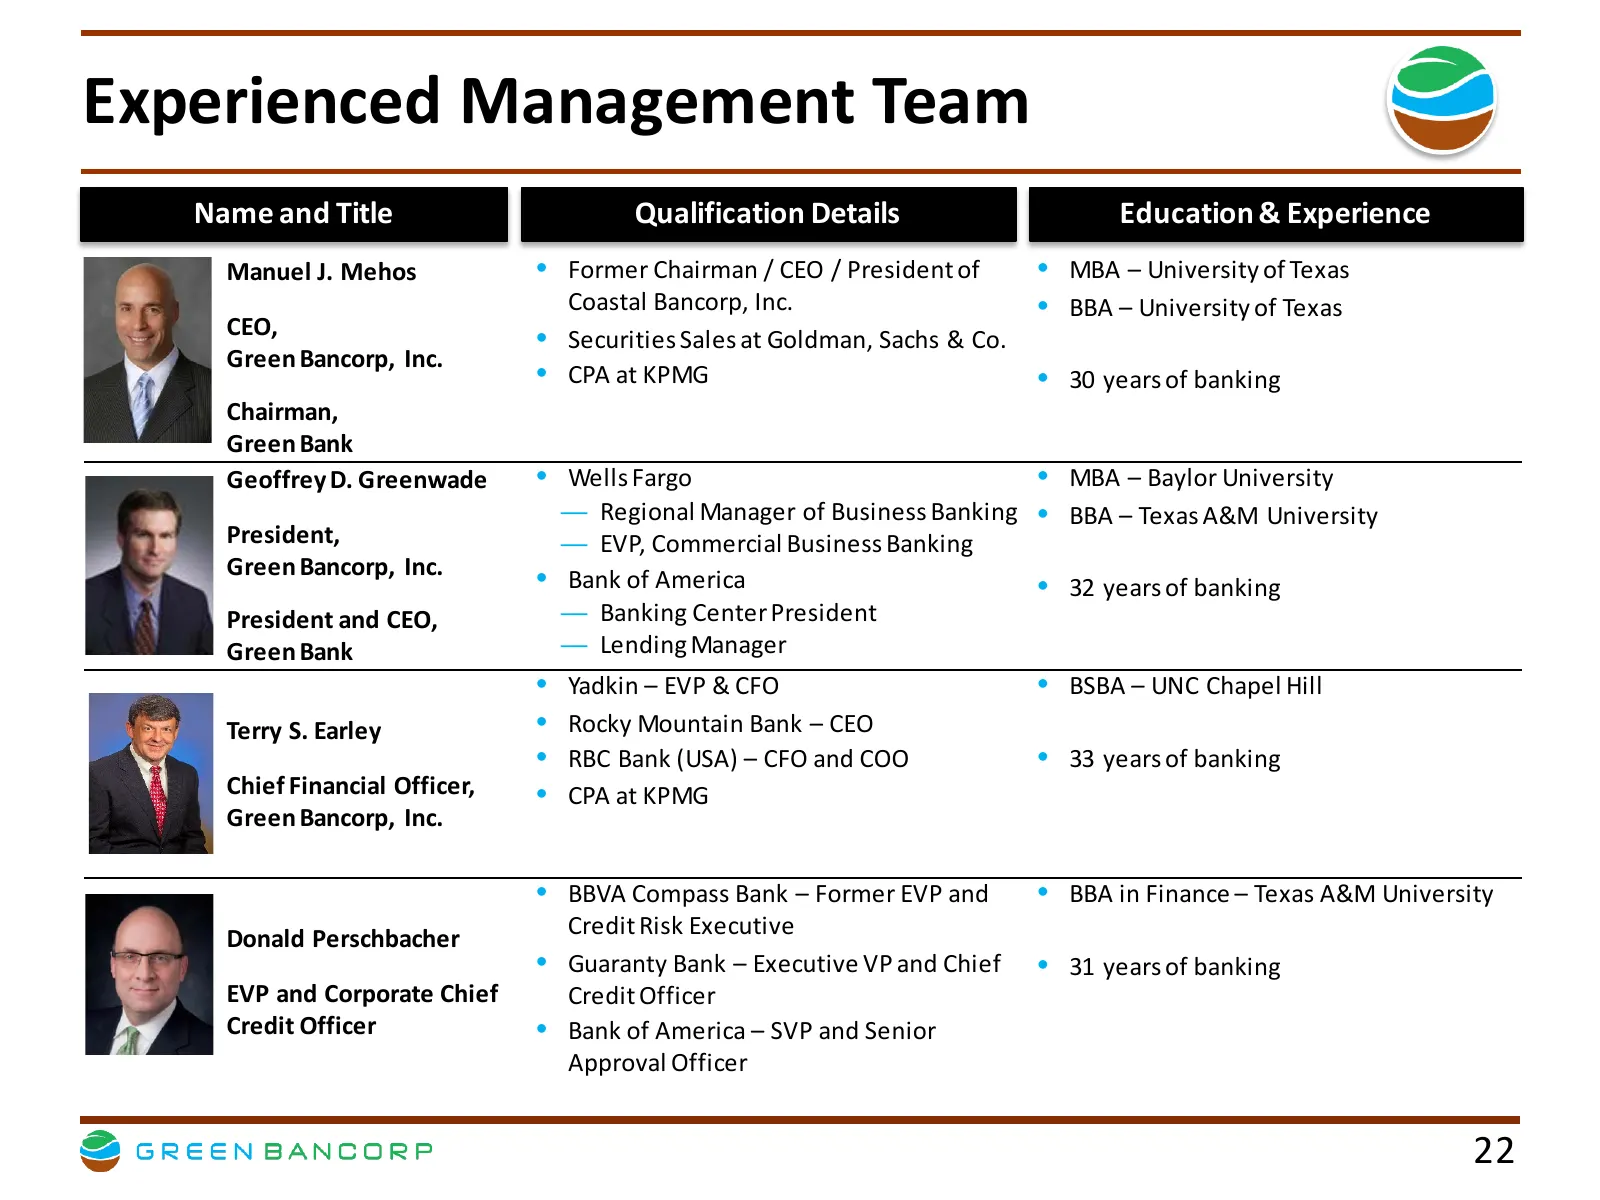
Slide 22: Experienced Management Team
Experienced Management Team Name and Title Qualification Details Education & Experience Manuel J. Mehos • Former Chairman / CEO / President of • MBA – University of Texas Coastal Bancorp, Inc. • BBA – University of Texas CEO, • Securities Sales at Goldman, Sachs & Co. Green Bancorp, Inc. • CPA at KP
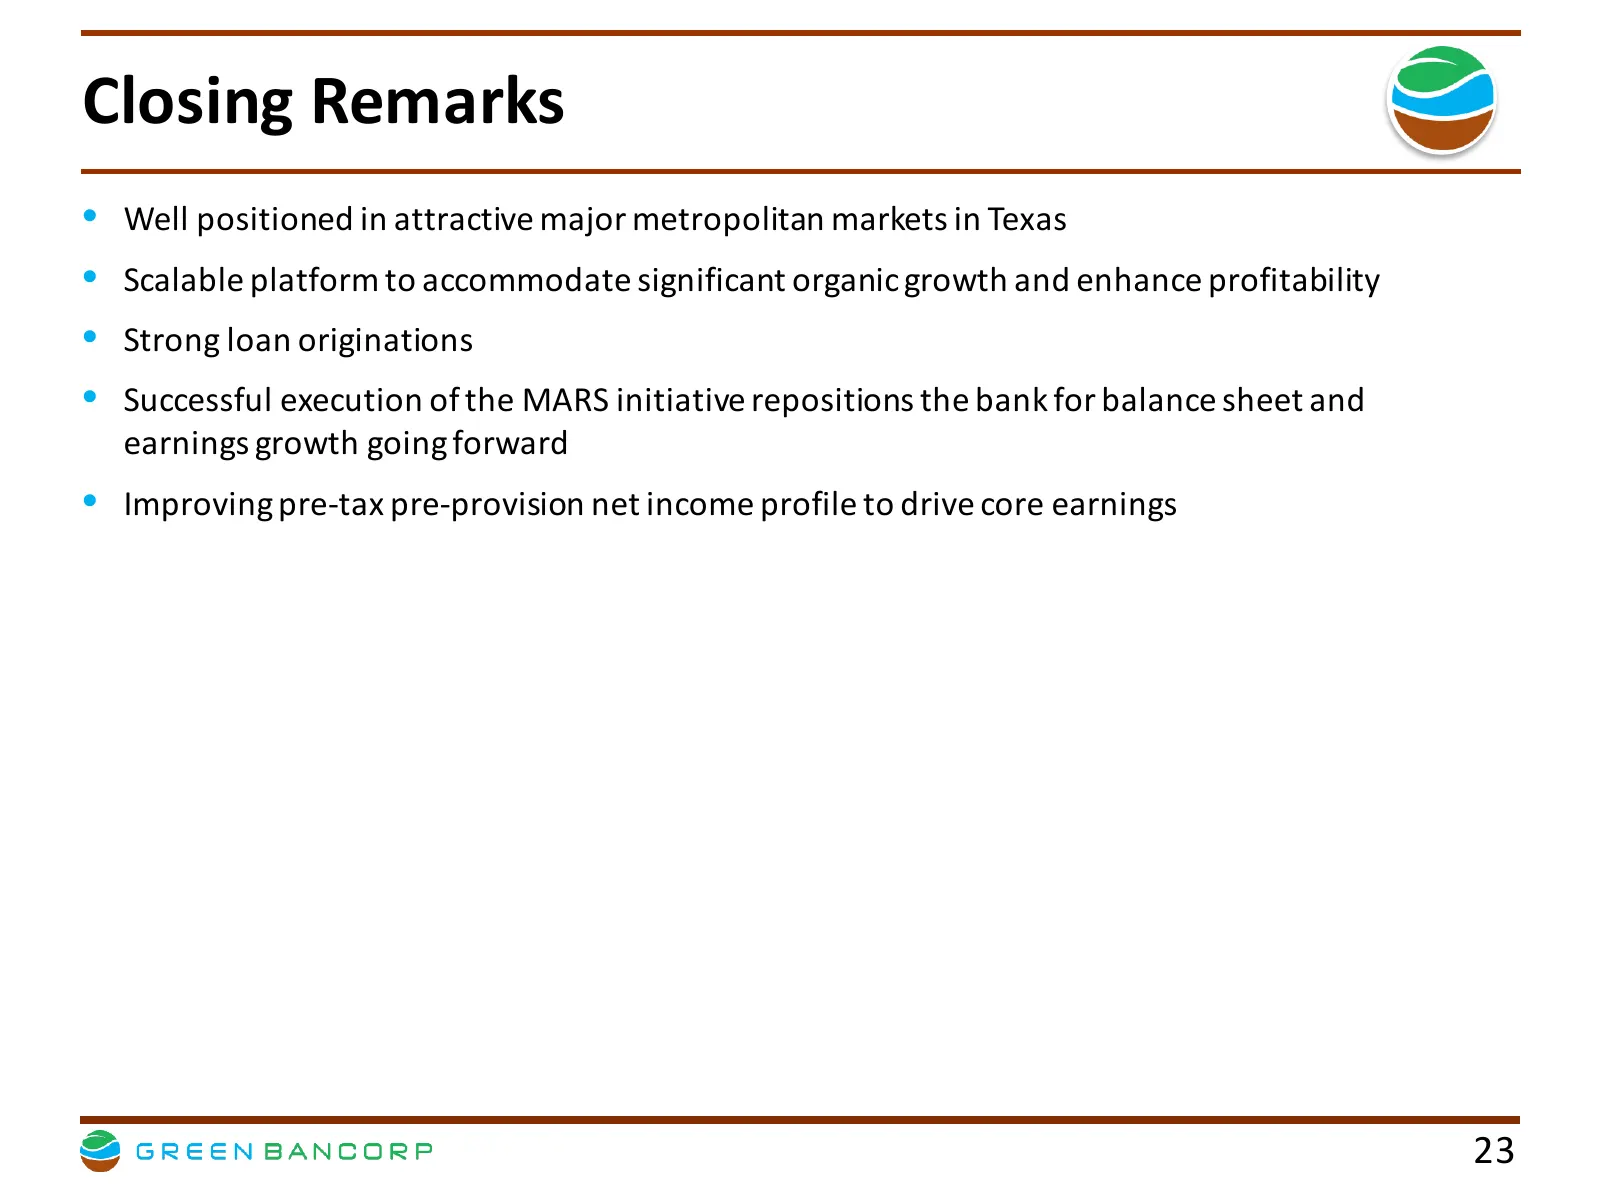
Slide 23: Closing Remarks
Closing Remarks • Well positioned in attractive major metropolitan markets in Texas • Scalable platform to accommodate significant organic growth and enhance profitability • Strong loan originations • Successful execution of the MARS initiative repositions the bank for balance sheet and earnings gro
Slide 24: Appendix
(VY FS 7 GREEN BANCORP Appendix 24
Slide 25: Commercial Real Estate (CRE) Portfolio Detail
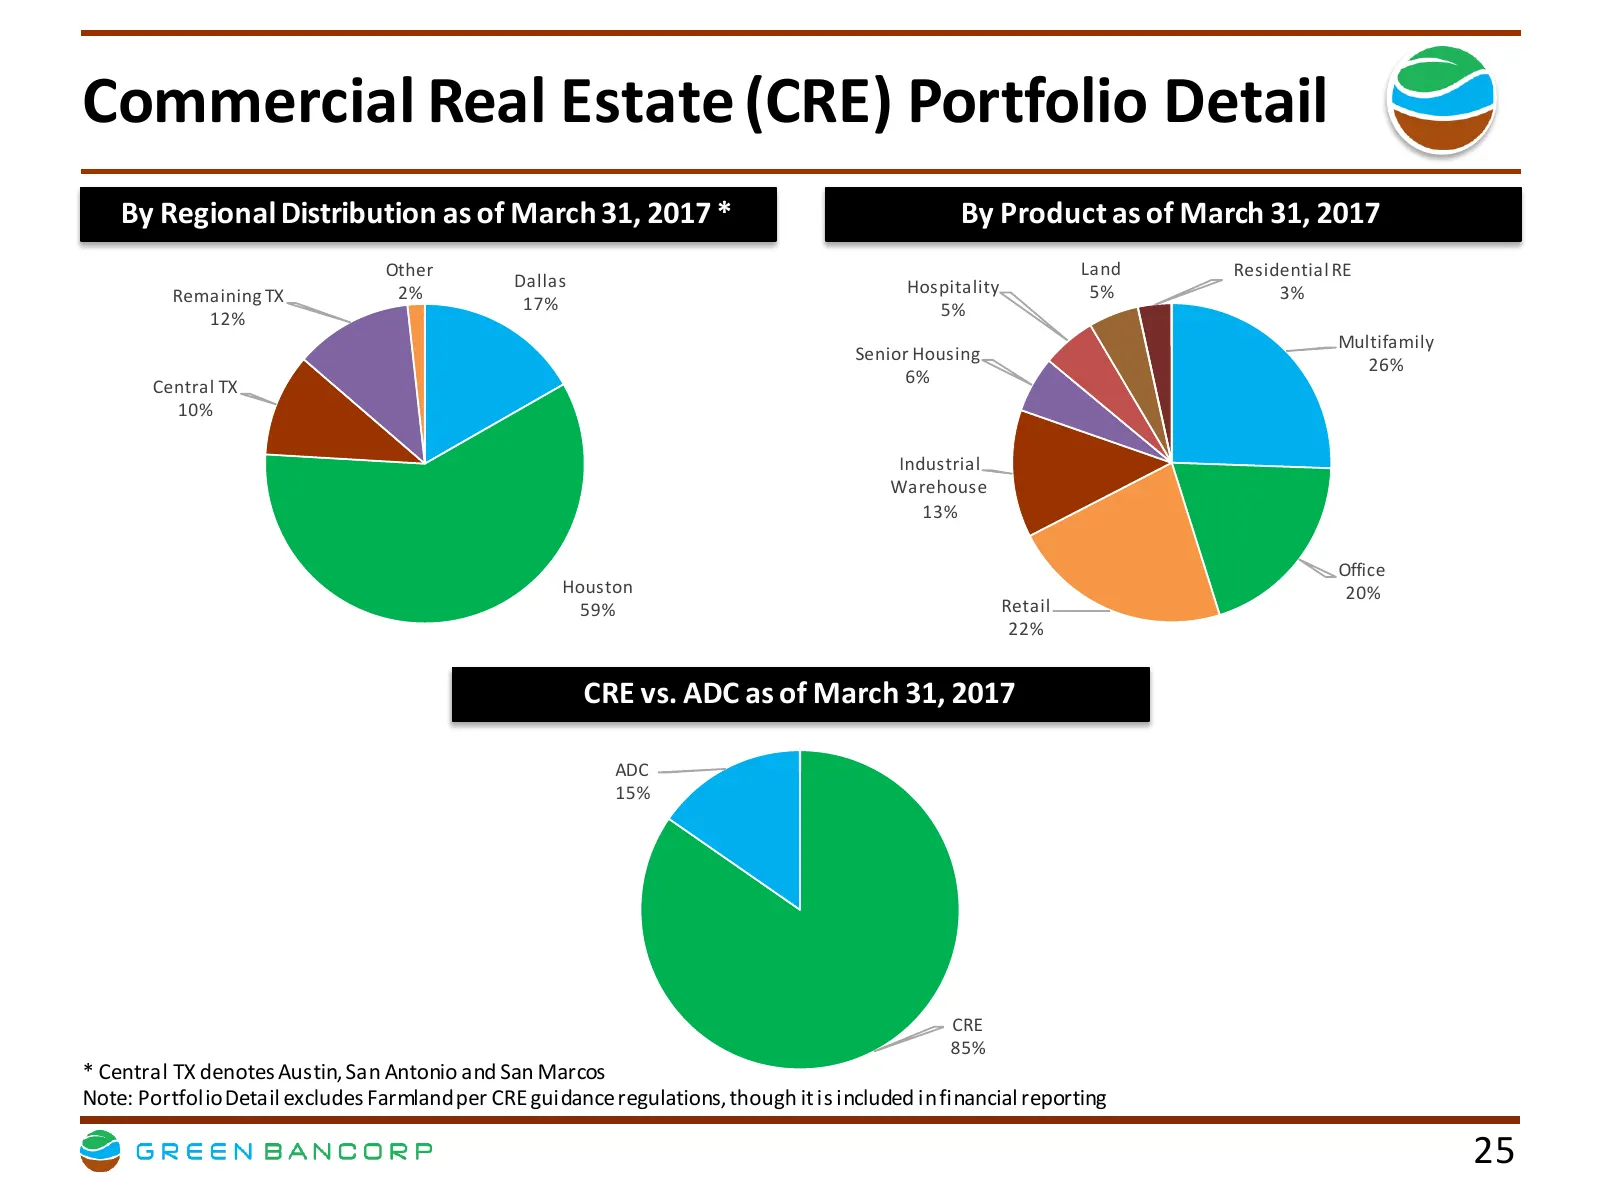
Commercial Real Estate (CRE) Portfolio Detail By Regional Distribution as of March 31, 2017 * By Product as of March 31, 2017 Other Land Residential RE Dallas Hospitality Remaining TX 2% 5% 3% 17% 5% 12% Multifamily Senior Housing 26% Central TX 6% 10% Industrial Warehouse 13% Office Houston 20% 59%
Slide 26: Financial Targets - Updated
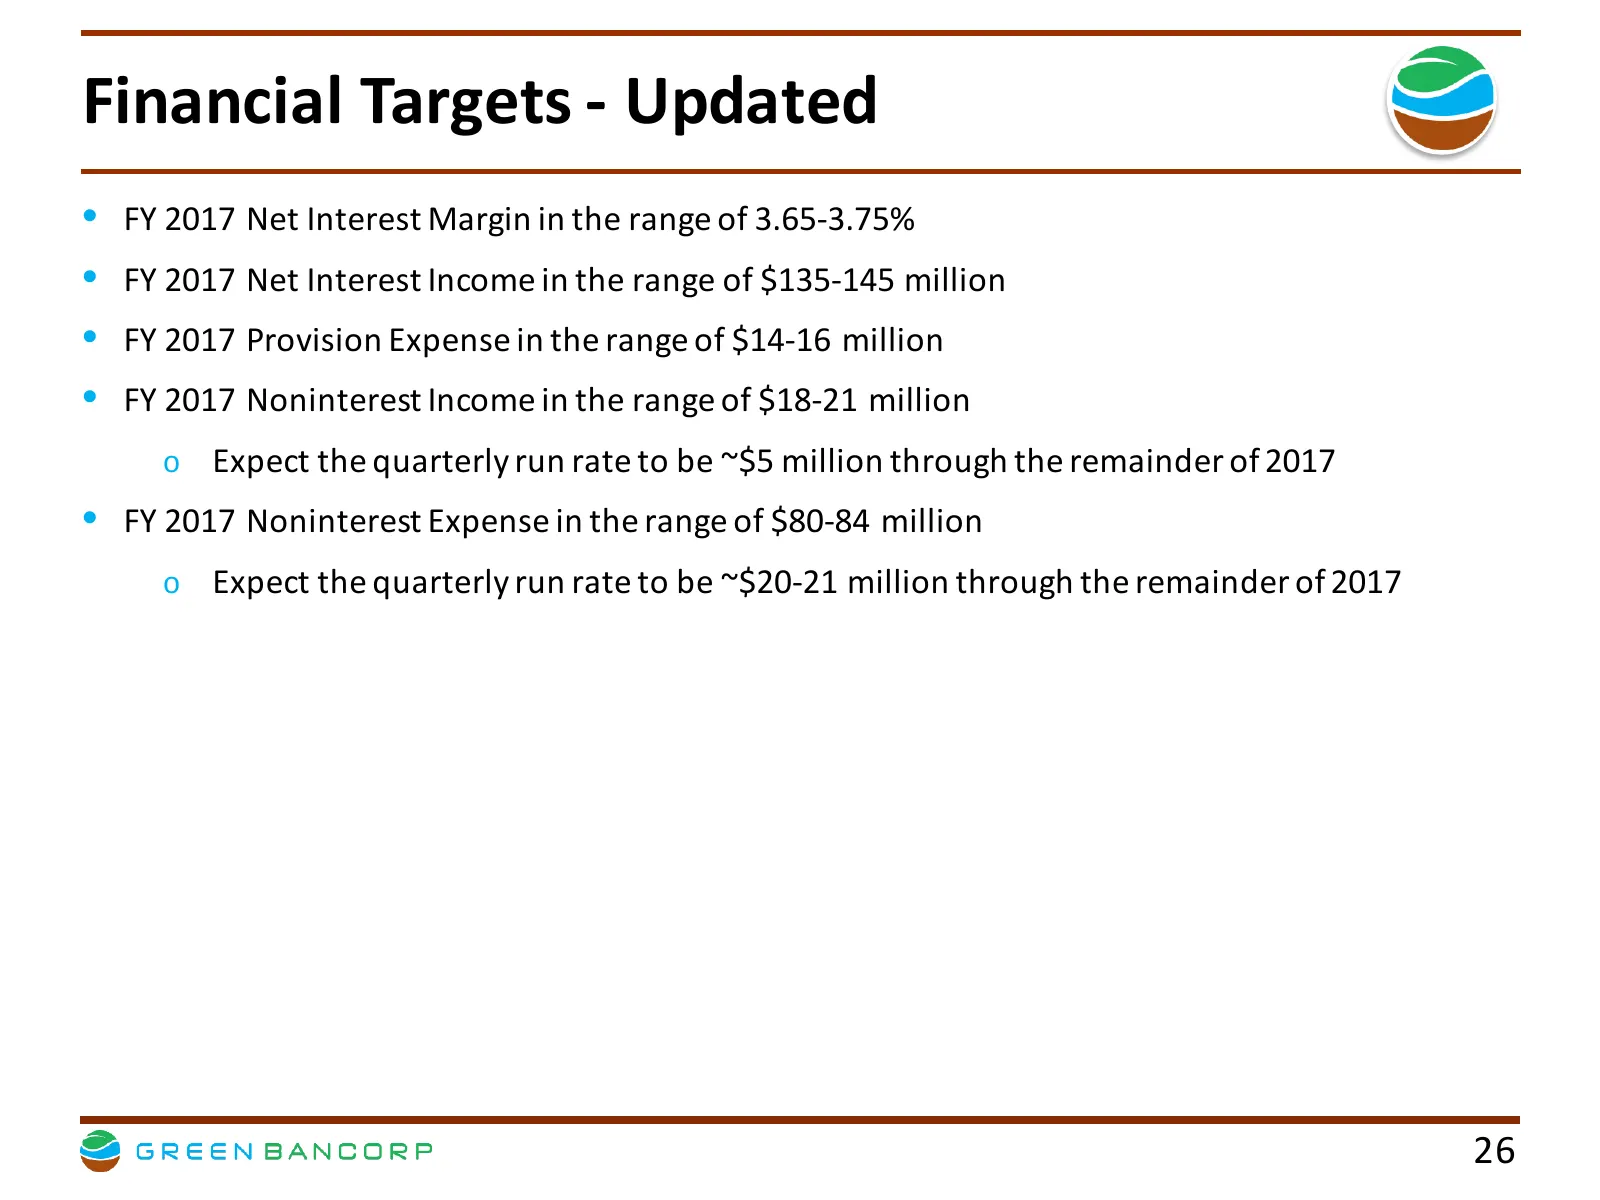
Financial Targets - Updated • FY 2017 Net Interest Margin in the range of 3.65-3.75% • FY 2017 Net Interest Income in the range of $135-145 million • FY 2017 Provision Expense in the range of $14-16 million • FY 2017 Noninterest Income in the range of $18-21 million o Expect the quarterly run rate t
Slide 27: Analyst Coverage
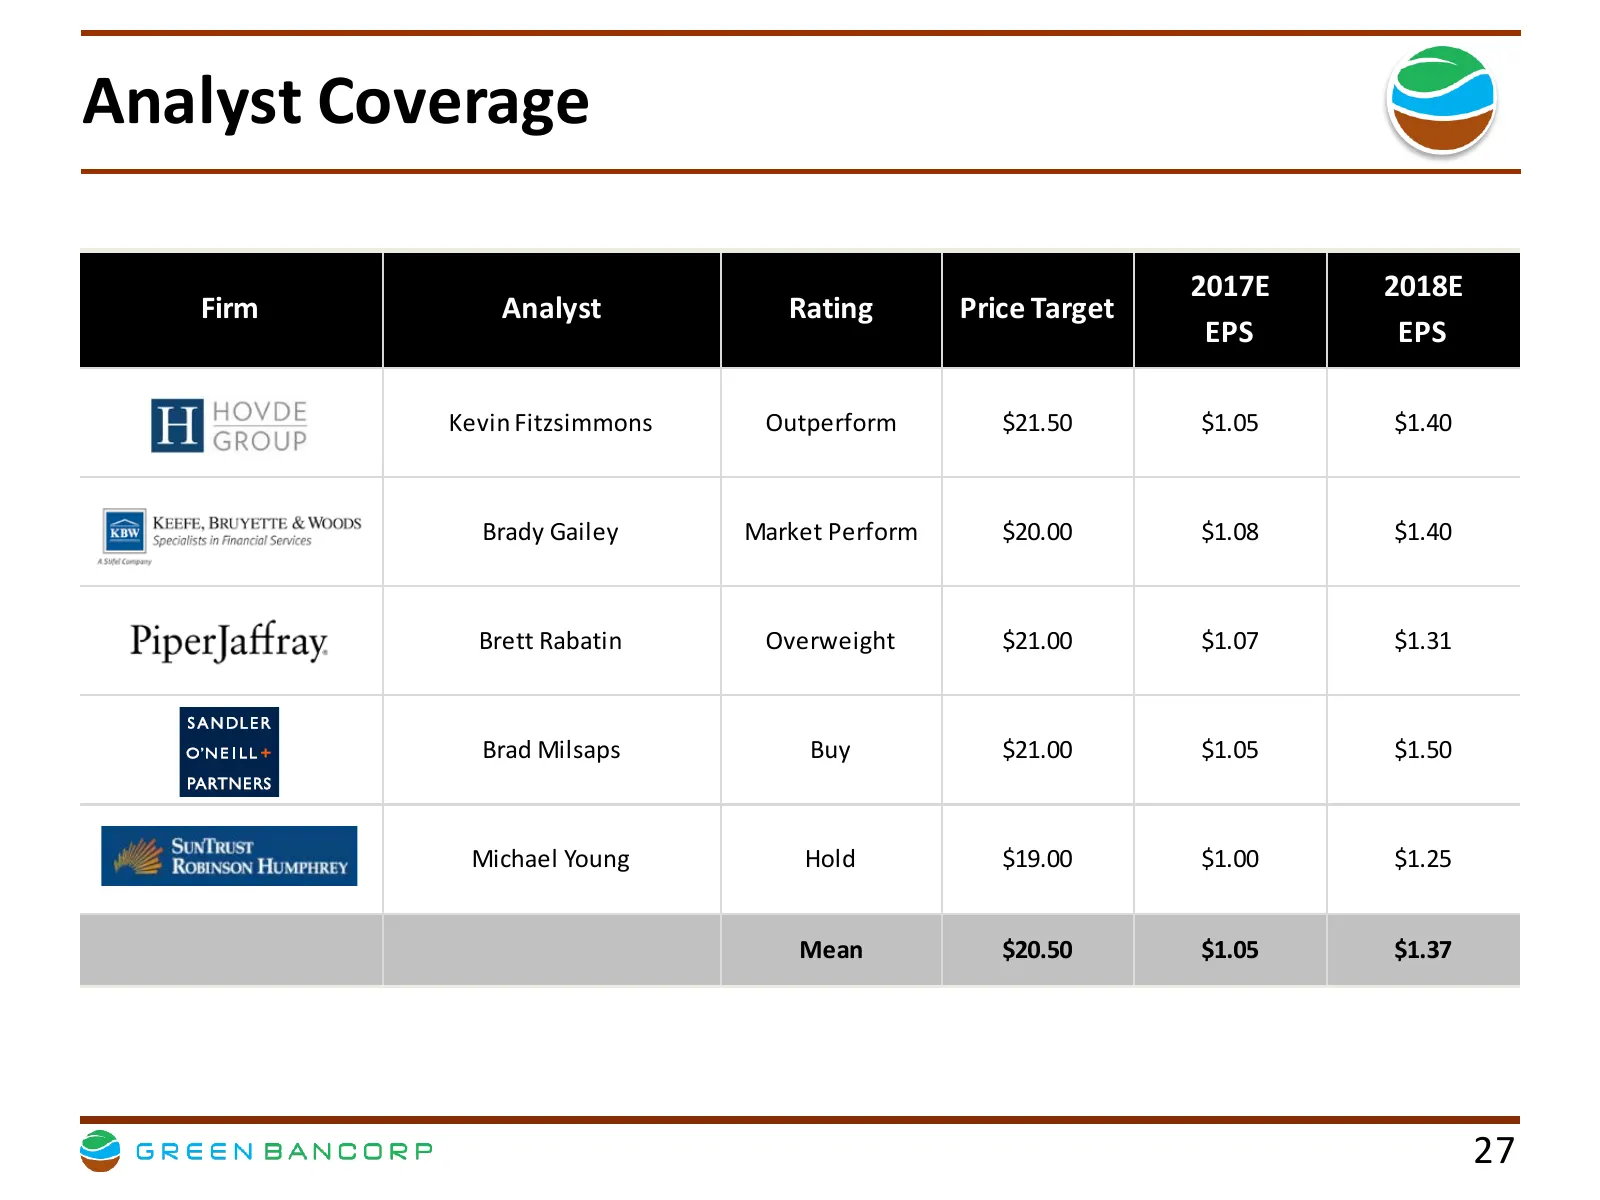
Analyst Coverage 2017E 2018E Firm Analyst Rating Price Target EPS EPS Kevin Fitzsimmons Outperform $21.50 $1.05 $1.40 Brady Gailey Market Perform $20.00 $1.08 $1.40 Brett Rabatin Overweight $21.00 $1.07 $1.31 Brad Milsaps Buy $21.00 $1.05 $1.50 Michael Young Hold $19.00 $1.00 $1.25 Mean $20.50 $1.05
Slide 28: GAAP to Non-GAAP Reconciliations
GAAP to Non-GAAP Reconciliations 28
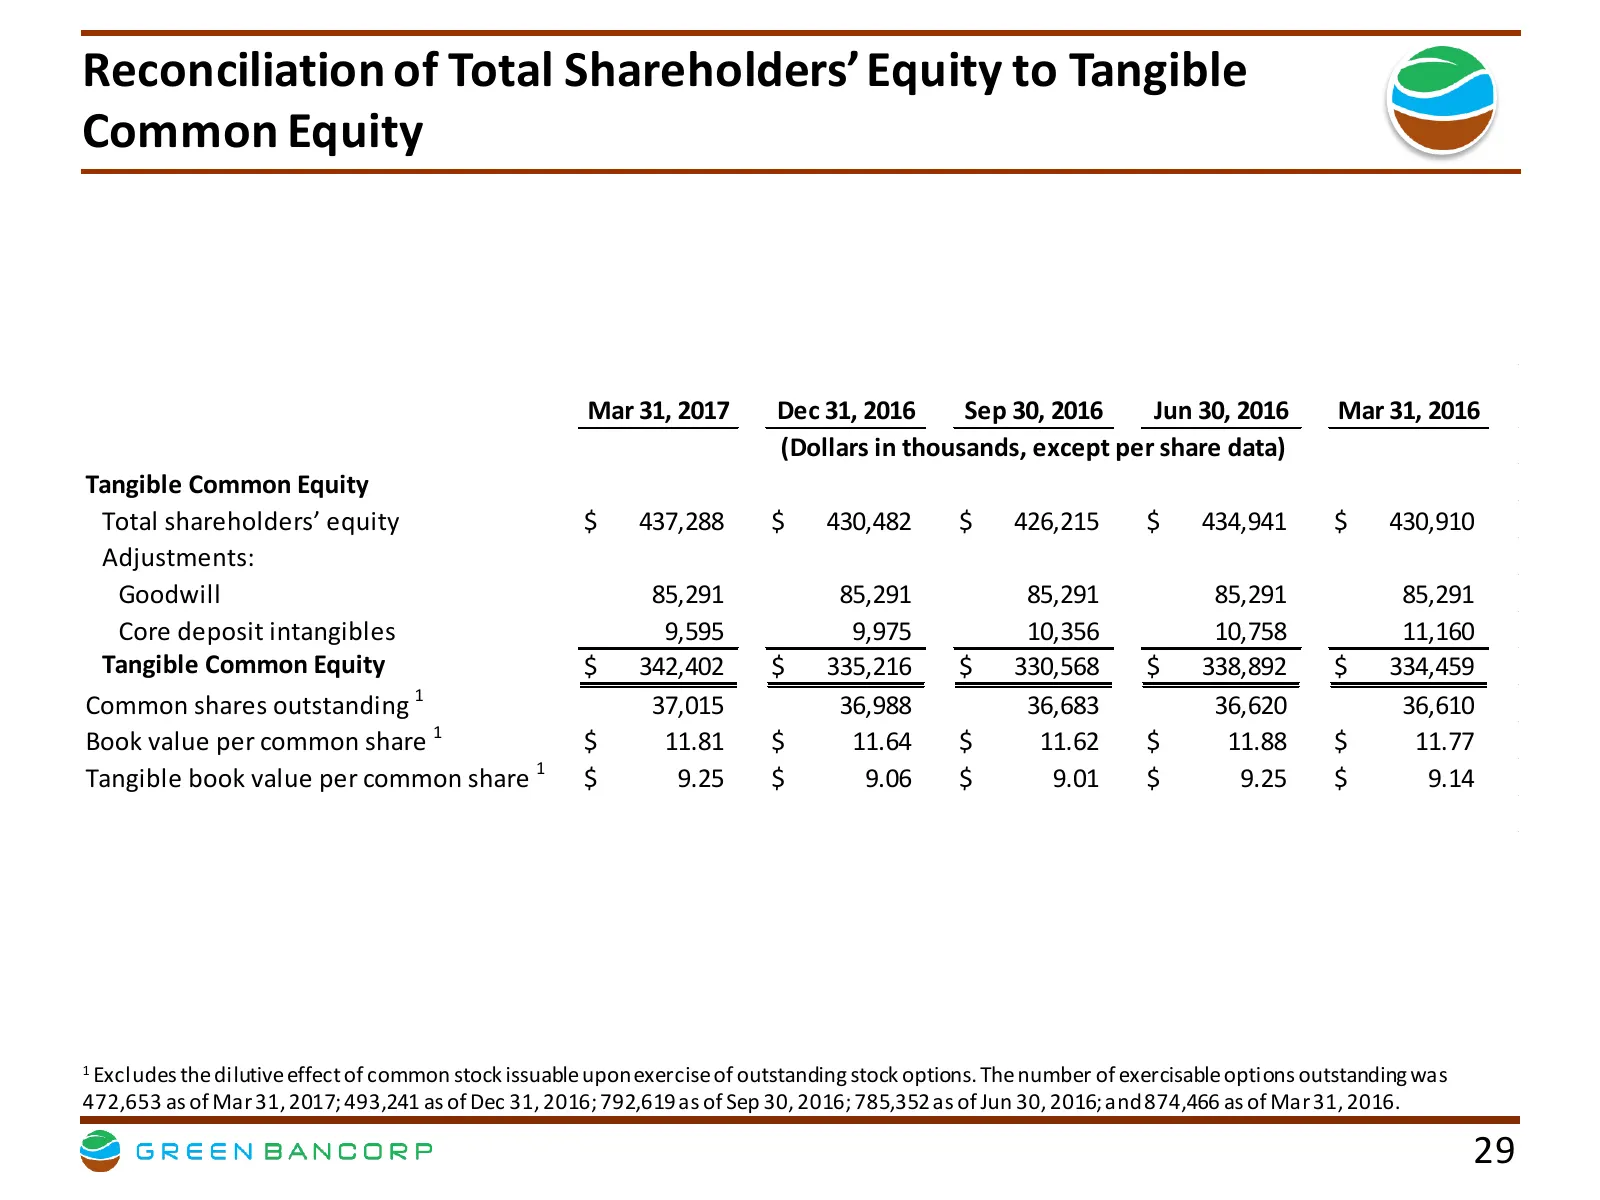
Slide 29: Reconciliation of Total Shareholders' Equity to Tangible Common Equity
Reconciliation of Total Shareholders’ Equity to Tangible Common Equity Mar 31, 2017 Dec 31, 2016 Sep 30, 2016 Jun 30, 2016 Mar 31, 2016 (Dollars in thousands, except per share data) Tangible Common Equity Total shareholders’ equity $ 437,288 $ 430,482 $ 426,215 $ 434,941 $ 430,910 Adjustments: Goodw
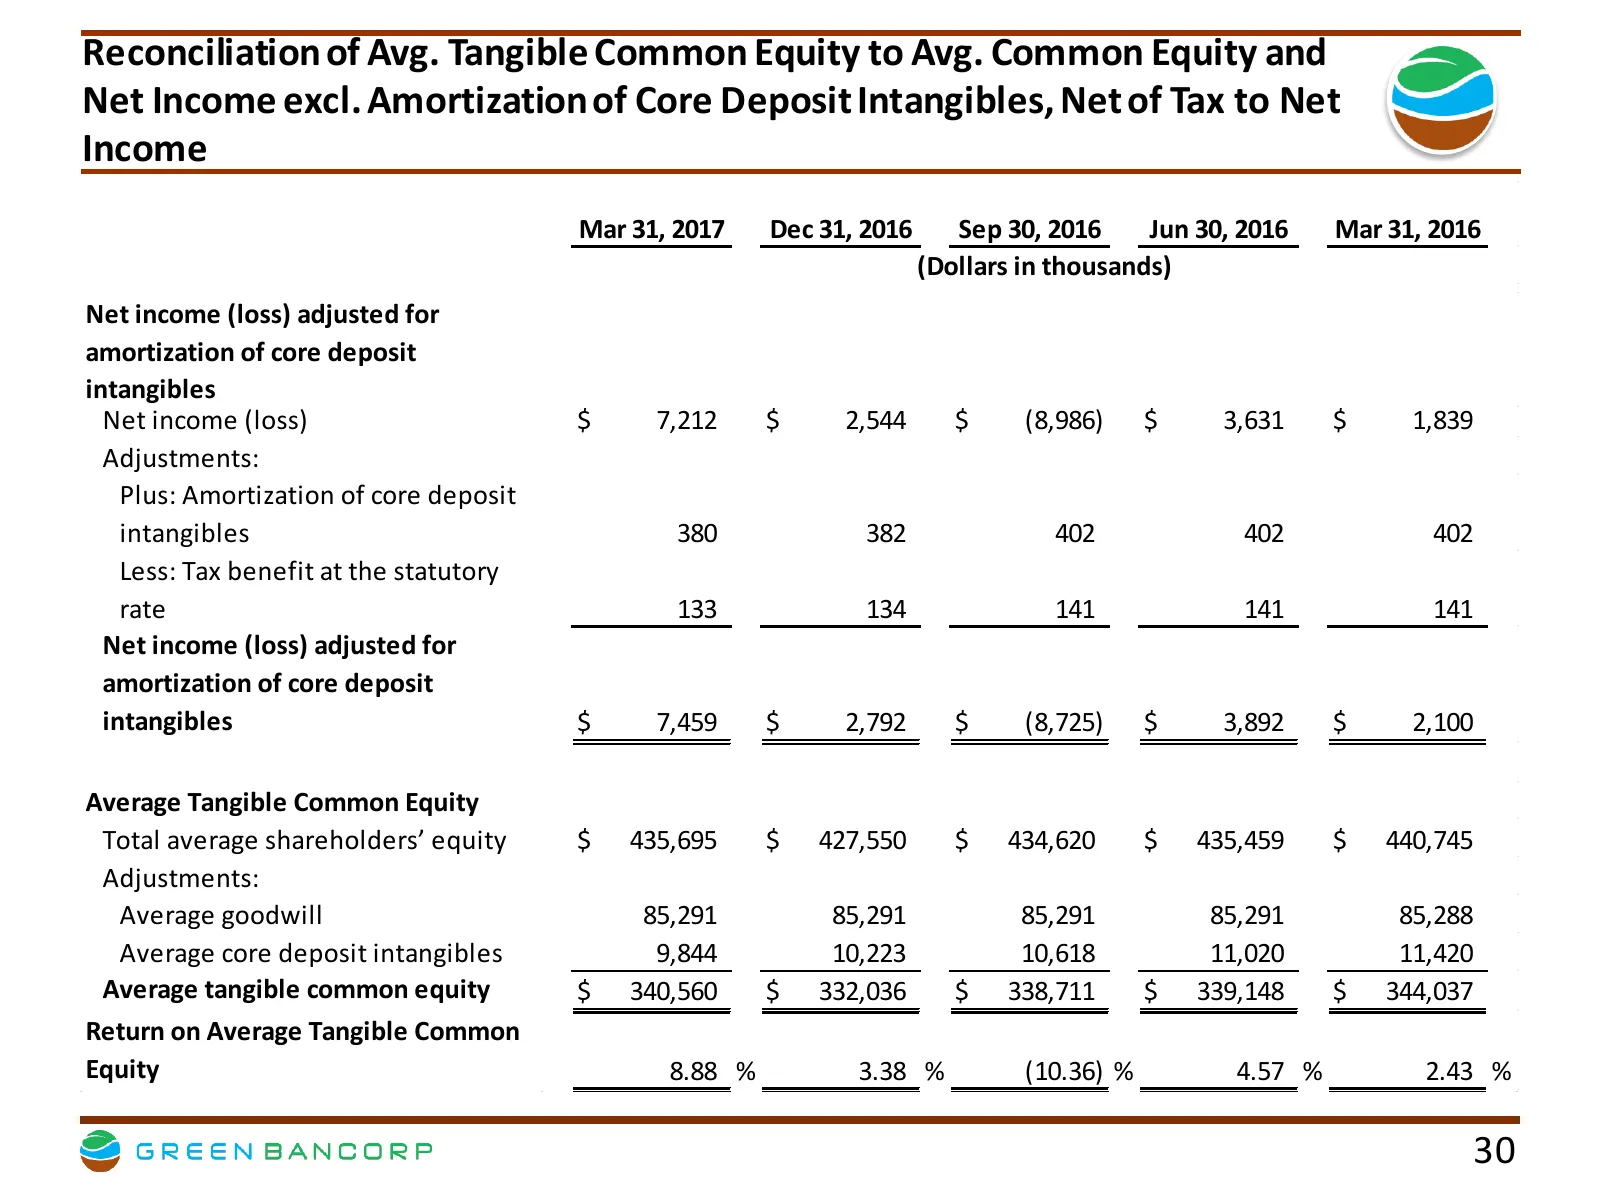
Slide 30: Reconciliation of Avg. Tangible Common Equity to Avg. Common Equity and Net Income
Reconciliation of Avg. Tangible Common Equity to Avg. Common Equity and Net Income excl. Amortization of Core Deposit Intangibles, Net of Tax to Net Income Mar 31, 2017 Dec 31, 2016 Sep 30, 2016 Jun 30, 2016 Mar 31, 2016 (Dollars in thousands) Net income (loss) adjusted for amortization of core depo
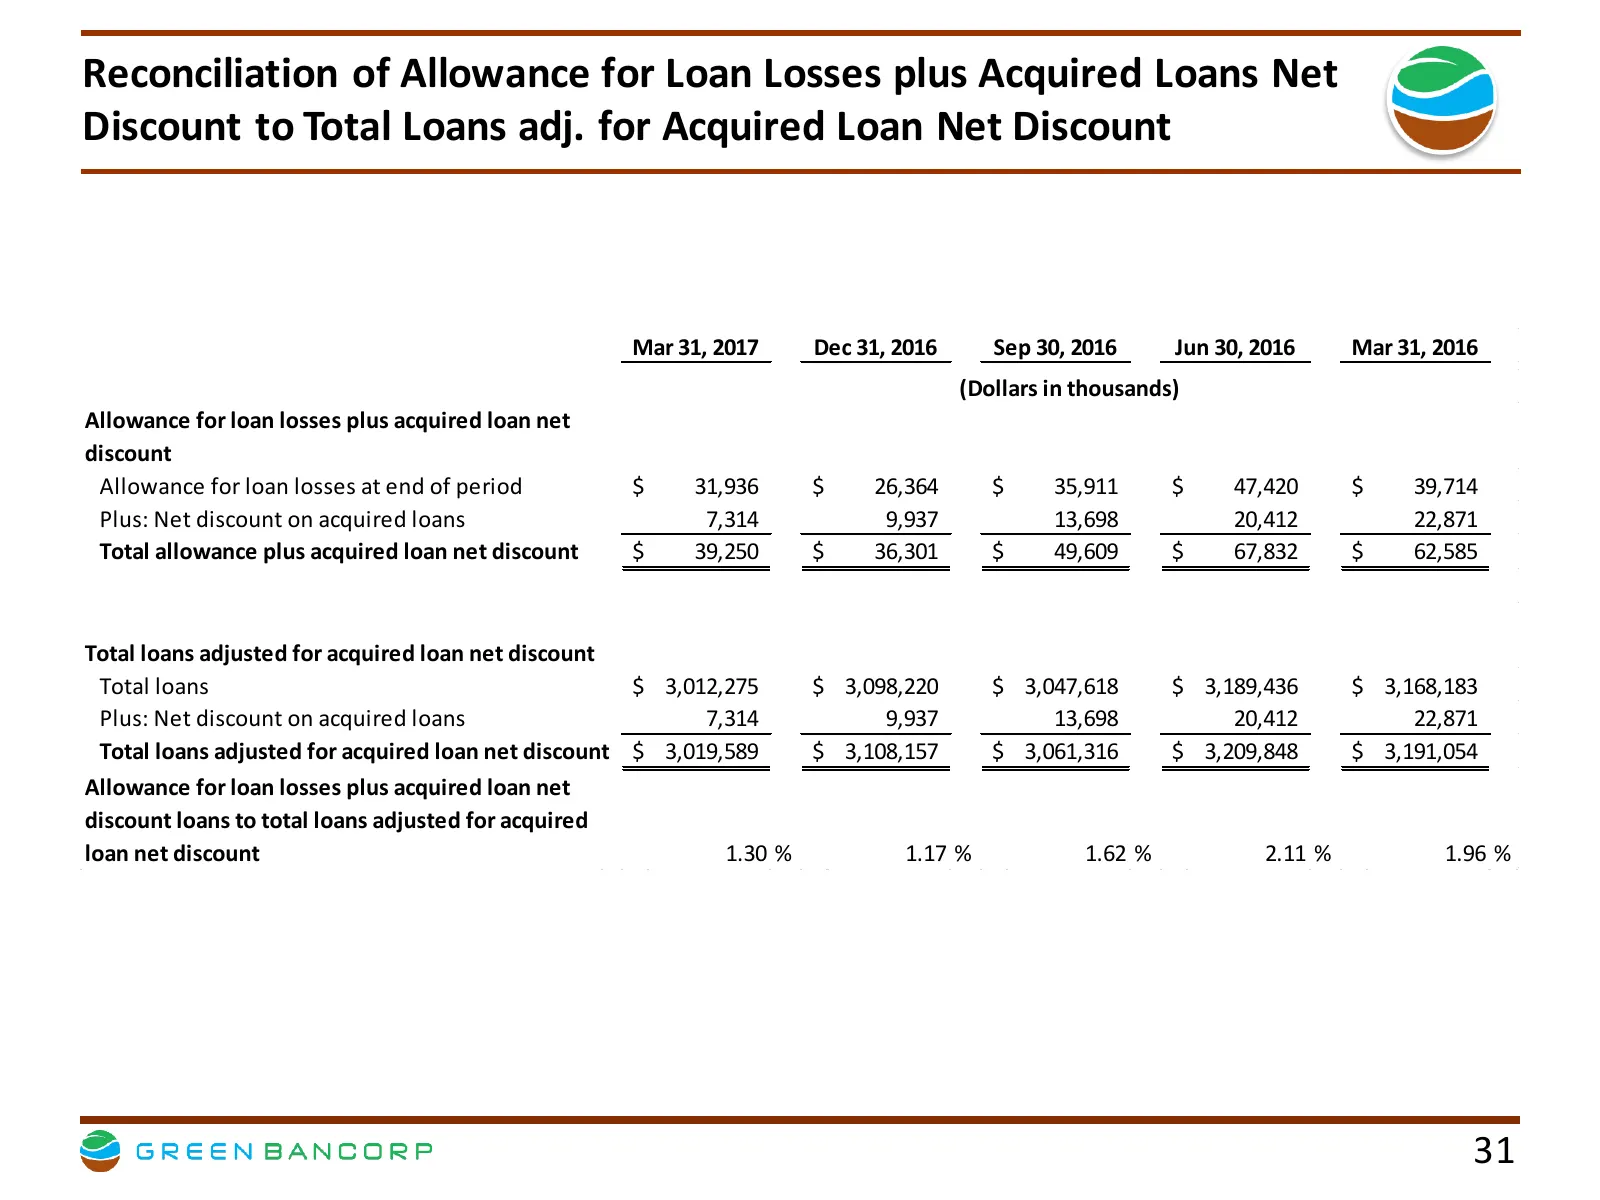
Slide 31: Reconciliation of Allowance for Loan Losses plus Acquired Loans Net Discount
Reconciliation of Allowance for Loan Losses plus Acquired Loans Net Discount to Total Loans adj. for Acquired Loan Net Discount Mar 31, 2017 Dec 31, 2016 Sep 30, 2016 Jun 30, 2016 Mar 31, 2016 (Dollars in thousands) Allowance for loan losses plus acquired loan net discount Allowance for loan losses
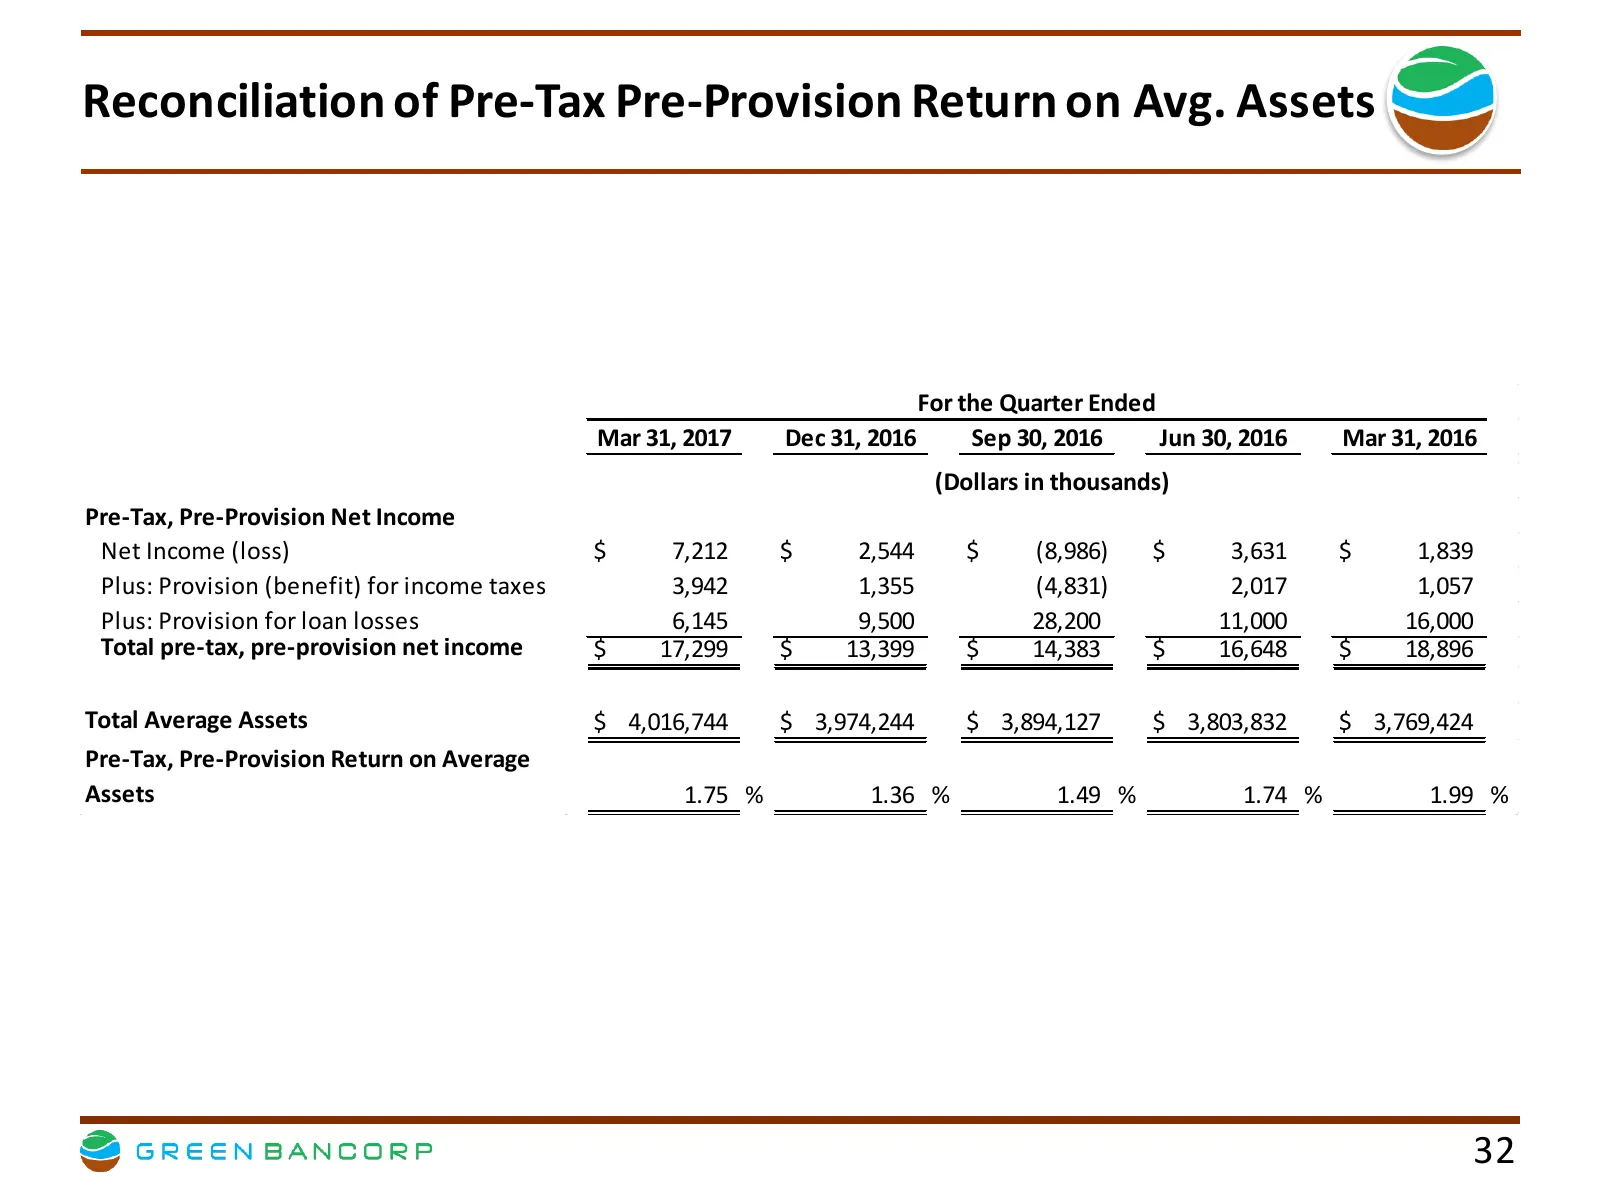
Slide 32: Reconciliation of Pre-Tax Pre-Provision Return on Avg. Assets
Reconciliation of Pre-Tax Pre-Provision Return on Avg. Assets For the Quarter Ended Mar 31, 2017 Dec 31, 2016 Sep 30, 2016 Jun 30, 2016 Mar 31, 2016 (Dollars in thousands) Pre-Tax, Pre-Provision Net Income Net Income (loss) $ 7,212 $ 2,544 $ (8,986) $ 3,631 $ 1,839 Plus: Provision (benefit) for inco
Source: SEC EDGAR · 8-K filed May 8, 2017
More decks from Green Bancorp Inc
 Sandler O'Neill East Coast Financial Services Conference 201834 slides · Nov 6, 2018
 Q3 2018 Earnings Presentation12 slides · Oct 22, 2018
 Q3 2018 Earnings Presentation17 slides · Oct 22, 2018
 Merger or Acquisition (July 2018)28 slides · Jul 24, 2018
 Q1 2018 Earnings Presentation34 slides · May 4, 2018
 Q1 2018 Earnings Presentation19 slides · Apr 26, 2018