Silvergate Capital Corp. · OTC:SICP
Silvergate Capital — Q4 2019 Earnings Presentation
14 slides from Silvergate Capital's earnings presentation, Jan 29, 2020

Slide 1: Silvergate Capital Corporation 4Q19 Earnings Presentation
Exhibit 99.2 Silvergate Capital Corporation 4Q19 Earnings Presentation January 29, 2020
Slide 2: Forward Looking Statements
Forward Looking Statements This presentation contains forward looking statements within the meaning of the Securities and Exchange Act of 1934, as amended, including statements of goals, intentions, and expectations as to future trends, plans, events or results of Company operations and policies and
Slide 3: 4Q19 Highlights
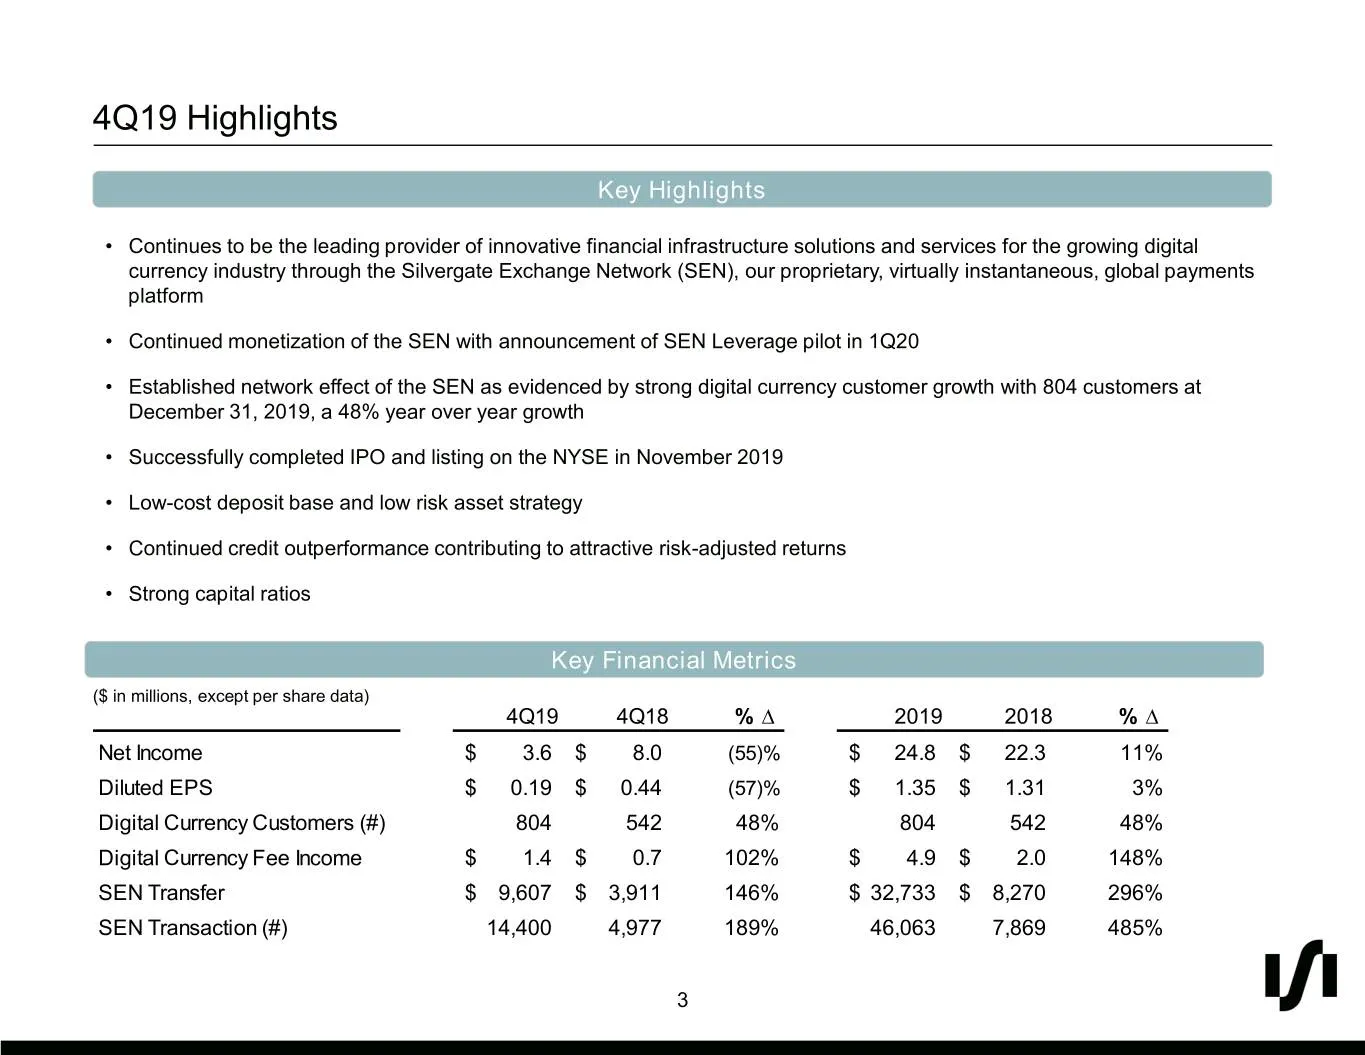
4Q19 Highlights Key Highlights • Continues to be the leading provider of innovative financial infrastructure solutions and services for the growing digital currency industry through the Silvergate Exchange Network (SEN), our proprietary, virtually instantaneous, global payments platform • Continued
Slide 4: Digital Currency Platform Expansion
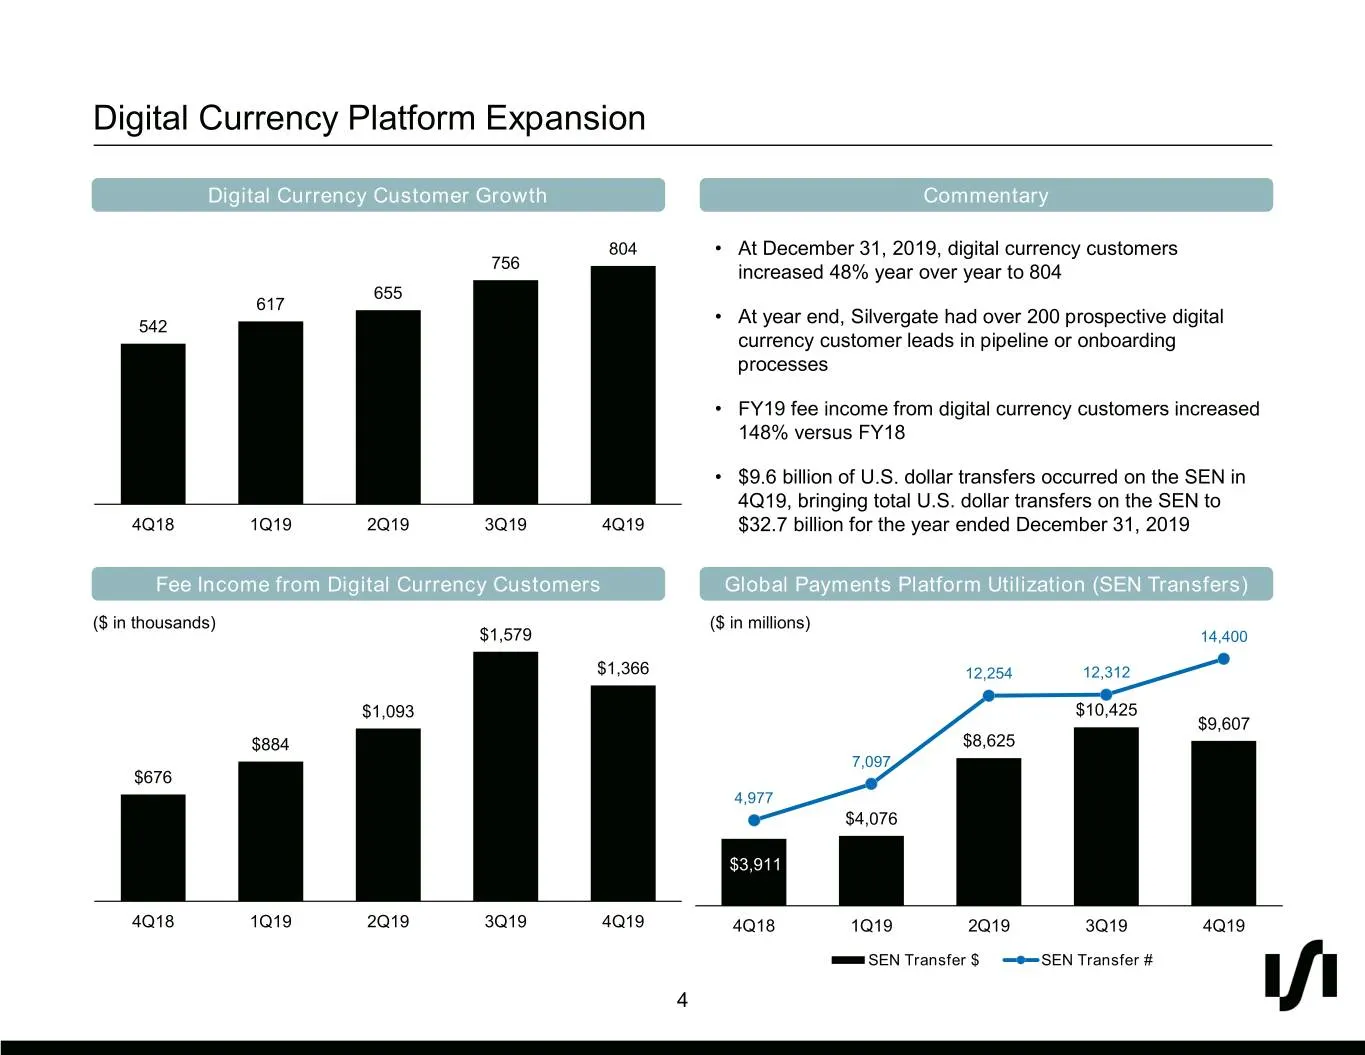
Digital Currency Platform Expansion Digital Currency Customer Growth Commentary 804 • At December 31, 2019, digital currency customers 756 increased 48% year over year to 804 655 617 542 • At year end, Silvergate had over 200 prospective digital currency customer leads in pipeline or onboarding proc
Slide 5: Deposits
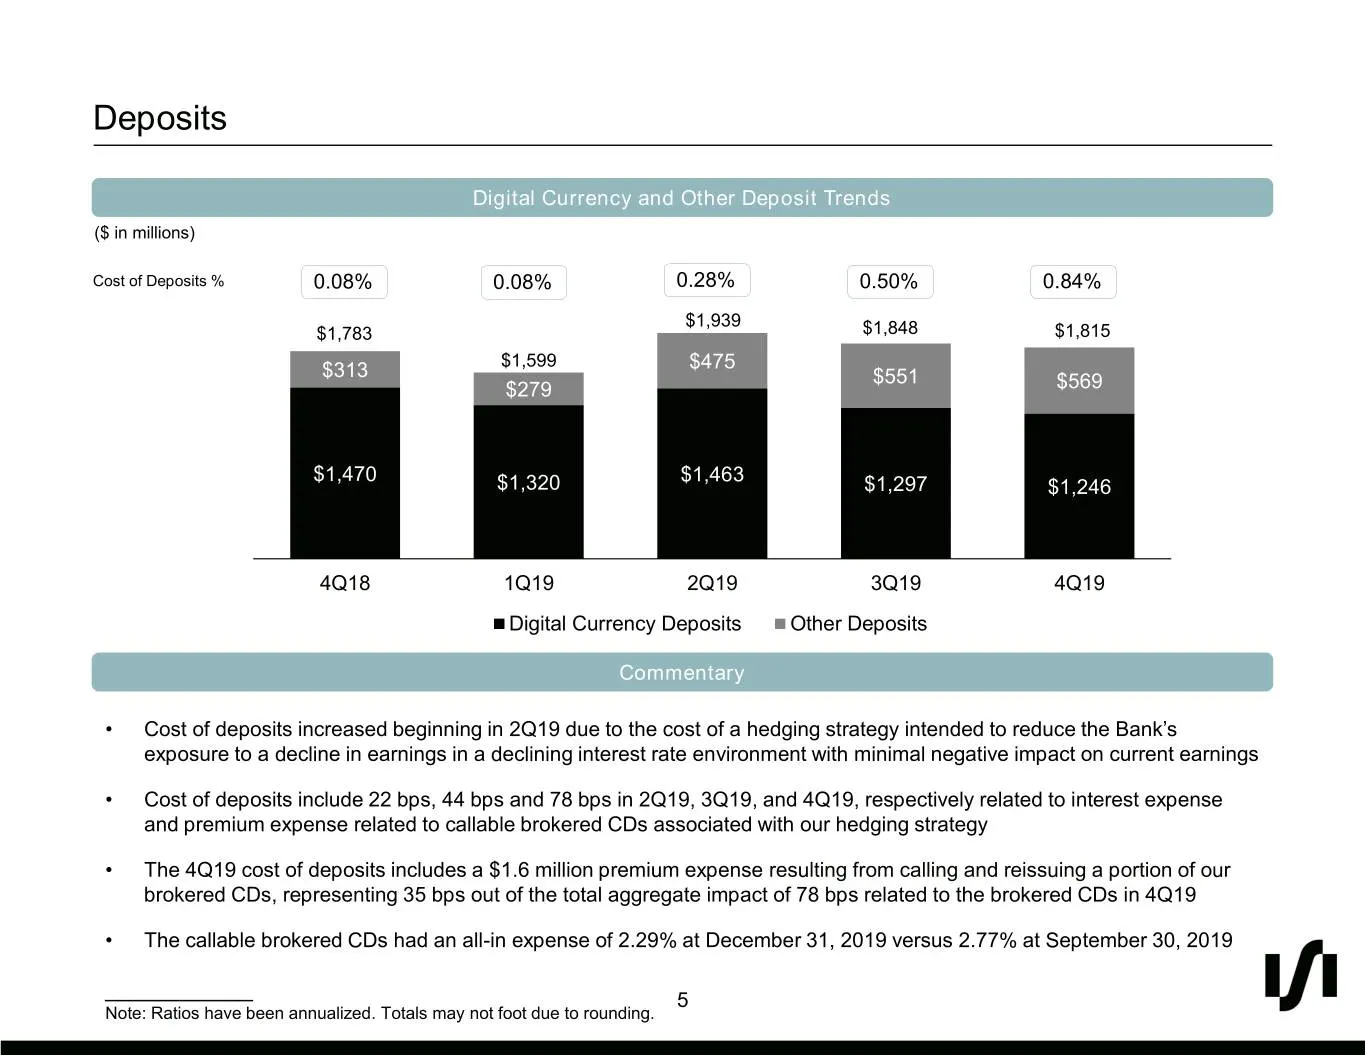
Deposits Digital Currency and Other Deposit Trends ($ in millions) Cost of Deposits % 0.08% 0.08% 0.28% 0.50% 0.84% $1,939 $1,783 $1,848 $1,815 $1,599 $475 $313 $551 $279 $569 $1,470 $1,463 $1,320 $1,297 $1,246 4Q18 1Q19 2Q19 3Q19 4Q19 Digital Currency Deposits Other Deposits Commentary • Cost of de
Slide 6: Yields, Cost of Deposits and Net Interest Margin
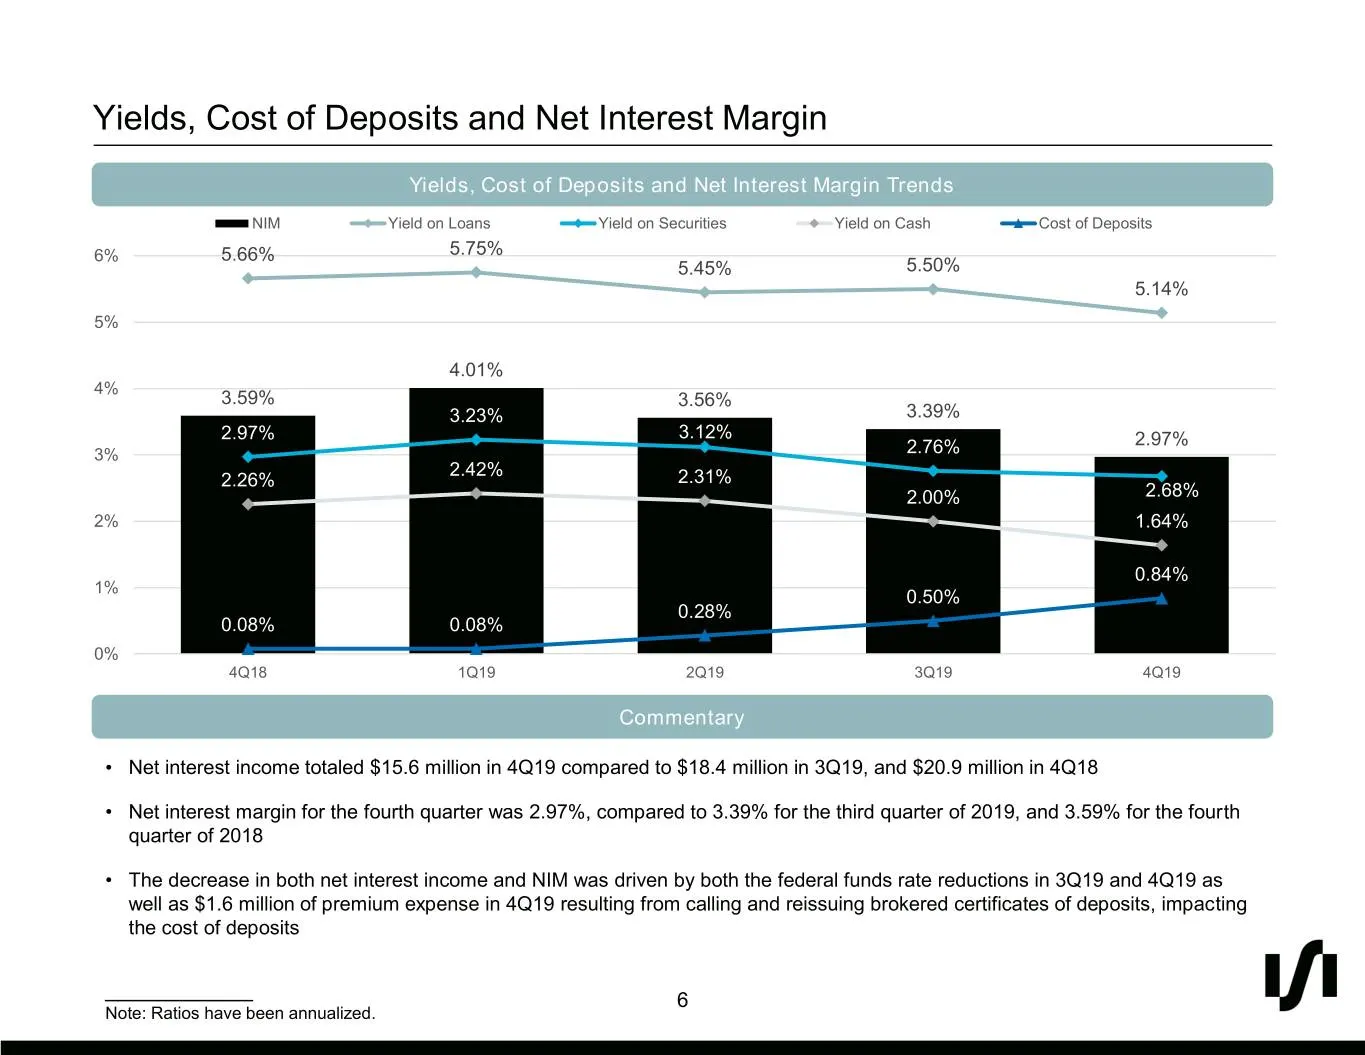
Yields, Cost of Deposits and Net Interest Margin Yields, Cost of Deposits and Net Interest Margin Trends NIM Yield on Loans Yield on Securities Yield on Cash Cost of Deposits 6% 5.66% 5.75% 5.45% 5.50% 5.14% 5% 4.01% 4% 3.59% 3.56% 3.23% 3.39% 2.97% 3.12% 2.97% 3% 2.76% 2.42% 2.26% 2.31% 2.00% 2.68%
Slide 7: Noninterest Income
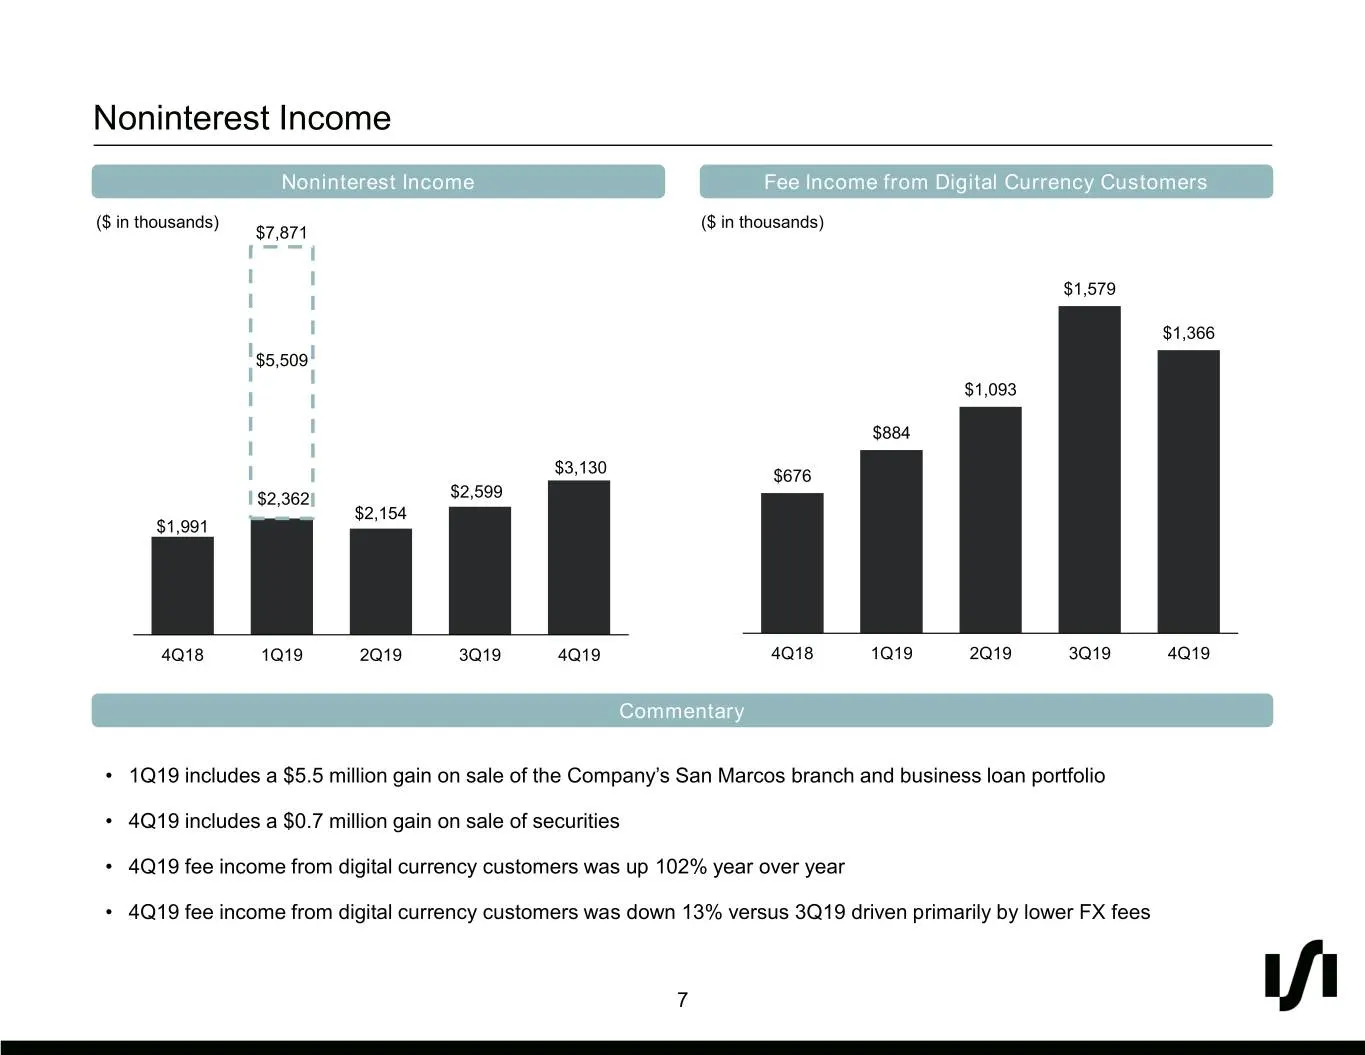
Noninterest Income Noninterest Income Fee Income from Digital Currency Customers ($ in thousands) ($ in 2,000thousands) 8,000 $7,871 1,800 7,000 $1,579 1,600 6,000 $1,366 1,400 $5,509 1,200 5,000 $1,093 1,000 4,000 $884 800 $3,130 $676 3,000 $2,362 $2,599 $2,154 600 $1,991 2,000 400 1,000 200 - - 4Q
Slide 8: Noninterest Expense
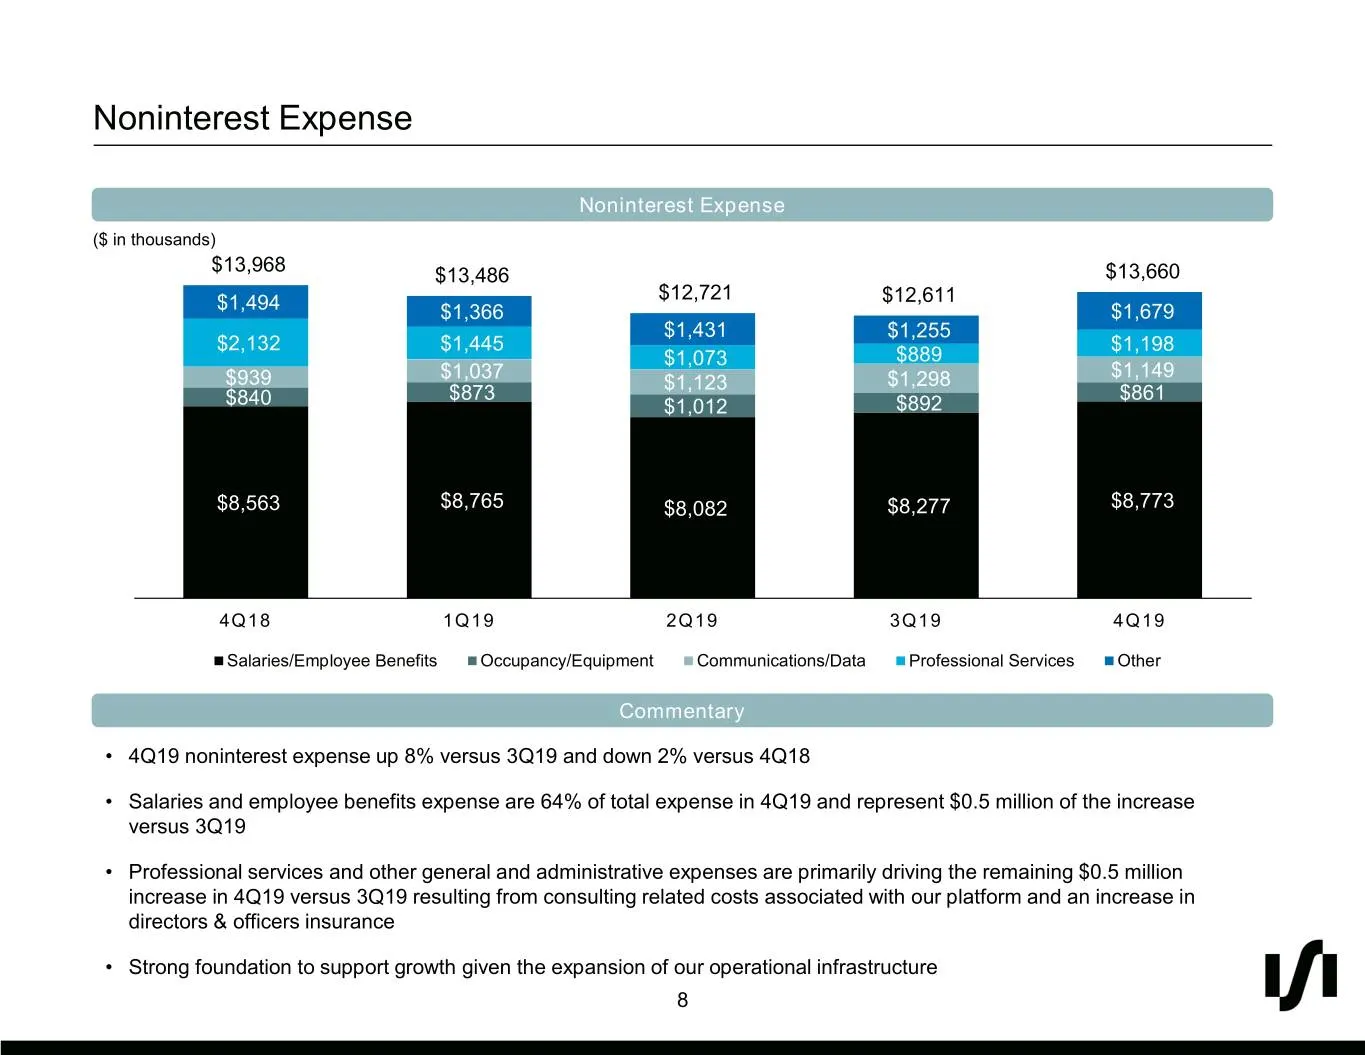
Noninterest Expense Noninterest Expense ($ in thousands) $13,968 $13,486 $13,660 $12,721 $12,611 $1,494 $1,366 $1,679 $1,431 $1,255 $2,132 $1,445 $1,198 $1,073 $889 $939 $1,037 $1,298 $1,149 $873 $1,123 $861 $840 $1,012 $892 $8,563 $8,765 $8,082 $8,277 $8,773 4Q18 1Q19 2Q19 3Q19 4Q19 Salaries/Employ
Slide 9: Asset & Credit Quality
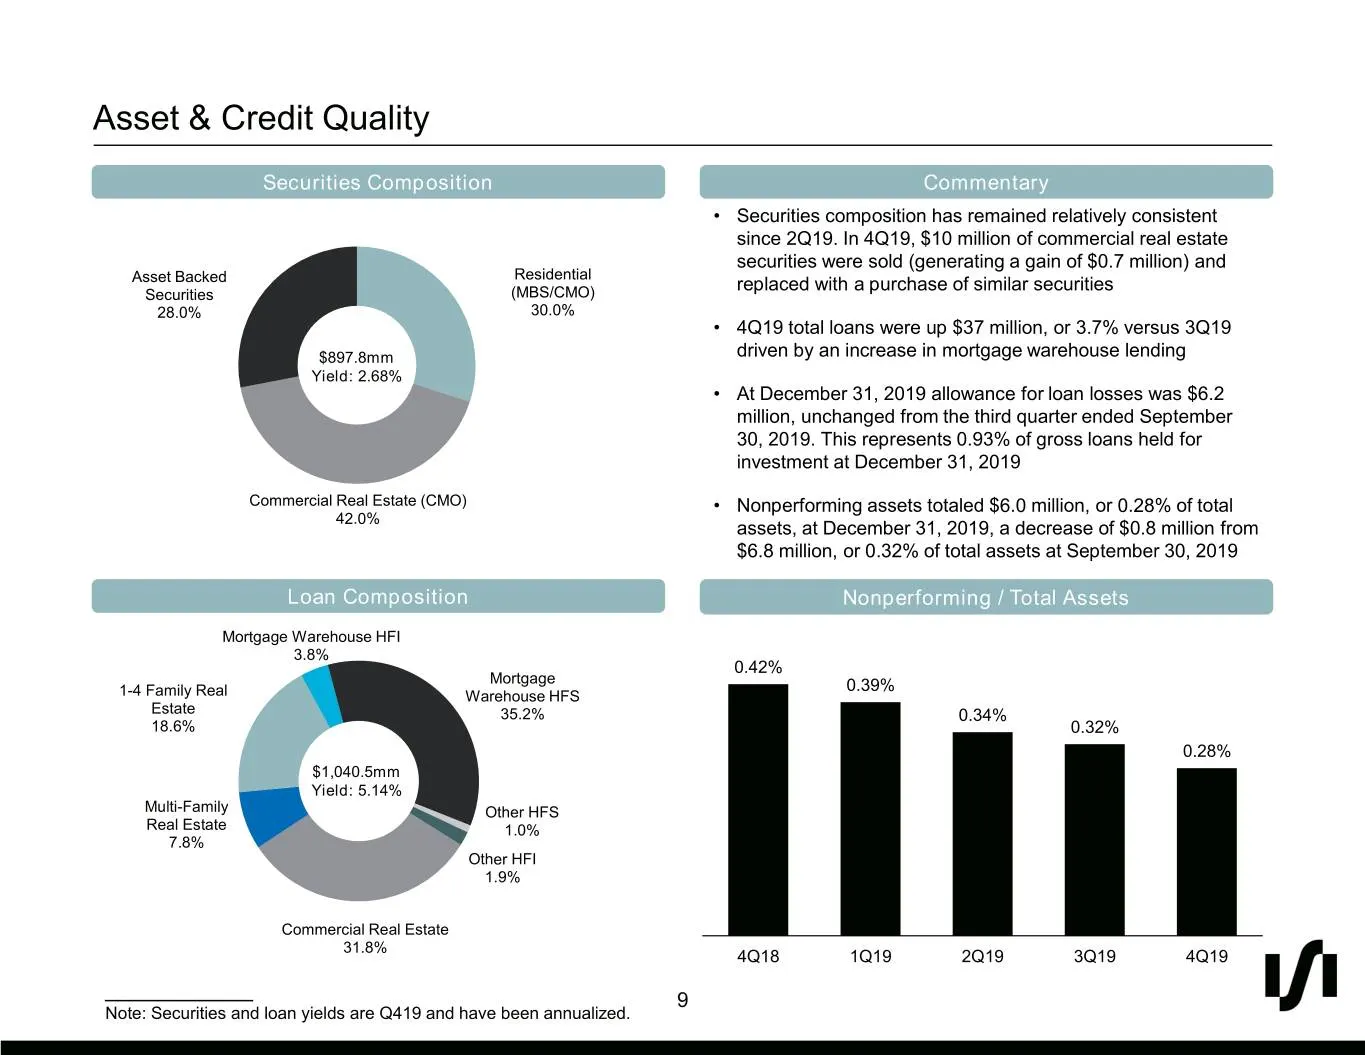
Asset & Credit Quality Securities Composition Commentary • Securities composition has remained relatively consistent since 2Q19. In 4Q19, $10 million of commercial real estate securities were sold (generating a gain of $0.7 million) and Residential Asset Backed replaced with a purchase of similar se
Slide 10: Capital
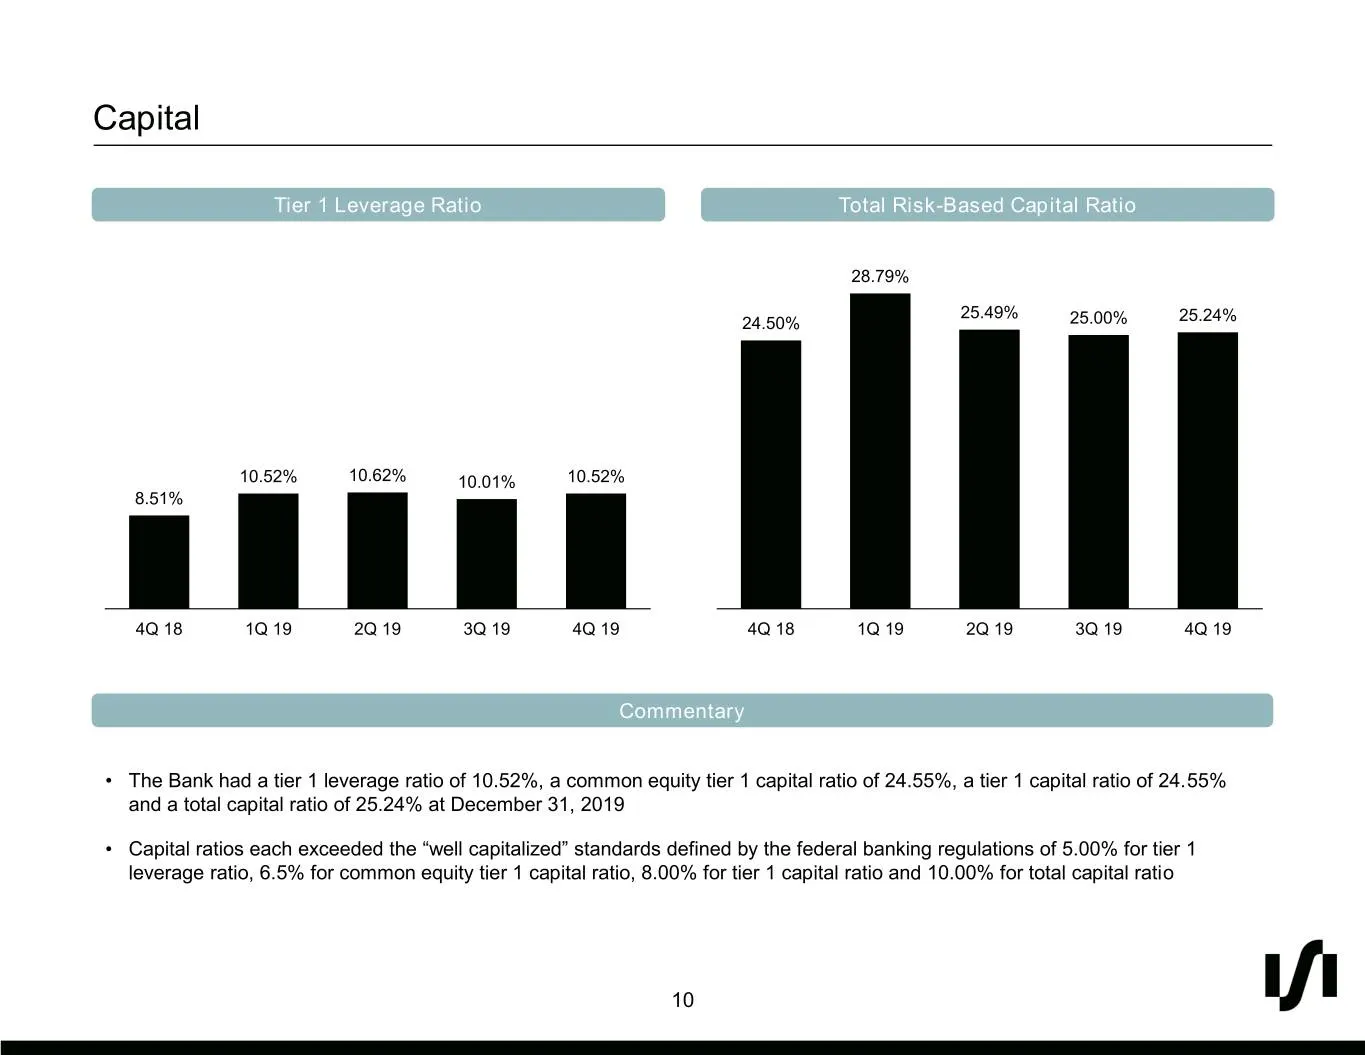
Capital Tier 1 Leverage Ratio Total Risk-Based Capital Ratio 28.79% 25.49% 24.50% 25.00% 25.24% 10.52% 10.62% 10.01% 10.52% 8.51% 4Q 18 1Q 19 2Q 19 3Q 19 4Q 19 4Q 18 1Q 19 2Q 19 3Q 19 4Q 19 Commentary • The Bank had a tier 1 leverage ratio of 10.52%, a common equity tier 1 capital ratio of 24.55%, a

Slide 11: Appendix
Appendix
Slide 12: 4Q19 Financial Results
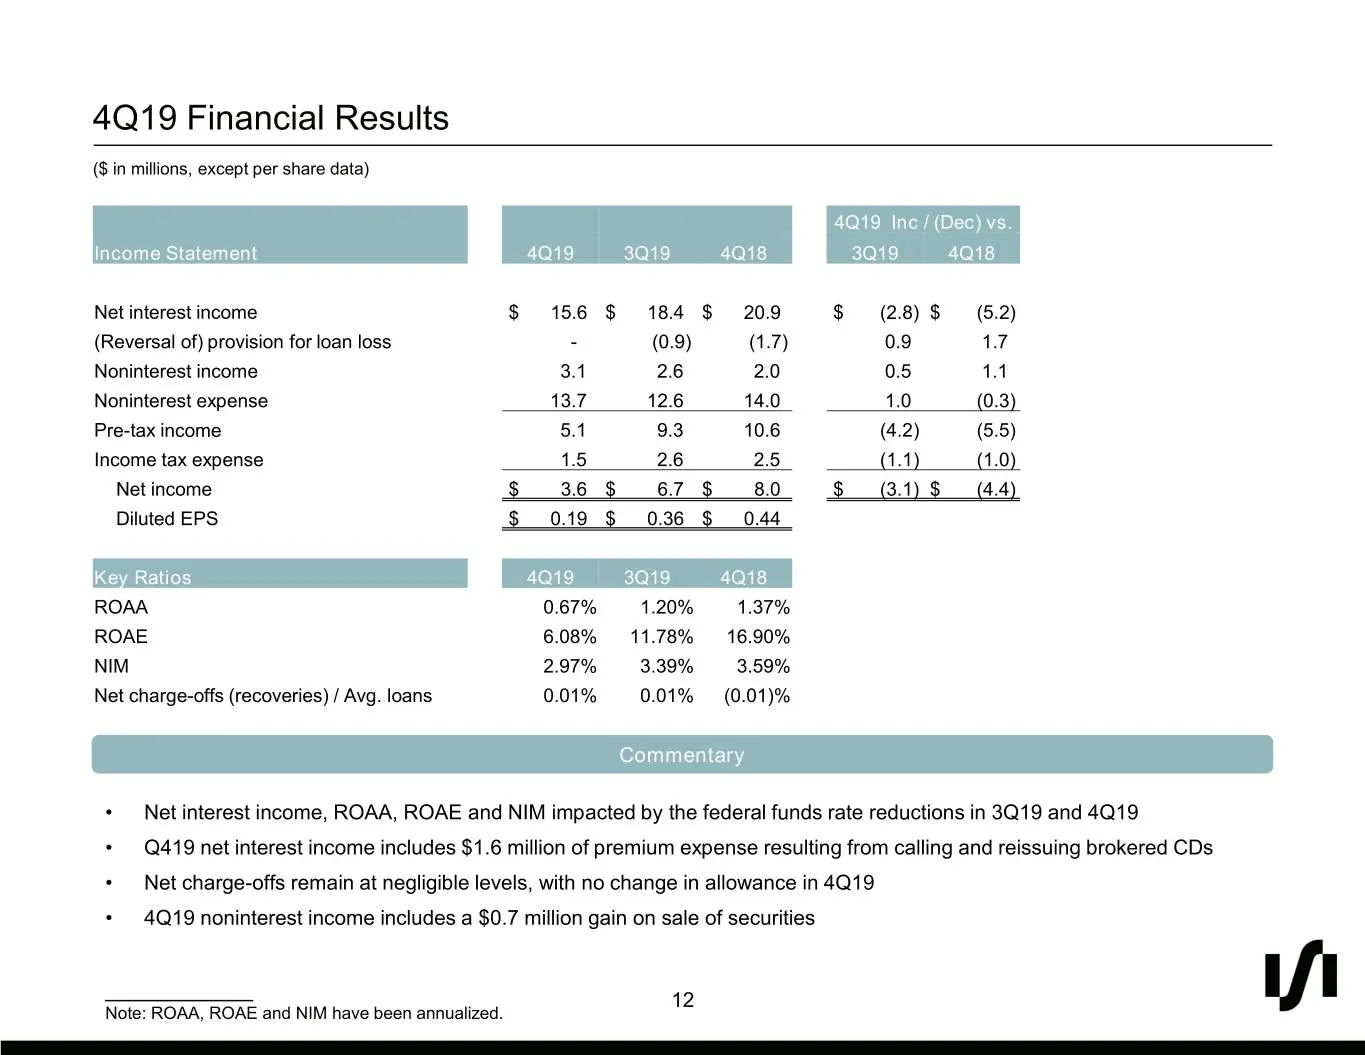
4Q19 Financial Results ($ in millions, except per share data) 4Q19 Inc / (Dec) vs. Income Statement 4Q19 3Q19 4Q18 3Q19 4Q18 Net interest income $ 15.6 $ 18.4 $ 20.9 $ (2.8) $ (5.2) (Reversal of) provision for loan loss - (0.9) (1.7) 0.9 1.7 Noninterest income 3.1 2.6 2.0 0.5 1.1 Noninterest expense
Slide 13: FY2019 Financial Results
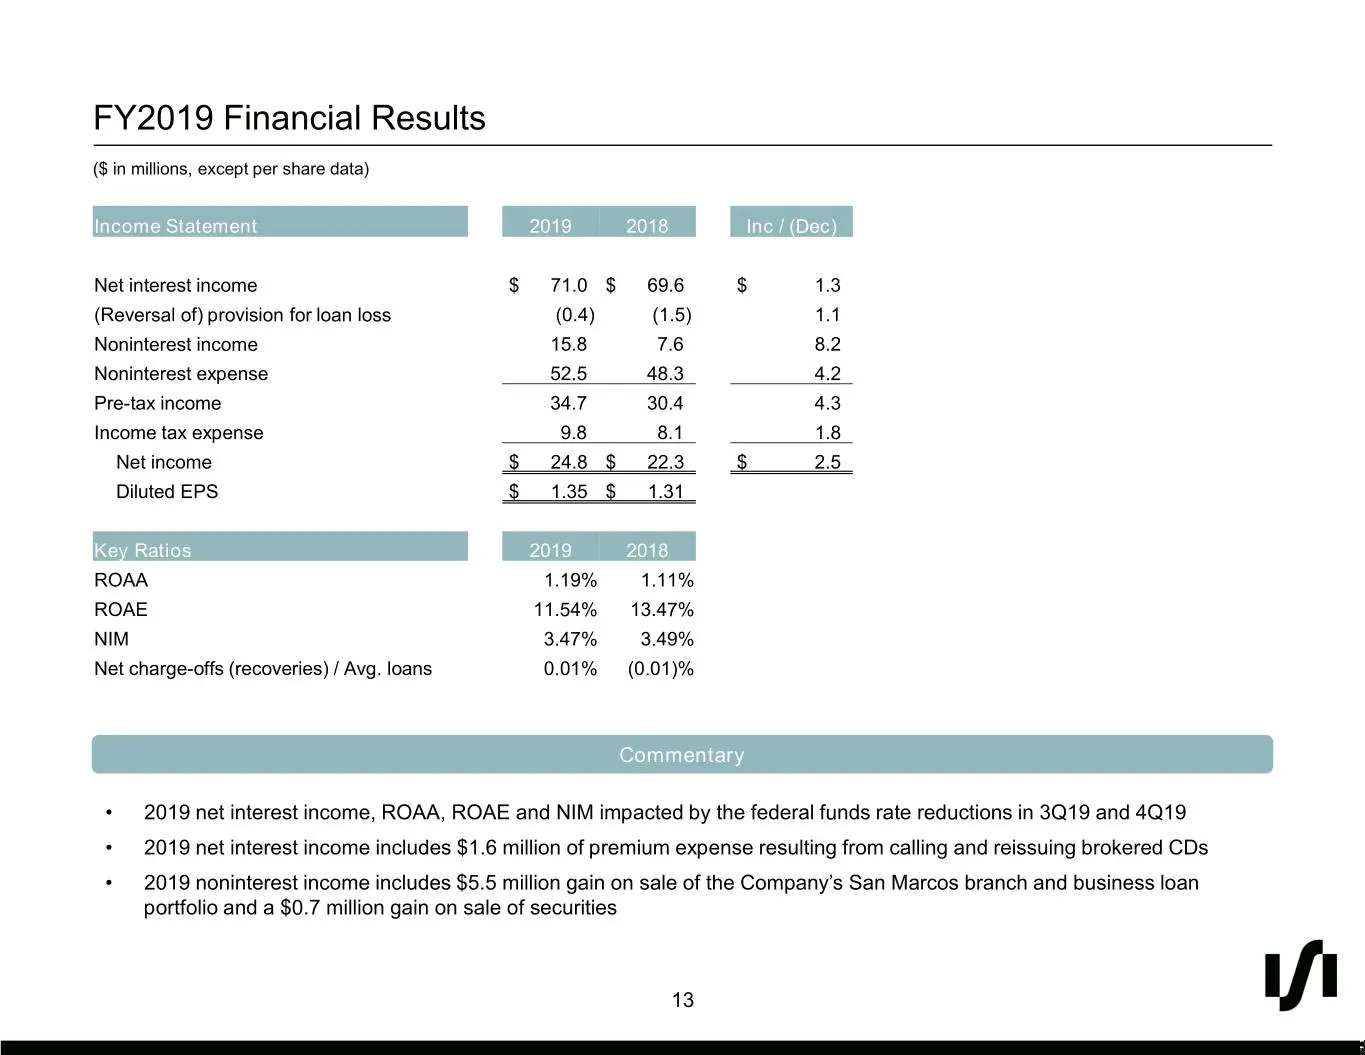
FY2019 Financial Results ($ in millions, except per share data) Income Statement 2019 2018 Inc / (Dec) Net interest income $ 71.0 $ 69.6 $ 1.3 (Reversal of) provision for loan loss (0.4) (1.5) 1.1 Noninterest income 15.8 7.6 8.2 Noninterest expense 52.5 48.3 4.2 Pre-tax income 34.7 30.4 4.3 Income t
Slide 14: Reconciliation of Non-GAAP Financial Measures
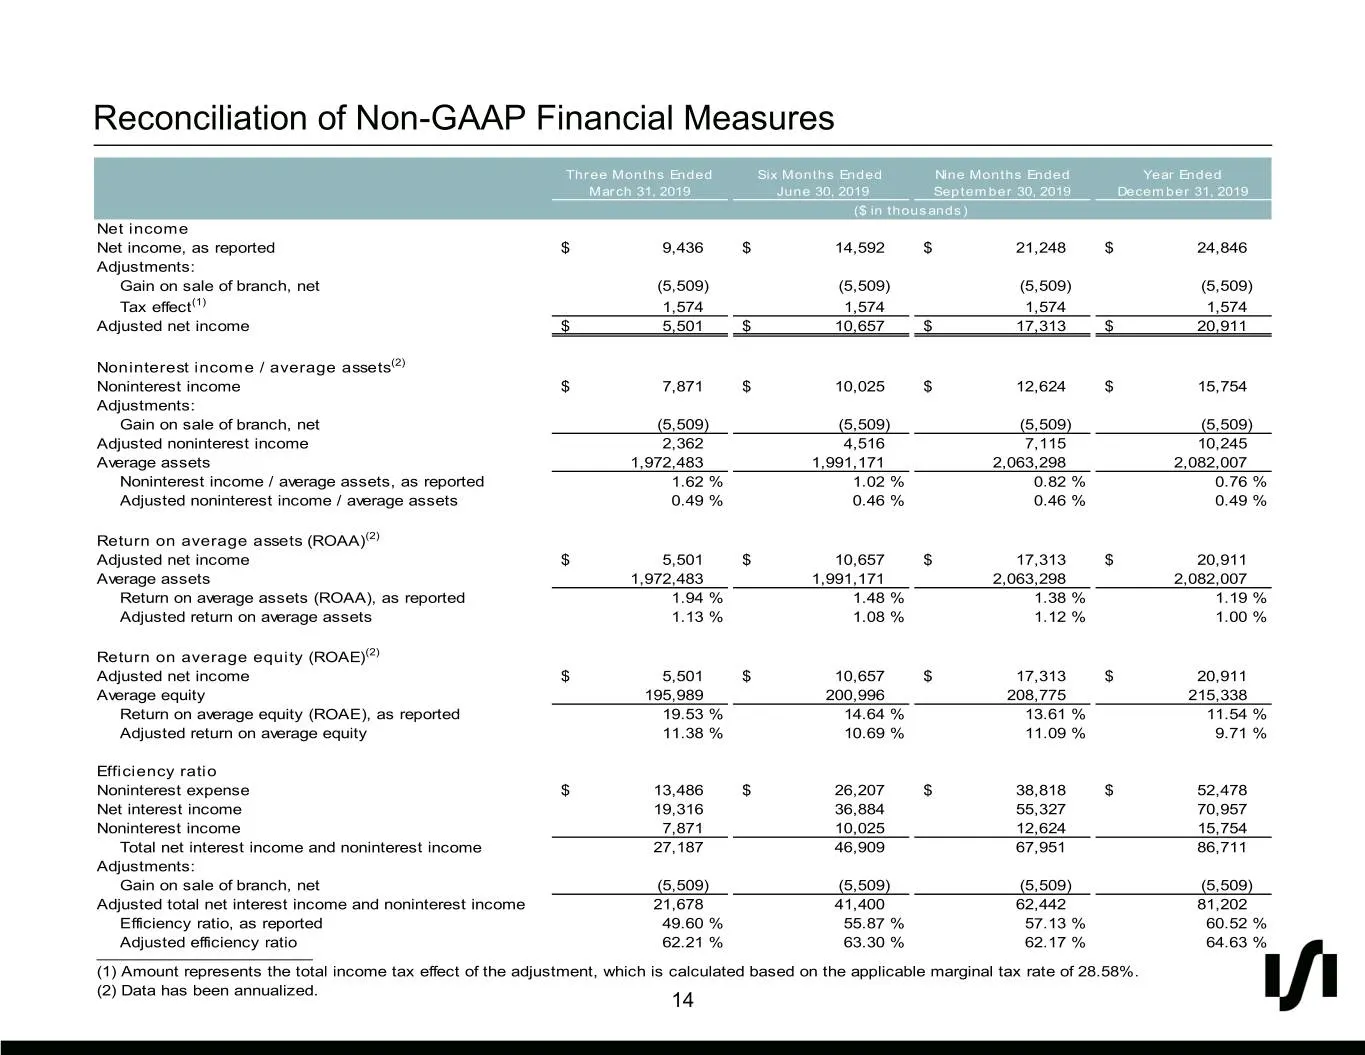
Reconciliation of Non-GAAP Financial Measures Three Months Ended Six Months Ended Nine Months Ended Year Ended March 31, 2019 June 30, 2019 September 30, 2019 December 31, 2019 ($ in thousands) Net income Net income, as reported $ 9,436 $ 14,592 $ 21,248 $ 24,846 Adjustments: Gain on sale of branch,
Source: SEC EDGAR · 8-K filed Jan 29, 2020
More decks from Silvergate Capital Corp.
 Q4 2022 Earnings Presentation11 slides · Jan 17, 2023
 Investor Presentation (November 2022)13 slides · Nov 1, 2022
 Q3 2022 Earnings Presentation10 slides · Oct 18, 2022
 Investor Presentation (August 2022)14 slides · Aug 8, 2022
 Q2 2022 Earnings Presentation10 slides · Jul 19, 2022
 Investor Presentation (May 2022)15 slides · May 10, 2022