Clearwater Paper Corporation · NYSE:CLW
Clearwater Paper — Investor Presentation (February 2023)
19 slides from Clearwater Paper's investor presentation, February 2023
Slide 1: Investor Presentation February 2023
INVESTOR PRESENTATION February 2023
Slide 2: Forward Looking Statements
FORWARD LOOKING STATEMENTS Cautionary Statement Regarding Forward Looking Statements This presentation of supplemental information contains, in addition to historical information, certain forward-looking statements within the meaning of the Private Securities Litigation Reform Act of 1995, including
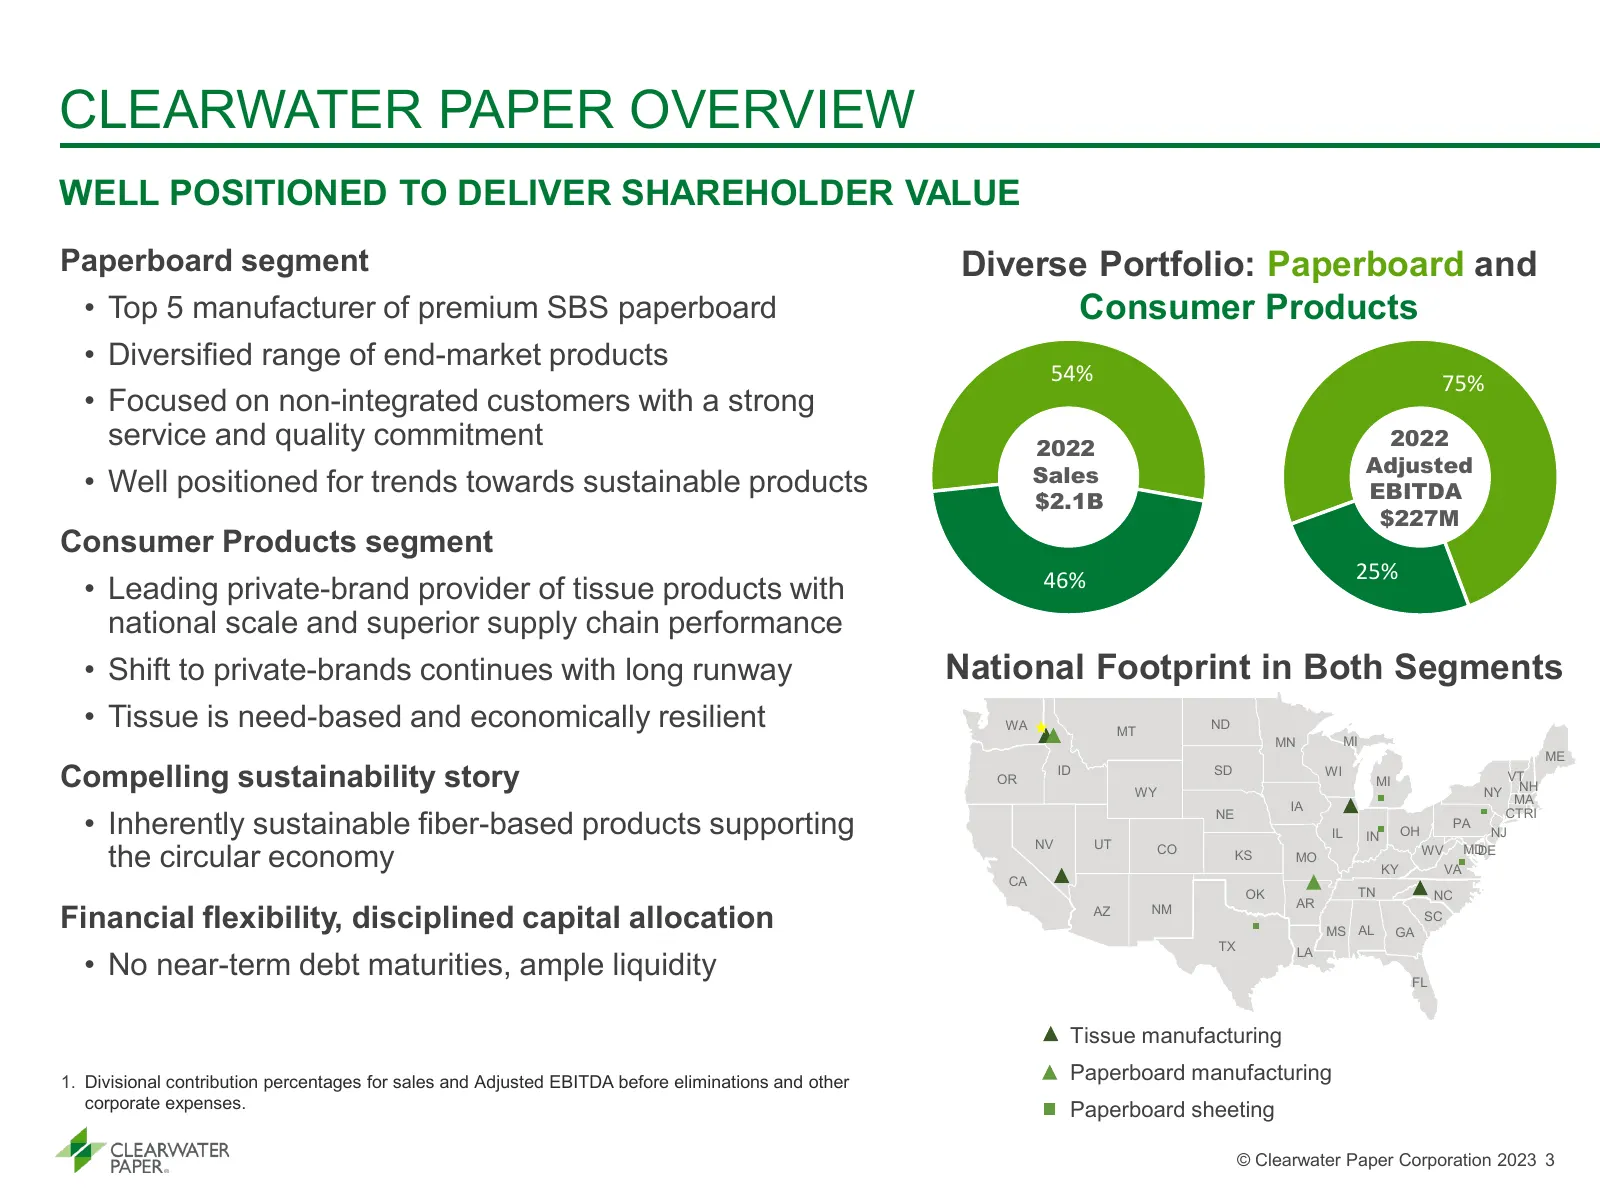
Slide 3: Clearwater Paper Overview
CLEARWATER PAPER OVERVIEW WELL POSITIONED TO DELIVER SHAREHOLDER VALUE Paperboard segment Diverse Portfolio: Paperboard and • Top 5 manufacturer of premium SBS paperboard Consumer Products • Diversified range of end-market products 54% 75% • Focused on non-integrated customers with a strong service
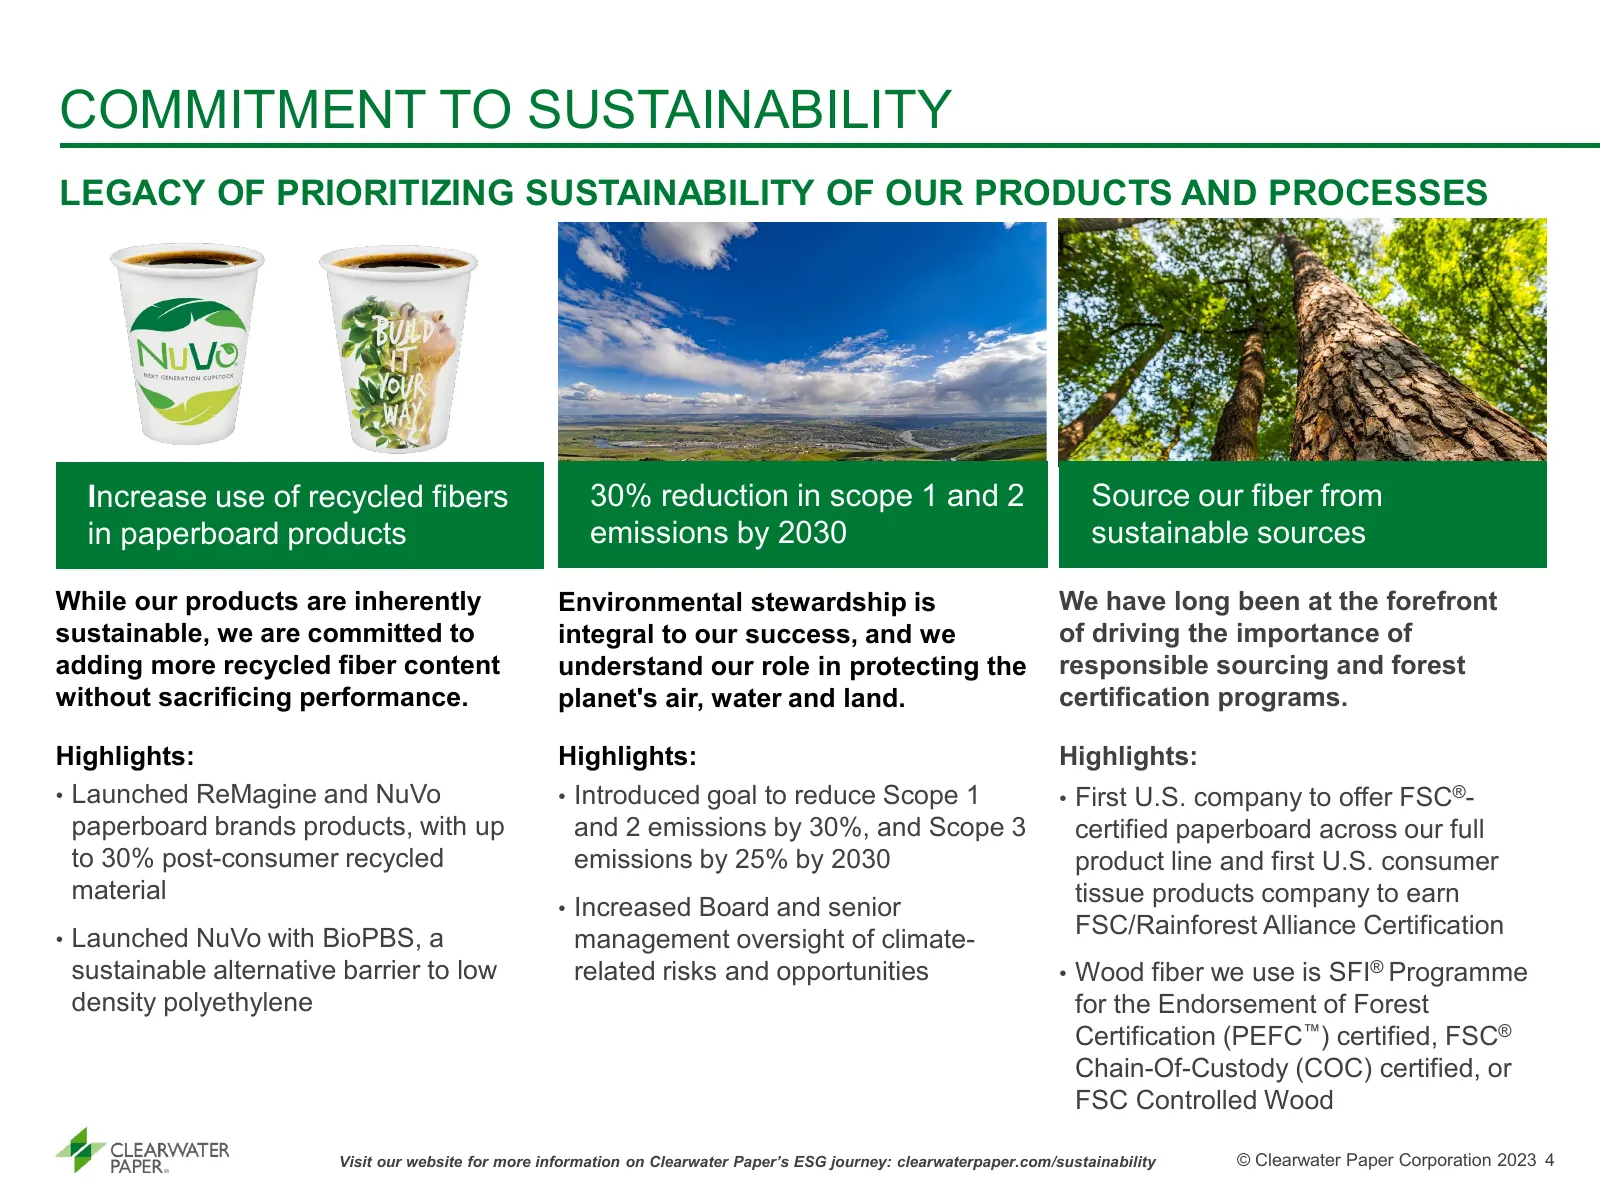
Slide 4: Commitment to Sustainability
COMMITMENT TO SUSTAINABILITY LEGACY OF PRIORITIZING SUSTAINABILITY OF OUR PRODUCTS AND PROCESSES Increase use of recycled fibers 30% reduction in scope 1 and 2 Source our fiber from in paperboard products emissions by 2030 sustainable sources While our products are inherently Environmental stewardsh
Slide 5: Capital Allocation Priorities
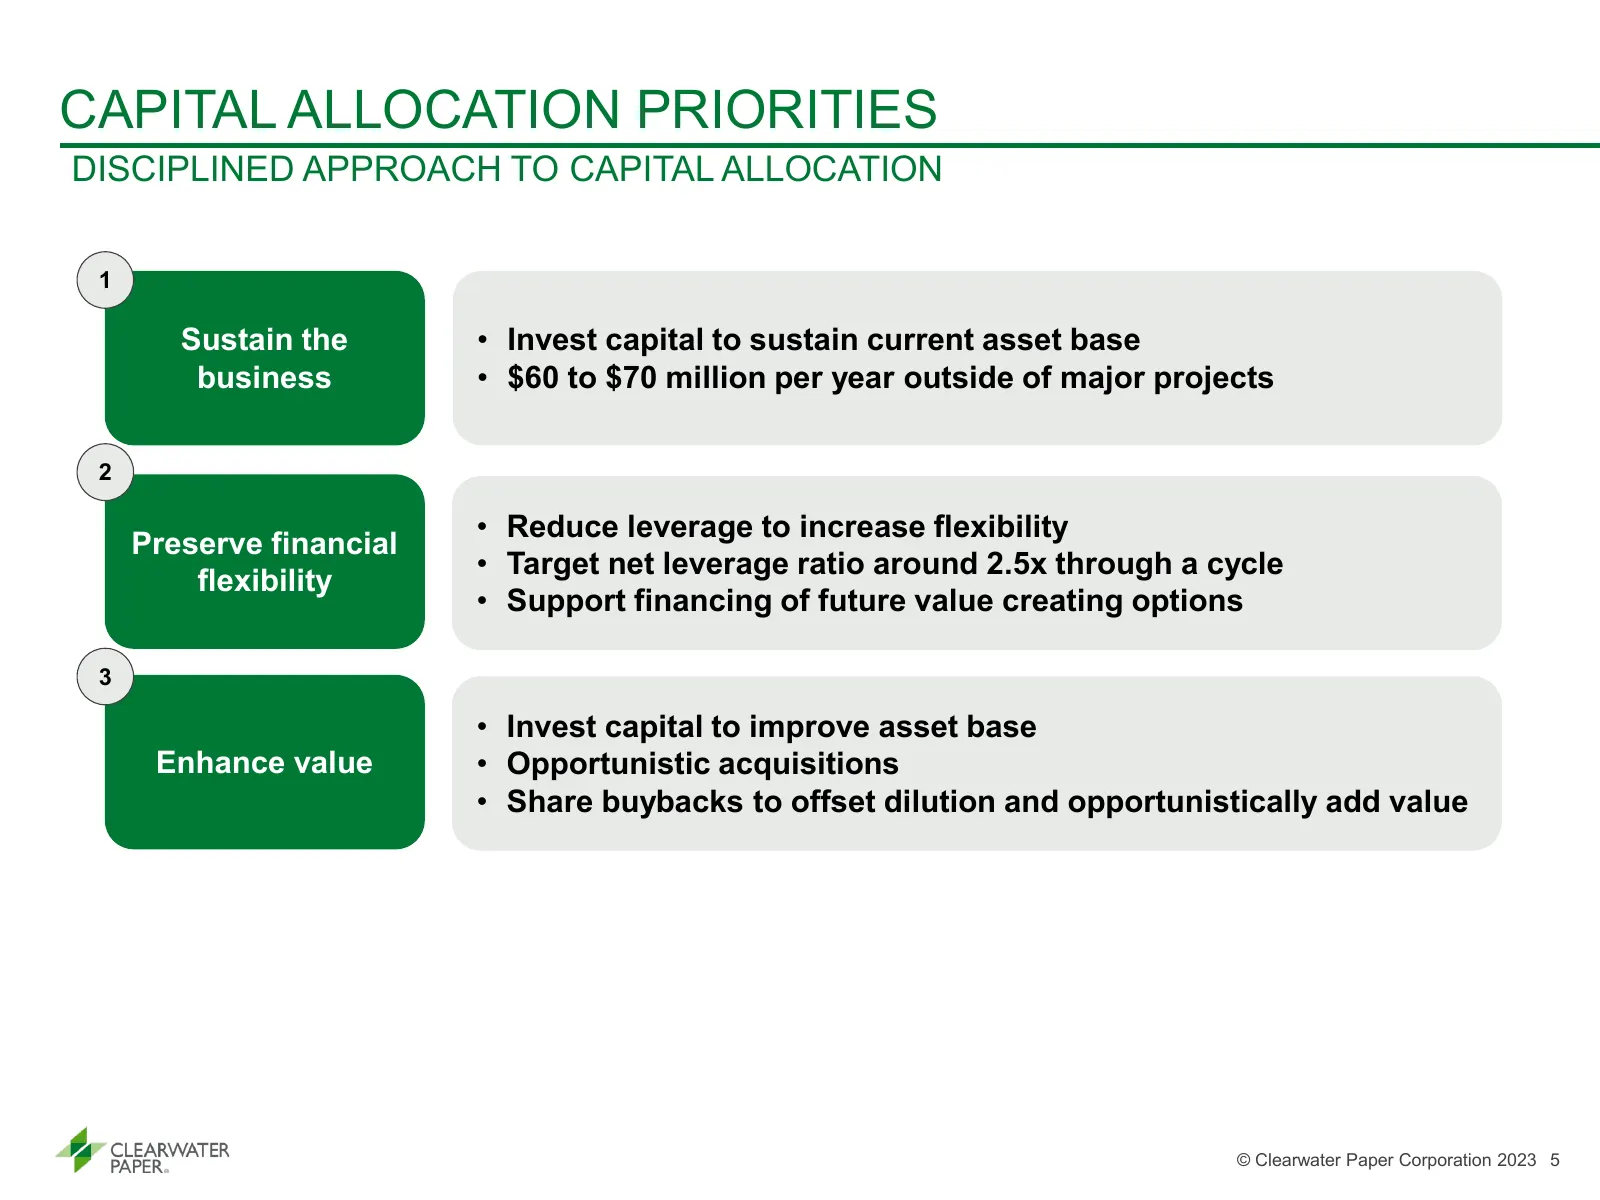
CAPITAL ALLOCATION PRIORITIES DISCIPLINED APPROACH TO CAPITAL ALLOCATION 1 Sustain the • Invest capital to sustain current asset base business • $60 to $70 million per year outside of major projects 2 • Reduce leverage to increase flexibility Preserve financial • Target net leverage ratio around 2.5
Slide 6: Paperboard Products Division
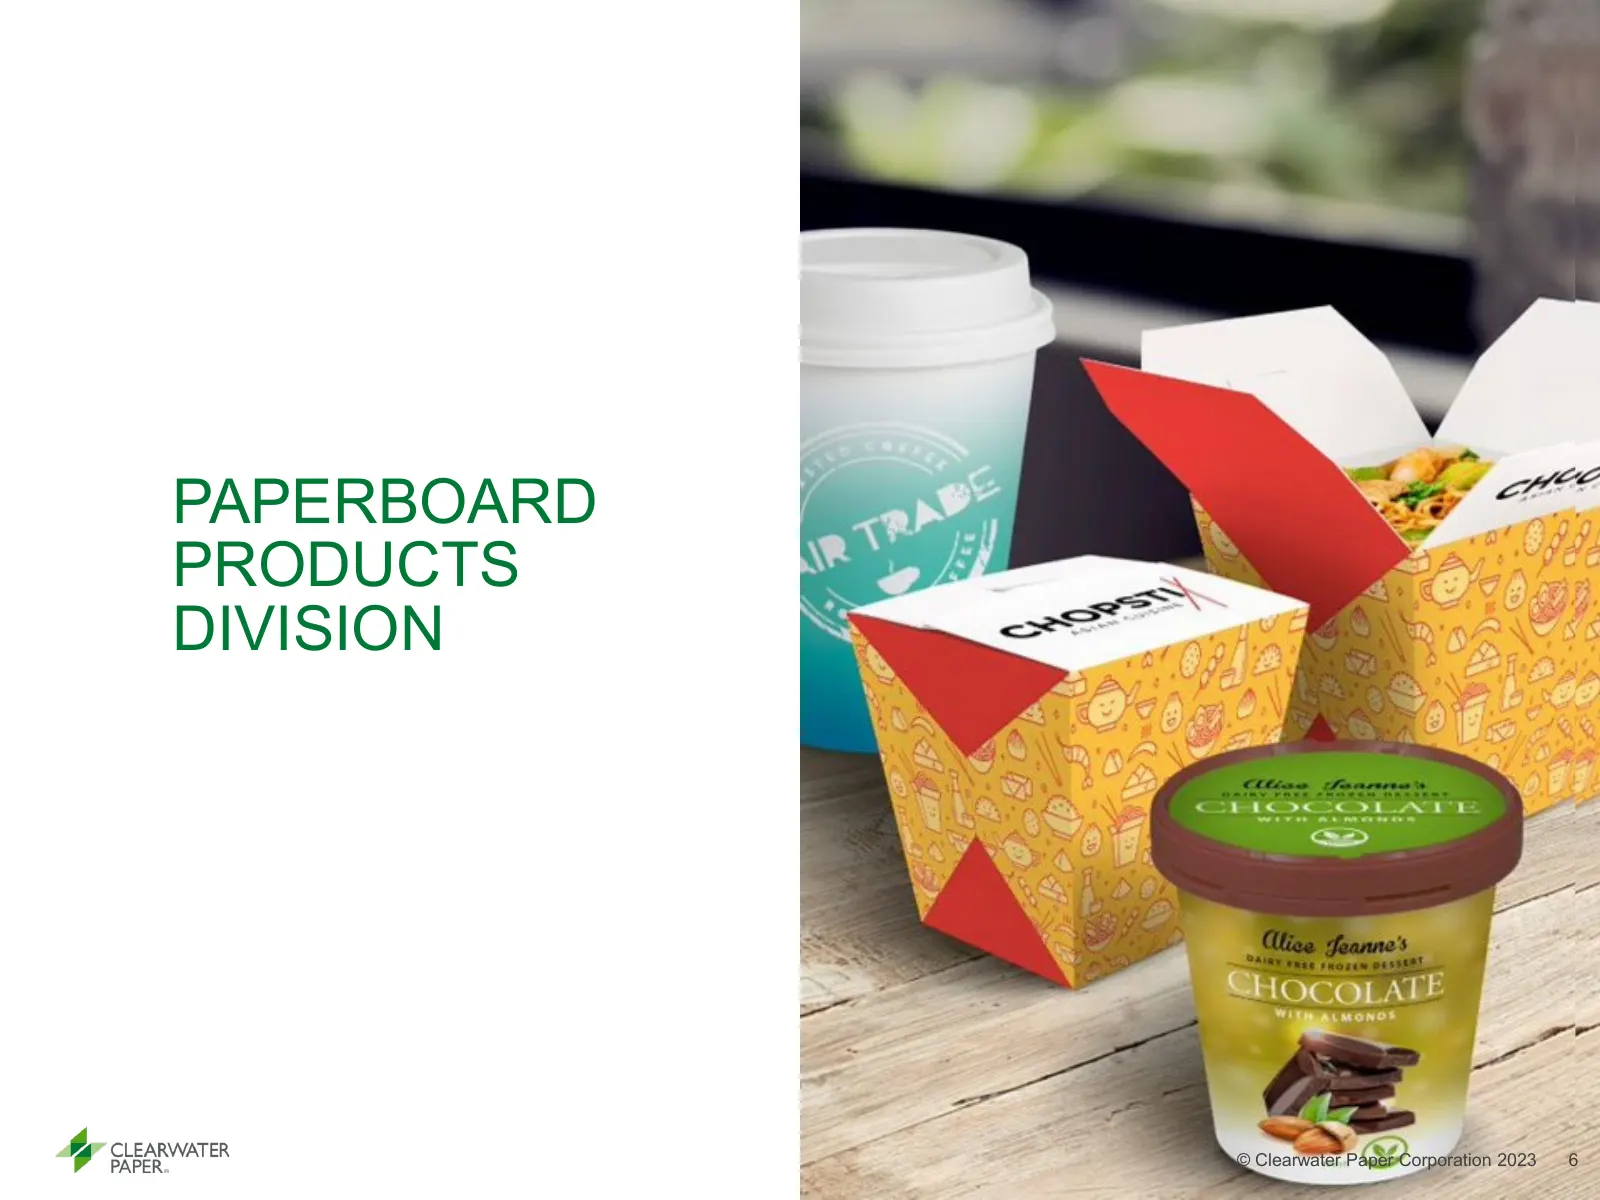
PAPERBOARD PRODUCTS DIVISION © Clearwater Paper Corporation 2023 6
Slide 7: Paperboard Segment Overview
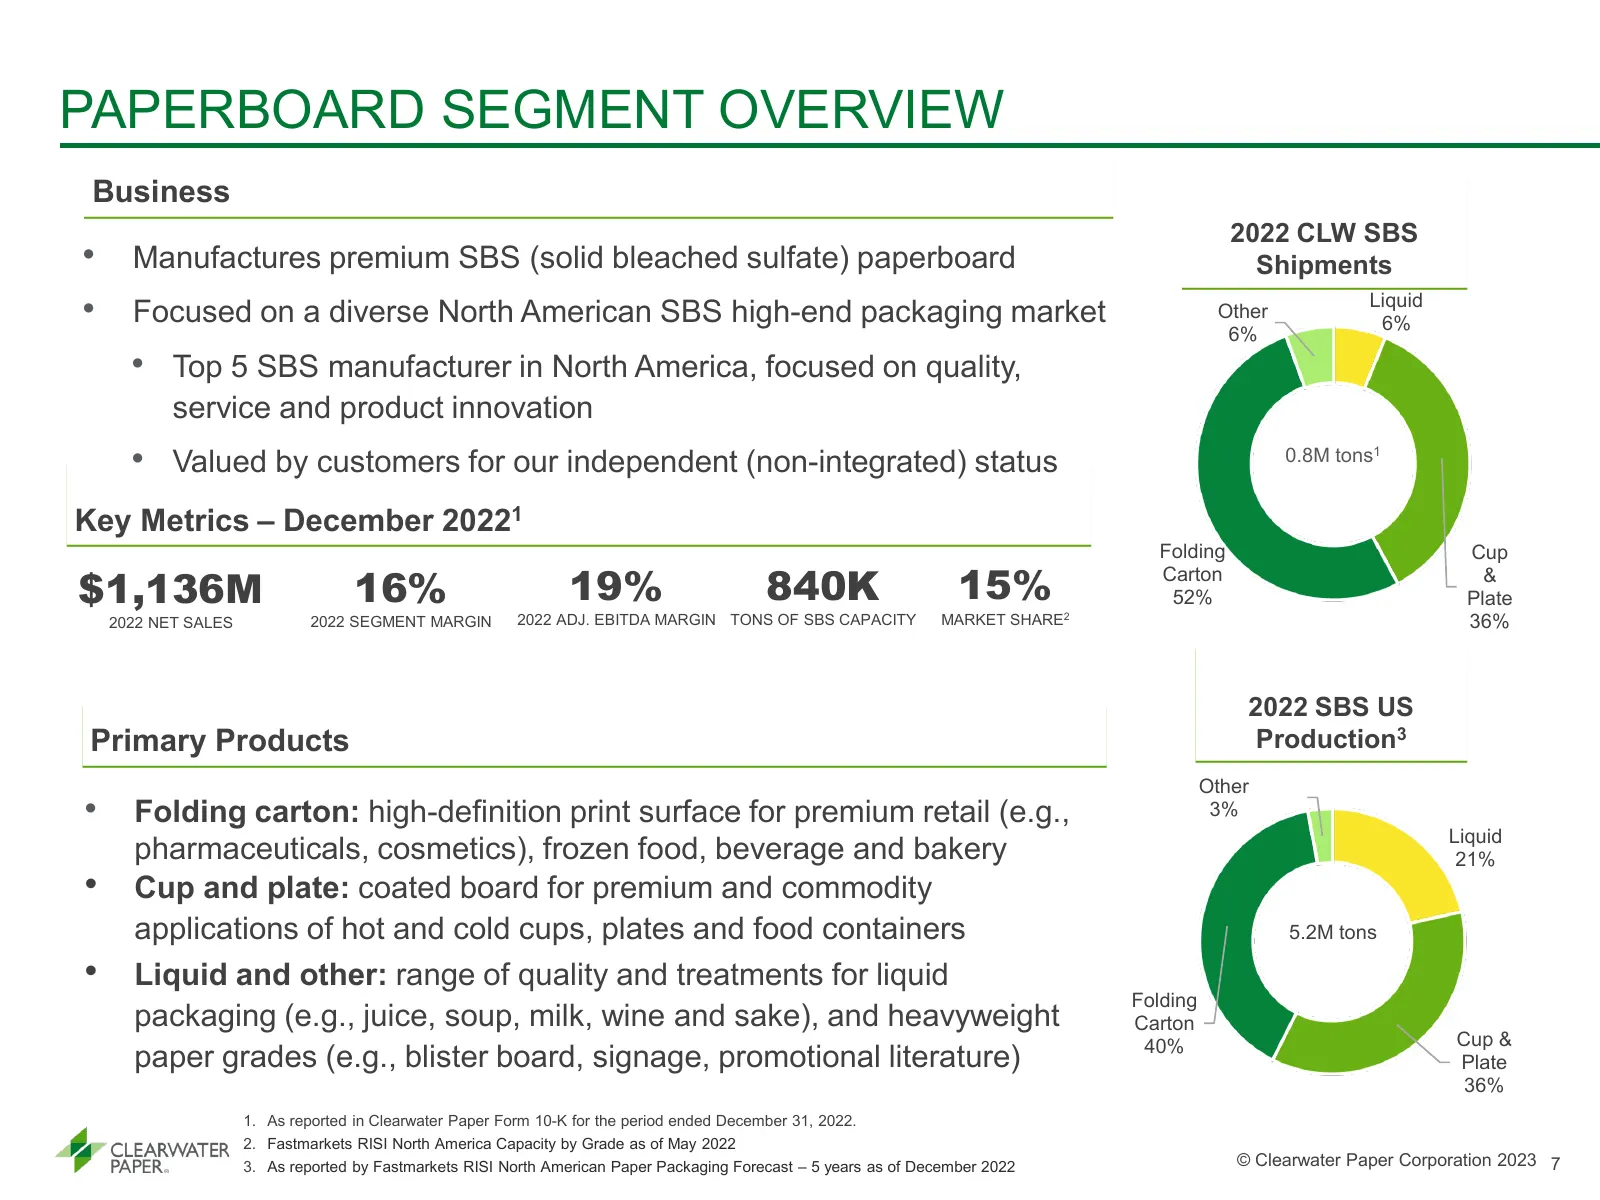
PAPERBOARD SEGMENT OVERVIEW Business 2022 CLW SBS • Manufactures premium SBS (solid bleached sulfate) paperboard Shipments • Focused on a diverse North American SBS high-end packaging market Other Liquid 6% 6% • Top 5 SBS manufacturer in North America, focused on quality, service and product innovat
Slide 8: Paperboard Industry Overview
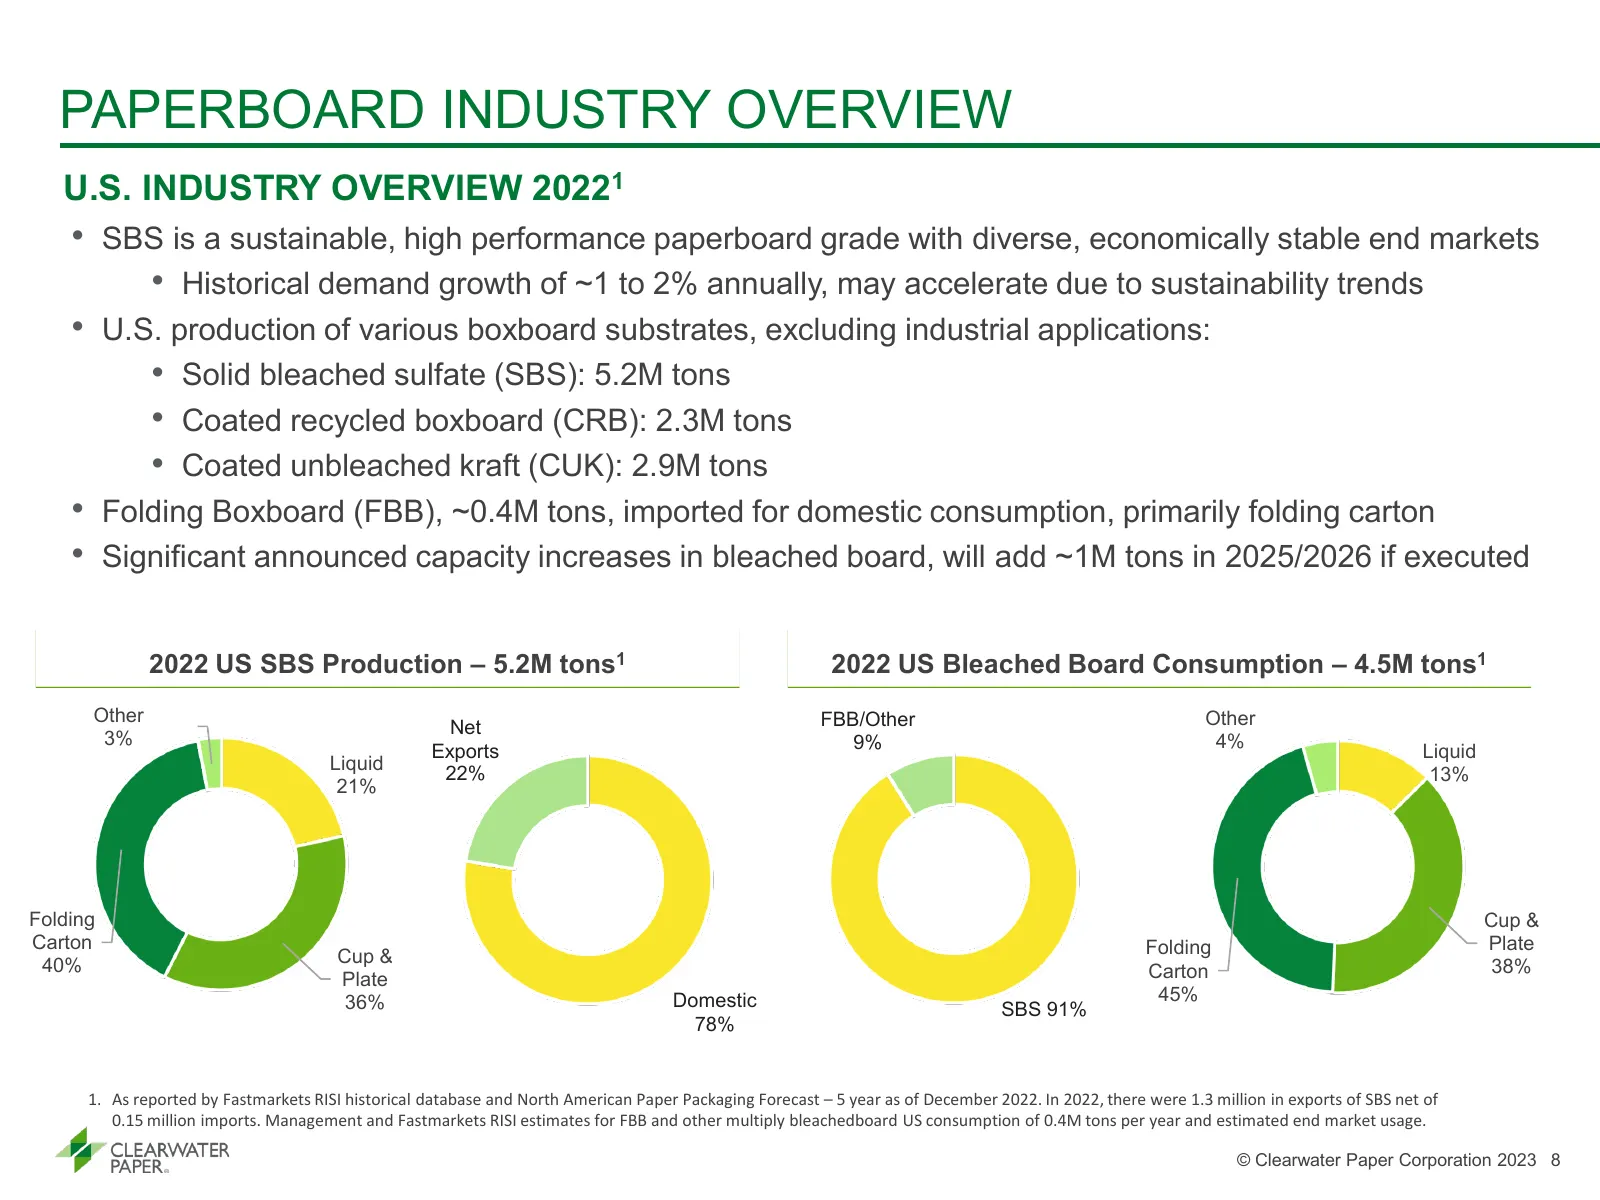
PAPERBOARD INDUSTRY OVERVIEW U.S. INDUSTRY OVERVIEW 20221 • SBS is a sustainable, high performance paperboard grade with diverse, economically stable end markets • Historical demand growth of ~1 to 2% annually, may accelerate due to sustainability trends • U.S. production of various boxboard substra
Slide 9: Sustainable Paperboard Products
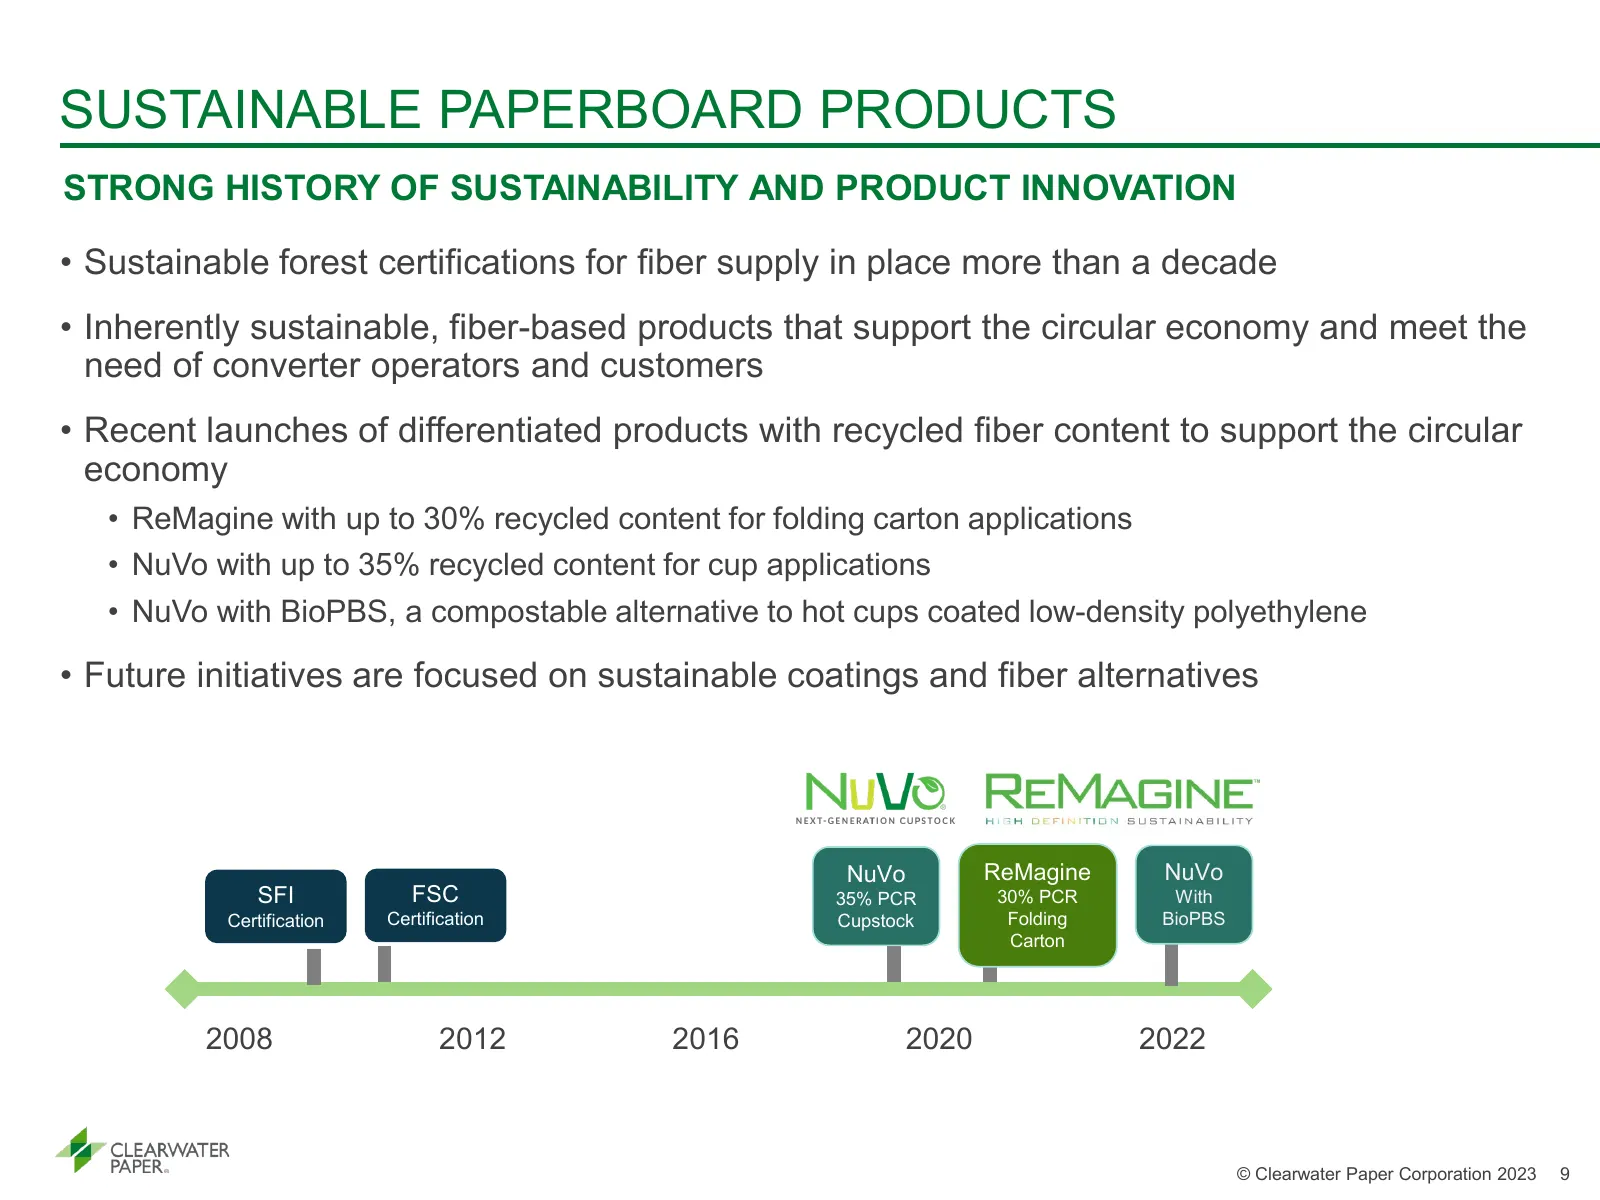
SUSTAINABLE PAPERBOARD PRODUCTS STRONG HISTORY OF SUSTAINABILITY AND PRODUCT INNOVATION • Sustainable forest certifications for fiber supply in place more than a decade • Inherently sustainable, fiber-based products that support the circular economy and meet the need of converter operators and custo
Slide 10: Consumer Products Division
CONSUMER PRODUCTS DIVISION © Clearwater Paper Corporation 2023 10
Slide 11: Consumer Products Segment Overview
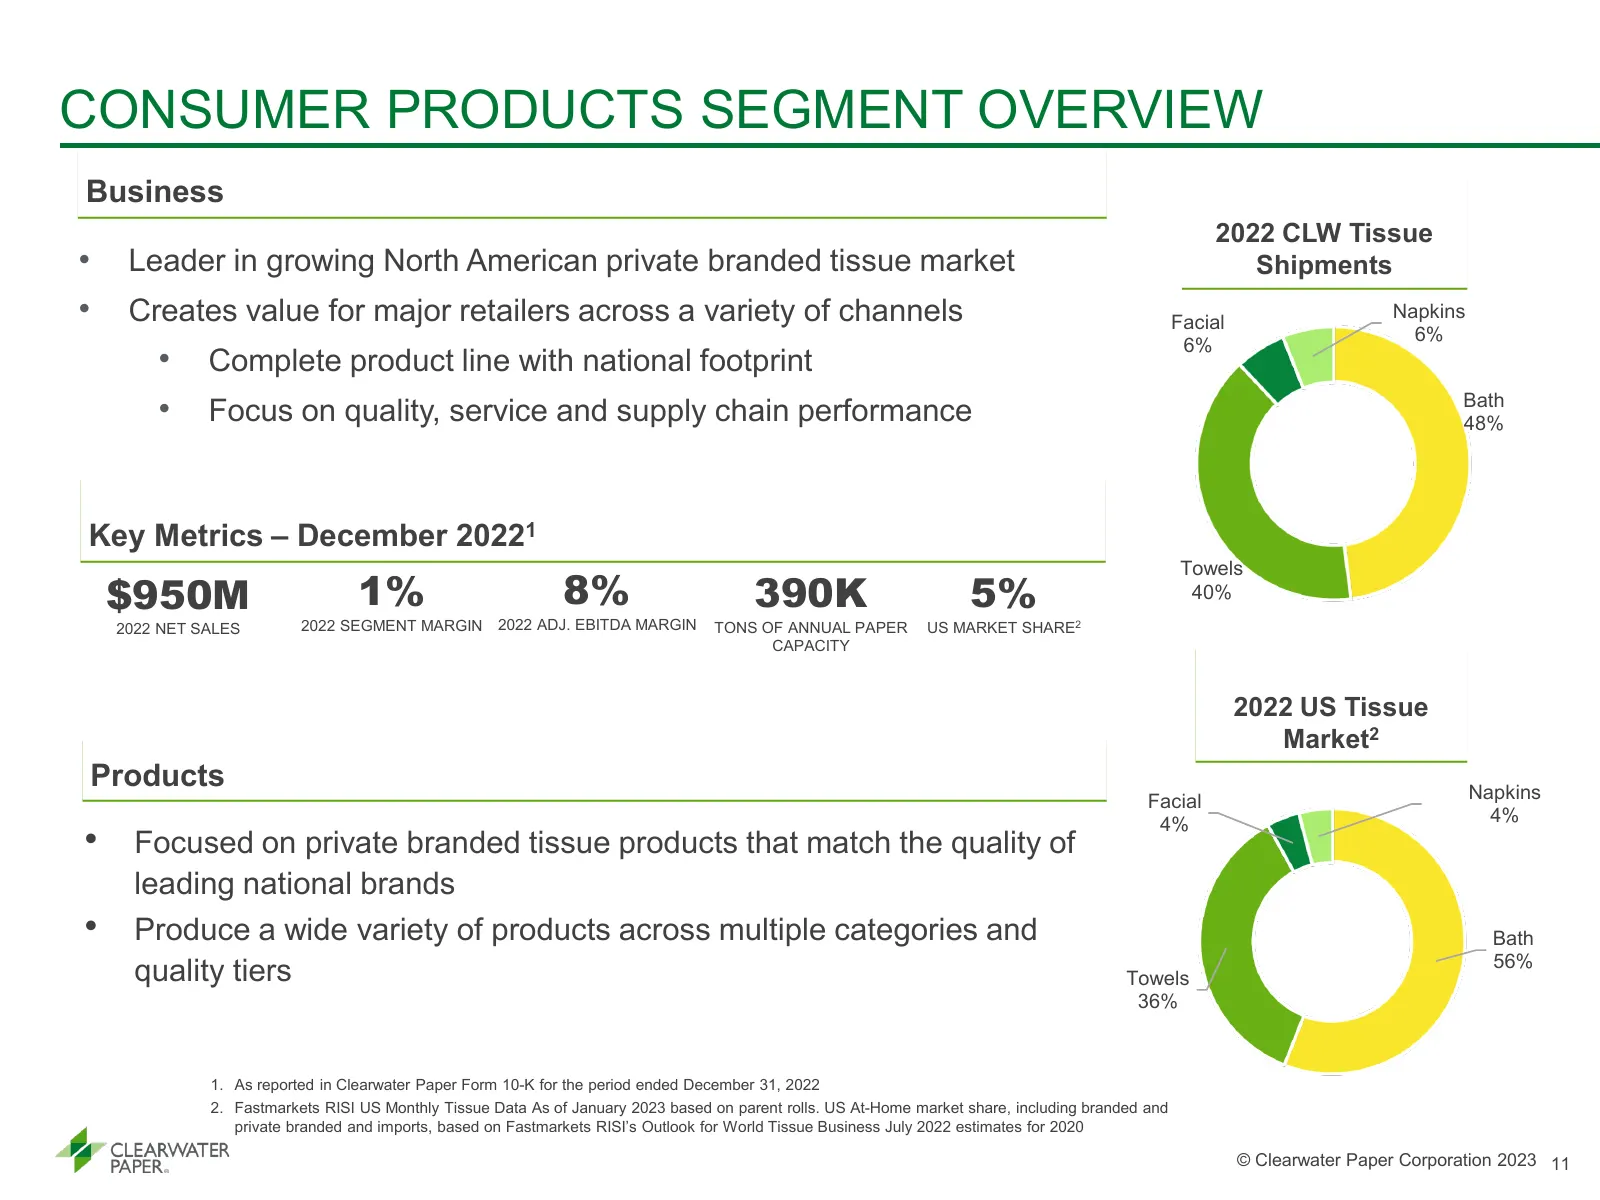
CONSUMER PRODUCTS SEGMENT OVERVIEW Business 2022 CLW Tissue • Leader in growing North American private branded tissue market Shipments • Creates value for major retailers across a variety of channels Facial Napkins 6% 6% • Complete product line with national footprint • Focus on quality, service and
Slide 12: Consumer Products Industry Overview
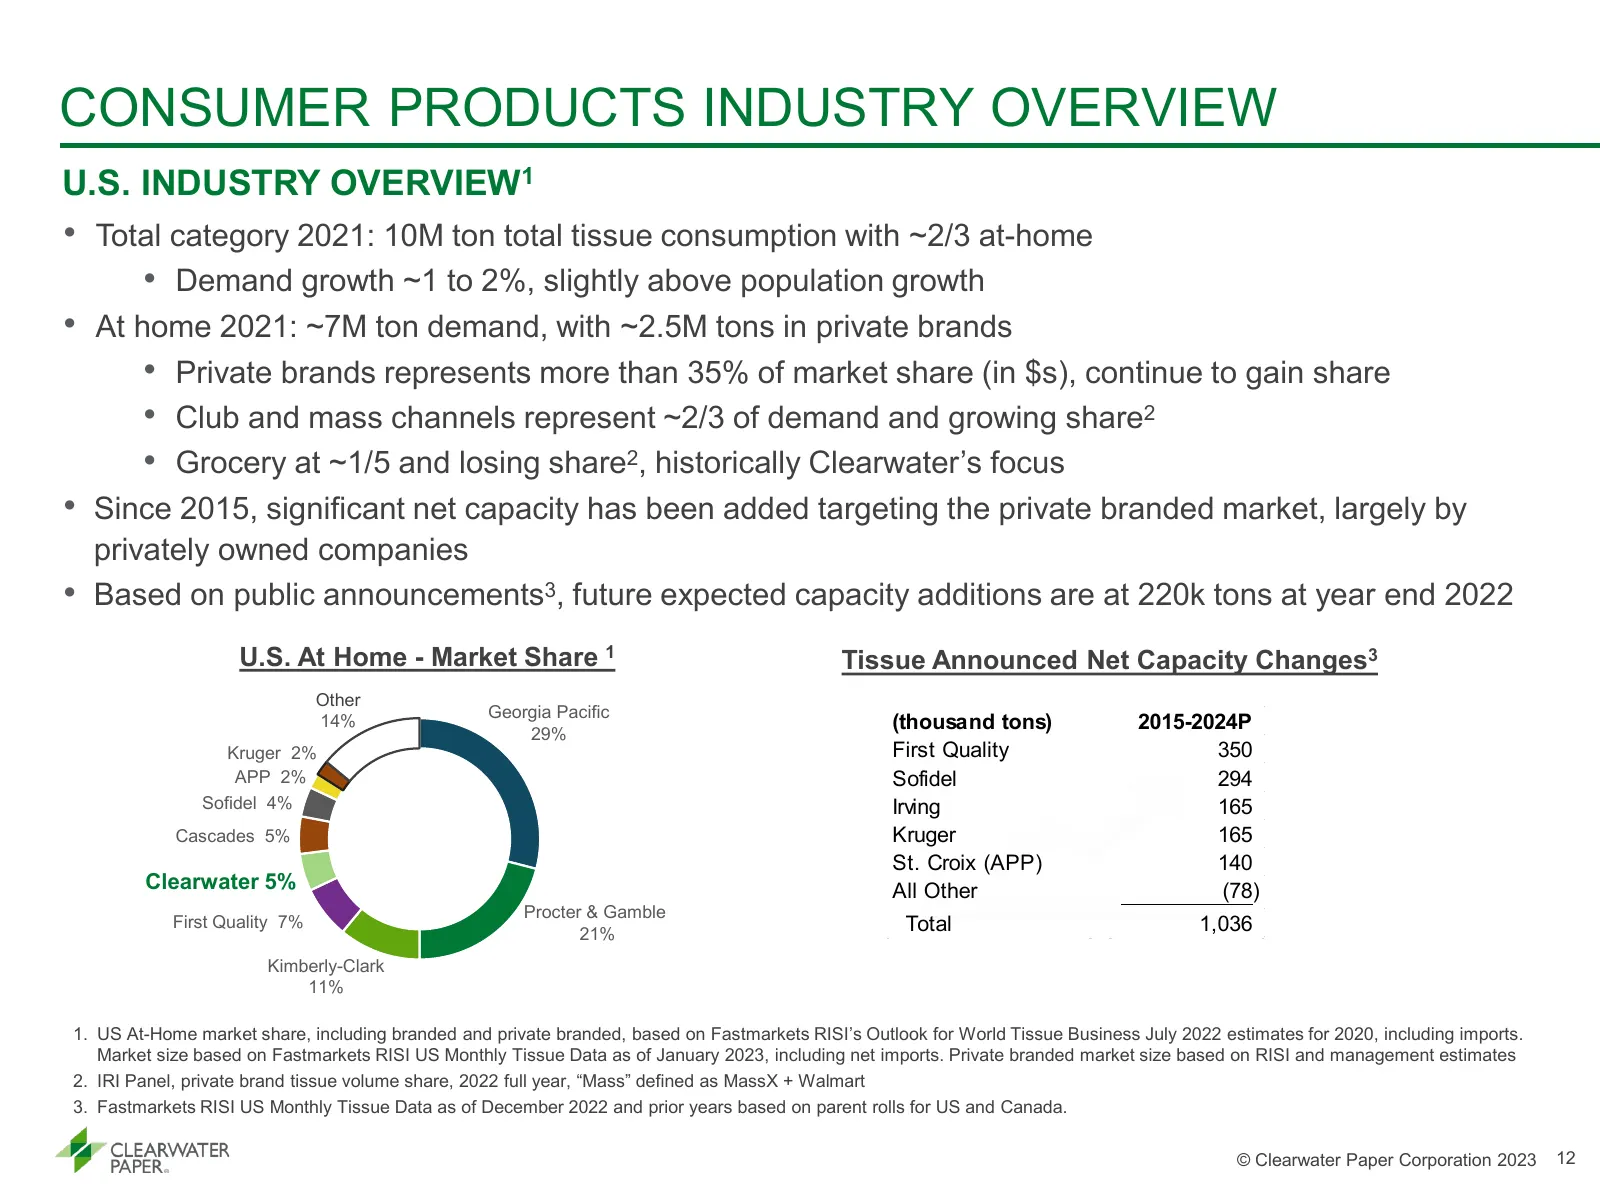
CONSUMER PRODUCTS INDUSTRY OVERVIEW U.S. INDUSTRY OVERVIEW1 • Total category 2021: 10M ton total tissue consumption with ~2/3 at-home • Demand growth ~1 to 2%, slightly above population growth • At home 2021: ~7M ton demand, with ~2.5M tons in private brands • Private brands represents more than 35%
Slide 13: Appendix
APPENDIX © Clearwater Paper Corporation 2023 13
Slide 14: Capital Structure and Allocation
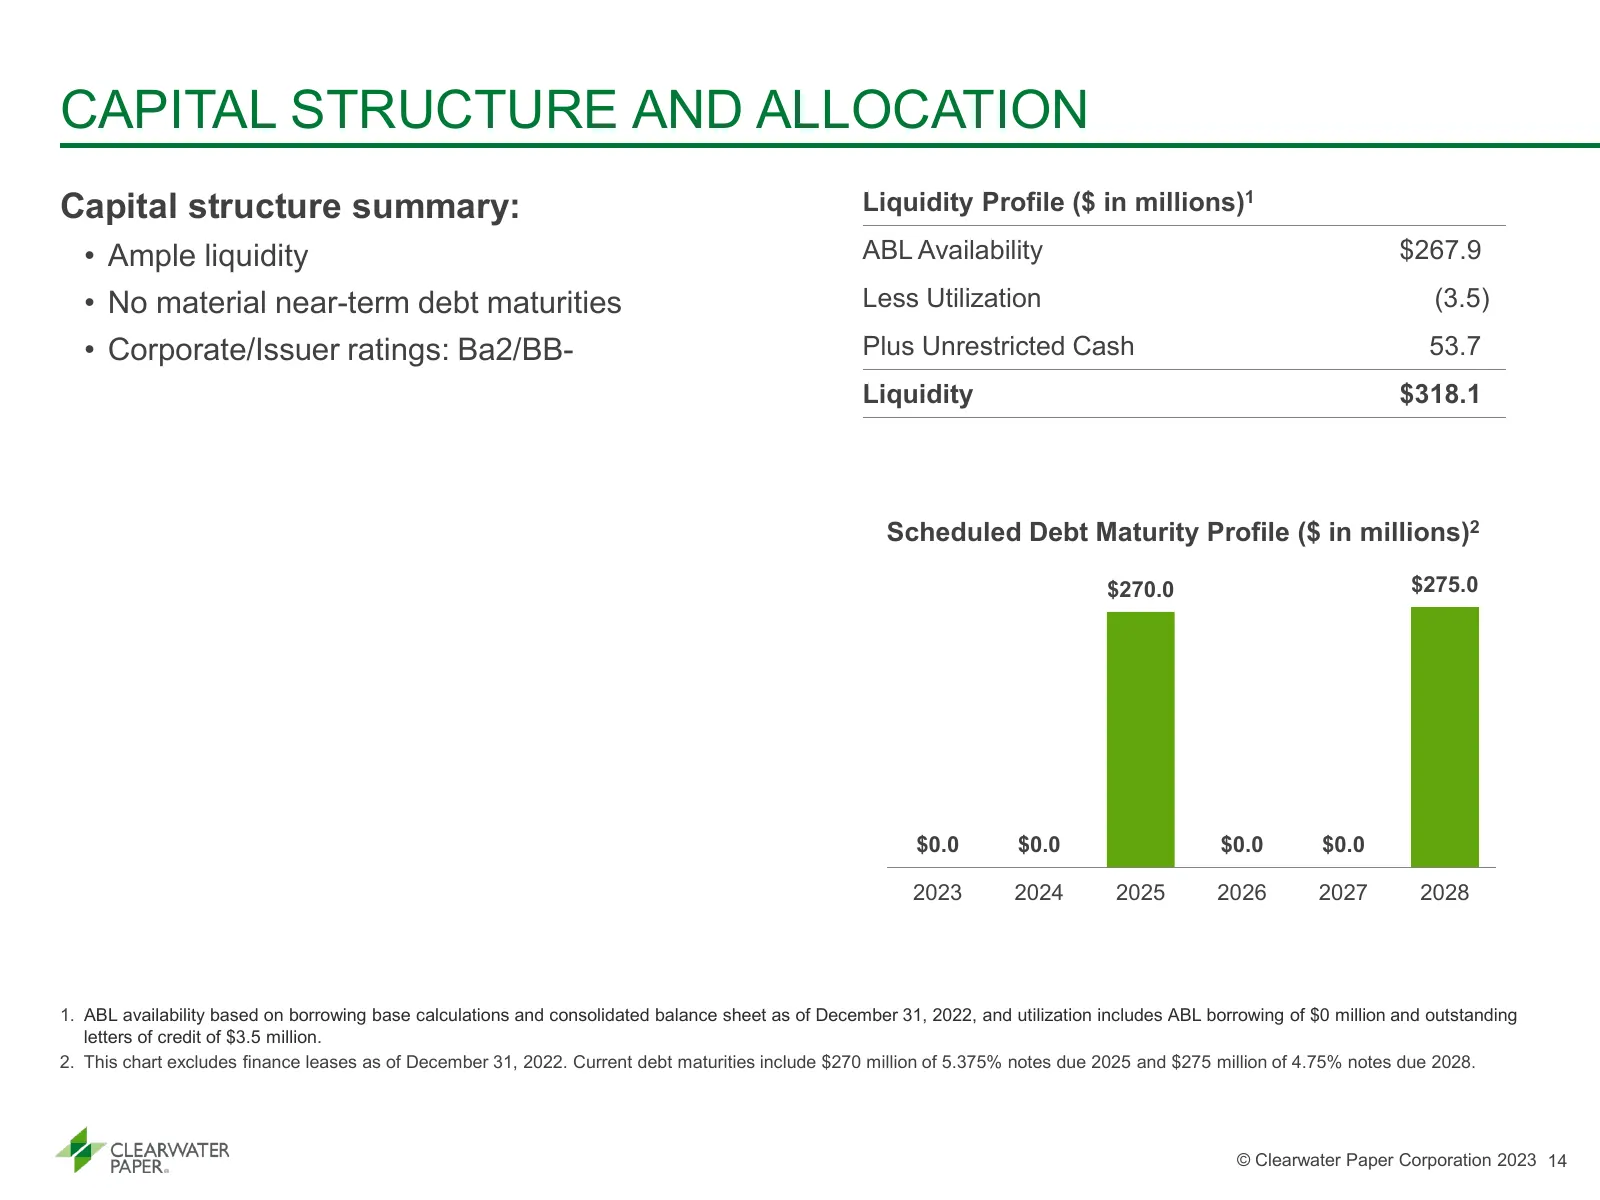
CAPITAL STRUCTURE AND ALLOCATION Capital structure summary: Liquidity Profile ($ in millions)1 • Ample liquidity ABL Availability $267.9 • No material near-term debt maturities Less Utilization (3.5) • Corporate/Issuer ratings: Ba2/BB- Plus Unrestricted Cash 53.7 Liquidity $318.1 Scheduled Debt Matu
Slide 15: Key Commodity Consumption Volumes
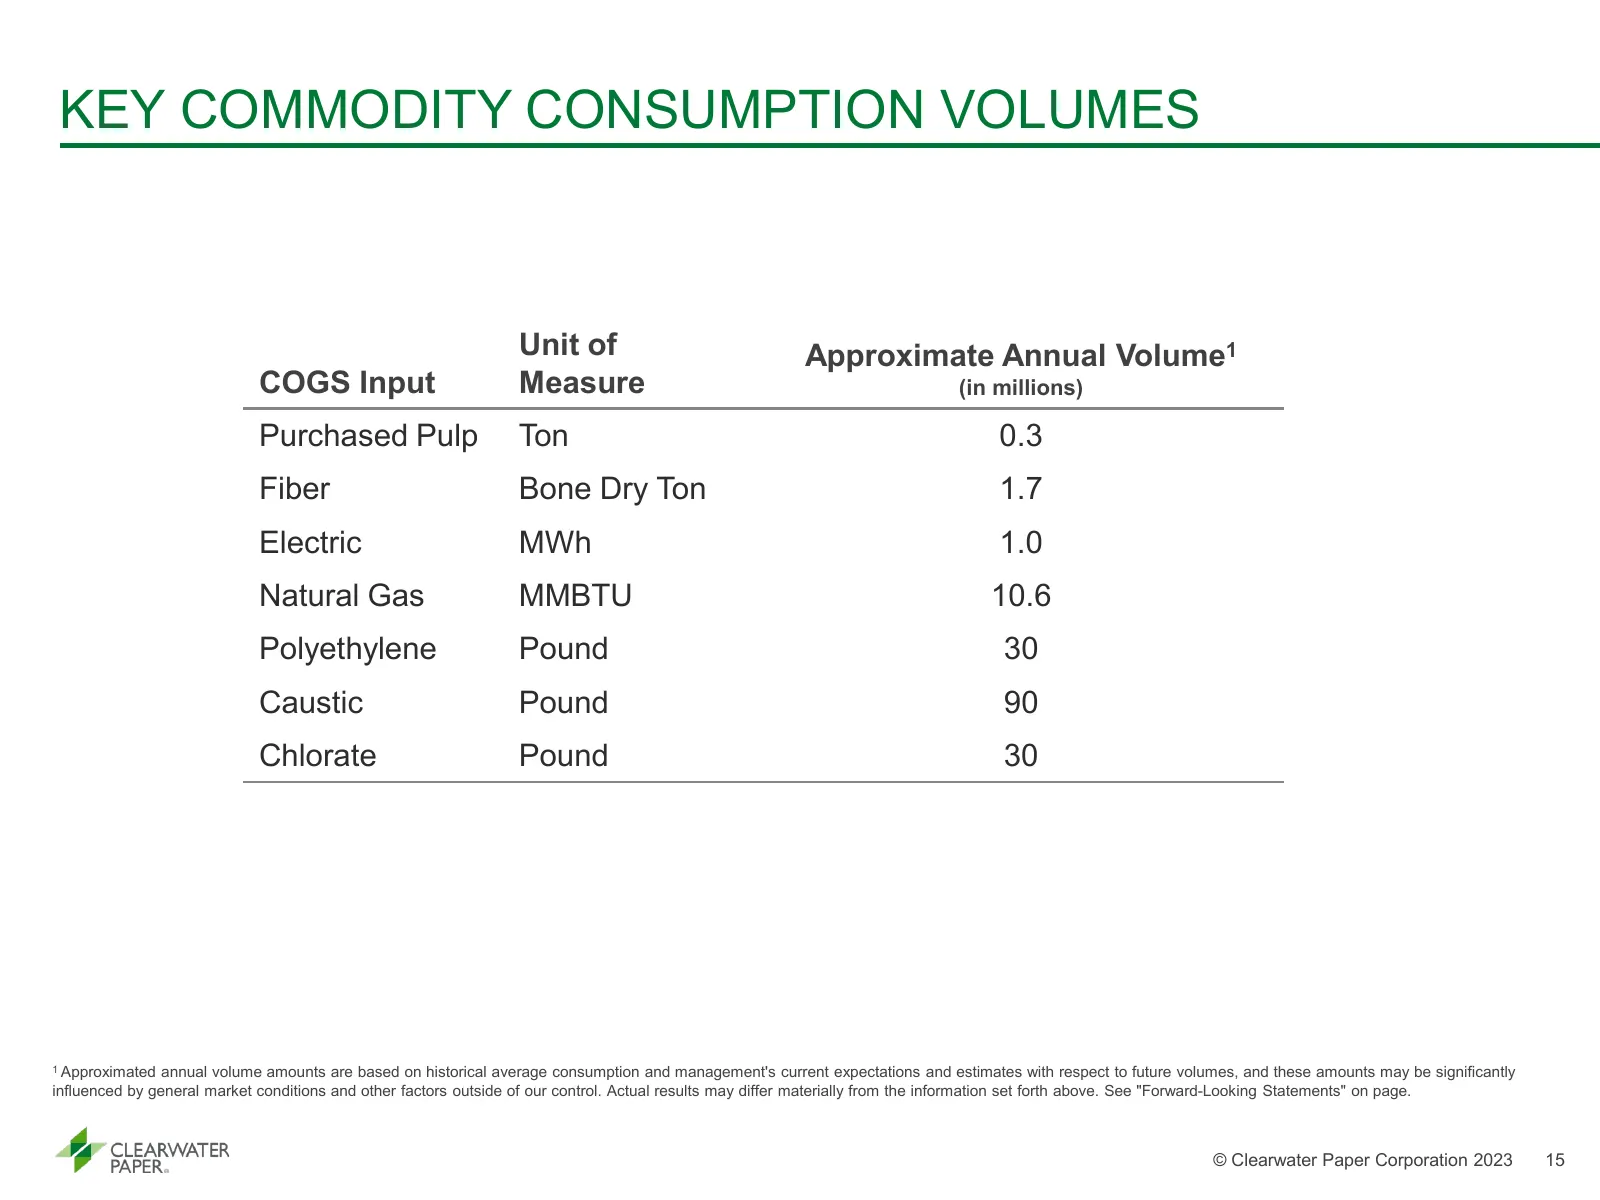
KEY COMMODITY CONSUMPTION VOLUMES Unit of Approximate Annual Volume1 COGS Input Measure (in millions) Purchased Pulp Ton 0.3 Fiber Bone Dry Ton 1.7 Electric MWh 1.0 Natural Gas MMBTU 10.6 Polyethylene Pound 30 Caustic Pound 90 Chlorate Pound 30 1 Approximated annual volume amounts are based on histo
Slide 16: Key Segment Information
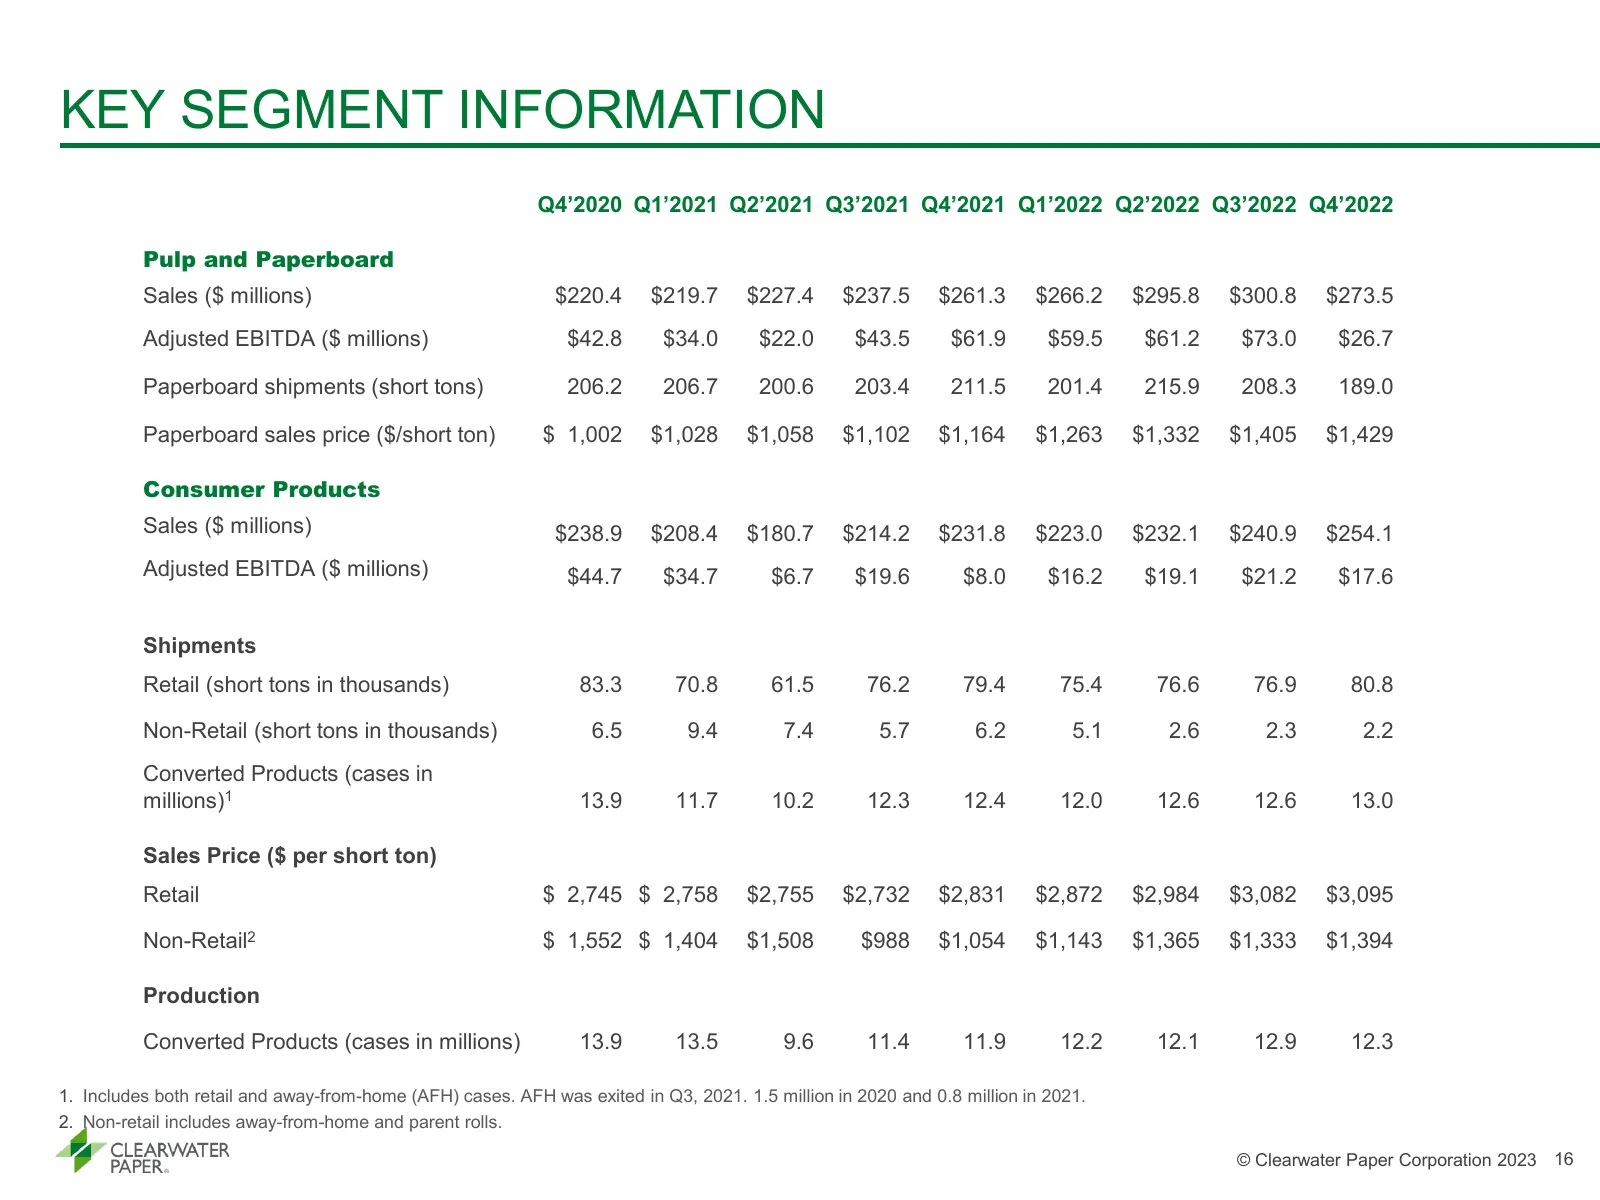
KEY SEGMENT INFORMATION Q4’2020 Q1’2021 Q2’2021 Q3’2021 Q4’2021 Q1’2022 Q2’2022 Q3’2022 Q4’2022 Pulp and Paperboard Sales ($ millions) $220.4 $219.7 $227.4 $237.5 $261.3 $266.2 $295.8 $300.8 $273.5 Adjusted EBITDA ($ millions) $42.8 $34.0 $22.0 $43.5 $61.9 $59.5 $61.2 $73.0 $26.7 Paperboard shipment
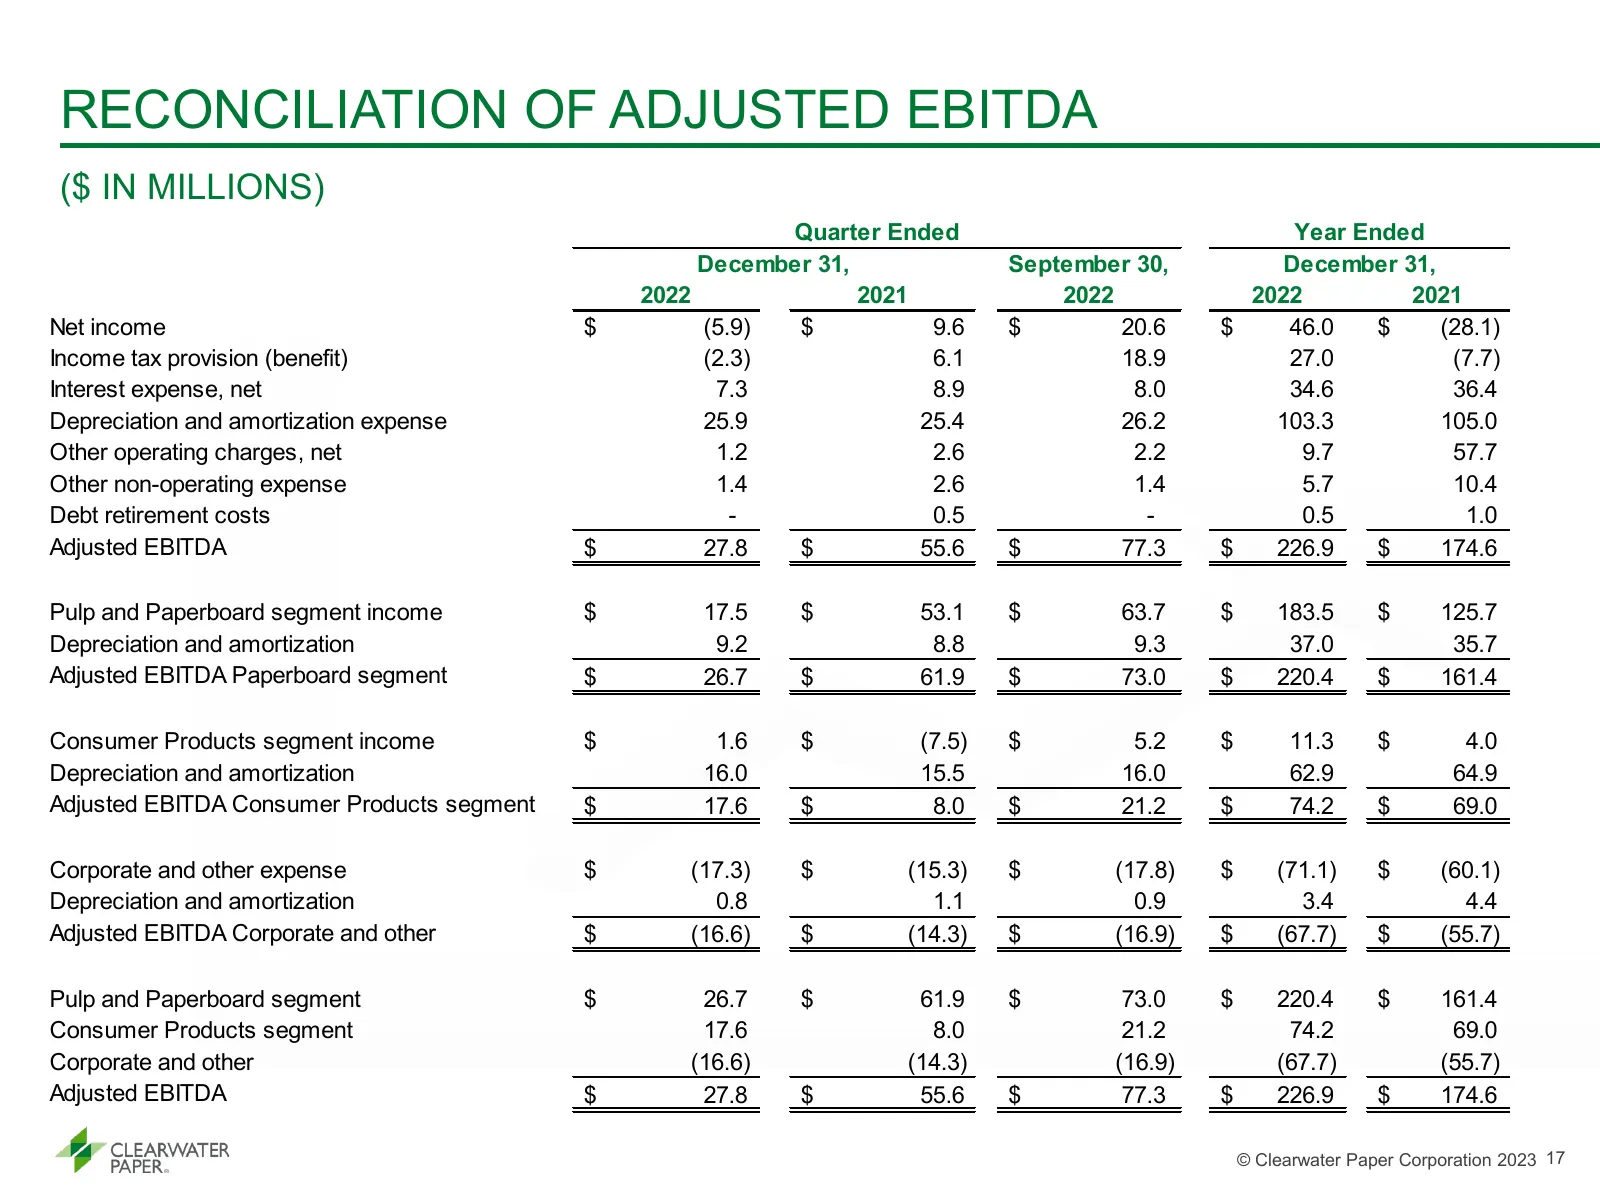
Slide 17: Reconciliation of Adjusted EBITDA
RECONCILIATION OF ADJUSTED EBITDA ($ IN MILLIONS) Quarter Ended Year Ended December 31, September 30, December 31, 2022 2021 2022 2022 2021 Net income $ (5.9) $ 9.6 $ 20.6 $ 46.0 $ (28.1) Income tax provision (benefit) (2.3) 6.1 18.9 27.0 (7.7) Interest expense, net 7.3 8.9 8.0 34.6 36.4 Depreciatio
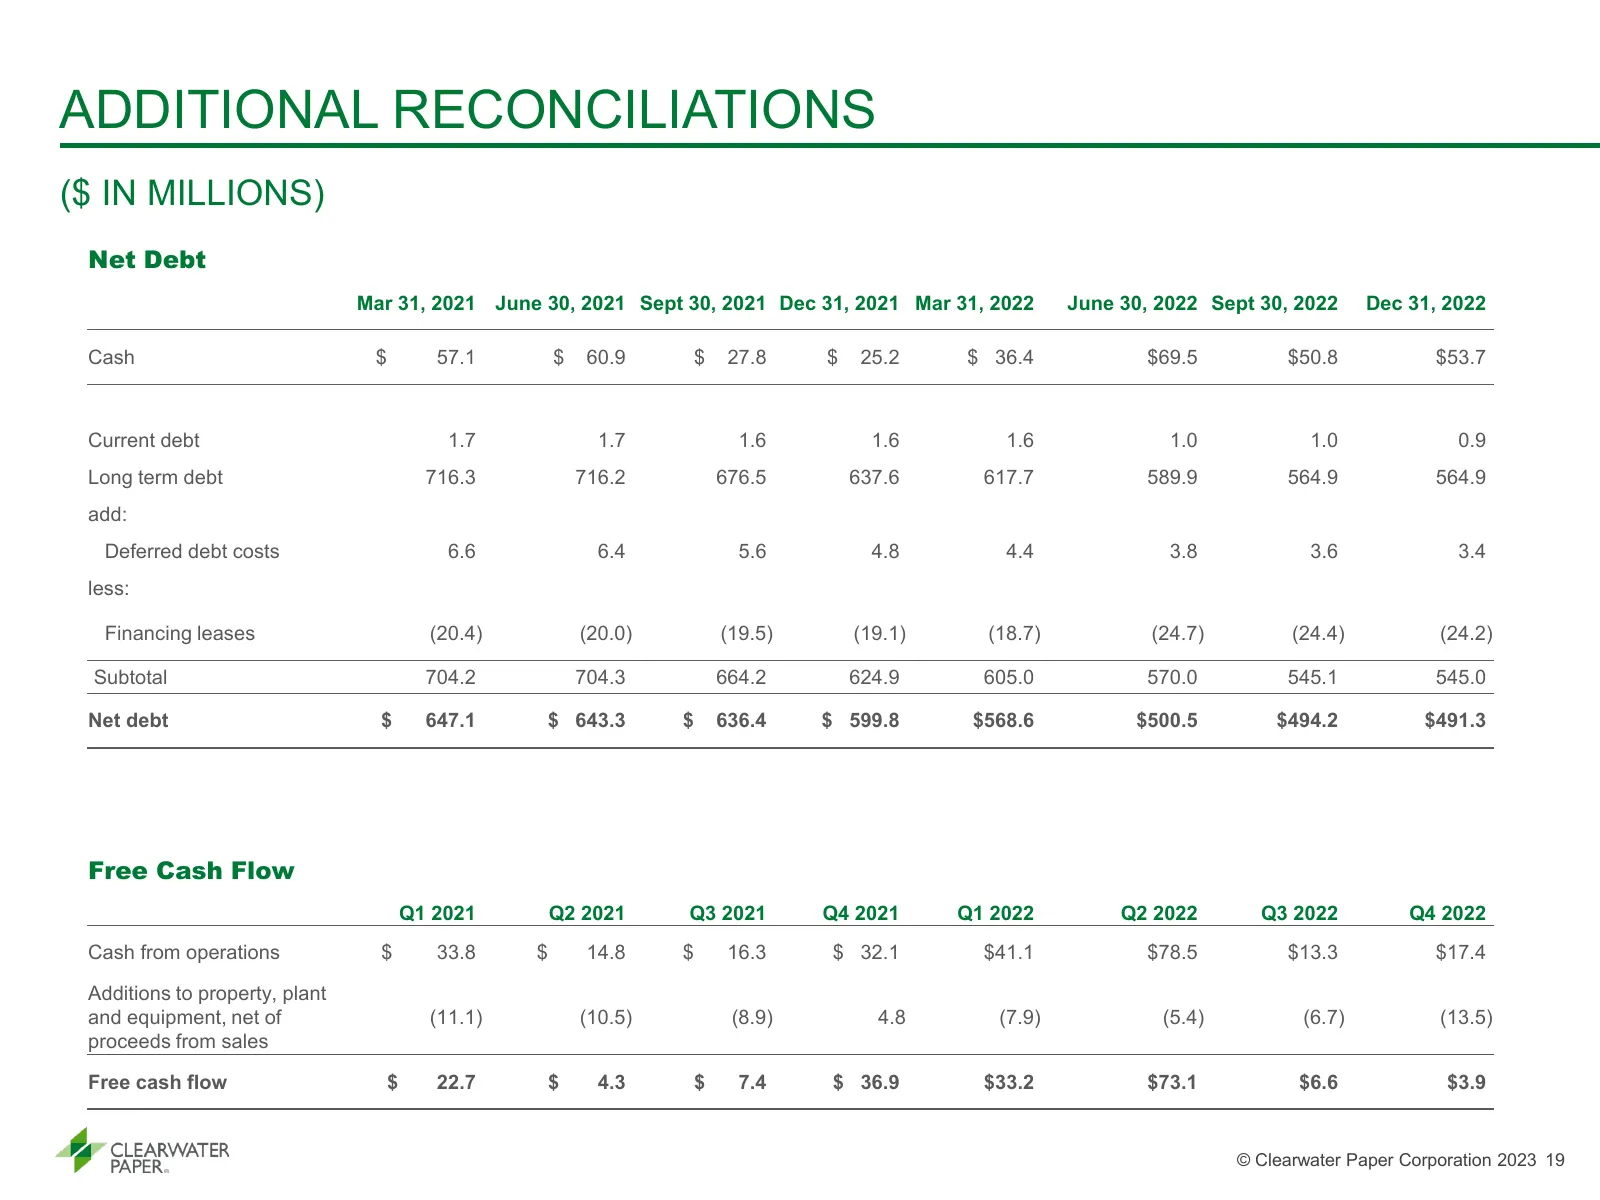
Slide 18: Additional Reconciliations
ADDITIONAL RECONCILIATIONS ($ IN MILLIONS) Net Debt Mar 31, 2021 June 30, 2021 Sept 30, 2021 Dec 31, 2021 Mar 31, 2022 June 30, 2022 Sept 30, 2022 Dec 31, 2022 Cash $ 57.1 $ 60.9 $ 27.8 $ 25.2 $ 36.4 $69.5 $50.8 $53.7 Current debt 1.7 1.7 1.6 1.6 1.6 1.0 1.0 0.9 Long term debt 716.3 716.2 676.5 637.
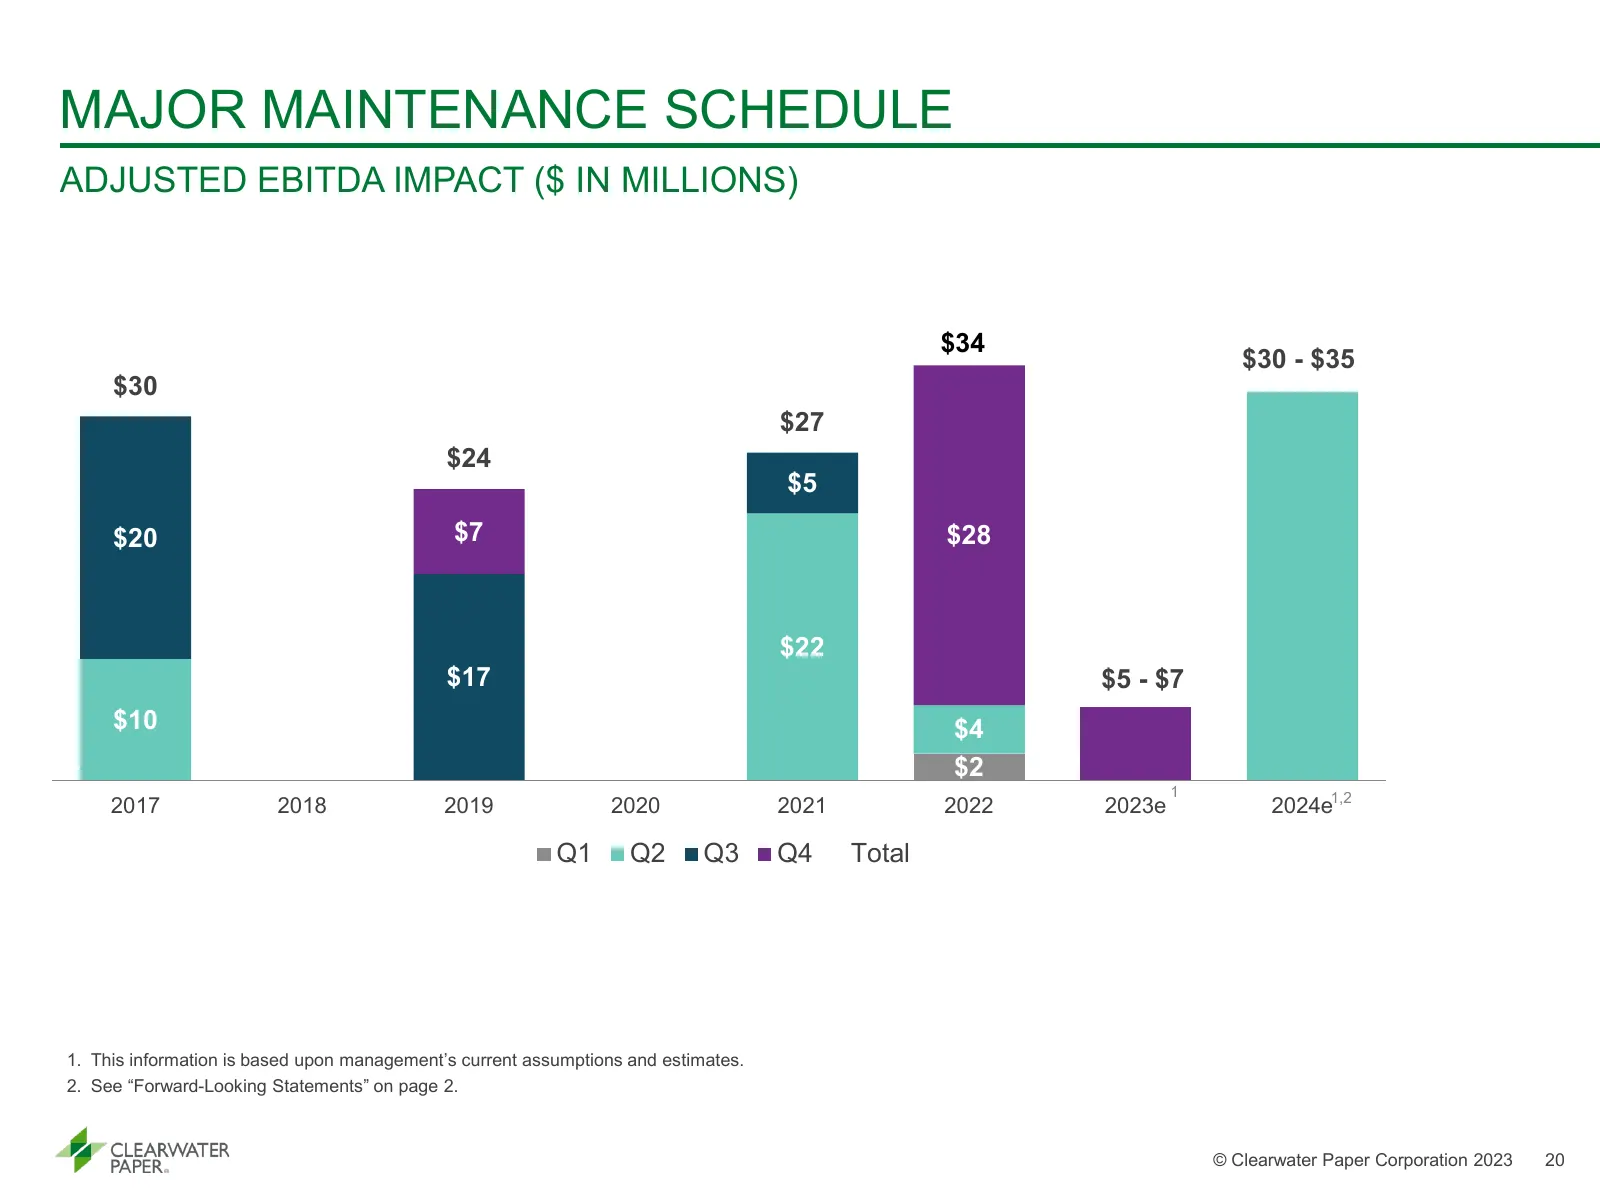
Slide 19: Major Maintenance Schedule
MAJOR MAINTENANCE SCHEDULE ADJUSTED EBITDA IMPACT ($ IN MILLIONS) $34 $30 - $35 $30 $27 $24 $5 $20 $7 $28 $22 $17 $5 - $7 $10 $4 $2 1 2017 2018 2019 2020 2021 2022 2023e 2024e1,2 Q1 Q2 Q3 Q4 Total 1. This information is based upon management’s current assumptions and estimates. 2. See “Forward-Looki
Source: Internet Archive copy of s24.q4cdn.com
More decks from Clearwater Paper Corporation
 Q3 2026 Earnings Presentation17 slides · Oct 26, 2026
 Q2 2026 Earnings Presentation17 slides · Jul 28, 2026
 Investor Presentation (June 2026)15 slides · June 2026
 Q1 2026 Earnings Presentation16 slides · Apr 28, 2026
 Q4 2025 Earnings Presentation18 slides · Feb 18, 2026
 Q3 2025 Earnings Presentation15 slides · Oct 28, 2025