Infrastructure and Energy Alternatives Inc
Infrastructure and Energy Alternatives — Debt Investor Presentation (October 2018)
49 slides from Infrastructure and Energy Alternatives's debt investor presentation, Oct 16, 2018
Slide 1: Lender Presentation October 2018
Lender Presentation October 2018
Slide 2: Disclaimer
Disclaimer This presentation includes “forward looking statements” (within the meaning of the “safe harbor” provisions of the United States Private Securities Litigation Reform Act of 1995), including but not limited to those regarding the proposed acquisitions by Infrastructure and Energy Alternati
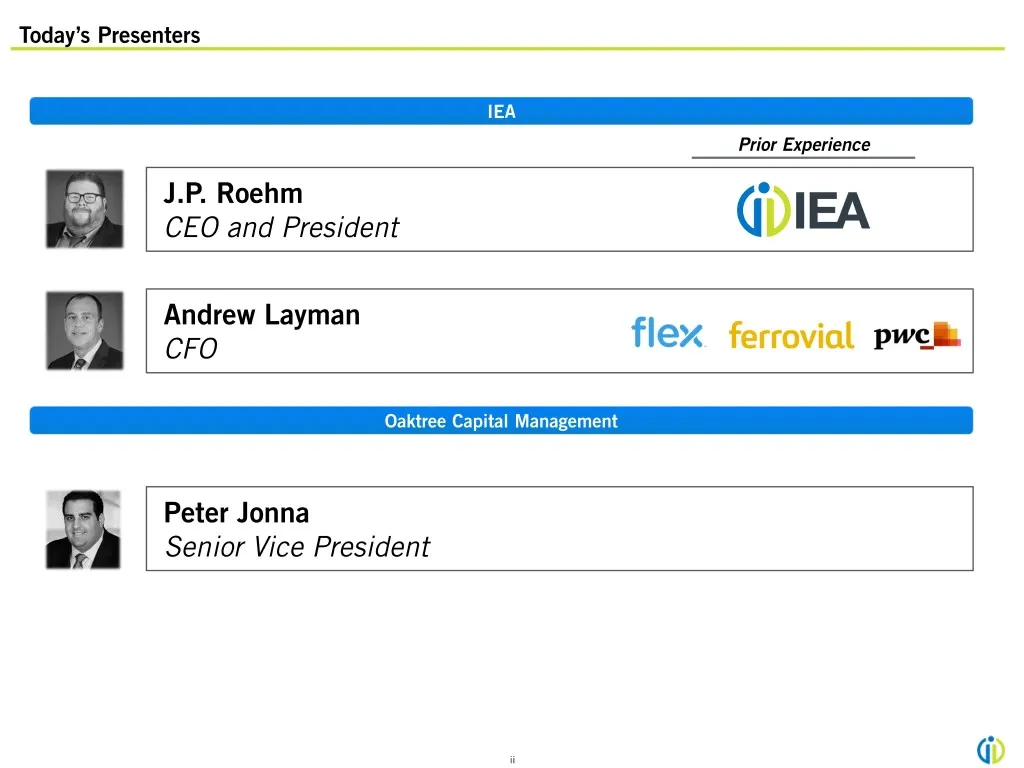
Slide 3: Today's Presenters
Today’s Presenters IEA Prior Experience J.P. Roehm CEO and President Andrew Layman CFO Oaktree Capital Management Peter Jonna Senior Vice President ii
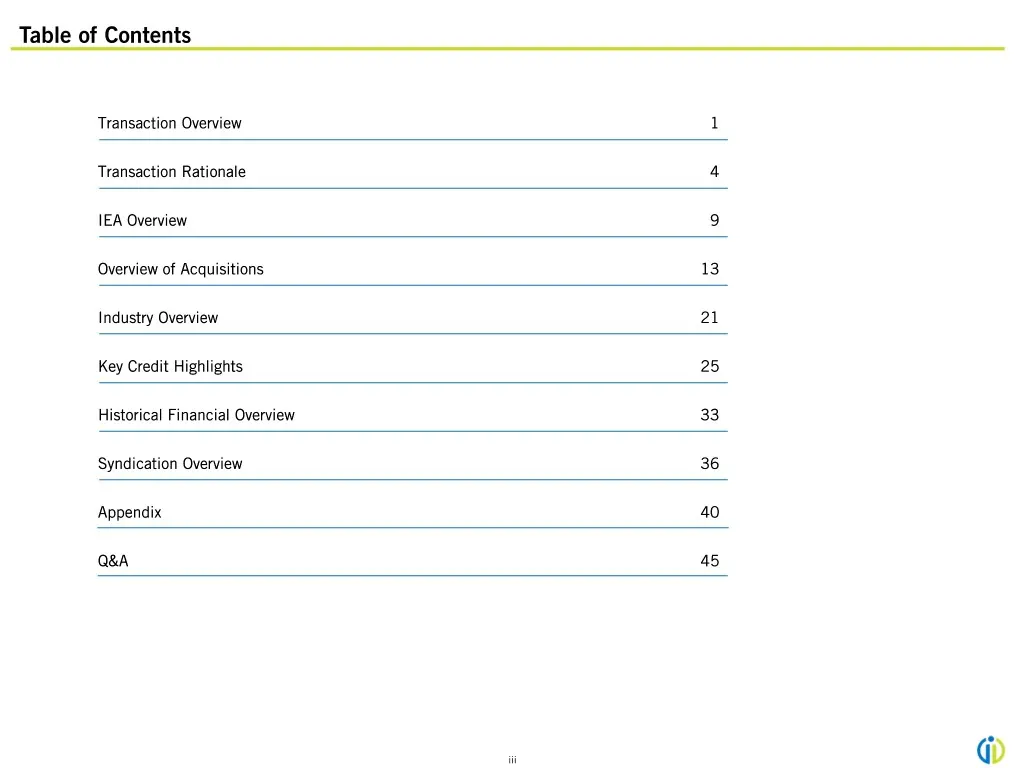
Slide 4: Table of Contents
Table of Contents Transaction Overview 1 Transaction Rationale 4 IEA Overview 9 Overview of Acquisitions 13 Industry Overview 21 Key Credit Highlights 25 Historical Financial Overview 33 Syndication Overview 36 Appendix 40 Q&A 45 iii
Slide 5: Transaction Overview
QDIEA Transaction Overview
Slide 6: Executive Summary
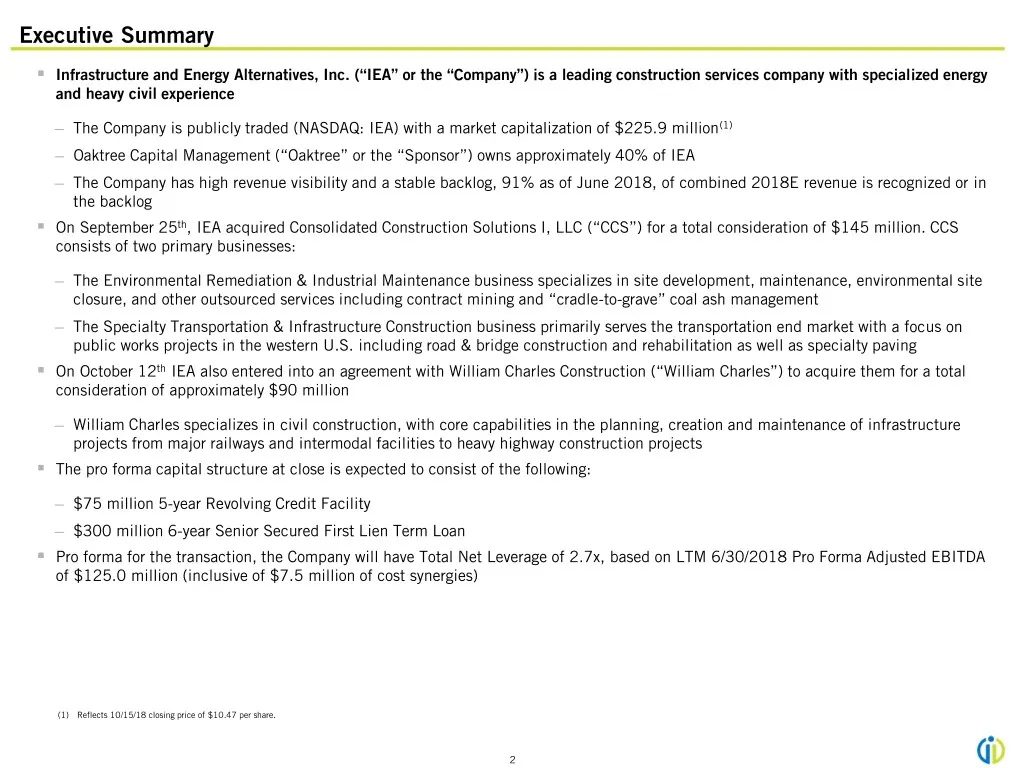
Executive Summary ▪ Infrastructure and Energy Alternatives, Inc. (“IEA” or the “Company”) is a leading construction services company with specialized energy and heavy civil experience ─ The Company is publicly traded (NASDAQ: IEA) with a market capitalization of $225.9 million(1) ─ Oaktree Capital M
Slide 7: Transaction Overview: Sources and Uses, Pro Forma Capitalization
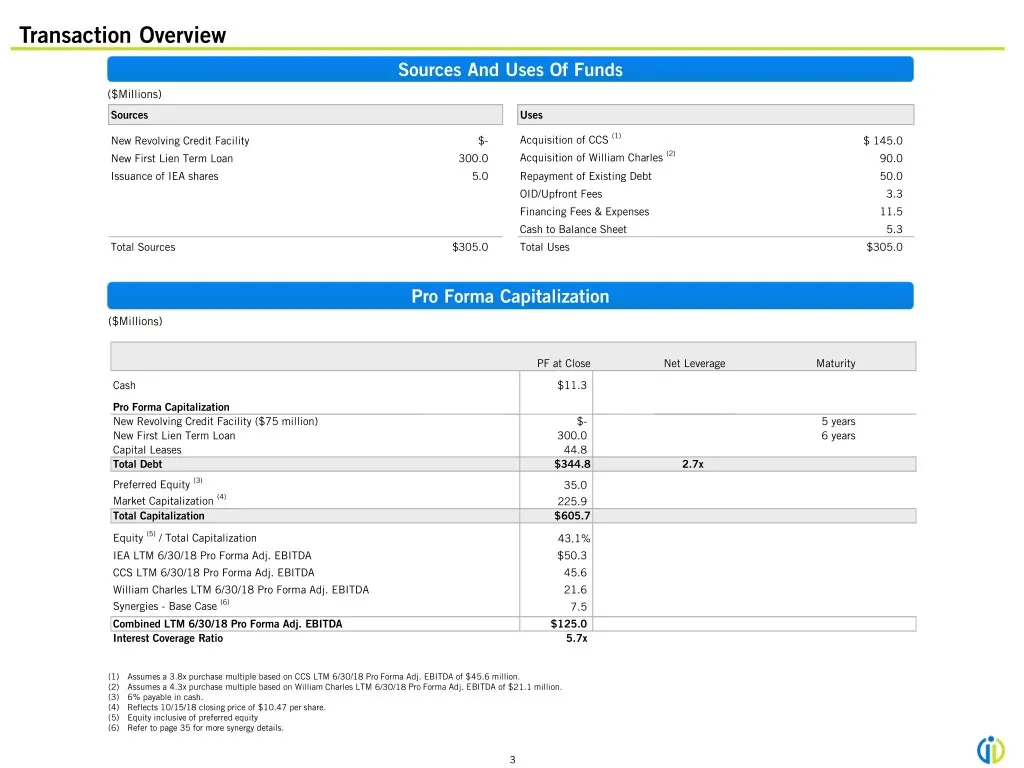
Transaction Overview Sources And Uses Of Funds ($Millions) Sources Uses New Revolving Credit Facility $- Acquisition of CCS (1) $ 145.0 New First Lien Term Loan 300.0 Acquisition of William Charles (2) 90.0 Issuance of IEA shares 5.0 Repayment of Existing Debt 50.0 OID/Upfront Fees 3.3 Financing Fee
Slide 8: Transaction Rationale
QDIEA Transaction Rationale
Slide 9: Acquisitions are a Continuation of the Company's Strategic Growth Objectives
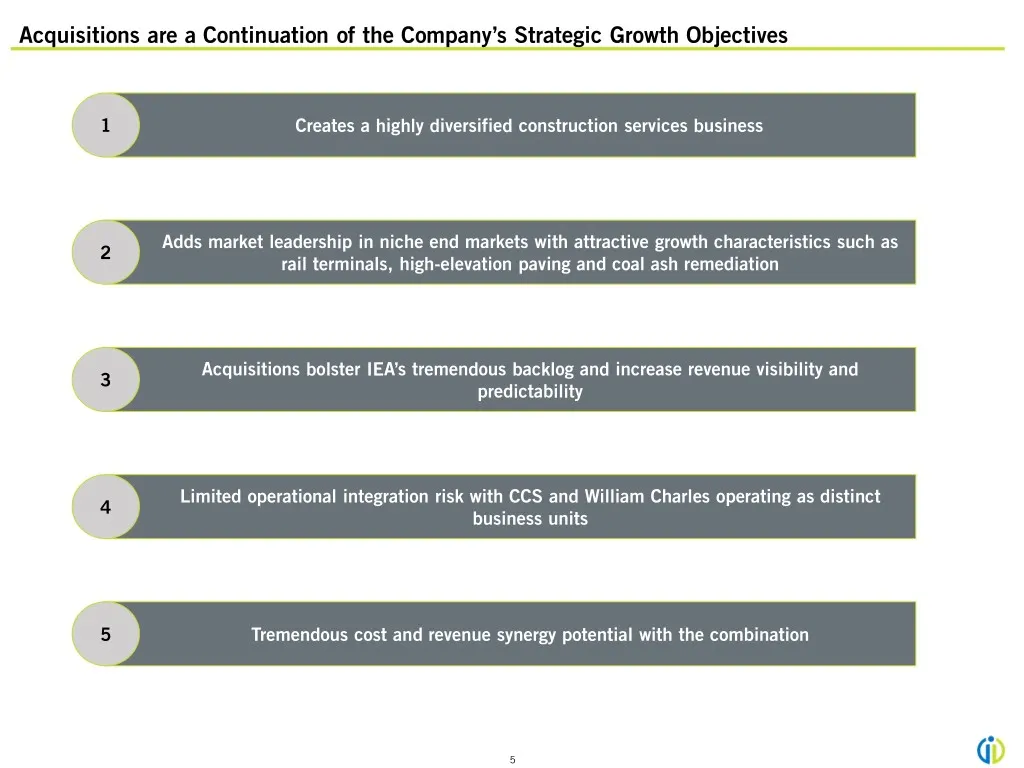
Acquisitions are a Continuation of the Company’s Strategic Growth Objectives 1 Creates a highly diversified construction services business Adds market leadership in niche end markets with attractive growth characteristics such as 2 rail terminals, high-elevation paving and coal ash remediation Acqui
Slide 10: Strategic Rationale
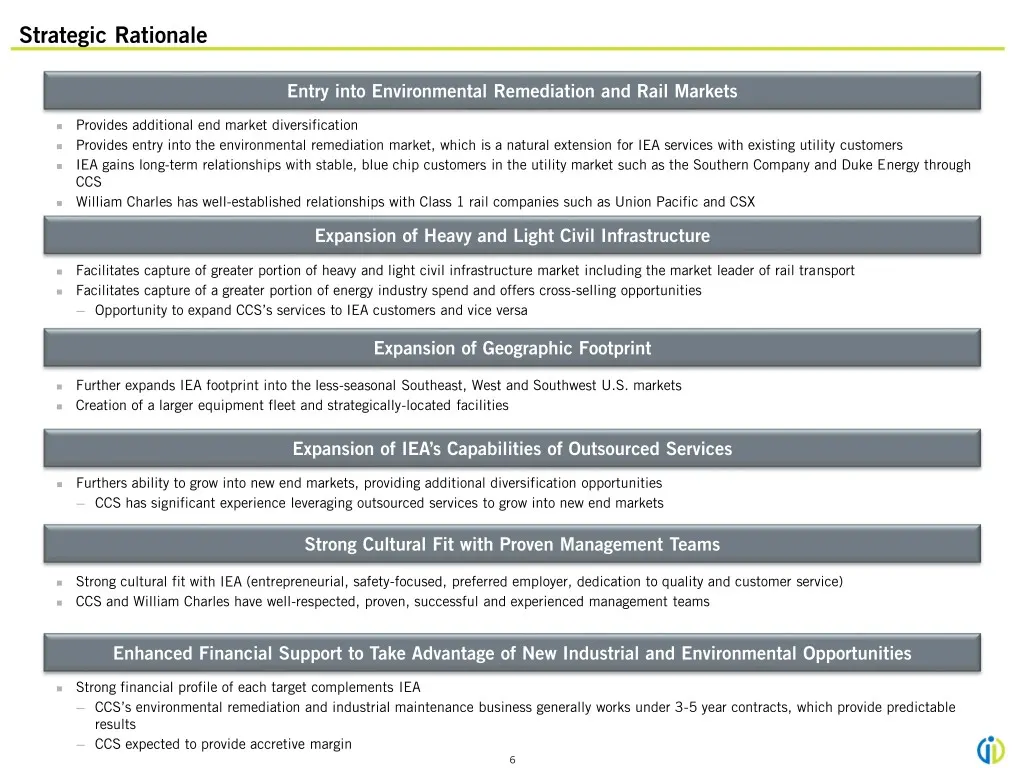
Strategic Rationale Entry into Environmental Remediation and Rail Markets ◼ Provides additional end market diversification ◼ Provides entry into the environmental remediation market, which is a natural extension for IEA services with existing utility customers ◼ IEA gains long-term relationships wit
Slide 11: Pro Forma Combined Business Overview
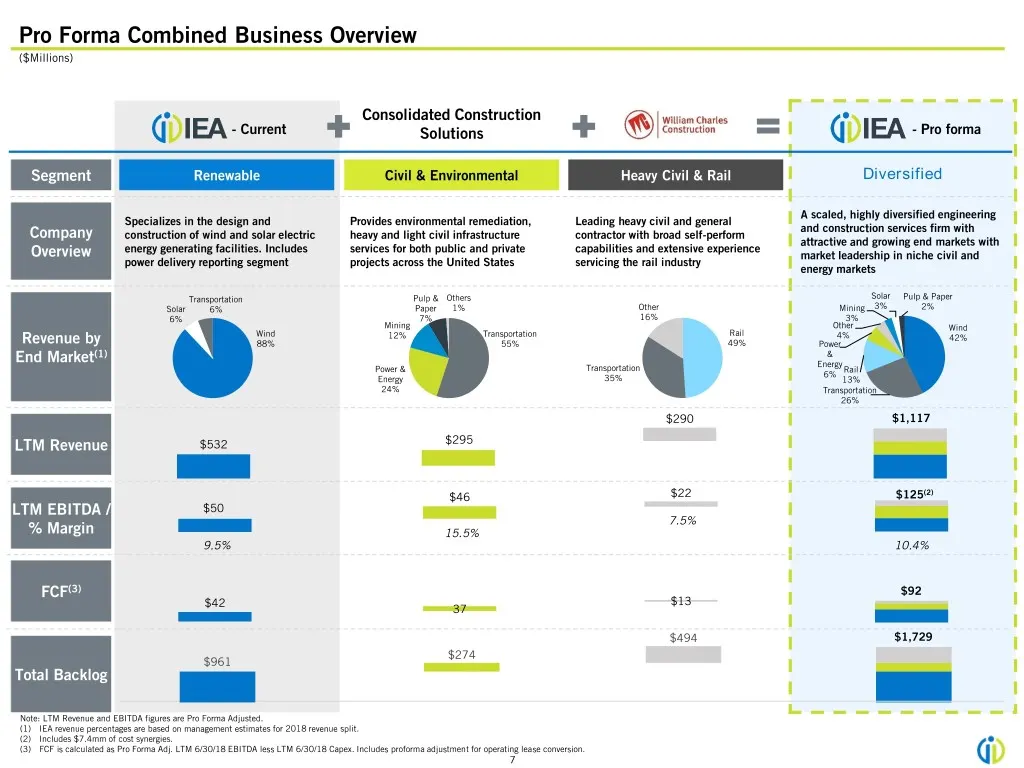
Pro Forma Combined Business Overview ($Millions) Consolidated Construction - Current Solutions - Pro forma Segment RenewableRenewable Civil & Environmental Heavy CivilRail & Rail Diversified A scaled, highly diversified engineering Specializes in the design and Provides environmental remediation, Le
Slide 12: Pro Forma Combined Business Operational Overview
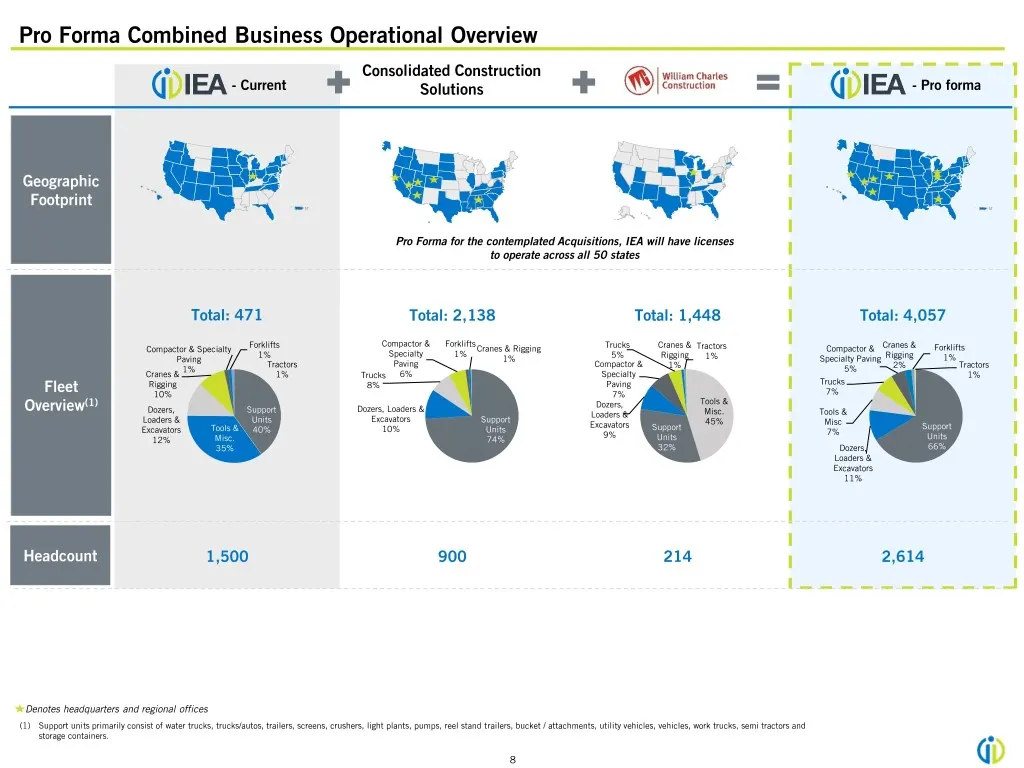
Pro Forma Combined Business Operational Overview Consolidated Construction - Current Solutions - Pro forma Geographic Footprint Pro Forma for the contemplated Acquisitions, IEA will have licenses to operate across all 50 states Total: 471 Total: 2,138 Total: 1,448 Total: 4,057 Forklifts Compactor &
Slide 13: IEA Overview
QDIEA IEA Overview
Slide 14: IEA Company Overview
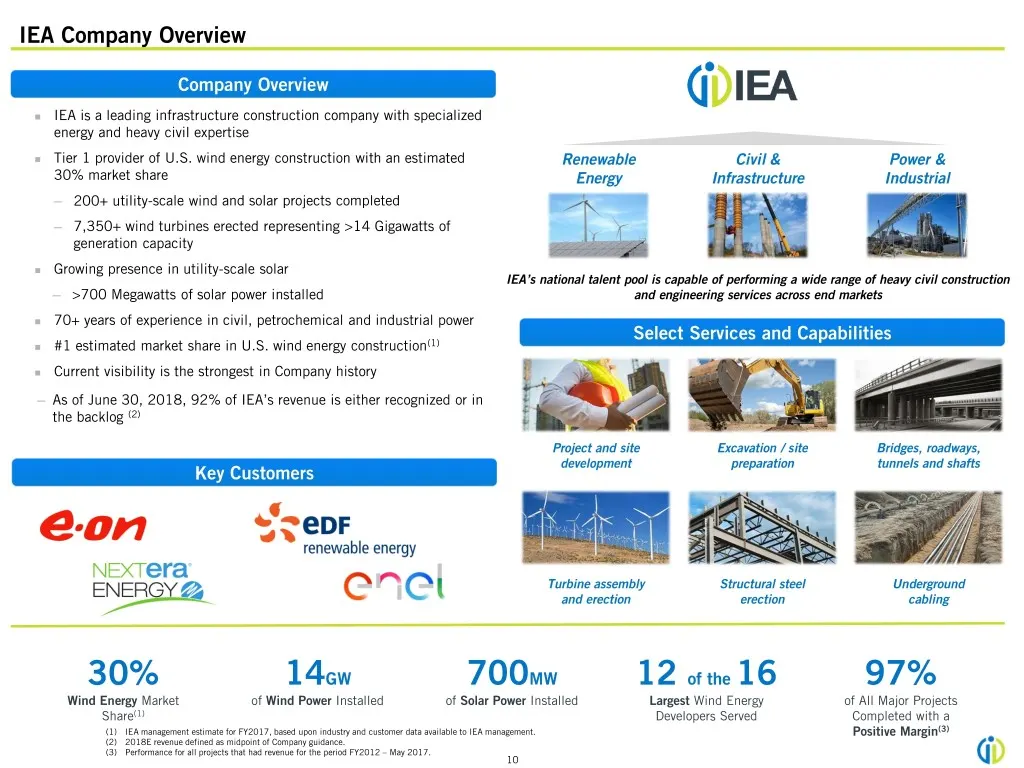
IEA Company Overview Company Overview ◼ IEA is a leading infrastructure construction company with specialized energy and heavy civil expertise ◼ Tier 1 provider of U.S. wind energy construction with an estimated Renewable Civil & Power & 30% market share Energy Infrastructure Industrial ─ 200+ utili
Slide 15: IEA is the Leader in Renewable Energy Infrastructure Construction
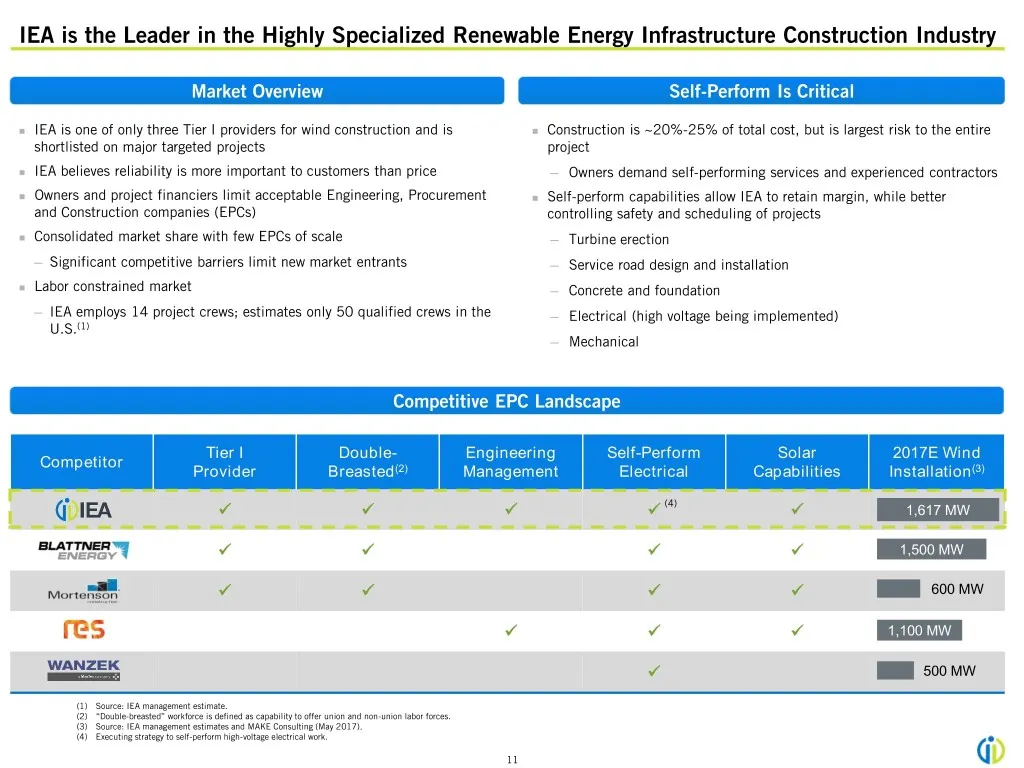
IEA is the Leader in the Highly Specialized Renewable Energy Infrastructure Construction Industry Market Overview Self-Perform Is Critical ◼ IEA is one of only three Tier I providers for wind construction and is ◼ Construction is ~20%-25% of total cost, but is largest risk to the entire shortlisted
Slide 16: IEA Representative Projects
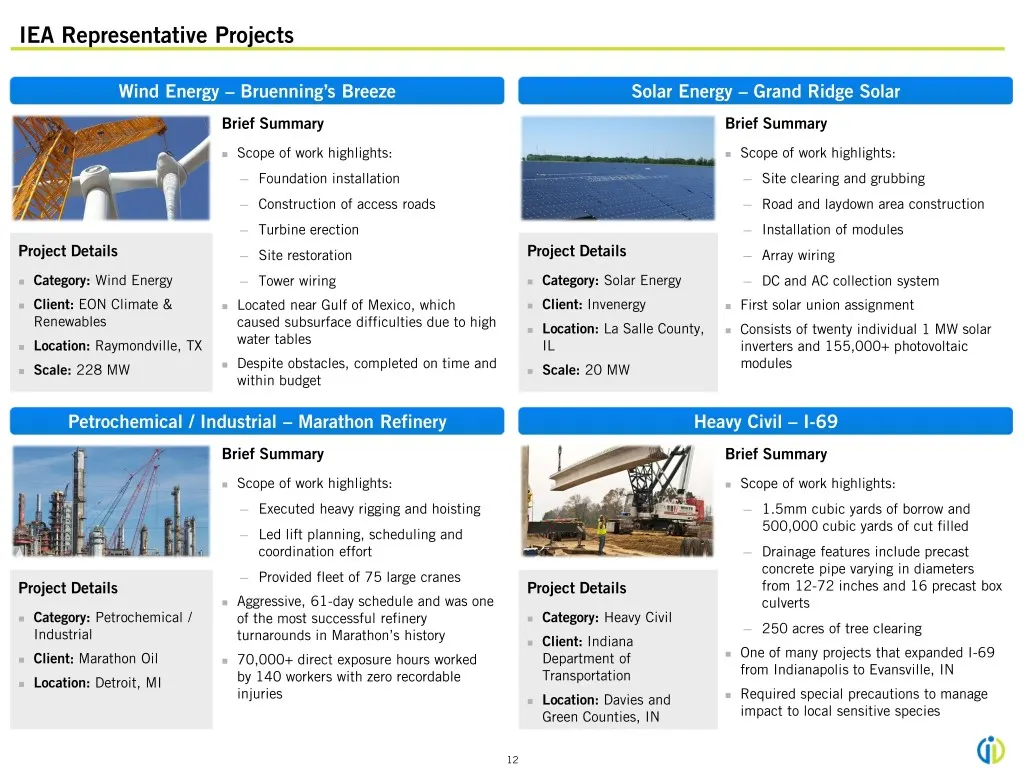
IEA Representative Projects Wind Energy – Bruenning’s Breeze Solar Energy – Grand Ridge Solar Brief Summary Brief Summary ◼ Scope of work highlights: ◼ Scope of work highlights: ─ Foundation installation ─ Site clearing and grubbing ─ Construction of access roads ─ Road and laydown area construction
Slide 17: Overview of Acquisitions
QDIEA Overview of Acquisitions
Slide 18: Consolidated Construction Solutions (CCS) Overview
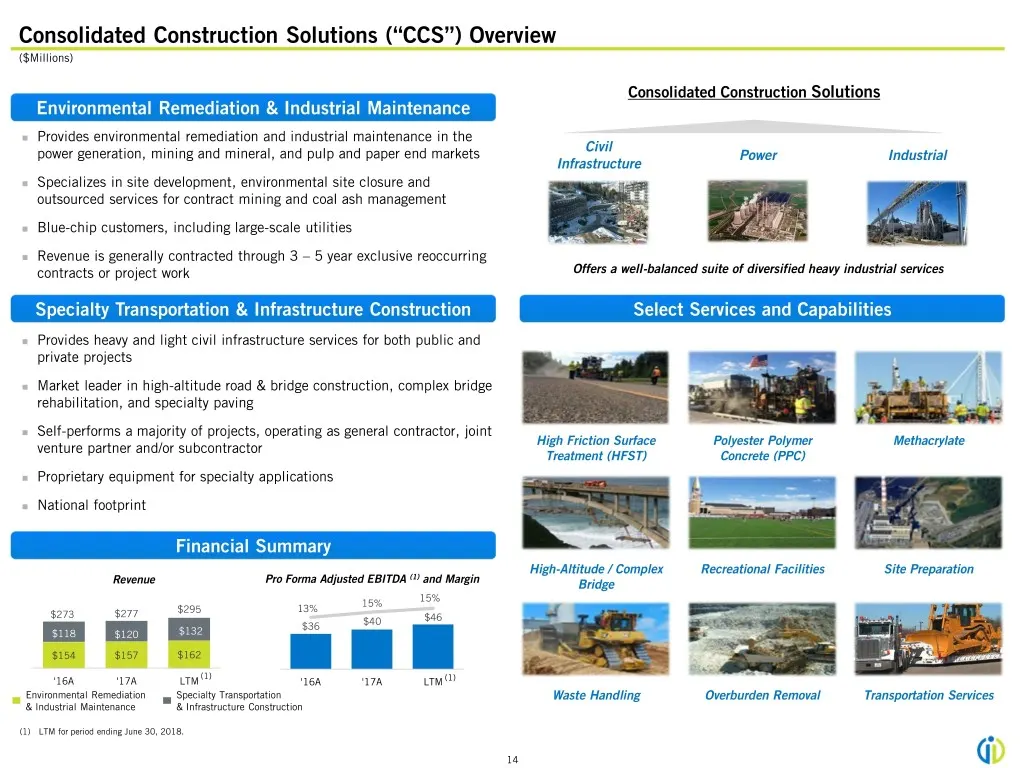
Consolidated Construction Solutions (“CCS”) Overview ($Millions) Consolidated Construction Solutions Environmental Remediation & Industrial Maintenance ◼ Provides environmental remediation and industrial maintenance in the Civil power generation, mining and mineral, and pulp and paper end markets Po
Slide 19: Environmental Remediation & Industrial Maintenance Business Overview
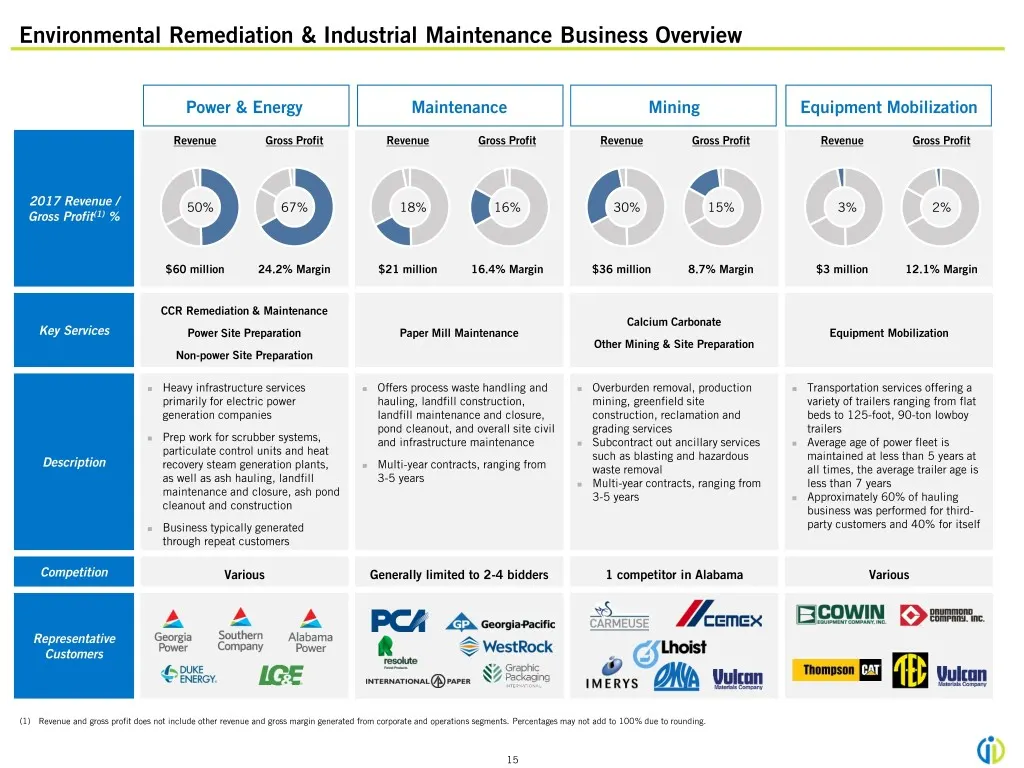
Environmental Remediation & Industrial Maintenance Business Overview Power & Energy Maintenance Mining Equipment Mobilization Revenue Gross Profit Revenue Gross Profit Revenue Gross Profit Revenue Gross Profit 2017 Revenue / 50% 67% 18% 16% 30% 15% 3% 2% Gross Profit(1) % $60 million 24.2% Margin $2
Slide 20: Specialty Transportation & Infrastructure Construction Business Overview
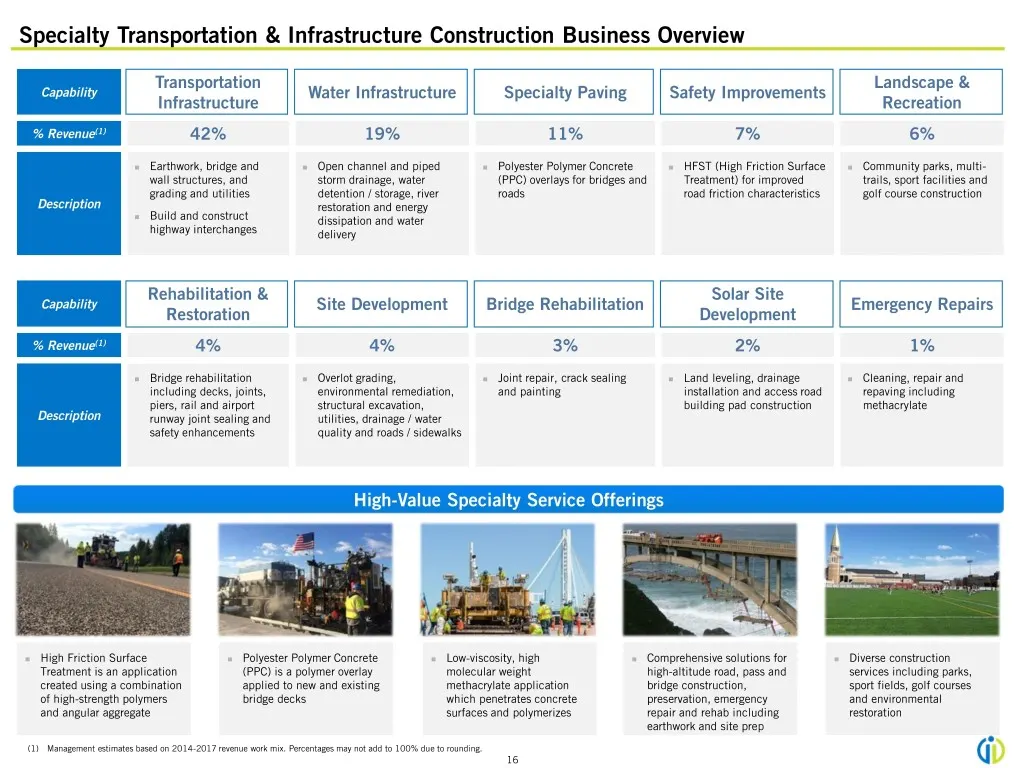
Specialty Transportation & Infrastructure Construction Business Overview Transportation Landscape & Capability Water Infrastructure Specialty Paving Safety Improvements Infrastructure Recreation % Revenue(1) 42% 19% 11% 7% 6% ◼ Earthwork, bridge and ◼ Open channel and piped ◼ Polyester Polymer Concr
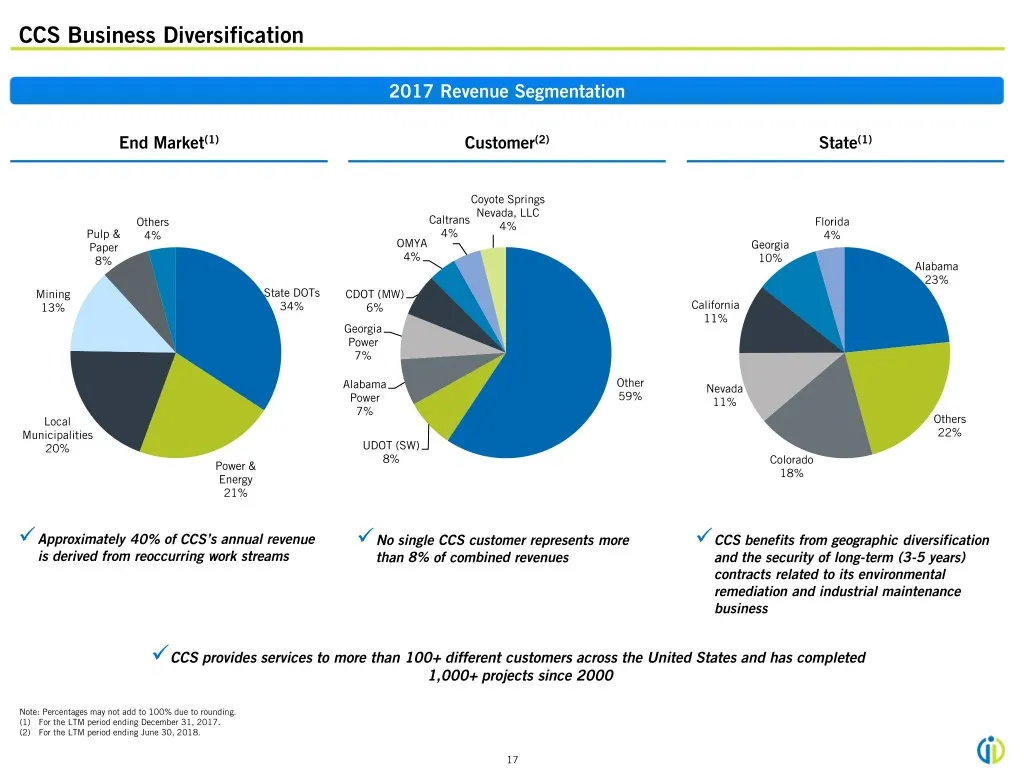
Slide 21: CCS Business Diversification
CCS Business Diversification 2017 Revenue Segmentation End Market(1) Customer(2) State(1) Coyote Springs Nevada, LLC Caltrans Others 4% Florida Pulp & 4% 4% 4% Paper OMYA Georgia 4% 10% 8% Alabama 23% Mining State DOTs CDOT (MW) 13% 34% 6% California 11% Georgia Power 7% Other Alabama Nevada 59% Pow
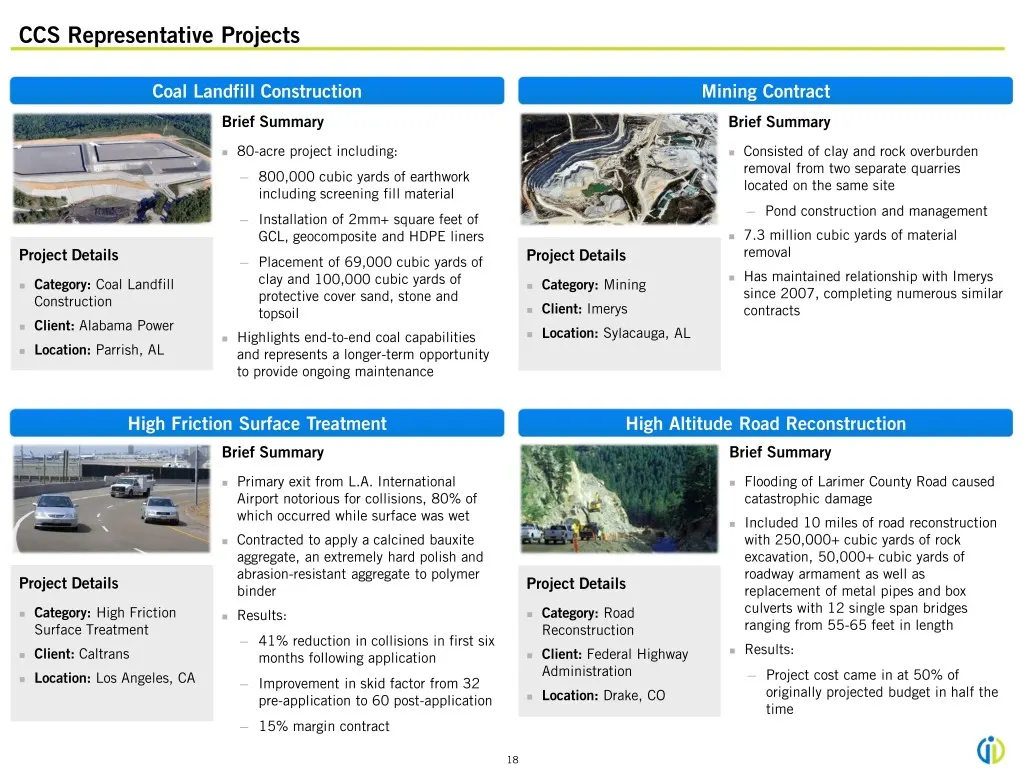
Slide 22: CCS Representative Projects
CCS Representative Projects Coal Landfill Construction Mining Contract Brief Summary Brief Summary ◼ 80-acre project including: ◼ Consisted of clay and rock overburden removal from two separate quarries ─ 800,000 cubic yards of earthwork located on the same site including screening fill material ─ P
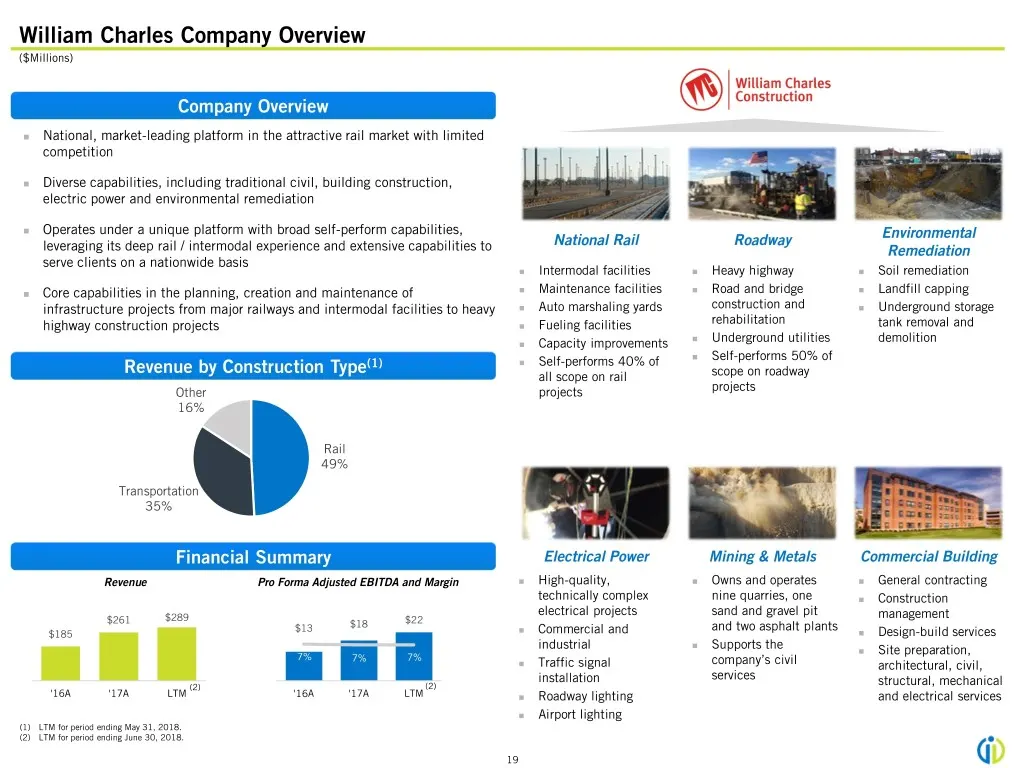
Slide 23: William Charles Company Overview
William Charles Company Overview ($Millions) Company Overview ◼ National, market-leading platform in the attractive rail market with limited competition ◼ Diverse capabilities, including traditional civil, building construction, electric power and environmental remediation ◼ Operates under a unique
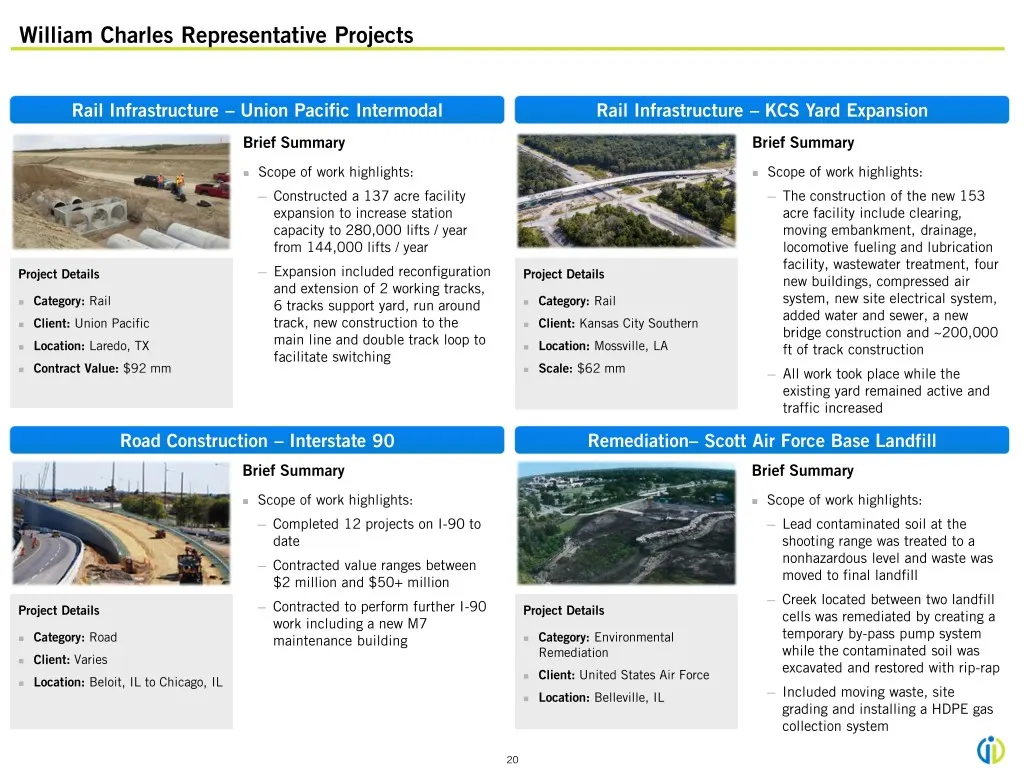
Slide 24: William Charles Representative Projects
William Charles Representative Projects Rail Infrastructure – Union Pacific Intermodal Rail Infrastructure – KCS Yard Expansion Brief Summary Brief Summary ◼ Scope of work highlights: ◼ Scope of work highlights: ─ Constructed a 137 acre facility ─ The construction of the new 153 expansion to increas
Slide 25: Industry Overview
QDIEA Industry Overview
Slide 26: U.S. Construction Market Overview
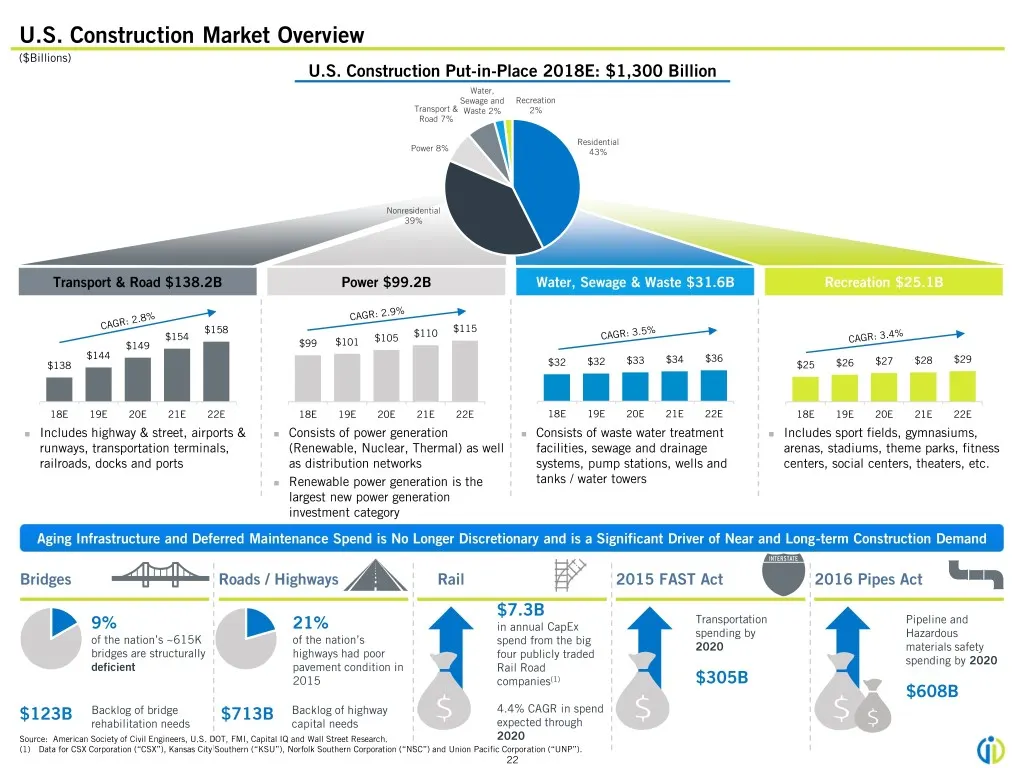
U.S. Construction Market Overview ($Billions) U.S. Construction Put-in-Place 2018E: $1,300 Billion Water, Sewage and Recreation Transport & Waste 2% 2% Road 7% Residential Power 8% 43% Nonresidential 39% Transport & Road $138.2B Power $99.2B Water, Sewage & Waste $31.6B Recreation $25.1B $158 $115 $
Slide 27: Renewable Energy Industry Overview
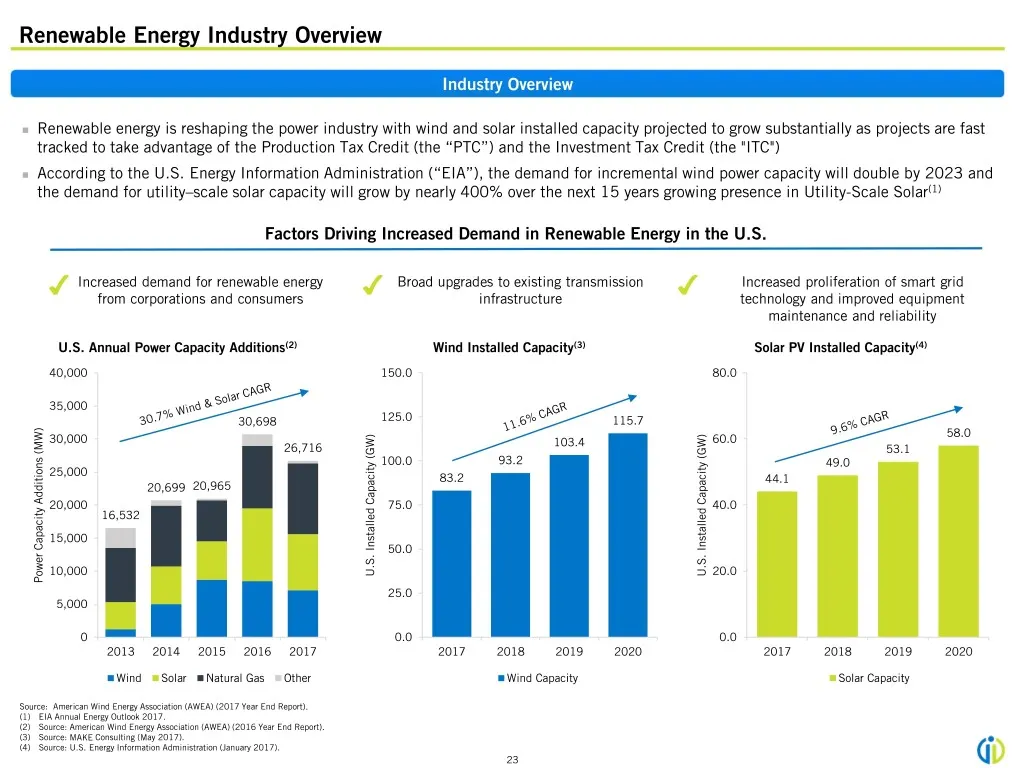
Renewable Energy Industry Overview Industry Overview ◼ Renewable energy is reshaping the power industry with wind and solar installed capacity projected to grow substantially as projects are fast tracked to take advantage of the Production Tax Credit (the “PTC”) and the Investment Tax Credit (the "I
Slide 28: Renewable Energy Cost Competitiveness
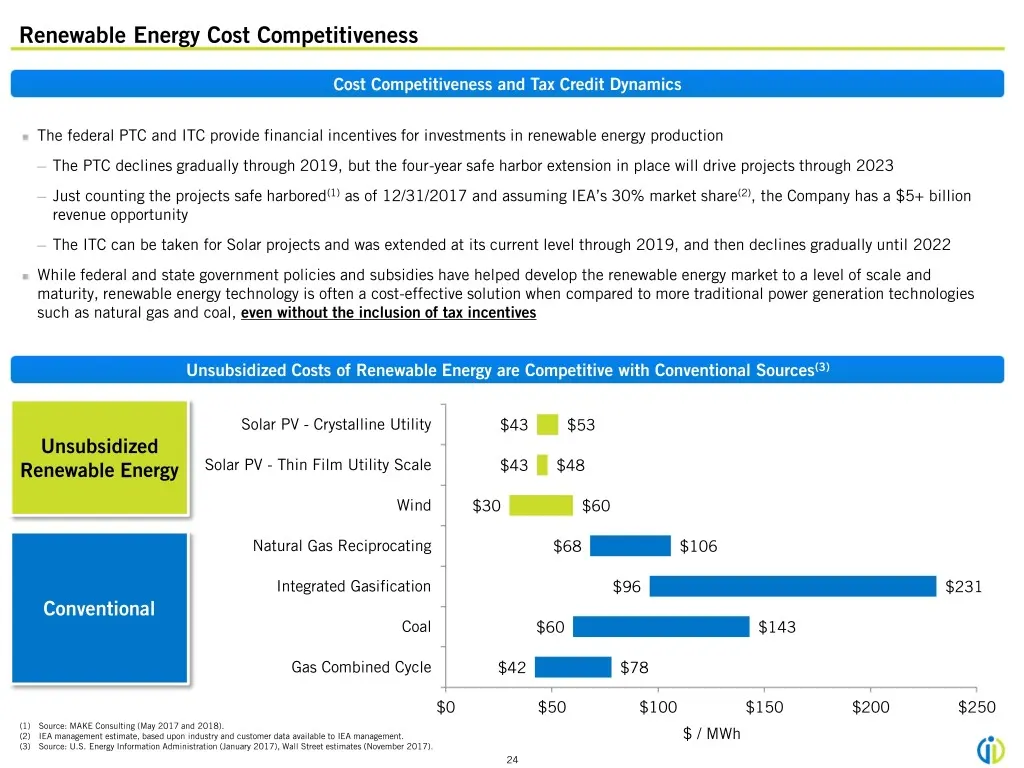
Renewable Energy Cost Competitiveness Cost Competitiveness and Tax Credit Dynamics ◼ The federal PTC and ITC provide financial incentives for investments in renewable energy production ─ The PTC declines gradually through 2019, but the four-year safe harbor extension in place will drive projects thr
Slide 29: Key Credit Highlights
QDIEA Key Credit Highlights
Slide 30: Key Credit Highlights
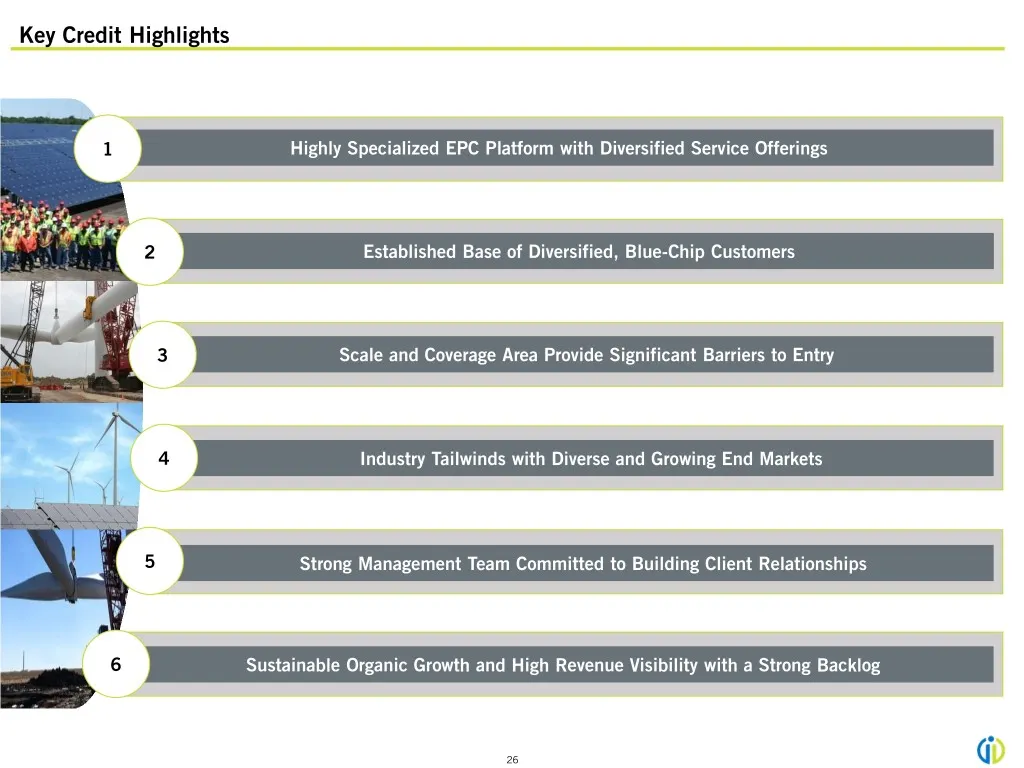
Key Credit Highlights 1 Highly Specialized EPC Platform with Diversified Service Offerings 2 Established Base of Diversified, Blue-Chip Customers 3 Scale and Coverage Area Provide Significant Barriers to Entry 4 Industry Tailwinds with Diverse and Growing End Markets 5 Strong Management Team Committ
Slide 31: Highly Specialized EPC Platform with Diversified Service Offerings
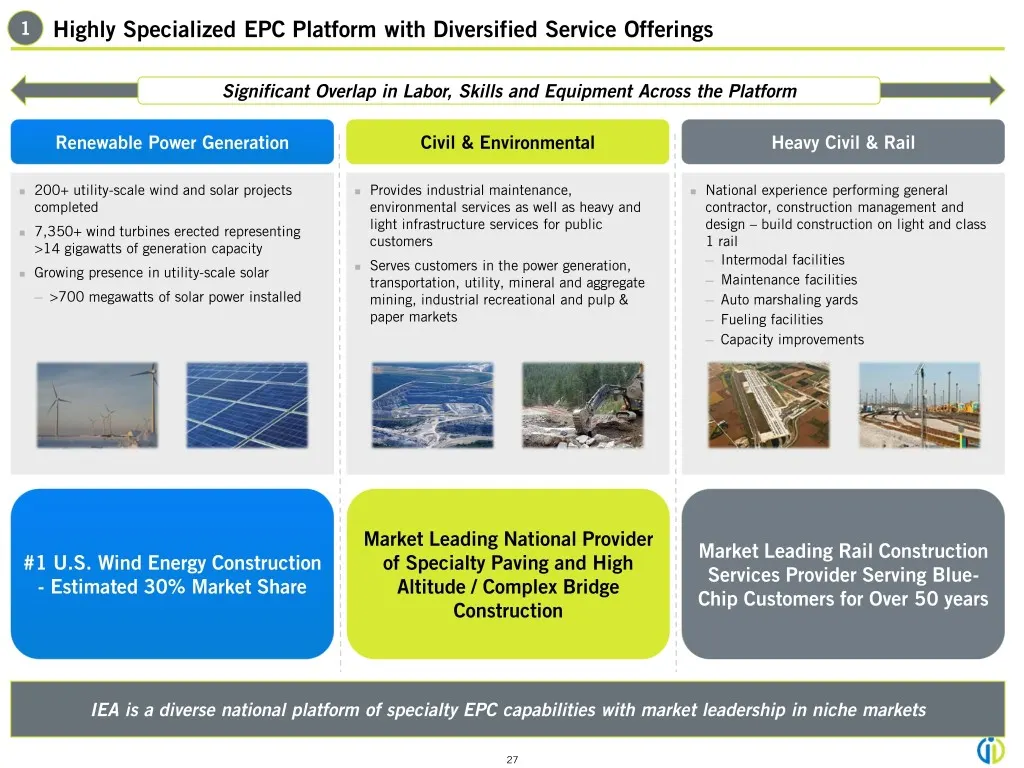
1 Highly Specialized EPC Platform with Diversified Service Offerings Significant Overlap in Labor, Skills and Equipment Across the Platform Renewable Power Generation Civil & Environmental Heavy Civil & Rail ◼ 200+ utility-scale wind and solar projects ◼ Provides industrial maintenance, ◼ National e
Slide 32: Established Base of Diversified, Blue-Chip Customers
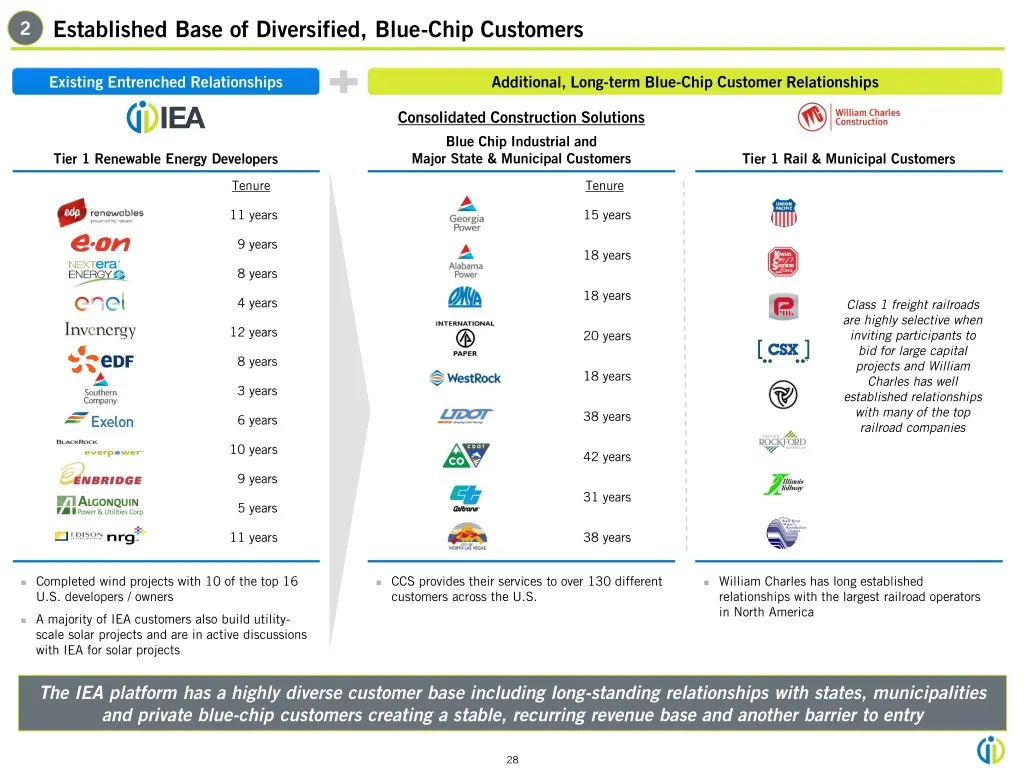
2 Established Base of Diversified, Blue-Chip Customers Existing Entrenched Relationships Additional, Long-term Blue-Chip Customer Relationships Consolidated Construction Solutions Blue Chip Industrial and Tier 1 Renewable Energy Developers Major State & Municipal Customers Tier 1 Rail & Municipal Cu
Slide 33: Scale and Coverage Area Provide Significant Barriers to Entry
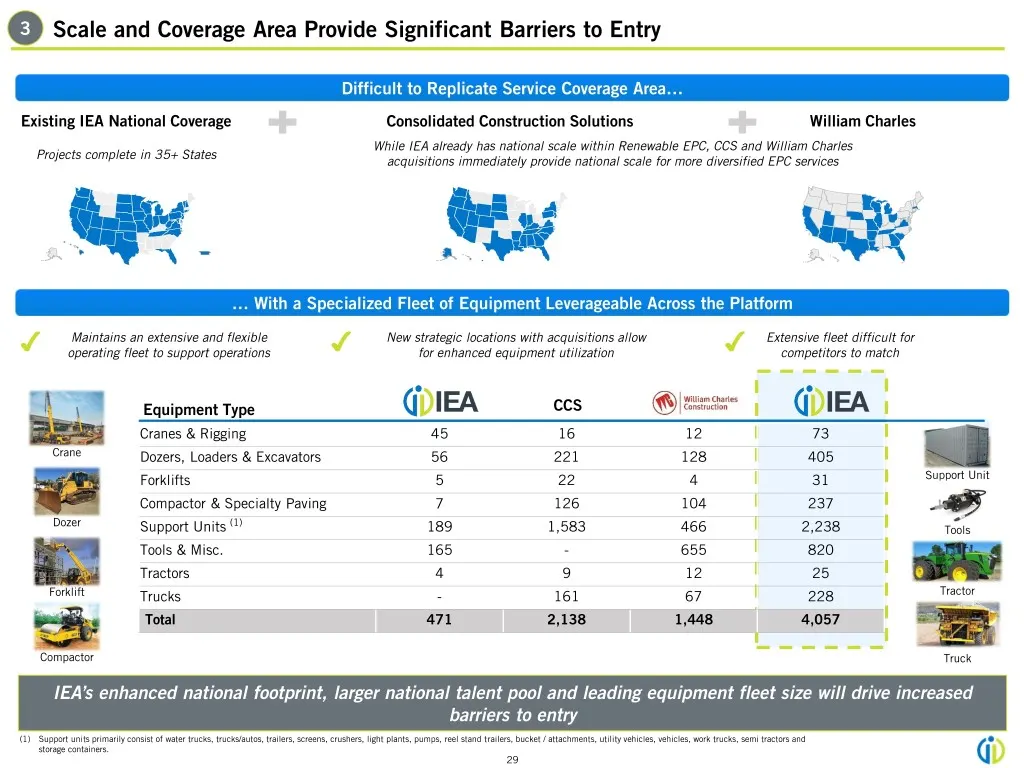
3 Scale and Coverage Area Provide Significant Barriers to Entry Difficult to Replicate Service Coverage Area… Existing IEA National Coverage Consolidated Construction Solutions William Charles While IEA already has national scale within Renewable EPC, CCS and William Charles Projects complete in 35+
Slide 34: Industry Tailwinds with Diverse and Growing End Markets
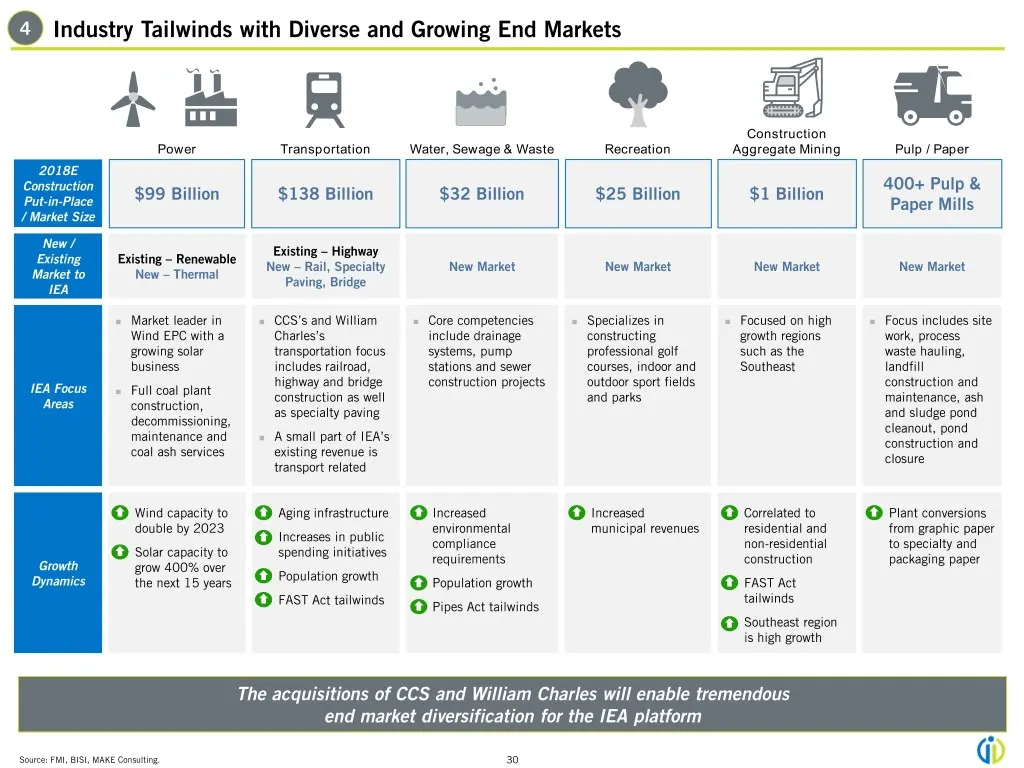
4 Industry Tailwinds with Diverse and Growing End Markets Construction Power Transportation Water, Sewage & Waste Recreation Aggregate Mining Pulp / Paper 2018E 400+ Pulp & Construction $99 Billion $138 Billion $32 Billion $25 Billion $1 Billion Put-in-Place Paper Mills / Market Size New / Existing
Slide 35: Strong Management Team Committed to Building Client Relationships
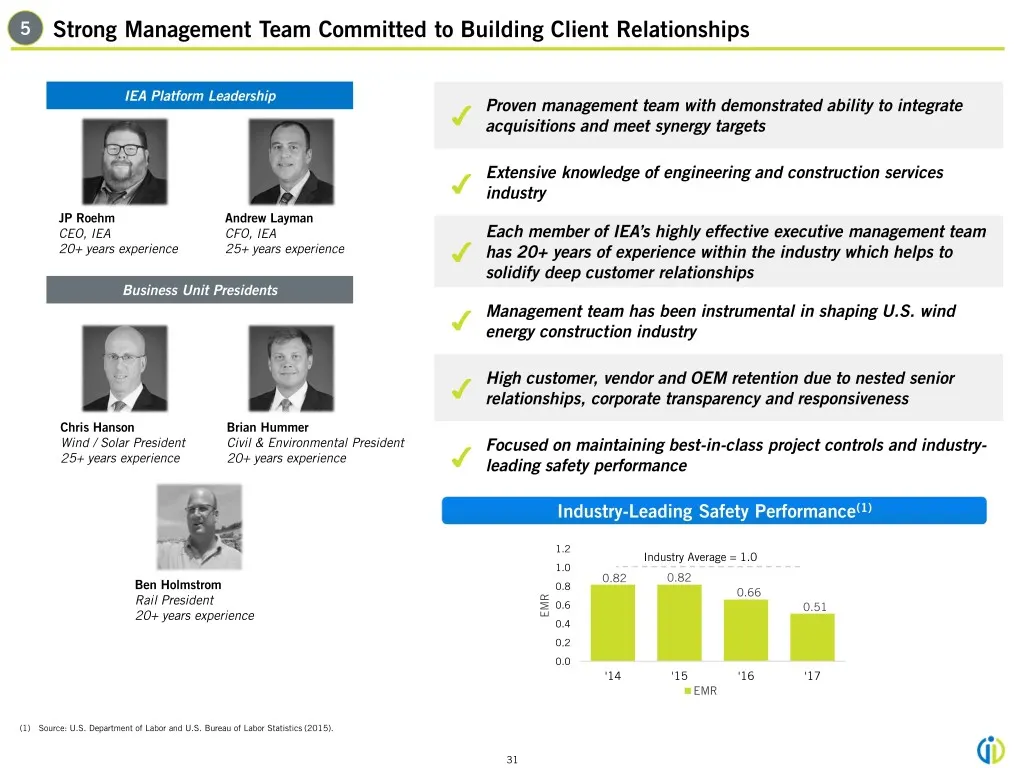
5 Strong Management Team Committed to Building Client Relationships IEA Platform Leadership Proven management team with demonstrated ability to integrate ✔ acquisitions and meet synergy targets Extensive knowledge of engineering and construction services ✔ industry JP Roehm Andrew Layman CEO, IEA CF
Slide 36: Sustainable Organic Growth and High Revenue Visibility with a Strong Backlog
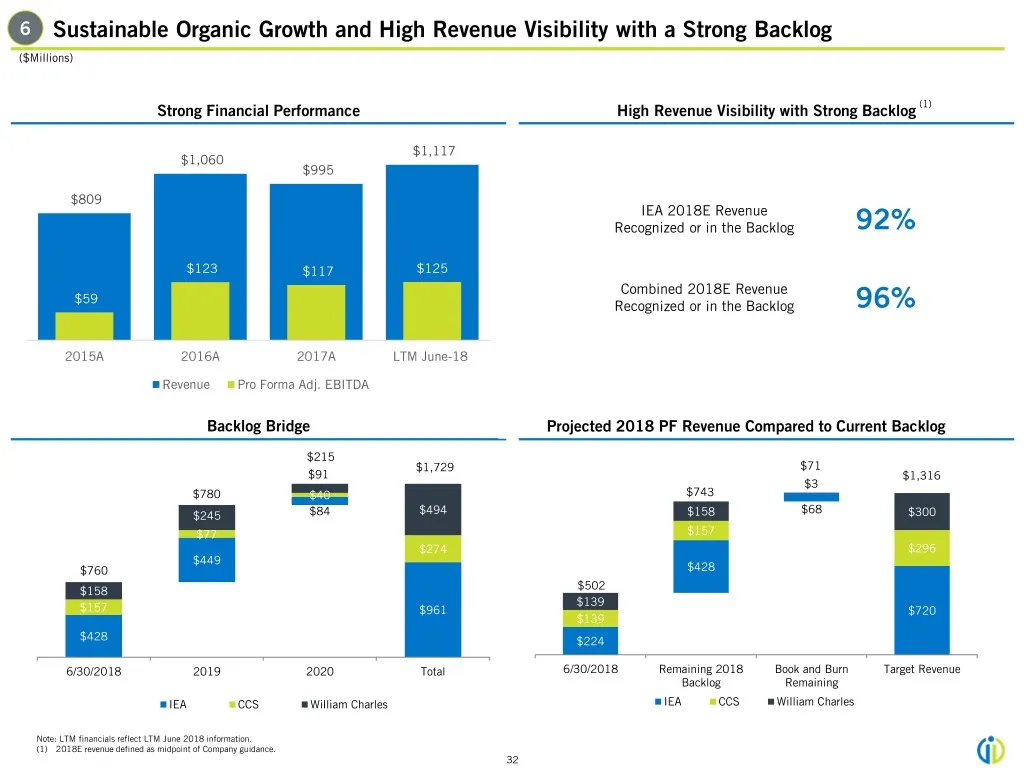
6 Sustainable Organic Growth and High Revenue Visibility with a Strong Backlog ($Millions) Strong Financial Performance High Revenue Visibility with Strong Backlog (1) $1,117 $1,060 $995 $809 IEA 2018E Revenue Recognized or in the Backlog 92% $123 $117 $125 Combined 2018E Revenue $59 Recognized or i
Slide 37: Historical Financial Overview
Historical Financial Overview 33
Slide 38: Pro Forma Historical Financial Performance
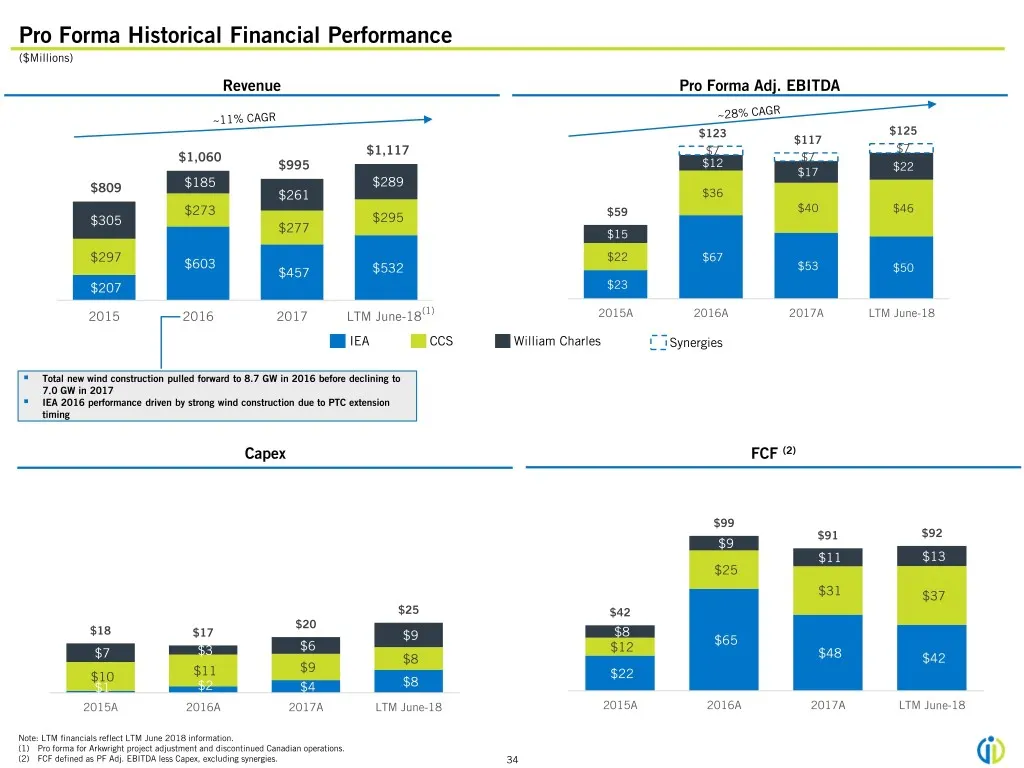
Pro Forma Historical Financial Performance ($Millions) Revenue Pro Forma Adj. EBITDA $123 $125 $117 $1,117 $7 $7 $1,060 (1) $7 $995 $12 $17 $22 $809 $185 $289 $261 $36 $273 $59 $40 $46 $305 $295 $277 $15 $297 $22 $67 $603 $53 $457 $532 $50 $207 $23 2015 2016 2017 LTM June-18(1) 2015A 2016A 2017A LTM
Slide 39: Synergy Opportunities
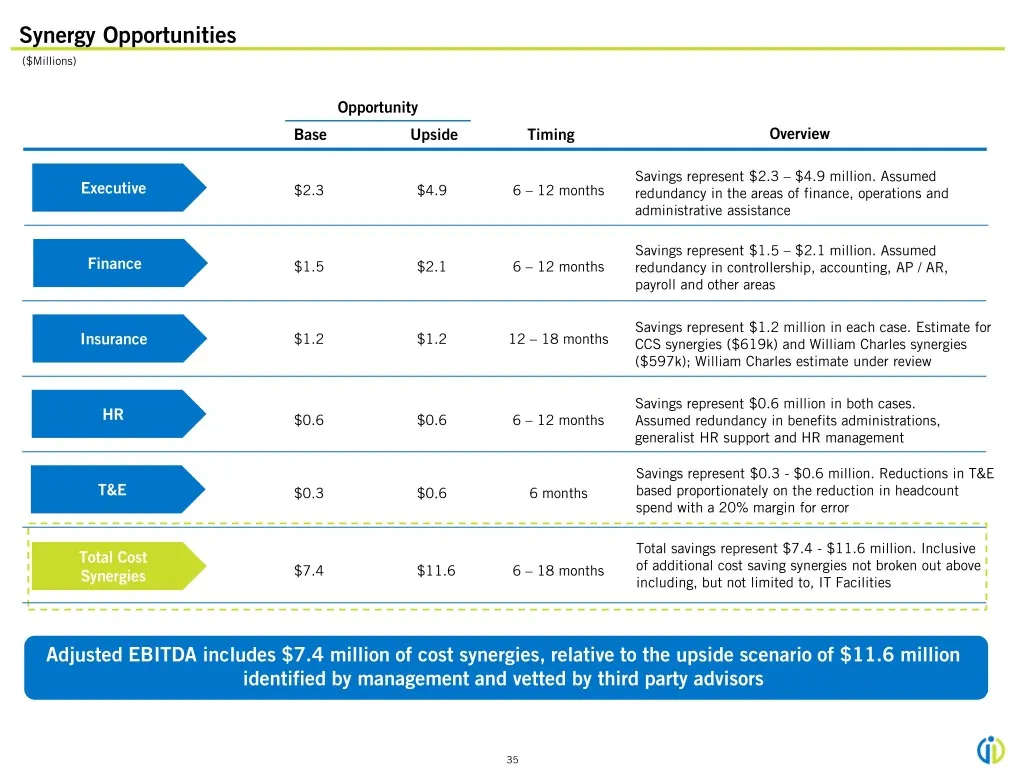
Synergy Opportunities ($Millions) Opportunity Base Upside Timing Overview Savings represent $2.3 – $4.9 million. Assumed Executive $2.3 $4.9 6 – 12 months redundancy in the areas of finance, operations and administrative assistance Savings represent $1.5 – $2.1 million. Assumed Finance $1.5 $2.1 6 –
Slide 40: Syndication Overview
QDIEA Syndication Overview
Slide 41: Summary of Key Terms
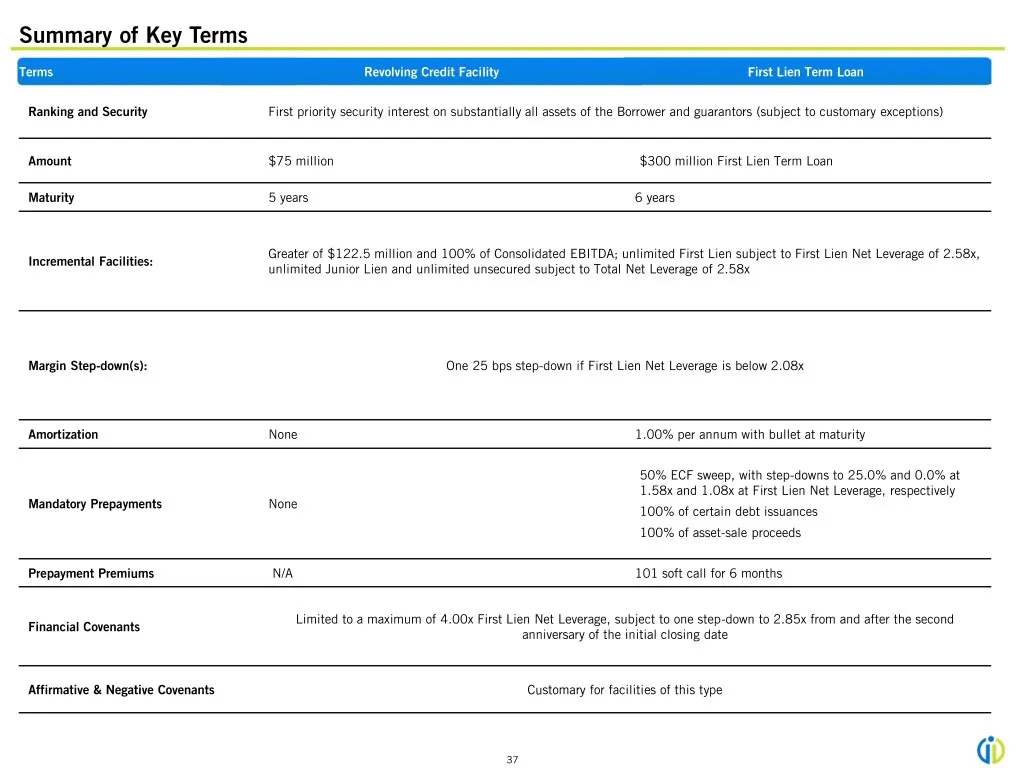
Summary of Key Terms TermsTerms ABLRevolving Revolving Credit Credit Facility Facility FirstFirst LienLien TermTerm LoanLoan Ranking and Security First priority security interest on substantially all assets of the Borrower and guarantors (subject to customary exceptions) Amount $75 million $300 mill
Slide 42: Transaction Timeline
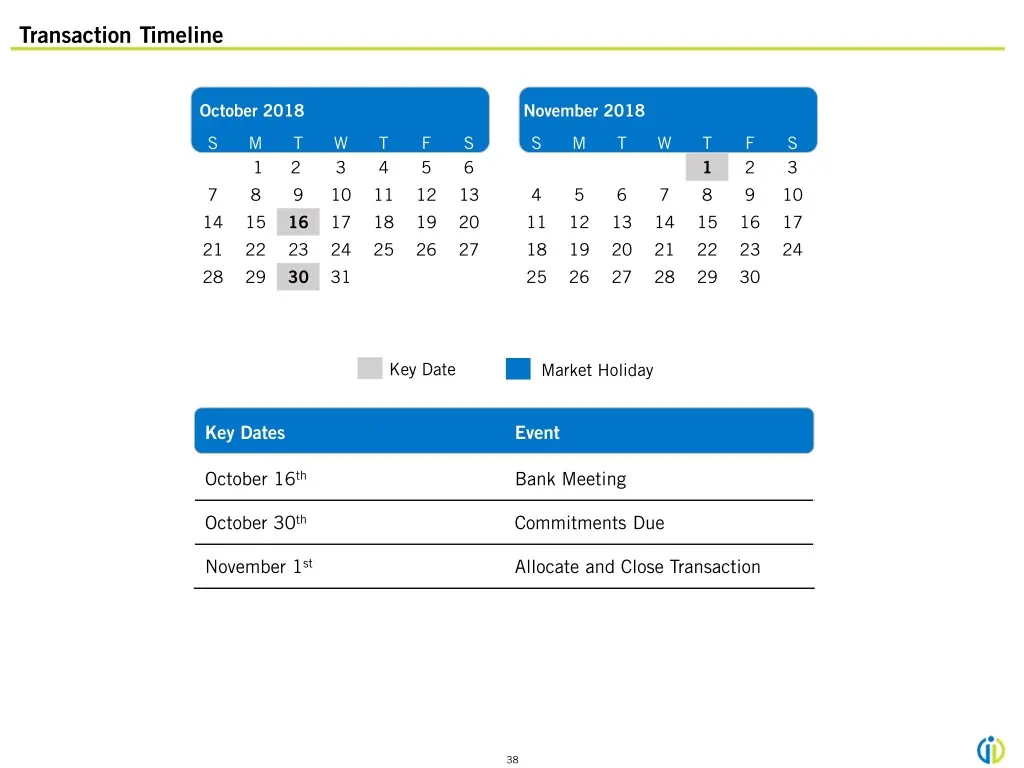
Transaction Timeline October 2018 November 2018 S M T W T F S S M T W T F S 1 2 3 4 5 6 1 2 3 7 8 9 10 11 12 13 4 5 6 7 8 9 10 14 15 16 17 18 19 20 11 12 13 14 15 16 17 21 22 23 24 25 26 27 18 19 20 21 22 23 24 28 29 30 31 25 26 27 28 29 30 Key Date Market Holiday Key Dates Event October 16th Bank M
Slide 43: Illustrative Pro Forma Corporate Structure
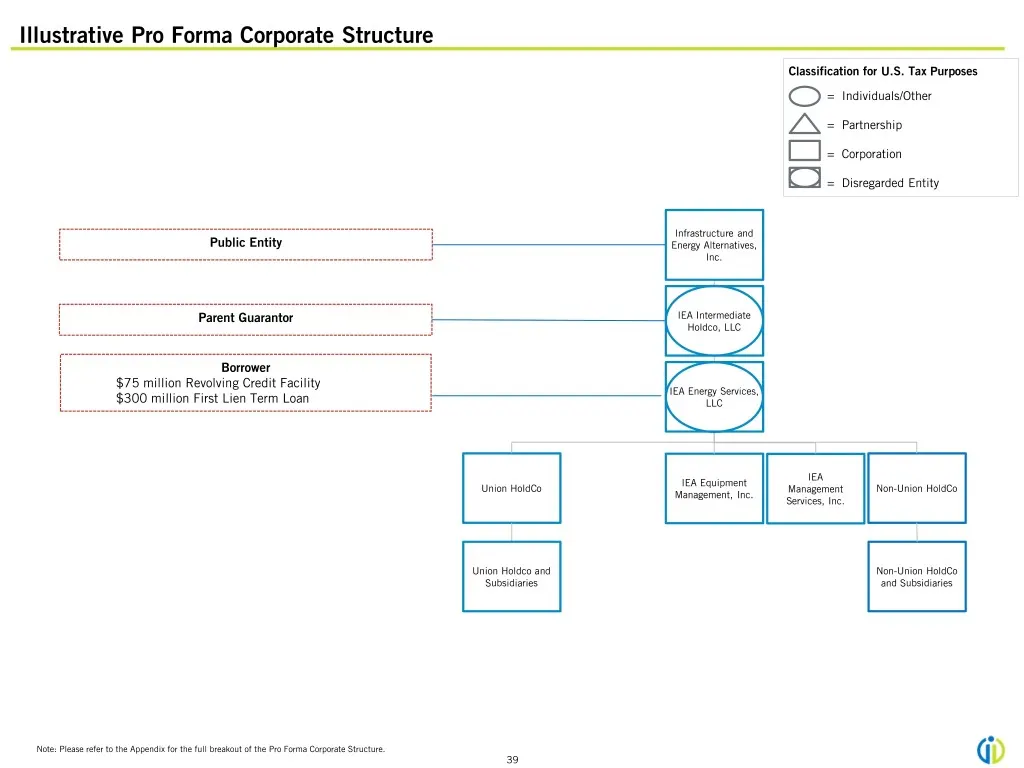
Illustrative Pro Forma Corporate Structure Classification for U.S. Tax Purposes = Individuals/Other = Partnership = Corporation = Disregarded Entity Infrastructure and Public Entity Energy Alternatives, Inc. Parent Guarantor IEA Intermediate Holdco, LLC Borrower $75 million Revolving Credit Facility
Slide 44: Appendix
QDIEA Appendix
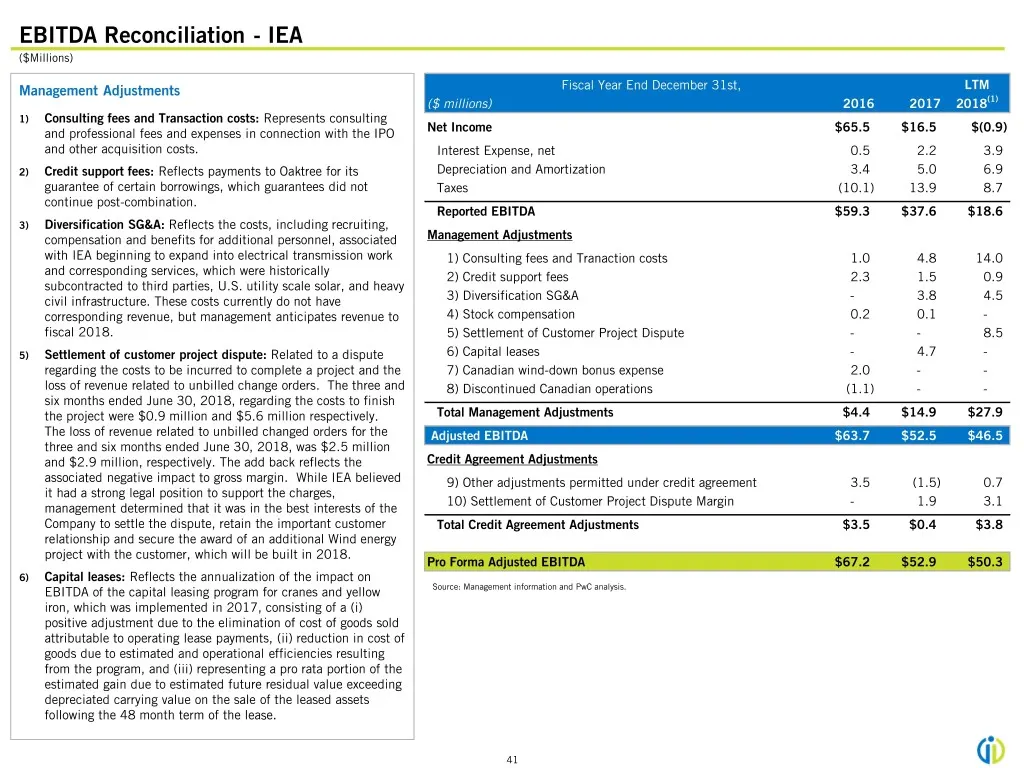
Slide 45: EBITDA Reconciliation - IEA
EBITDA Reconciliation - IEA ($Millions) Management Adjustments Fiscal Year End December 31st, LTM ($ millions) 2016 2017 2018(1) 1) Consulting fees and Transaction costs: Represents consulting and professional fees and expenses in connection with the IPO Net Income $65.5 $16.5 $(0.9) and other acqui
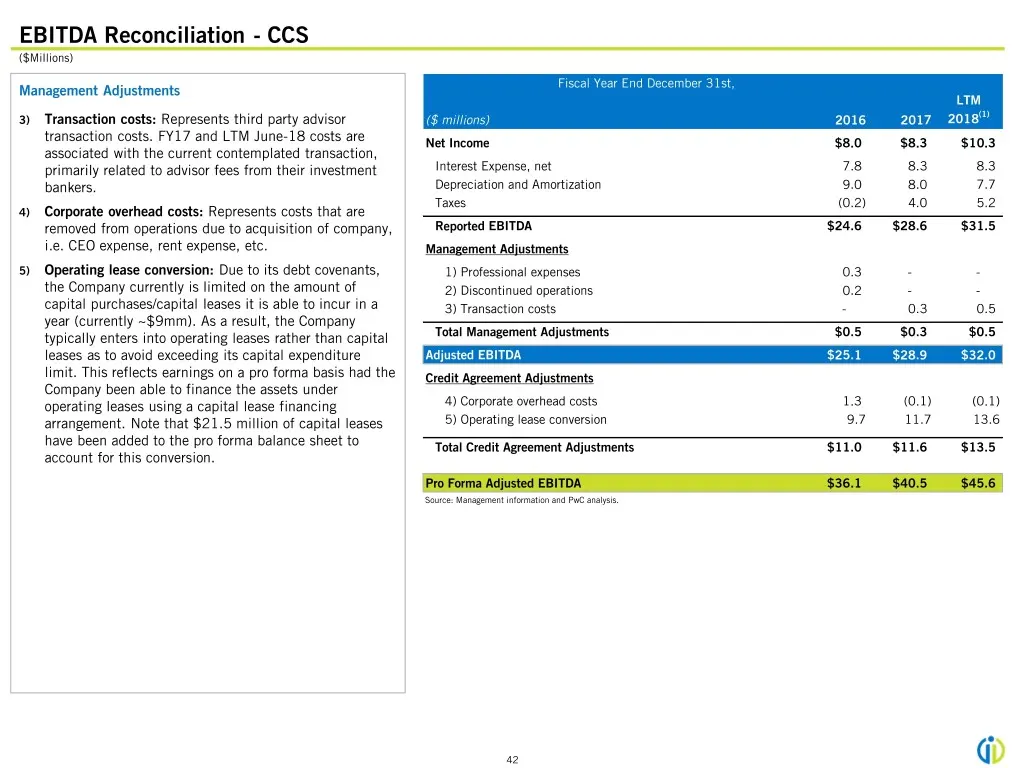
Slide 46: EBITDA Reconciliation - CCS
EBITDA Reconciliation - CCS ($Millions) Fiscal Year End December 31st, Management Adjustments LTM (1) 3) Transaction costs: Represents third party advisor ($ millions) 2016 2017 2018 transaction costs. FY17 and LTM June-18 costs are Net Income $8.0 $8.3 $10.3 associated with the current contemplated
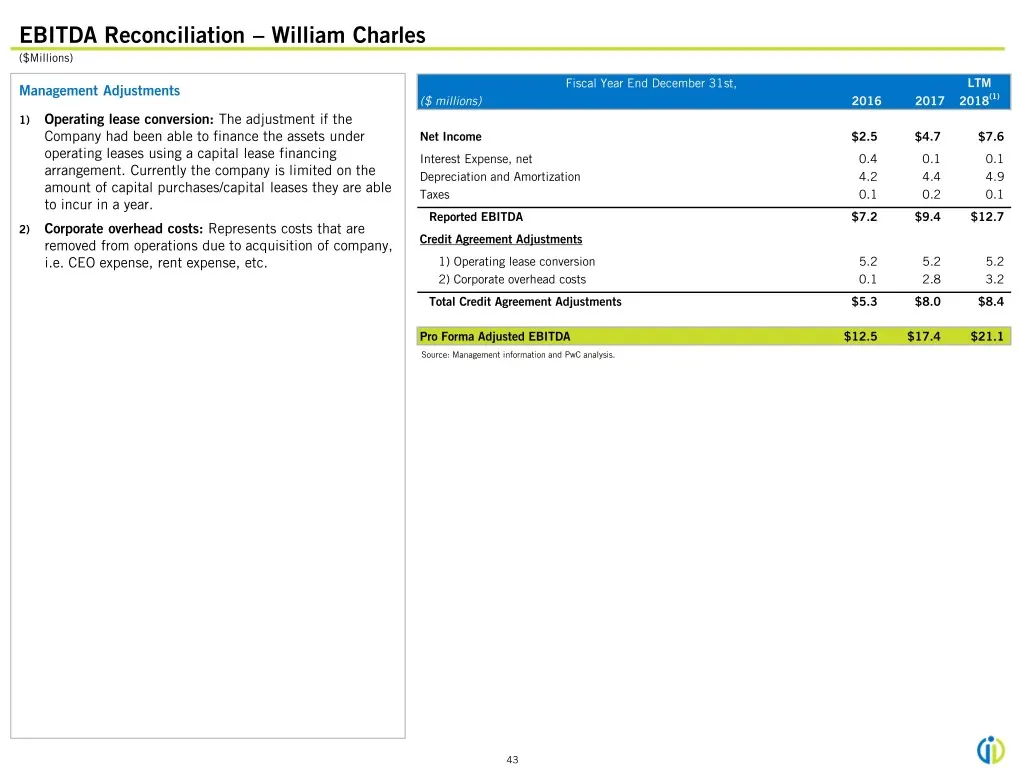
Slide 47: EBITDA Reconciliation – William Charles
EBITDA Reconciliation – William Charles ($Millions) Fiscal Year End December 31st, LTM Management Adjustments ($ millions) 2016 2017 2018(1) 1) Operating lease conversion: The adjustment if the Company had been able to finance the assets under Net Income $2.5 $4.7 $7.6 operating leases using a capit
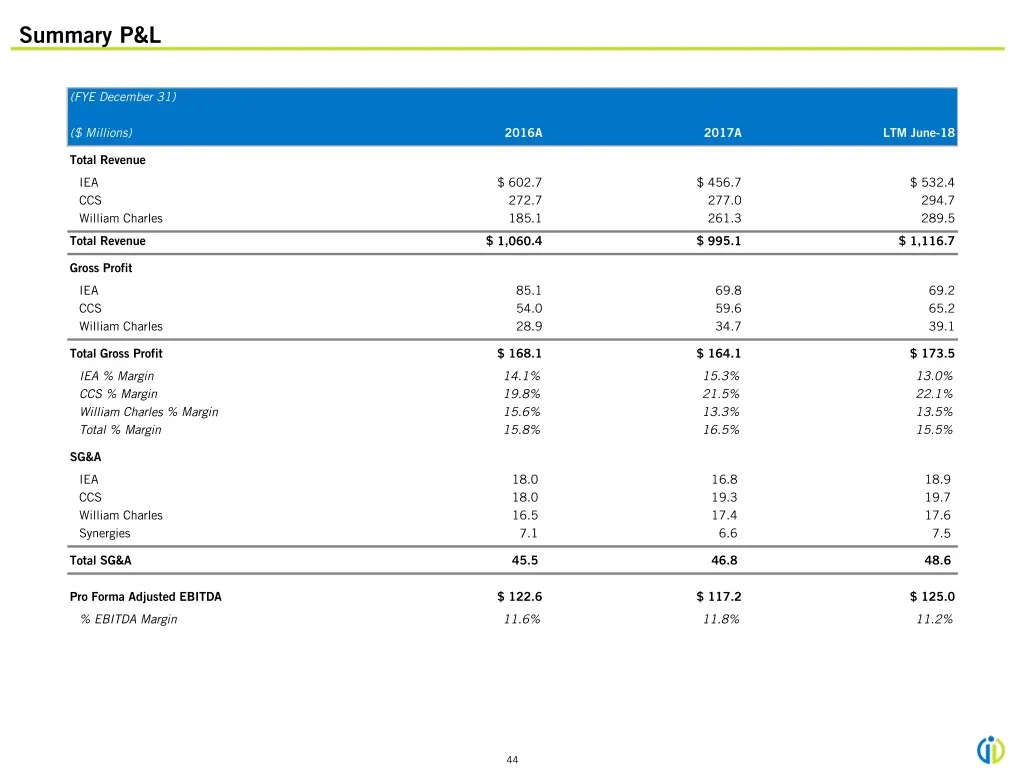
Slide 48: Summary P&L
Summary P&L (FYE December 31) ($ Millions) 2016A 2017A LTM June-18 Total Revenue IEA $ 602.7 $ 456.7 $ 532.4 CCS 272.7 277.0 294.7 William Charles 185.1 261.3 289.5 Total Revenue $ 1,060.4 $ 995.1 $ 1,116.7 Gross Profit IEA 85.1 69.8 69.2 CCS 54.0 59.6 65.2 William Charles 28.9 34.7 39.1 Total Gross
Slide 49: Q&A
QDIEA Q&A
Source: SEC EDGAR · 8-K filed Oct 16, 2018
More decks from Infrastructure and Energy Alternatives Inc
 Q1 2022 Earnings Presentation23 slides · May 9, 2022
 Q4 2021 Earnings Presentation24 slides · Mar 7, 2022
 FY2020 Earnings Presentation20 slides · Mar 8, 2021
 Q4 2019 Earnings Presentation23 slides · Mar 10, 2020
 Q3 2019 Earnings Presentation19 slides · Nov 12, 2019
 Investor Presentation (October 2019)15 slides · Oct 30, 2019