Tiger Brands Limited · JSE:TBS
Tiger Brands — H1 2010 Earnings Presentation
63 slides from Tiger Brands's earnings presentation, May 18, 2010
Slide 1: Interim Results Investor Presentation 2010
TigerBrandsLimited InterimResultsInvestorPresentation 2010 Adding value to life 1 Group results and capital distribution for half year ended 31 March 2010
Slide 2: Agenda
AGENDA Corporate Strategy A Context for Performance Salient Features Financial Analysis Segmental Performance Outlook 2
Slide 3: Corporate Strategy
CORPORATESTRATEGY PeterMatlare ChiefExecutiveOfficer 3
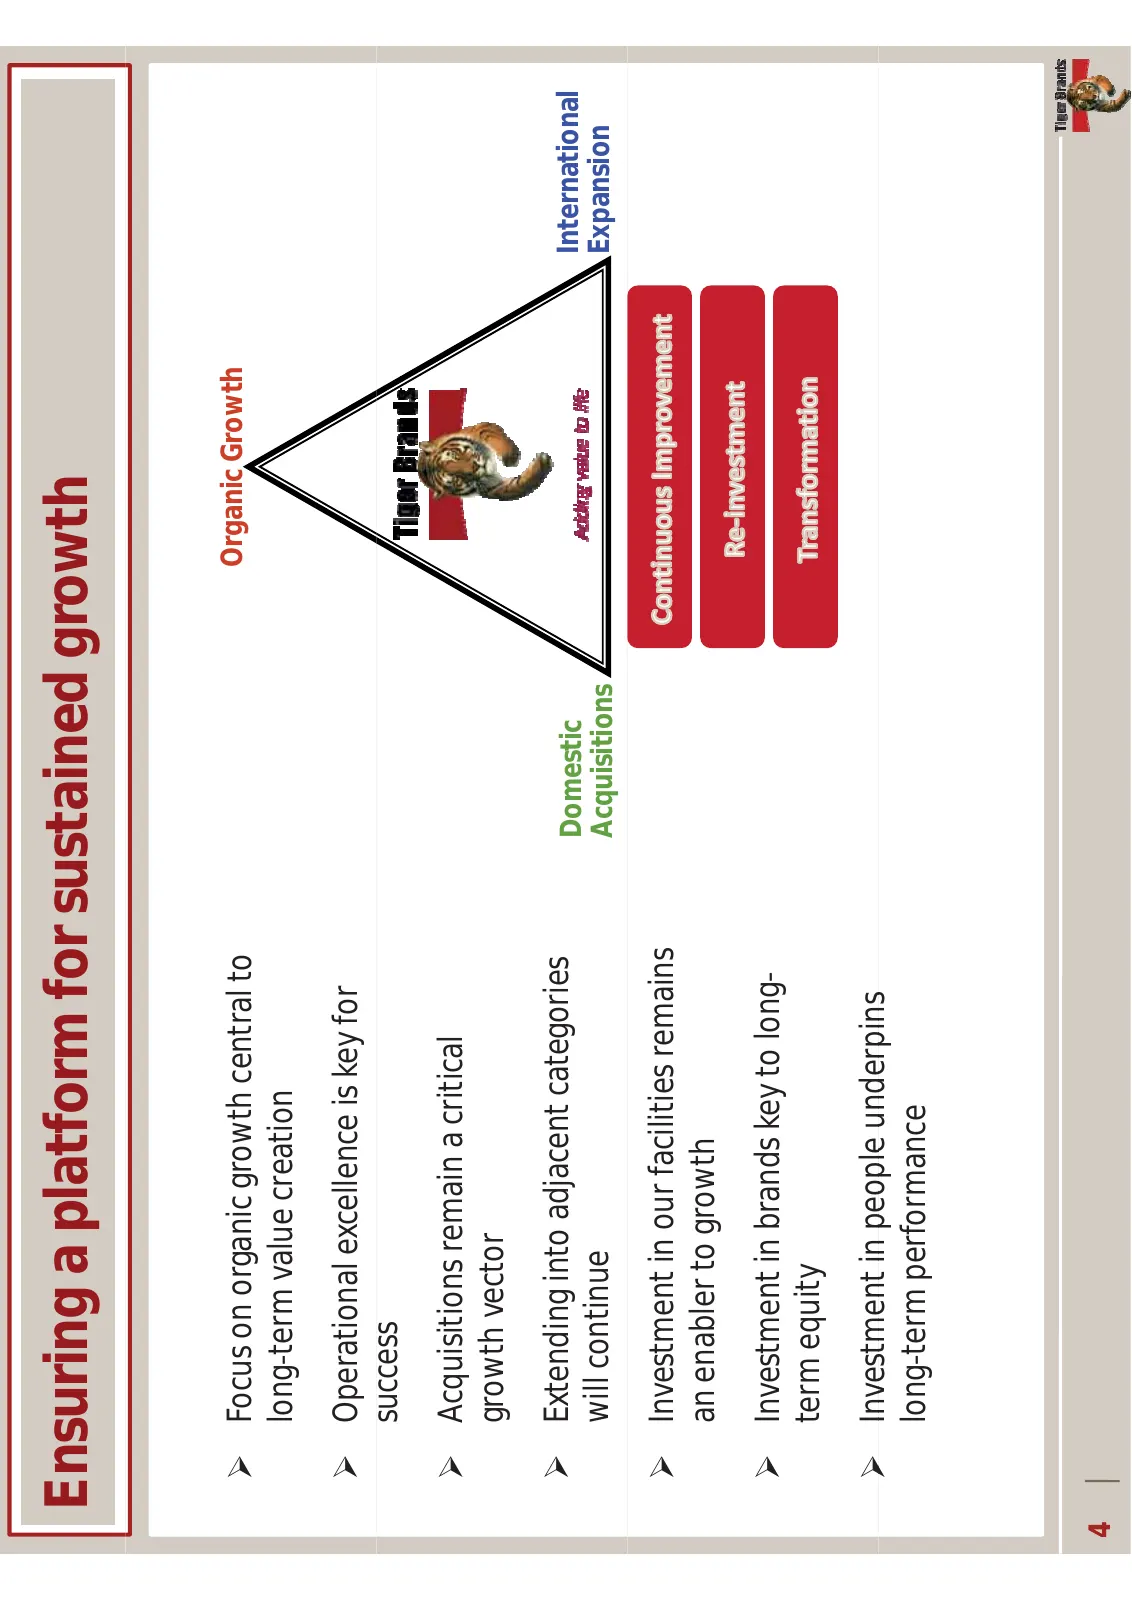
Slide 4: Ensuring a platform for sustained growth
Ensuringaplatformforsustainedgrowth ¾ Focus Focusonorganicgrowthcentralto on organic growth central to OrganicGrowth longͲtermvaluecreation ¾ Operationalexcellenceiskeyfor success ¾ Acquisitionsremainacritical growth vector growthvector ¾ Extendingintoadjacentcategories Domestic International willco
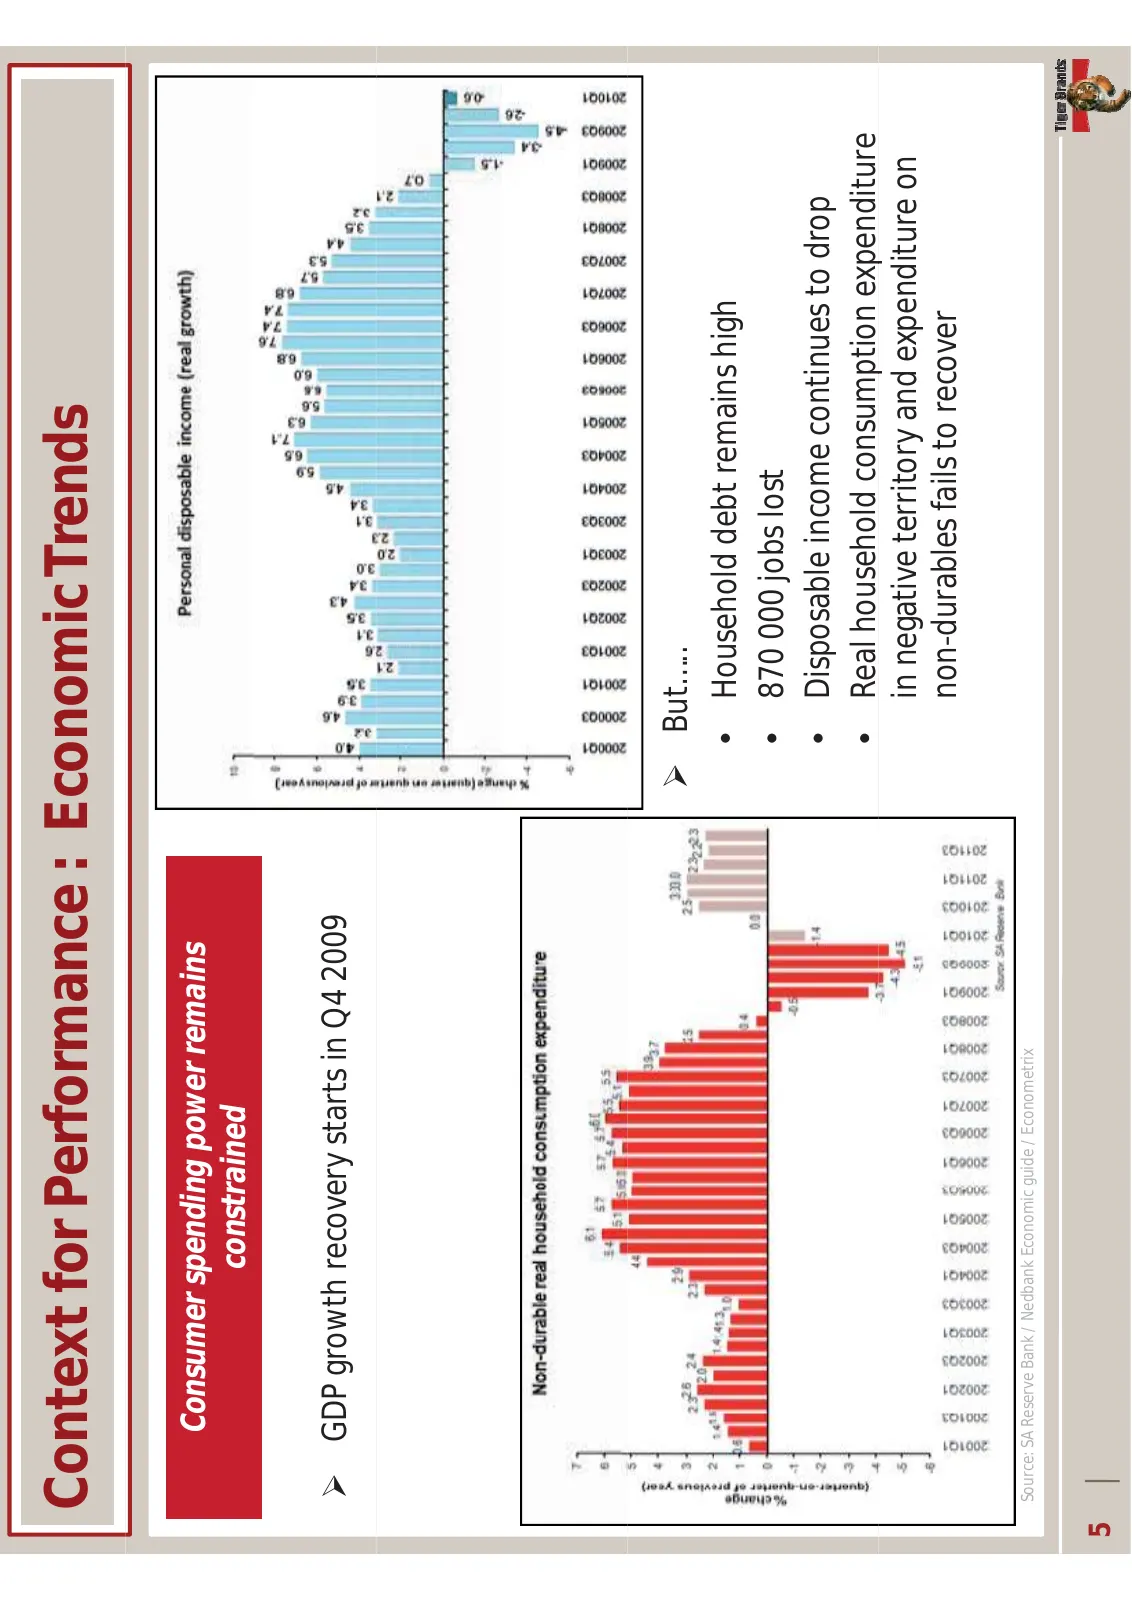
Slide 5: Context for Performance: Economic Trends
ContextforPerformance:EconomicTrends Consumerspendingpowerremains constrained ¾ GDPgrowthrecoverystartsinQ42009 ¾ But….. • Householddebtremainshigh • 870000jobslost • Disposableincomecontinuestodrop p p • Realhouseholdconsumptionexpenditure innegativeterritoryandexpenditureon nonͲdurablesfailstoreco
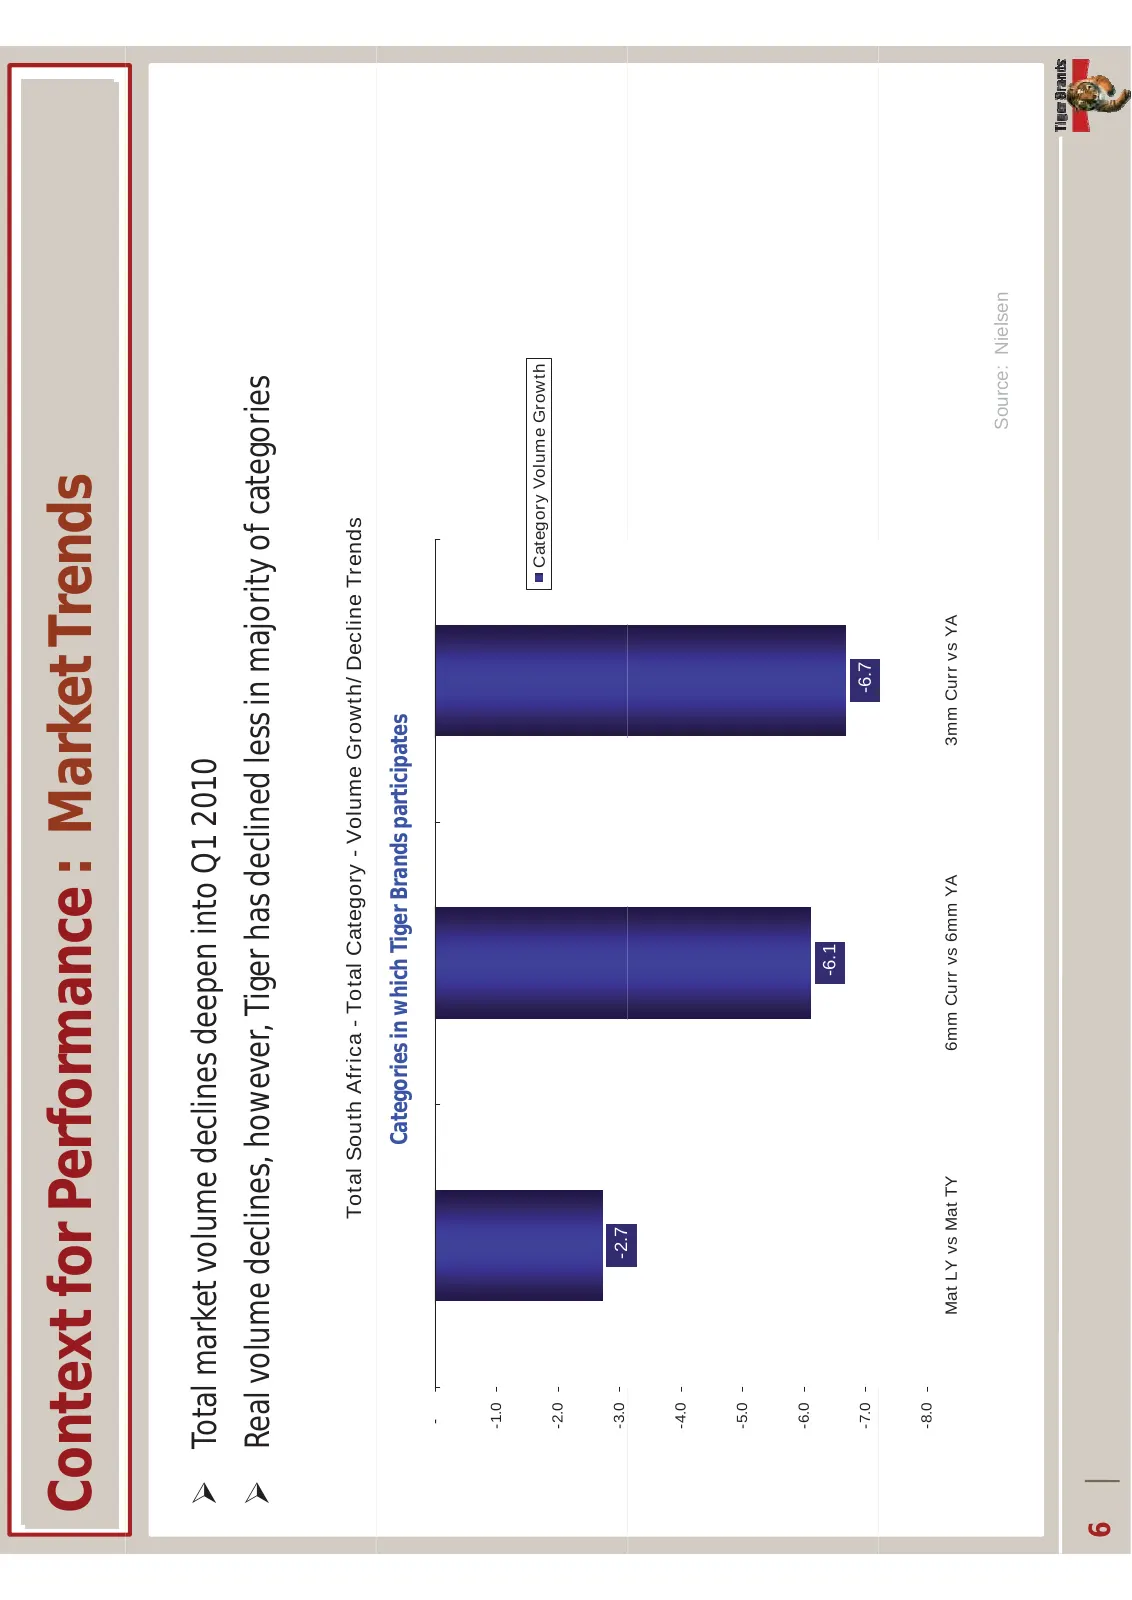
Slide 6: Context for Performance: Market Trends
ContextforPerformance:MarketTrends ¾ TotalmarketvolumedeclinesdeepenintoQ12010 ¾ Realvolumedeclines,however,Tigerhasdeclinedlessinmajorityofcategories R l l d li h Ti h d li d l i j it f t i Total South Africa - Total Category - Volume Growth/ Decline Trends CategoriesinwhichTigerBrandsparticipates
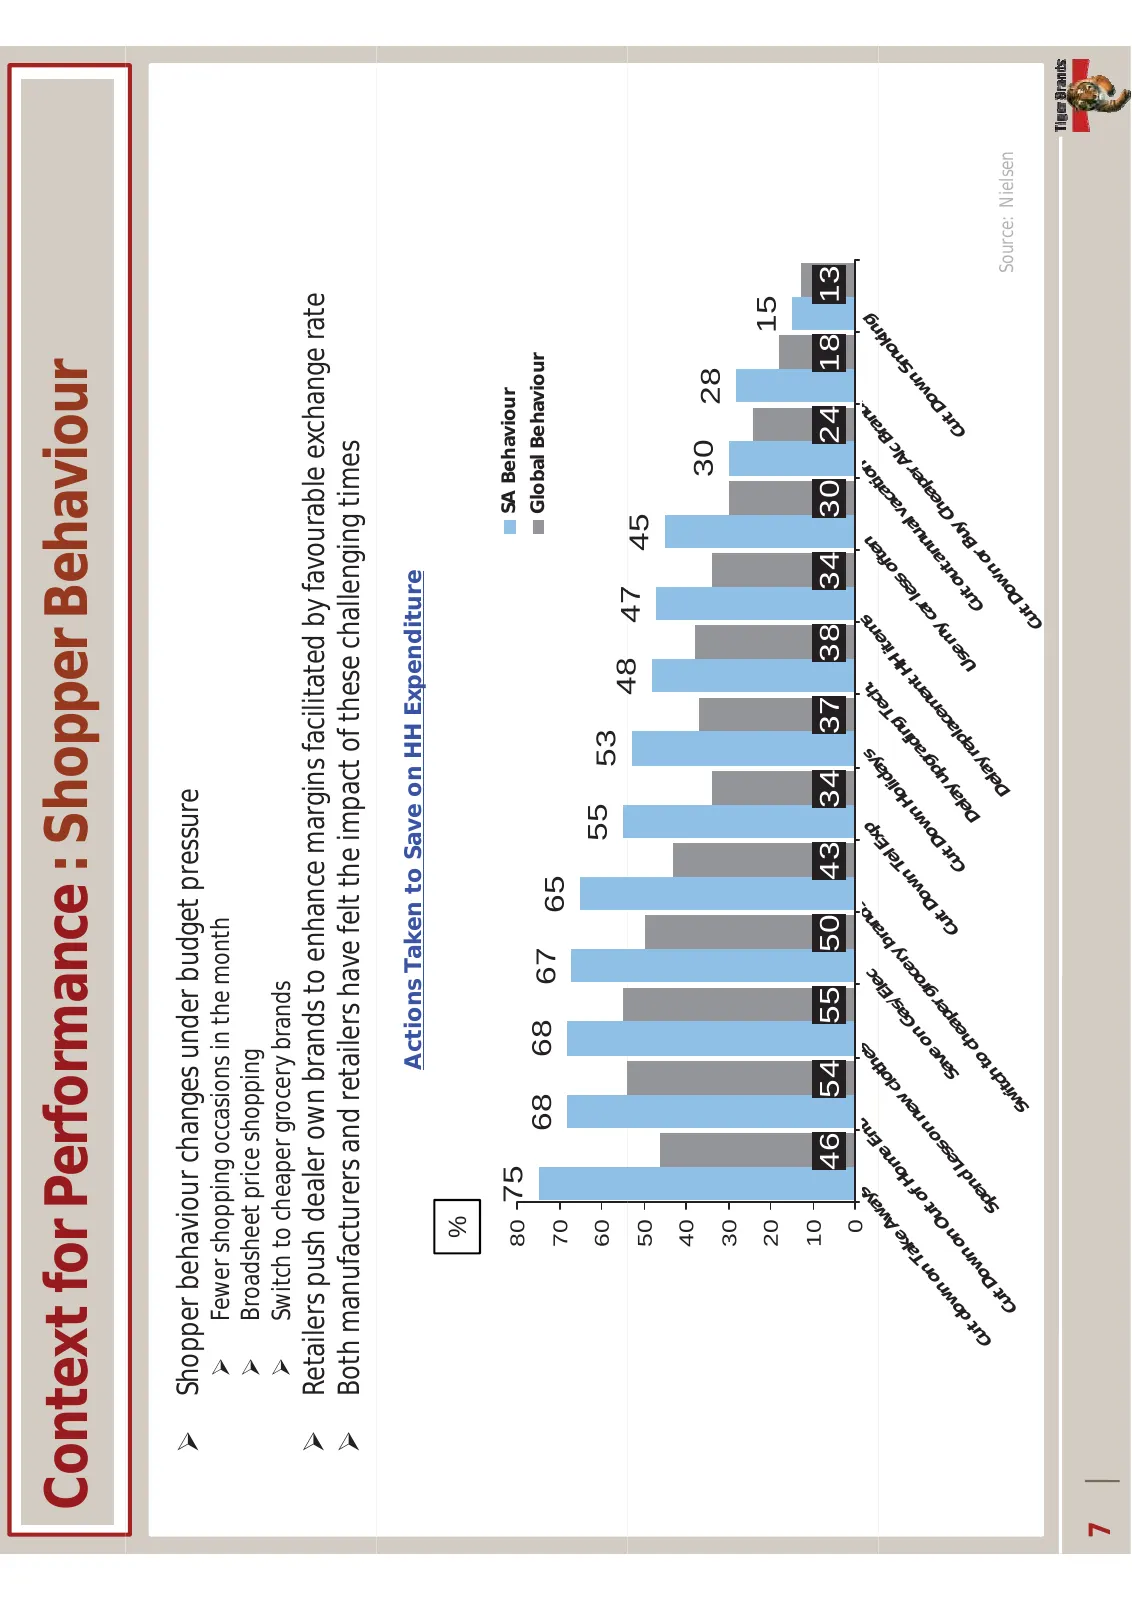
Slide 7: Context for Performance: Shopper Behaviour
ContextforPerformance:ShopperBehaviour ¾ Shopperbehaviourchangesunderbudgetpressure ¾ Fewershoppingoccasionsinthemonth ¾ Broadsheet price shopping Broadsheetpriceshopping ¾ Switchtocheapergrocerybrands ¾ Retailerspushdealerownbrandstoenhancemarginsfacilitatedbyfavourableexchangerate ¾ Bothmanufactur
Slide 8: Tiger Brands Response
TigerBrandsResponse ¾ Marginprotectionemphasis M i t ti h i ¾ Increasedmarketinginvestment ¾ IncreasedTradeinvestmentforactivation ¾ Judiciouspricemanagement ¾ Leadingbrandspartlymitigatedeffectsofseveredownturn ¾ Thebenefitofadiversifiedbasketstrategy 8
Slide 9: Salient Features: FMCG Operations
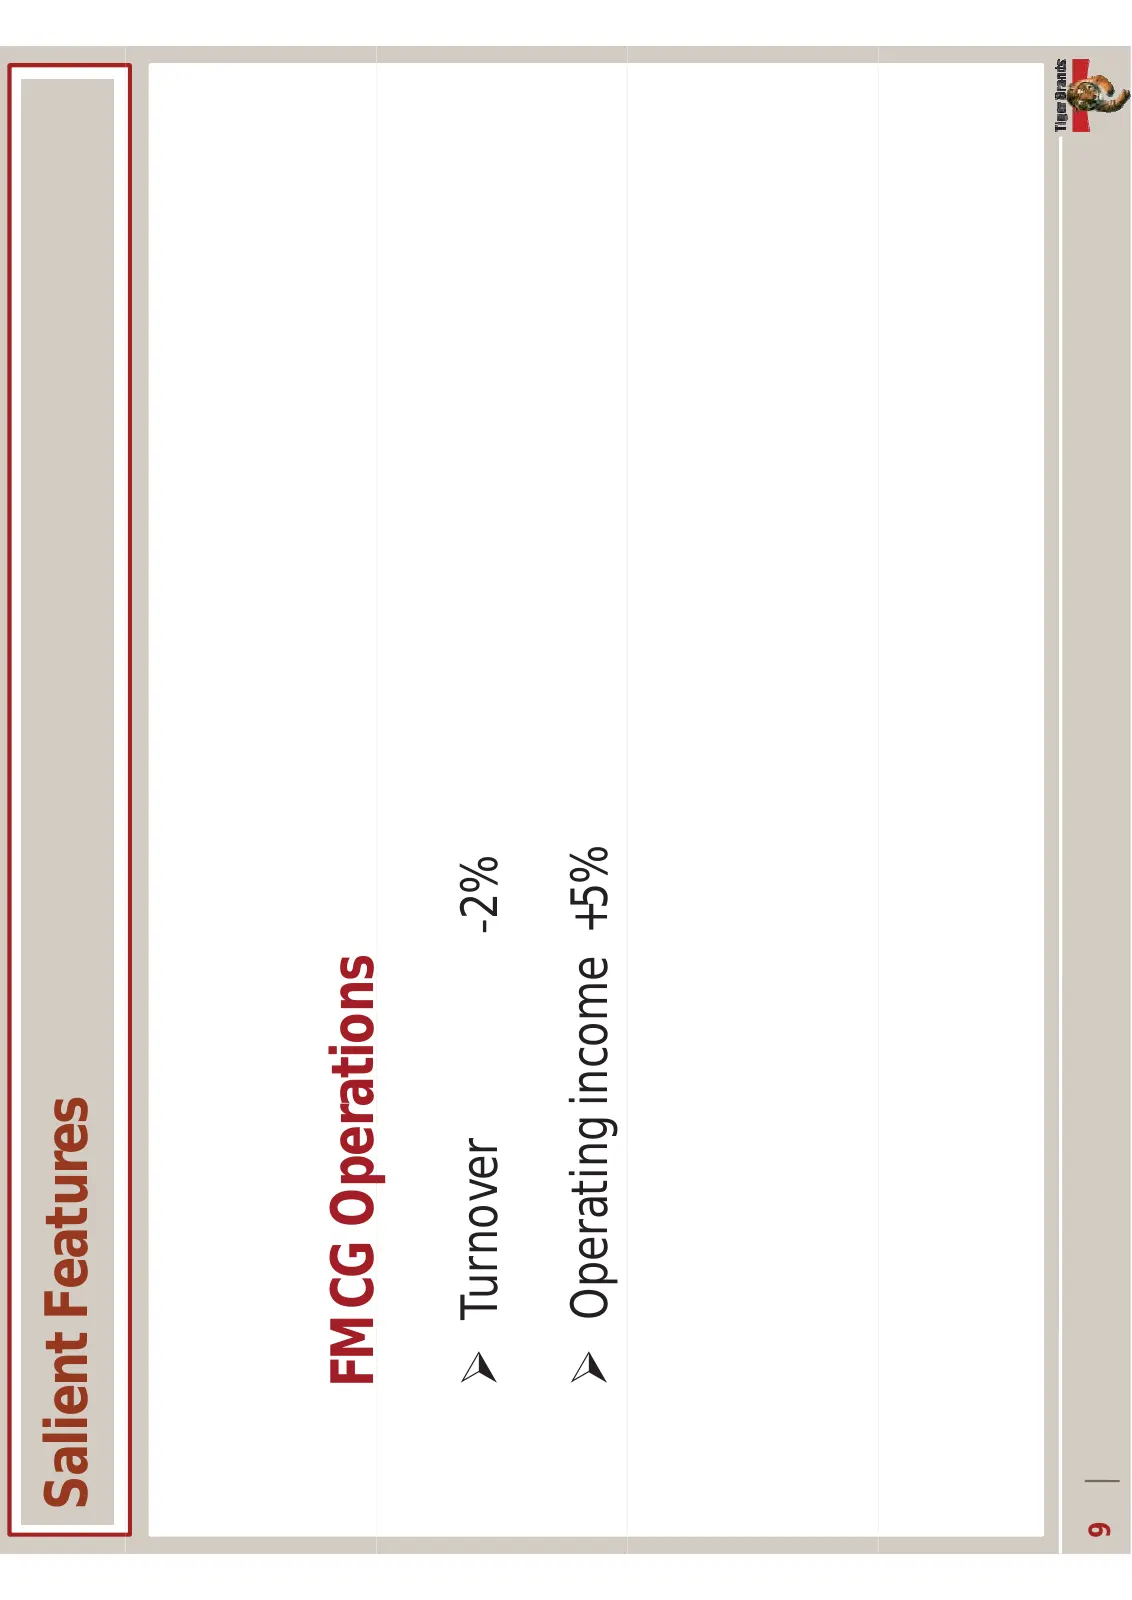
SalientFeatures FMCGOperations p ¾ Turnover Ͳ2% ¾ Operatingincome +5% 9
Slide 10: HEPS (cents)
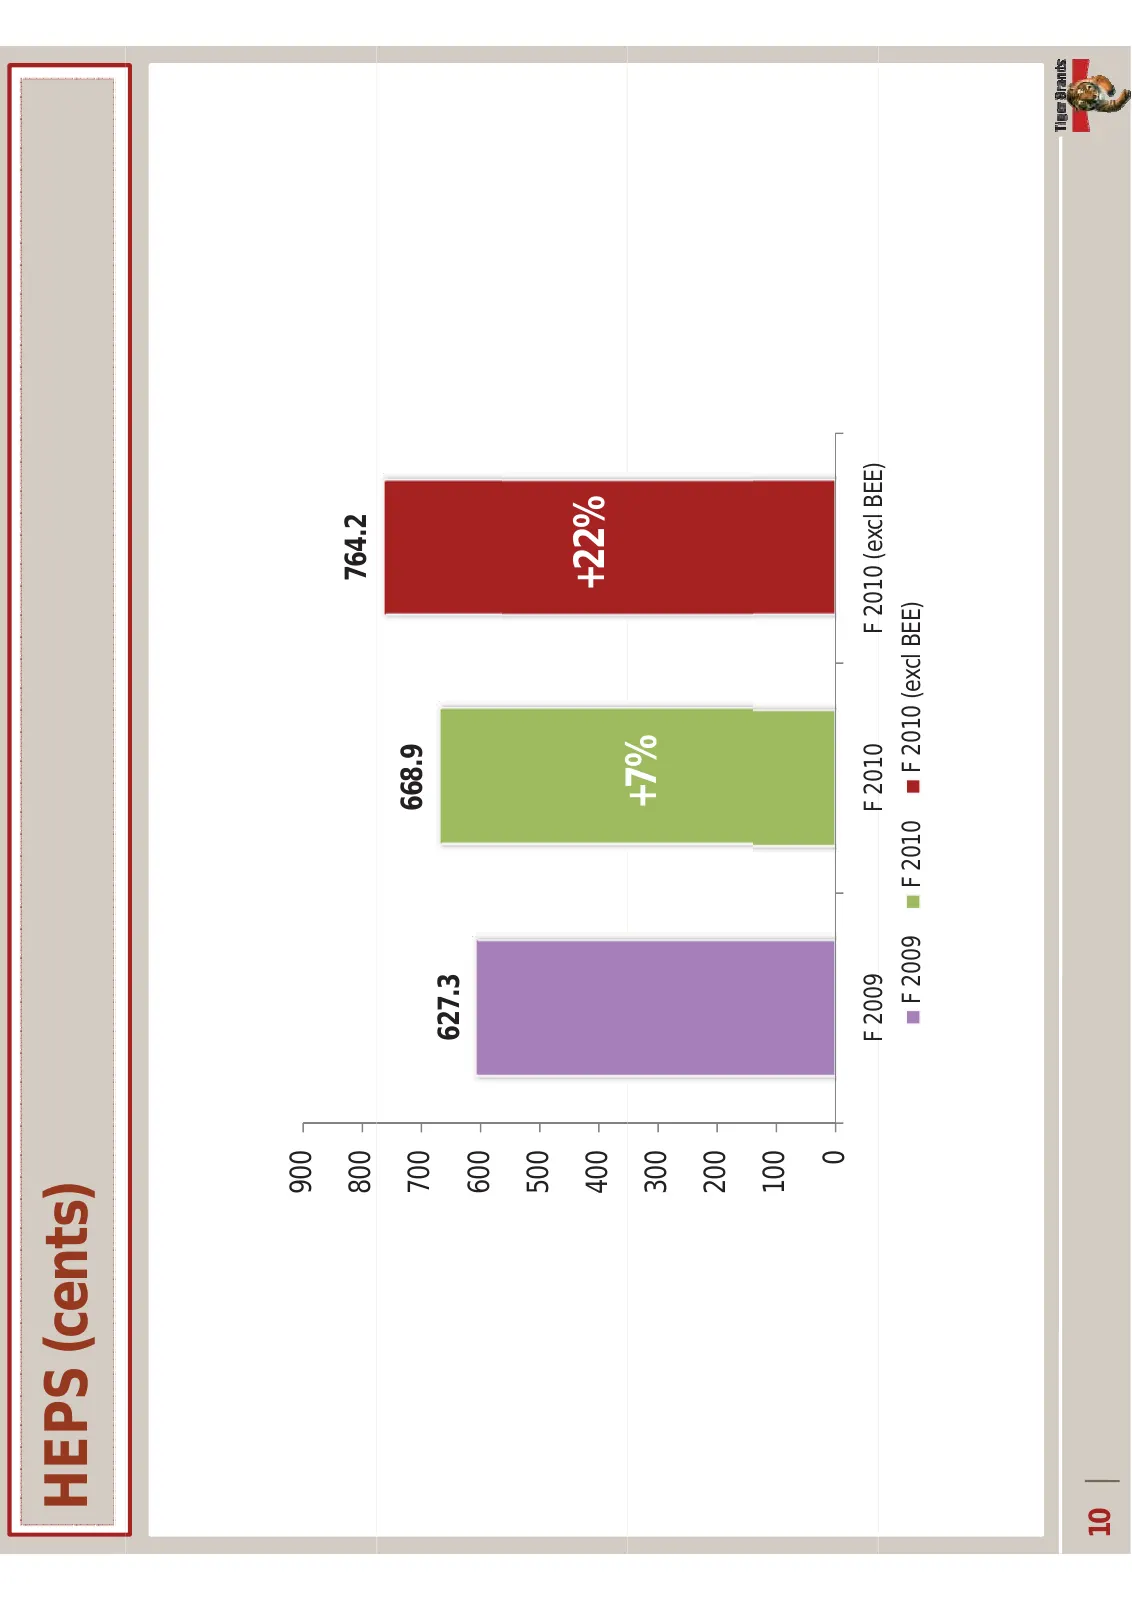
HEPS(cents) 900 800 764.2 700 668.9 627.3 600 500 400 +22% 300 +7% 200 100 0 F2009 F 2009 F2010 F 2010 F2010(exclBEE) F 2010 (excl BEE) F2009 F2010 F2010(exclBEE) 10
Slide 11: Interim Distribution – cents per share
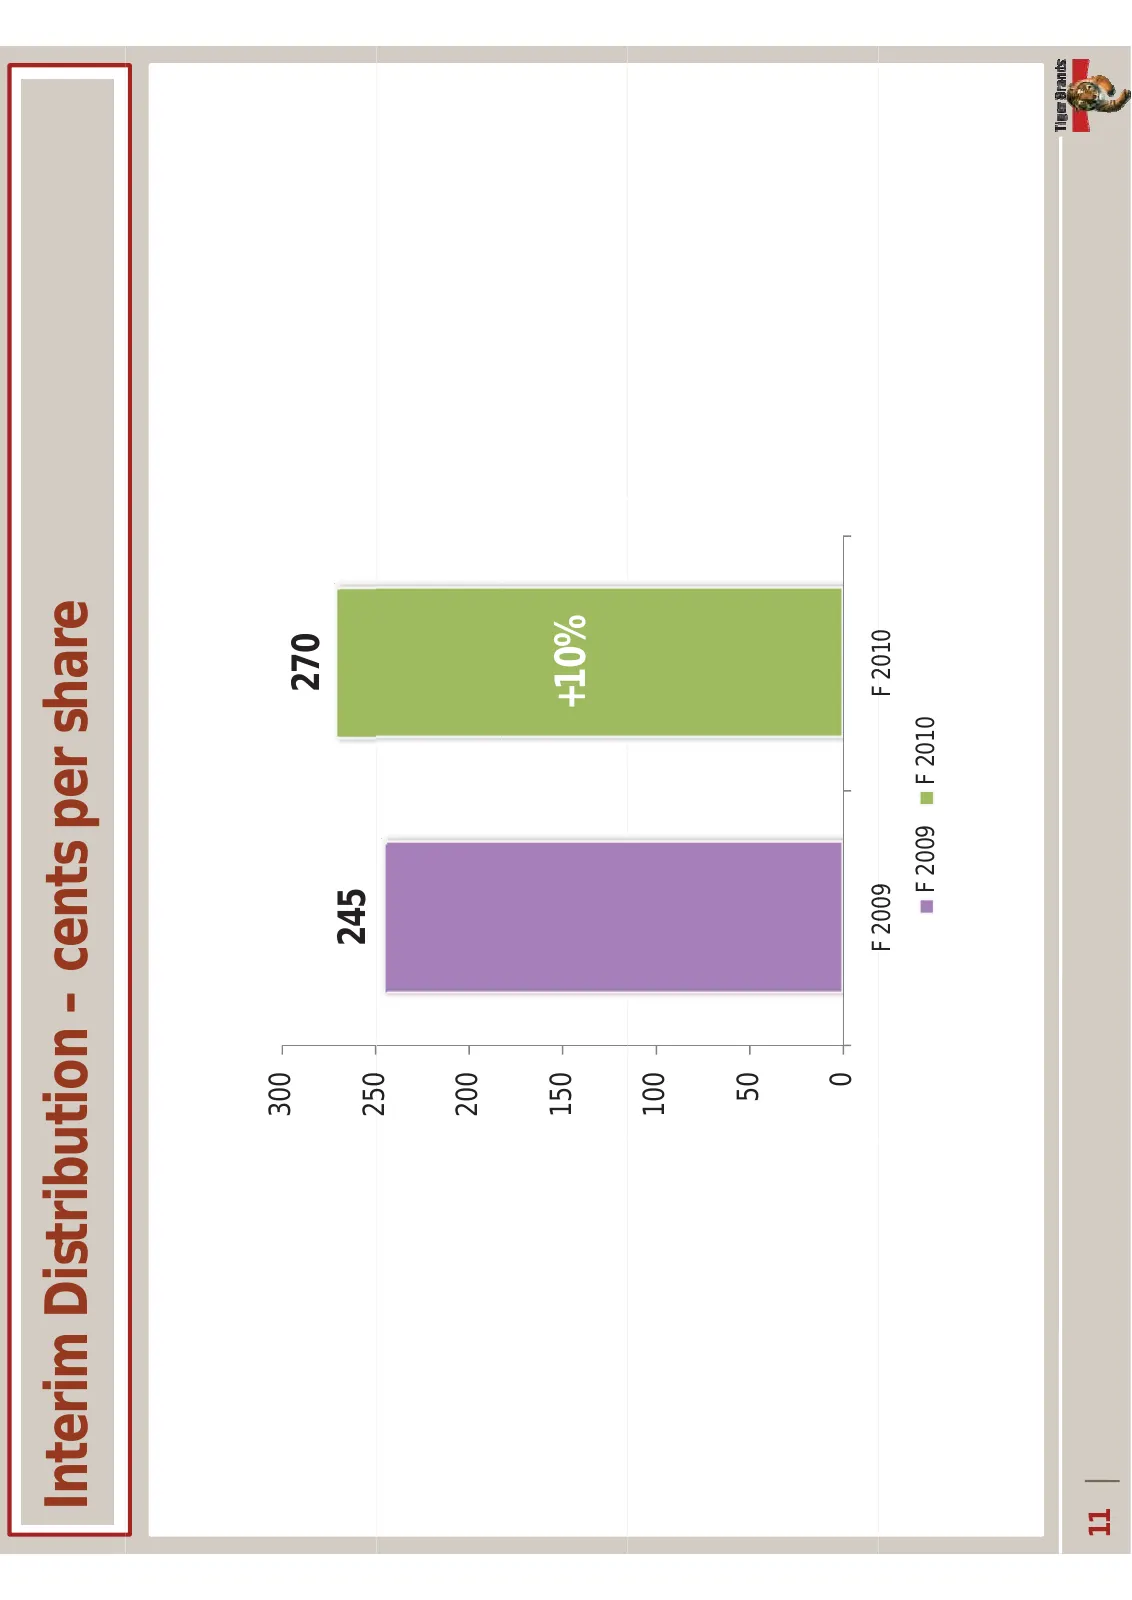
InterimDistribution– centspershare 300 270 250 245 200 150 +10% 100 50 0 F 2009 F2009 F 2010 F2010 F2009 F2010 11
Slide 12: Financial Analysis
FINANCIALANALYSIS Michael Fleming MichaelFleming ChiefFinancialOfficer 12
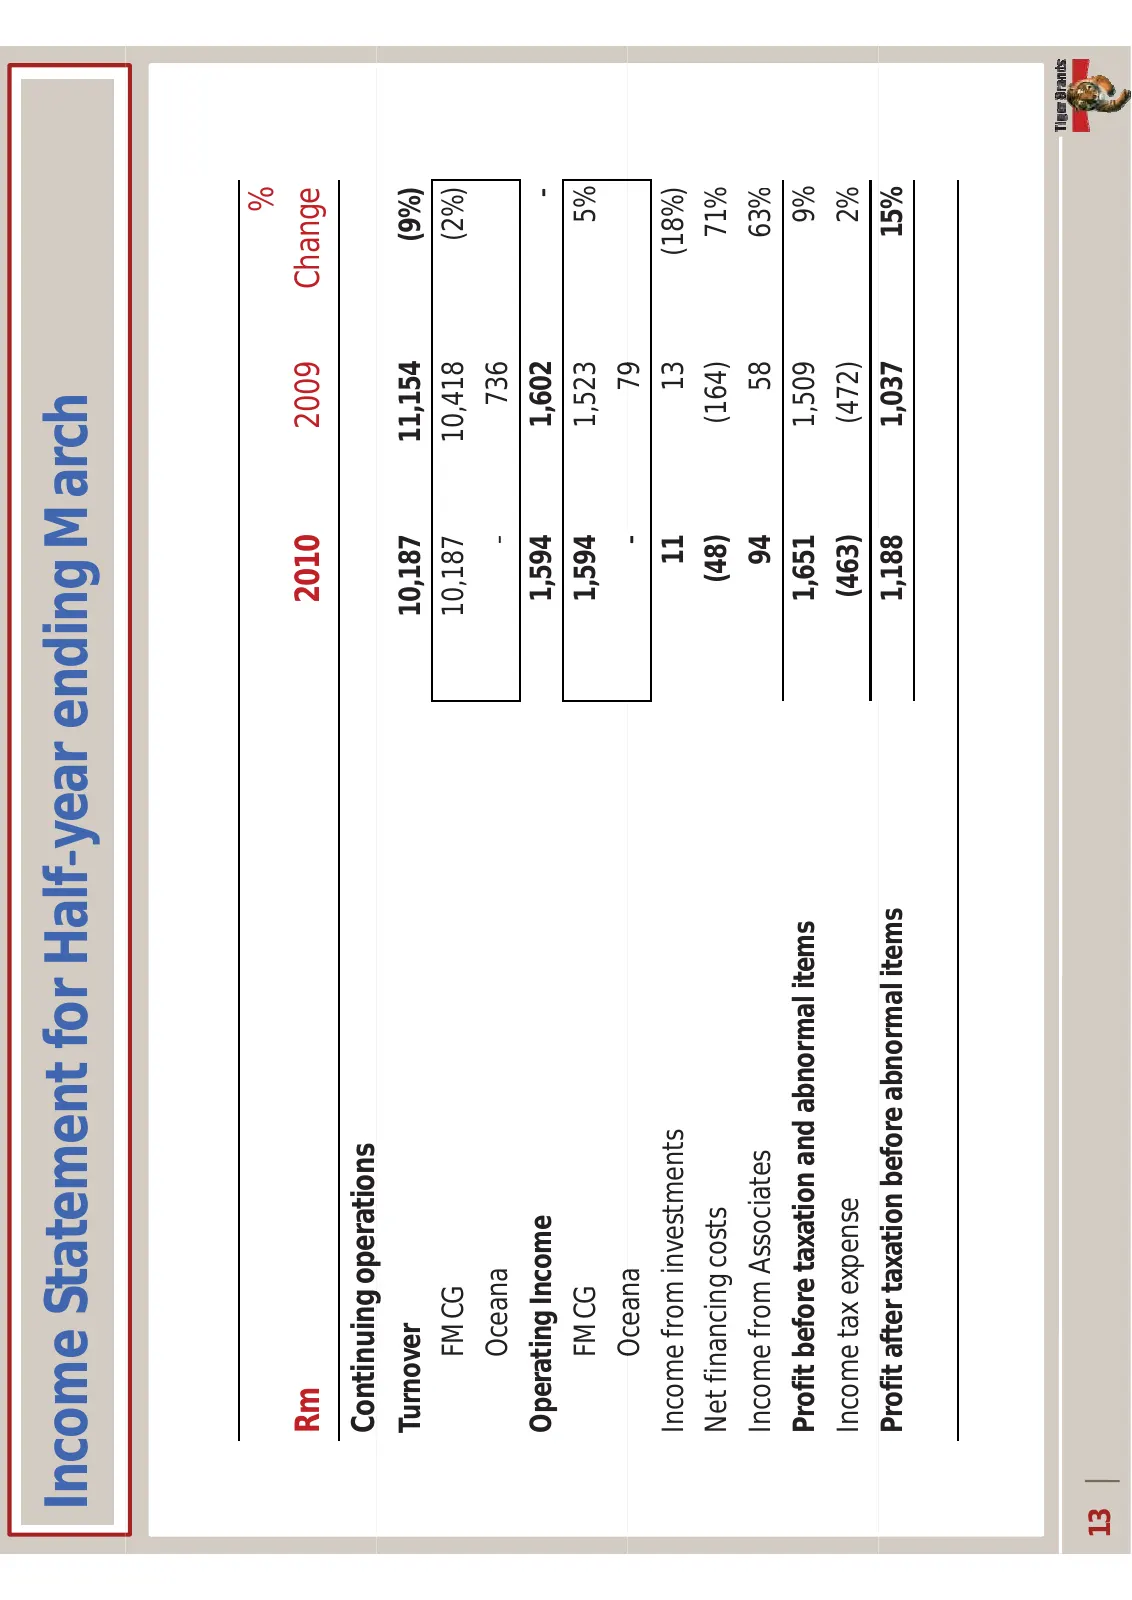
Slide 13: Income Statement for Half-year ending March
IncomeStatementforHalfͲyearendingMarch % Rm 2010 2009 Change Continuingoperations g p Turnover 10,187 11,154 (9%) FMCG 10,187 10,418 (2%) Oceana Ͳ 736 OperatingIncome 1,594 1,602 Ͳ FMCG 1,594 1,523 5% Oceana Ͳ 79 Incomefrominvestments 11 13 (18%) Netfinancingcosts (48) (164) 71% I IncomefromAssociat
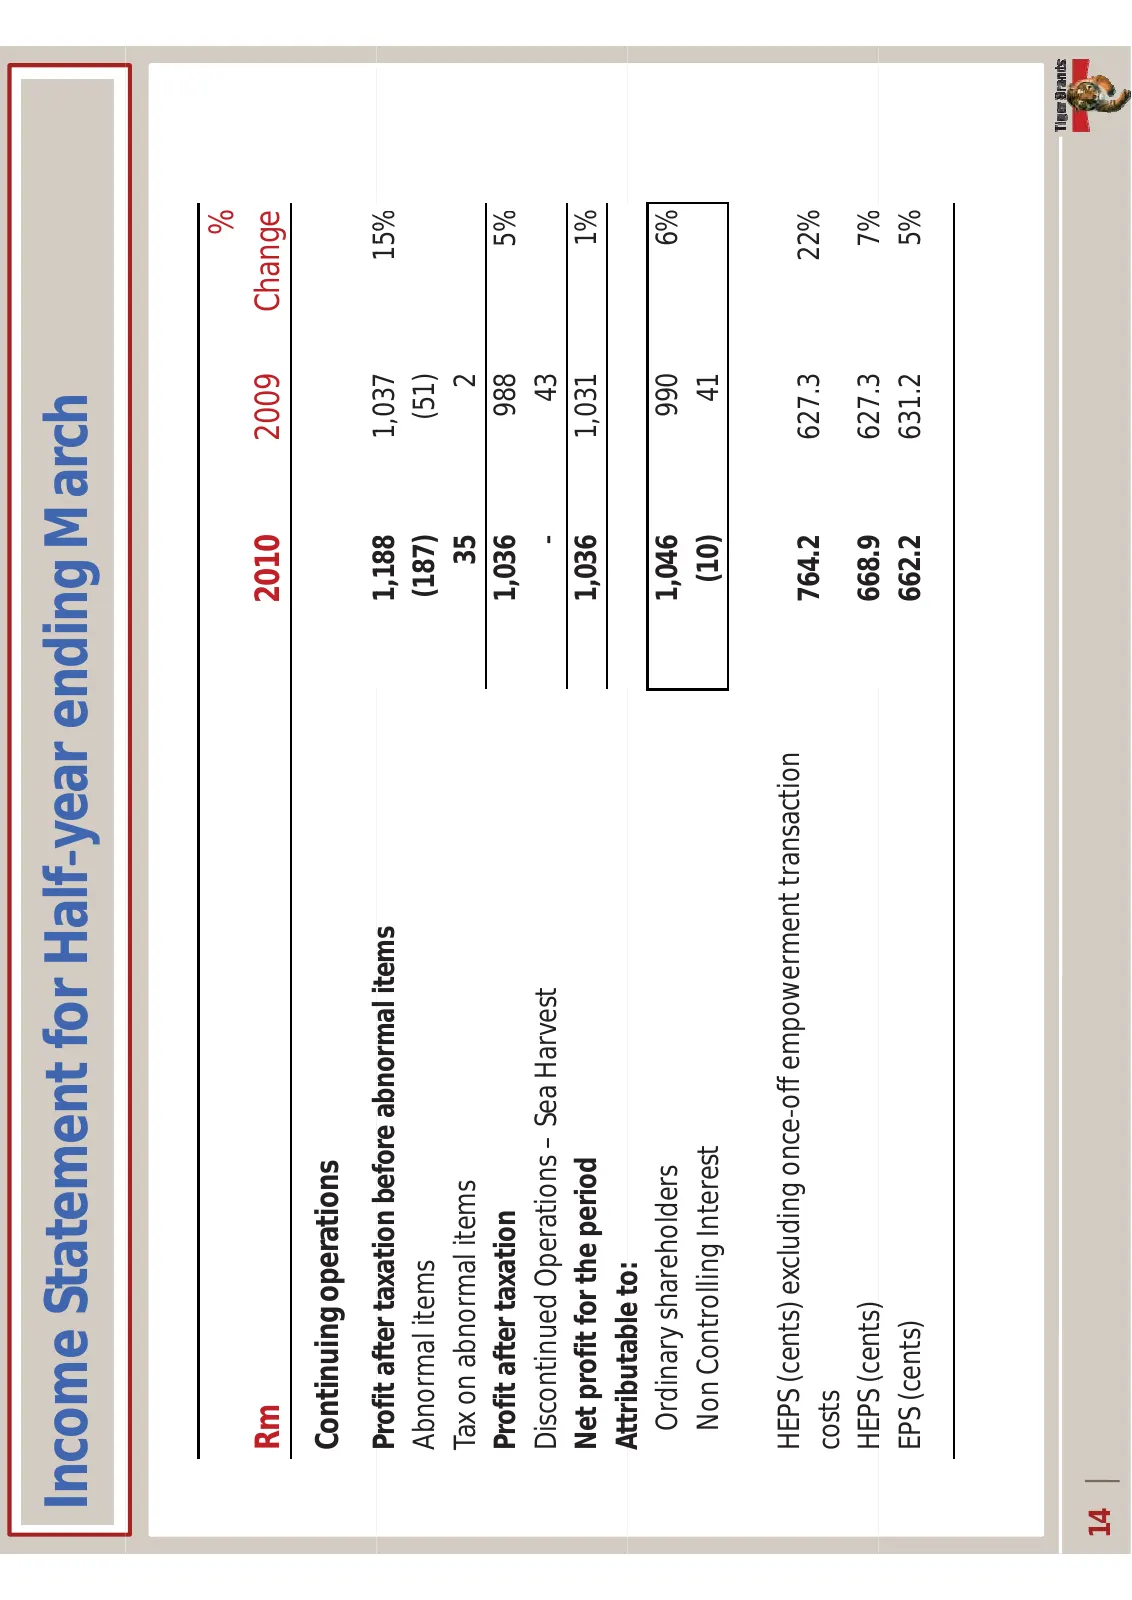
Slide 14: Income Statement for Half-year ending March
IncomeStatementforHalfͲyearendingMarch % Rm 2010 2009 Change Continuingoperations Profitaftertaxationbeforeabnormalitems P fi f i b f b li 1,188 1 188 1,037 1 037 15% Abnormalitems (187) (51) Tax onabnormalitems 35 2 Profit after taxation Profitaftertaxation 1 036 1,036 988 5% DiscontinuedOperations
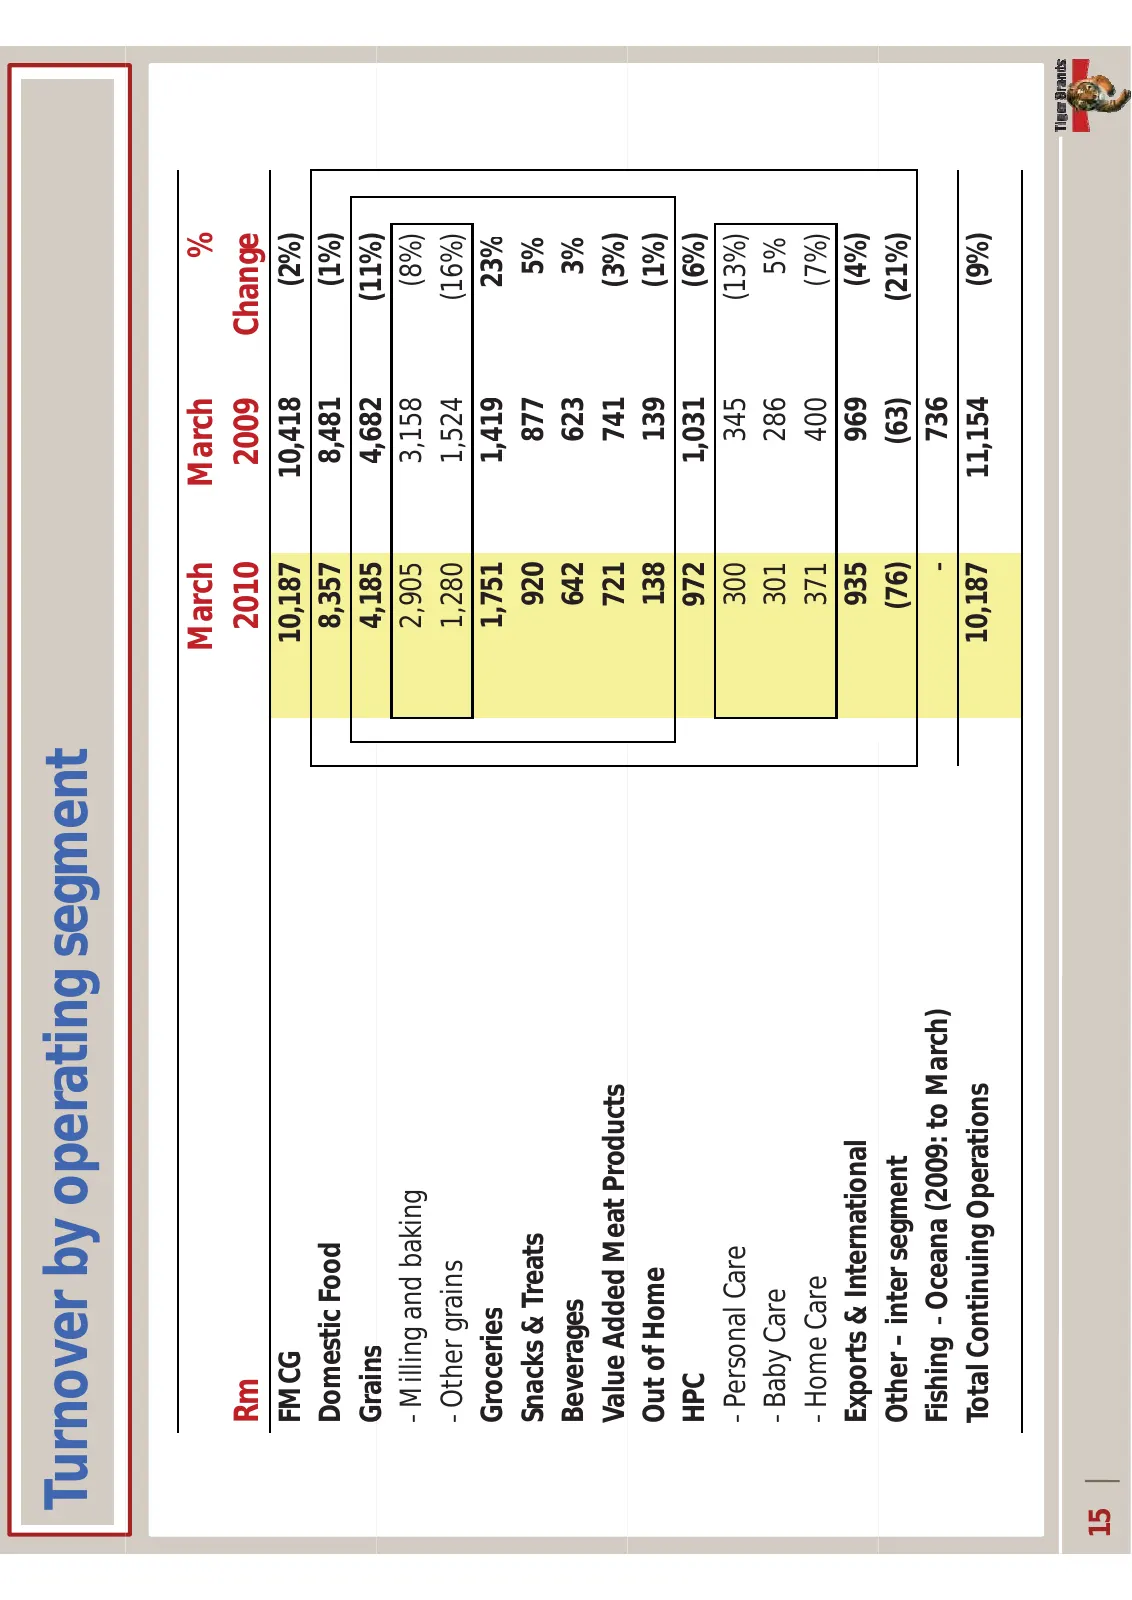
Slide 15: Turnover by operating segment
Turnoverbyoperatingsegment March March % Rm 2010 2009 Change FMCG 10,187 10,418 (2%) DomesticFood 8,357 8,481 (1%) Grains 4 185 4,185 4 682 4,682 (11%) Ͳ Millingandbaking 2,905 3,158 (8%) Ͳ Othergrains 1,280 1,524 (16%) Groceries 1,751 1,419 23% Snacks&Treats 920 877 5% Beverages 642 623 3% ValueAdd
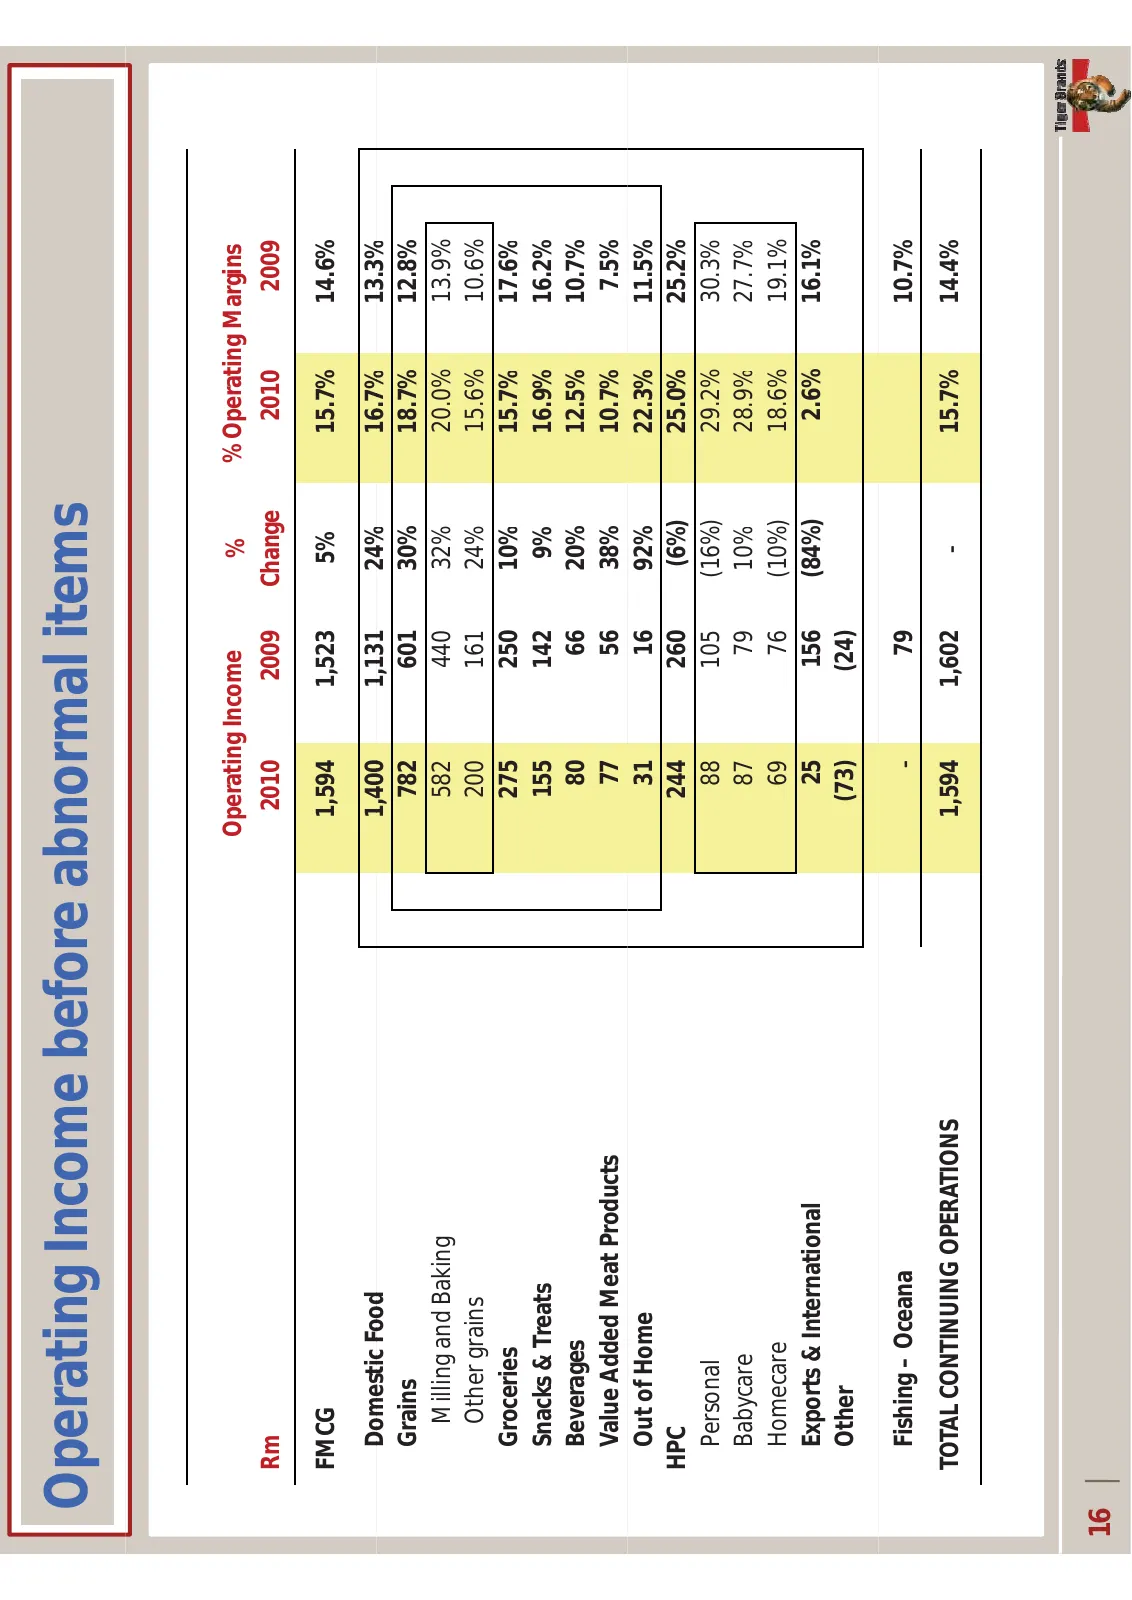
Slide 16: Operating Income before abnormal items
OperatingIncomebeforeabnormalitems OperatingIncome % %Operating Margins Rm 2010 2009 Change 2010 2009 FMCG 1,594 1,523 5% 15.7% 14.6% DomesticFood Domestic Food 1,400 1 400 1,131 1 131 24% 16.7% 16 7% 13.3% 13 3% Grains 782 601 30% 18.7% 12.8% MillingandBaking 582 440 32% 20.0% 13.9% Othergrains 200
Slide 17: Abnormal Items for Half-year ended March
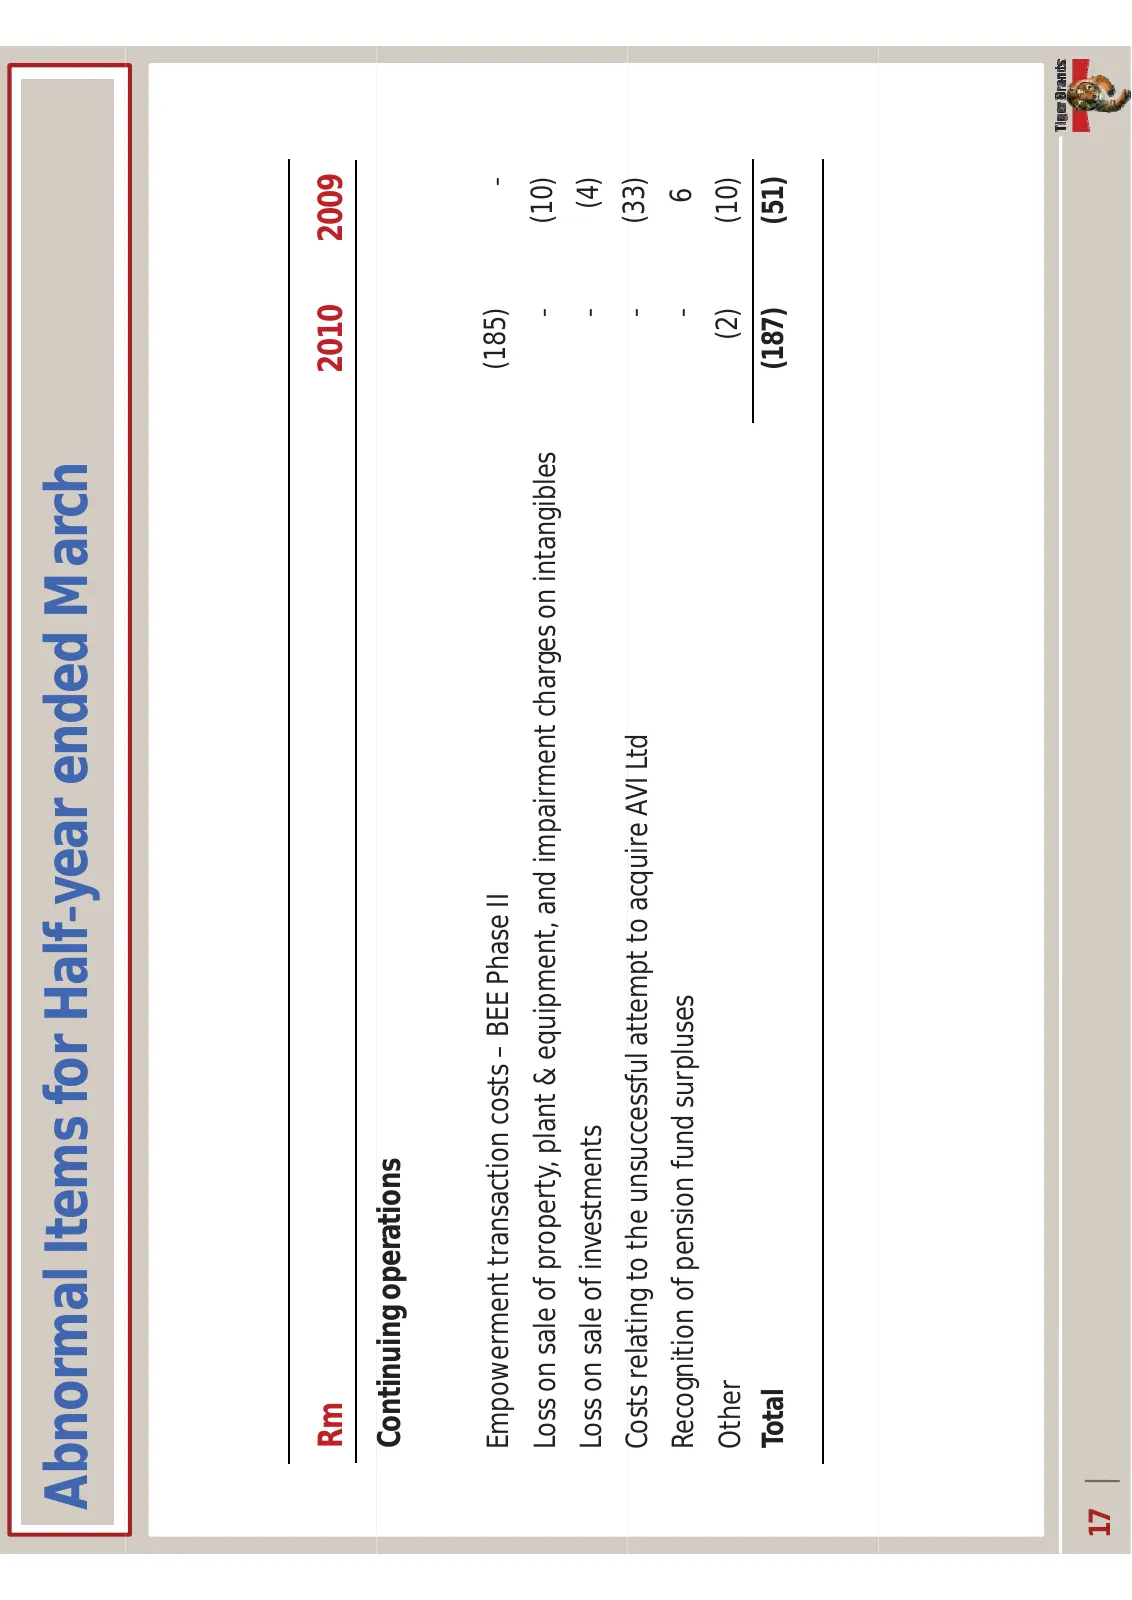
AbnormalItemsforHalfͲyearendedMarch Rm 2010 2009 Continuing operations Empowerment transaction costs – BEEPhaseII Empowermenttransactioncosts BEE Phase II (185) Ͳ Lossonsaleofproperty,plant&equipment,andimpairmentchargesonintangibles Ͳ (10) Lossonsaleofinvestments Ͳ (4) Costsrelatingtotheunsuccessfu
Slide 18: HEPS excluding once-off empowerment transaction costs
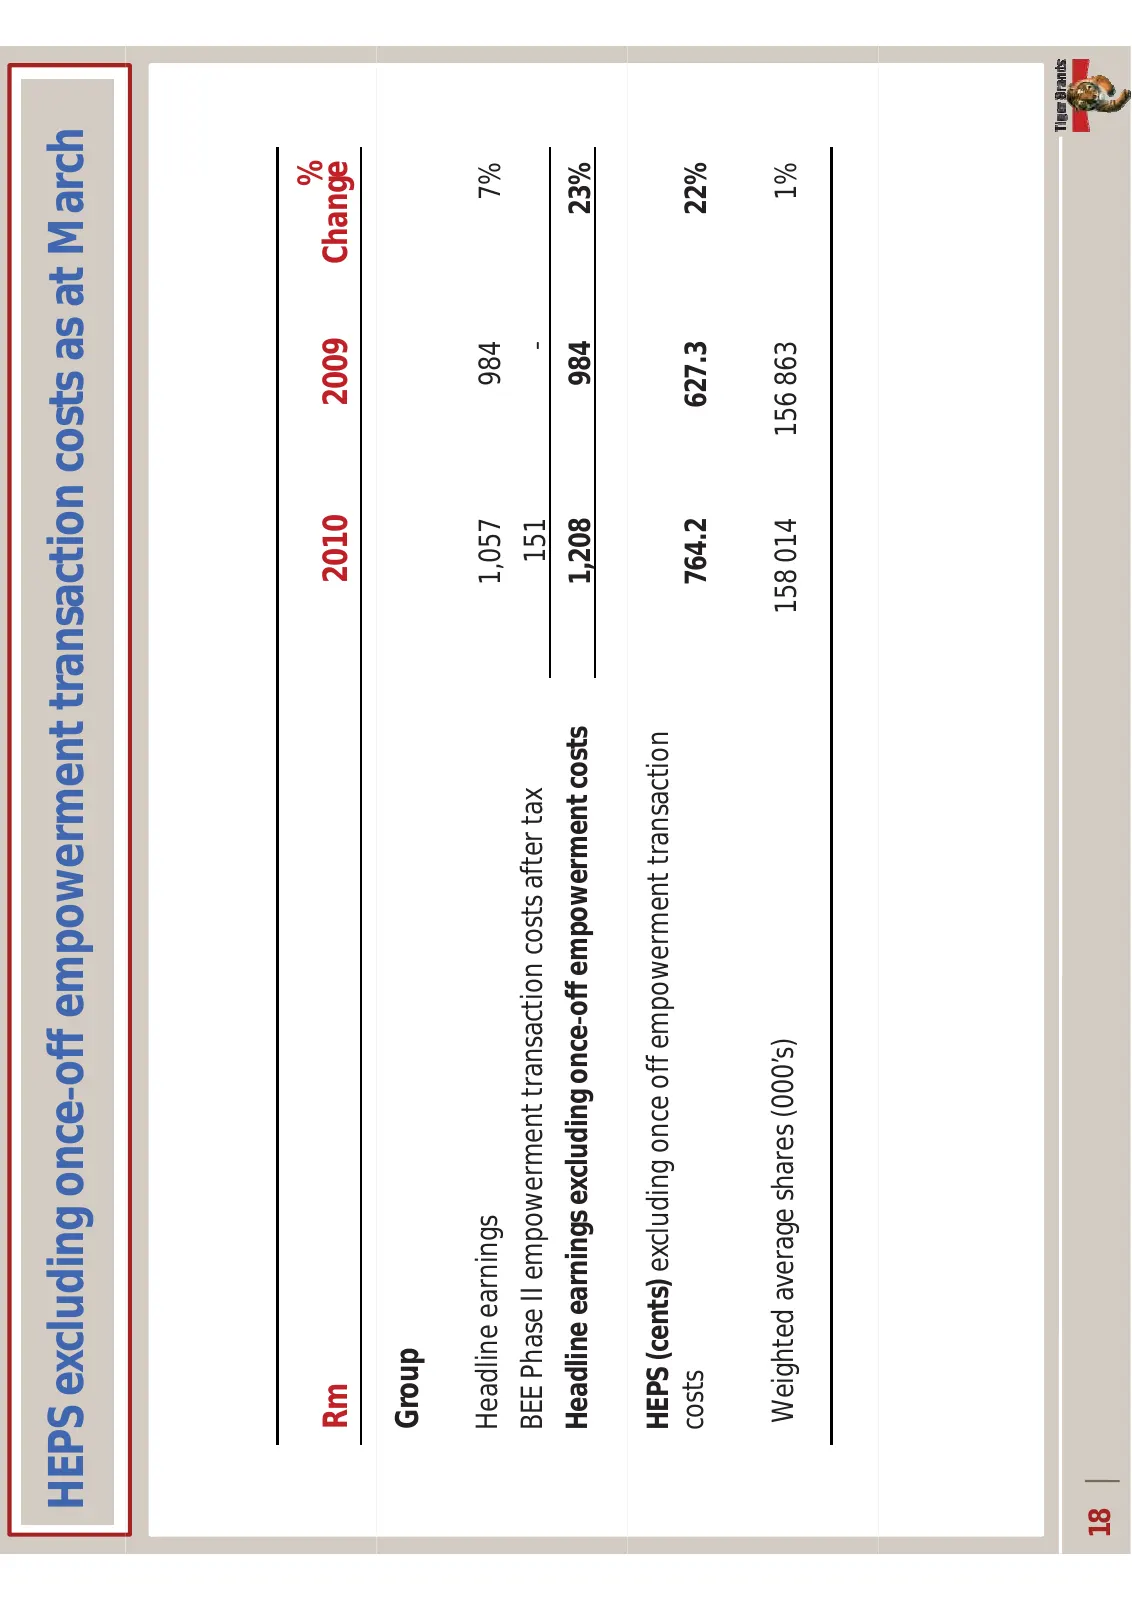
HEPSexcludingonceͲoffempowermenttransactioncostsasatMarch % Rm 2010 2009 Change Group Headlineearnings g 1,057 , 984 7% BEEPhaseIIempowermenttransactioncosts aftertax 151 Ͳ Headlineearningsexcluding onceͲoffempowermentcosts 1,208 984 23% HEPS(cents) excludingonceoffempowermenttransaction costs 764.2
Slide 19: Group Balance Sheet at March
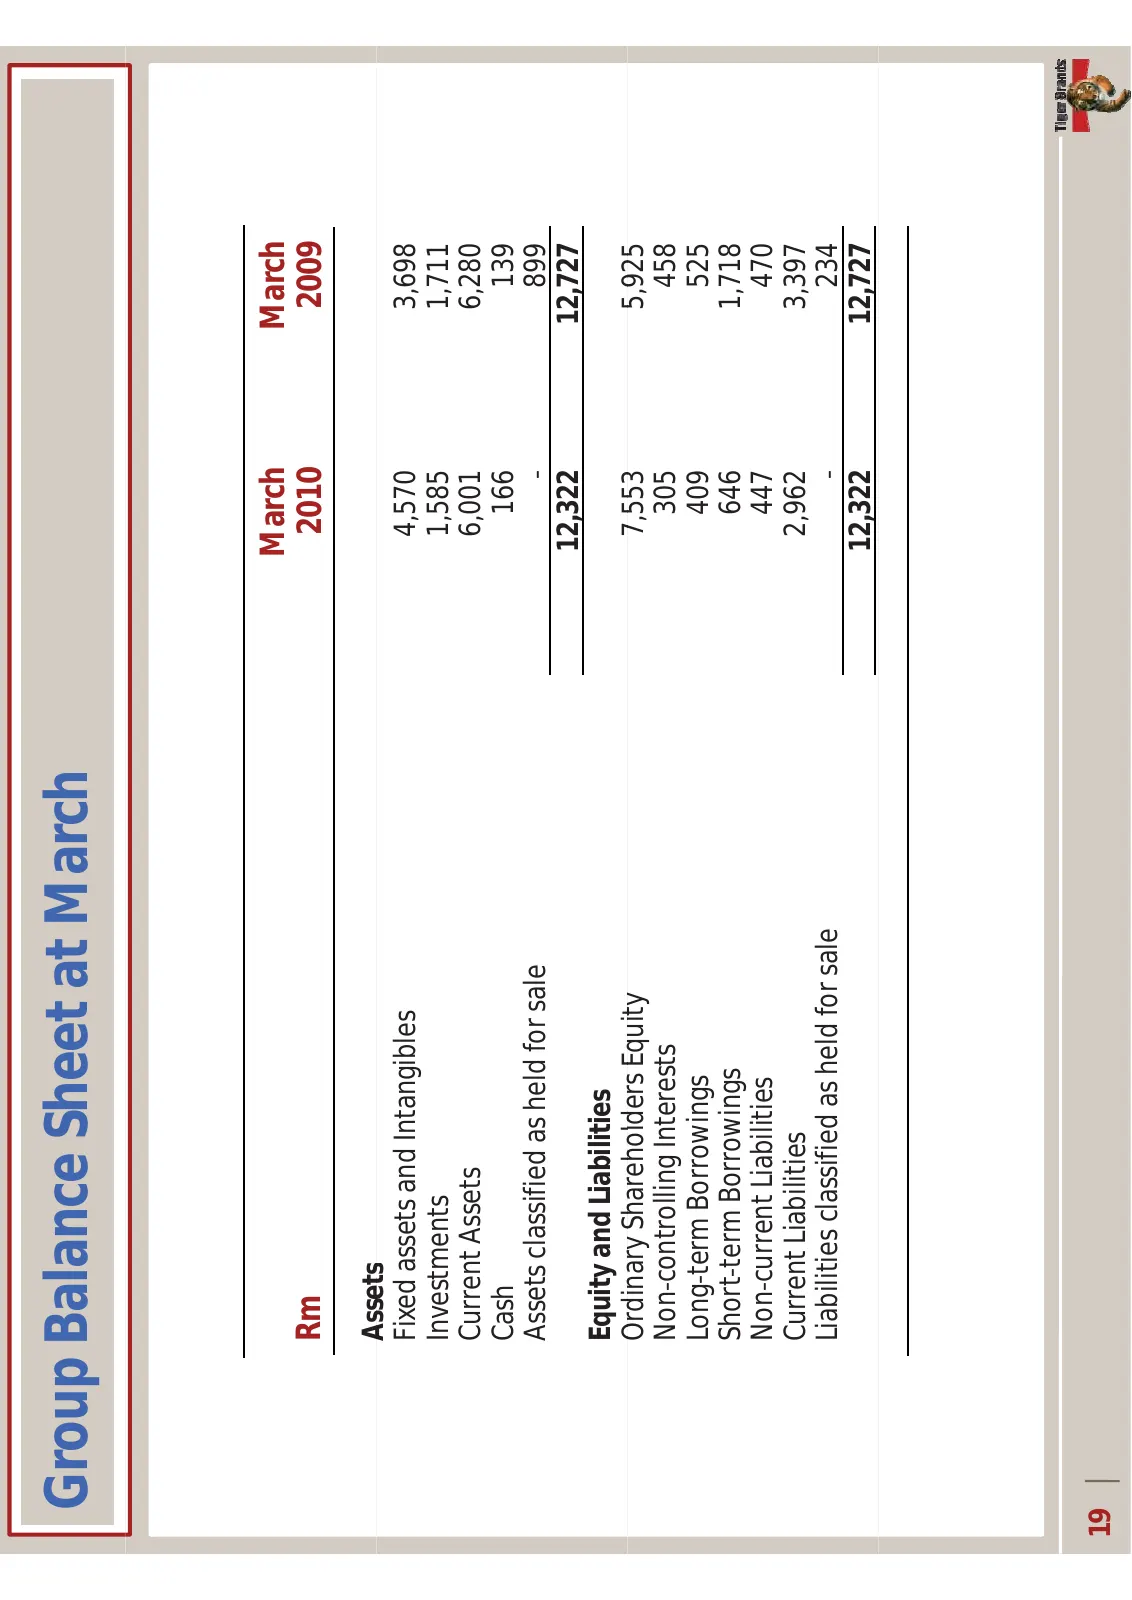
GroupBalanceSheetatMarch March March Rm 2010 2009 Assets FixedassetsandIntangibles 4,570 3,698 Investments 1,585 1,711 CurrentAssets 6,001 6,280 Cash Cash 166 139 Assetsclassifiedasheldforsale Ͳ 899 12,322 12,727 EquityandLiabilities O di OrdinaryShareholdersEquity Sh h ld E it 7,553 7 553 5,925 5 9
Slide 20: Key Statistics as at March
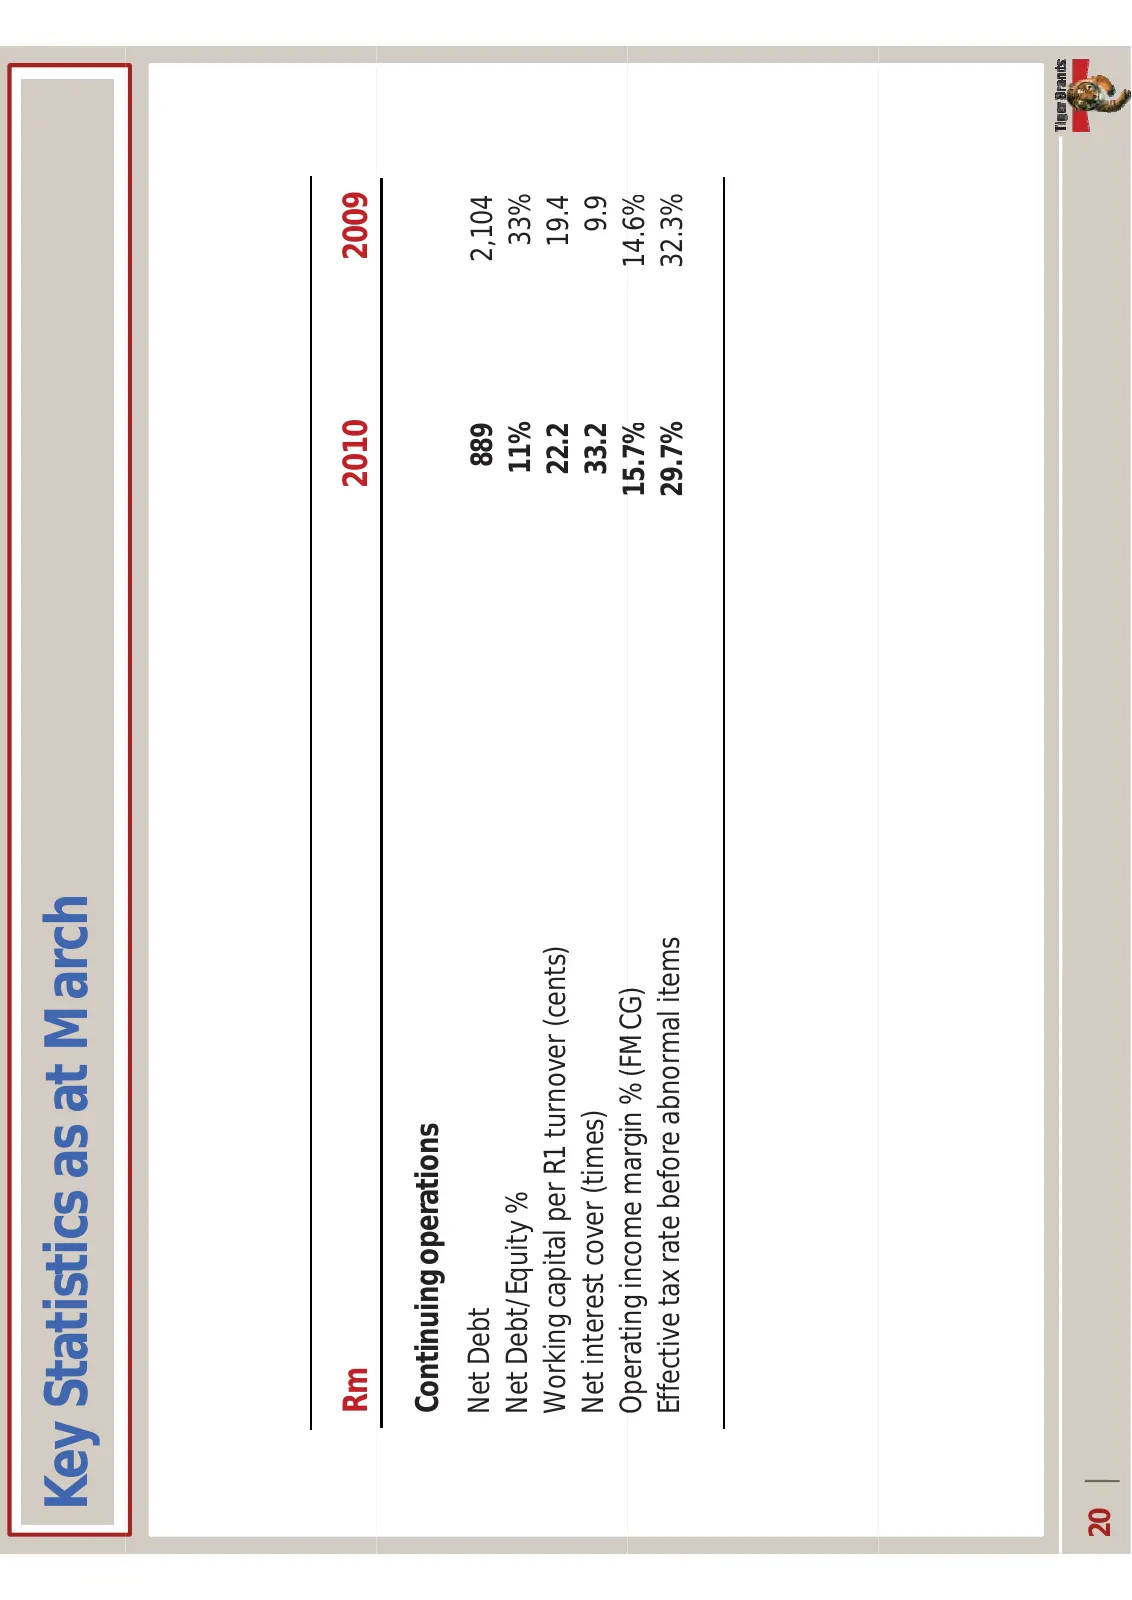
KeyStatisticsasatMarch Rm 2010 2009 Continuing operations NetDebt 889 2,104 NetDebt/Equity% 11% 33% WorkingcapitalperR1turnover(cents) 22.2 19.4 Netinterestcover(times) 33.2 9.9 Operating income margin %(FMCG) Operatingincomemargin % (FMCG) 15 7% 15.7% 14 6% 14.6% Effectivetaxratebeforeabnormalitems
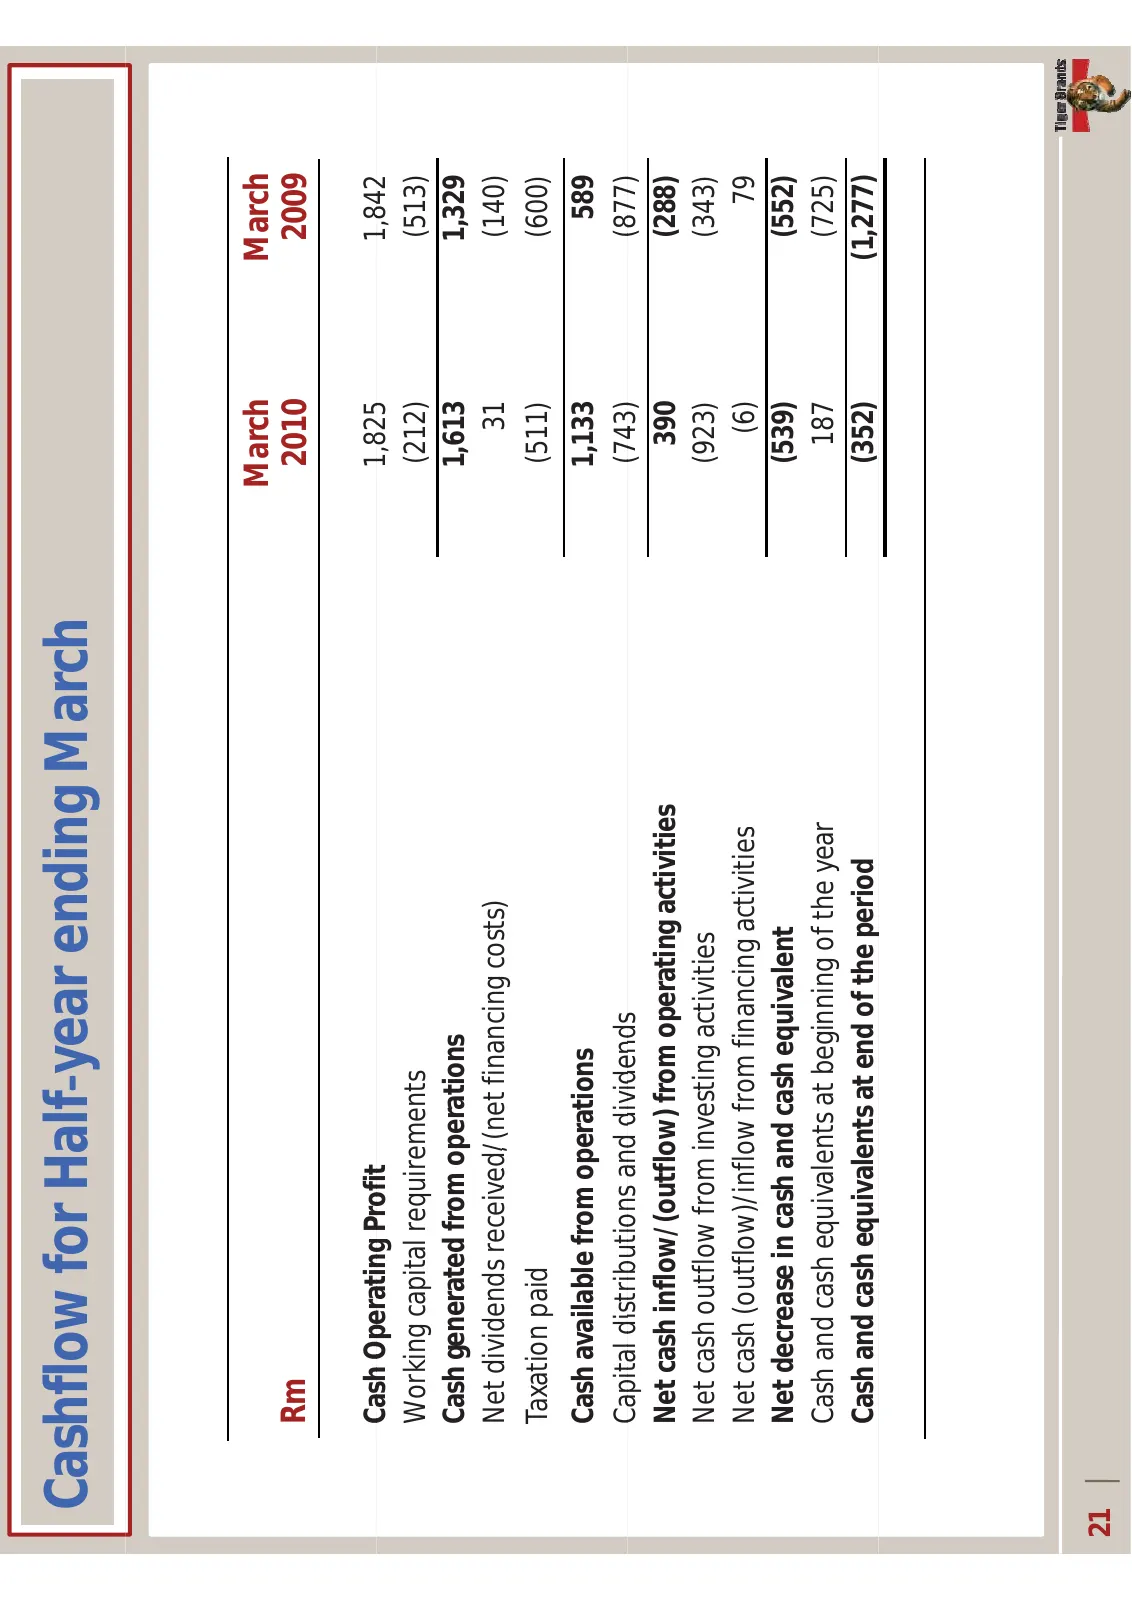
Slide 21: Cashflow for Half-year ending March
CashflowforHalfͲyearendingMarch March M h March M h Rm 2010 2009 CashOperating Cash Operating Profit 1,825 1 825 1,842 1 842 Workingcapitalrequirements (212) (513) Cashgeneratedfromoperations 1,613 1,329 Net dividends received/(net financing costs) Netdividendsreceived/(netfinancingcosts) 31 (140) T
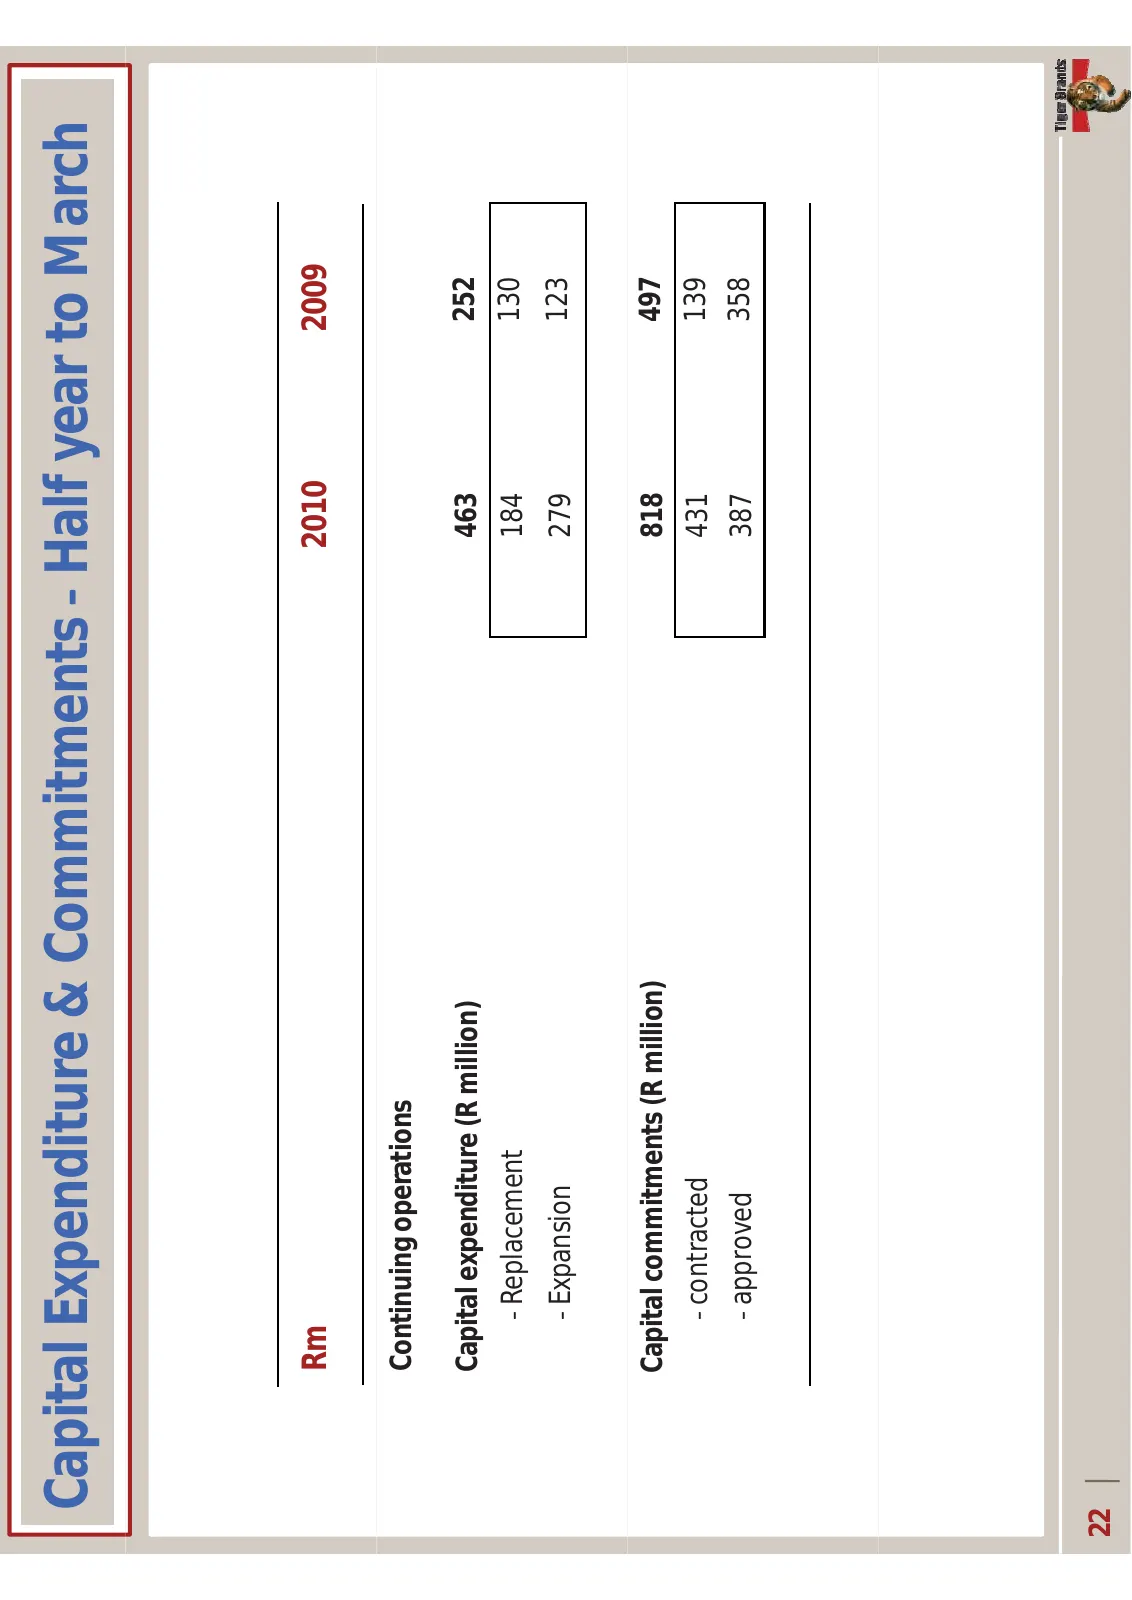
Slide 22: Capital Expenditure & Commitments
CapitalExpenditure&CommitmentsͲ HalfyeartoMarch Rm 2010 2009 Continuing operations Capitalexpenditure(Rmillion) 463 252 Ͳ Replacement 184 130 Ͳ Expansion 279 123 Capitalcommitments(Rmillion) 818 497 Ͳ contracted 431 139 pp Ͳ approved 387 358 22
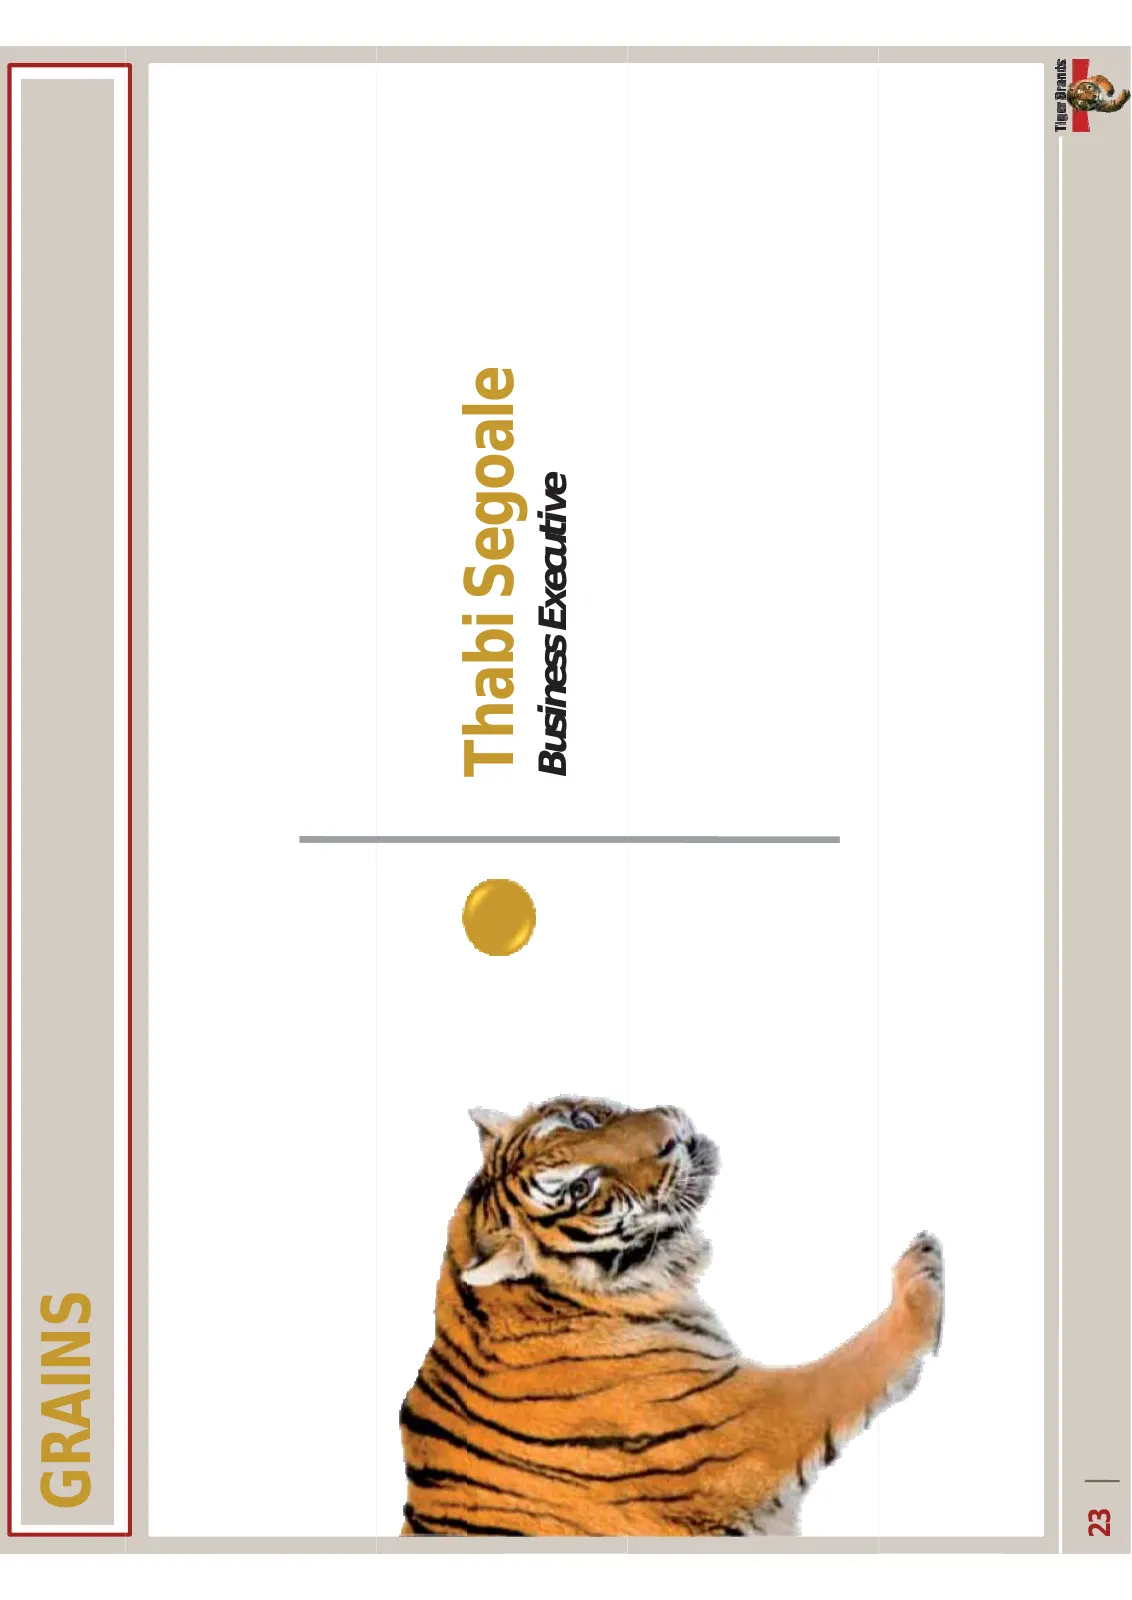
Slide 23: Grains
GRAINS Thabi Segoale ThabiSegoale BusinessExecutive 23
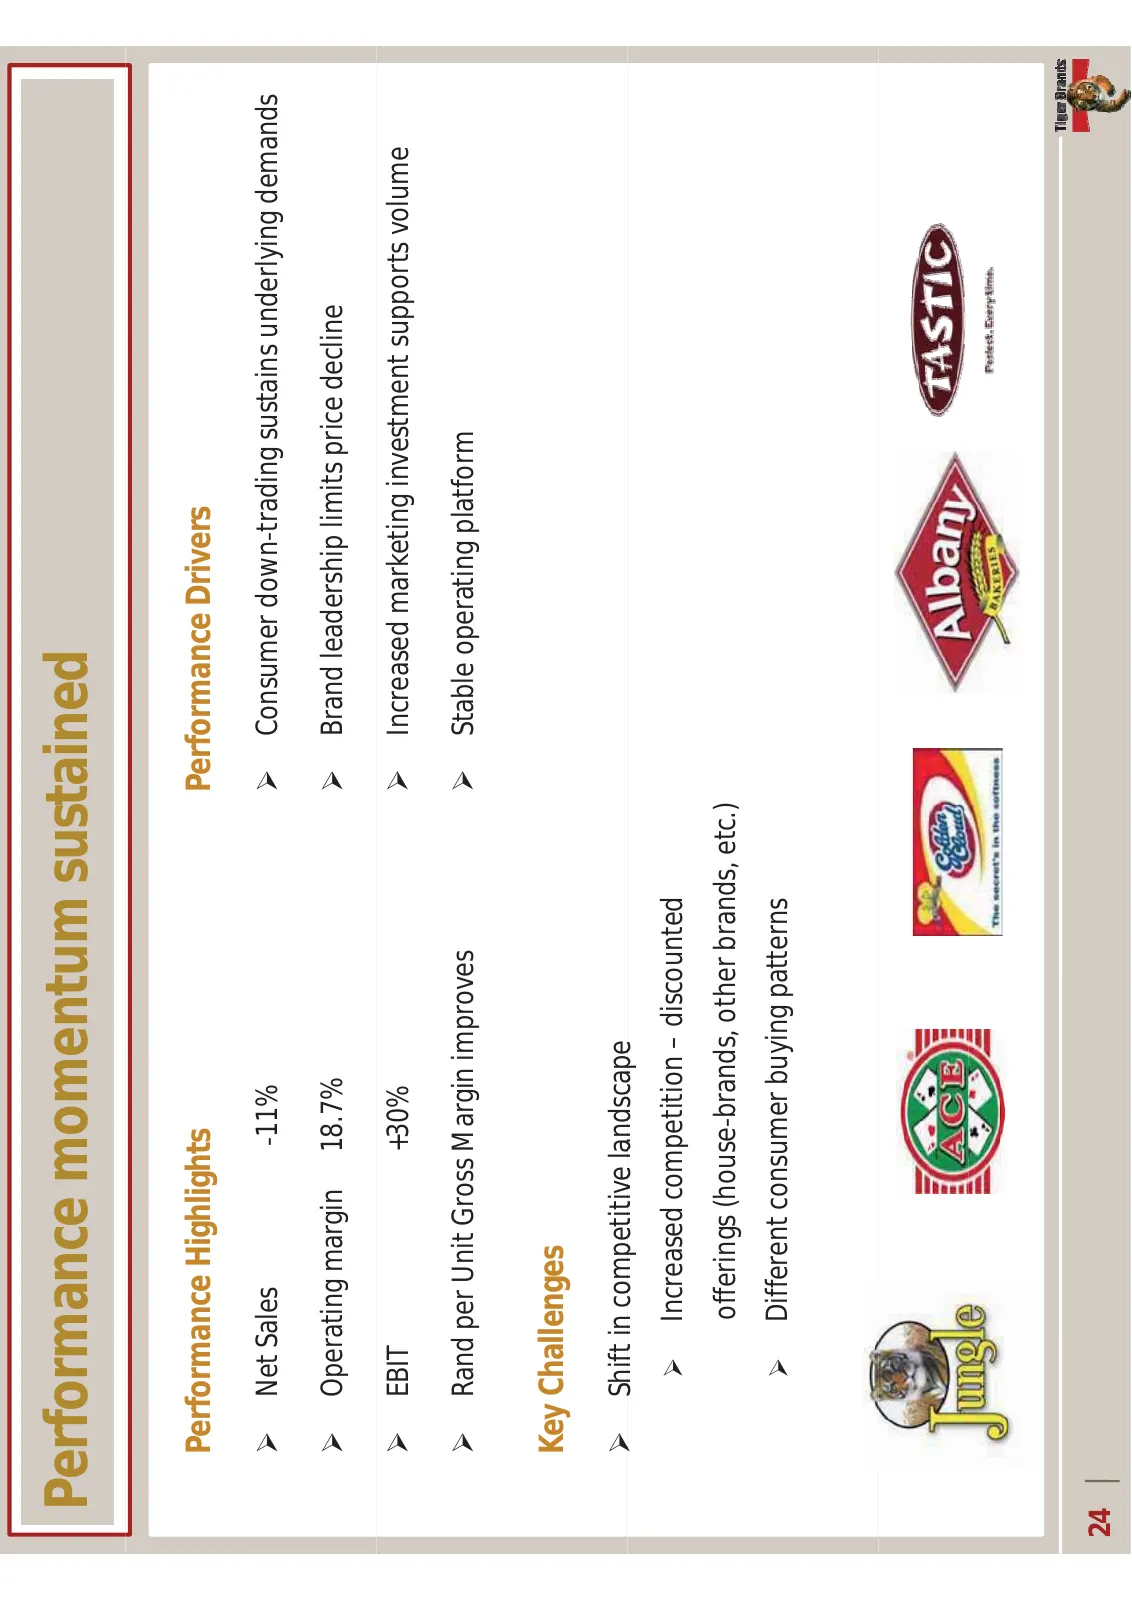
Slide 24: Performance momentum sustained
Performancemomentumsustained PerformanceHighlights PerformanceDrivers ¾ NetSales Ͳ11% ¾ ConsumerdownͲtradingsustainsunderlyingdemands ¾ Operatingmargin 18.7% ¾ Brandleadershiplimitspricedecline ¾ EBIT +30% ¾ Increasedmarketinginvestmentsupportsvolume ¾ RandperUnitGrossMarginimproves ¾ Stableoperatin
Slide 25: Maize Milling
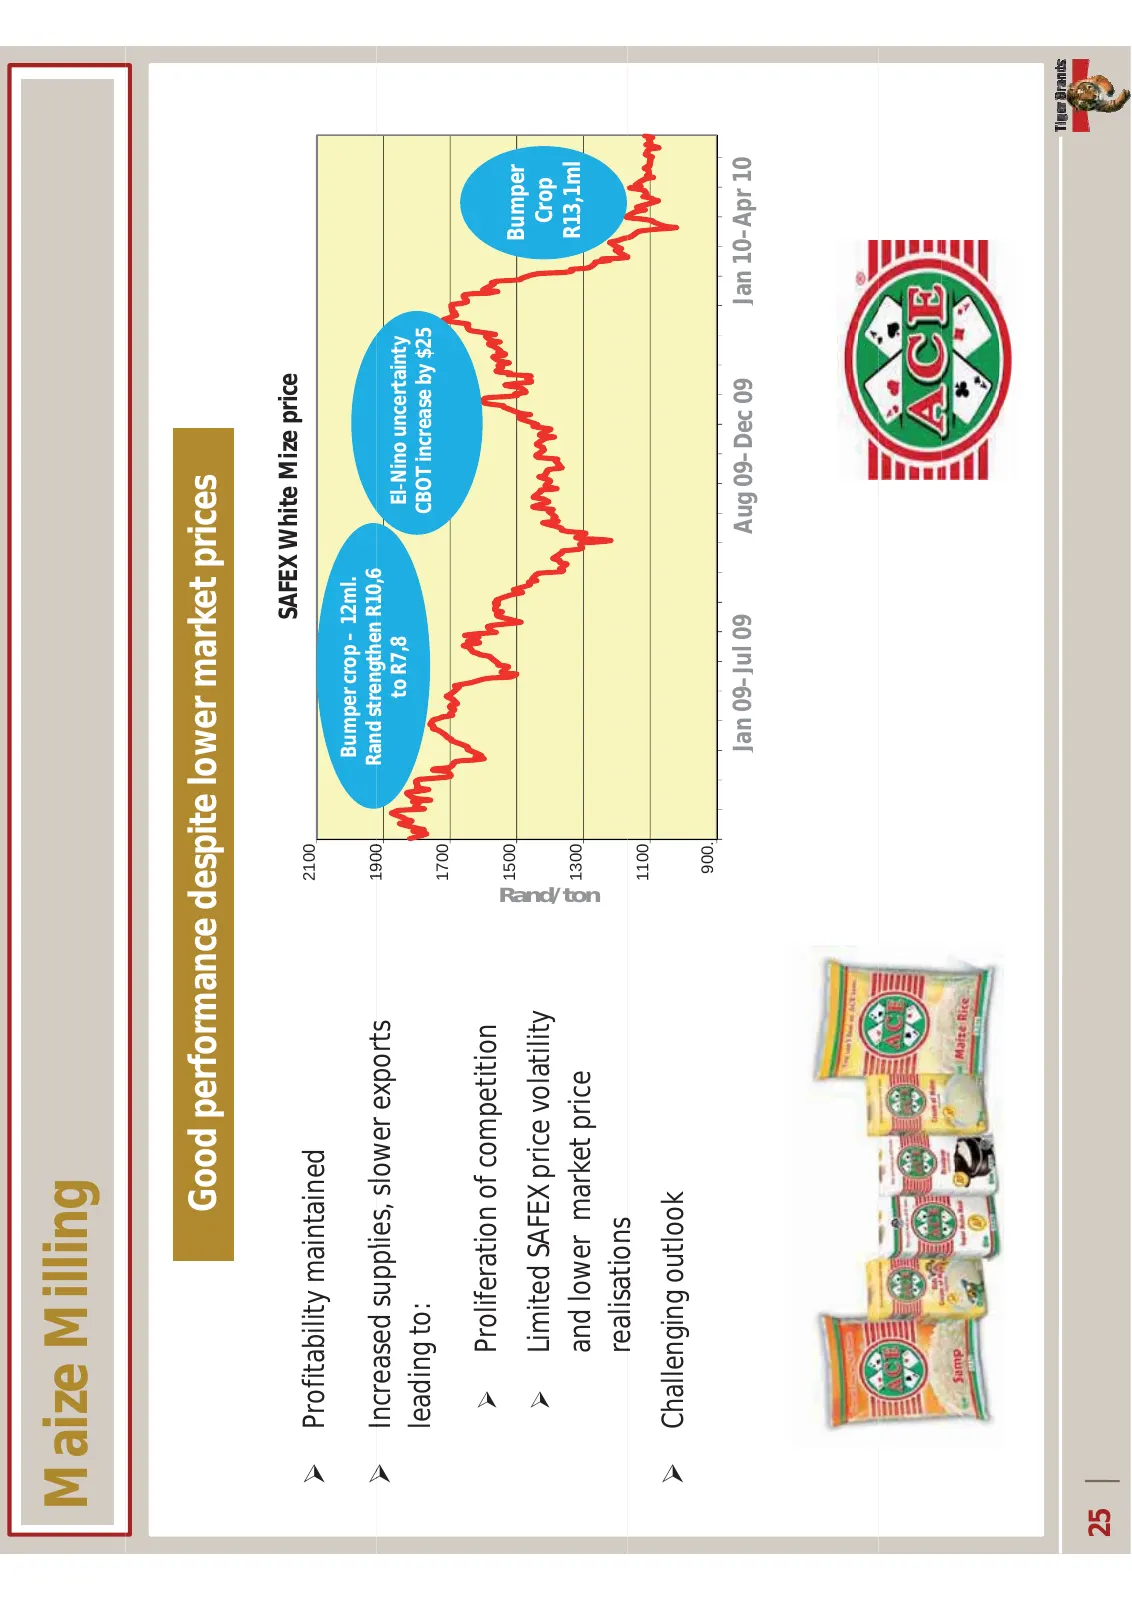
MaizeMilling Goodperformancedespitelowermarketprices SAFEXWhiteMizeprice 2100 ¾ Profitabilitymaintained Bumpercrop– 12ml. 1900 Rand strengthenR10,6 strengthen R10 6 ¾ IIncreasedsupplies,slowerexports d li l t toR7,8 ElͲNinouncertainty leadingto: CBOTincreaseby$25 1700 ¾ Proliferationofcompetition R
Slide 26: Wheat Milling & Baking
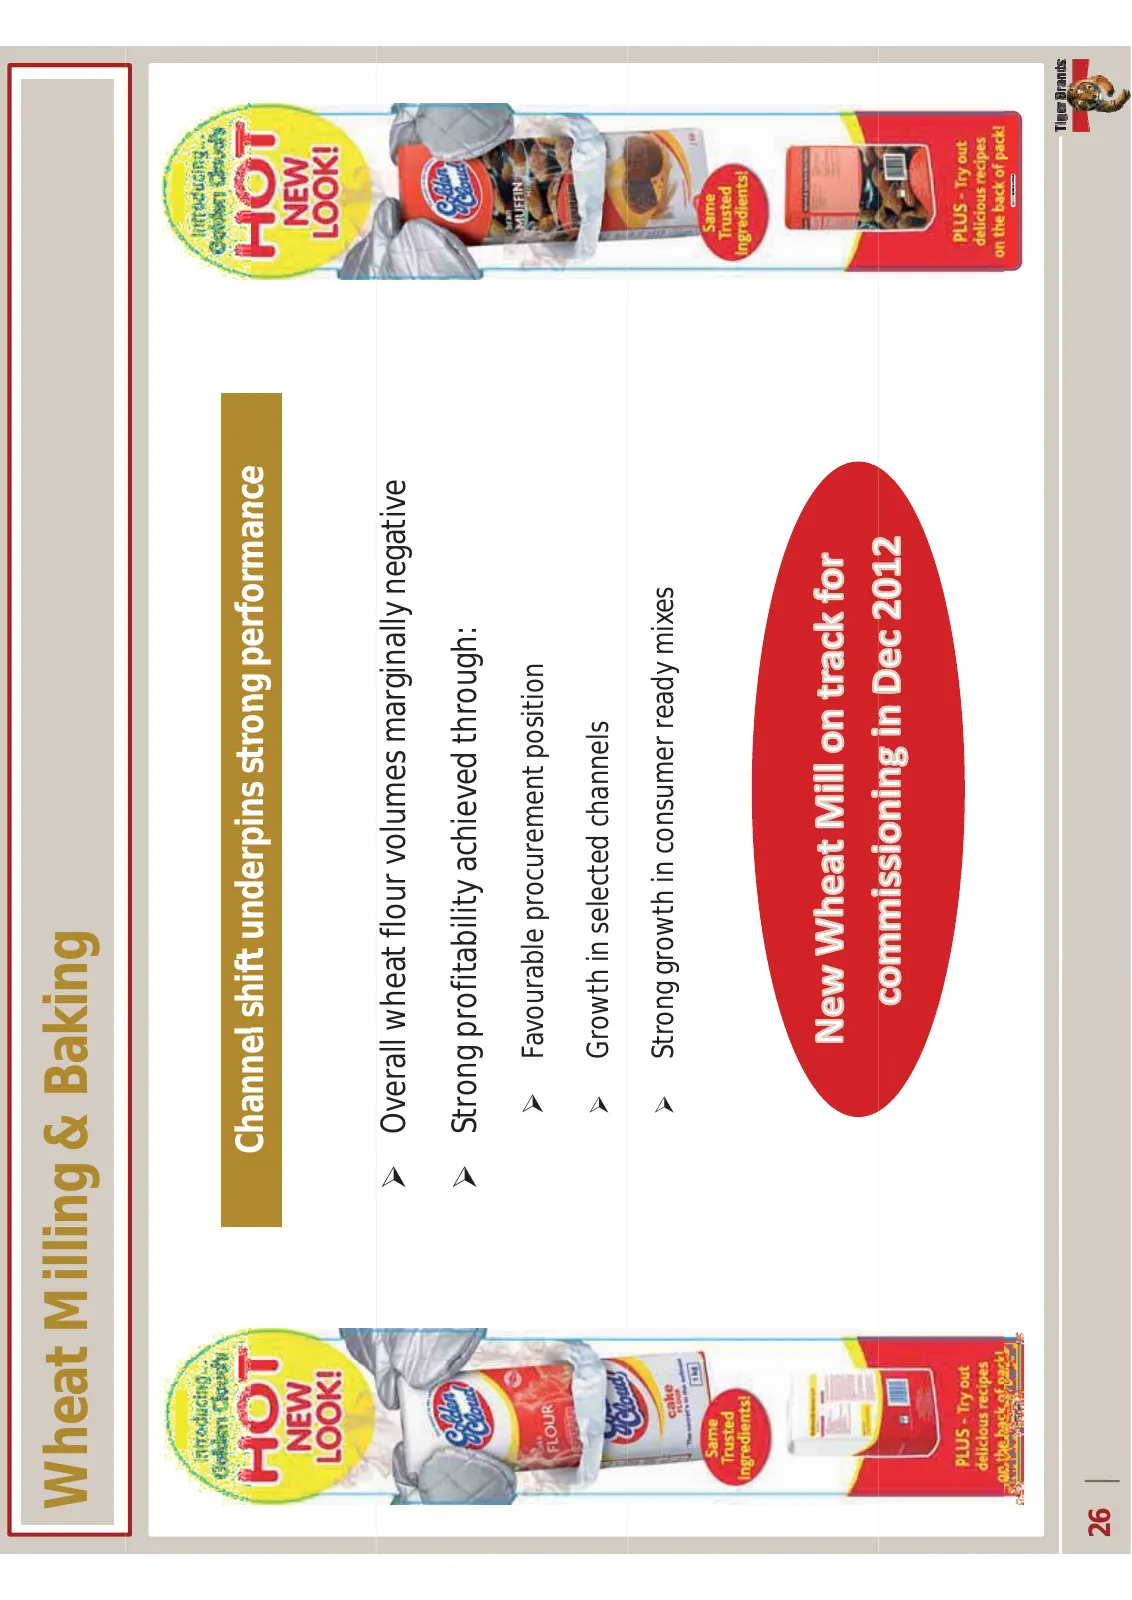
WheatMilling&Baking Channel shift underpins strong performance Channelshiftunderpinsstrongperformance ¾ Overallwheatflourvolumesmarginallynegative ¾ Strongprofitabilityachievedthrough: ¾ Favourableprocurementposition ¾ Growthinselectedchannels ¾ Stronggrowthinconsumerreadymixes 26
Slide 27: Wheat Milling & Baking: Albany
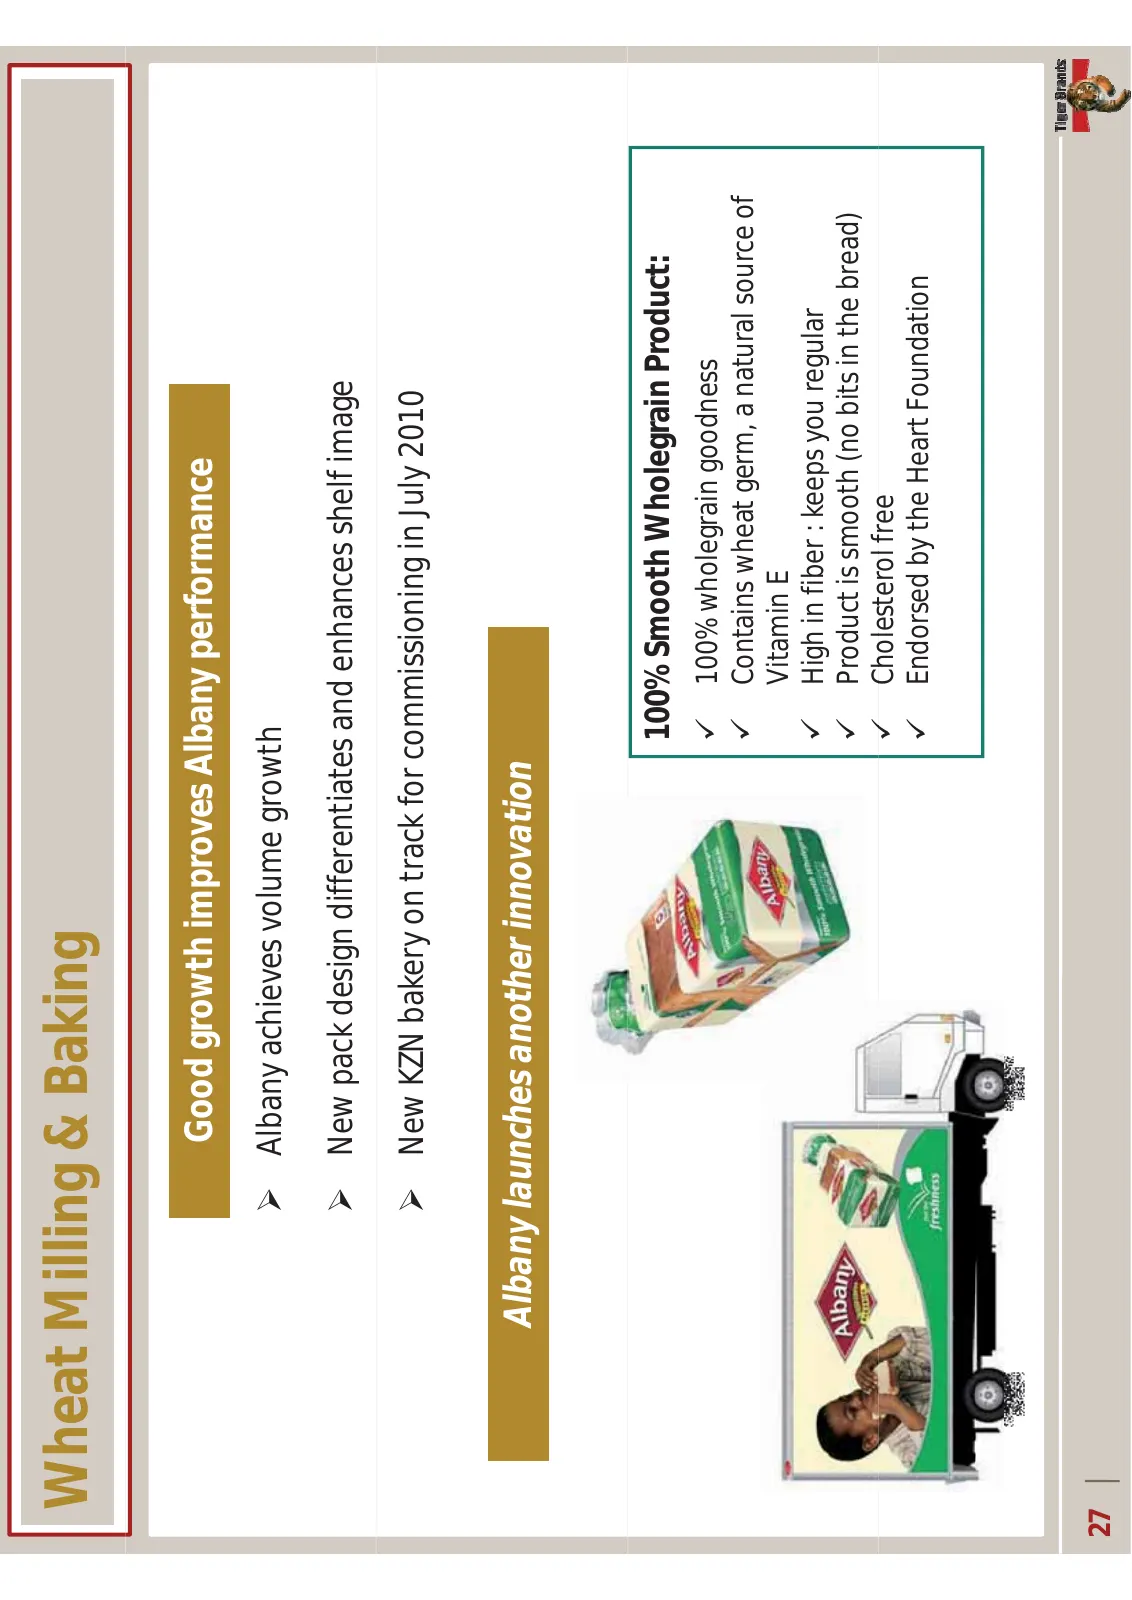
WheatMilling&Baking GoodgrowthimprovesAlbanyperformance ¾ Albanyachievesvolumegrowth ¾ Newpackdesigndifferentiatesandenhancesshelfimage ¾ NewKZNbakeryontrackforcommissioninginJuly2010 Albanylaunchesanotherinnovation 100%SmoothWholegrainProduct: 9 100%wholegraingoodness 9 Co ta s eat ge , a atu a sou
Slide 28: Tastic Rice
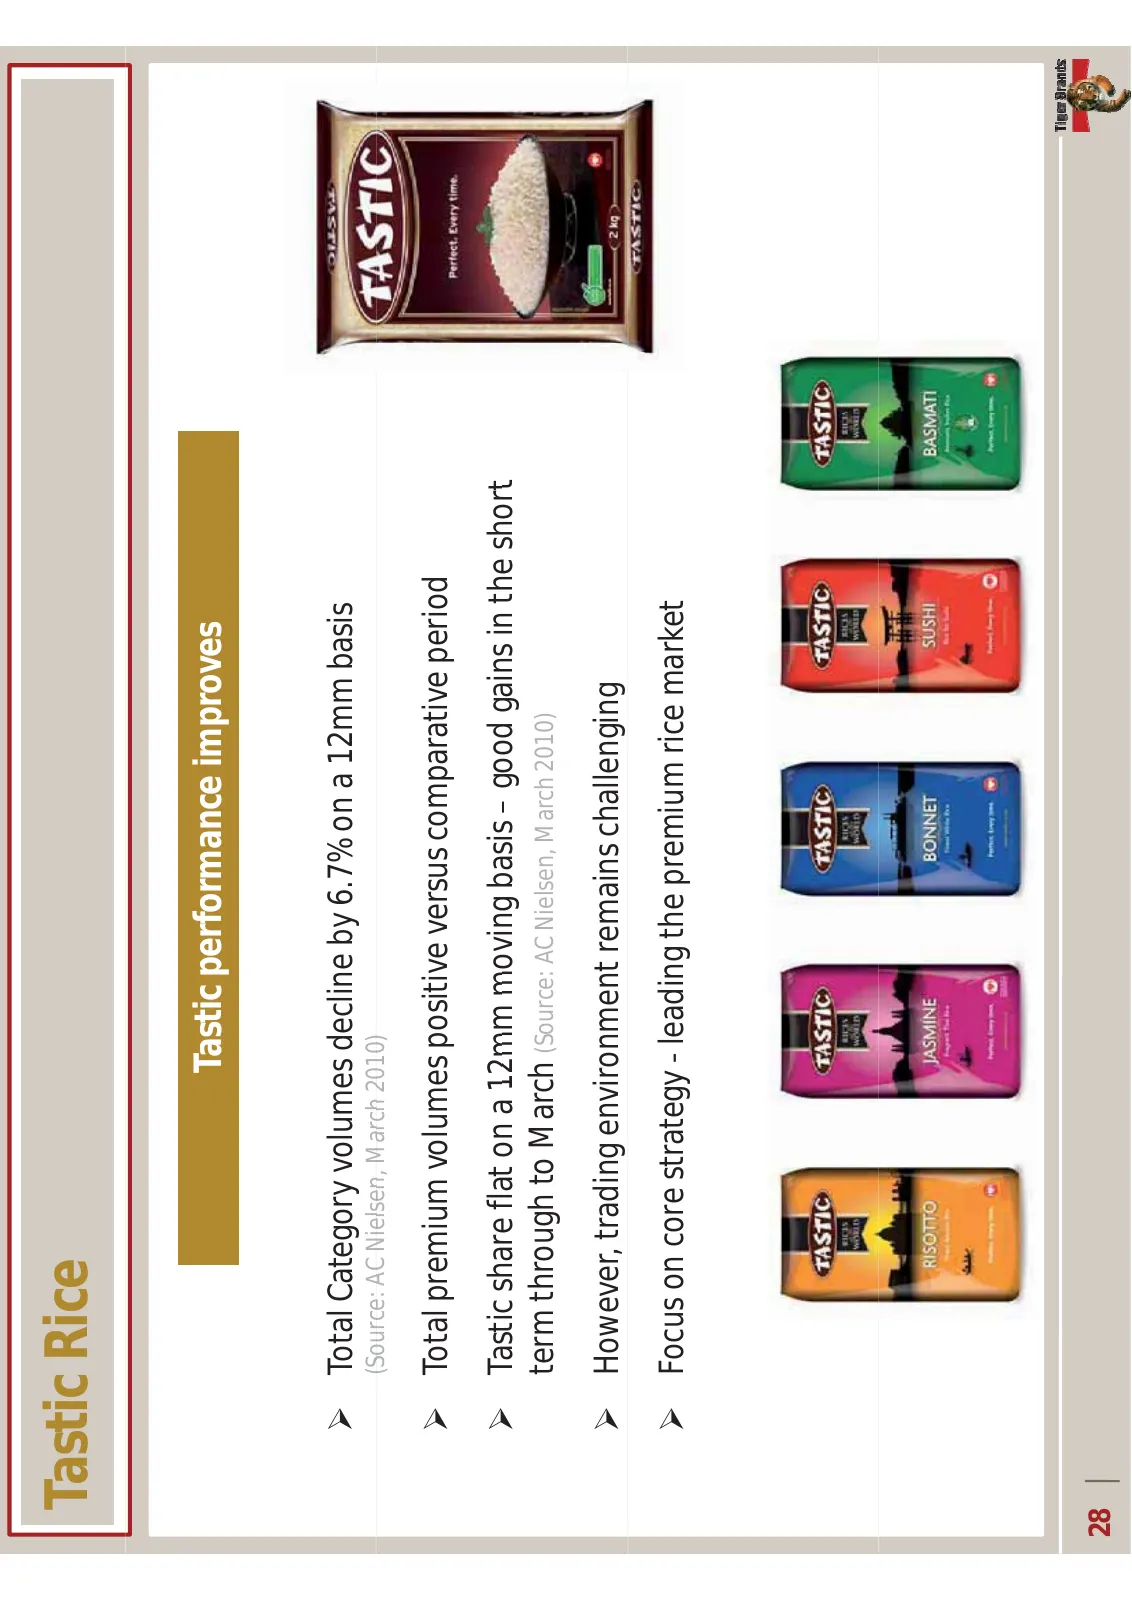
TasticRice Tasticperformanceimproves ¾ TotalCategoryvolumesdeclineby6.7%ona12mmbasis (Source: AC Nielsen March 2010) (Source:ACNielsen,March2010) ¾ Totalpremiumvolumespositiveversuscomparativeperiod ¾ Tastic Tasticshareflatona12mmmovingbasis– share flat on a 12mm moving basis goodgainsintheshort goo
Slide 29: Breakfast Cereals
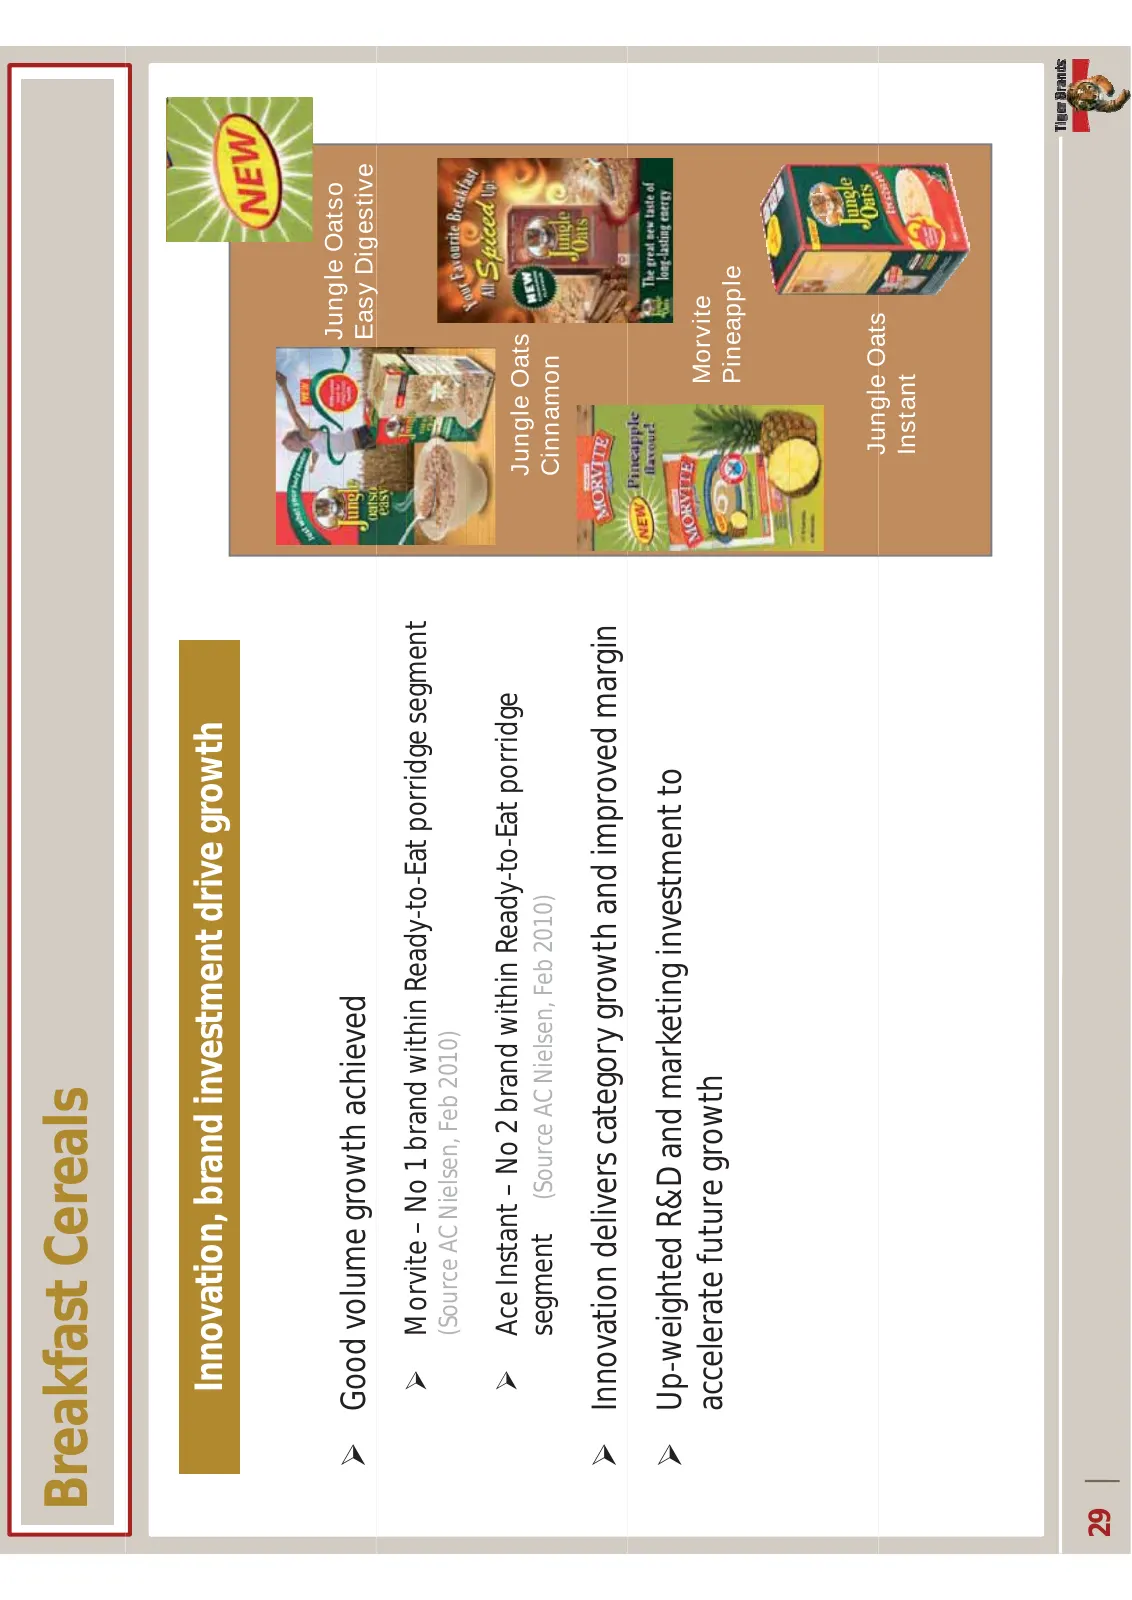
BreakfastCereals Innovation,brandinvestmentdrivegrowth Jungle Oatso ¾ Goodvolumegrowthachieved Easy y Digestive g ¾ Morvite– No1brandwithinReadyͲtoͲEatporridgesegment (SourceACNielsen,Feb2010) ¾ AceInstant– A I t t No2brandwithinReadyͲtoͲEatporridge N 2 b d ithi R d t E t id Jungle Oats segment(Sour
Slide 30: Summary - Grains
SUMMARYͲ GRAINS ¾ Performanceobjectivesachieved ¾ Keyoperationalfundamentalswellhoned ¾ Keygrowthdrivers: ¾ ReͲdefinedmarketuniverse ¾ Increasedmarketpenetration ¾ Brandinvestmentandinnovation 30
Slide 31: Consumer Brands
CONSUMERBRANDS Neil Brimacombe NeilBrimacombe ExecutiveDirector 31
Slide 32: Groceries
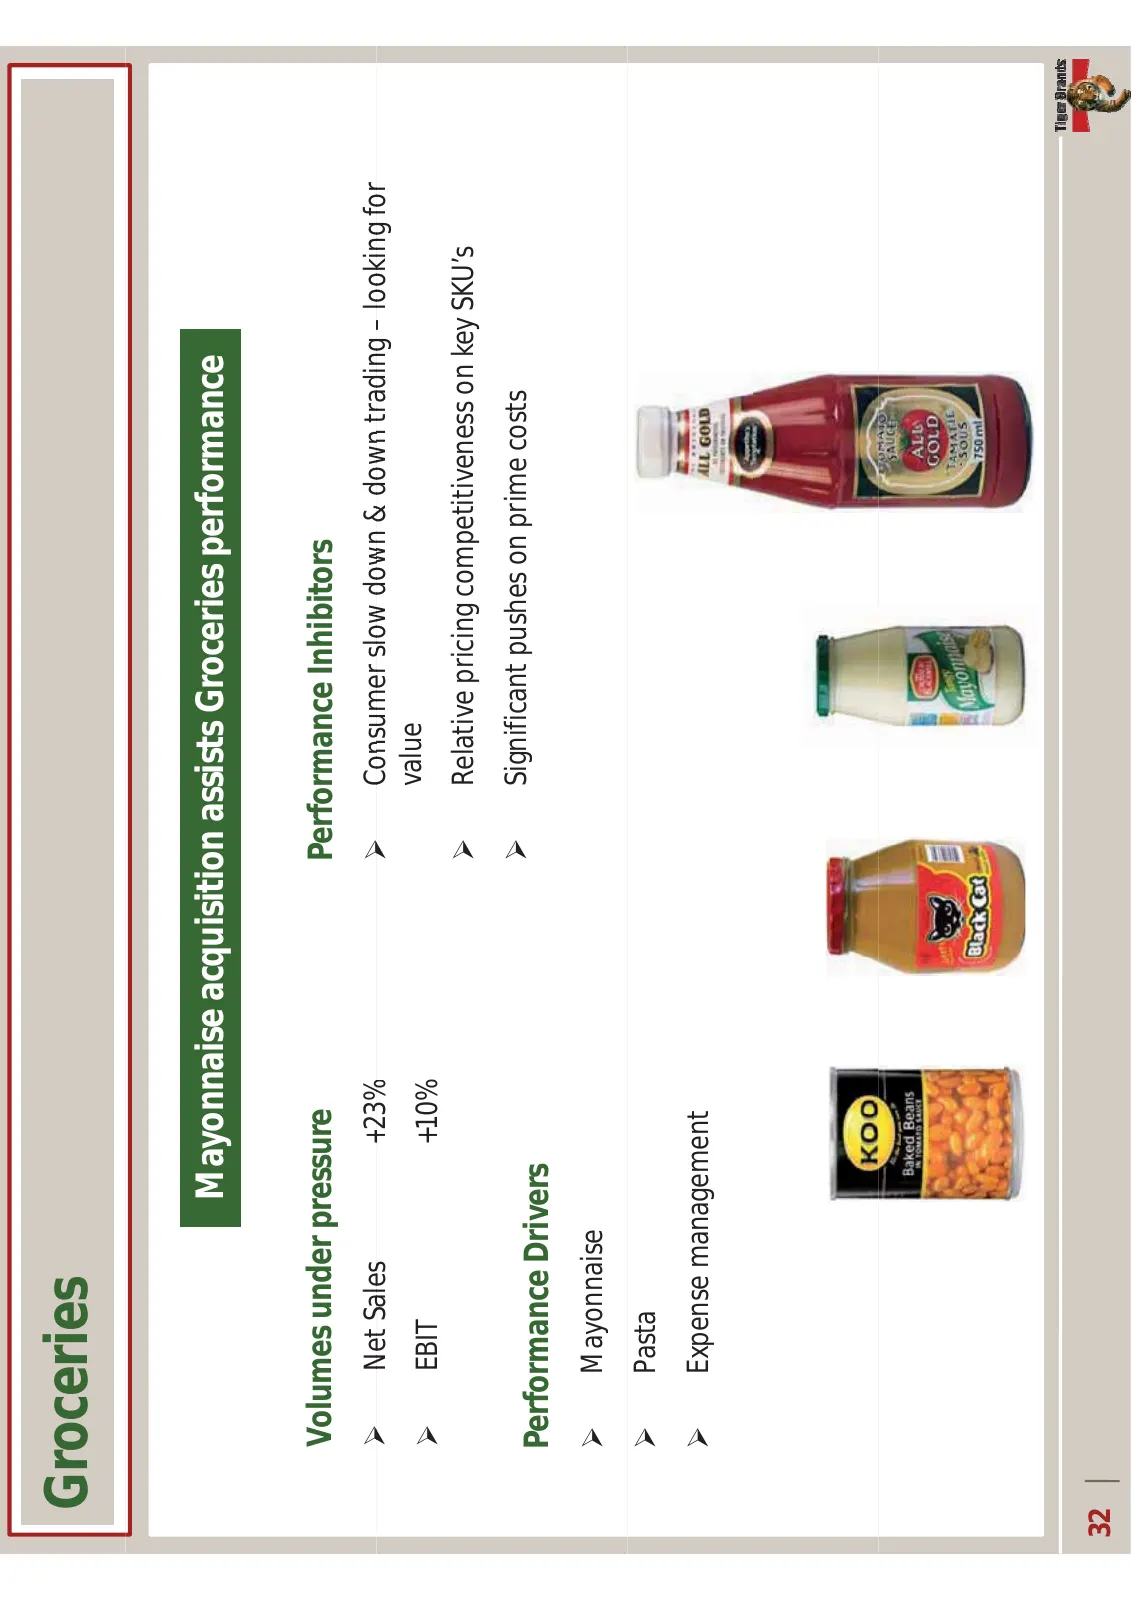
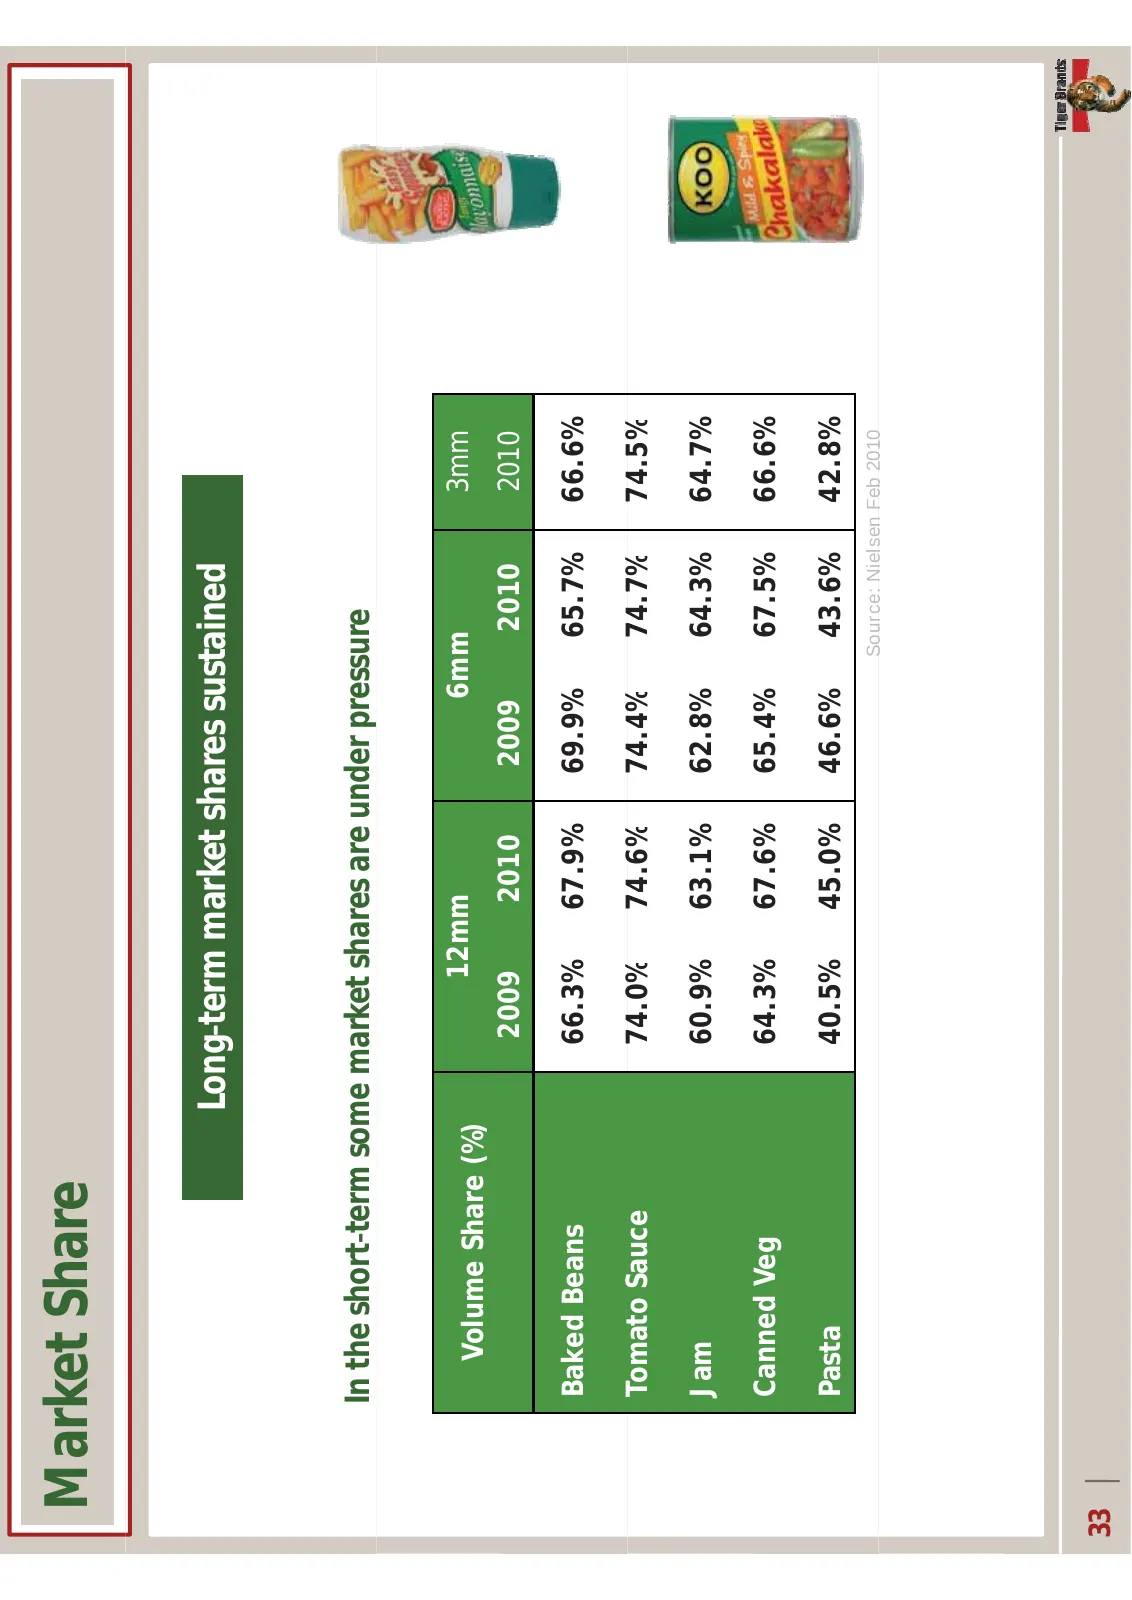
Groceries MayonnaiseacquisitionassistsGroceriesperformance Volumesunderpressure PerformanceInhibitors ¾ Net Sales NetSales +23% ¾ Consumerslowdown&downtrading– Consumer slow down & down trading lookingfor looking for value ¾ EBIT +10% ¾ RelativepricingcompetitivenessonkeySKU’s ¾ Significantpushesonp
Slide 33: Market Share
MarketShare LongͲtermmarketsharessustained IntheshortͲtermsomemarketsharesareunderpressure 12mm 6mm 3mm Volume Share (%) 2009 2010 2009 2010 2010 Baked Beans 66.3% 67.9% 69.9% 65.7% 66.6% T Tomato Sauce S 74 0% 74.0% 74 6% 74.6% 74 4% 74.4% 74 7% 74.7% 74 5% 74.5% Jam 60.9% 63.1% 62.8% 64.3% 64.7% C
Slide 34: Crosse & Blackwell Acquisition
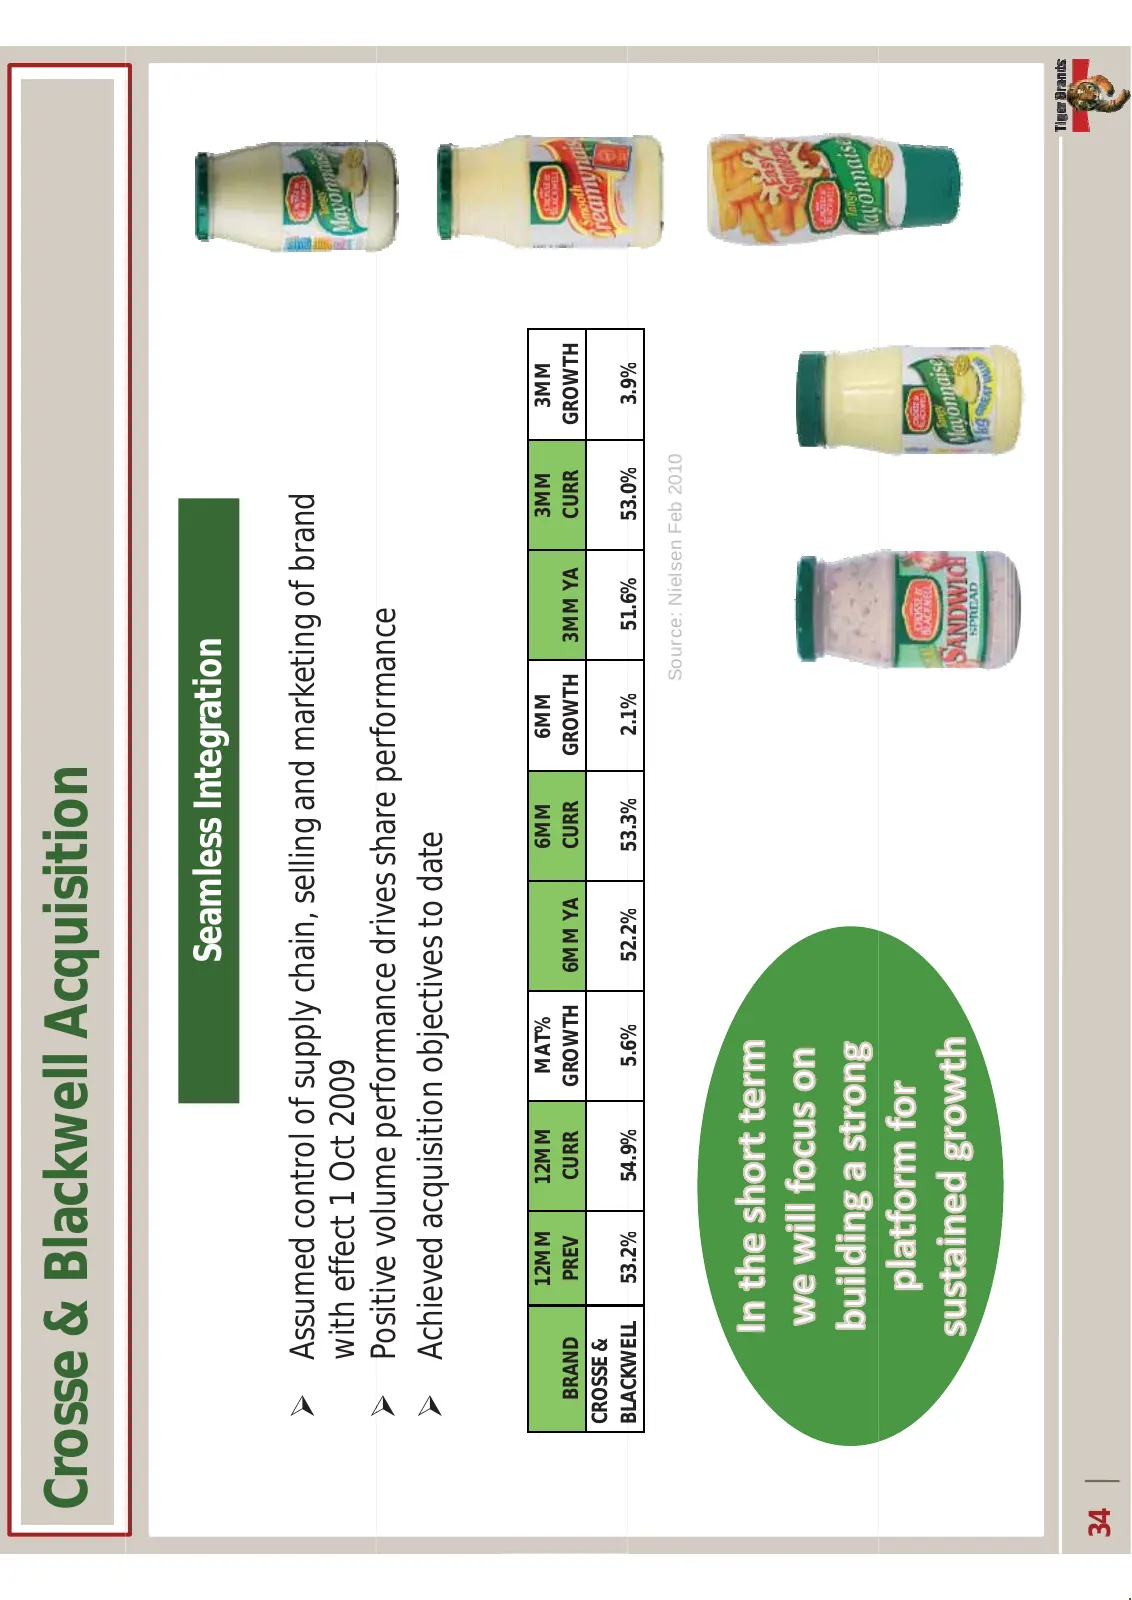
Crosse&BlackwellAcquisition SeamlessIntegration ¾ Assumedcontrolofsupplychain,sellingandmarketingofbrand witheffect1Oct2009 ¾ Positivevolumeperformancedrivesshareperformance P iti l f di h f ¾ Achievedacquisitionobjectivestodate 12MM 12MM MAT% 6MM 6MM 3MM 3MM BRAND PREV CURR GROWTH 6MMYA CURR GROWTH
Slide 35: Sustained Investment Behind Core Brands
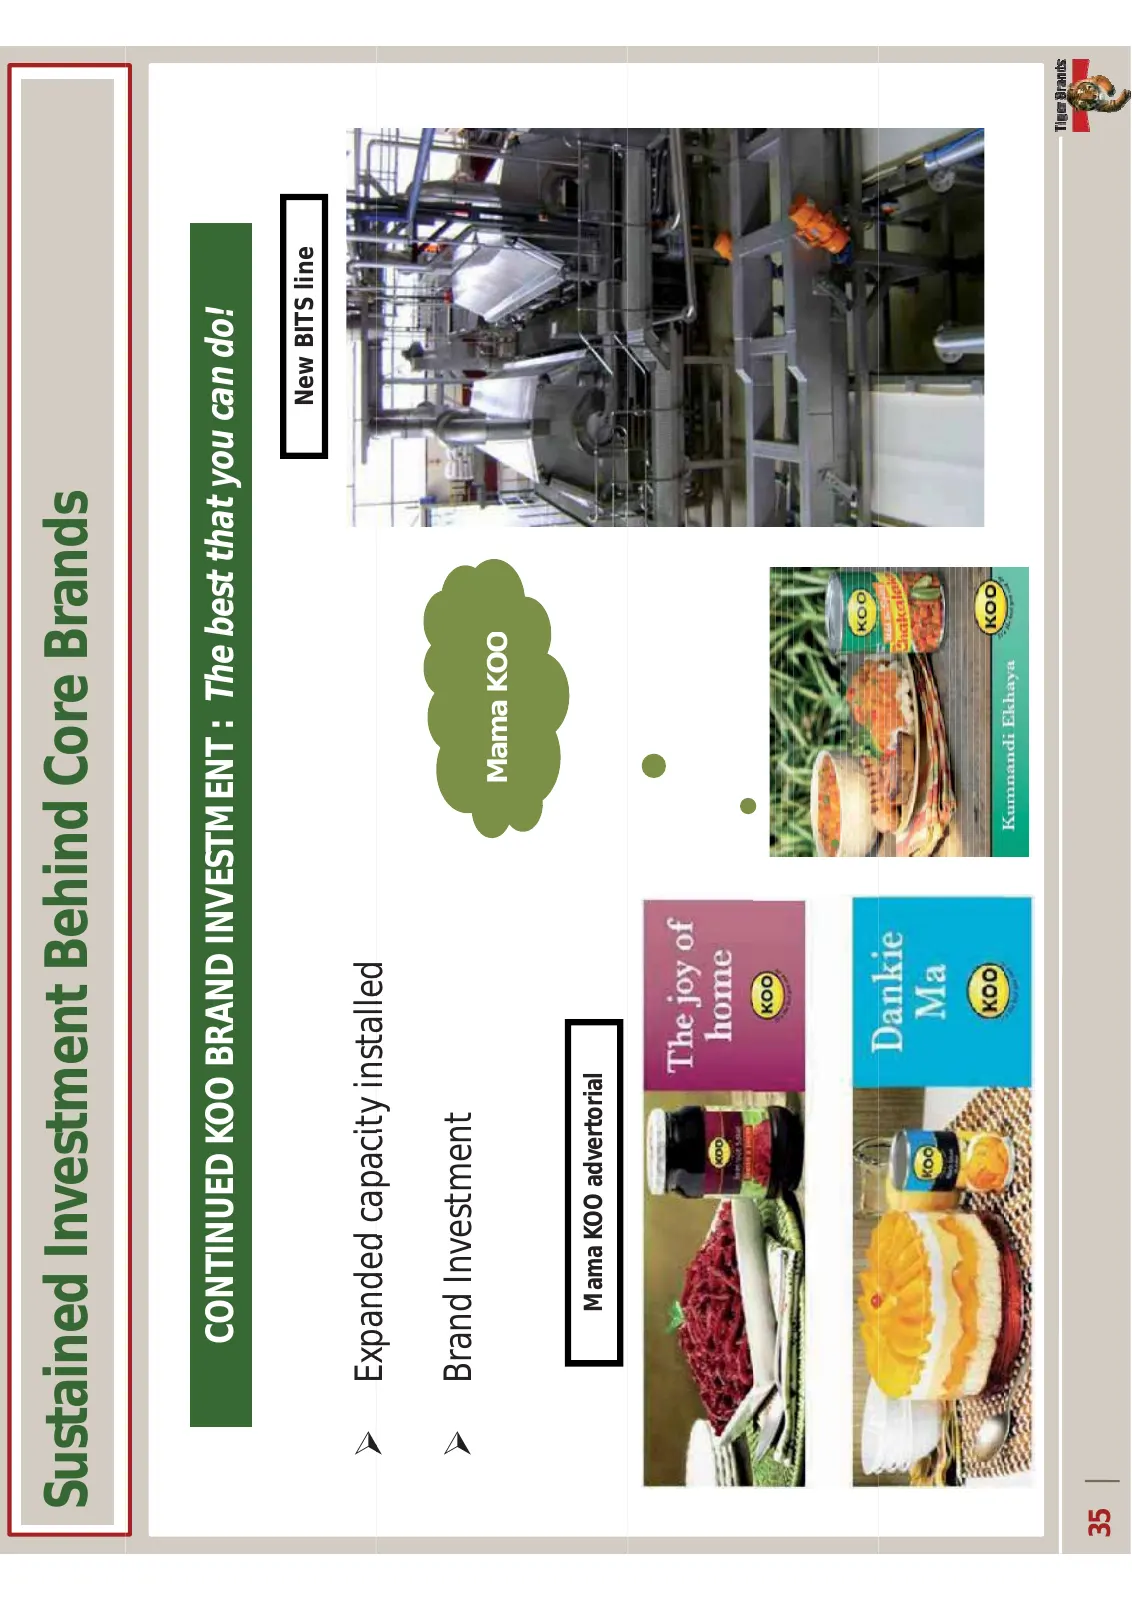
SustainedInvestmentBehindCoreBrands CONTINUEDKOOBRANDINVESTMENT:Thebestthatyoucando! New BITS line ¾ Expanded capacity installed Expandedcapacityinstalled ¾ BrandInvestment Mama KOO MamaKOOadvertorial 35
Slide 36: Snacks & Treats
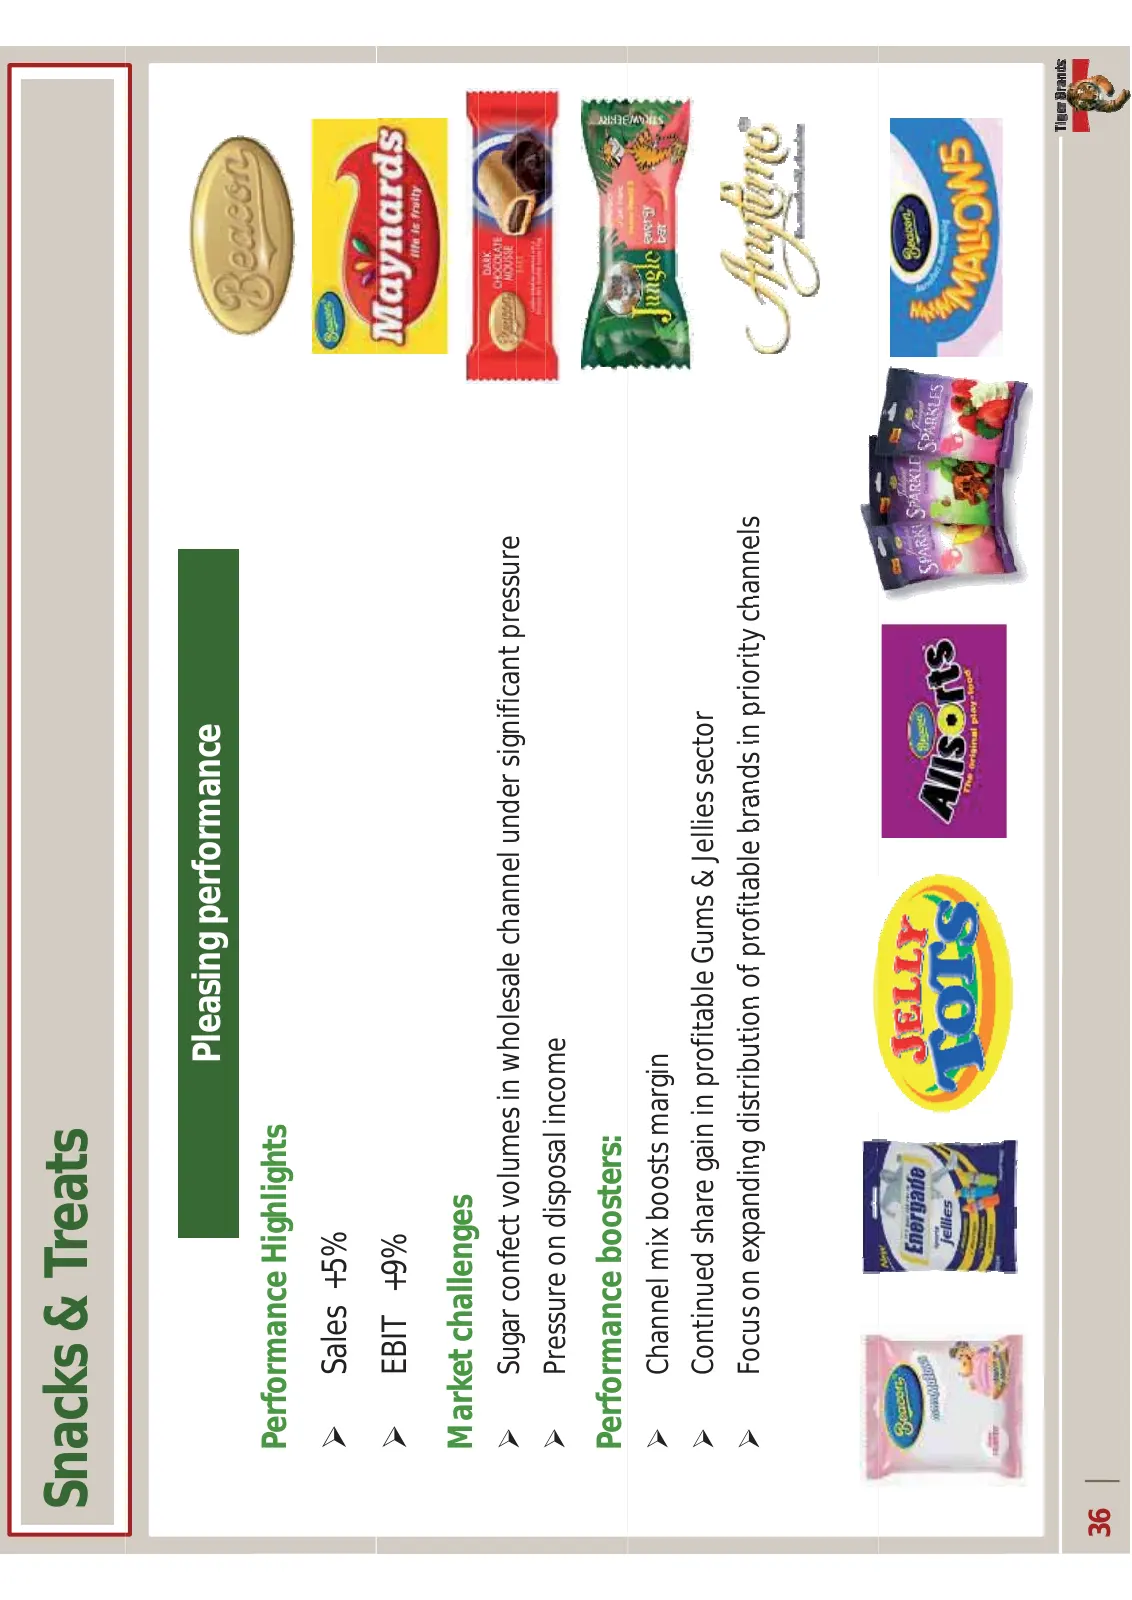
Snacks&Treats Pleasingperformance PerformanceHighlights ¾ Sales+5% ¾ EBIT+9% Marketchallenges ¾ S Sugarconfectvolumesinwholesalechannelundersignificantpressure f l i h l l h l d i ifi ¾ Pressureondisposalincome Performanceboosters: ¾ Channelmixboostsmargin ¾ ContinuedsharegaininprofitableGums&Jellie
Slide 37: Managing in tough times
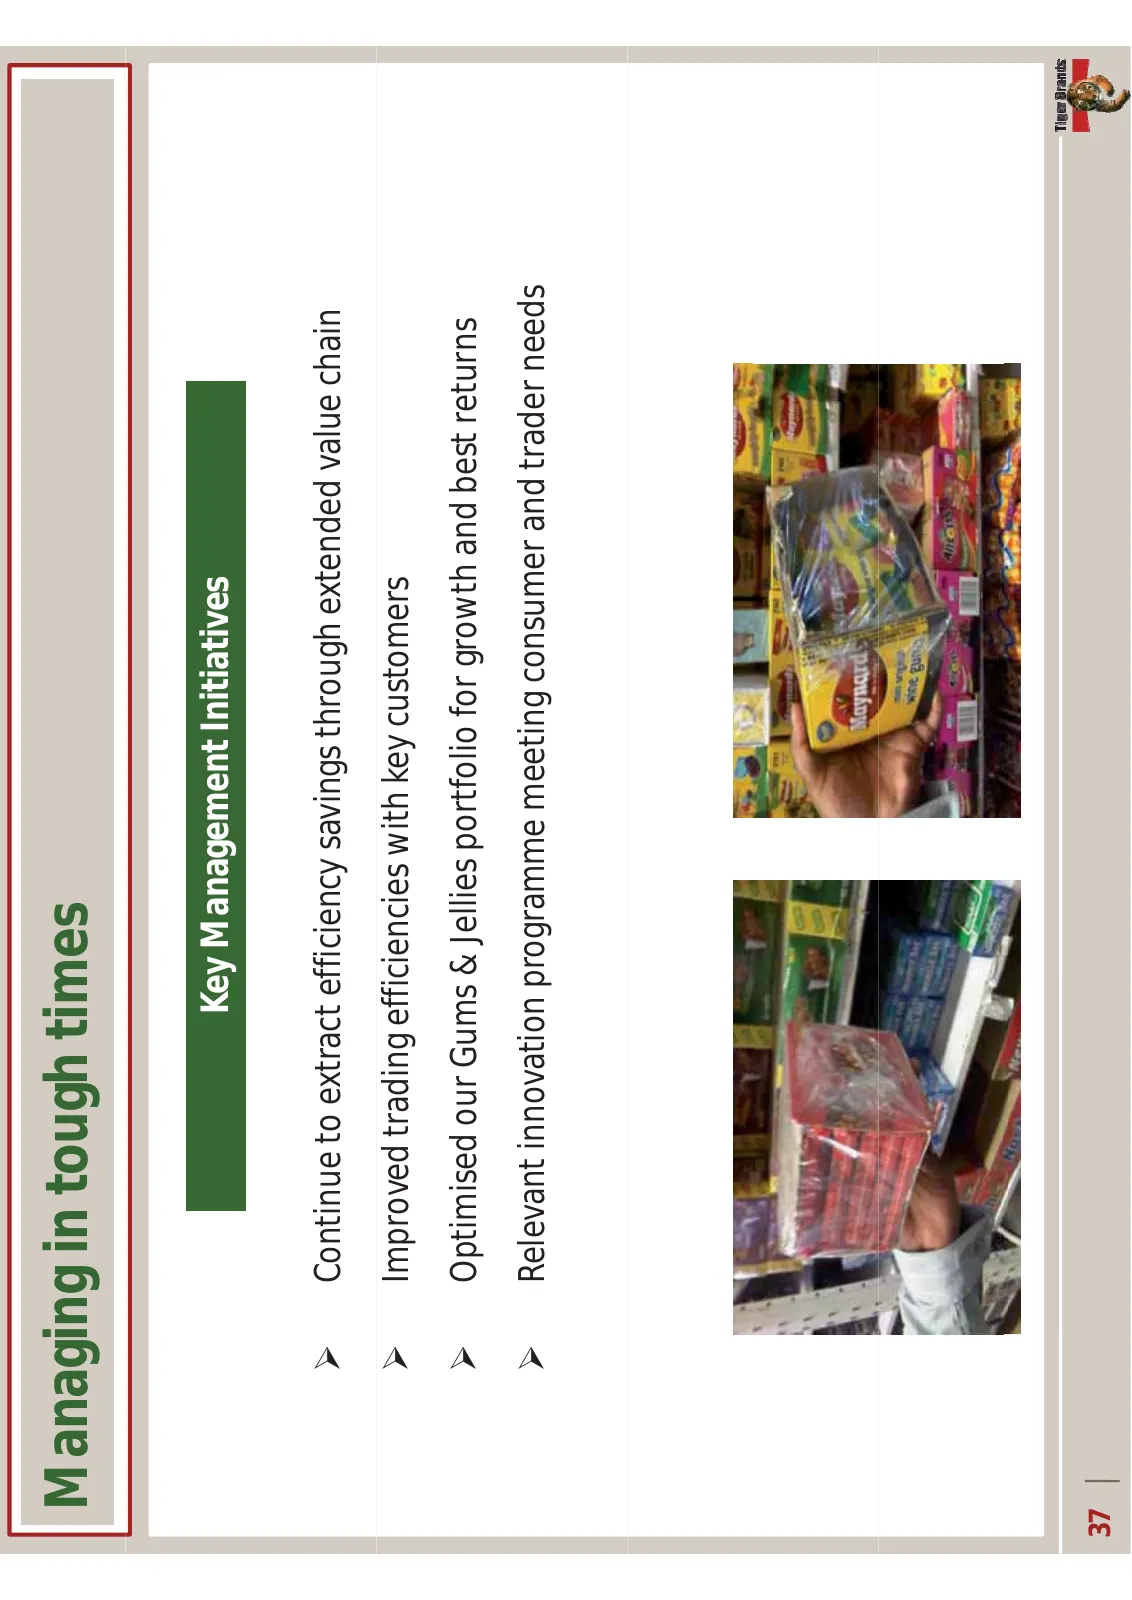
Managingintoughtimes KeyManagementInitiatives ¾ Continuetoextractefficiencysavingsthroughextendedvaluechain ¾ Improvedtradingefficiencieswithkeycustomers ¾ OptimisedourGums&Jelliesportfolioforgrowthandbestreturns ¾ Relevantinnovationprogrammemeetingconsumerandtraderneeds 37
Slide 38: Snacks & Treats: Innovation
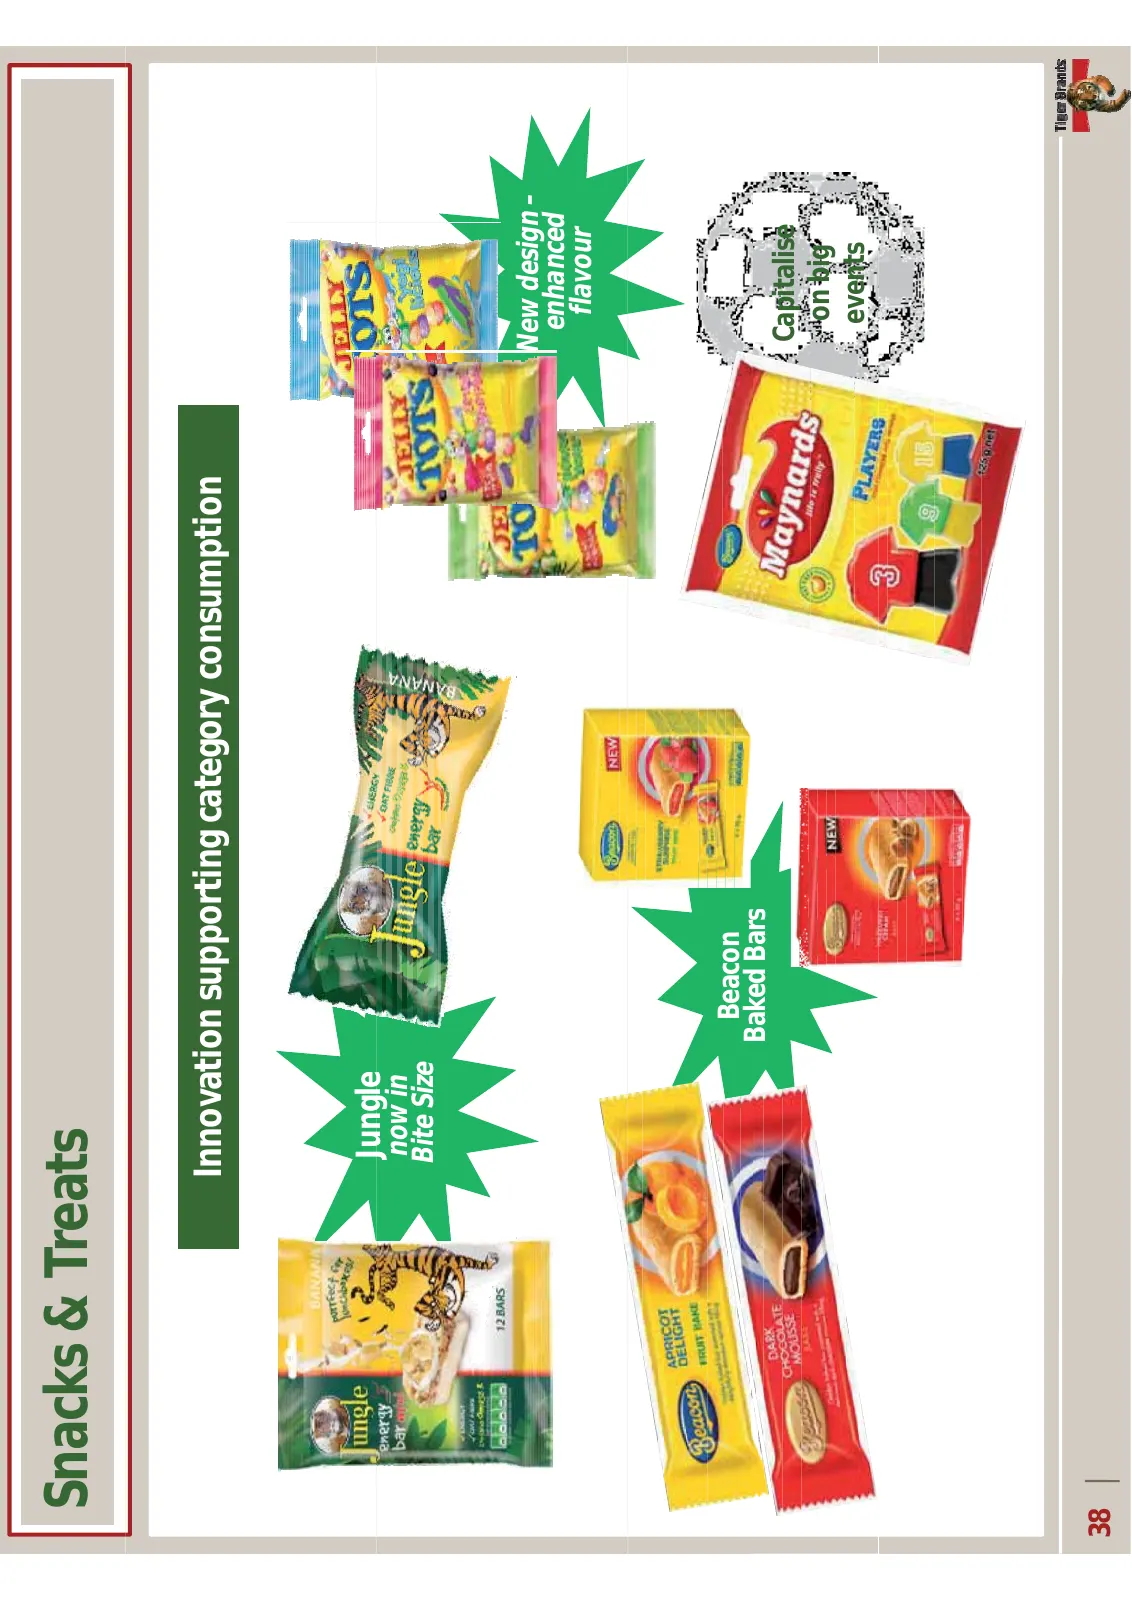
Snacks&Treats Innovationsupportingcategoryconsumption Jungle nowin BiteSize Newdesign– enhanced flavour Beacon BakedBars Baked Bars Capitalise onbig events 38
Slide 39: Beverages
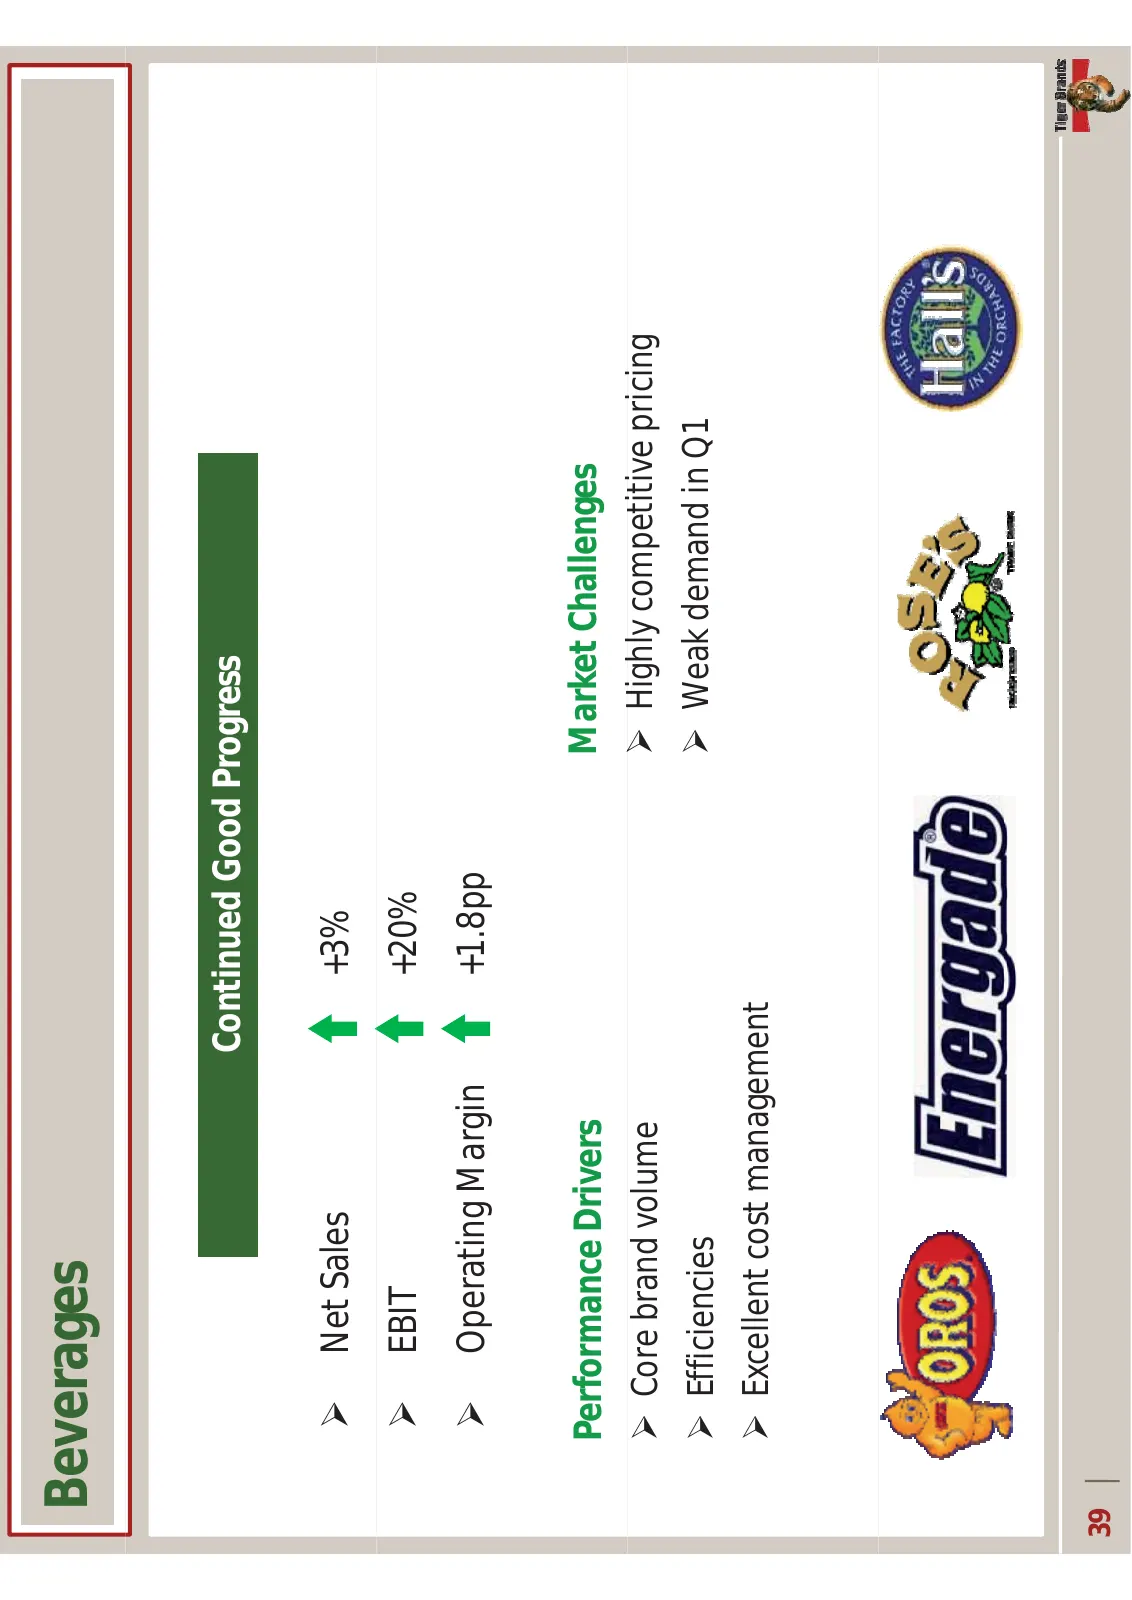
Beverages ContinuedGoodProgress ¾ NetSales +3% ¾ EBIT +20% ¾ OperatingMargin +1.8pp PerformanceDrivers MarketChallenges ¾ Corebrandvolume ¾ Highlycompetitivepricing ¾ Efficiencies ¾ WeakdemandinQ1 ¾ Excellentcostmanagement Excellent cost management 39
Slide 40: Beverages: Investing in core brands
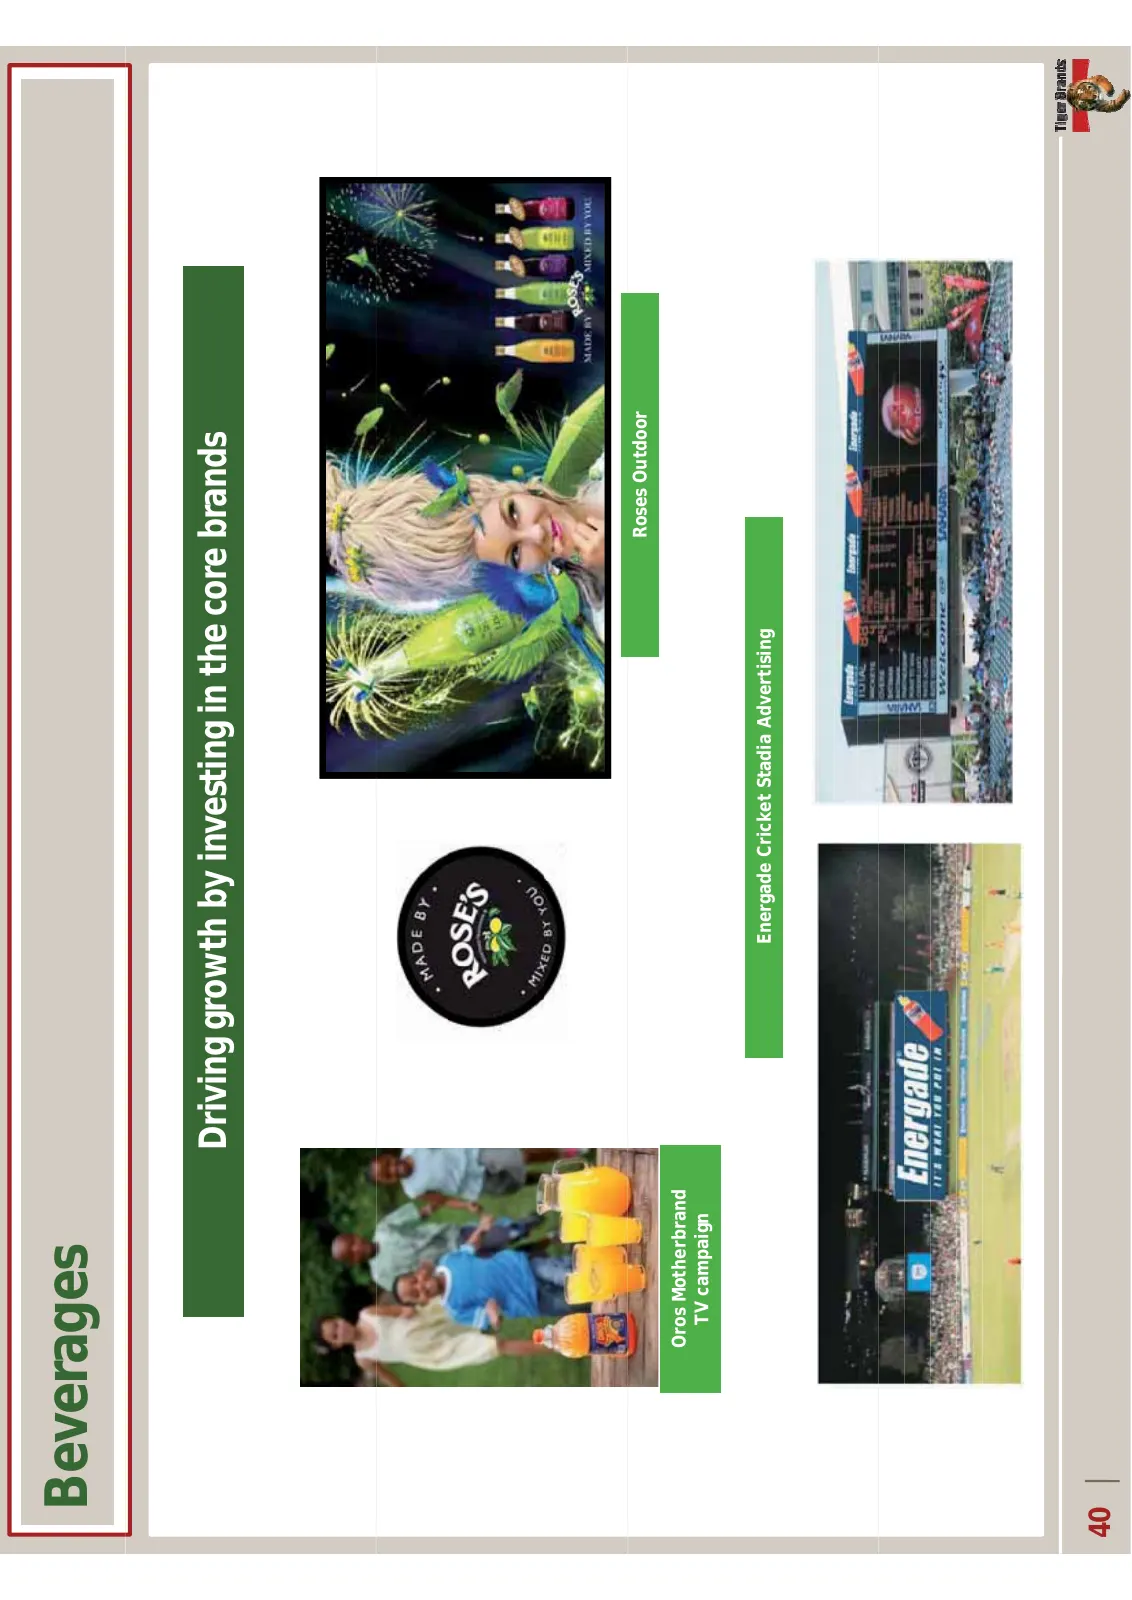
Beverages Drivinggrowthbyinvestinginthecorebrands Roses Outdoor Oros Motherbrand TV campaign Energade Cricket Stadia Advertising 40
Slide 41: Beverages: Relevant innovation
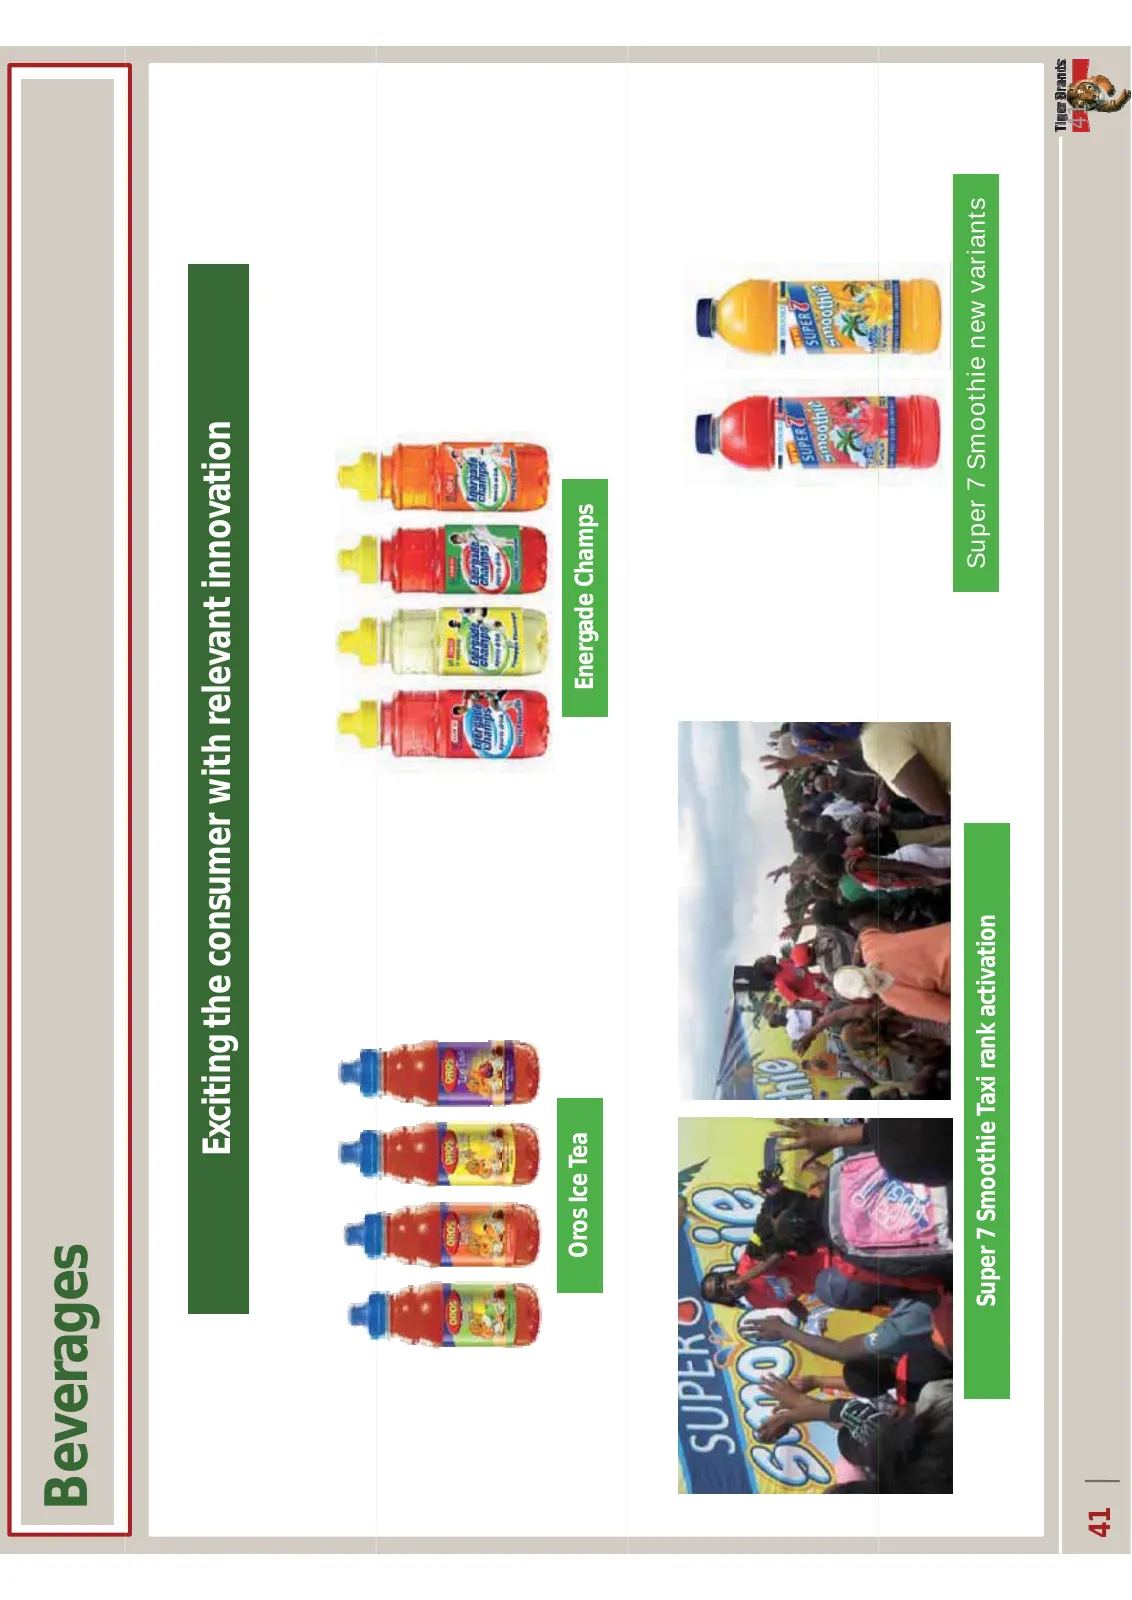
Beverages Excitingtheconsumerwithrelevantinnovation OrosIceTea EnergadeChamps Super7SmoothieTaxirankactivation Super 7 Smoothie new variants 41 41
Slide 42: Value Added Meat Products
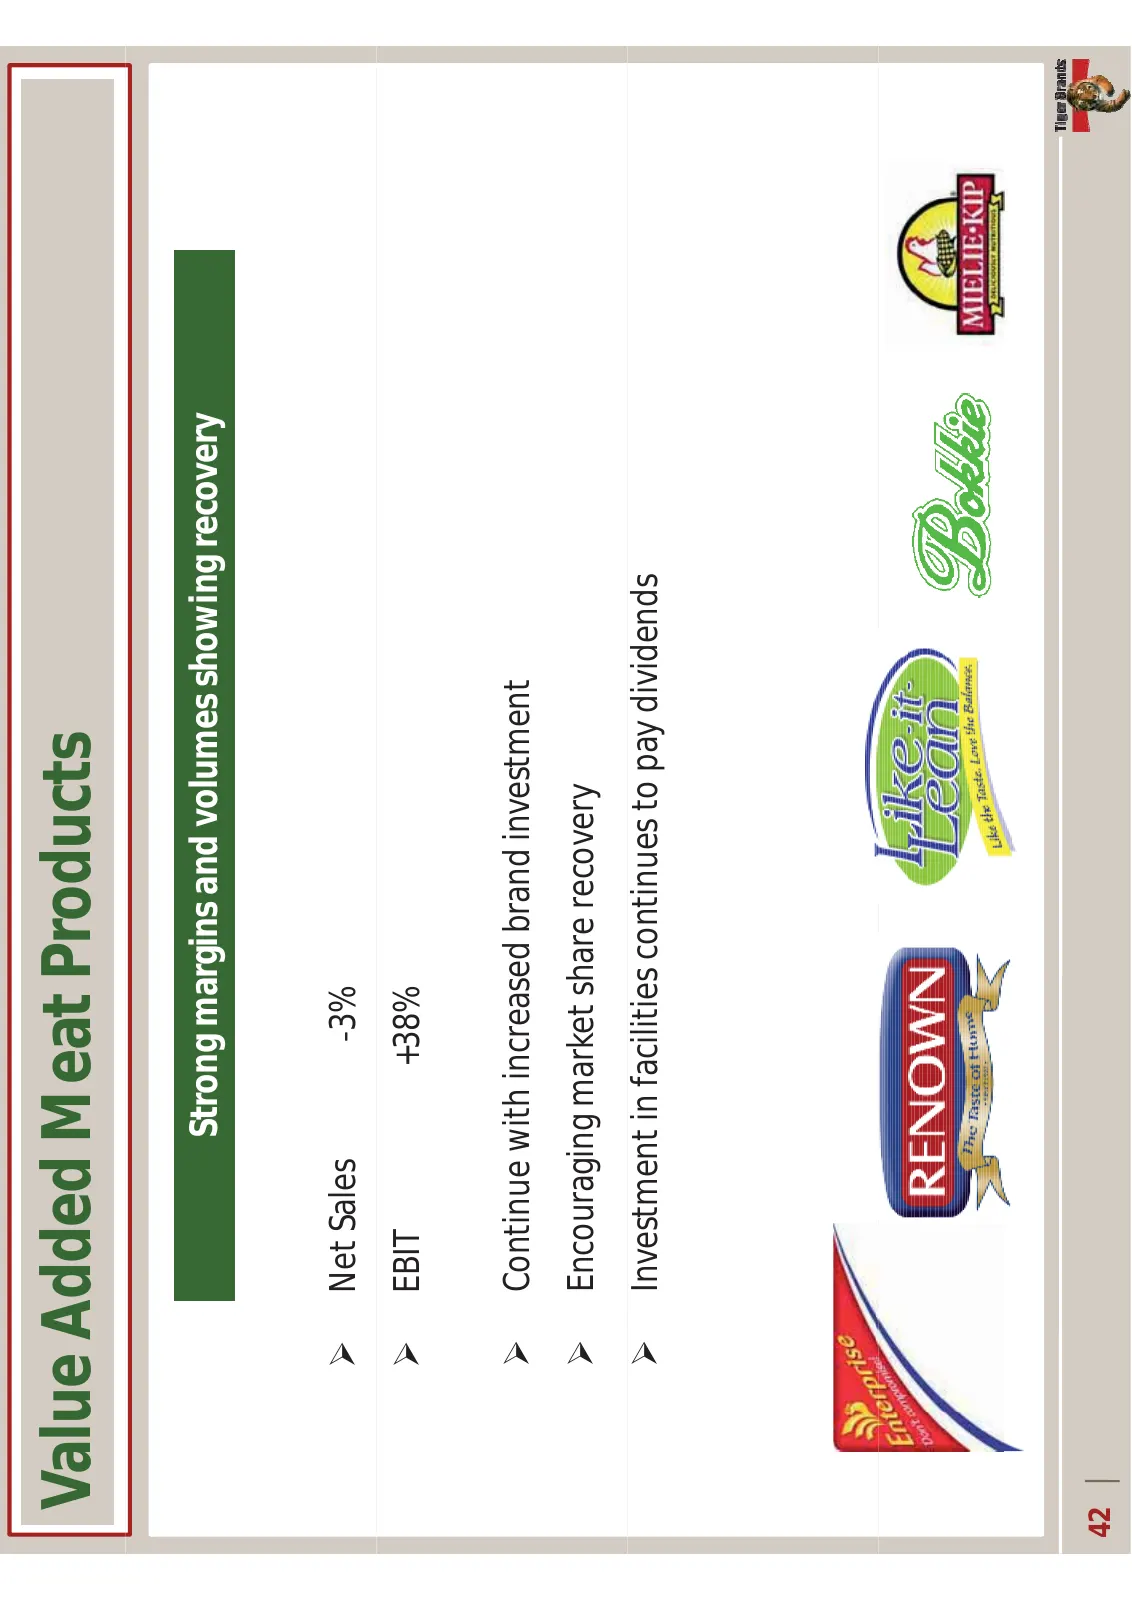
ValueAddedMeatProducts Strongmarginsandvolumesshowingrecovery ¾ NetSales Ͳ3% ¾ EBIT +38% ¾ Continuewithincreasedbrandinvestment ¾ Encouragingmarketsharerecovery ¾ Investmentinfacilitiescontinuestopaydividends 42
Slide 43: Out of Home
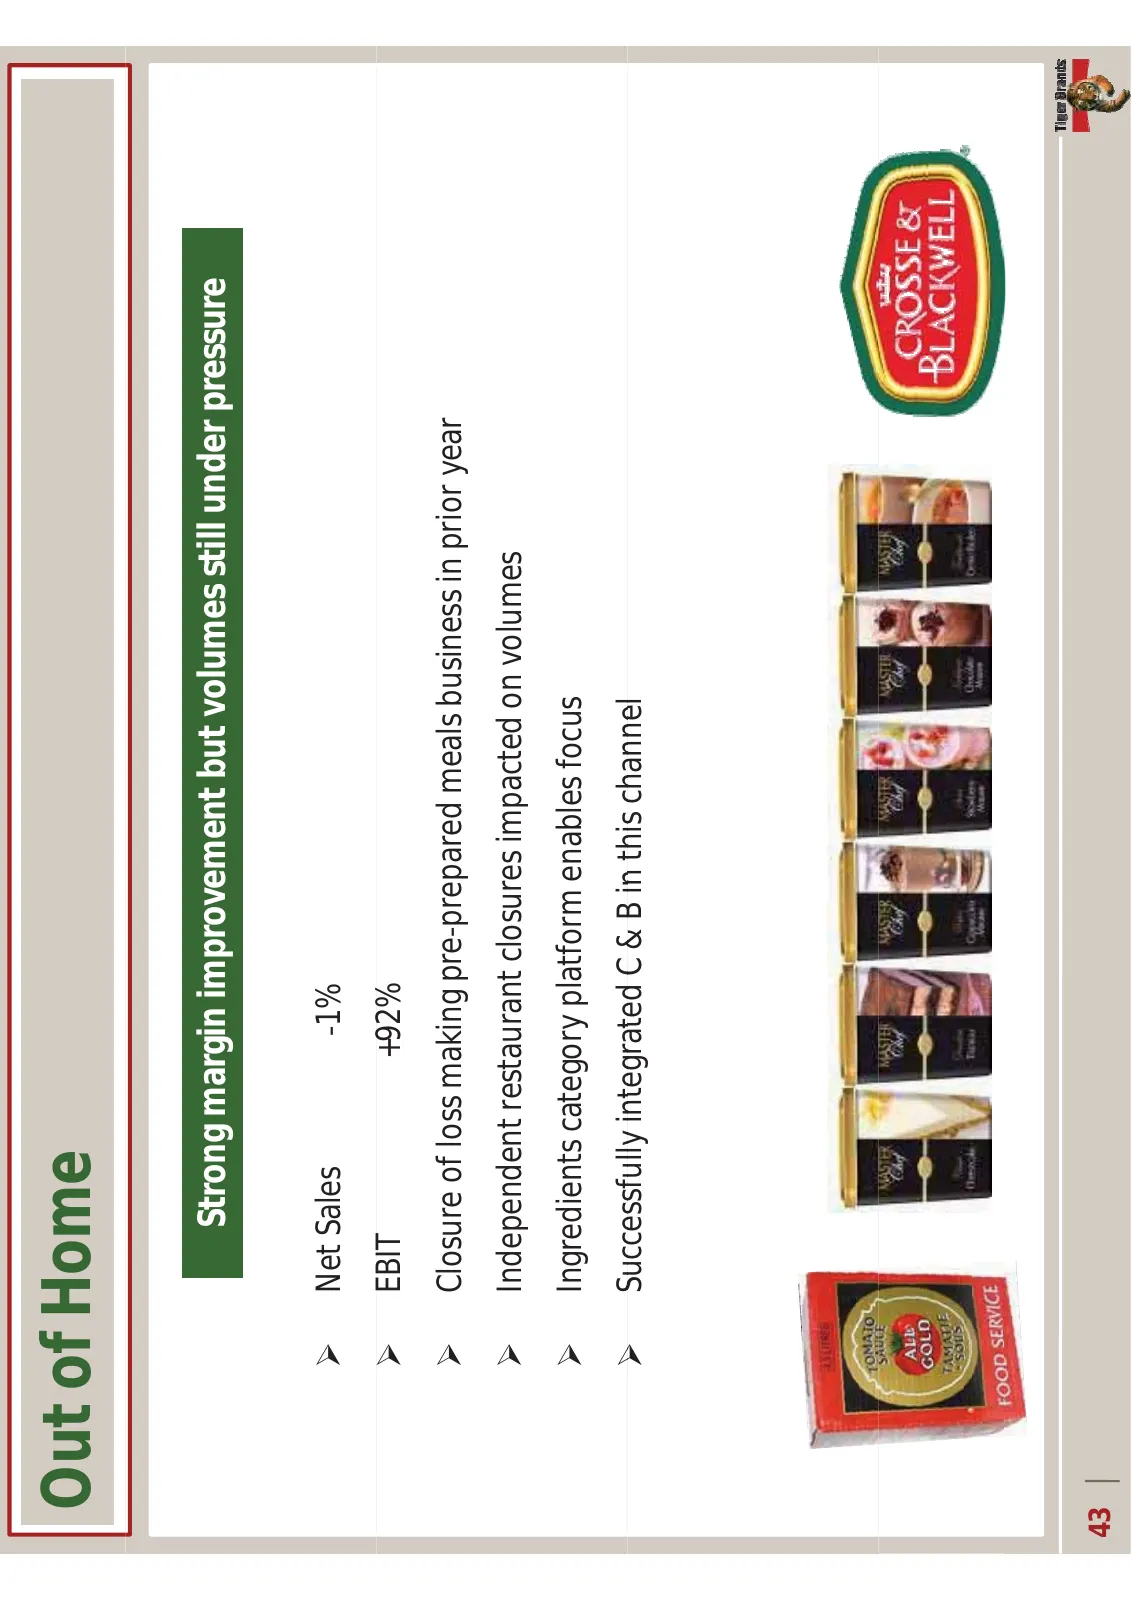
OutofHome Strongmarginimprovementbutvolumesstillunderpressure ¾ NetSales Ͳ1% ¾ EBIT +92% ¾ ClosureoflossmakingpreͲpreparedmealsbusinessinprioryear ¾ I d Independentrestaurantclosuresimpactedonvolumes d t t t l i t d l ¾ Ingredientscategoryplatformenablesfocus ¾ Successfully integrated C & B in this
Slide 44: Langeberg & Ashton Foods
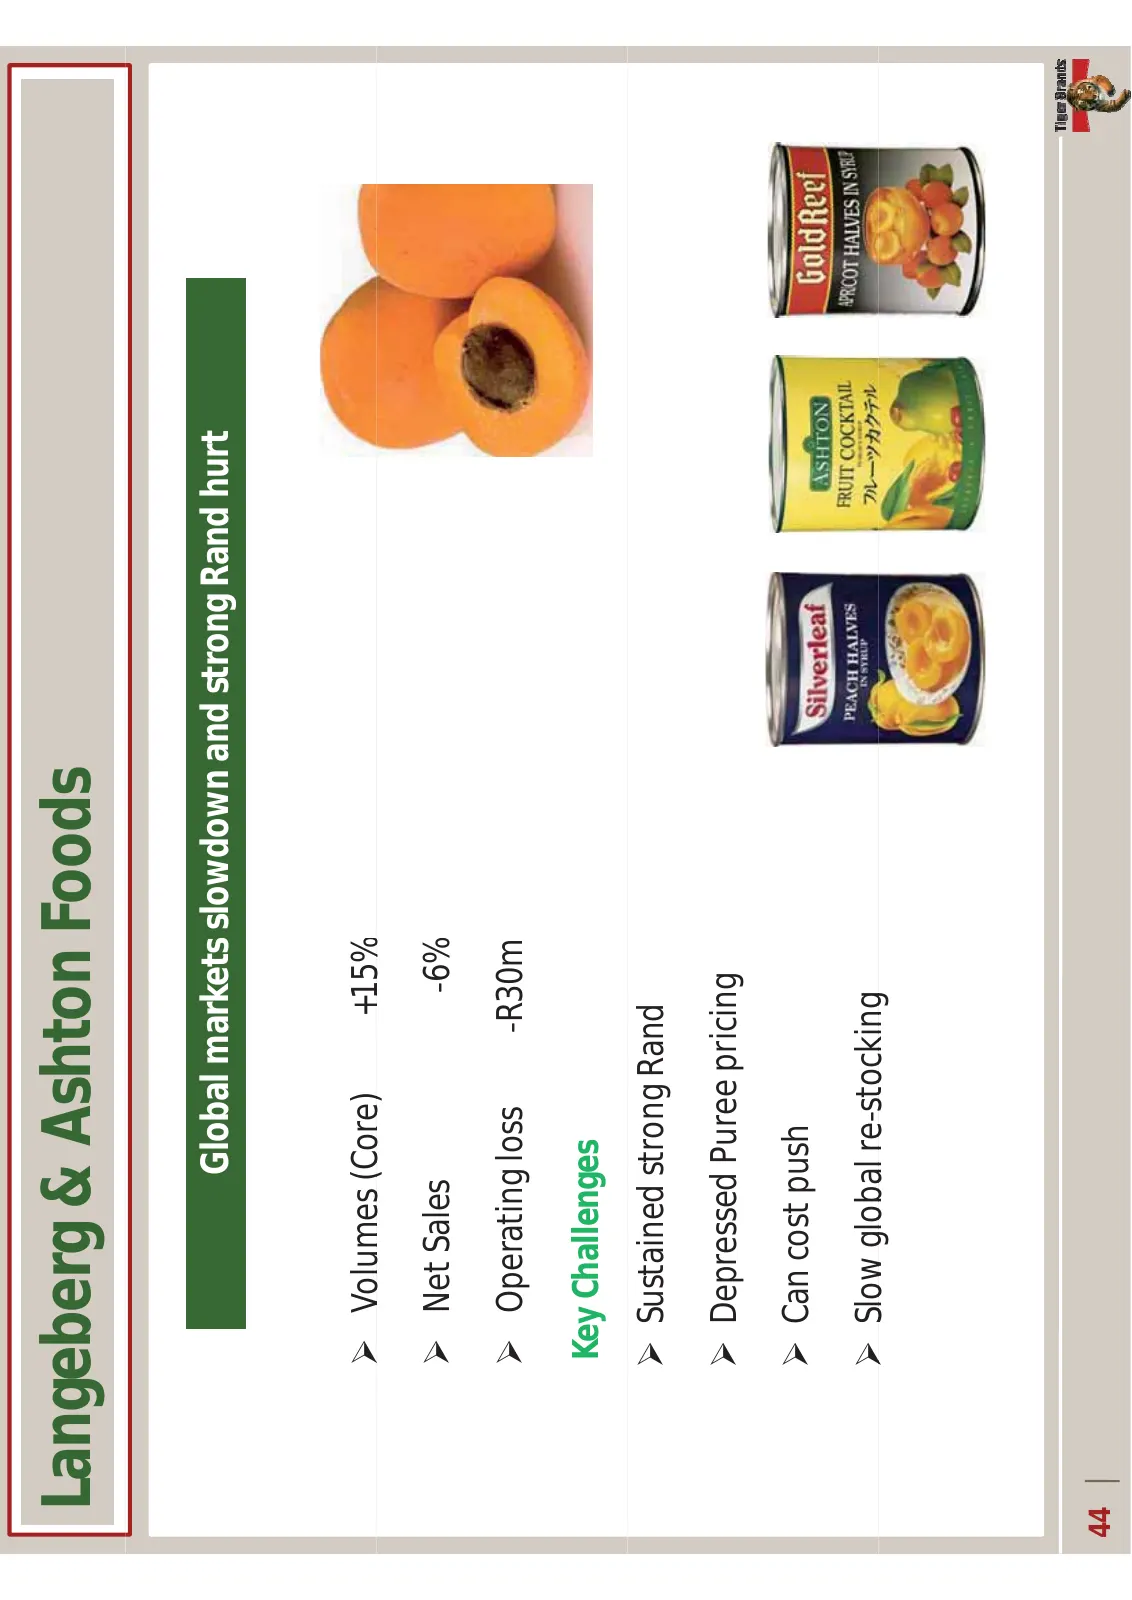
Langeberg&AshtonFoods GlobalmarketsslowdownandstrongRandhurt ¾ Volumes(Core) Volumes (Core) +15% 15% ¾ NetSales Ͳ6% ¾ Operatingloss O ti l ͲR30m R30 KeyChallenges ¾ SustainedstrongRand ¾ DepressedPureepricing ¾ Cancostpush ¾ Slowglobalre Slow global reͲstocking stocking 44
Slide 45: HPC
HPC BrendaKoornneef BusinessExecutive 45
Slide 46: Personal Care
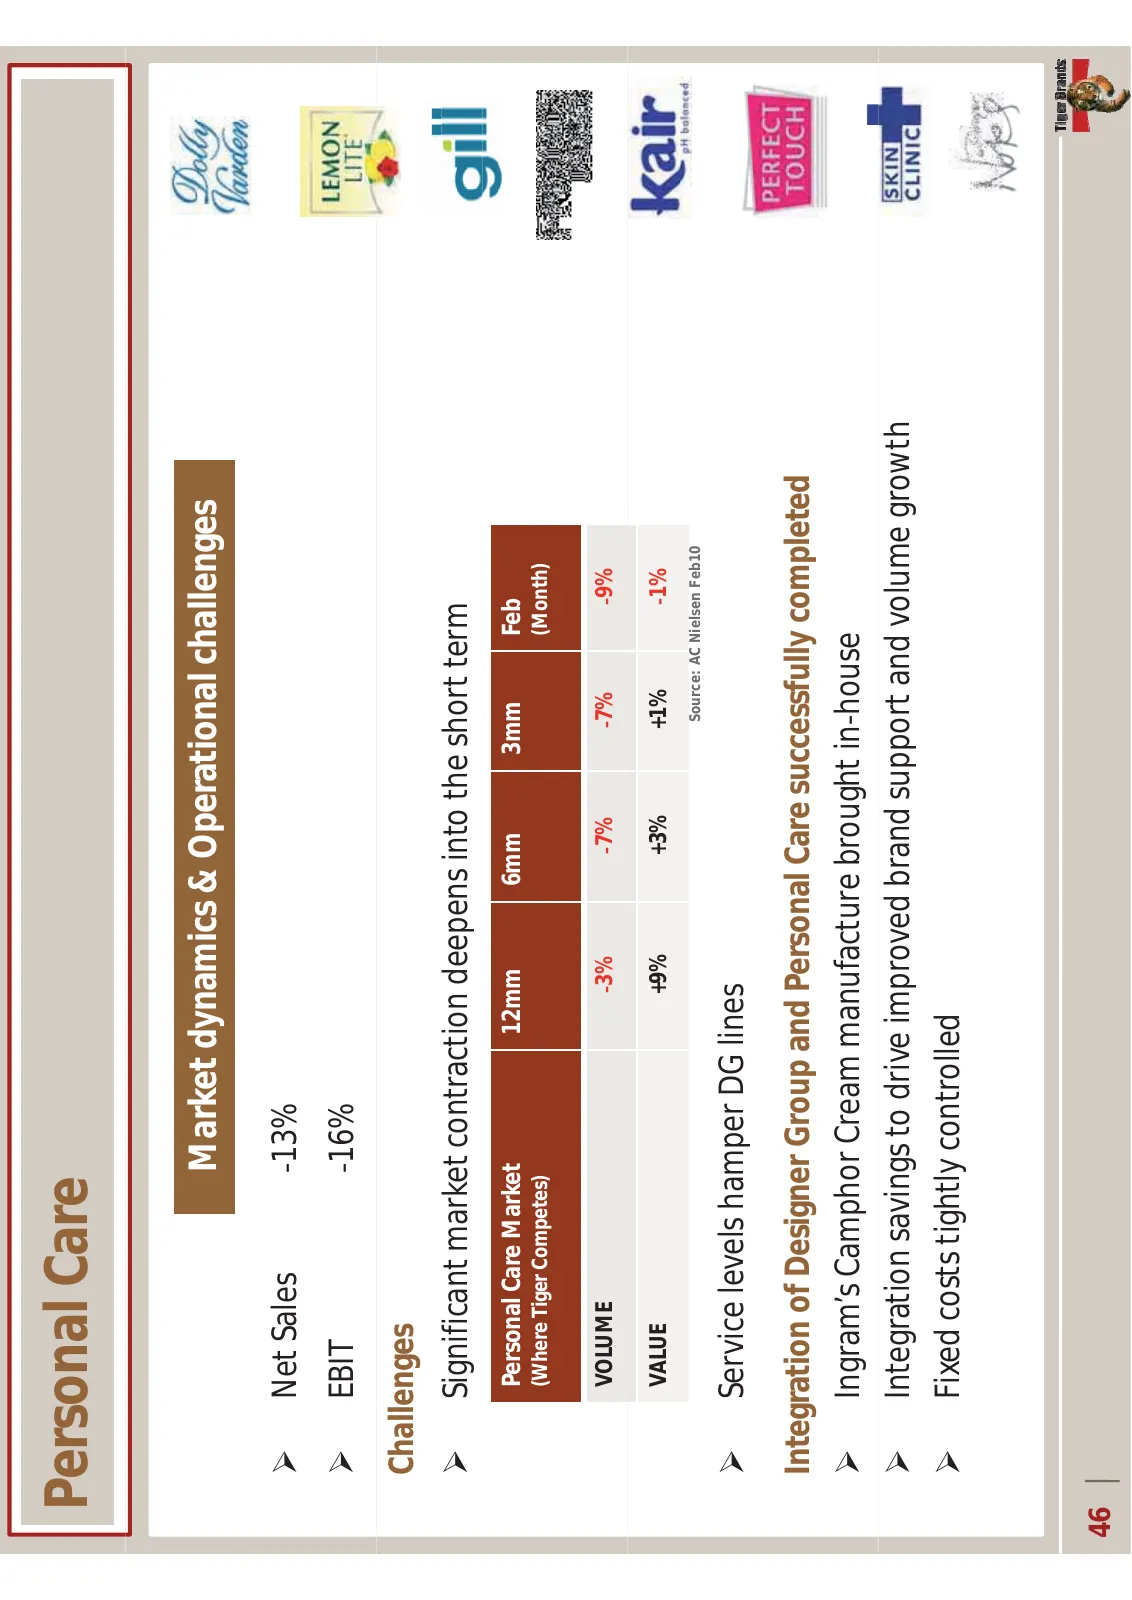
PersonalCare Marketdynamics&Operationalchallenges ¾ NetSales Ͳ13% ¾ EBIT Ͳ16% Challenges ¾ Significantmarketcontractiondeepensintotheshortterm PersonalCareMarket 12mm 6mm 3mm Feb (WhereTigerCompetes) (Month) VOLUME Ͳ3% Ͳ7% Ͳ7% Ͳ9% VALUE +9% +3% +1% Ͳ1% Source: AC Nielsen Feb10 ¾ ServicelevelshamperD
Slide 47: Personal Care remains a Growth Vector
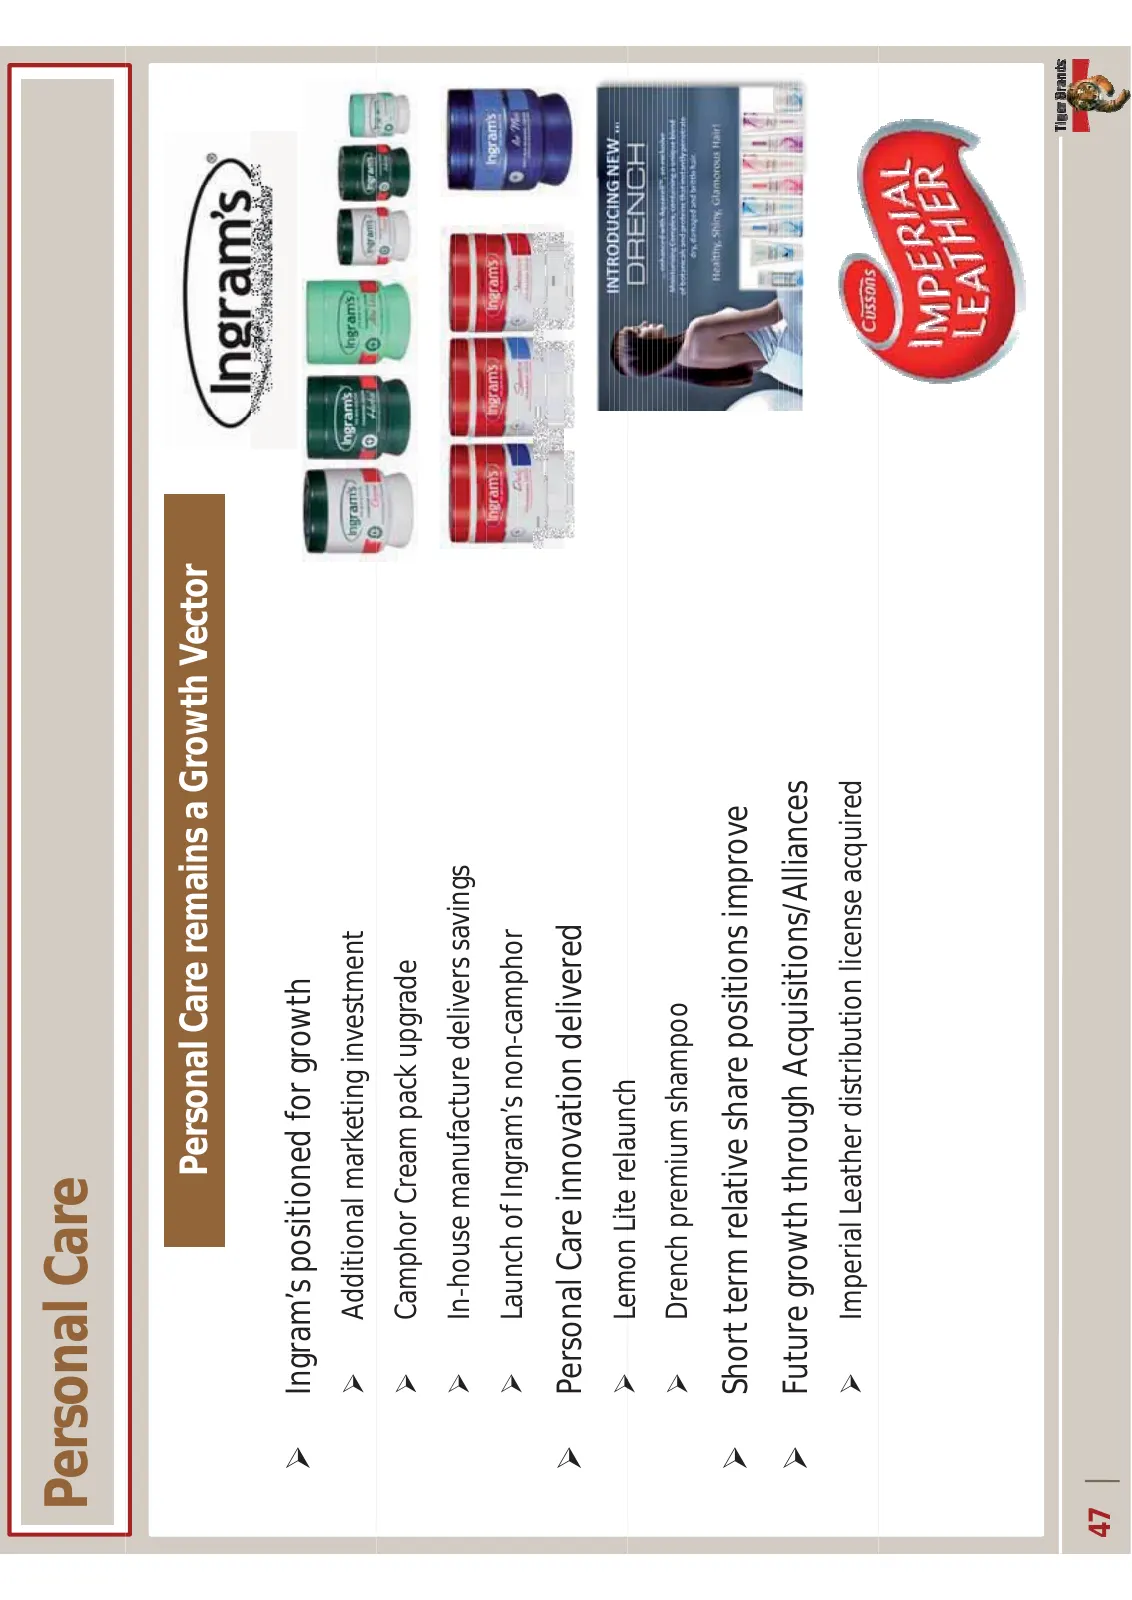
PersonalCare PersonalCareremainsaGrowthVector ¾ Ingram’spositionedforgrowth ¾ Additionalmarketinginvestment ¾ CamphorCreampackupgrade ¾ InͲhousemanufacturedeliverssavings ¾ LaunchofIngram’snonͲcamphor f ’ ¾ PersonalCareinnovationdelivered ¾ Lemon Lite relaunch LemonLiterelaunch ¾ Drenchpremiumshampo
Slide 48: Home Care
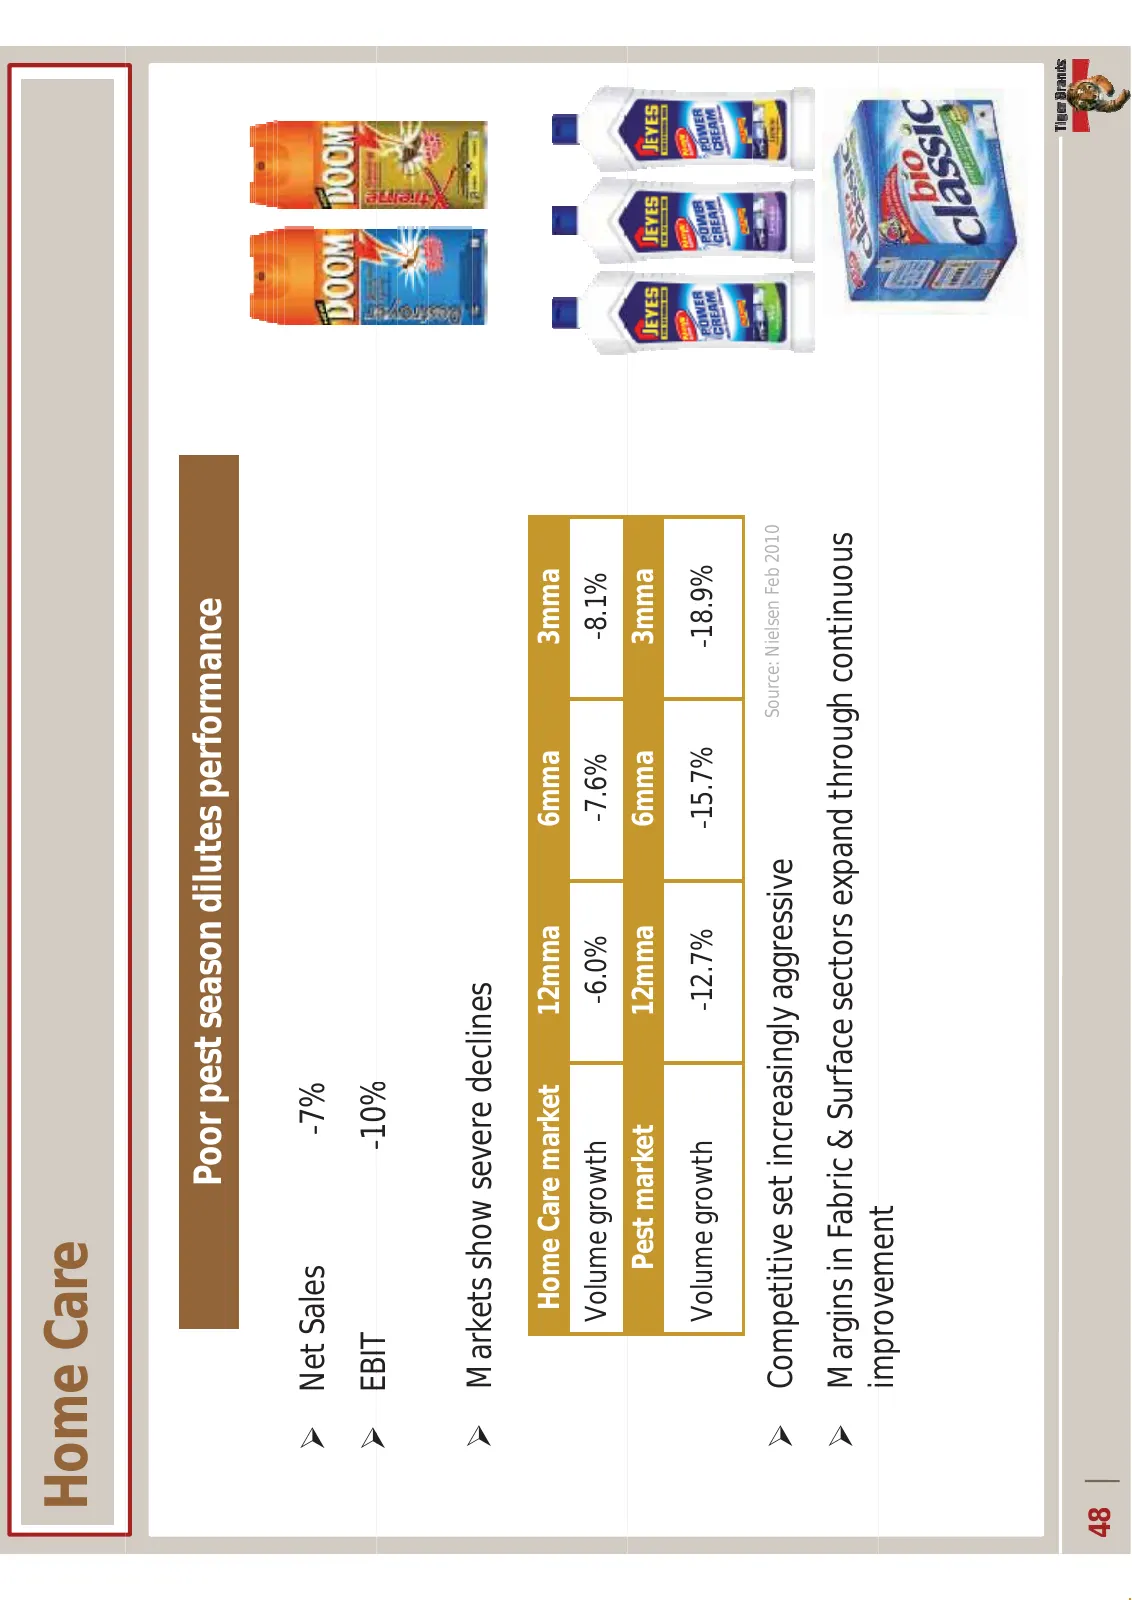
HomeCare Poorpestseasondilutesperformance ¾ NetSales Ͳ7% ¾ EBIT Ͳ10% ¾ Marketsshowseveredeclines HomeCaremarket 12mma 6mma 3mma Volumegrowth Ͳ6.0% Ͳ7.6% Ͳ8.1% Pestmarket 12mma 6mma 3mma Volumegrowth Ͳ12.7% Ͳ15.7% Ͳ18.9% Source:NielsenFeb2010 ¾ Competitivesetincreasinglyaggressive ¾ MarginsinFabric&S
Slide 49: Home Care: Market shares
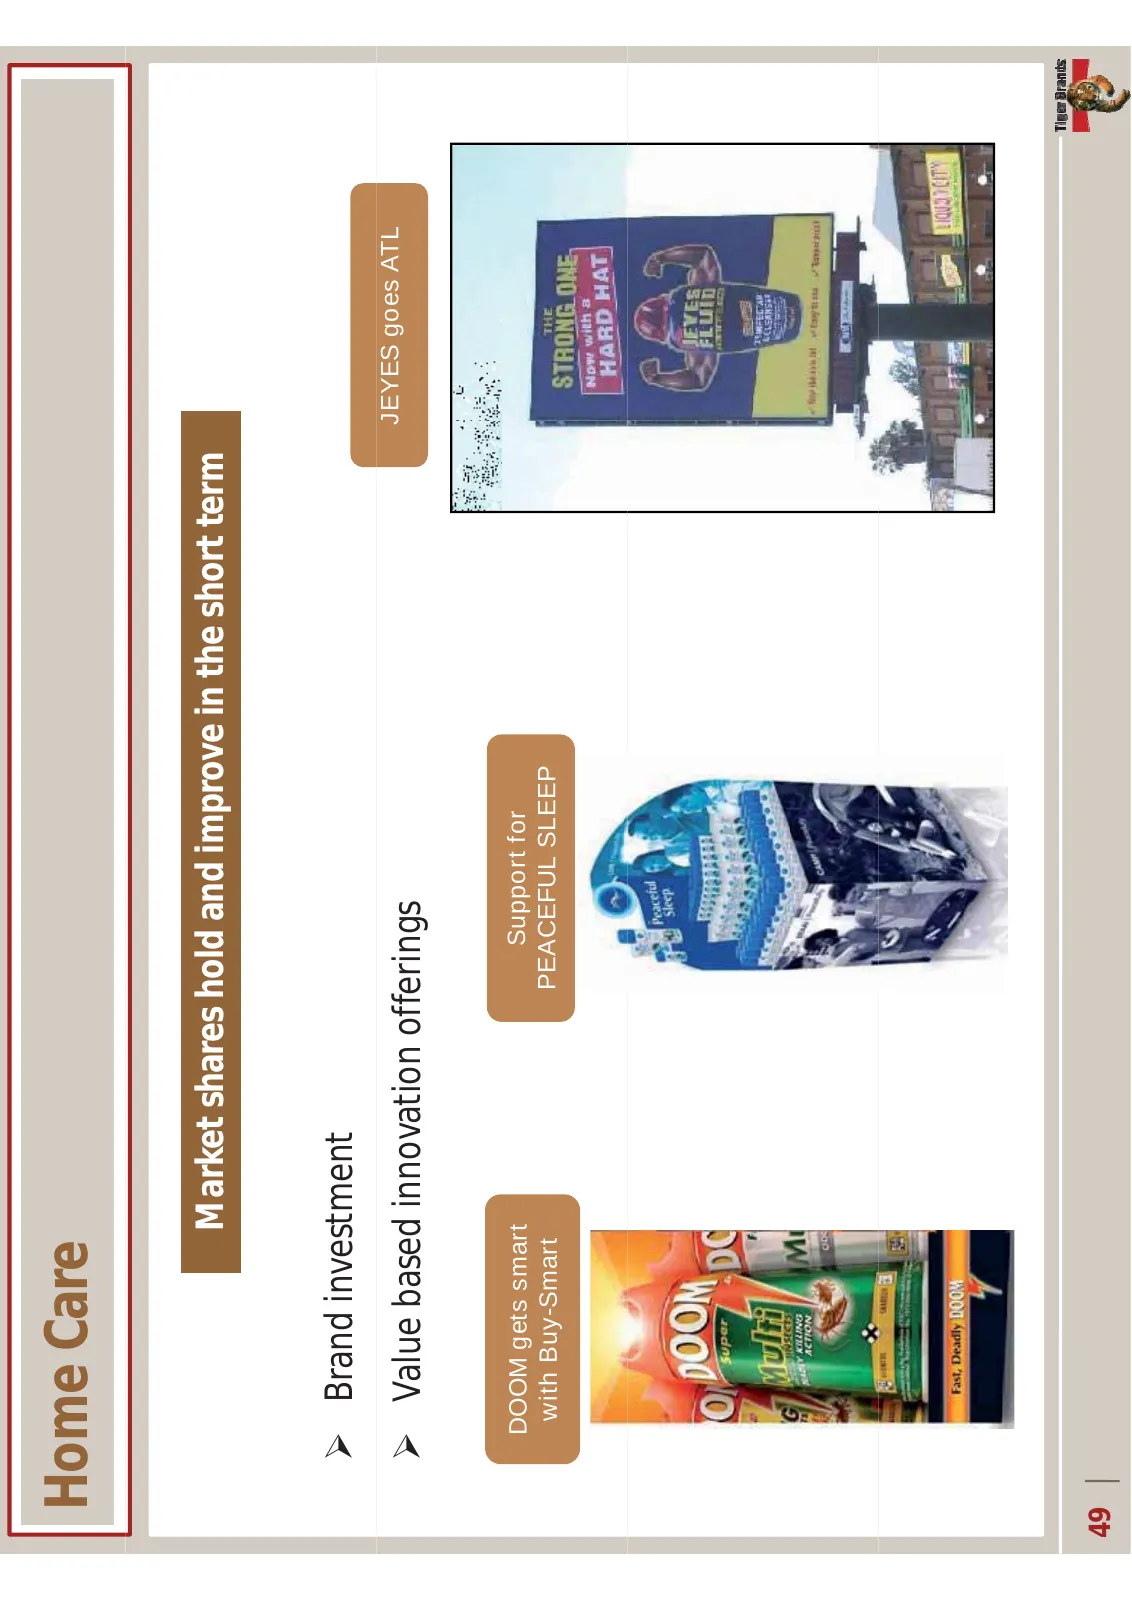
HomeCare Marketsharesholdandimproveintheshortterm ¾ Brandinvestment JEYES goes ATL ¾ Valuebasedinnovationofferings DOOM gets smart Support for with Buy-Smart PEACEFUL SLEEP 49
Slide 50: Baby Care
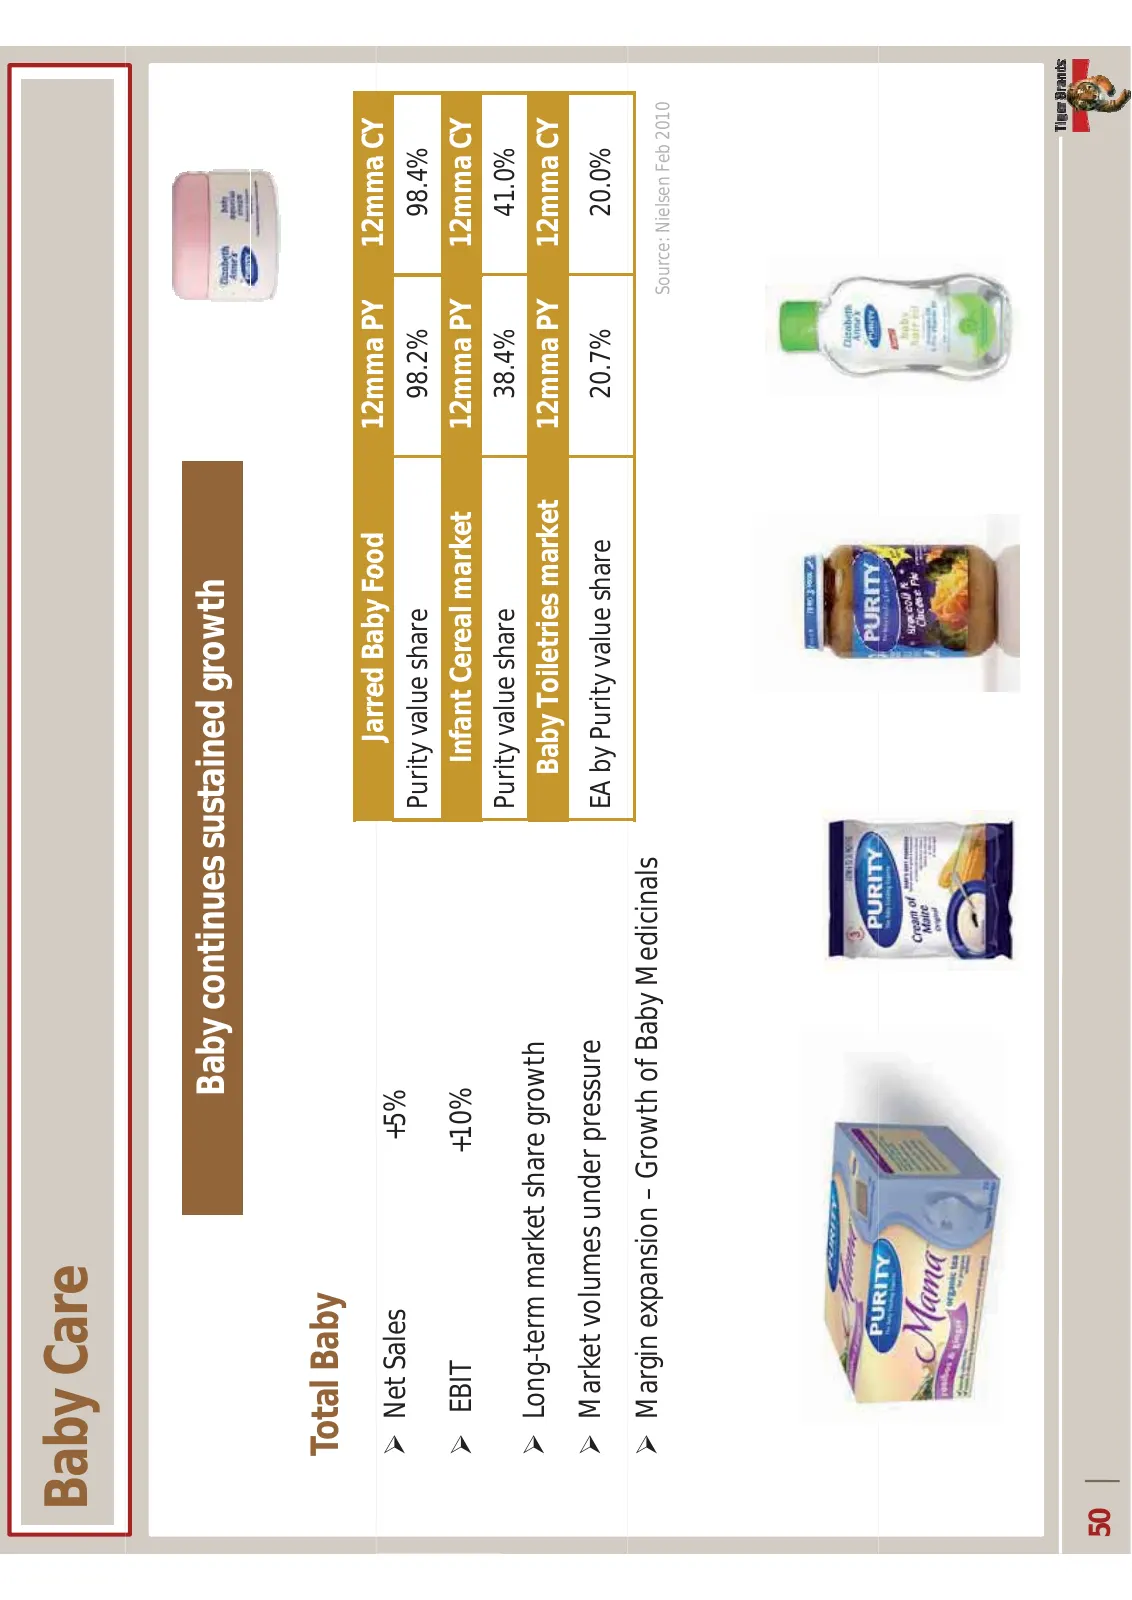
BabyCare Babycontinuessustainedgrowth TotalBaby Jarred Baby Food JarredBabyFood 12mma PY 12mma CY 12mmaCY ¾ NetSales +5% Purityvalueshare 98.2% 98.4% ¾ EBIT +10% InfantCerealmarket 12mma PY 12mmaCY Purity value share Purityvalueshare 38 4% 38.4% 41 0% 41.0% ¾ LongͲtermmarketsharegrowth BabyToiletrie
Slide 51: Baby Care: Innovation drives profitable growth
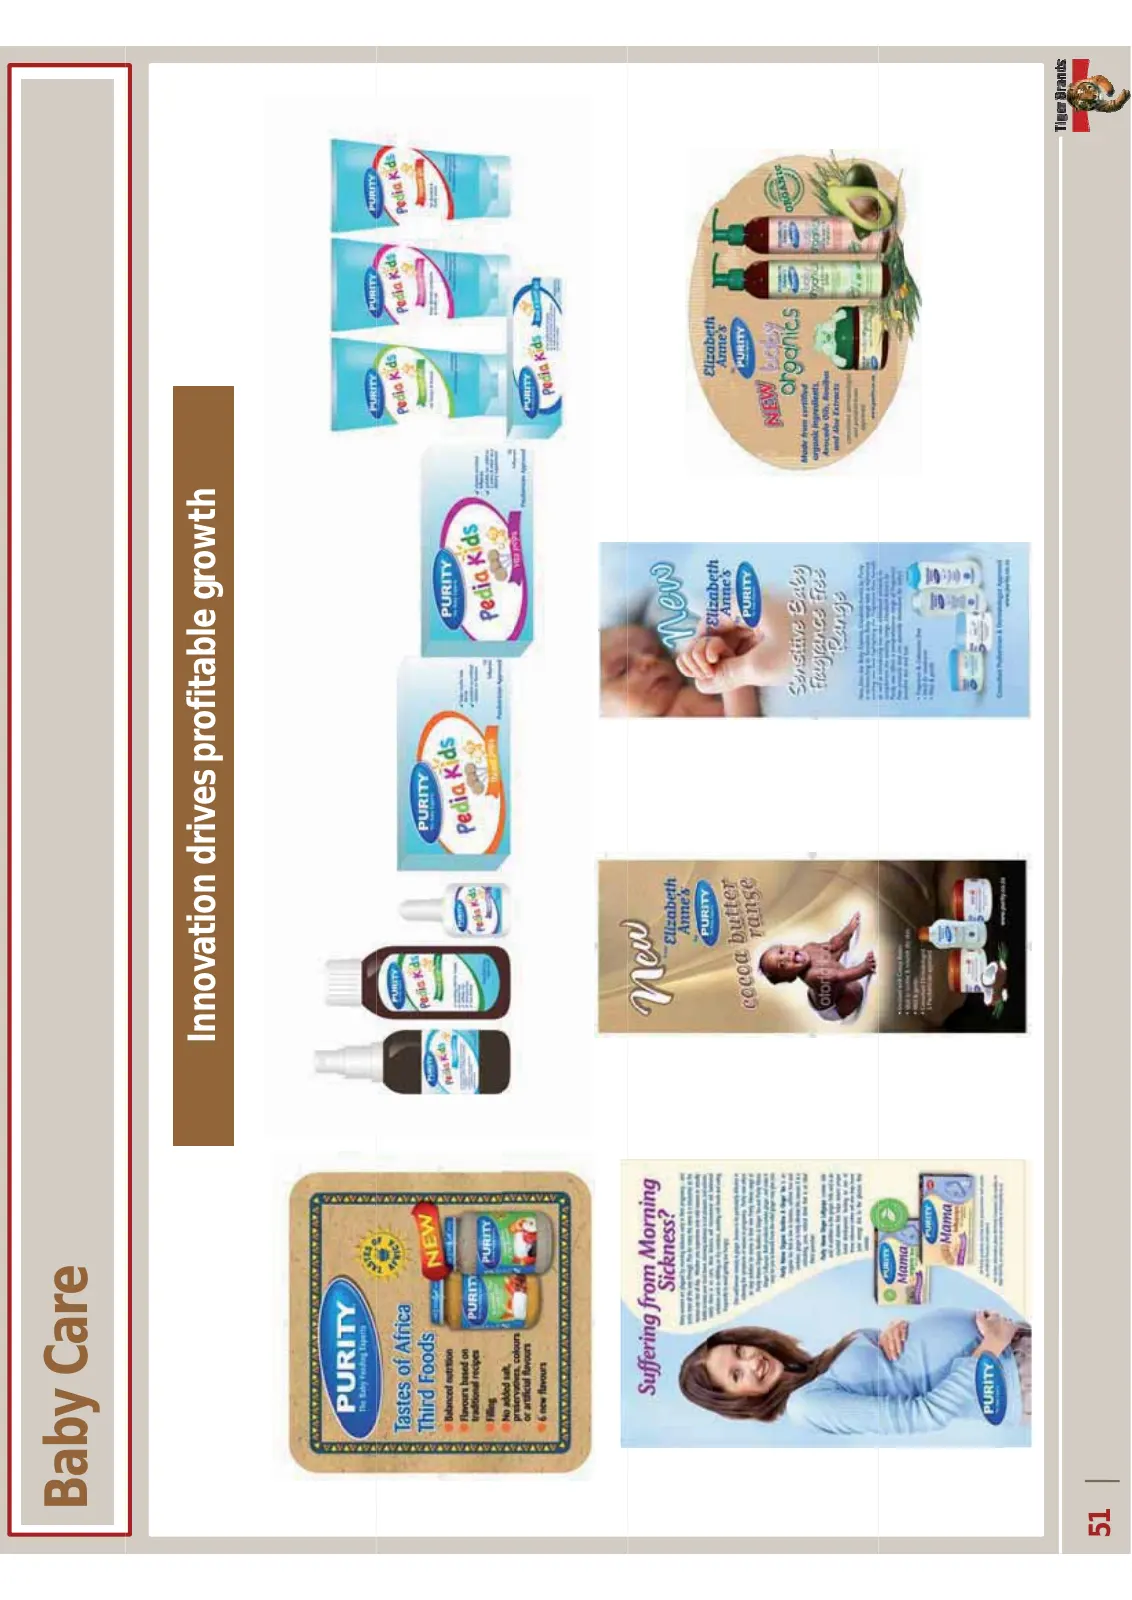
BabyCare Innovationdrivesprofitablegrowth 51
Slide 52: Summary - HPC
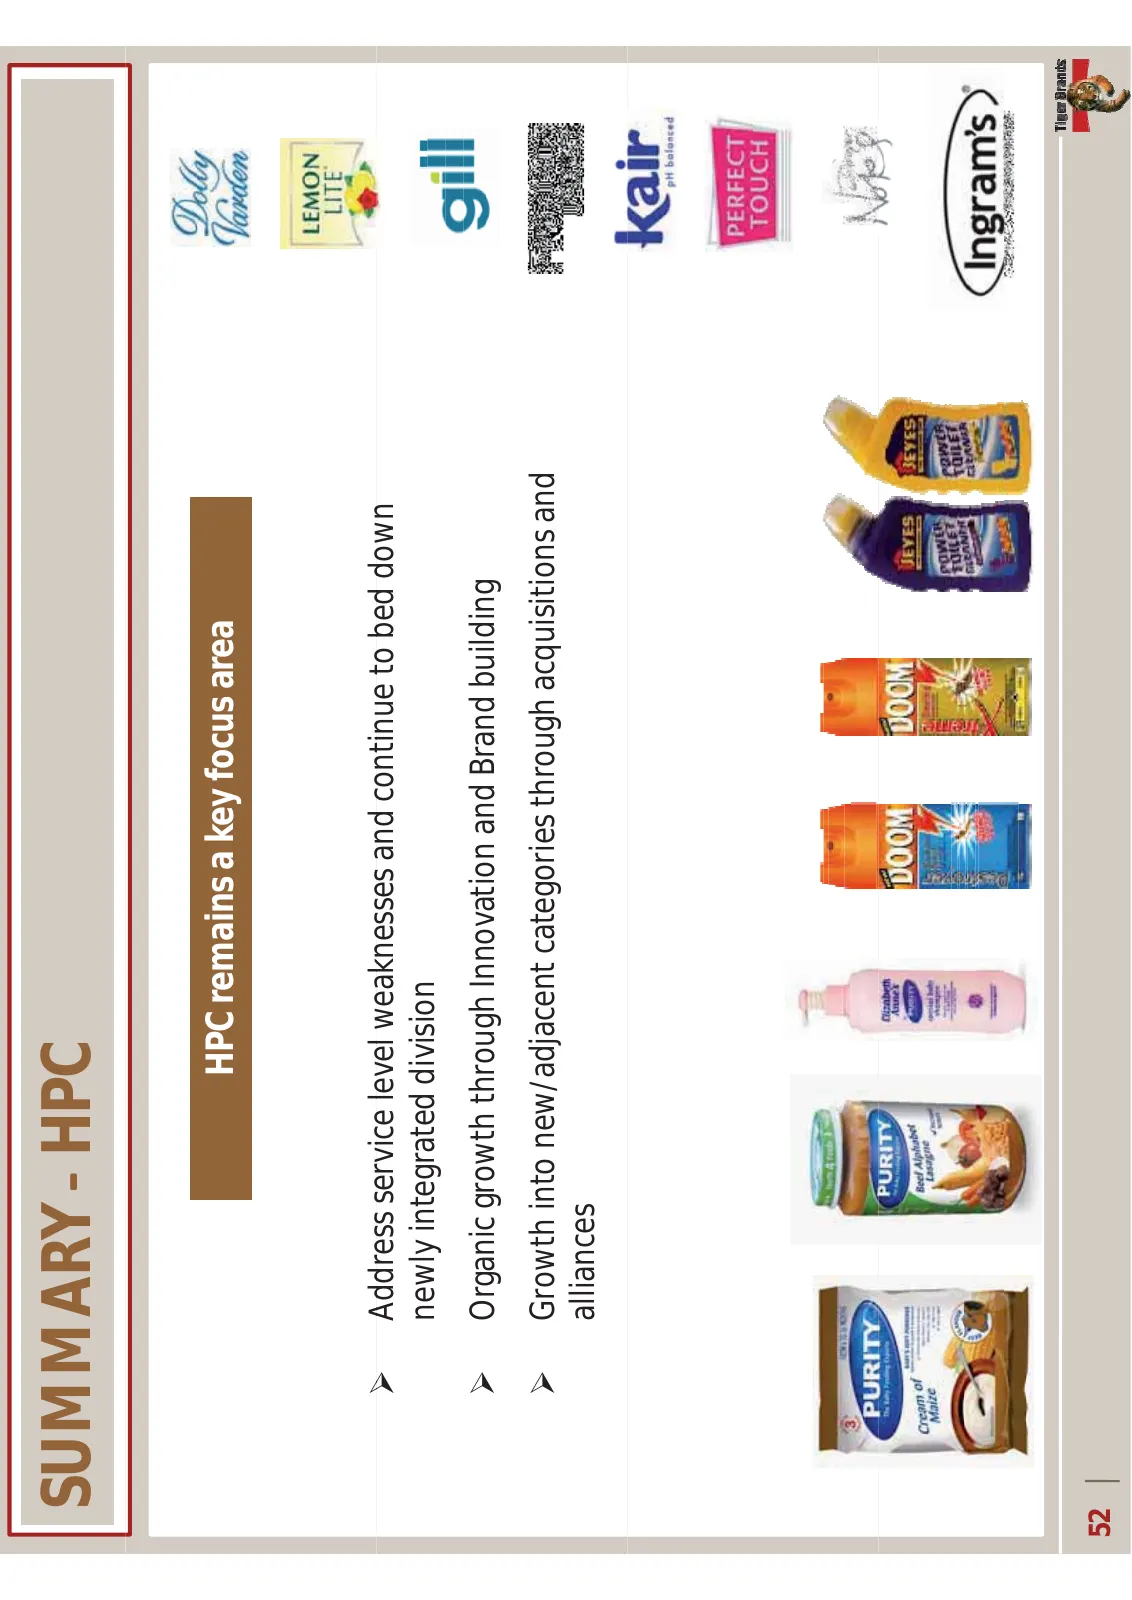
SUMMARY Ͳ HPC HPCremainsakeyfocusarea ¾ Addressservicelevelweaknessesandcontinuetobeddown Add i l l k d ti t b dd newlyintegrateddivision ¾ OrganicgrowththroughInnovationandBrandbuilding ¾ Growthintonew/adjacentcategoriesthroughacquisitionsand alliances 52
Slide 53: Tiger Brands International
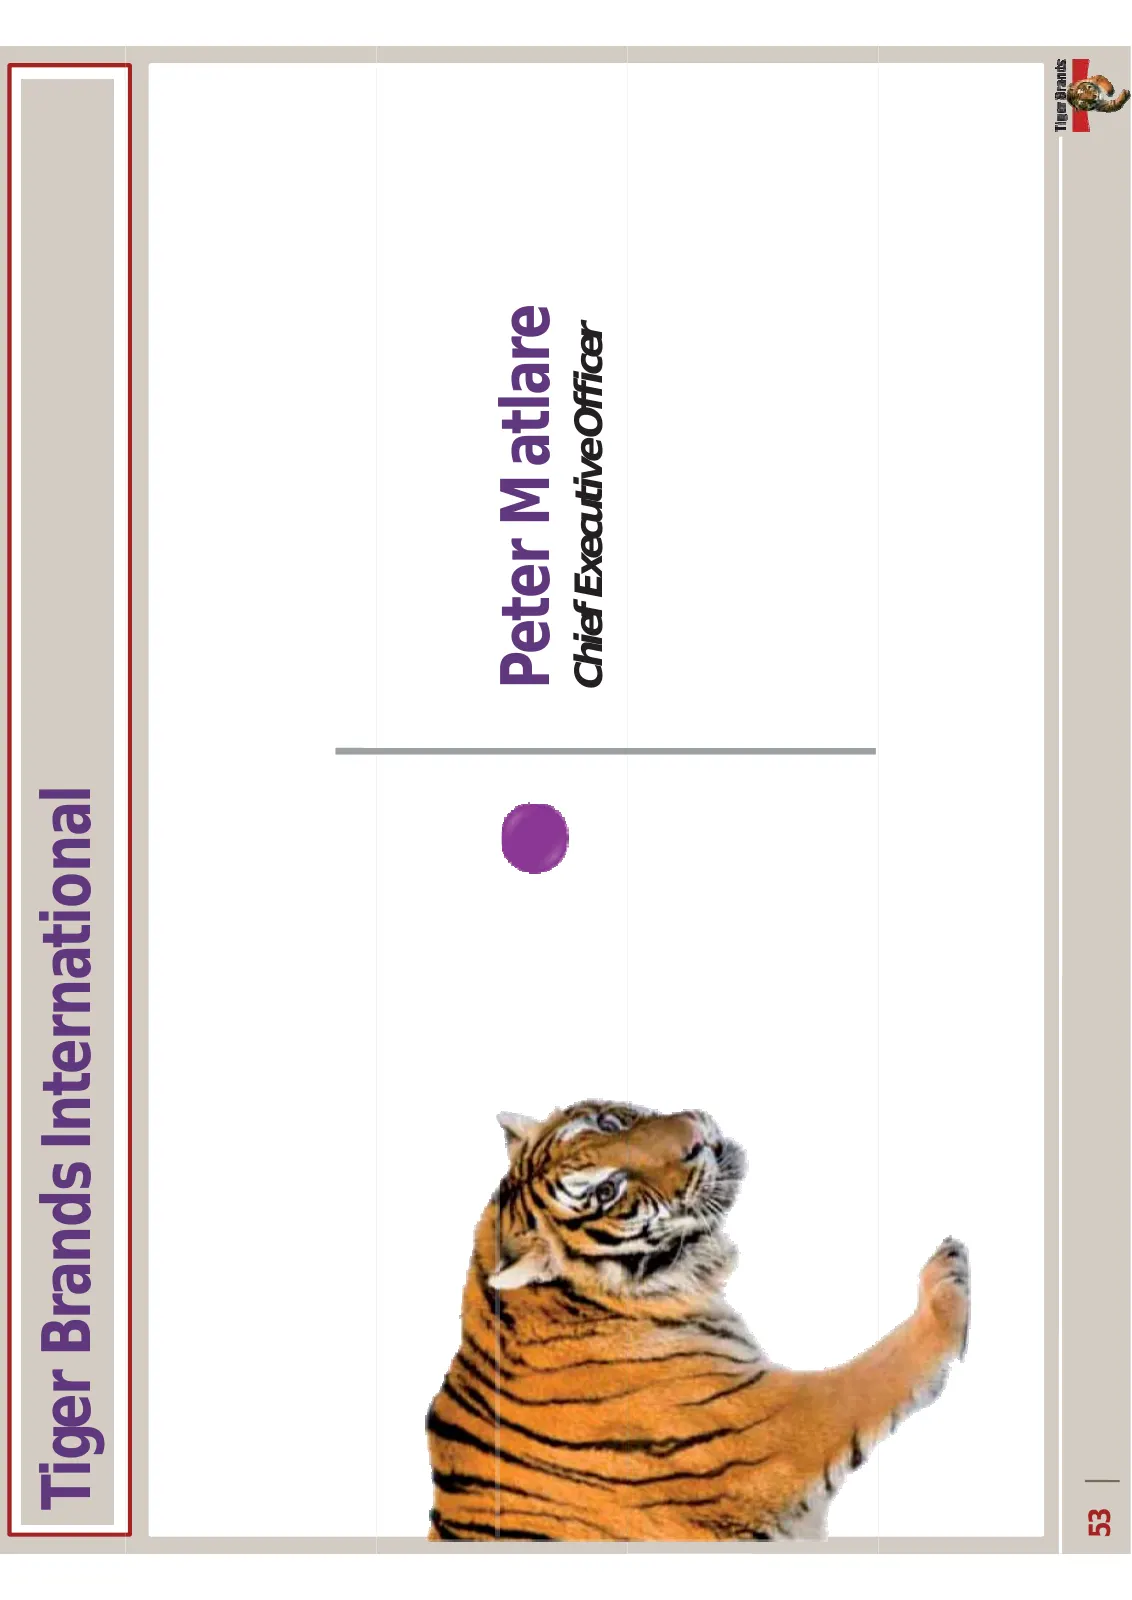
TigerBrandsInternational PeterMatlare ChiefExecutiveOfficer 53
Slide 54: Tiger Brands International: Priority Zones
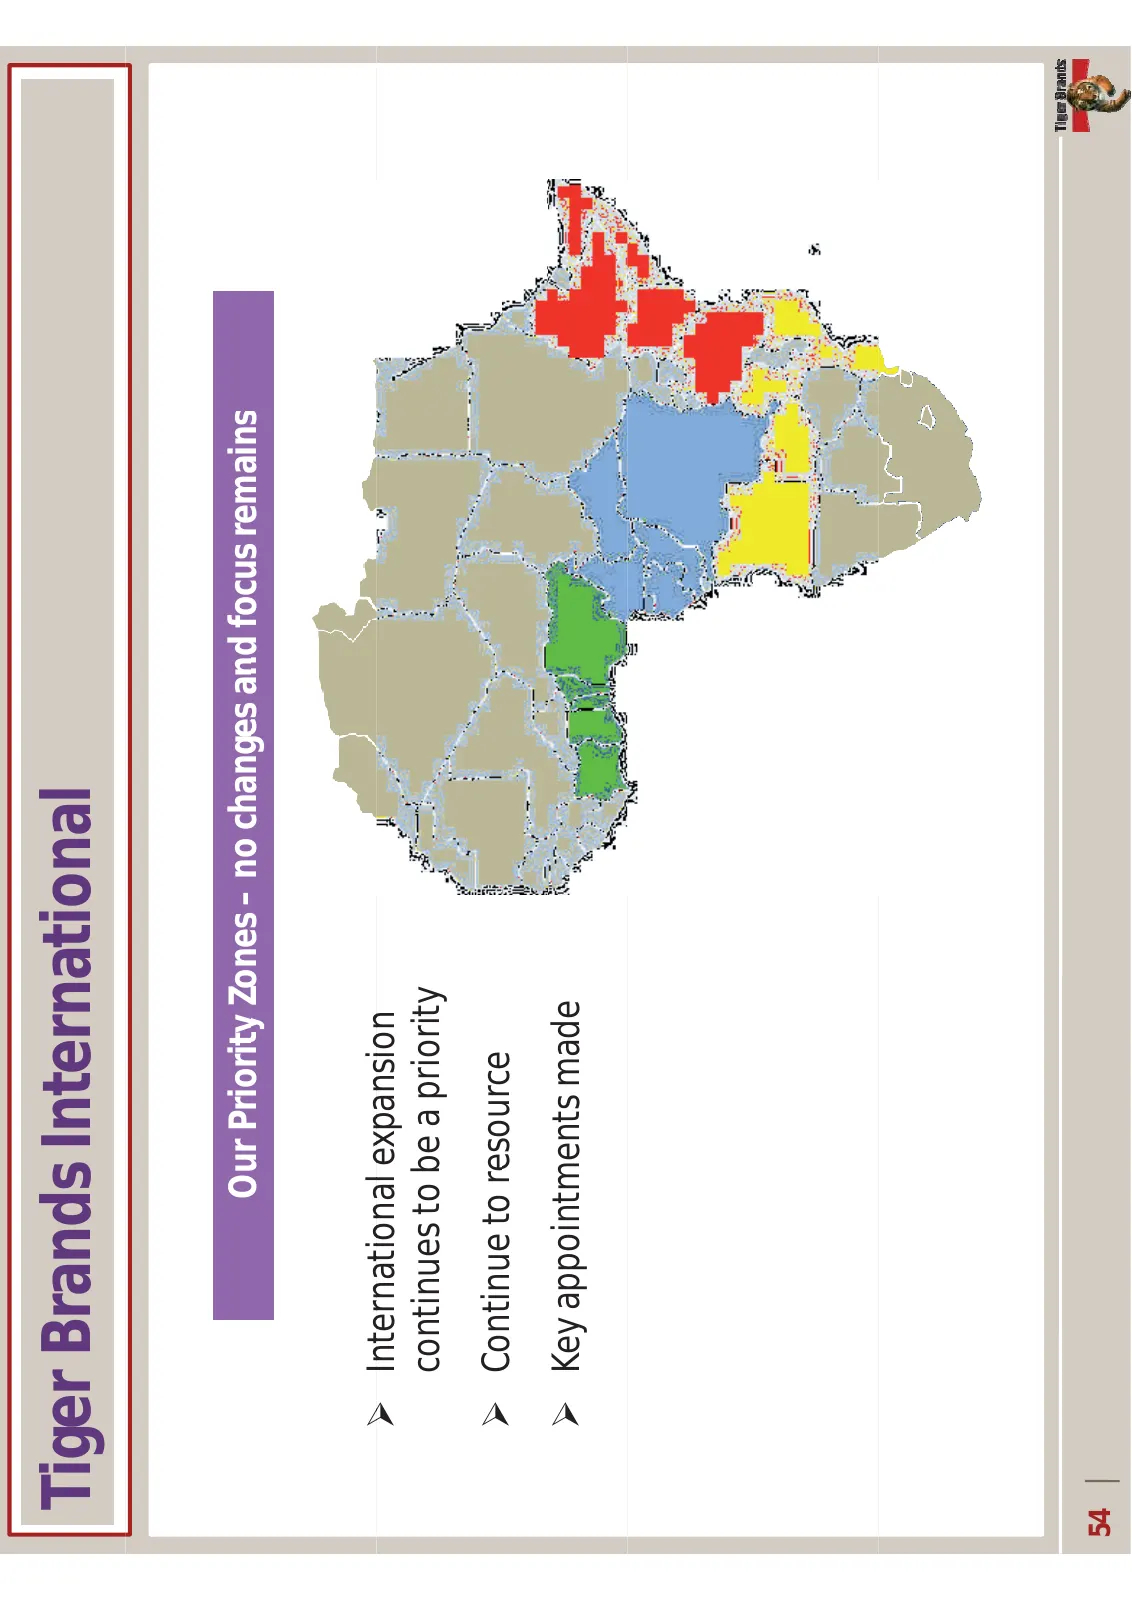
TigerBrandsInternational Our Priority Zones – nochangesandfocusremains OurPriorityZones no changes and focus remains ¾ International Internationalexpansion expansion continuestobeapriority ¾ Continuetoresource Continue to resource ¾ Keyappointmentsmade 54
Slide 55: Tiger Brands International: Key metrics
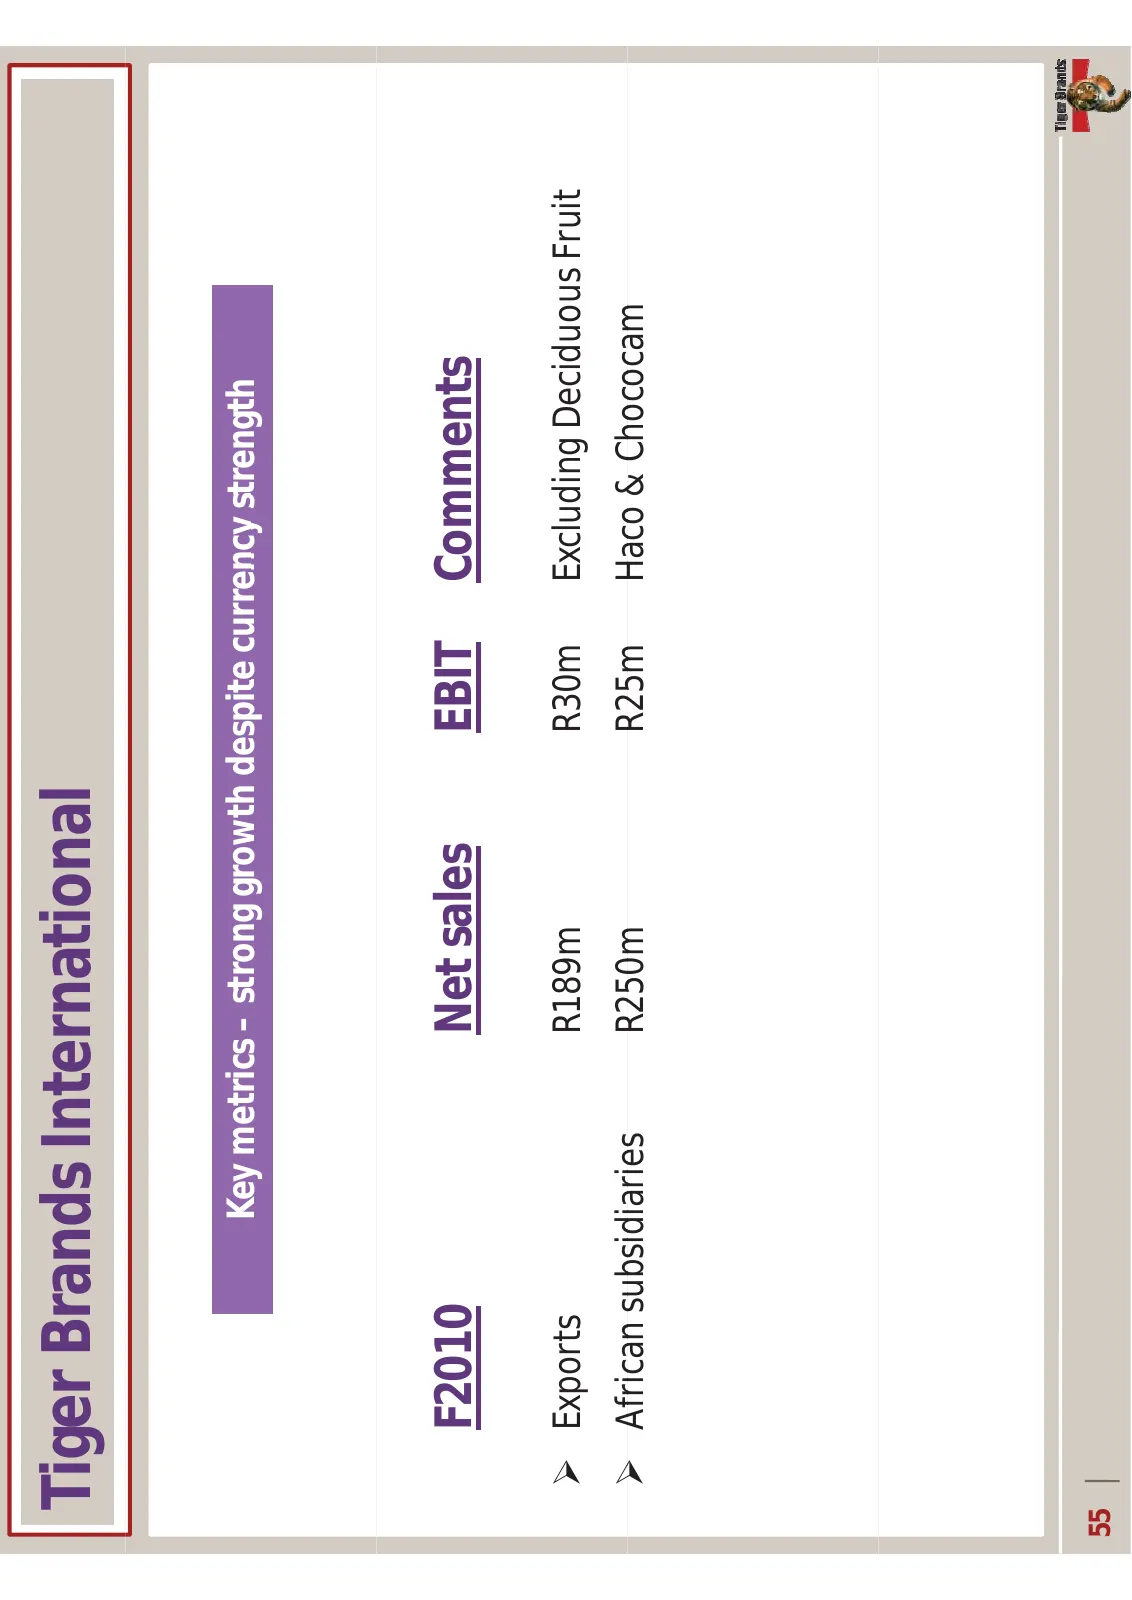
TigerBrandsInternational Key metrics – stronggrowthdespitecurrencystrength Keymetrics strong growth despite currency strength F2010 Netsales EBIT Comments ¾ Exports R189m R30m ExcludingDeciduousFruit ¾ Africansubsidiaries African subsidiaries R250m R25m Haco & Chococam Haco&Chococam 55
Slide 56: Tiger Brands International: Exports
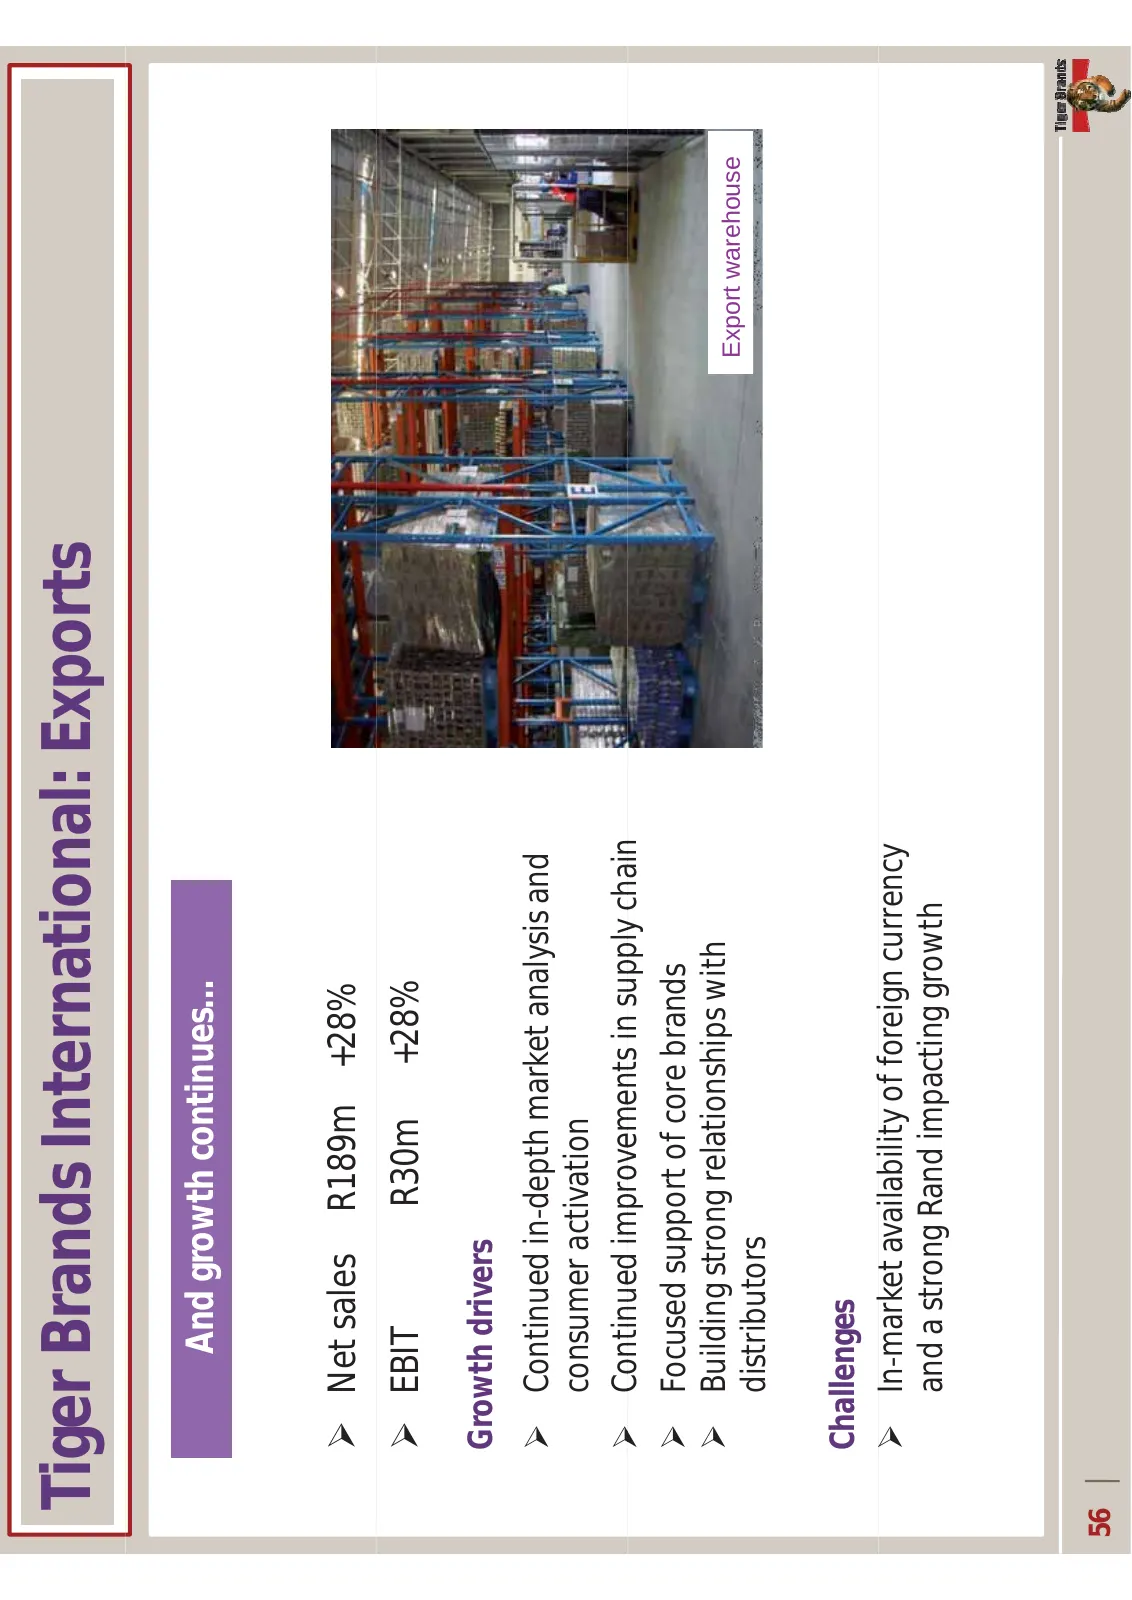
TigerBrandsInternational:Exports Andgrowthcontinues… ¾ NetsalesR189m+28% ¾ EBITR30m+28% Growthdrivers ¾ ContinuedinͲdepthmarketanalysisand consumeractivation ¾ Continuedimprovementsinsupplychain Continued improvements in supply chain ¾ Focusedsupportofcorebrands ¾ Buildingstrongrelationshipswith Exp
Slide 57: Exports: Investing in key countries
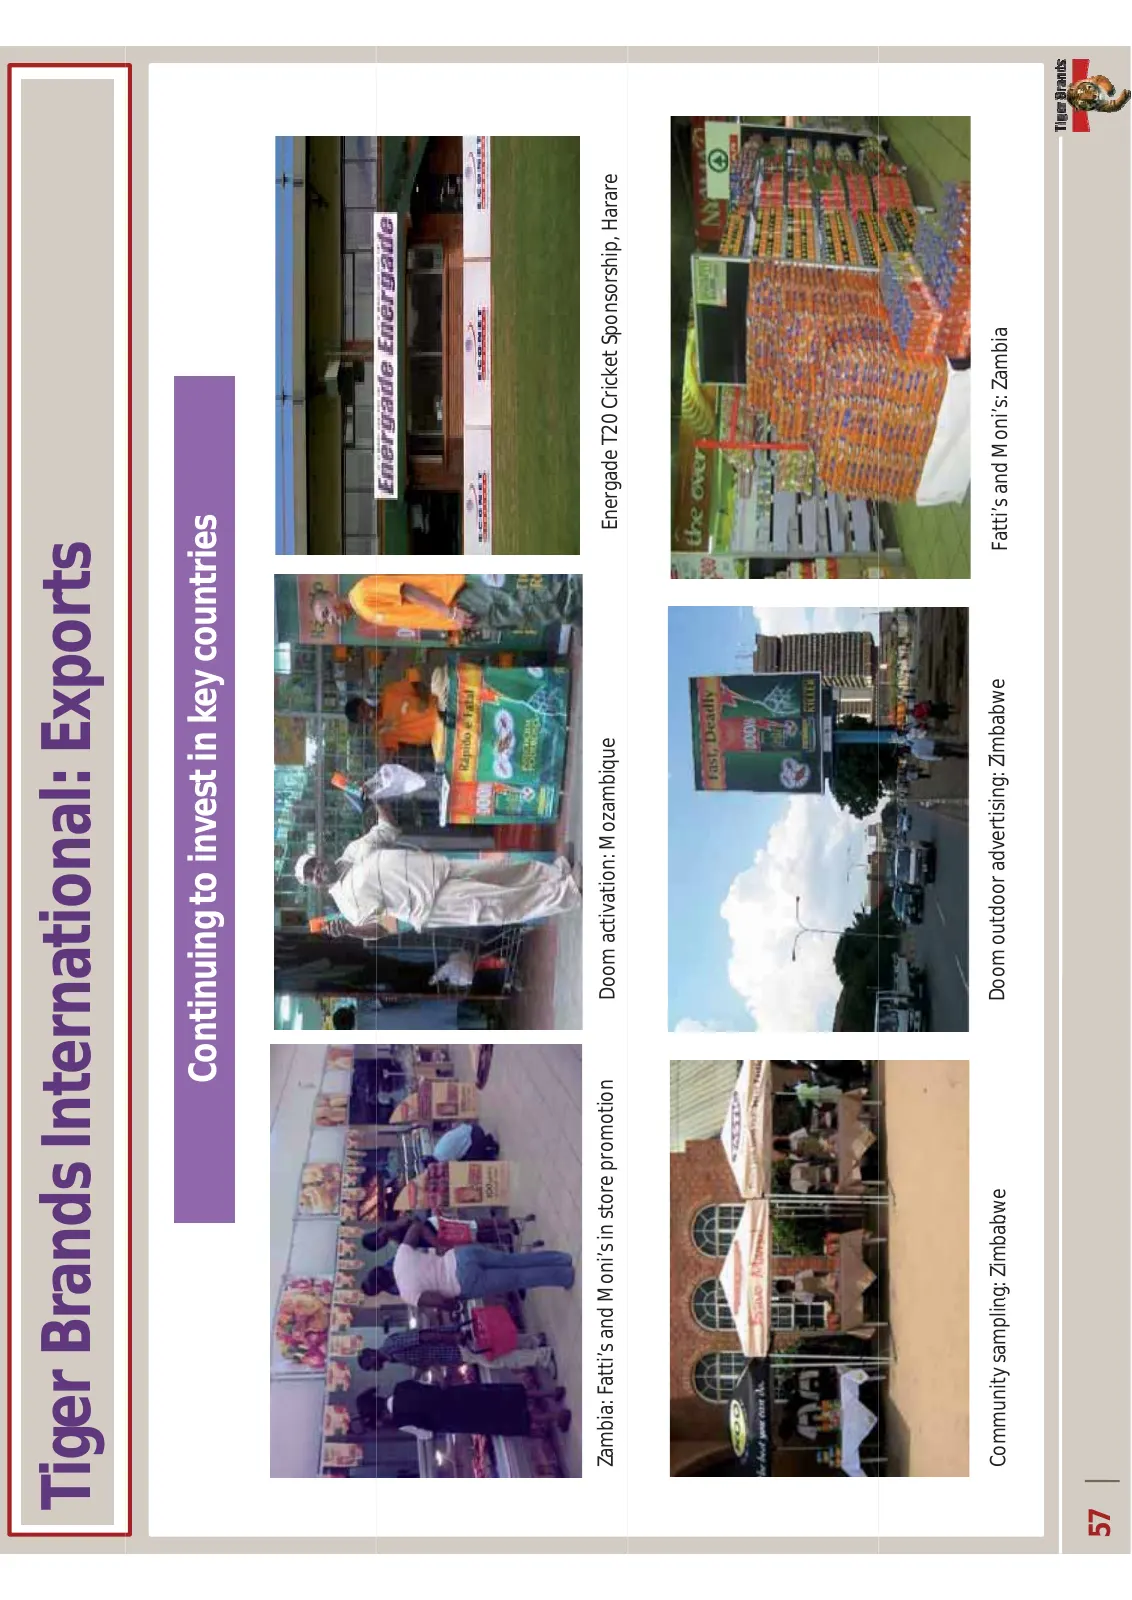
TigerBrandsInternational:Exports Continuingtoinvestinkeycountries Zambia:Fatti’sandMoni’sinstorepromotion Doomactivation:Mozambique EnergadeT20CricketSponsorship,Harare Community sampling: Zimbabwe Communitysampling:Zimbabwe Doom outdoor advertising: Zimbabwe Doomoutdooradvertising:Zimbabwe Fatti’ss
Slide 58: Haco (Kenya): Delivering on the strategy
TigerBrandsInternational:Haco(Kenya) Deliveringonthestrategy G GrowthDrivers h i Localcurrency: ¾ Expandedpenetration Sales+18%onPY ¾ Improved service levels Improvedservicelevels EBIT+41%onPY ¾ Investmentinfacilities ¾ g Increasedmarketinginvestment ¾ IncreasedpenetrationofSAbrands 58
Slide 59: Haco (Kenya): Strong brands
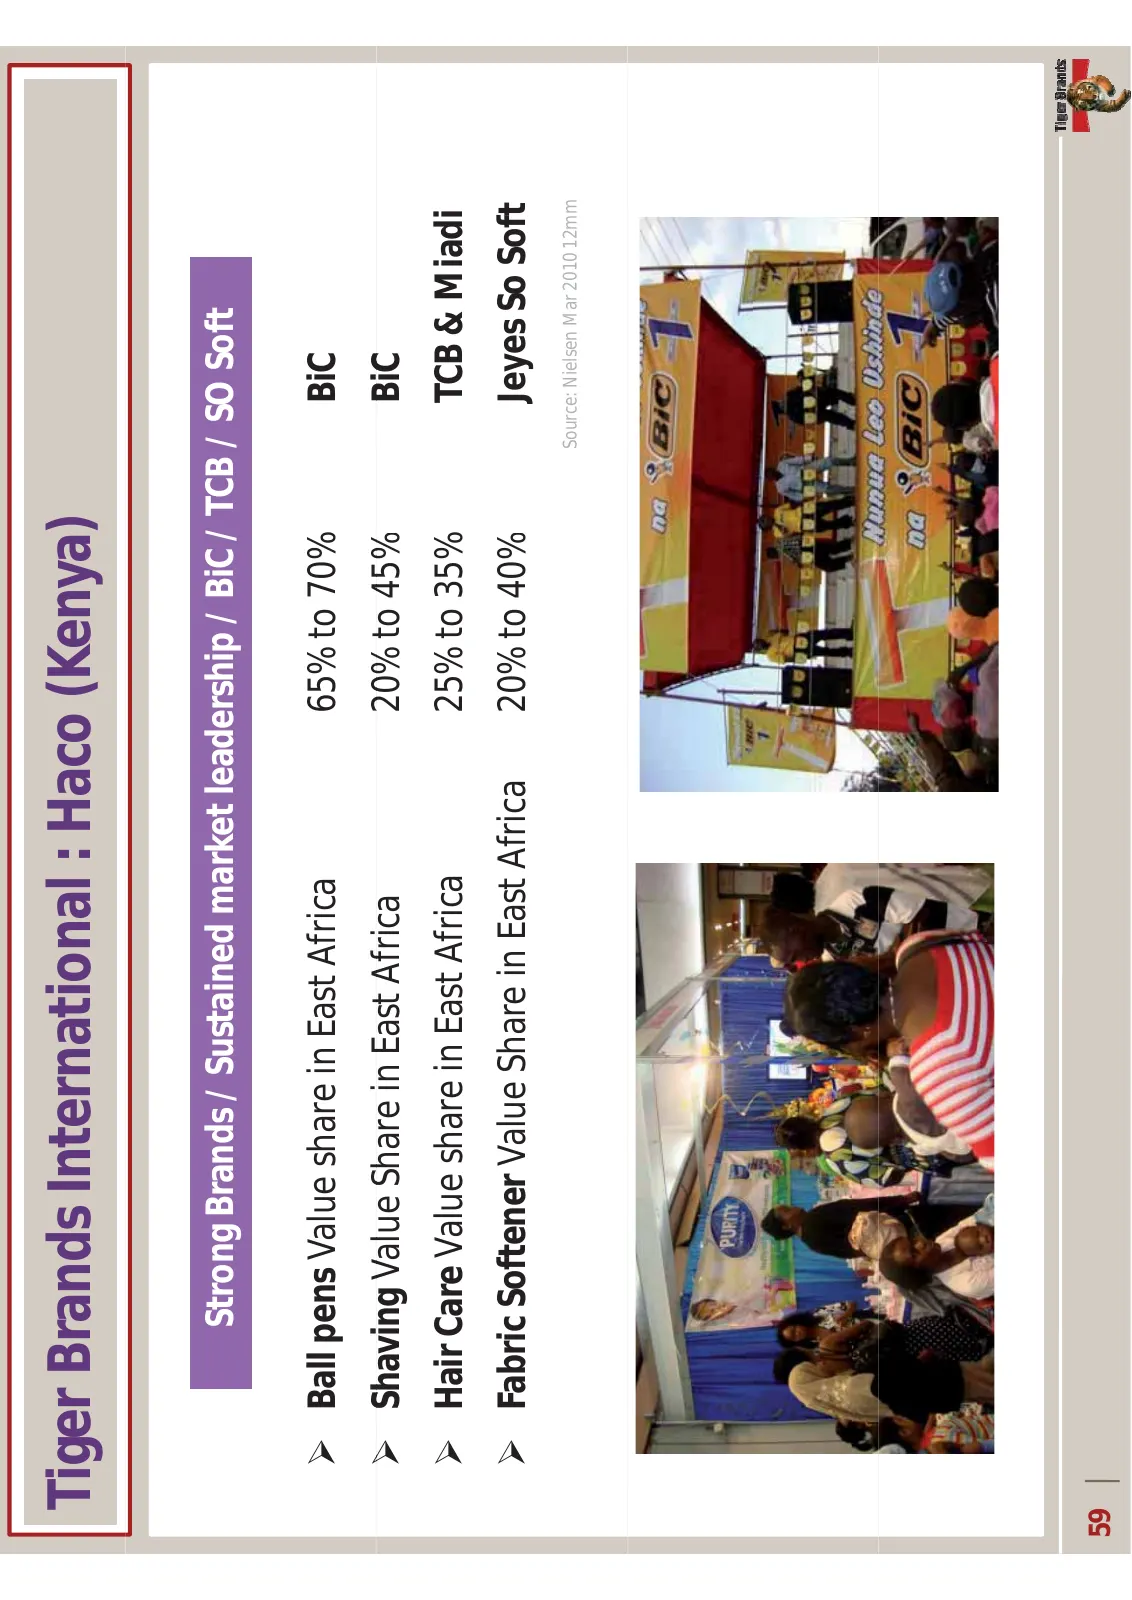
TigerBrandsInternational:Haco(Kenya) StrongBrands/Sustainedmarketleadership/BiC/TCB/SOSoft ¾ BallpensValueshareinEastAfrica 65%to70% BiC ¾ ShavingValue Sh i V l ShareinEastAfrica Sh i E Af i 20% 45% 20%to45% BiC ¾ HairCareValueshareinEastAfrica 25%to35% TCB&Miadi ¾ FabricSoftenerValueShareinEastAfri
Slide 60: Chococam (Cameroon)
Chococam(Cameroon) ChococamǦ Cameroon Integrationcontinues ¾ LocalcurrencyNetSales Local currency Net Sales Ͳ5%vsPY Ͳ5% vs PY ¾ LocalcurrencyEBIT Ͳ2%vsPY Inhibitors ¾ Factoryconstraintshamperservicelevels Factory constraints hamper service levels ¾ Sustainableplatformforfuturegrowth: • ReͲalignmento
Slide 61: Summary - TBI
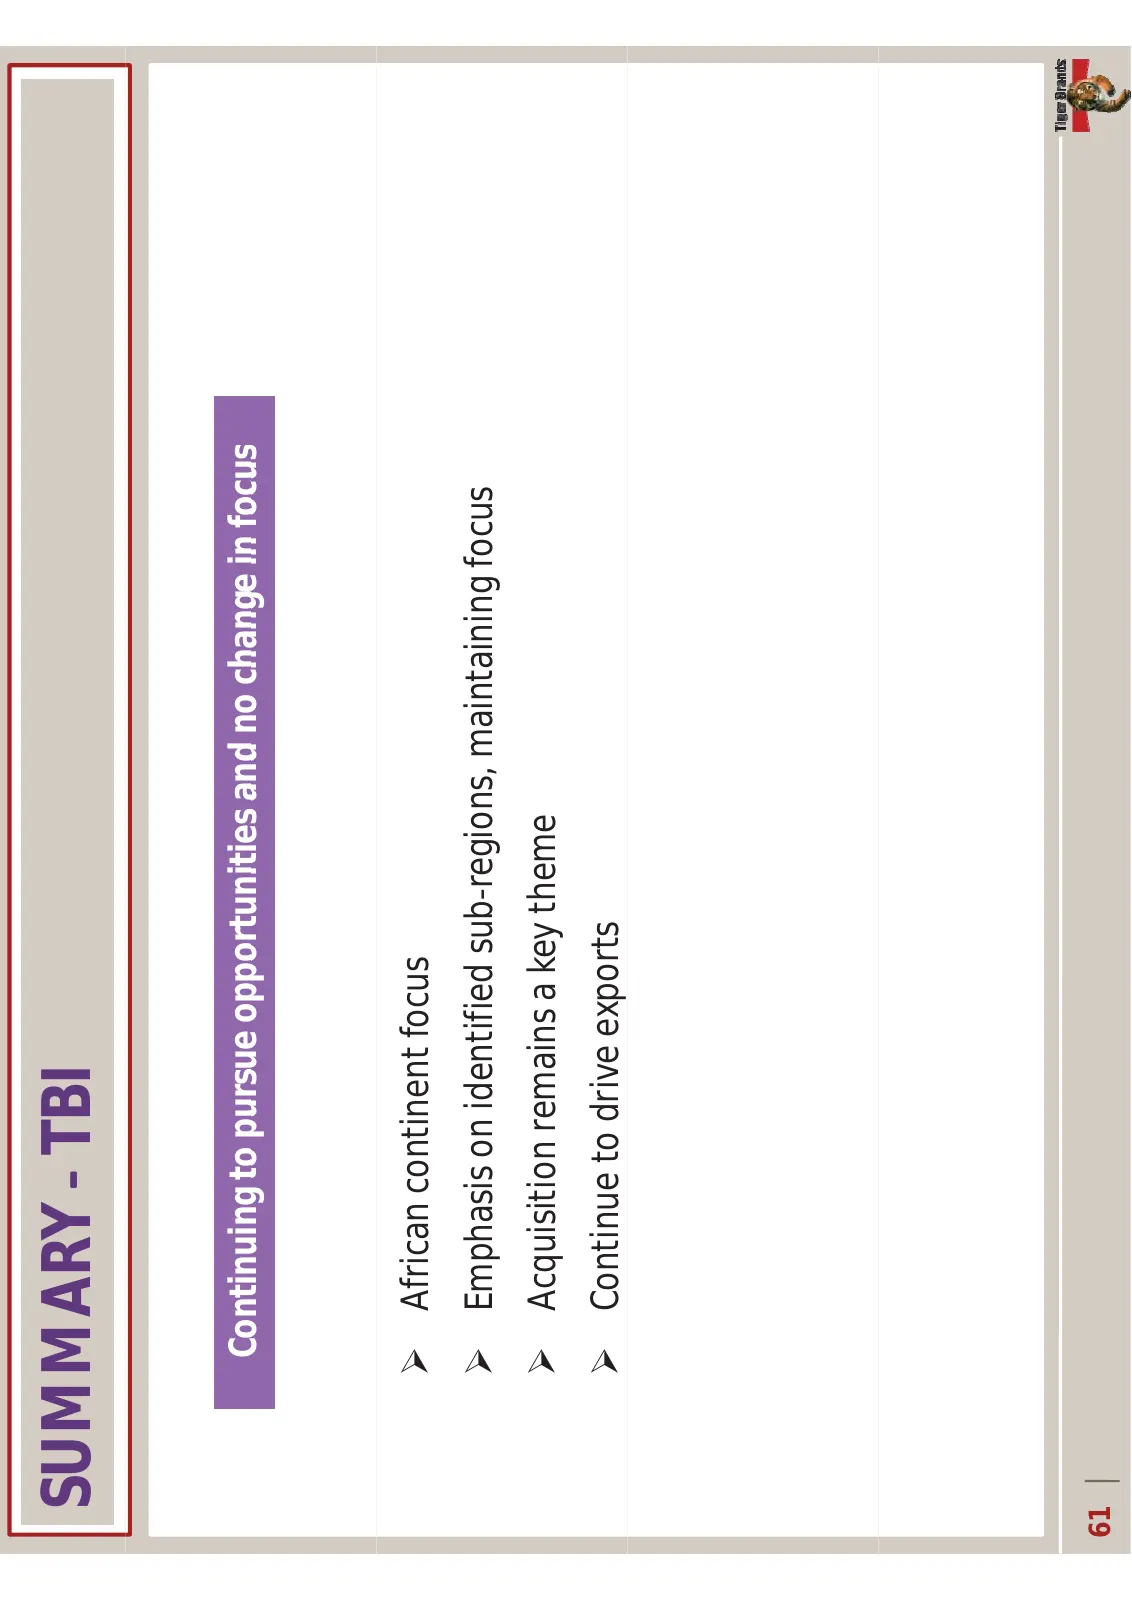
SUMMARYͲ TBI Continuing to pursue opportunities and no change in focus Continuingtopursueopportunitiesandnochangeinfocus ¾ Africancontinentfocus ¾ EmphasisonidentifiedsubͲregions,maintainingfocus ¾ Acquisitionremainsakeytheme ¾ Continuetodriveexports 61
Slide 62: Outlook
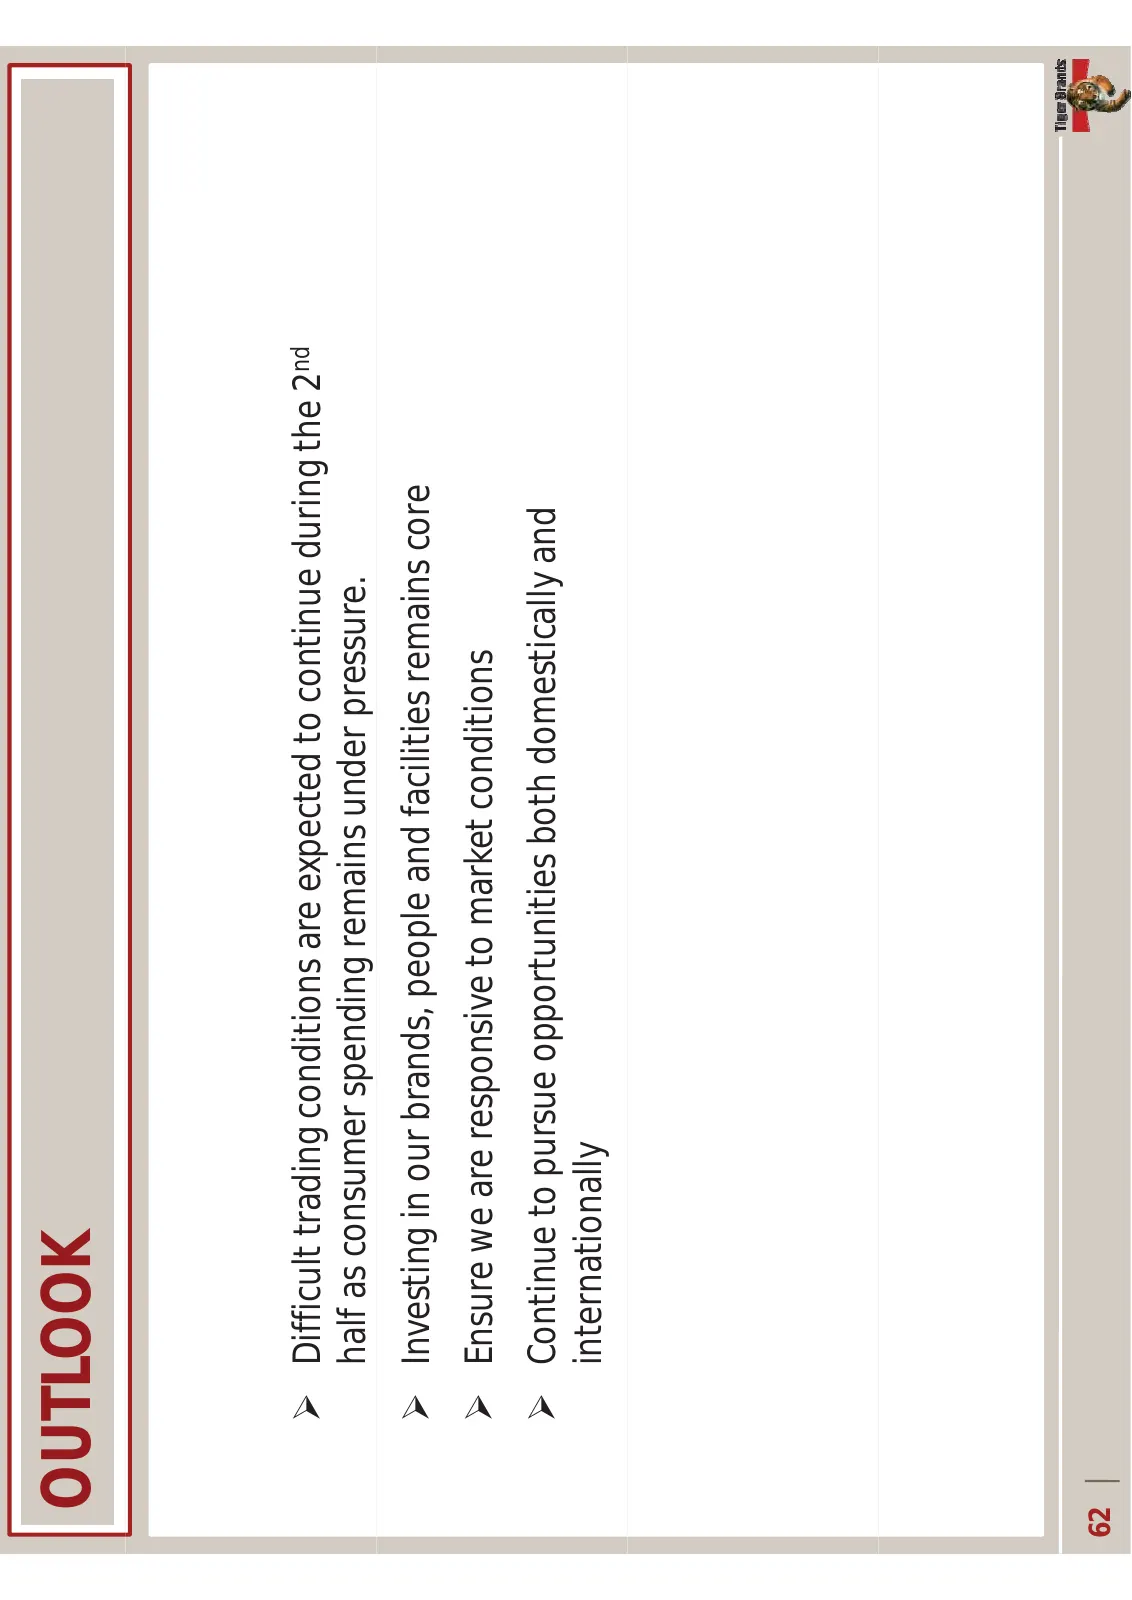
OUTLOOK ¾ Difficulttradingconditionsareexpectedtocontinueduringthe2nd halfasconsumerspendingremainsunderpressure. ¾ Investinginourbrands,peopleandfacilitiesremainscore ¾ Ensureweareresponsivetomarketconditions ¾ Continuetopursueopportunitiesbothdomesticallyand internationally 62

Slide 63: 2010
63 2010
Source: Internet Archive copy of tigerbrands.com
More decks from Tiger Brands Limited
 H1 2026 Earnings Presentation37 slides · Jun 1, 2026
 H1 2026 Earnings Presentation38 slides · Jun 1, 2026
 FY2025 Earnings Presentation38 slides · Nov 26, 2025
 H1 2025 Earnings Presentation43 slides · May 28, 2025
 H1 FY2024 Earnings Presentation38 slides · May 27, 2024
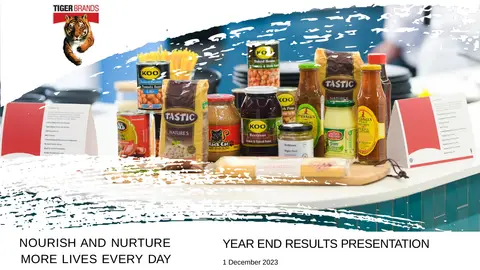 FY2023 Earnings Presentation45 slides · Dec 1, 2023