Endeavour Mining PLC · TSX:EDV
Endeavour Mining — Investor Presentation (November 2026)
170 slides from Endeavour Mining's investor presentation, November 2026

Slide 1: Corporate Presentation
CORPORATE PRESENTATION November 2026 1
Slide 2: Table of Contents
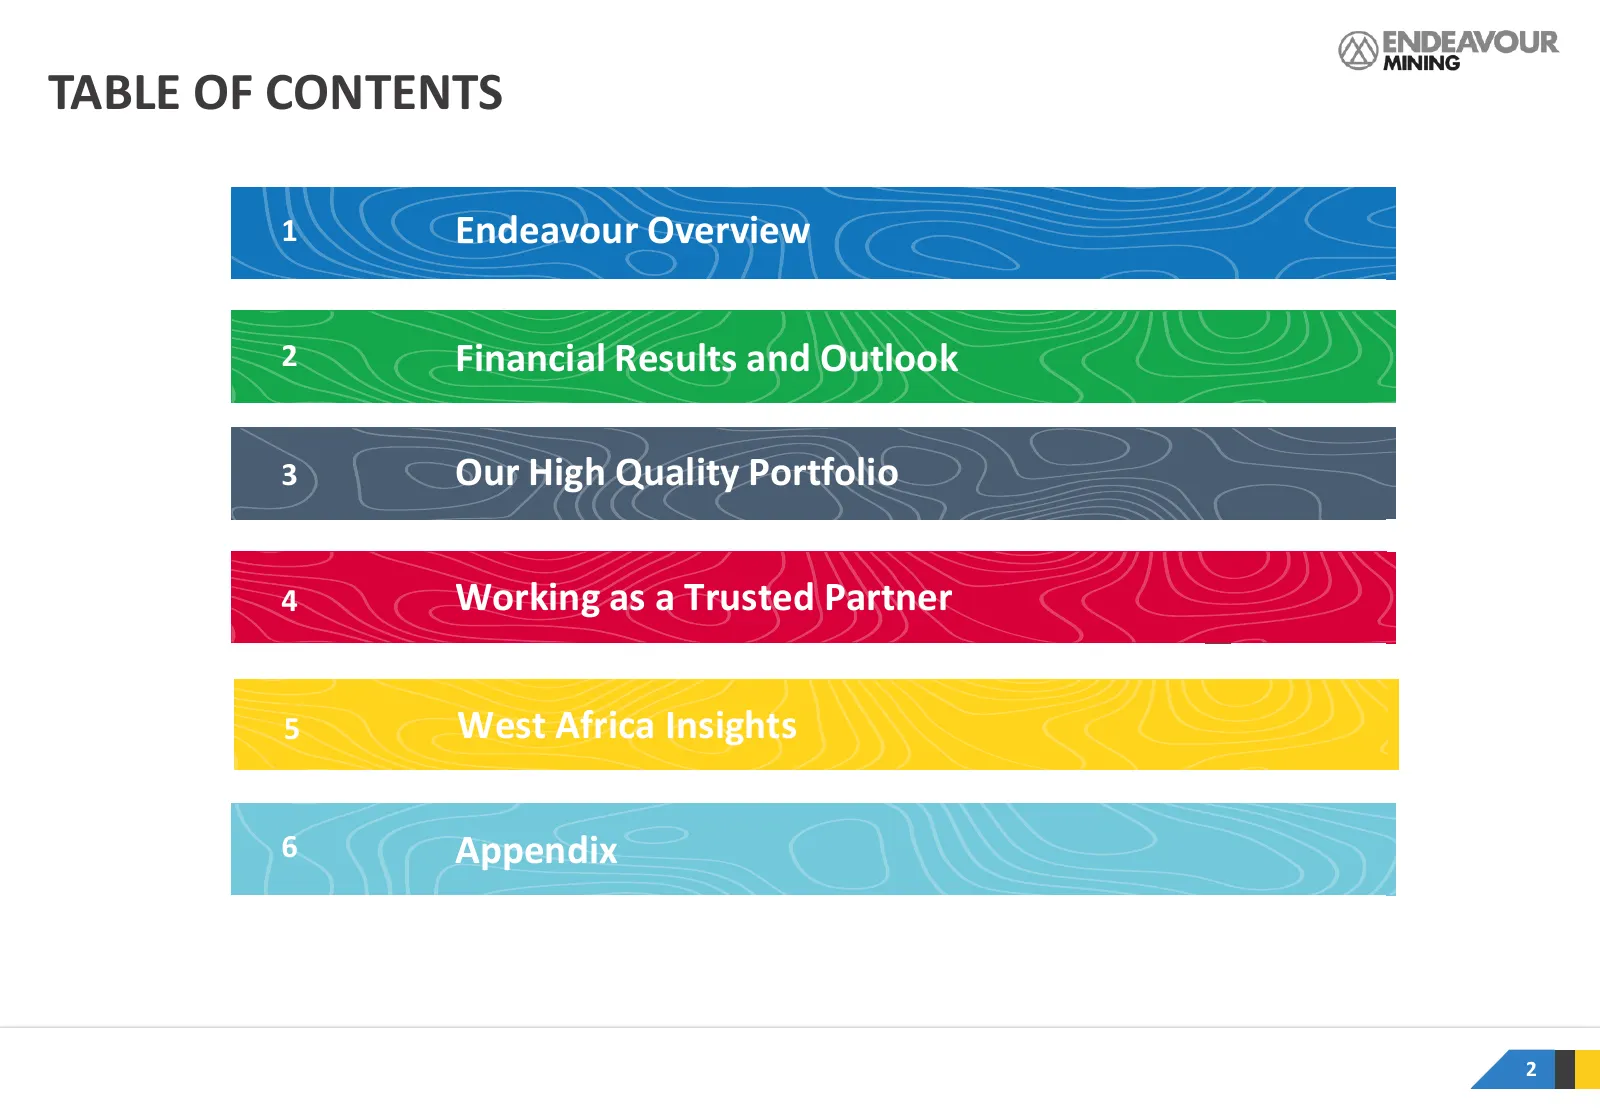
TABLE OF CONTENTS 1 Endeavour Overview 2 Financial Results and Outlook 3 Our High Quality Portfolio 4 Working as a Trusted Partner 5 West Africa Insights 6 Appendix 2

Slide 3: Disclaimer & Forward-Looking Statements
DISCLAIMER & FORWARD-LOOKING STATEMENTS Some of the indicators used by Endeavour in this presentation represent non-IFRS financial changes in the administration of laws, policies and practices in the jurisdictions in which Endeavour measures, including sustaining capital per ounce, non-sustaining ca
Slide 4: Endeavour Overview
ENDEAVOUR OVERVIEW 1
Slide 5: Endeavour Has an Unmatched Competitive Advantage
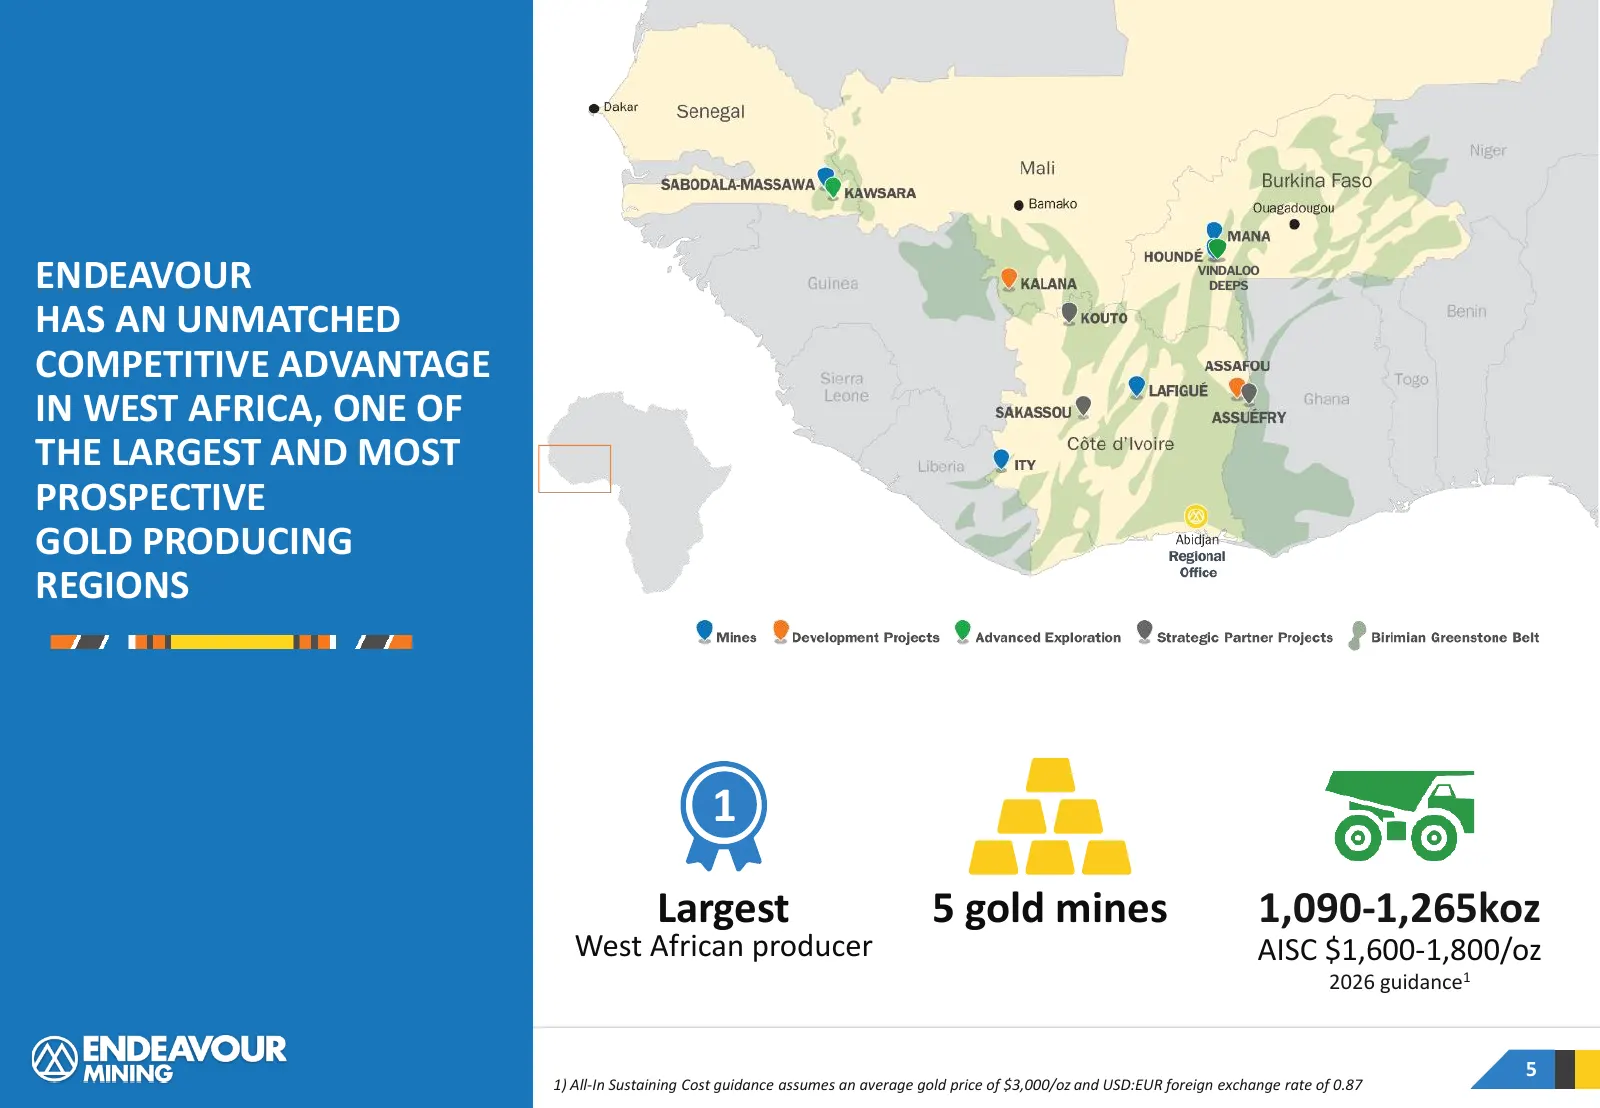
ENDEAVOUR VINDALOO DEEPS HAS AN UNMATCHED COMPETITIVE ADVANTAGE IN WEST AFRICA, ONE OF THE LARGEST AND MOST PROSPECTIVE GOLD PRODUCING REGIONS 1 Largest 5 gold mines 1,090-1,265koz West African producer AISC $1,600-1,800/oz 2026 guidance1 5 1) All-In Sustaining Cost guidance assumes an average gold
Slide 6: Company Profile
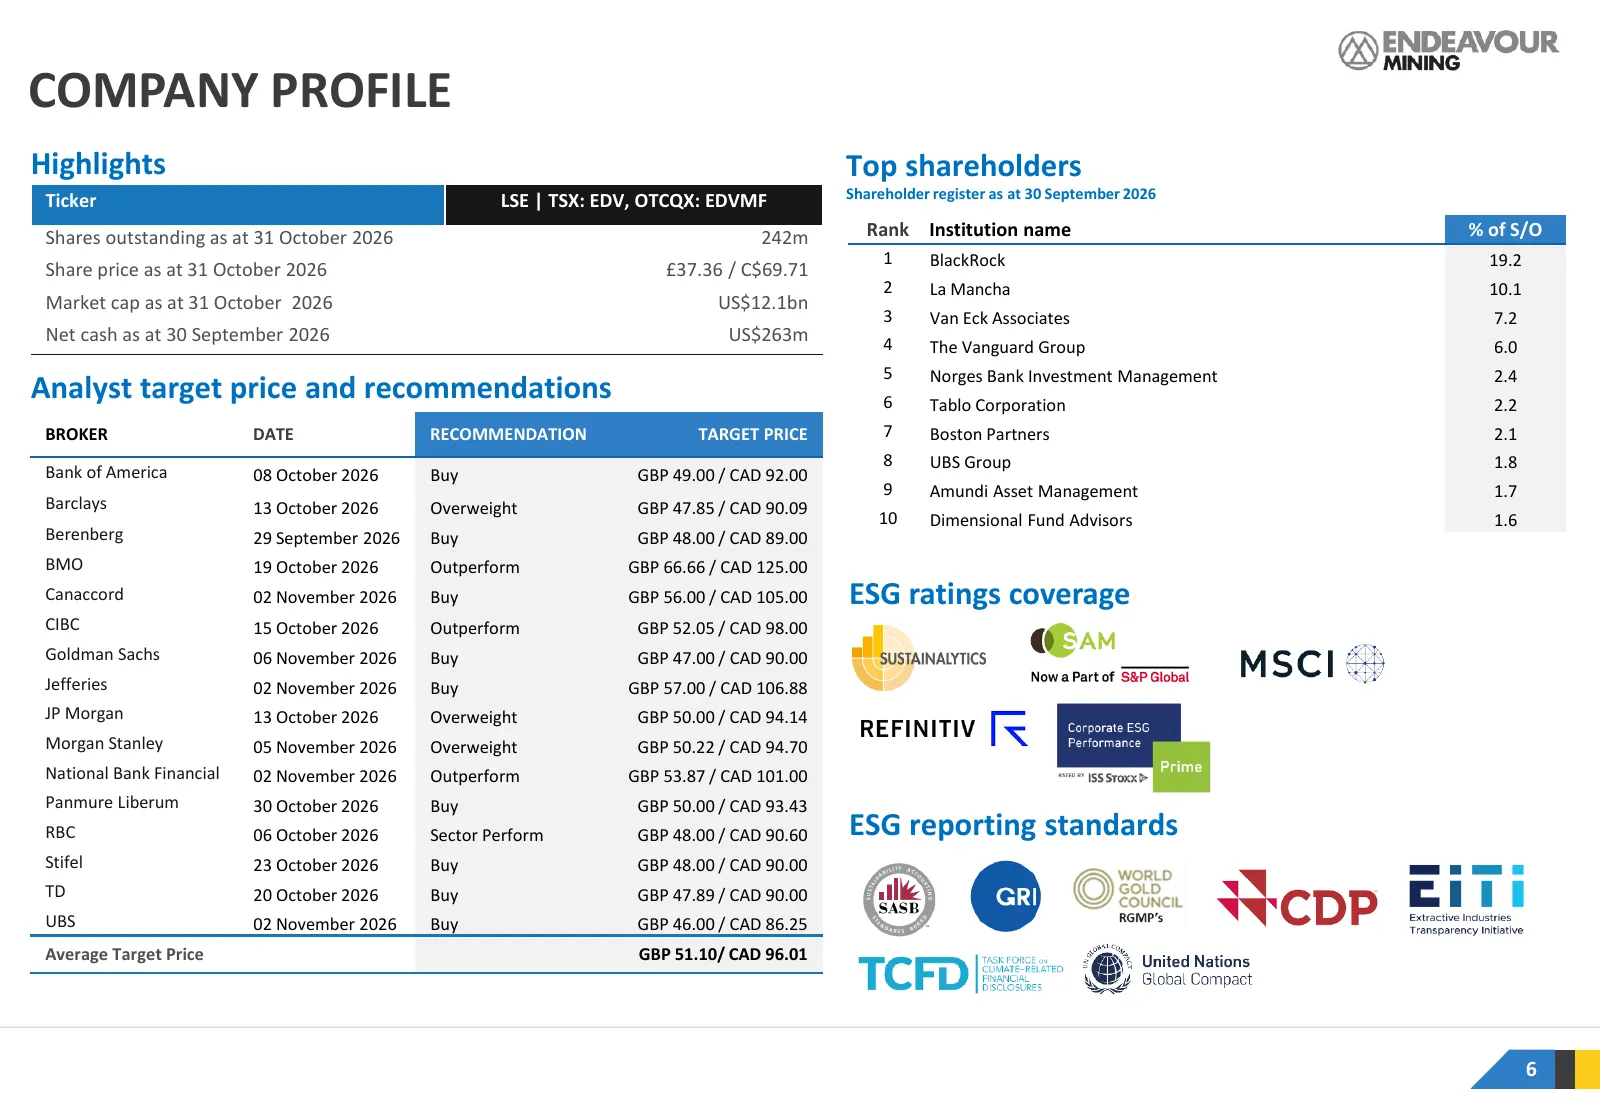
COMPANY PROFILE Highlights Top shareholders Shareholder register as at 30 September 2026 Ticker LSE | TSX: EDV, OTCQX: EDVMF Shares outstanding as at 31 October 2026 242m Rank Institution name % of S/O 1 BlackRock 19.2 Share price as at 31 October 2026 £37.36 / C$69.71 2 La Mancha 10.1 Market cap as
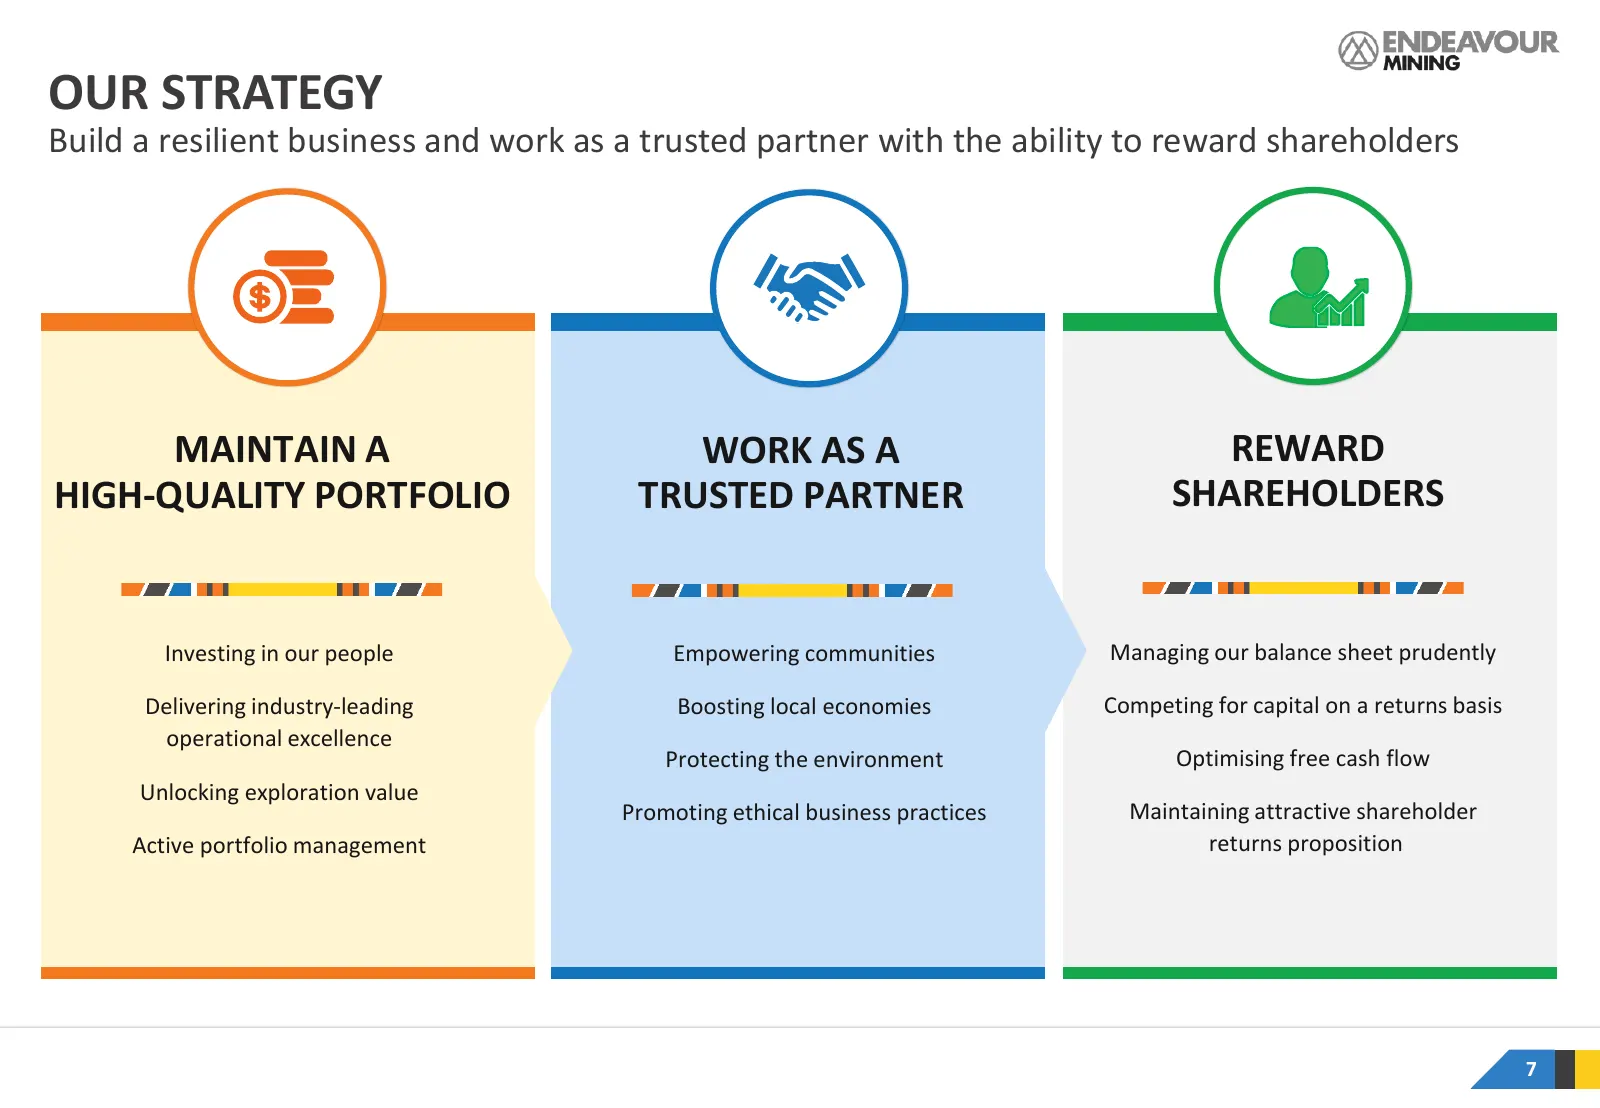
Slide 7: Our Strategy
OUR STRATEGY Build a resilient business and work as a trusted partner with the ability to reward shareholders MAINTAIN A WORK AS A REWARD HIGH-QUALITY PORTFOLIO TRUSTED PARTNER SHAREHOLDERS Investing in our people Empowering communities Managing our balance sheet prudently Delivering industry-leadin
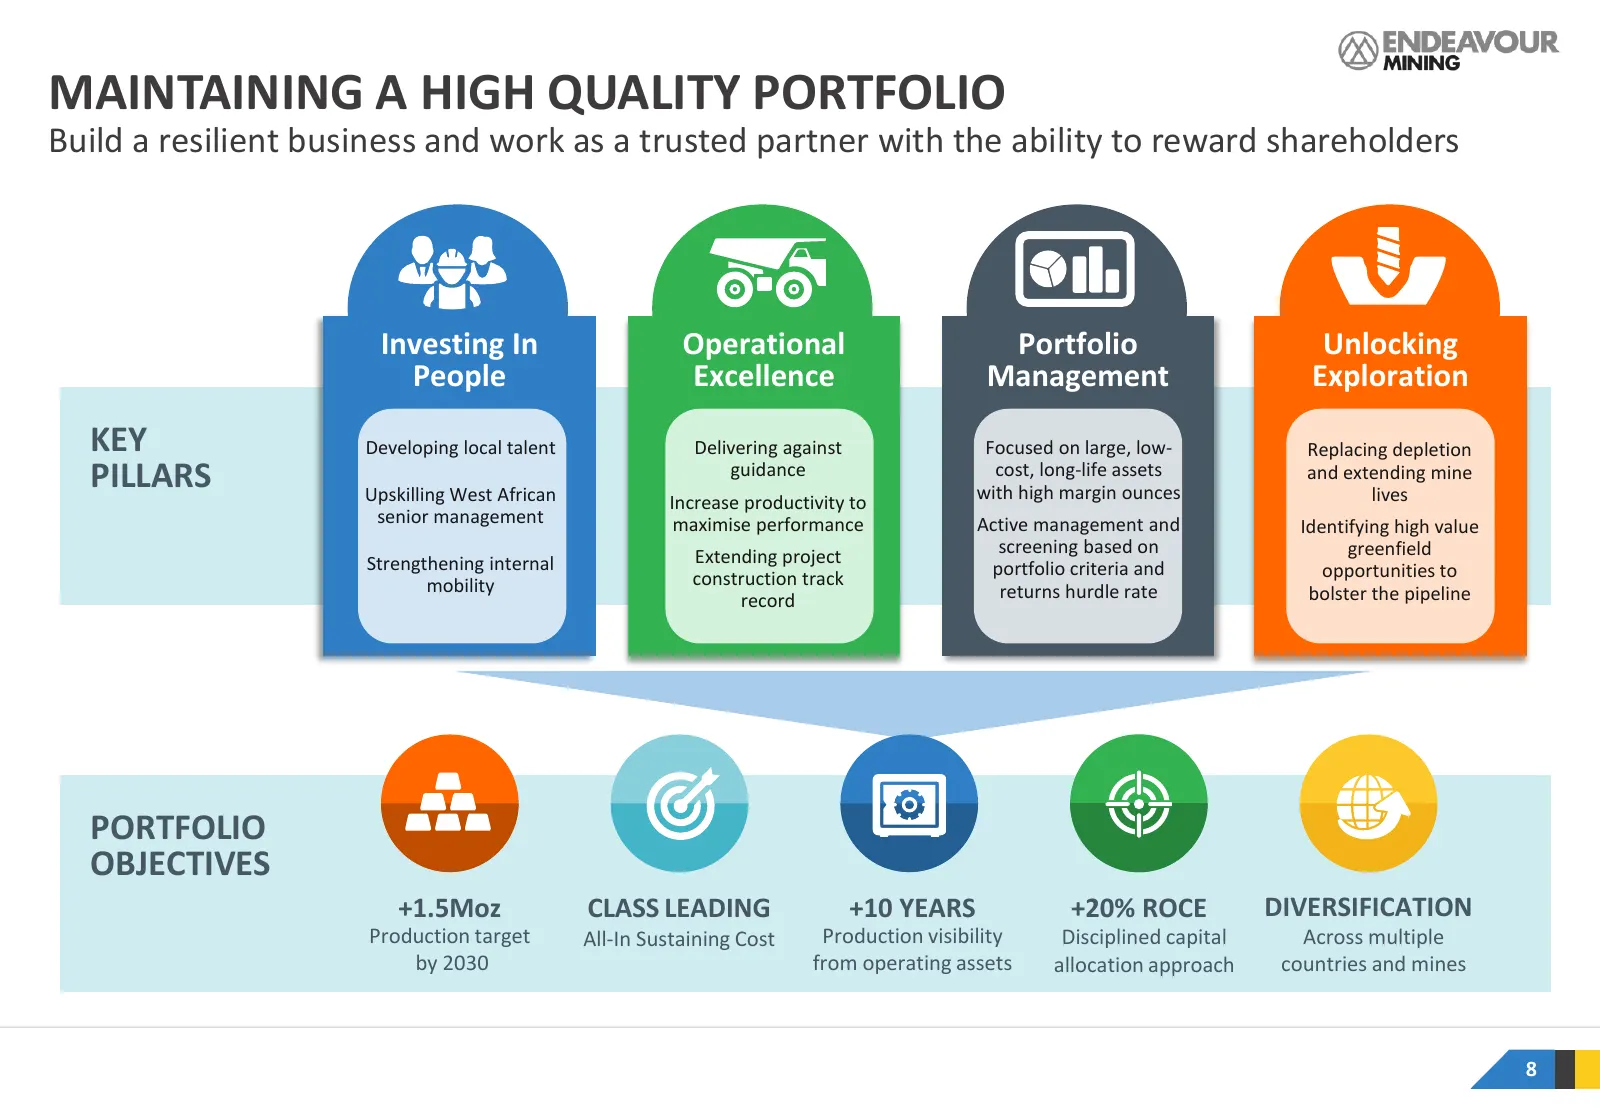
Slide 8: Maintaining a High Quality Portfolio
MAINTAINING A HIGH QUALITY PORTFOLIO Build a resilient business and work as a trusted partner with the ability to reward shareholders Investing In Operational Portfolio Unlocking People Excellence Management Exploration KEY Developing local talent Delivering against Focused on large, low- Replacing
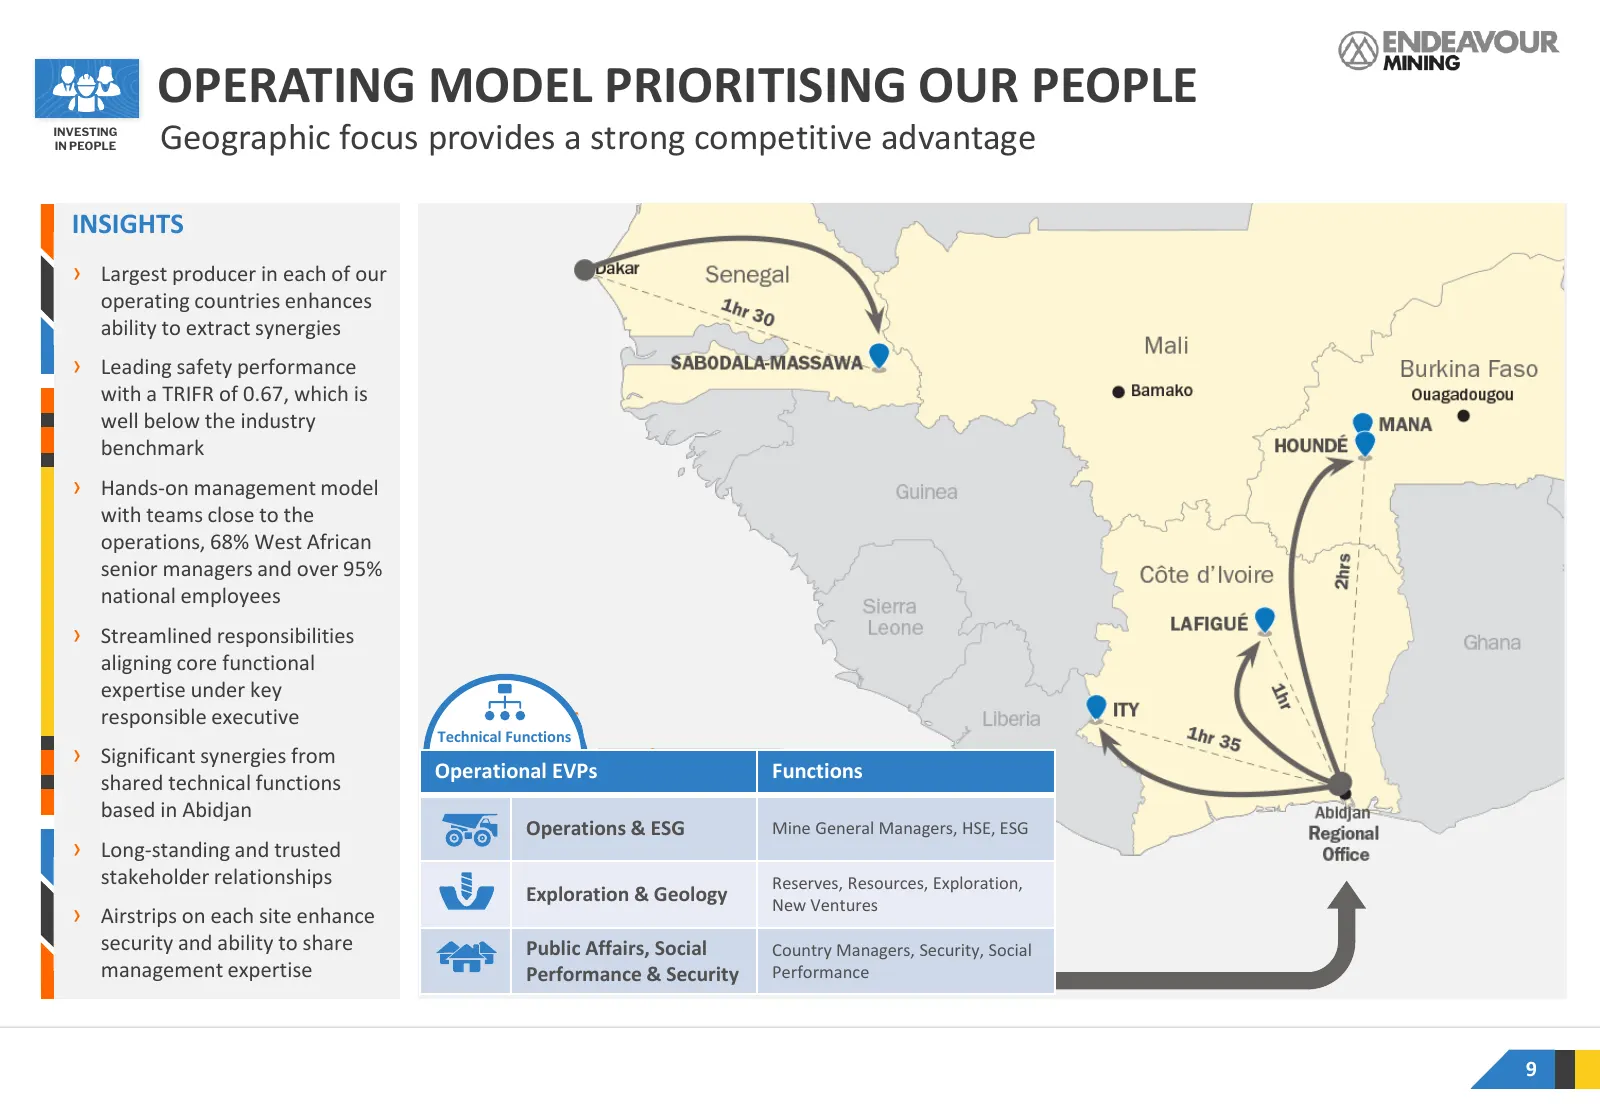
Slide 9: Operating Model Prioritising Our People
OPERATING MODEL PRIORITISING OUR PEOPLE INVESTING IN PEOPLE Geographic focus provides a strong competitive advantage INSIGHTS › Largest producer in each of our operating countries enhances ability to extract synergies › Leading safety performance with a TRIFR of 0.67, which is well below the industr
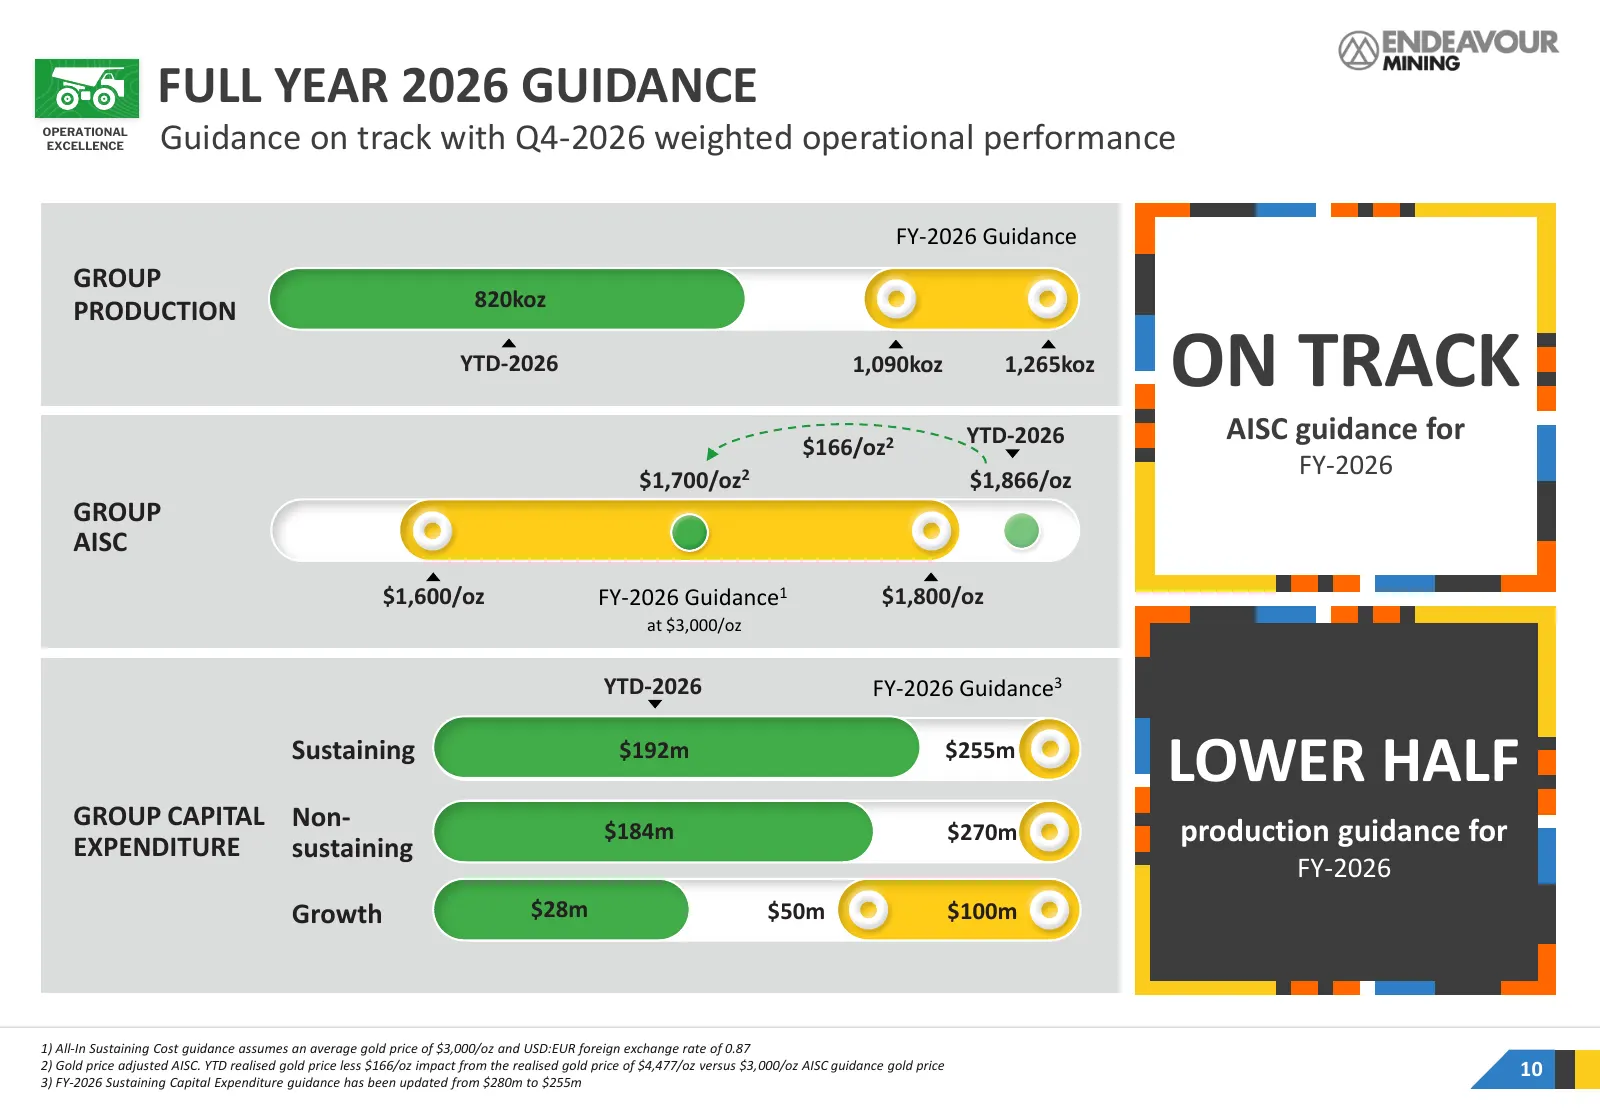
Slide 10: Full Year 2026 Guidance
FULL YEAR 2026 GUIDANCE OPERATIONAL EXCELLENCE Guidance on track with Q4-2026 weighted operational performance FY-2026 Guidance GROUP 820koz PRODUCTION YTD-2026 1,090koz 1,265koz ON TRACK YTD-2026 AISC guidance for $166/oz2 $1,700/oz2 $1,866/oz FY-2026 GROUP AISC $1,600/oz FY-2026 Guidance1 $1,800/o
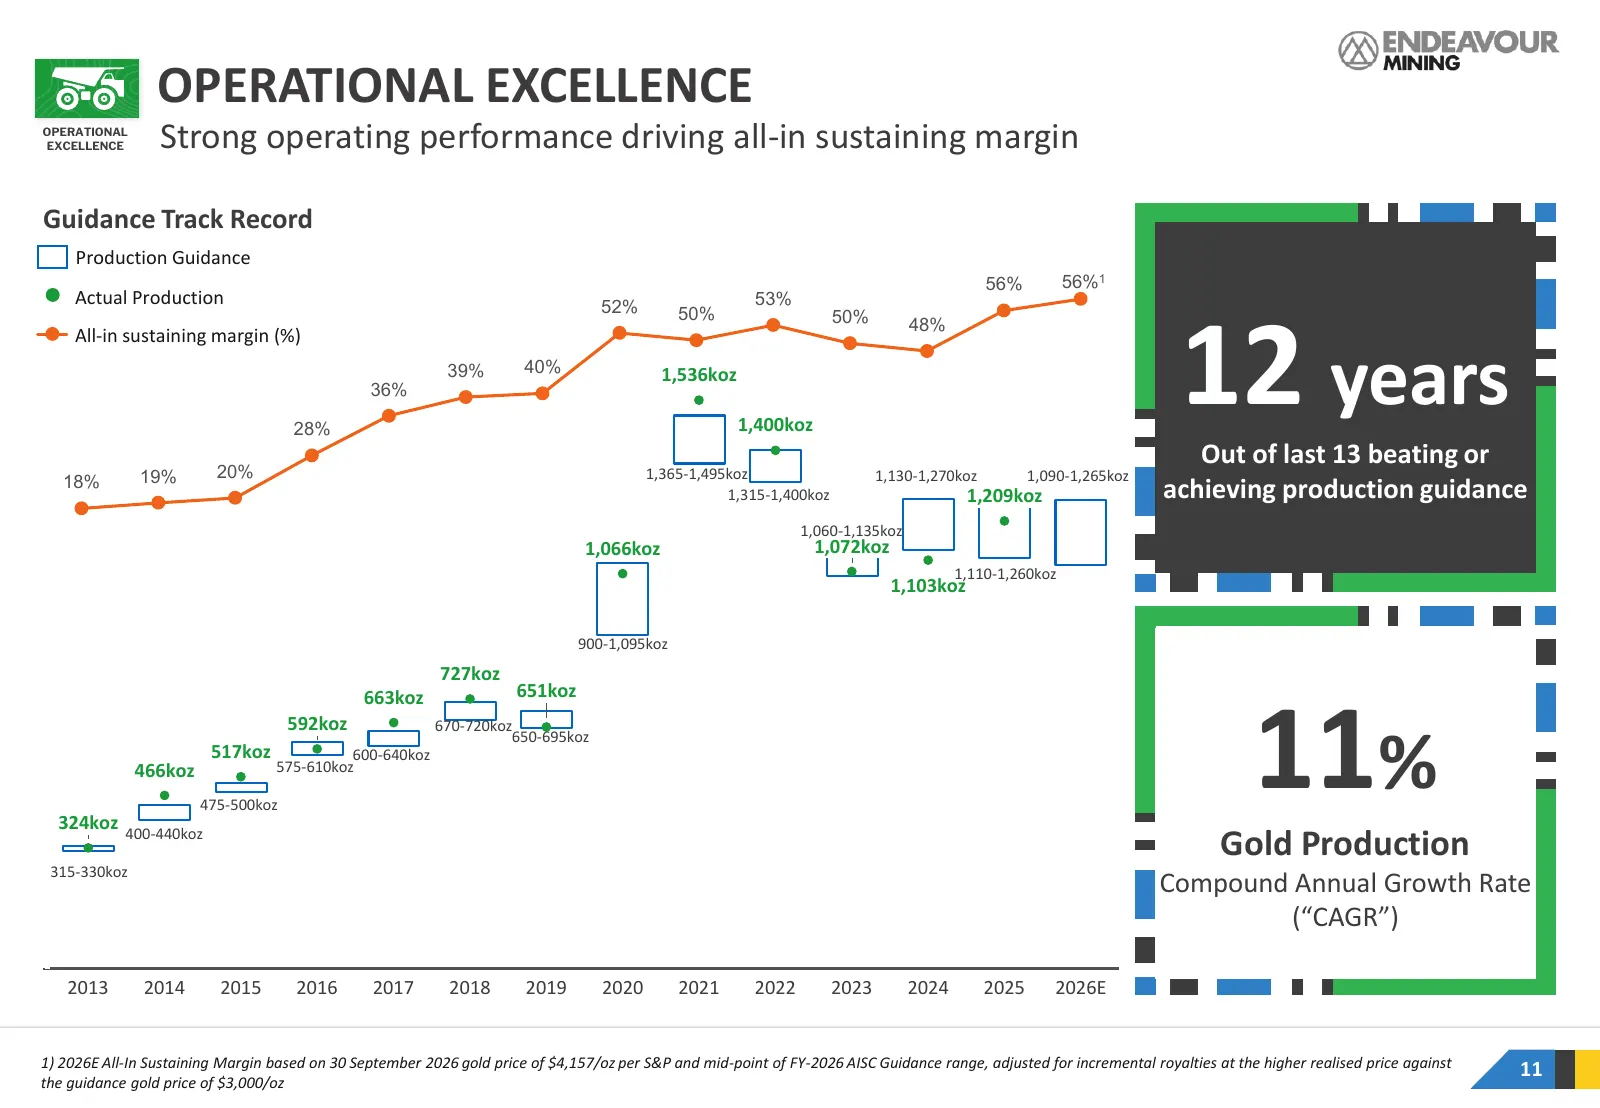
Slide 11: Operational Excellence: Guidance Track Record
OPERATIONAL EXCELLENCE OPERATIONAL EXCELLENCE Strong operating performance driving all-in sustaining margin Guidance Track Record Production Guidance 56% 56%1 Actual Production 52% 53% 50% 50% 12 years 48% All-in sustaining margin (%) 39% 40% 1,536koz 36% 28% 1,400koz Out of last 13 beating or 19% 2
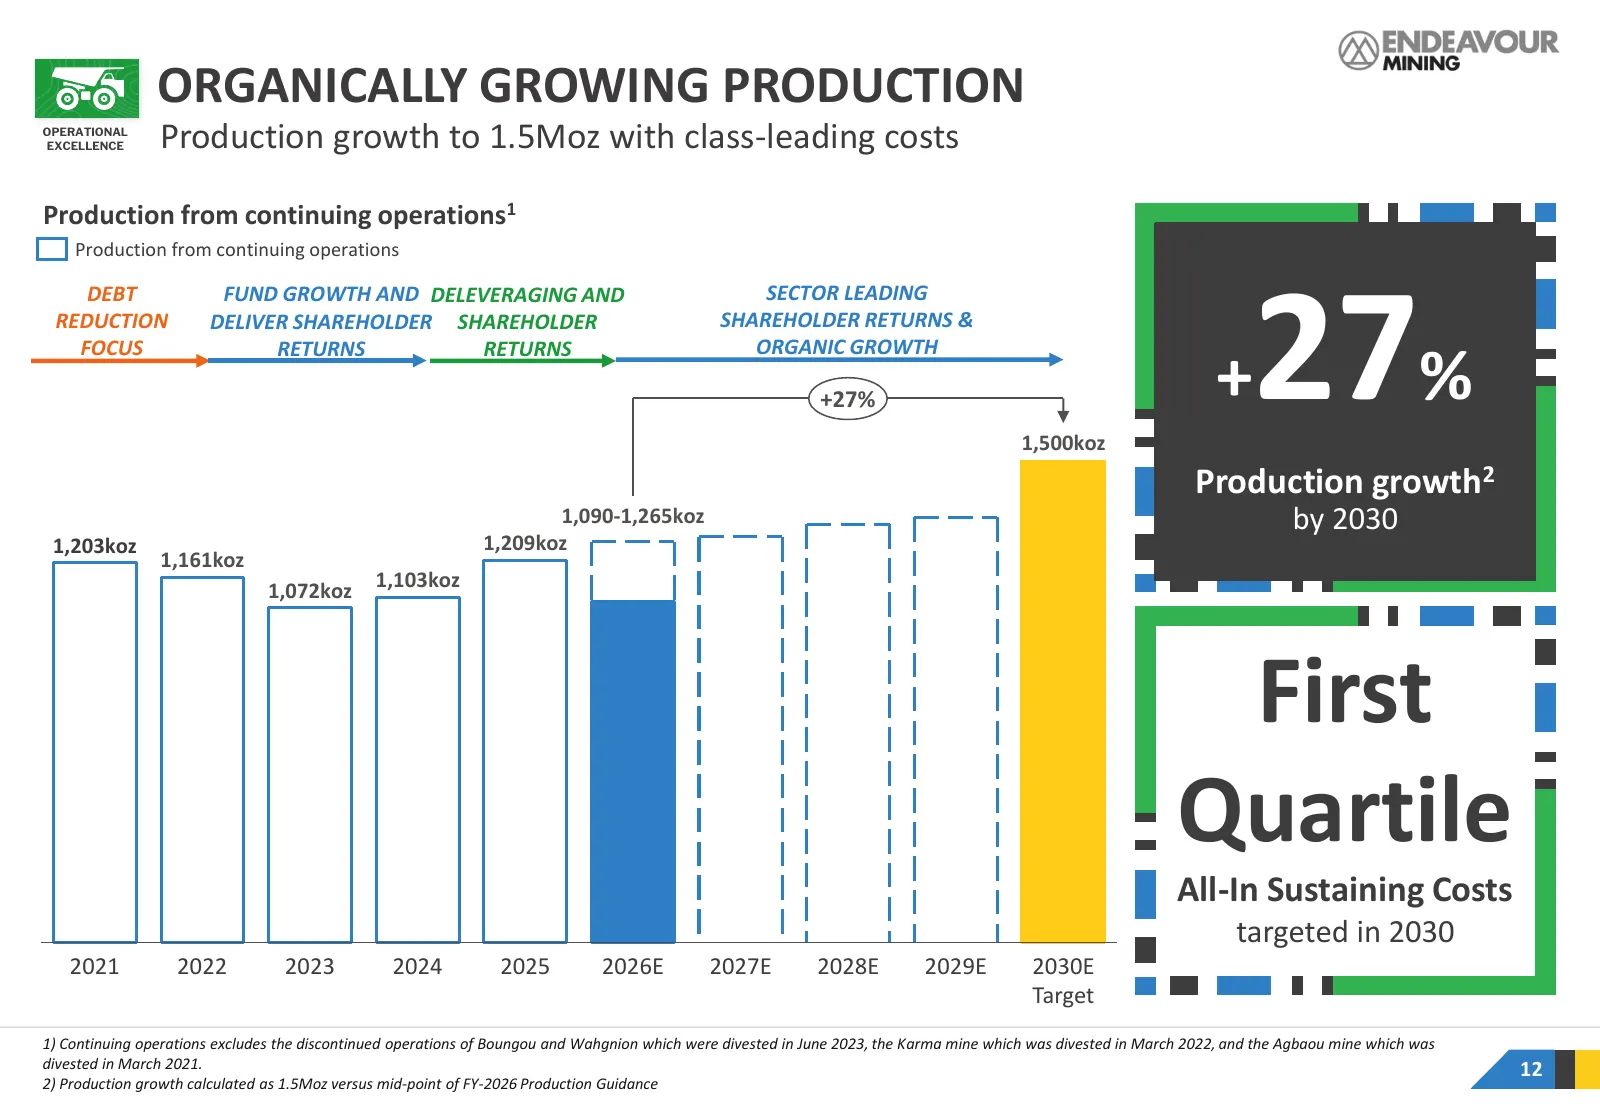
Slide 12: Organically Growing Production
ORGANICALLY GROWING PRODUCTION OPERATIONAL EXCELLENCE Production growth to 1.5Moz with class-leading costs Production from continuing operations1 Production from continuing operations 27%% 24 DEBT FUND GROWTH AND DELEVERAGING AND SECTOR LEADING REDUCTION DELIVER SHAREHOLDER SHAREHOLDER SHAREHOLDER R
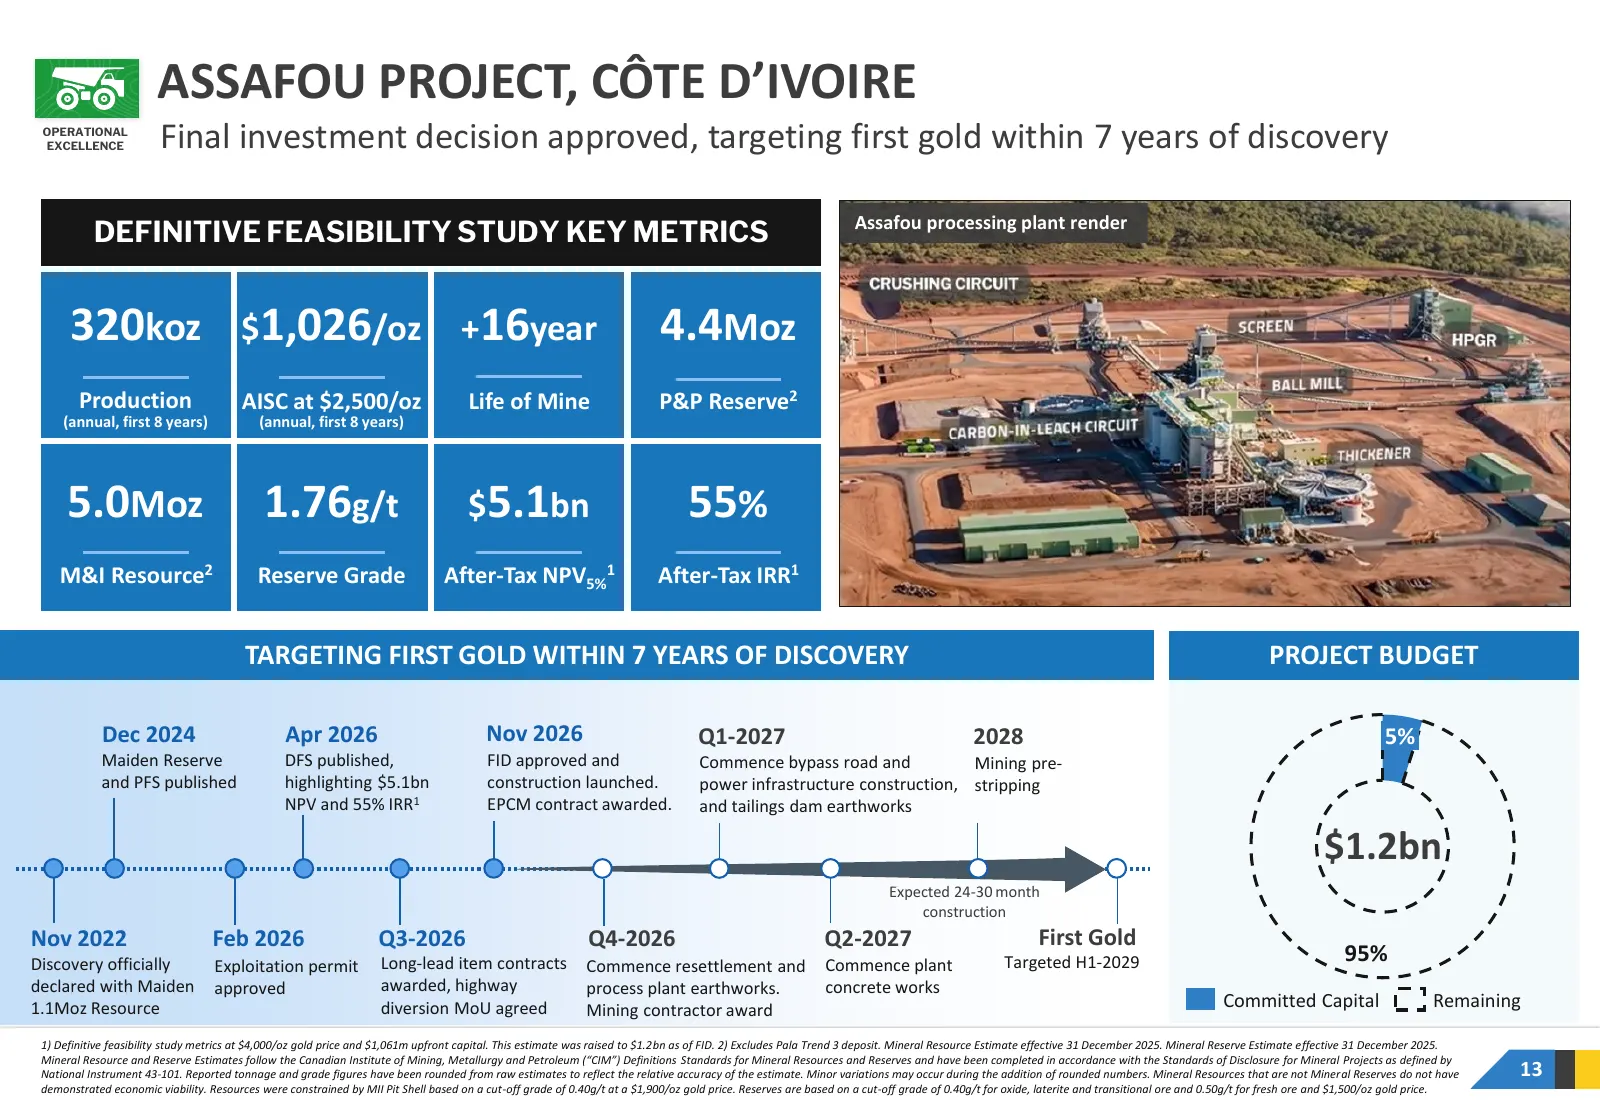
Slide 13: Assafou Project, Côte d'Ivoire
ASSAFOU PROJECT, CÔTE D’IVOIRE OPERATIONAL EXCELLENCE Final investment decision approved, targeting first gold within 7 years of discovery Assafou processing plant render DEFINITIVE FEASIBILITY STUDY KEY METRICS 320koz $1,026/oz +16year 4.4Moz Production AISC at $2,500/oz Life of Mine P&P Reserve2 (
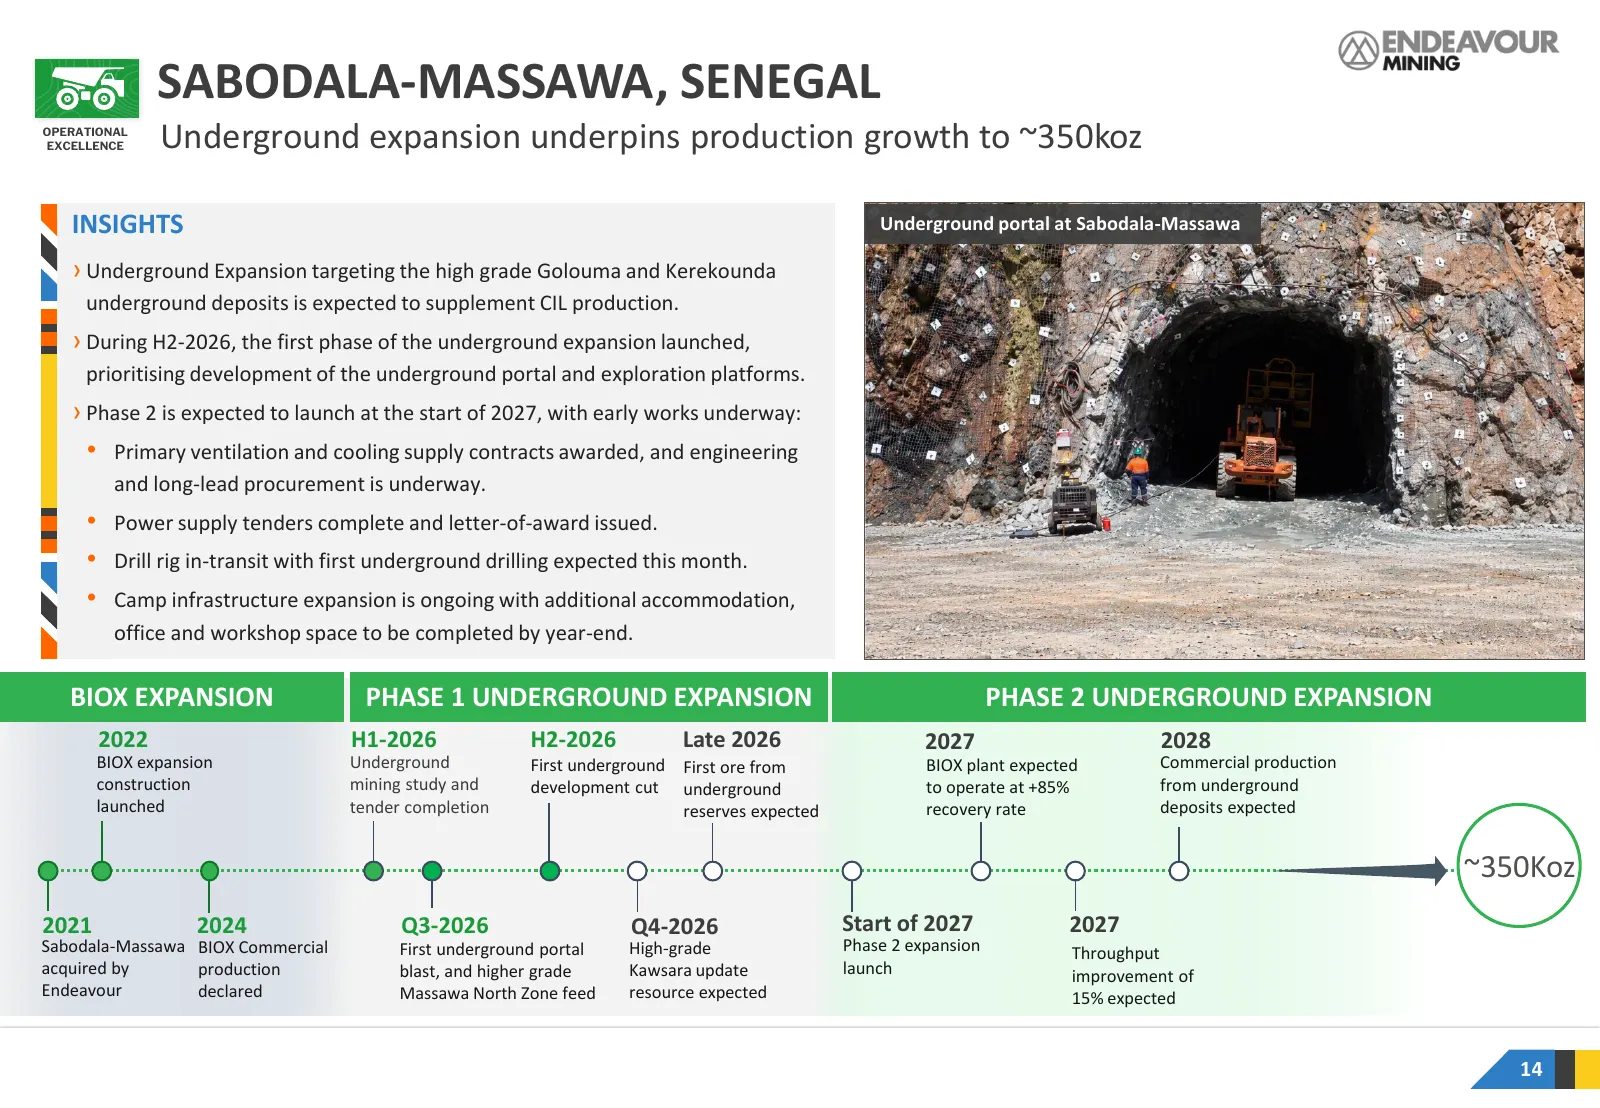
Slide 14: Sabodala-Massawa, Senegal
SABODALA-MASSAWA, SENEGAL OPERATIONAL EXCELLENCE Underground expansion underpins production growth to ~350koz INSIGHTS Underground portal at Sabodala-Massawa › Underground Expansion targeting the high grade Golouma and Kerekounda underground deposits is expected to supplement CIL production. › Durin
Slide 15: Strong Construction Track Record
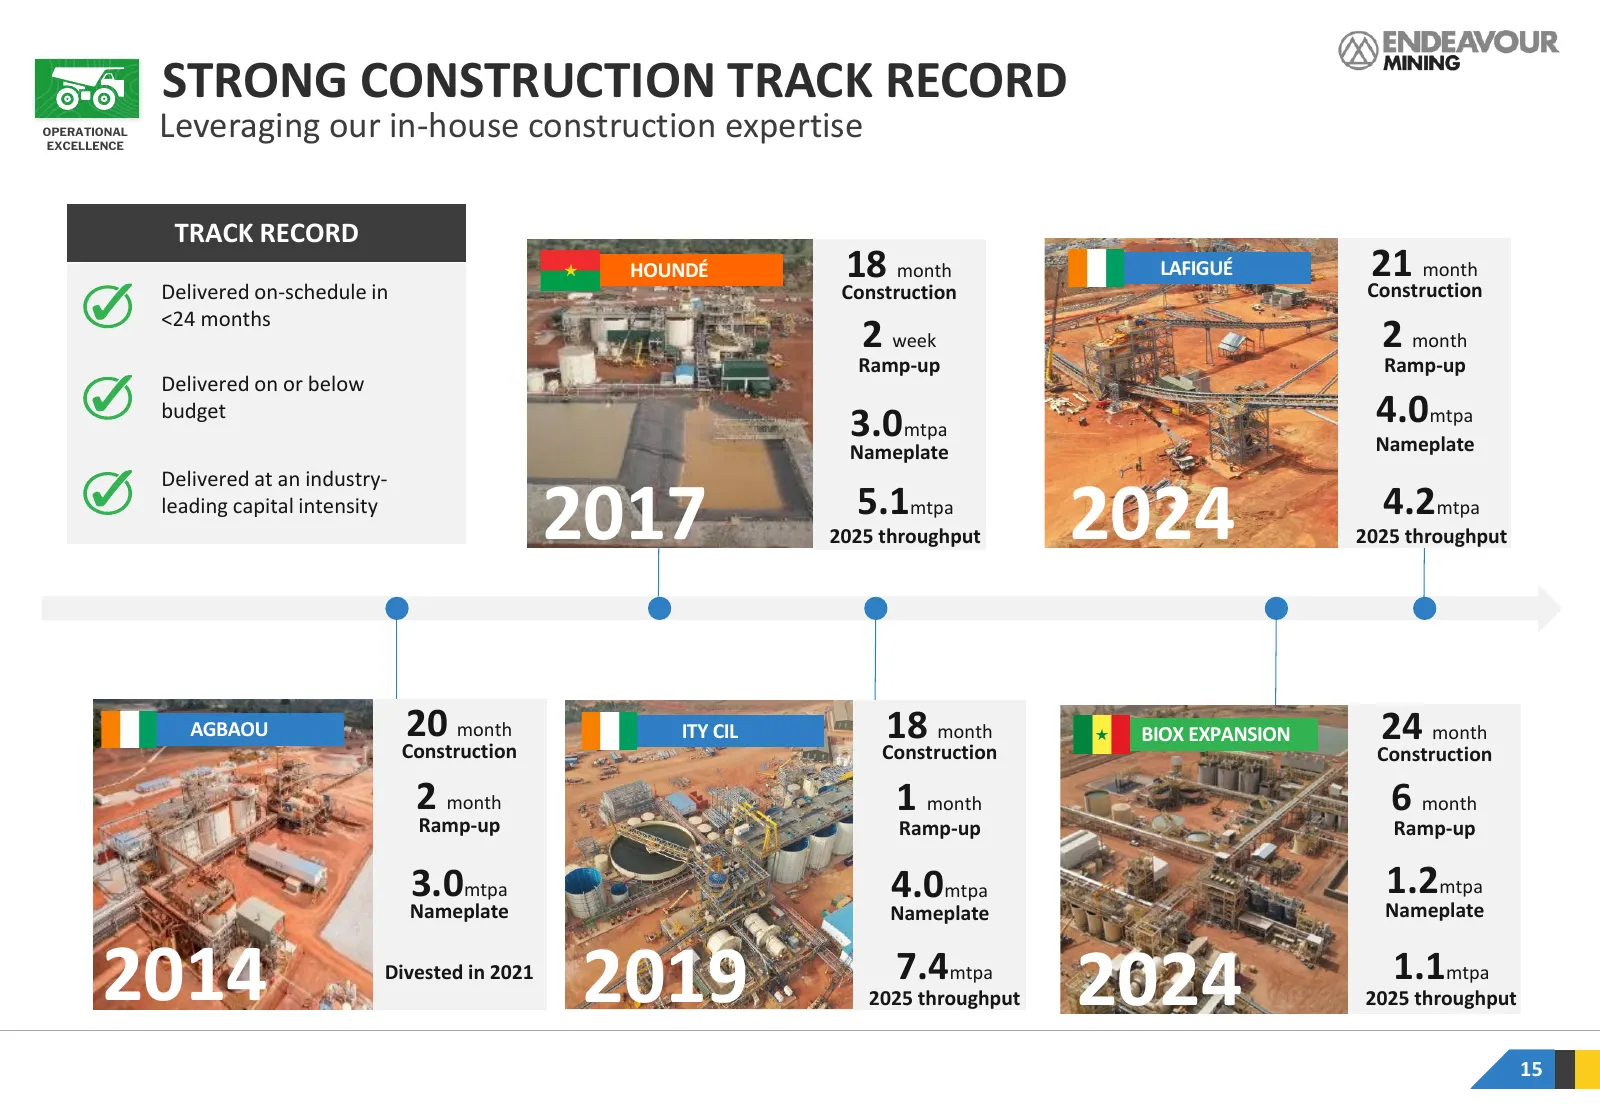
CEO INTRODUCTION STRONG CONSTRUCTION TRACK RECORD OPERATIONAL EXCELLENCE Leveraging our in-house construction expertise TRACK RECORD HOUNDÉ 18 month LAFIGUÉ 21 month Delivered on-schedule in Construction Construction <24 months 2 week 2 month Ramp-up Ramp-up Delivered on or below budget 3.0mtpa 4.0m
Slide 16: Active Portfolio Management
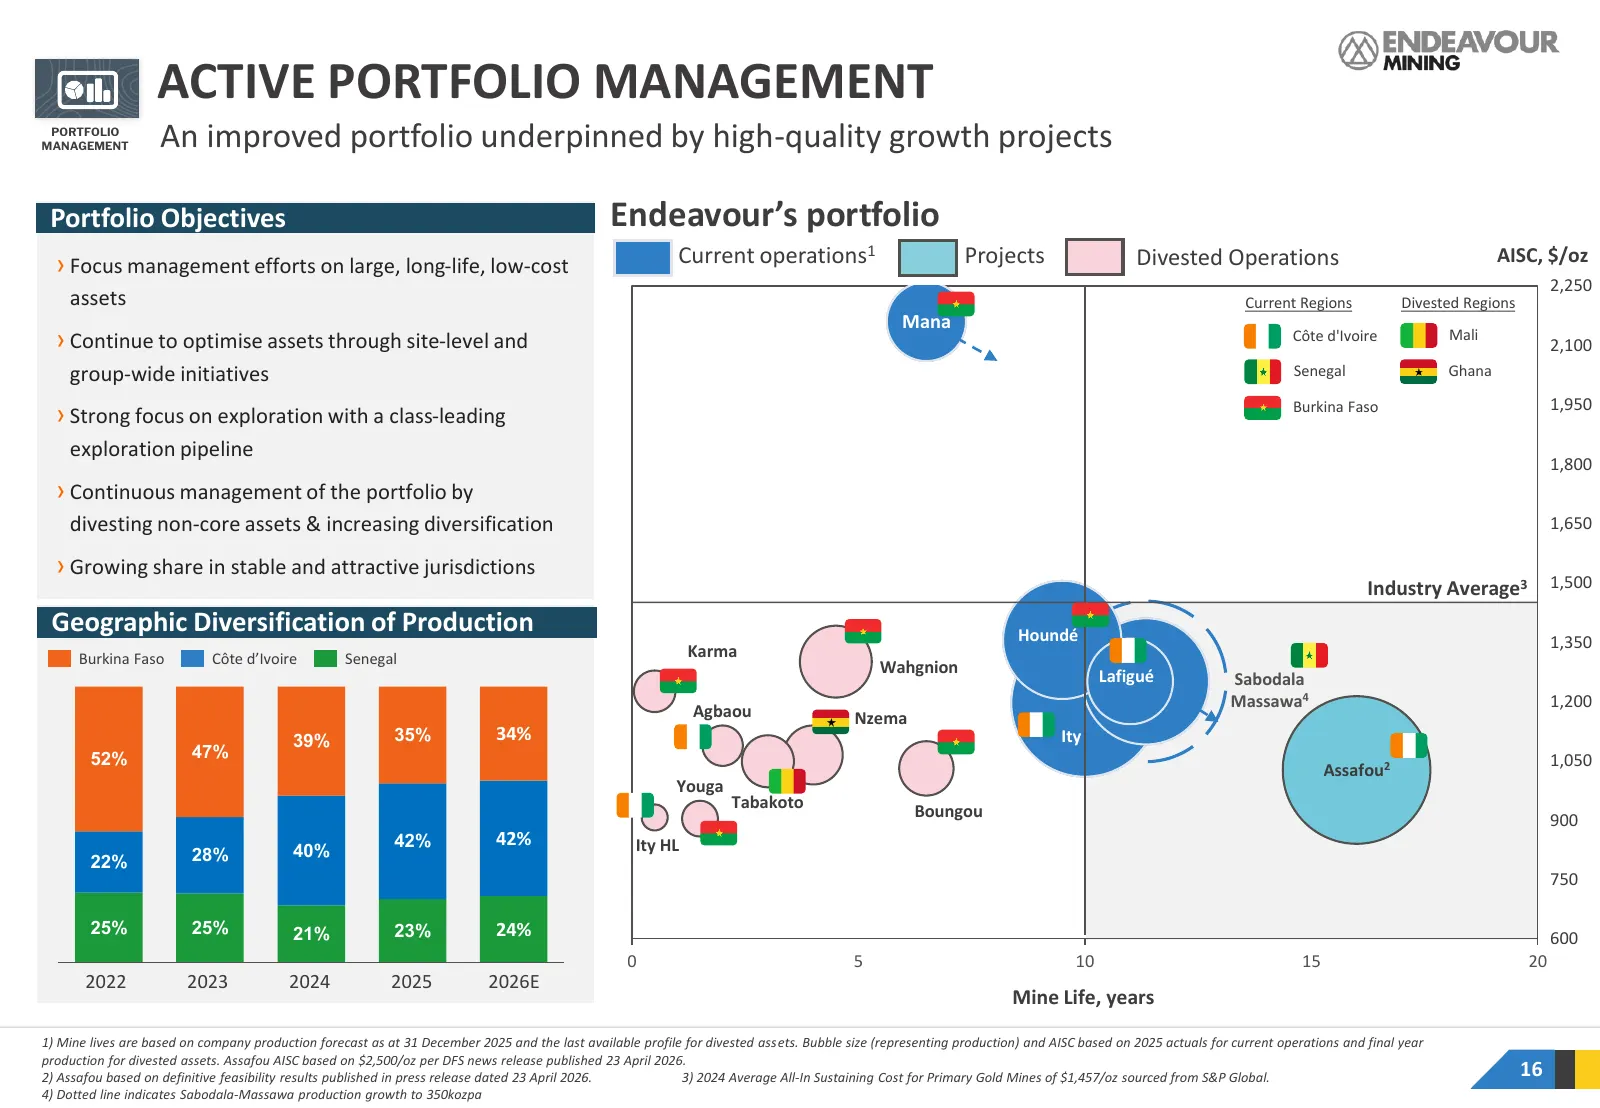
ACTIVE PORTFOLIO MANAGEMENT PORTFOLIO MANAGEMENT An improved portfolio underpinned by high-quality growth projects Portfolio Objectives Endeavour’s portfolio › Focus management efforts on large, long-life, low-cost Current operations1 Projects Divested Operations AISC, $/oz 2,250 assets Current Regi
Slide 17: Optimising Assets and Replenishing Pipeline
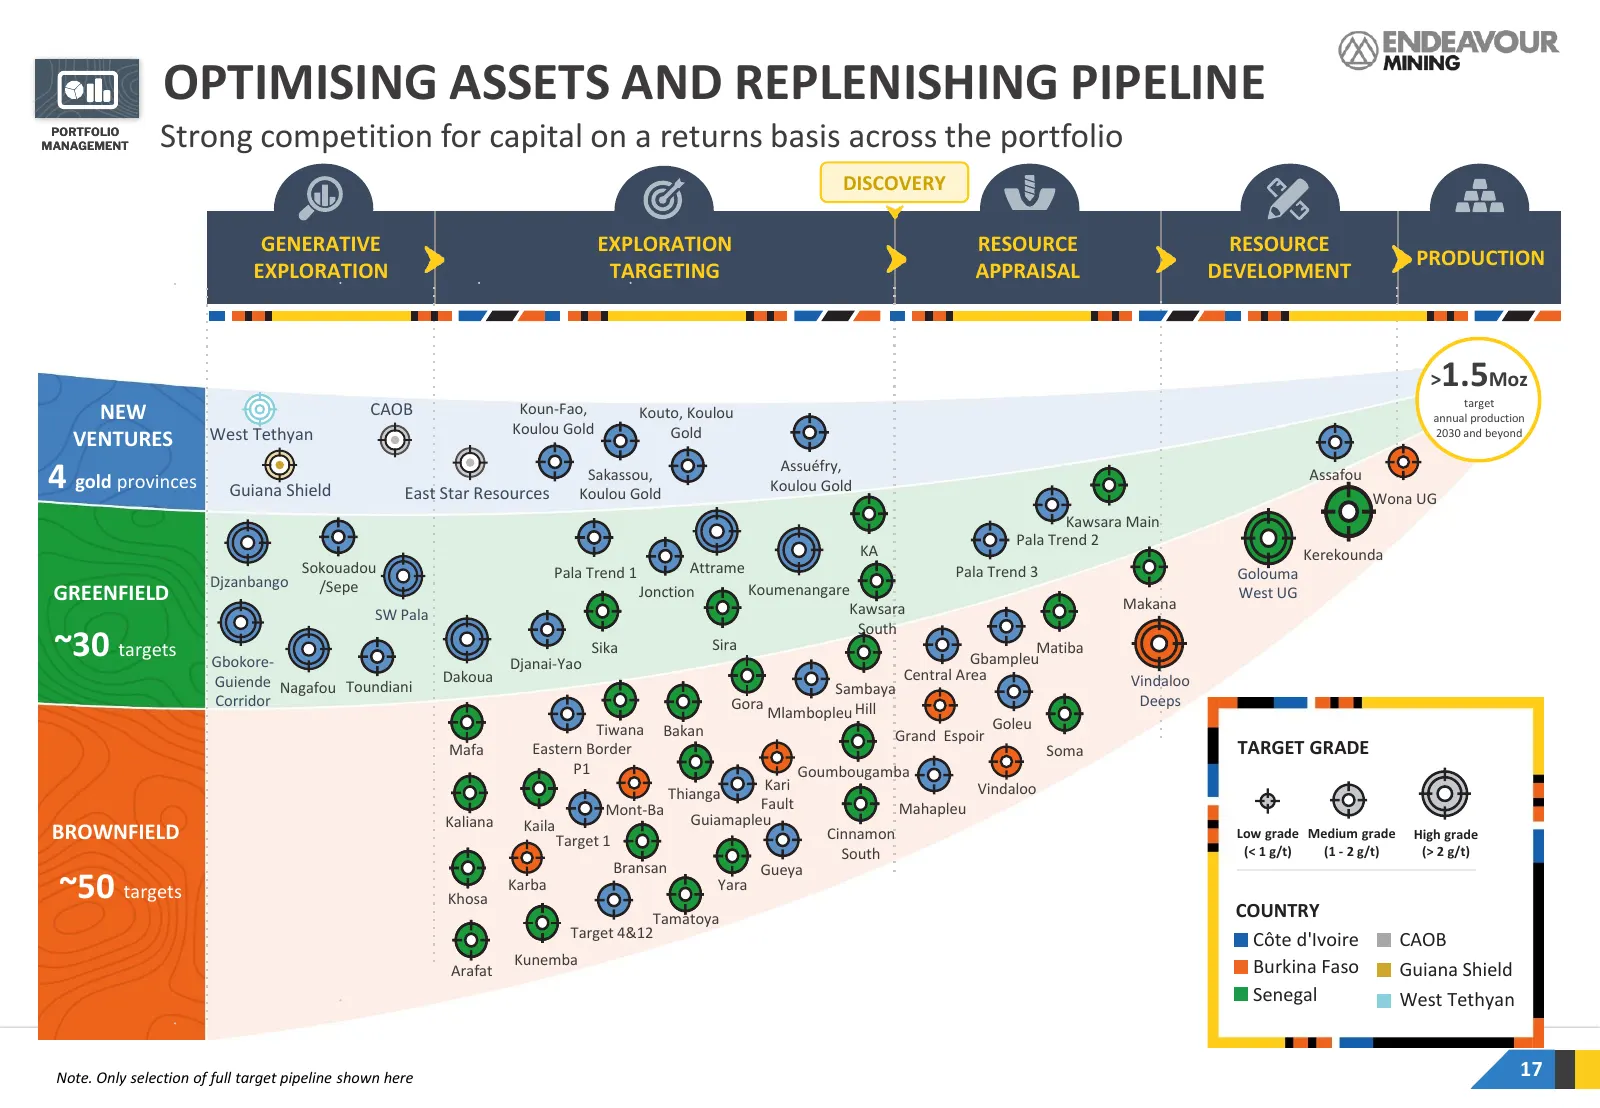
OPTIMISING ASSETS AND REPLENISHING PIPELINE PORTFOLIO MANAGEMENT Strong competition for capital on a returns basis across the portfolio DISCOVERY GENERATIVE EXPLORATION RESOURCE RESOURCE PRODUCTION EXPLORATION TARGETING APPRAISAL DEVELOPMENT > 1.5Moz target NEW CAOB Koun-Fao, Kouto, Koulou annual pr
Slide 18: Exploration Track Record
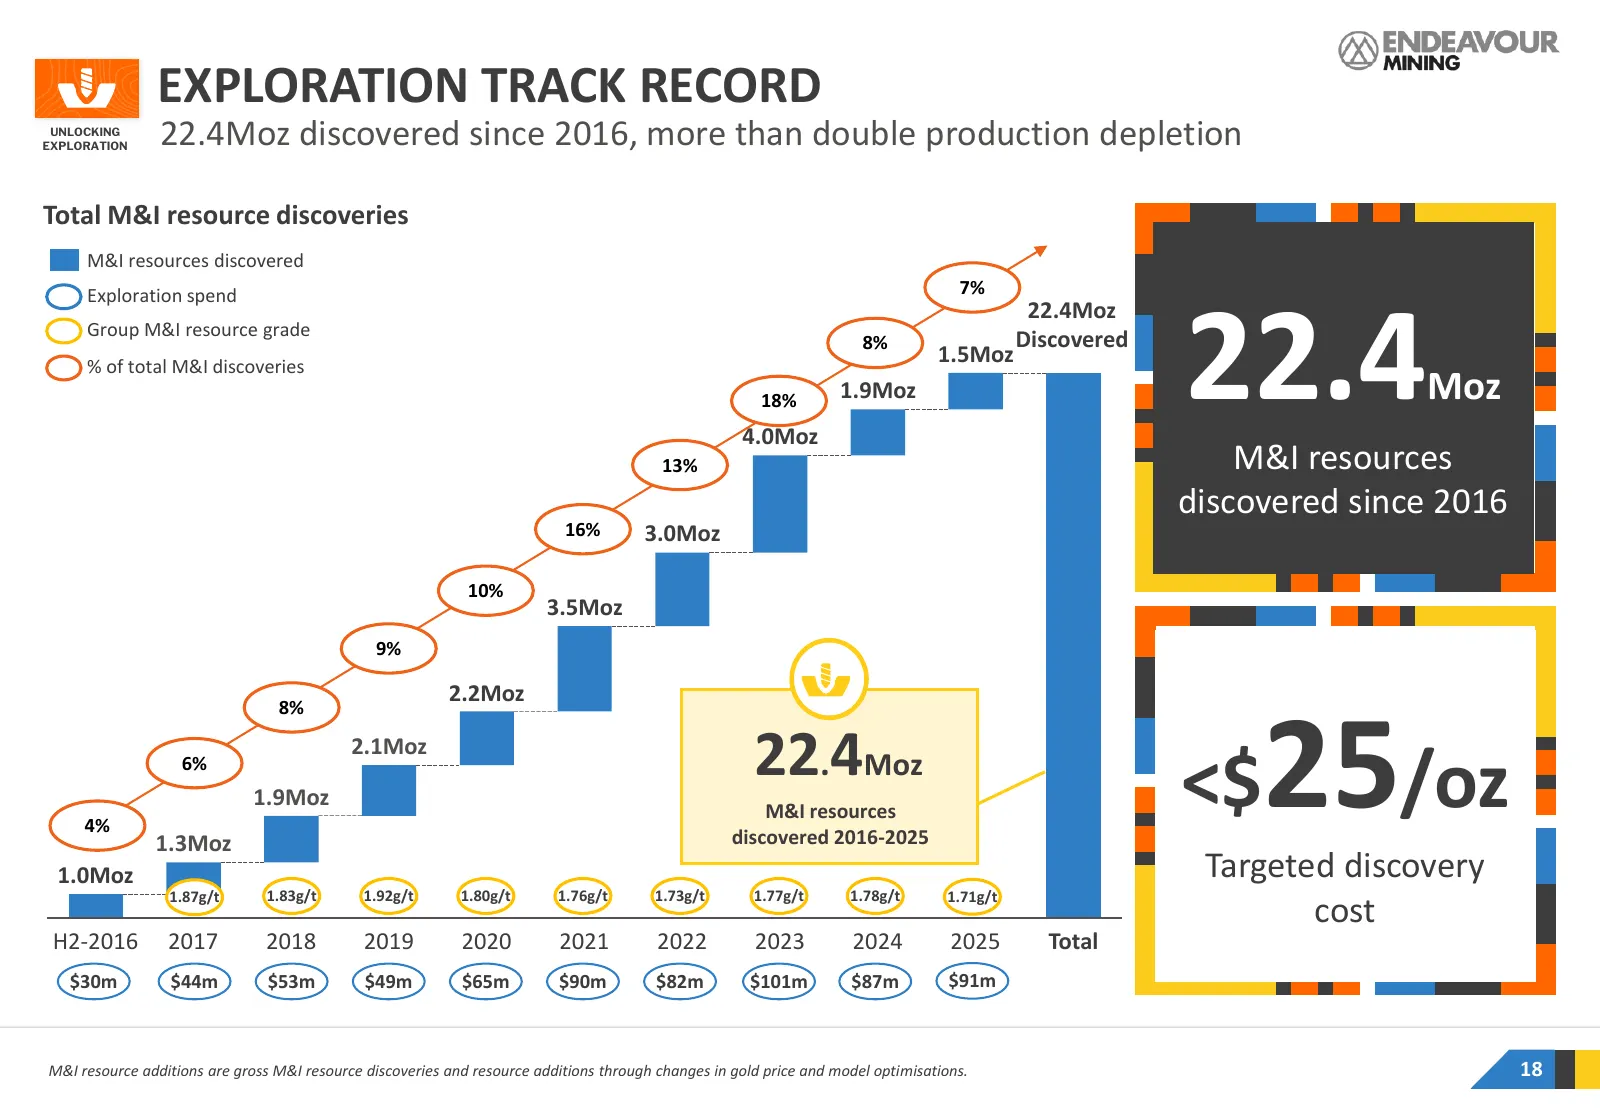
EXPLORATION TRACK RECORD UNLOCKING EXPLORATION 22.4Moz discovered since 2016, more than double production depletion Total M&I resource discoveries M&I resources discovered Exploration spend 7% 22.4 22.4Moz Group M&I resource grade 8% Discovered % of total M&I discoveries 1.5Moz 18% 1.9Moz Moz 4.0Moz
Slide 19: Exploration Track Record
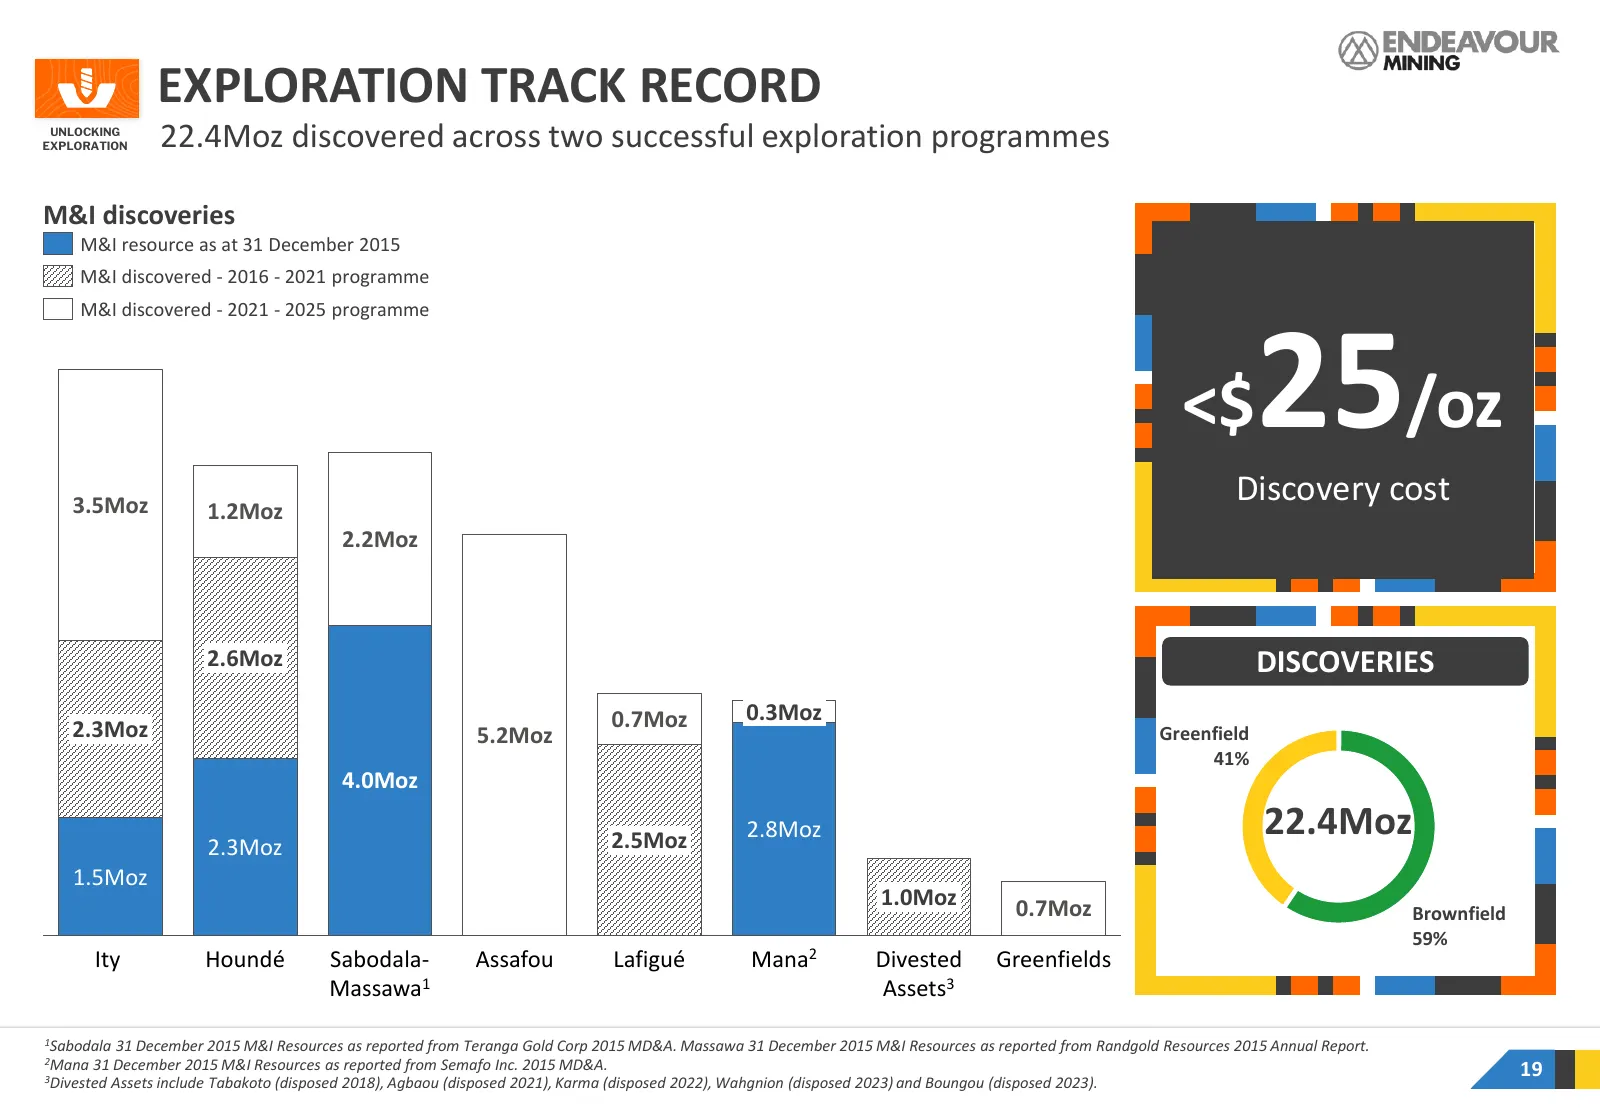
EXPLORATION TRACK RECORD UNLOCKING EXPLORATION 22.4Moz discovered across two successful exploration programmes M&I discoveries M&I resource as at 31 December 2015 M&I discovered - 2016 - 2021 programme M&I discovered - 2021 - 2025 programme <$ 25/oz Discovery cost 3.5Moz 1.2Moz 2.2Moz 2.6Moz DISCOVE
Slide 20: Quick Timeline from Discovery to Production
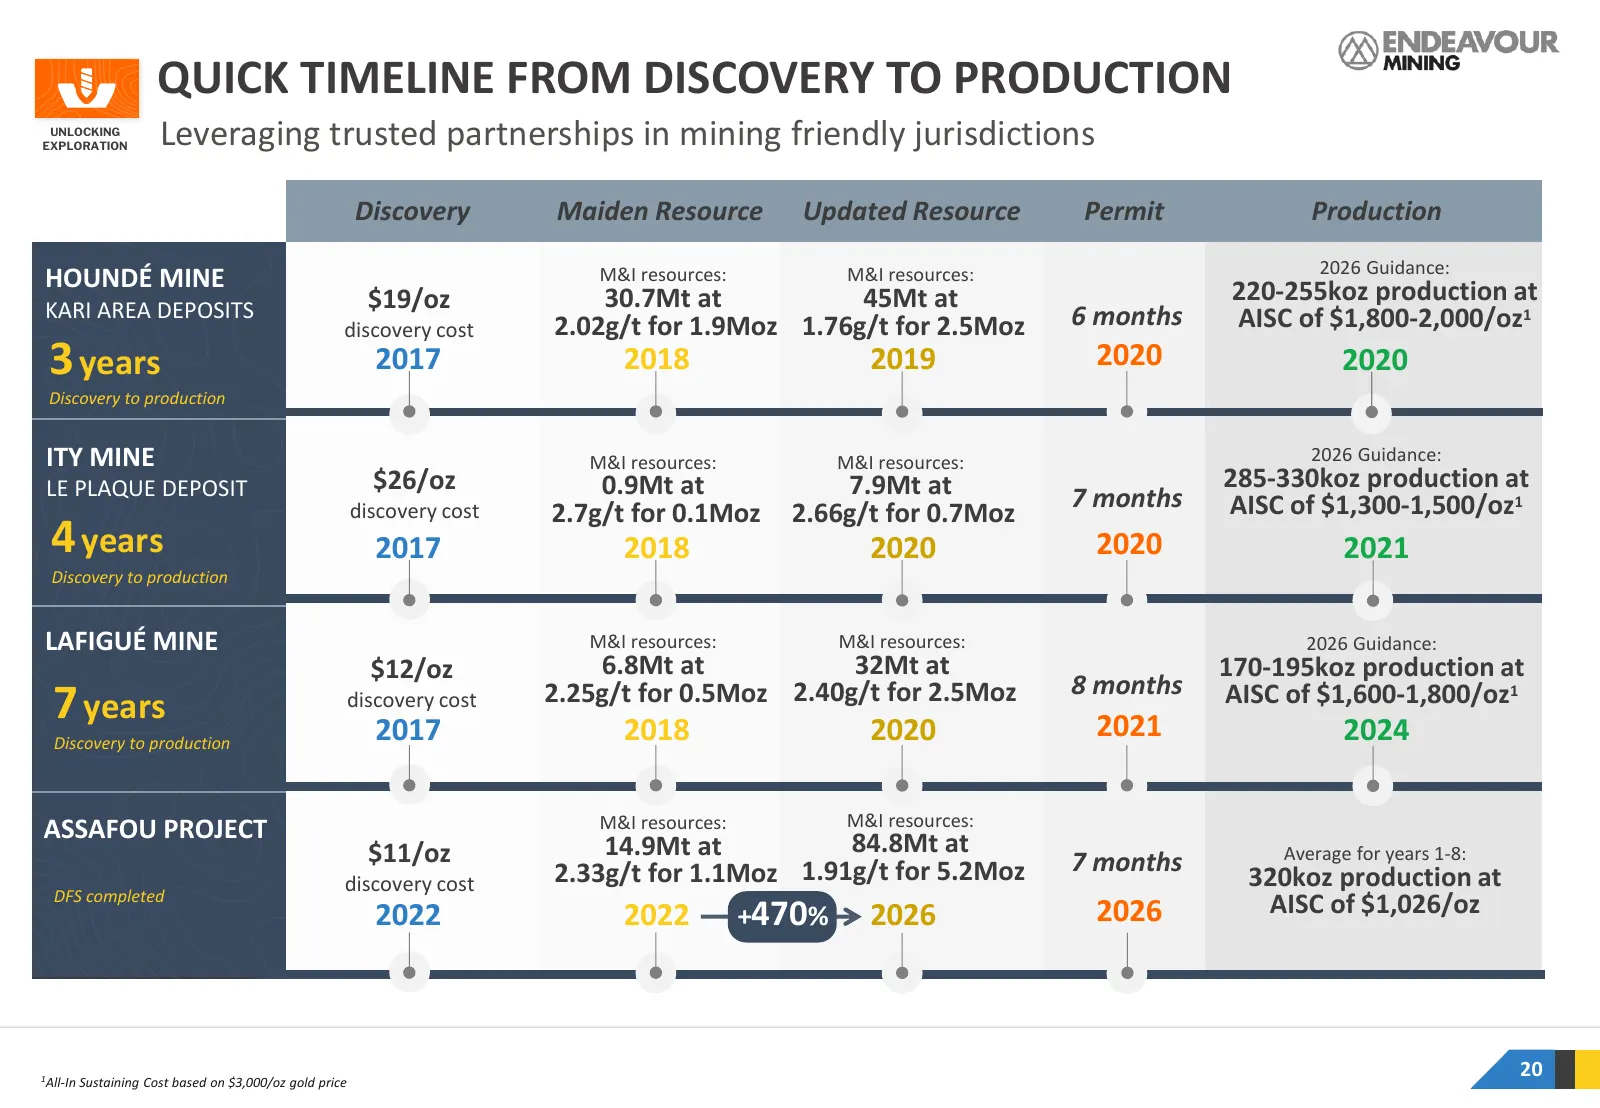
QUICK TIMELINE FROM DISCOVERY TO PRODUCTION UNLOCKING EXPLORATION Leveraging trusted partnerships in mining friendly jurisdictions Discovery Maiden Resource Updated Resource Permit Production 2026 Guidance: HOUNDÉ MINE M&I resources: M&I resources: 220-255koz production at KARI AREA DEPOSITS $19/oz
Slide 21: Our Exploration Methodology
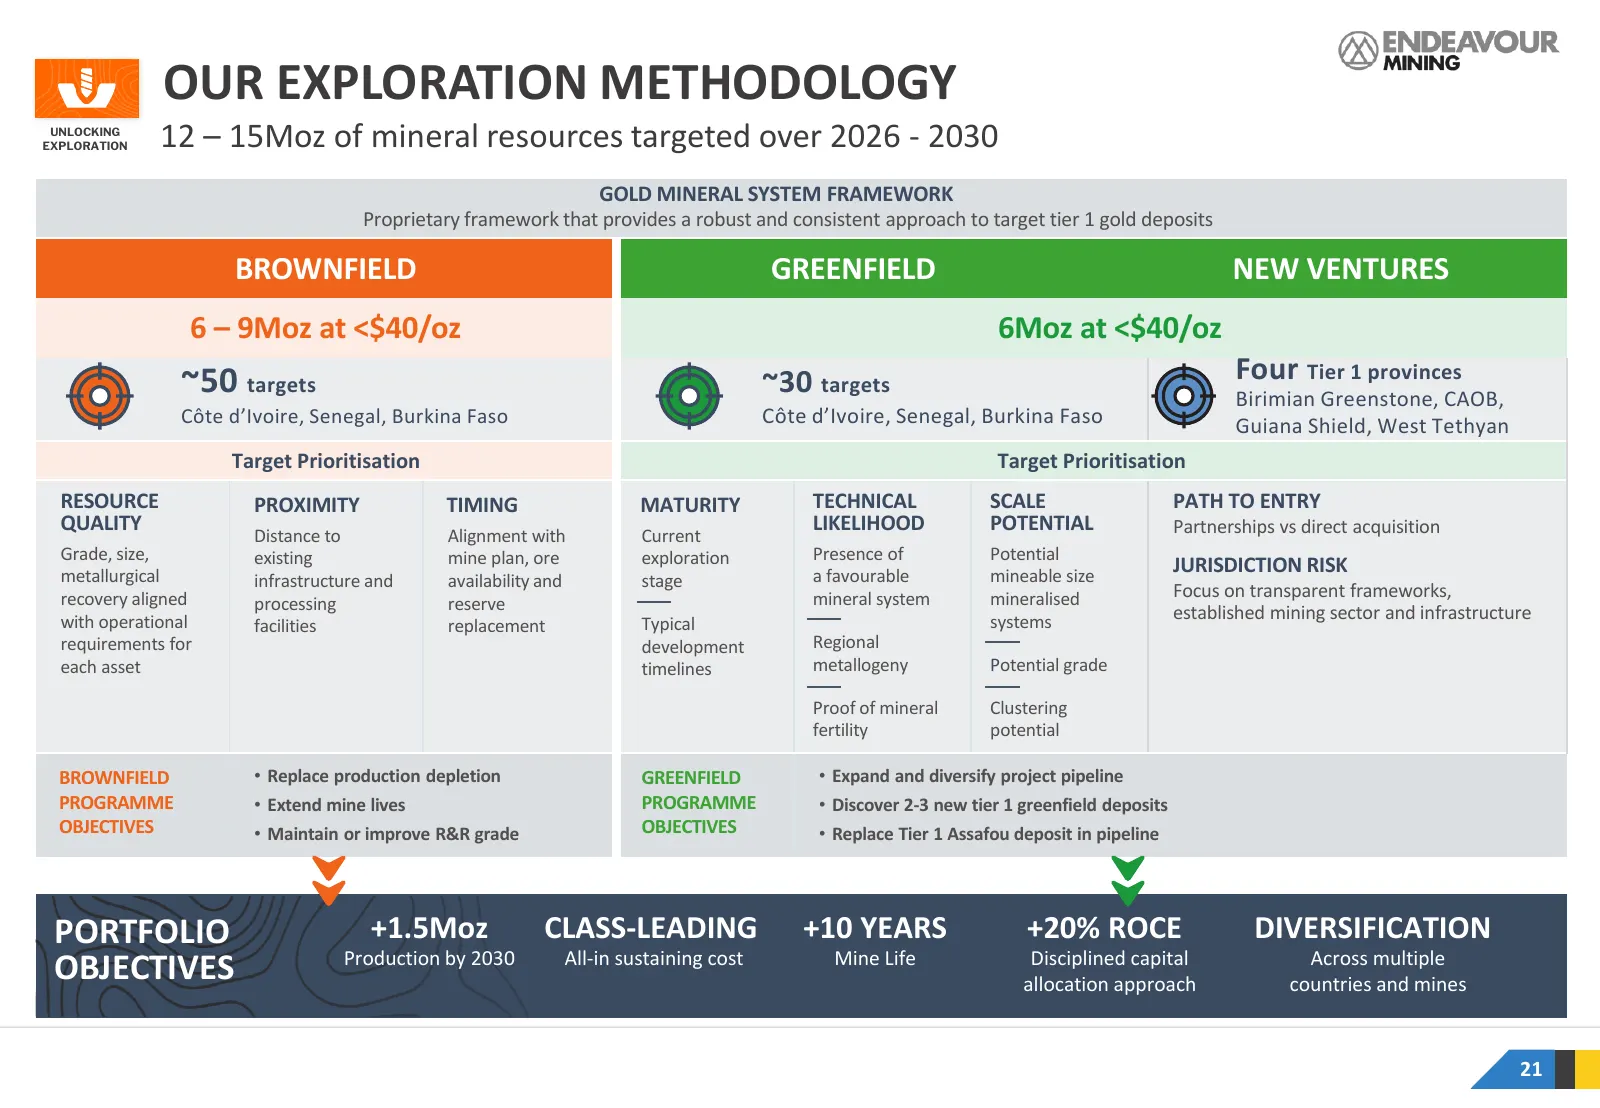
OUR EXPLORATION METHODOLOGY UNLOCKING EXPLORATION 12 – 15Moz of mineral resources targeted over 2026 - 2030 GOLD MINERAL SYSTEM FRAMEWORK Proprietary framework that provides a robust and consistent approach to target tier 1 gold deposits BROWNFIELD GREENFIELD NEW VENTURES 6 – 9Moz at <$40/oz 6Moz at
Slide 22: 5-Year Discovery Outlook
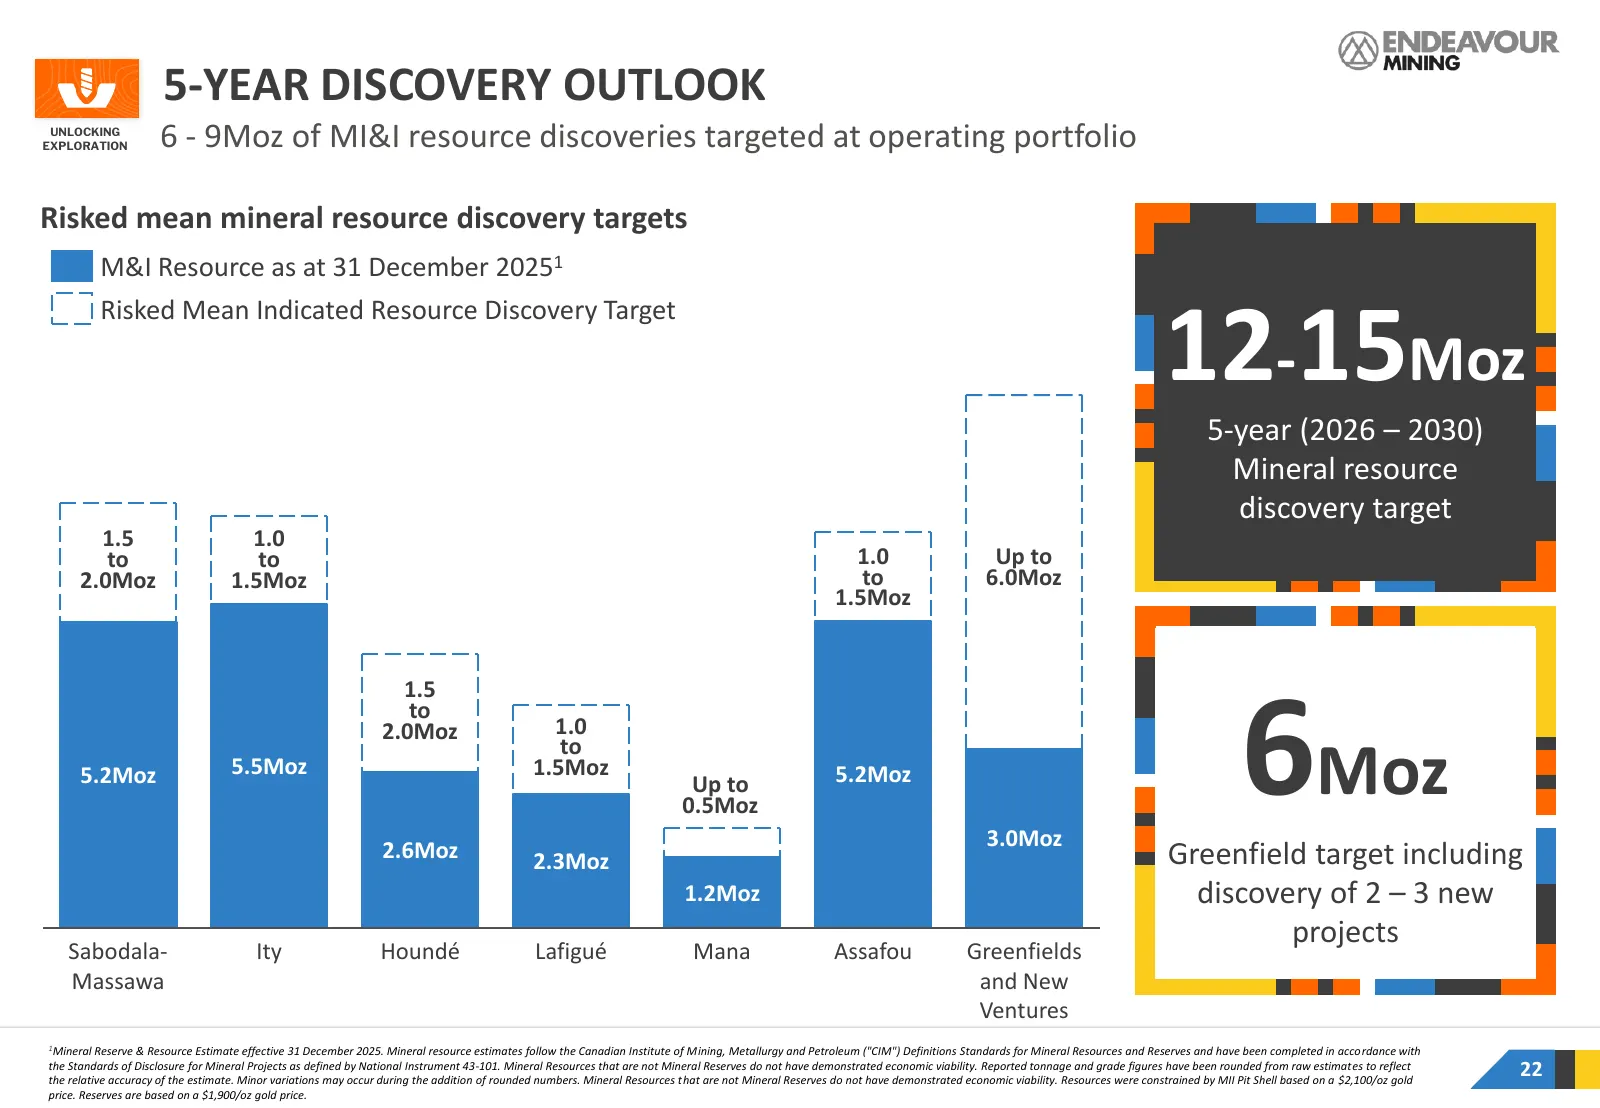
5-YEAR DISCOVERY OUTLOOK UNLOCKING EXPLORATION 6 - 9Moz of MI&I resource discoveries targeted at operating portfolio Risked mean mineral resource discovery targets M&I Resource as at 31 December 20251 12-15Moz Risked Mean Indicated Resource Discovery Target 5-year (2026 – 2030) Mineral resource disc
Slide 23: Largest Exploration Presence in West Africa
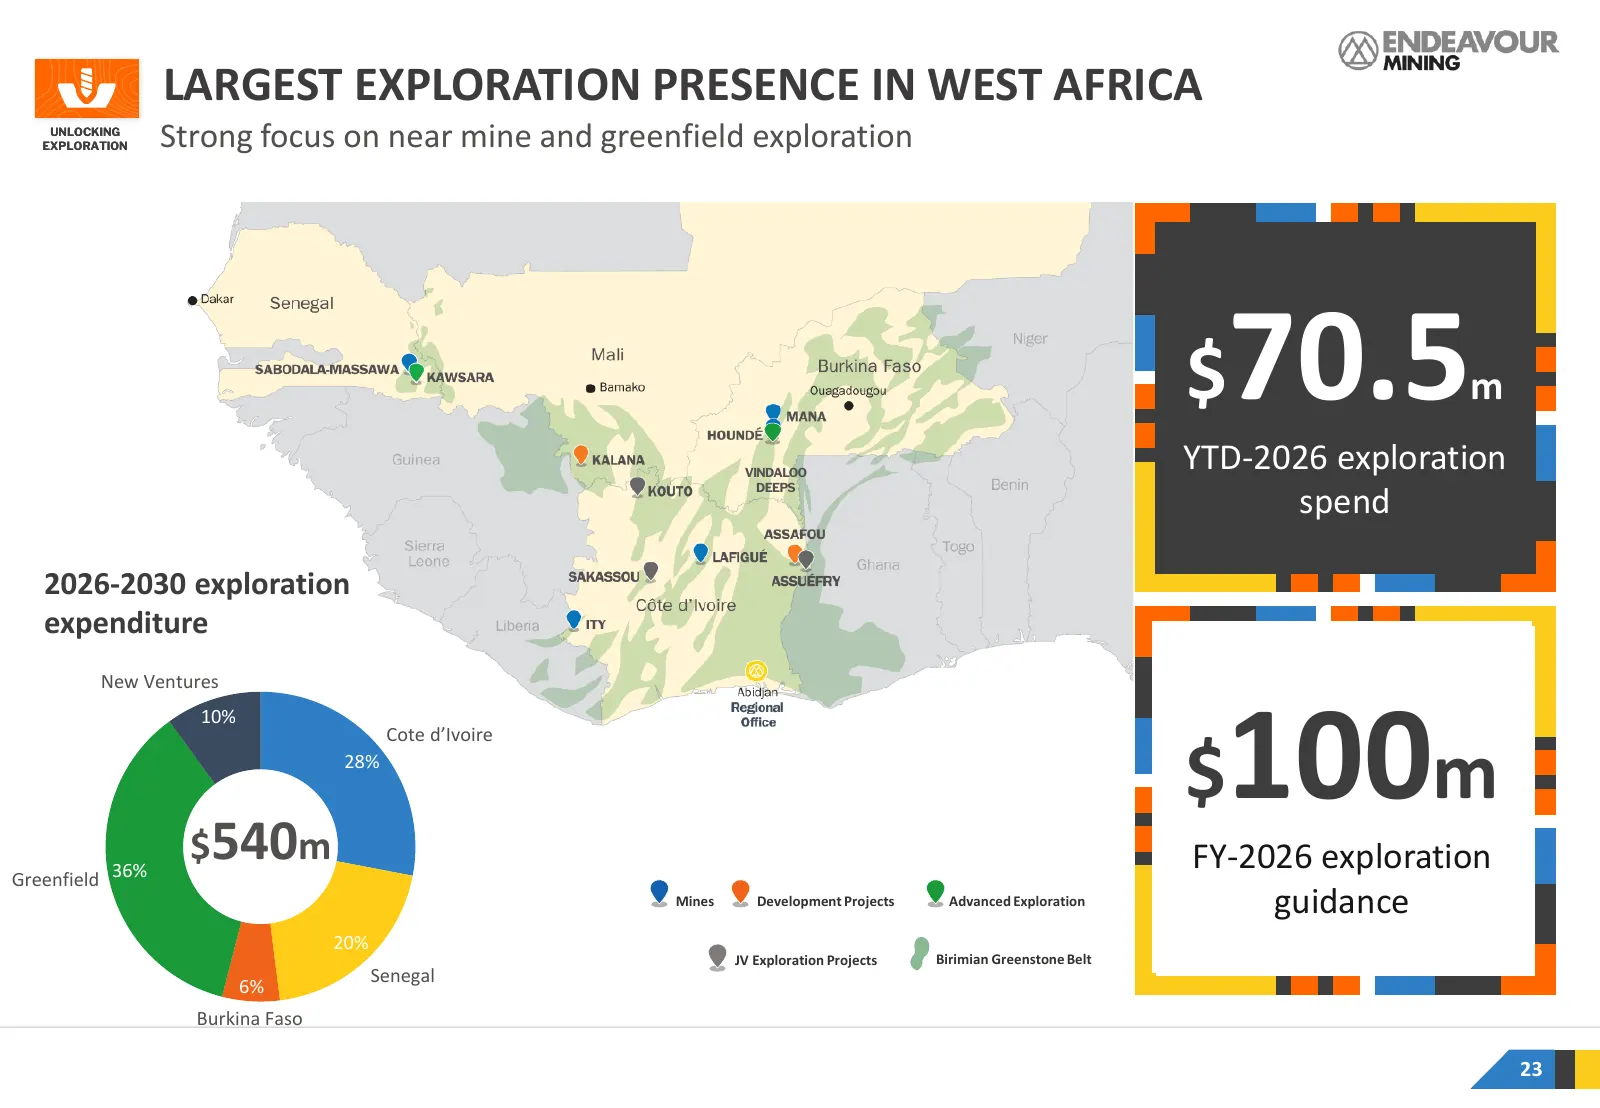
LARGEST EXPLORATION PRESENCE IN WEST AFRICA UNLOCKING EXPLORATION Strong focus on near mine and greenfield exploration $ 70.5 m VINDALOO YTD-2026 exploration DEEPS spend 2026-2030 exploration expenditure New Ventures 100m 10% Cote d’Ivoire 28% $ $540m FY-2026 exploration Greenfield 36% Mines Develop
Slide 24: Assafou Project, Côte d'Ivoire
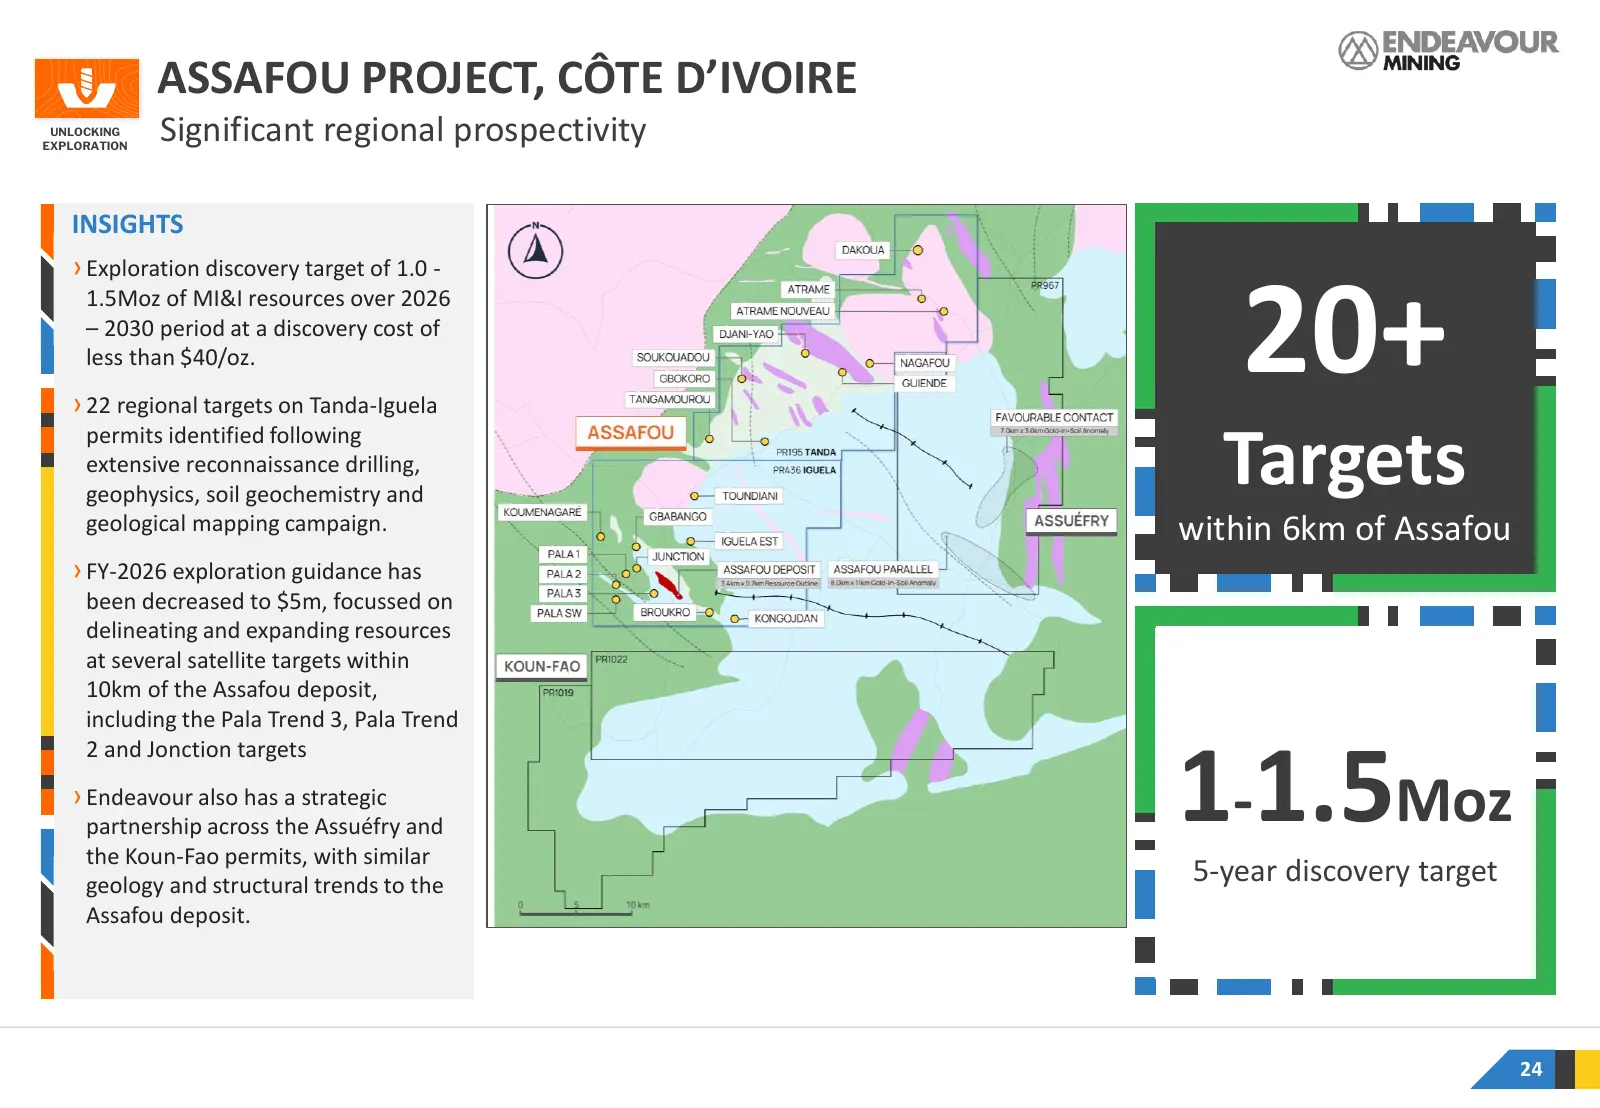
ASSAFOU PROJECT, CÔTE D’IVOIRE UNLOCKING EXPLORATION Significant regional prospectivity INSIGHTS › Exploration discovery target of 1.0 - 1.5Moz of MI&I resources over 2026 – 2030 period at a discovery cost of less than $40/oz. › 22 regional targets on Tanda-Iguela 20+ Targets permits identified foll
Slide 25: New Ventures Exploration
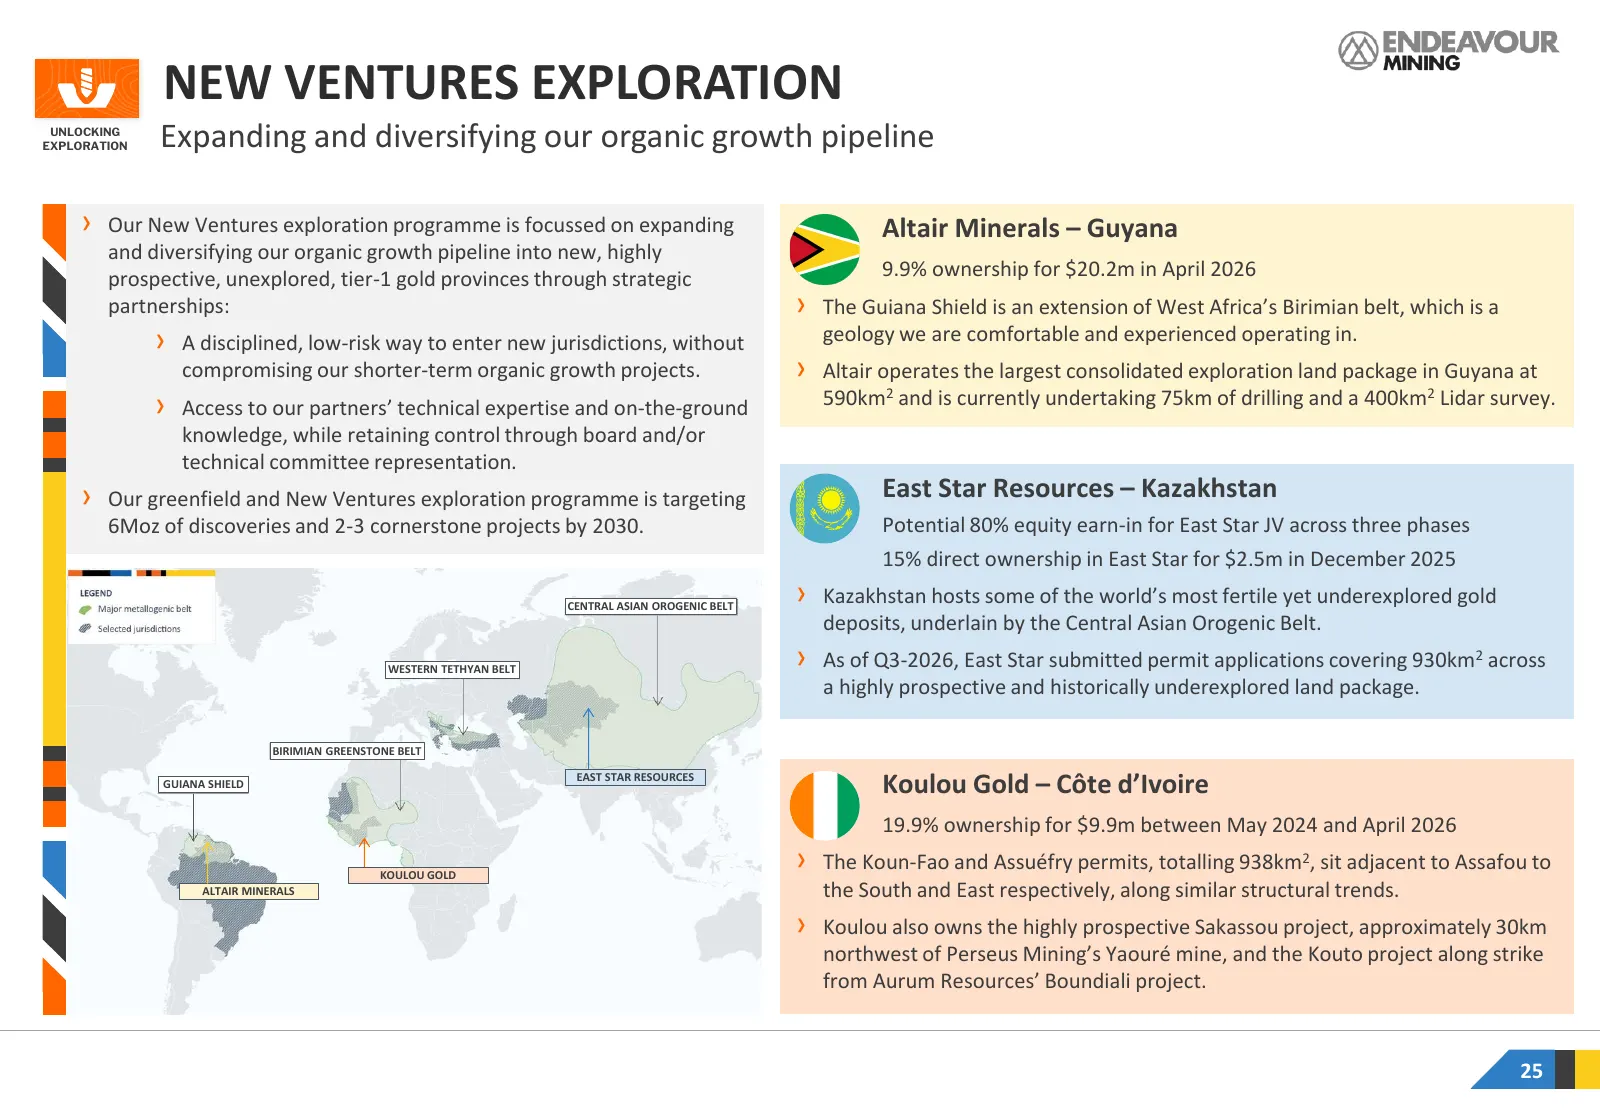
NEW VENTURES EXPLORATION UNLOCKING EXPLORATION Expanding and diversifying our organic growth pipeline › Our New Ventures exploration programme is focussed on expanding Altair Minerals – Guyana and diversifying our organic growth pipeline into new, highly prospective, unexplored, tier-1 gold province
Slide 26: Record Free Cash Flow Generation
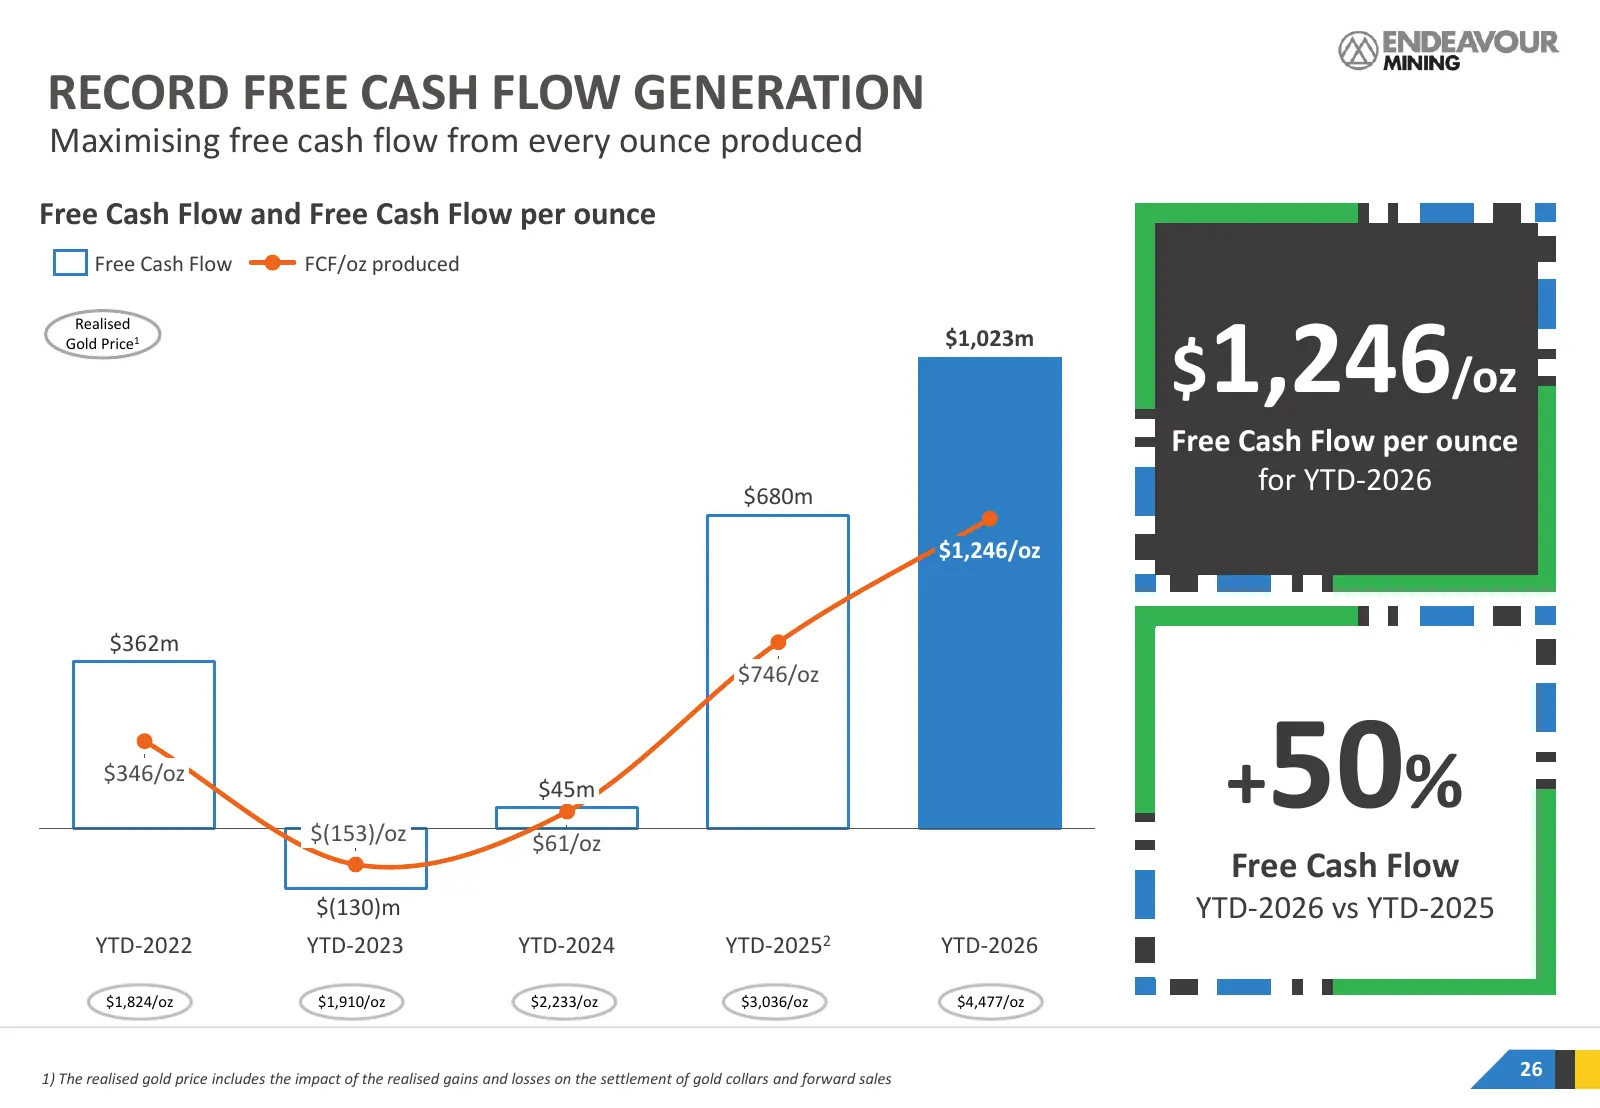
RECORD FREE CASH FLOW GENERATION Maximising free cash flow from every ounce produced Free Cash Flow and Free Cash Flow per ounce Free Cash Flow FCF/oz produced $1,246/oz Realised Gold Price1 $1,023m Free Cash Flow per ounce $680m for YTD-2026 $1,246/oz $362m $746/oz $346/oz $(153)/oz $45m $61/oz + 5
Slide 27: Healthy Financial Position
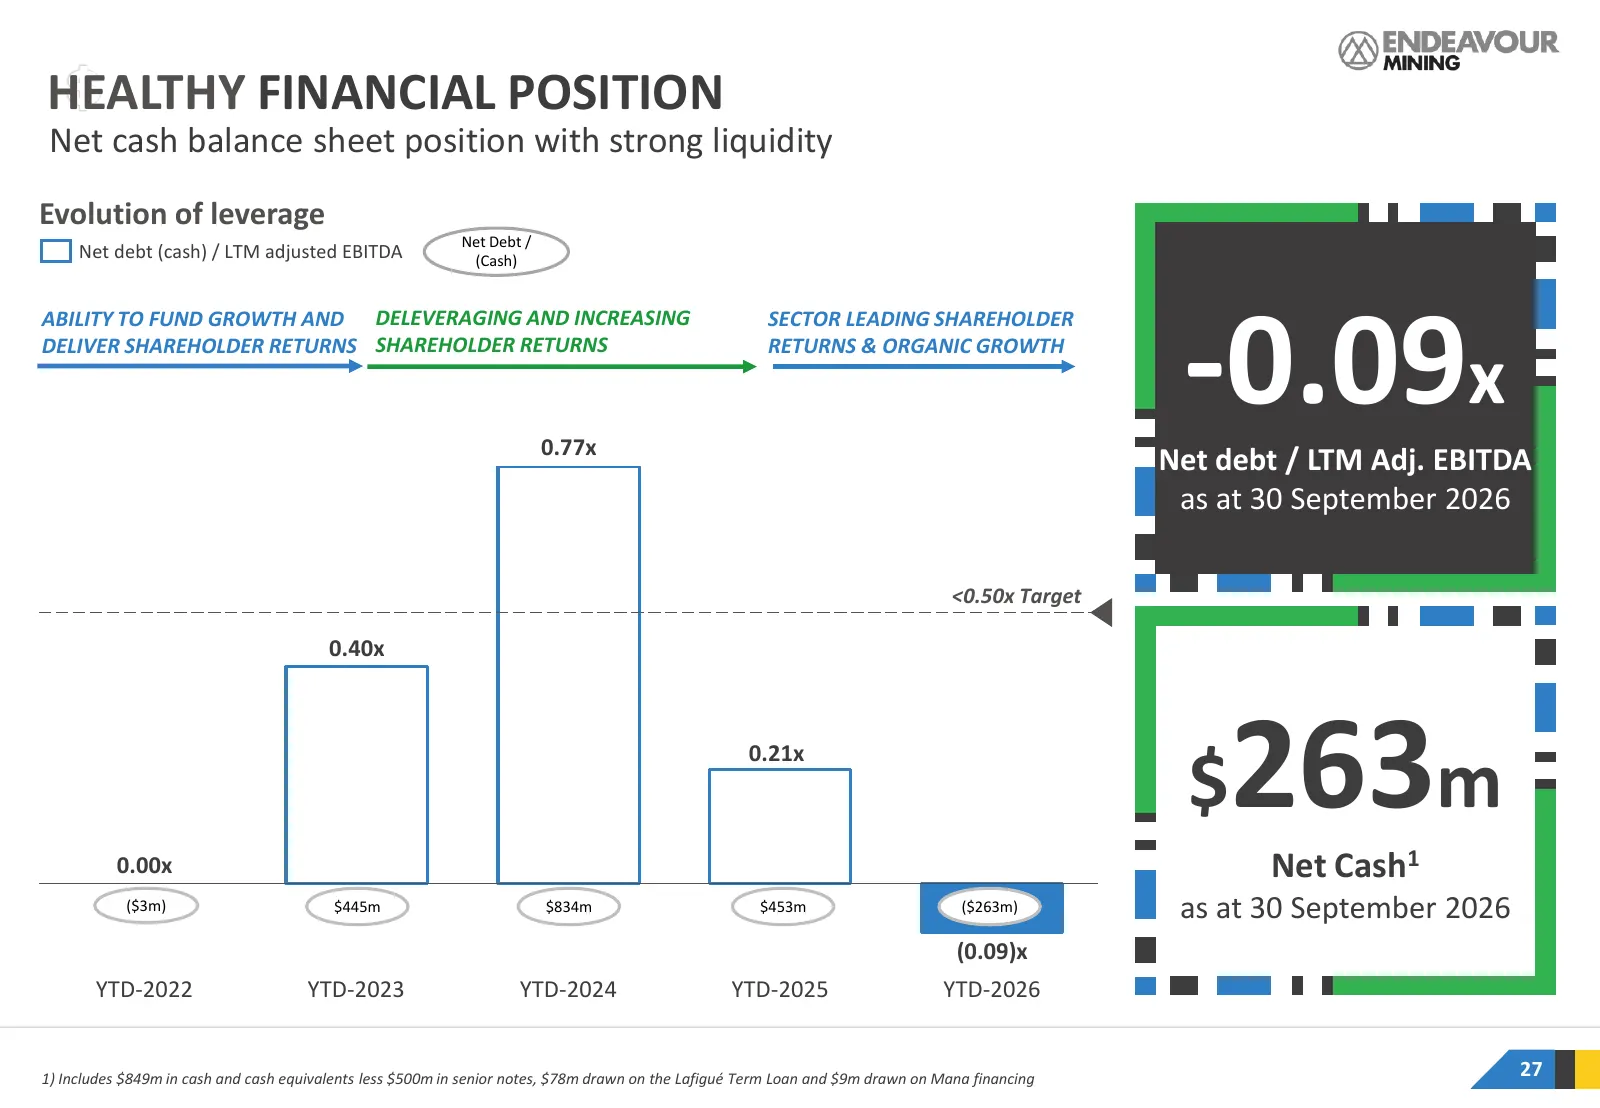
HEALTHY FINANCIAL POSITION Net cash balance sheet position with strong liquidity Evolution of leverage • Net Debt / Net debt (cash) / LTM adjusted EBITDA (Cash) -0.09x ABILITY TO FUND GROWTH AND DELEVERAGING AND INCREASING SECTOR LEADING SHAREHOLDER DELIVER SHAREHOLDER RETURNS SHAREHOLDER RETURNS RE
Slide 28: Sector-Leading Shareholder Returns
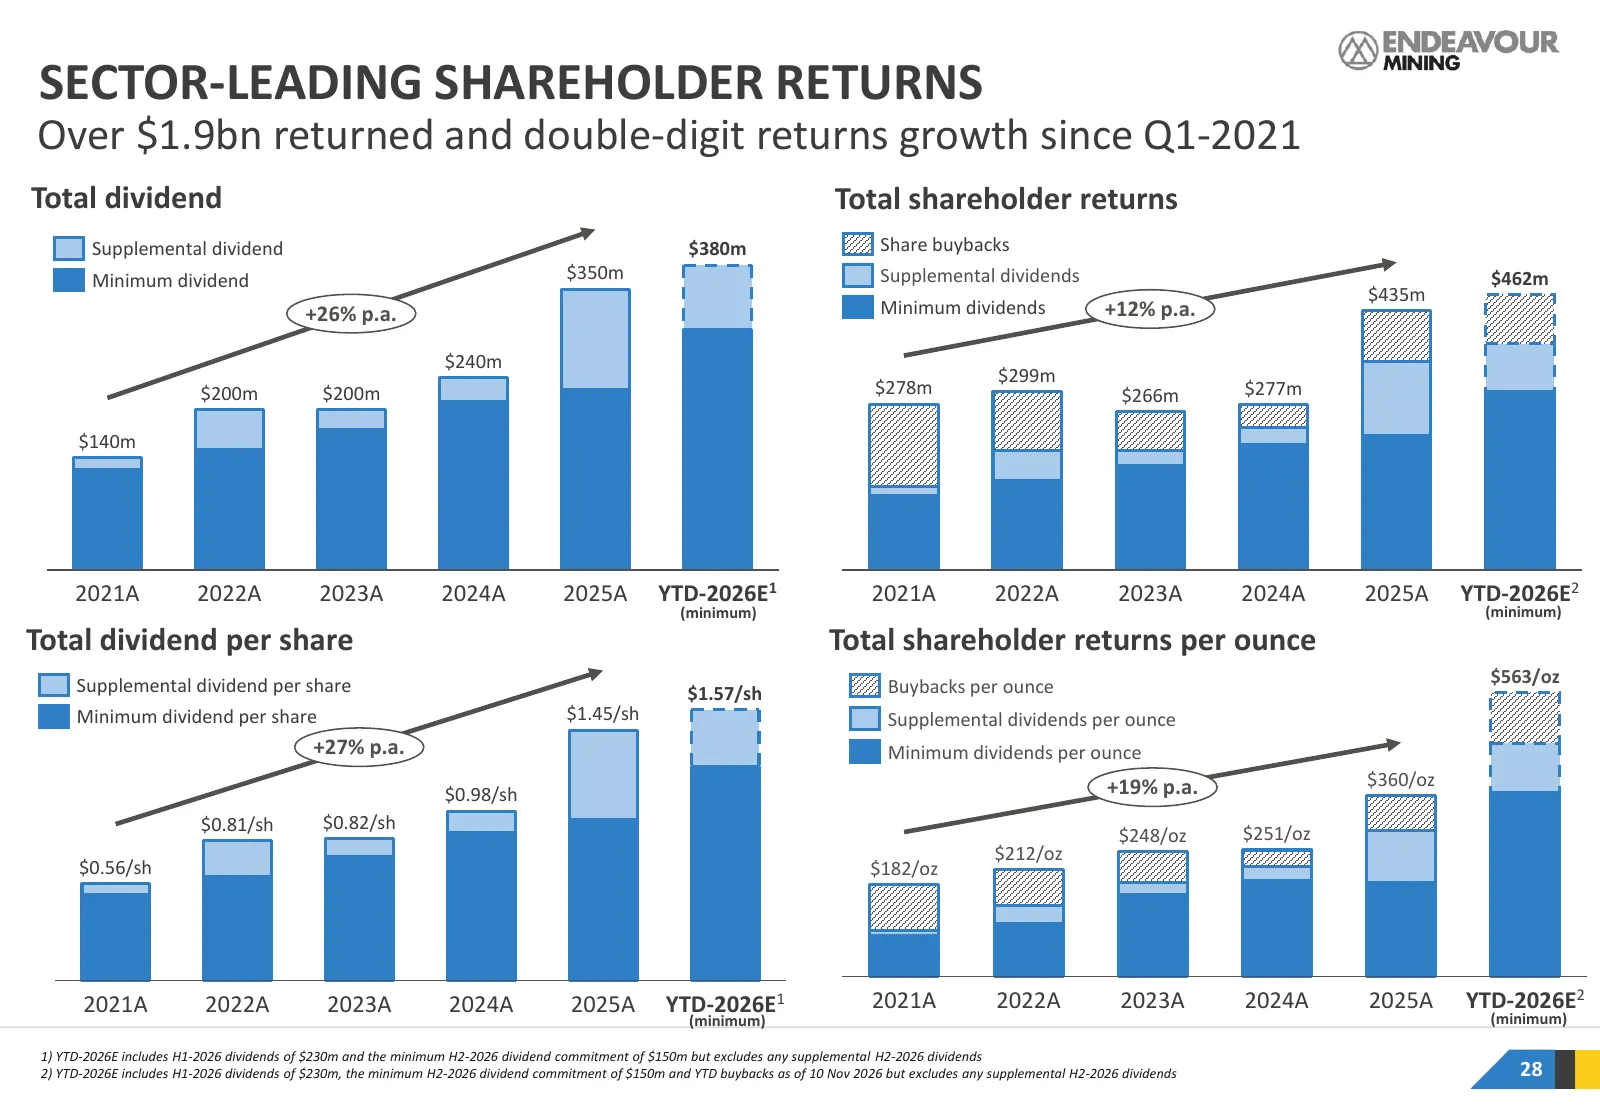
28 SECTOR-LEADING SHAREHOLDER RETURNS Over $1.9bn returned and double-digit returns growth since Q1-2021 Total dividend Total shareholder returns Supplemental dividend $380m Share buybacks Minimum dividend $350m Supplemental dividends $462m $435m +26% p.a. Minimum dividends +12% p.a. $240m $299m $20
Slide 29: Attractive Shareholder Returns
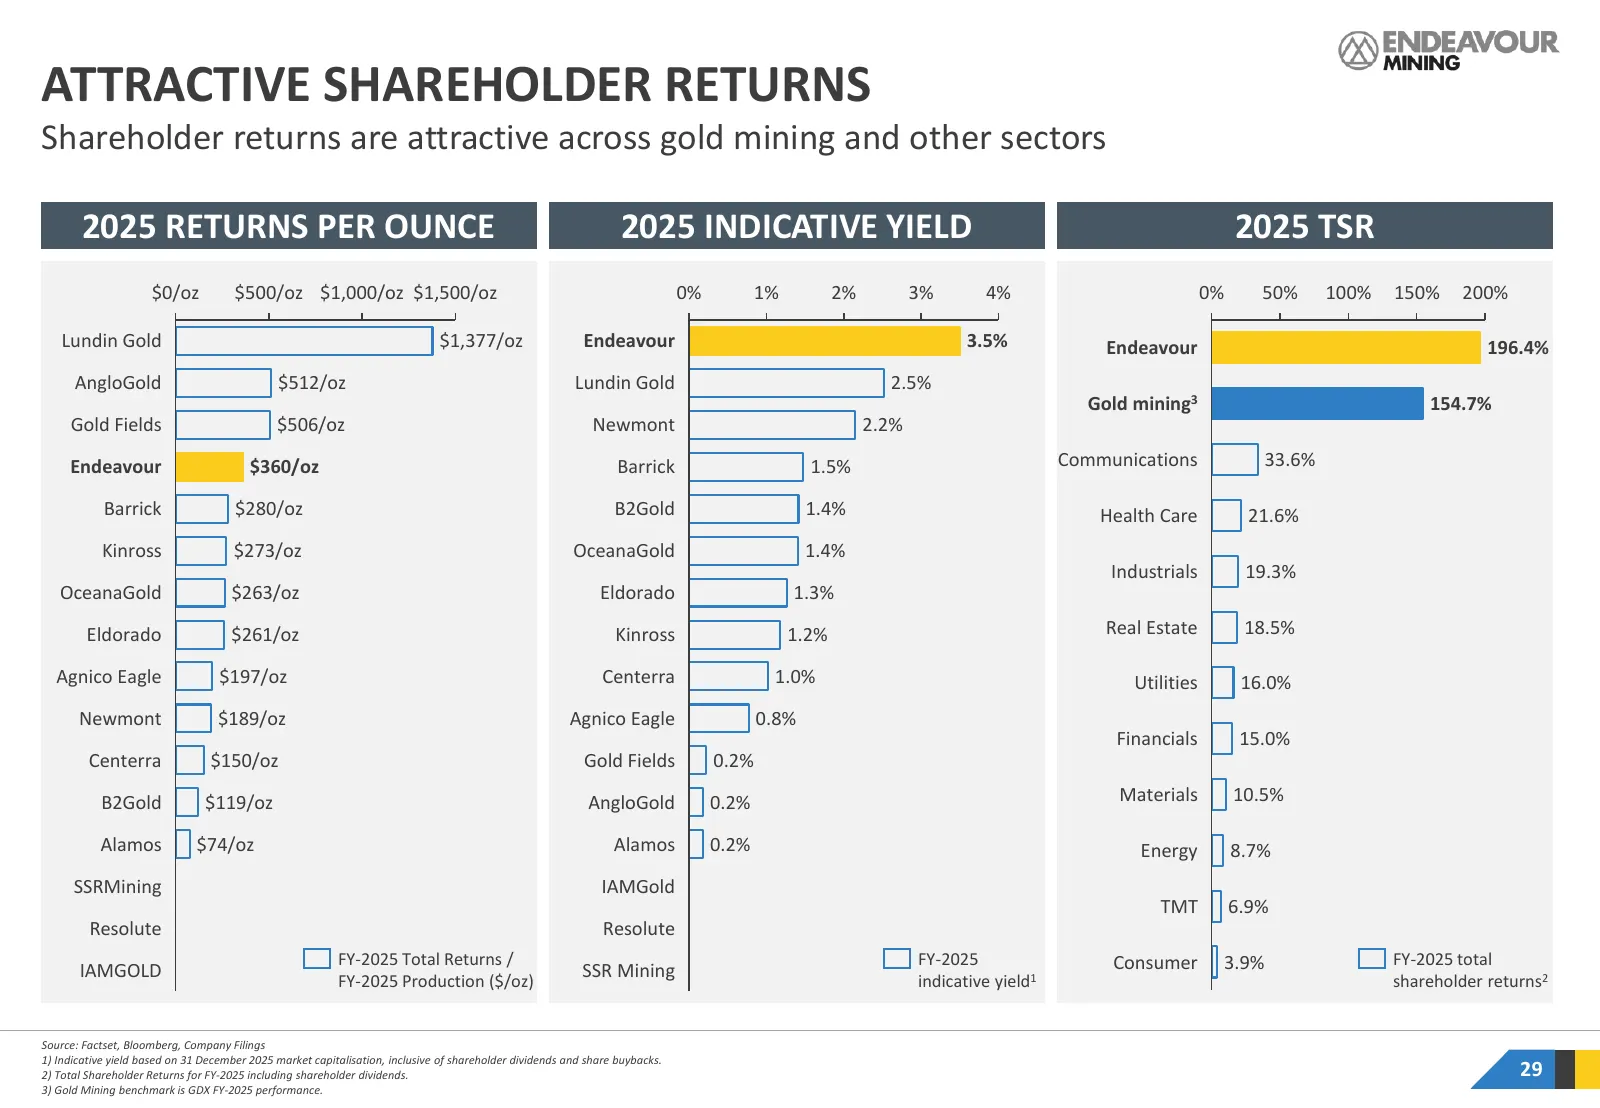
ATTRACTIVE SHAREHOLDER RETURNS Shareholder returns are attractive across gold mining and other sectors 2025 RETURNS PER OUNCE 2025 INDICATIVE YIELD 2025 TSR $0/oz $500/oz $1,000/oz $1,500/oz 0% 1% 2% 3% 4% 0% 50% 100% 150% 200% Lundin Gold $1,377/oz Endeavour 3.5% Endeavour 196.4% AngloGold $512/oz
Slide 30: 2026-2028 Shareholder Returns Programme
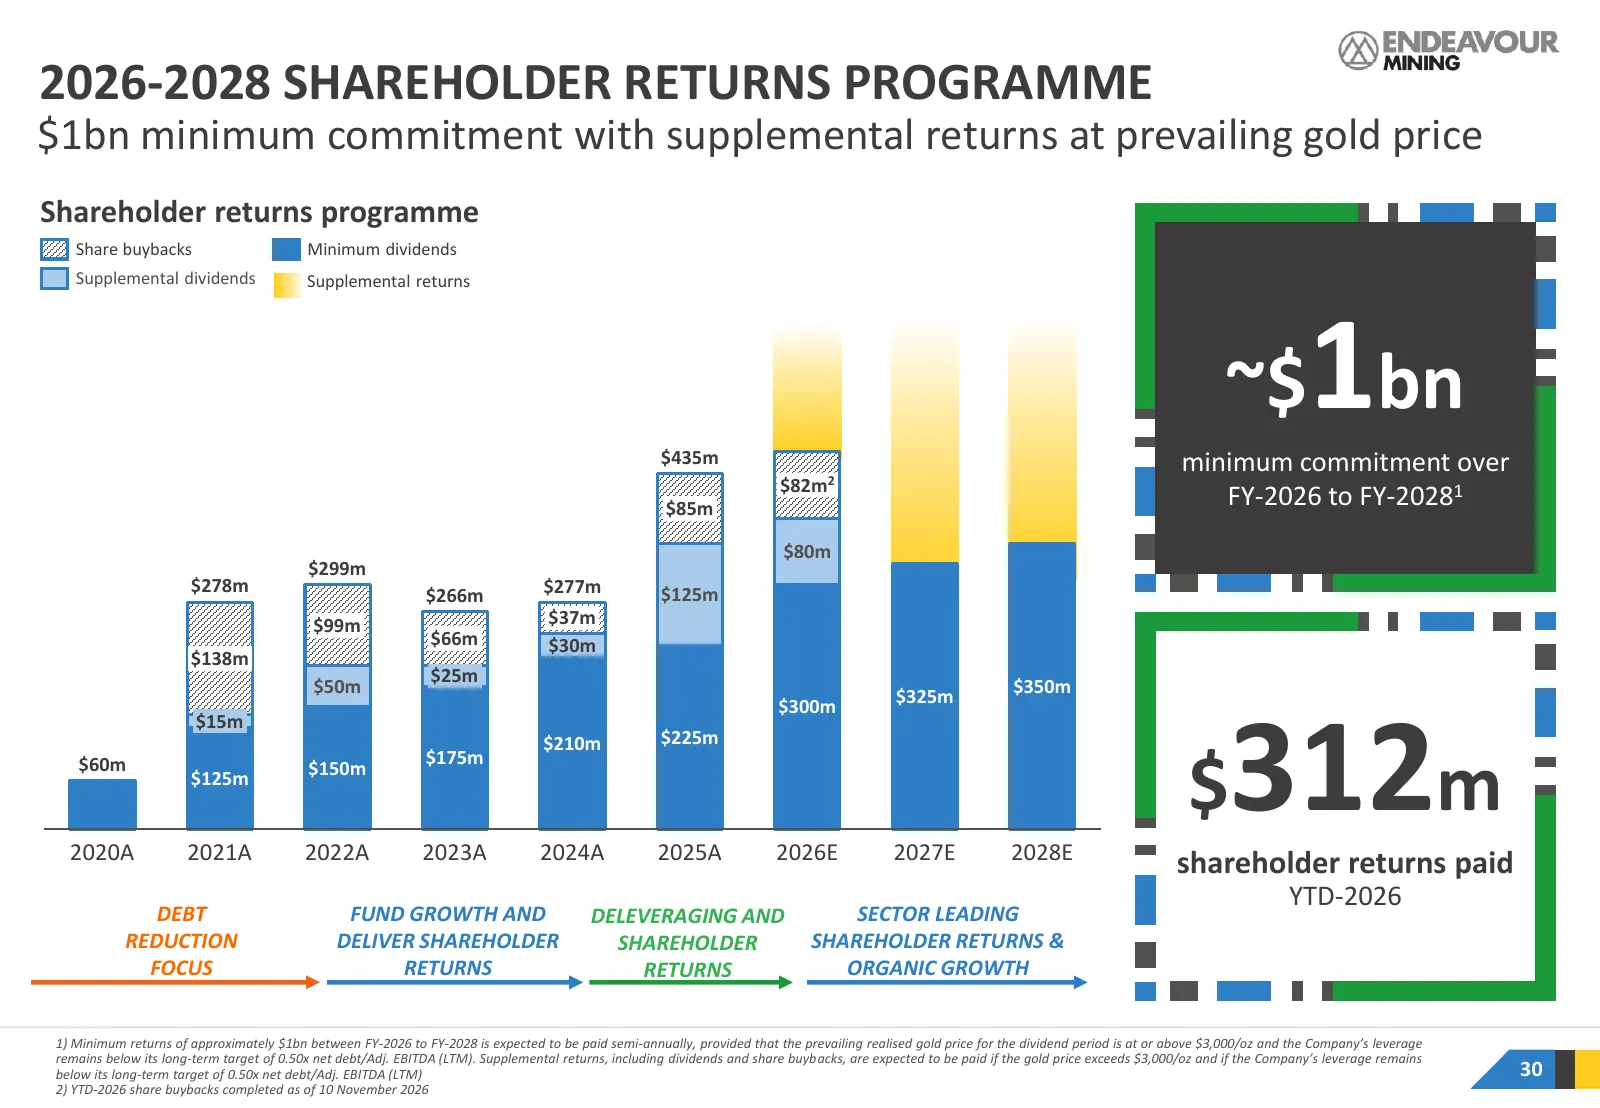
~$ bn 2026-2028 SHAREHOLDER RETURNS PROGRAMME $1bn minimum commitment with supplemental returns at prevailing gold price 1 minimum commitment over Shareholder returns programme FY-2026 to FY-2028 Share buybacks Minimum dividends Supplemental dividends Supplemental returns $435m ~$ bn 1 minimum commi
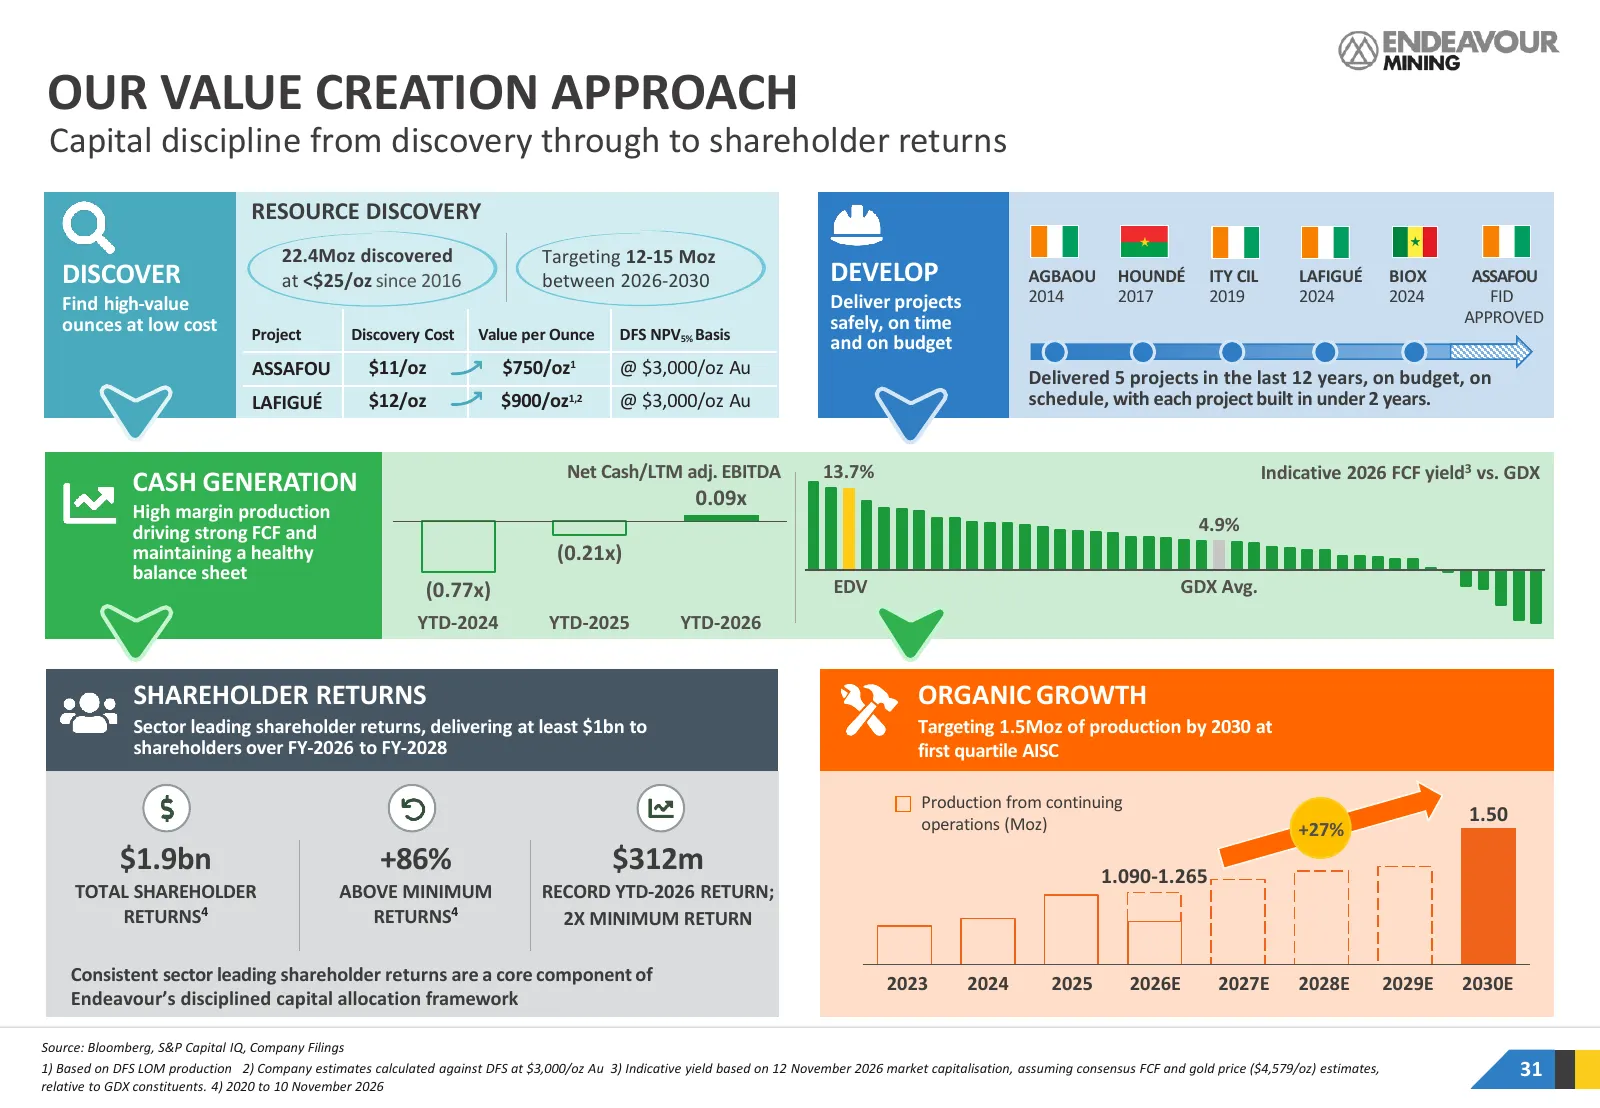
Slide 31: Our Value Creation Approach
OUR VALUE CREATION APPROACH Capital discipline from discovery through to shareholder returns RESOURCE DISCOVERY 22.4Moz discovered Targeting 12-15 Moz DISCOVER at <$25/oz since 2016 between 2026-2030 DEVELOP AGBAOU HOUNDÉ ITY CIL LAFIGUÉ BIOX ASSAFOU Find high-value Deliver projects 2014 2017 2019 2
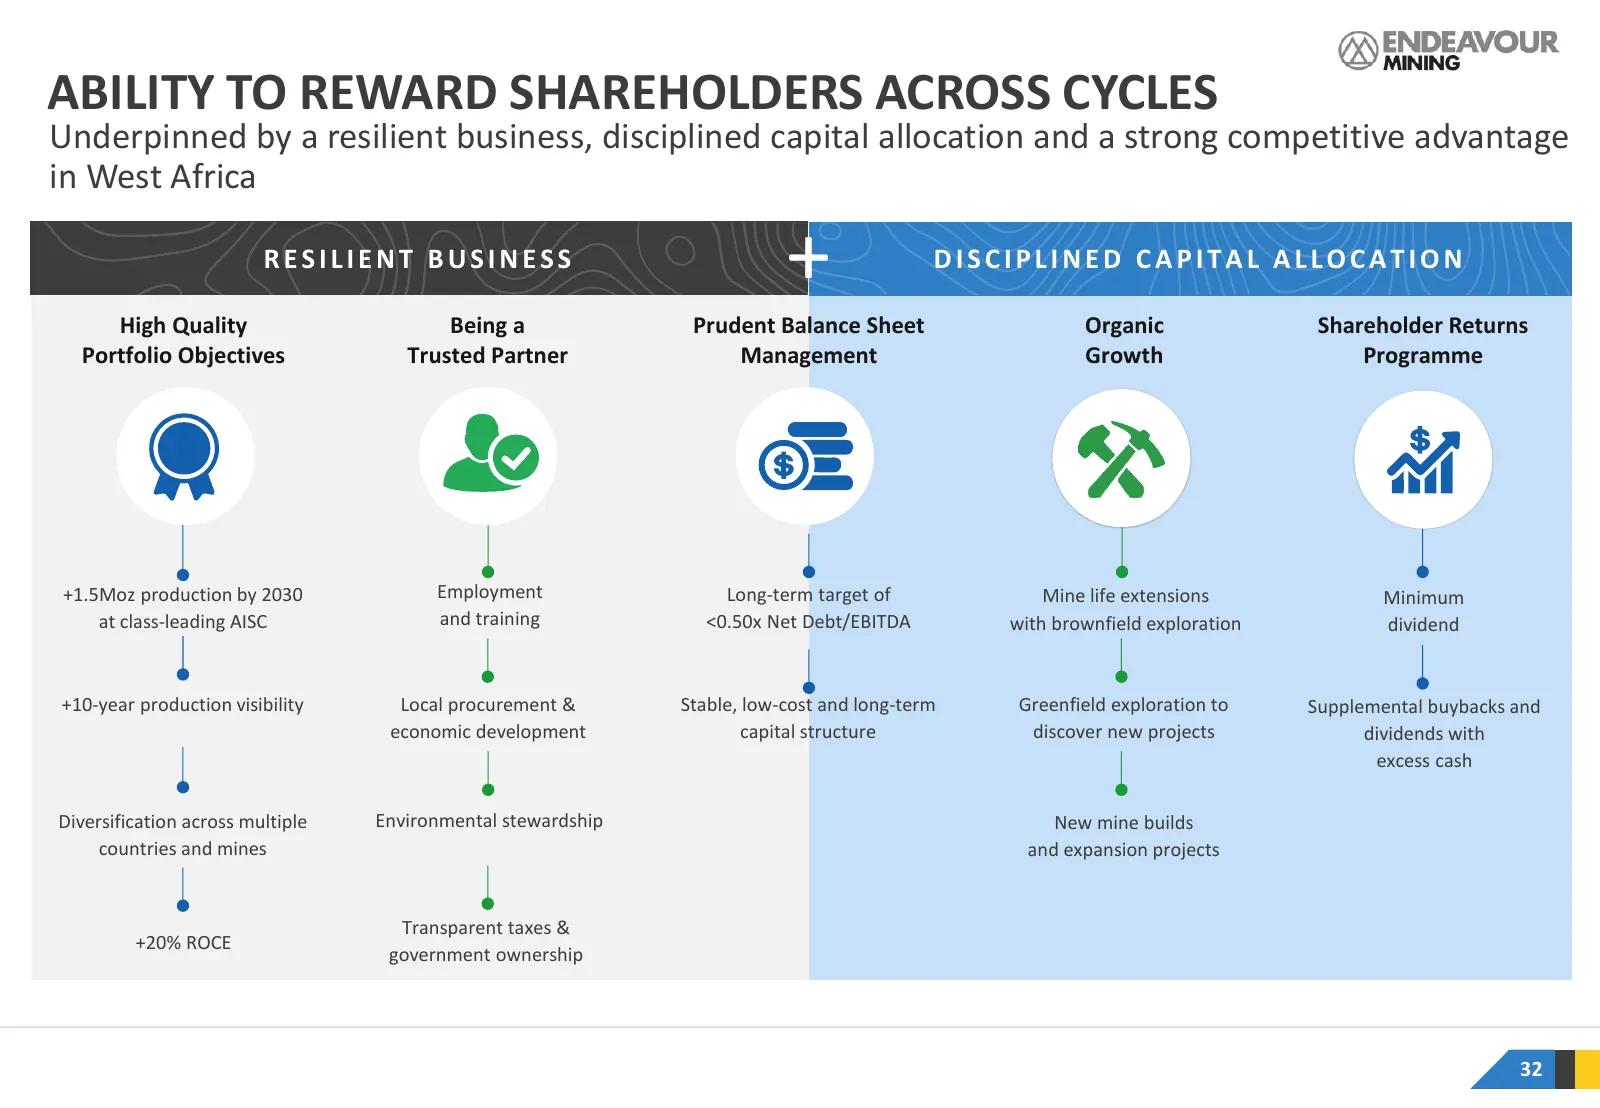
Slide 32: Ability to Reward Shareholders Across Cycles
ABILITY TO REWARD SHAREHOLDERS ACROSS CYCLES Underpinned by a resilient business, disciplined capital allocation and a strong competitive advantage in West Africa RESILIENT BUSINESS + DISCIPLINED CAPITAL ALLOCATION High Quality Being a Prudent Balance Sheet Organic Shareholder Returns Portfolio Obje
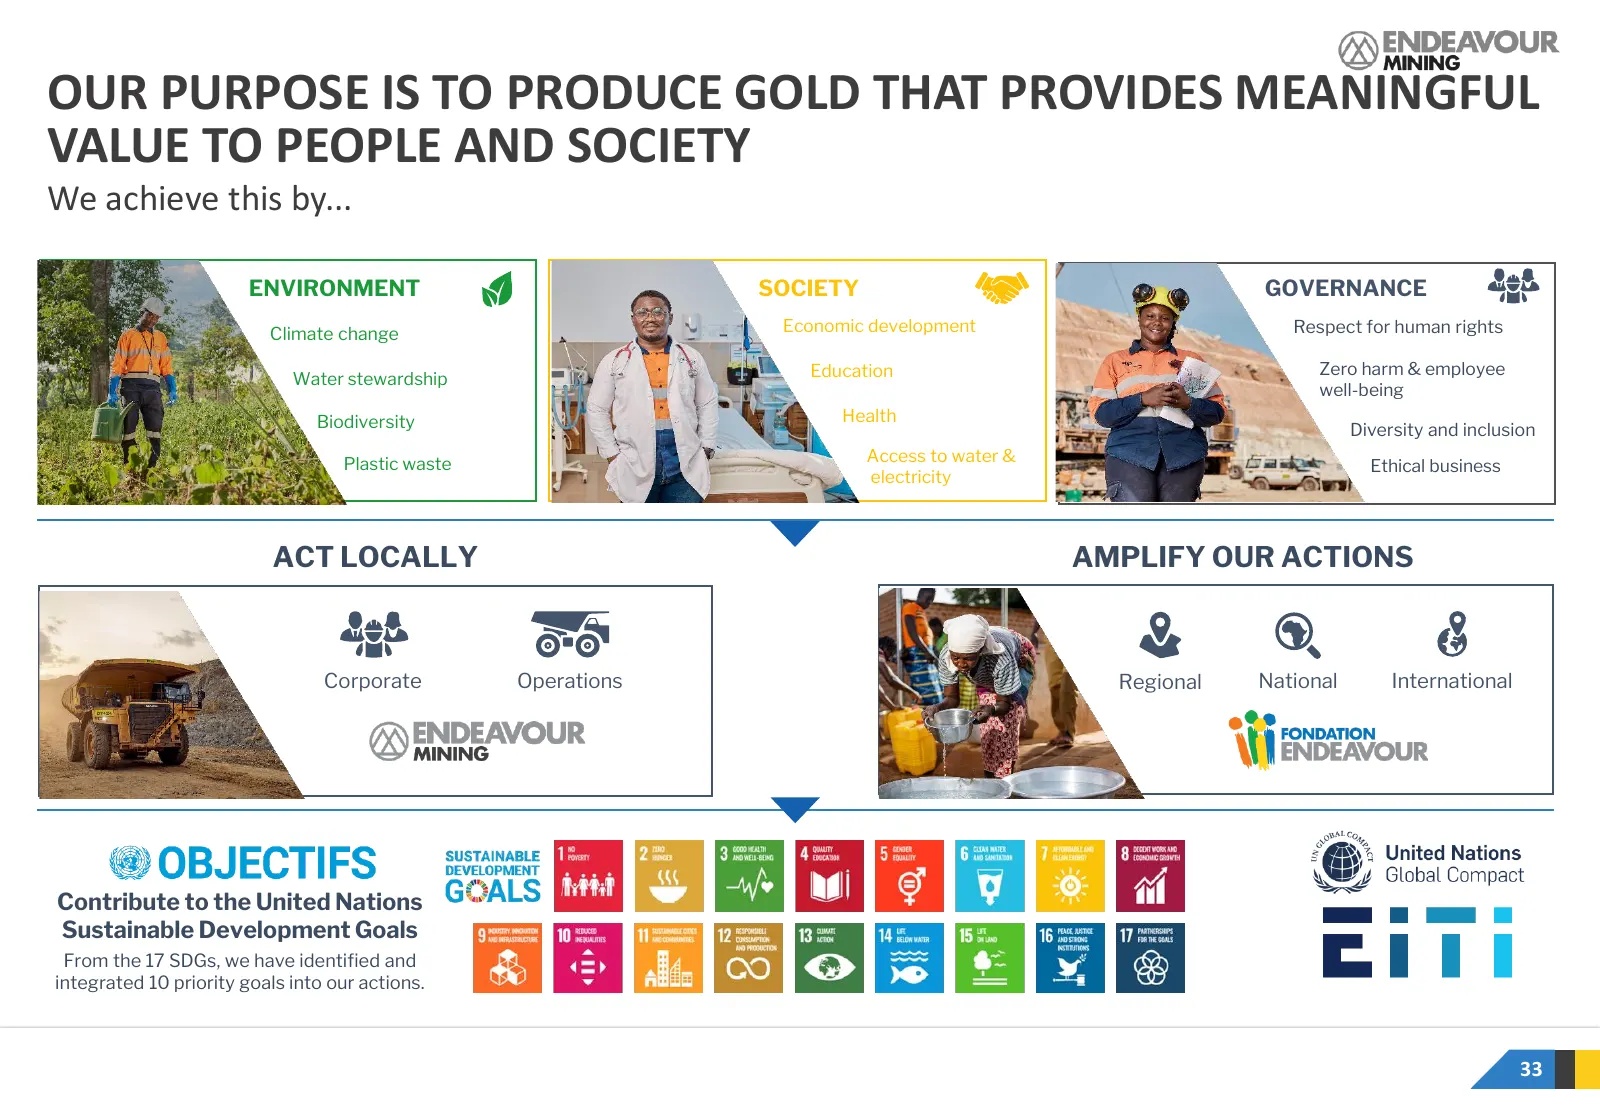
Slide 33: Our Purpose Is to Produce Gold That Provides Meaningful Value
OUR PURPOSE IS TO PRODUCE GOLD THAT PROVIDES MEANINGFUL VALUE TO PEOPLE AND SOCIETY We achieve this by... ENVIRONMENT SOCIETY GOVERNANCE Climate change Economic development Respect for human rights Education Zero harm & employee Water stewardship well-being Biodiversity Health Diversity and inclusio
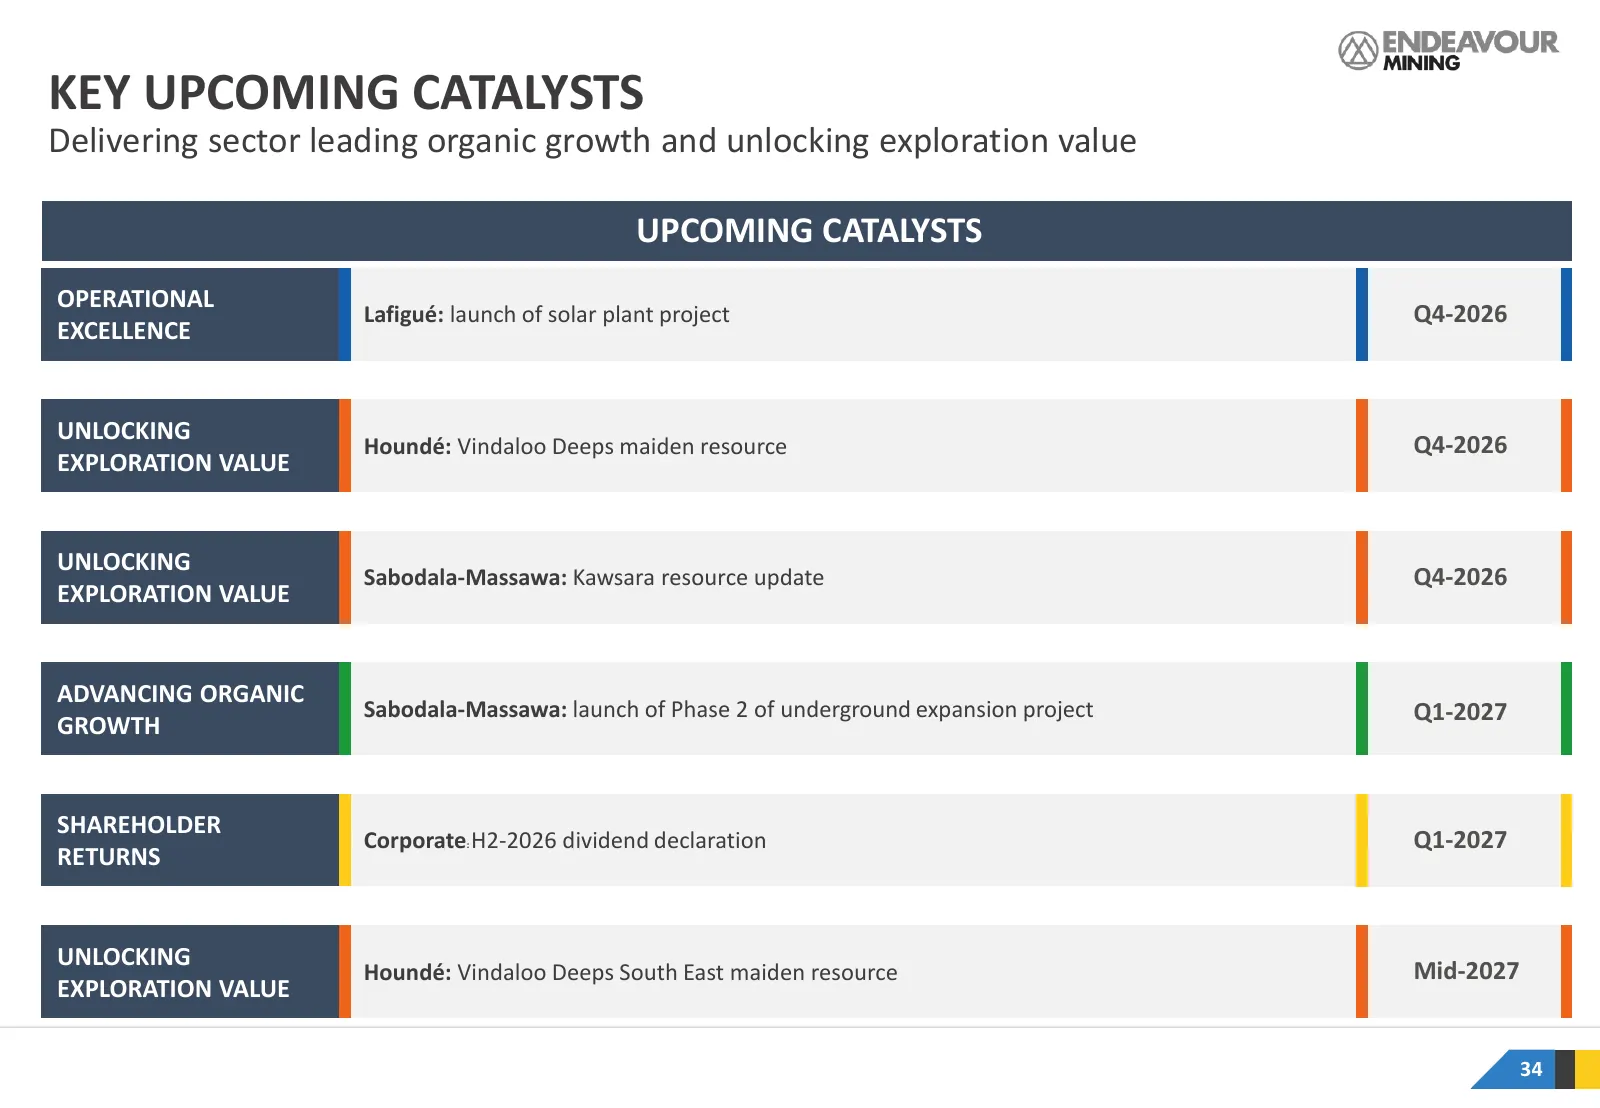
Slide 34: Key Upcoming Catalysts
KEY UPCOMING CATALYSTS Delivering sector leading organic growth and unlocking exploration value UPCOMING CATALYSTS OPERATIONAL Lafigué: launch of solar plant project Q4-2026 EXCELLENCE UNLOCKING Houndé: Vindaloo Deeps maiden resource Q4-2026 EXPLORATION VALUE UNLOCKING Sabodala-Massawa: Kawsara reso
Slide 35: Financial Results and Outlook
FINANCIAL RESULTS AND OUTLOOK 2
Slide 36: Financial Highlights
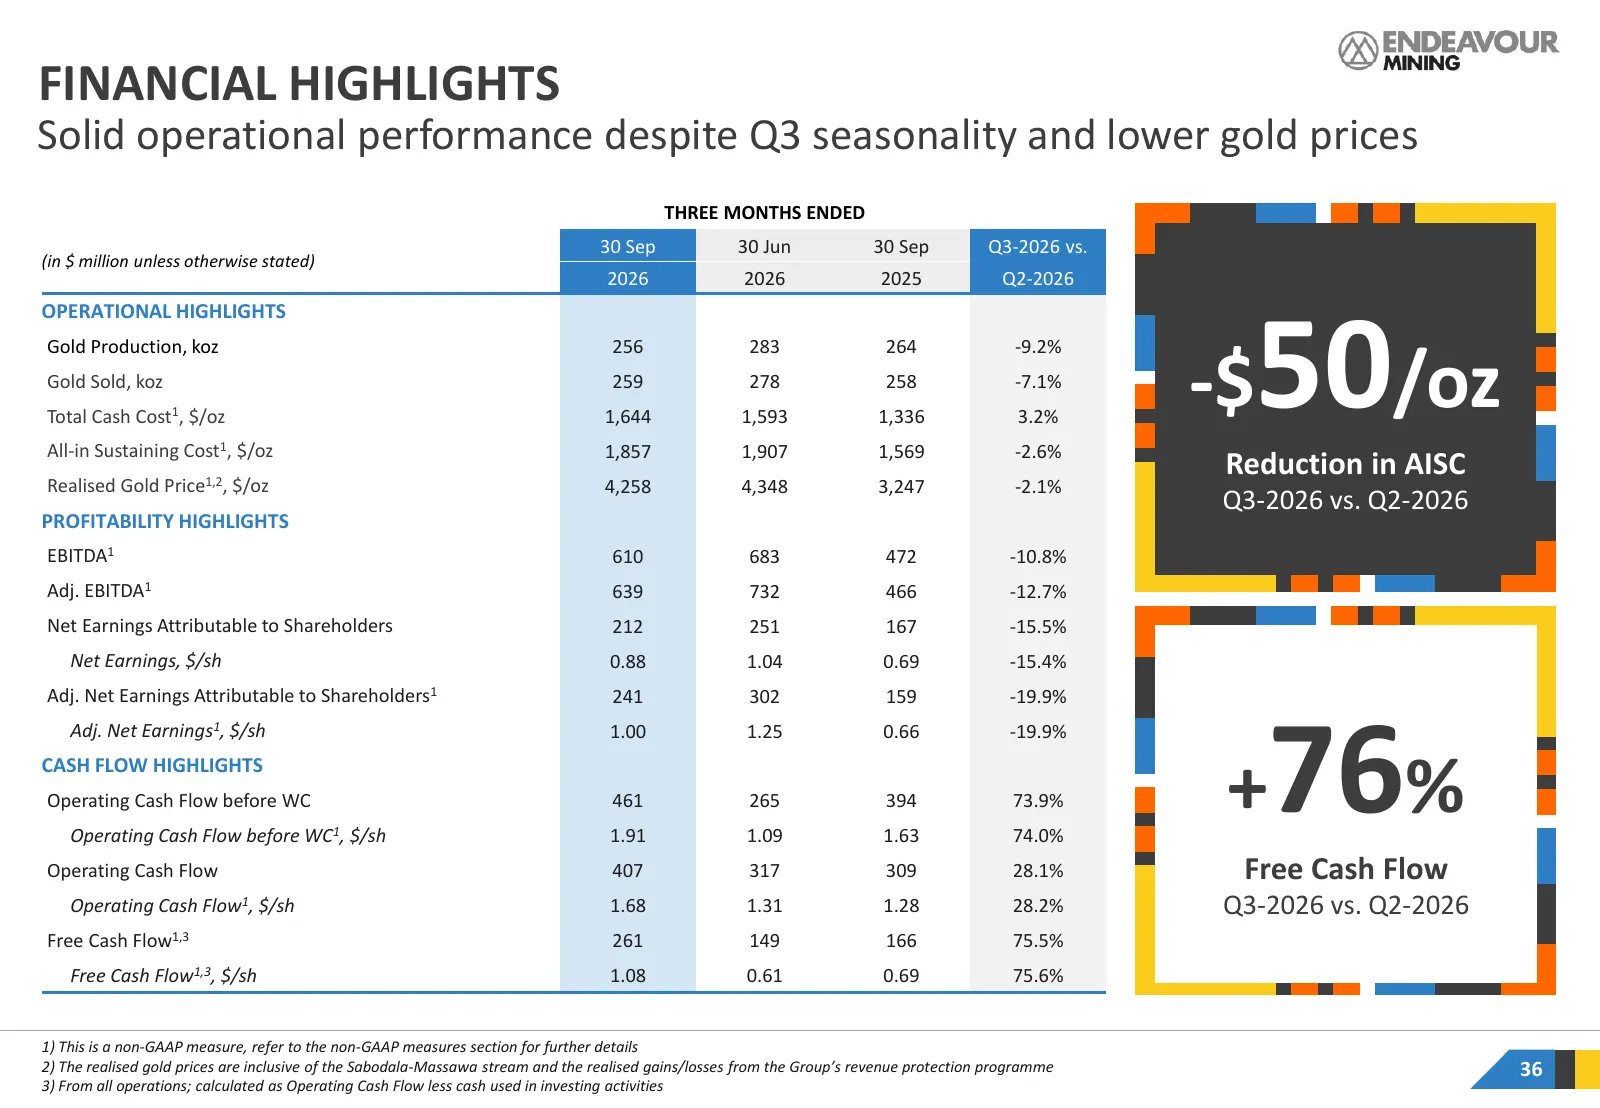
FINANCIAL HIGHLIGHTS Solid operational performance despite Q3 seasonality and lower gold prices THREE MONTHS ENDED 30 Sep 30 Jun 30 Sep Q3-2026 vs. (in $ million unless otherwise stated) 2026 2026 2025 Q2-2026 OPERATIONAL HIGHLIGHTS Gold Production, koz Gold Sold, koz Total Cash Cost1, $/oz All-in S
Slide 37: On Track to Achieve Full Year Guidance
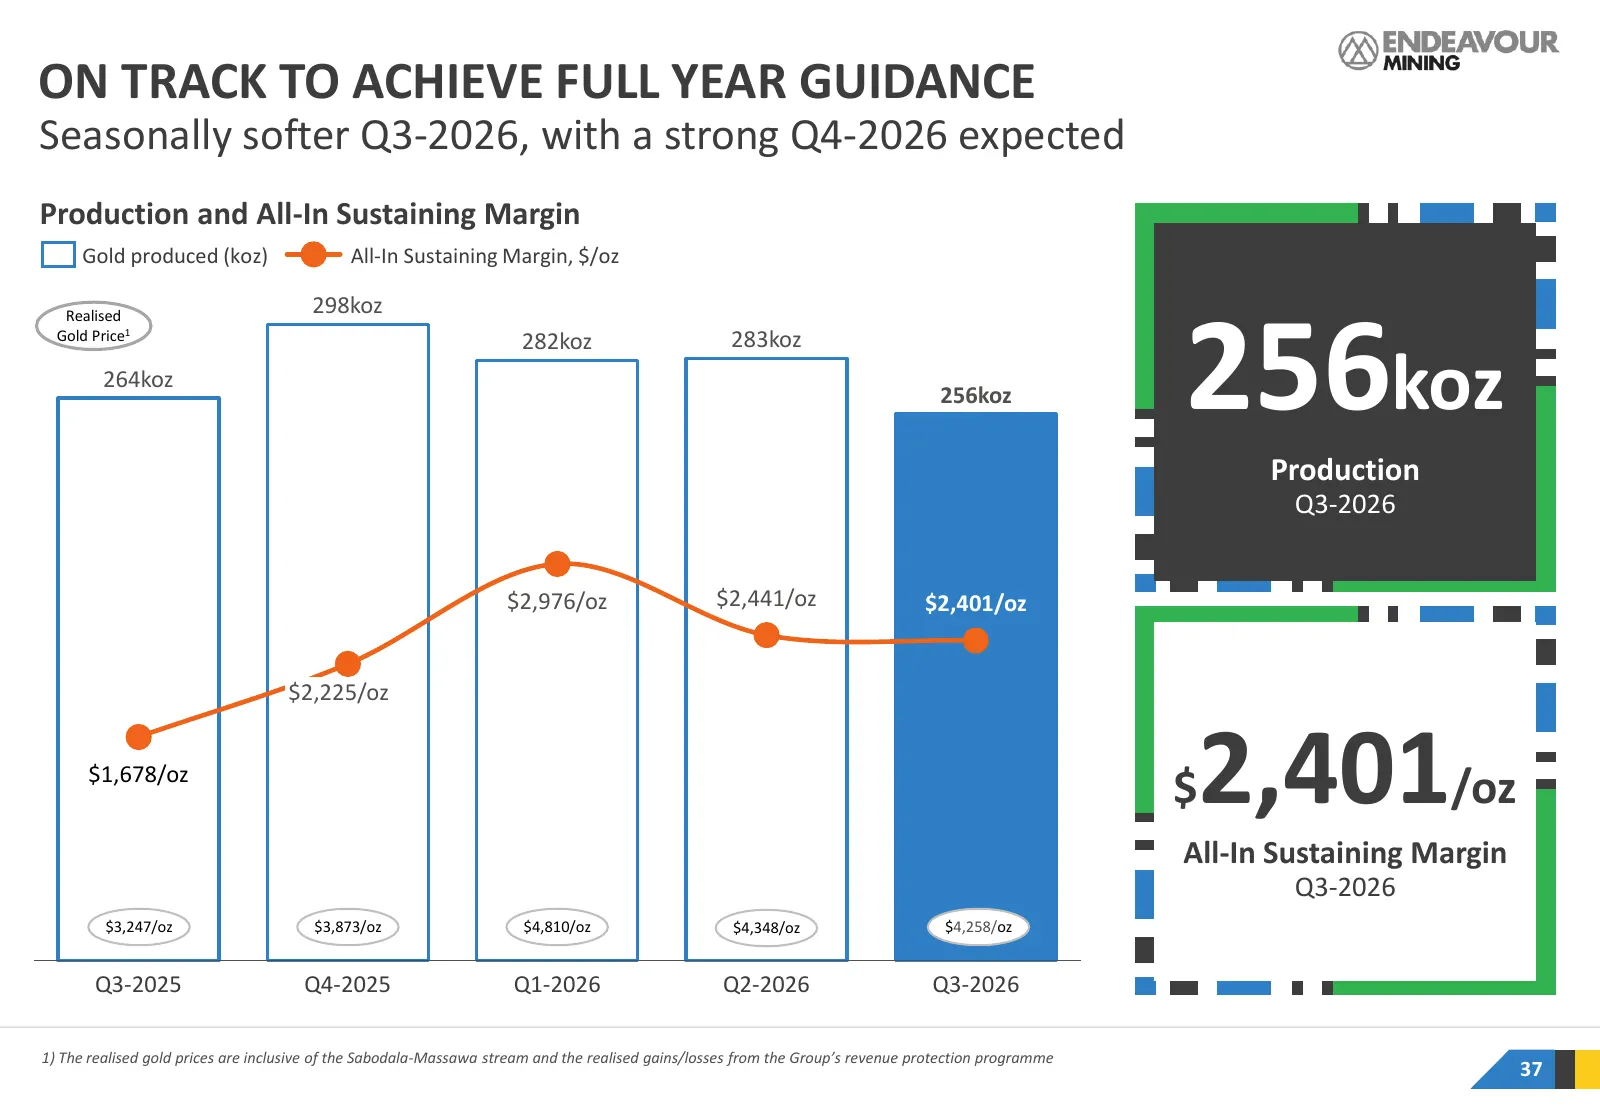
ON TRACK TO ACHIEVE FULL YEAR GUIDANCE Seasonally softer Q3-2026, with a strong Q4-2026 expected Production and All-In Sustaining Margin Gold produced (koz) All-In Sustaining Margin, $/oz 298koz 256koz Realised Gold Price1 283koz 282koz 264koz 256koz Production Q3-2026 $2,976/oz $2,441/oz $2,401/oz
Slide 38: Our Cost Base
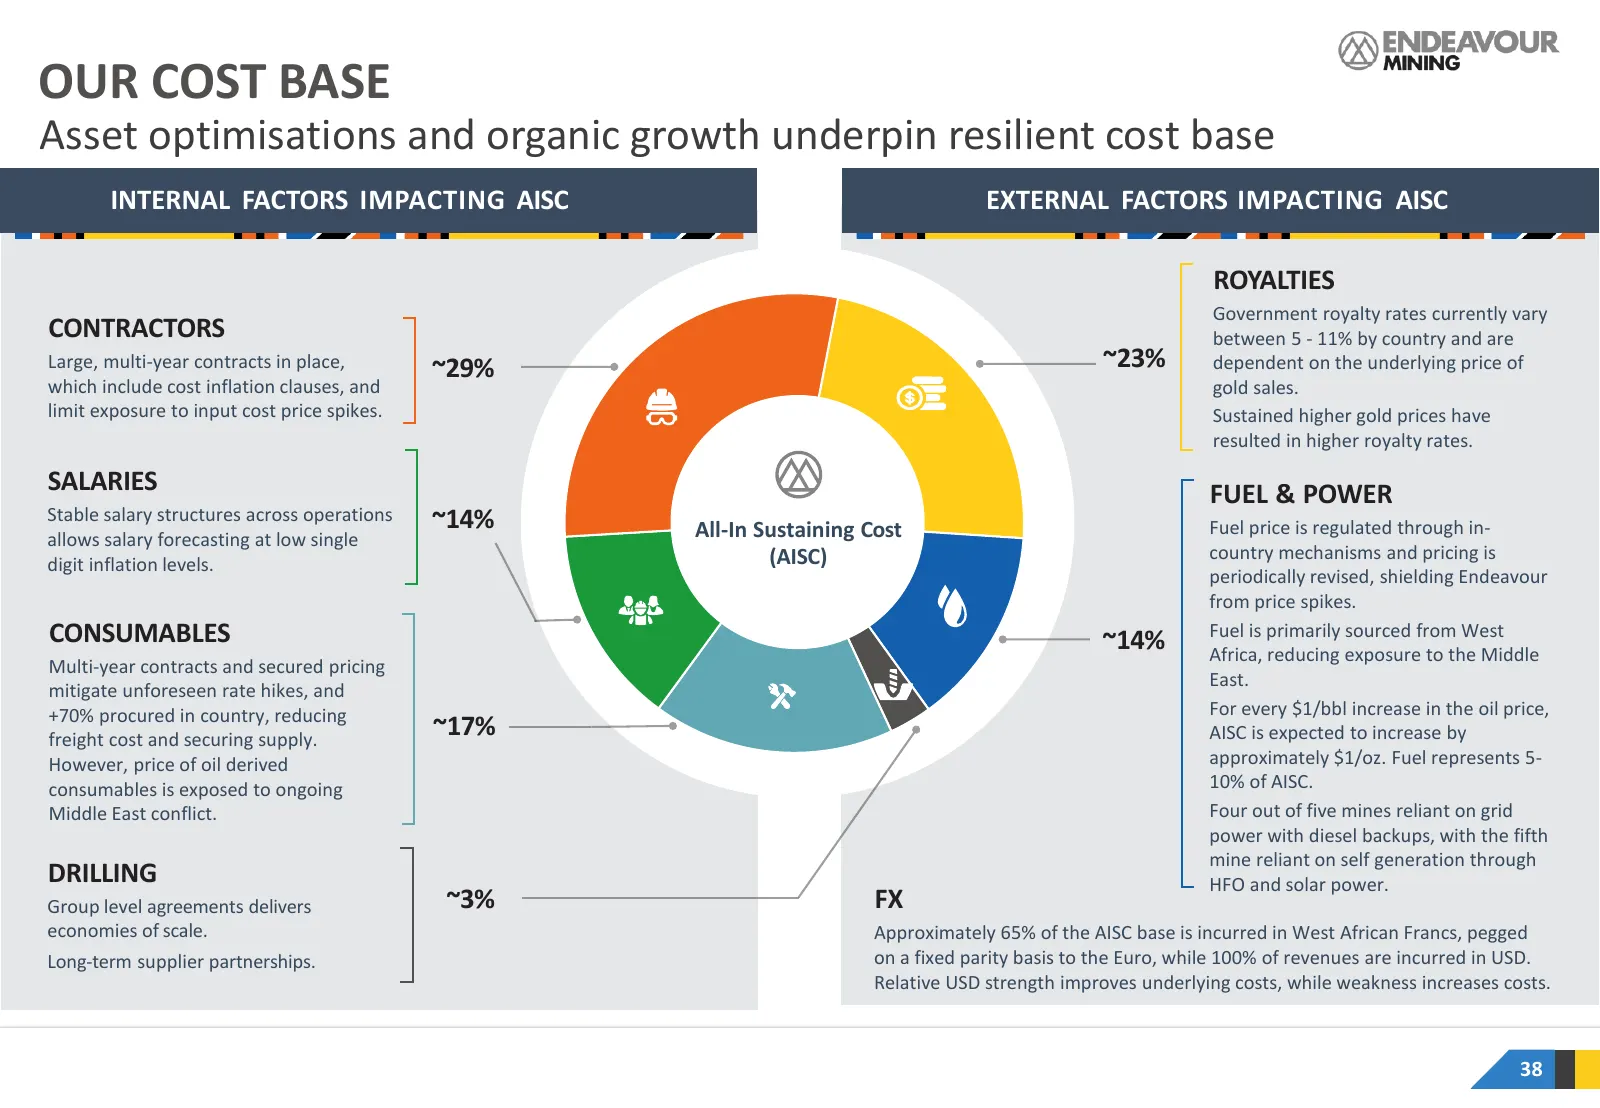
OUR COST BASE Asset optimisations and organic growth underpin resilient cost base INTERNAL FACTORS IMPACTING AISC EXTERNAL FACTORS IMPACTING AISC ROYALTIES Government royalty rates currently vary CONTRACTORS between 5 - 11% by country and are Large, multi-year contracts in place, ~29% ~23% dependent
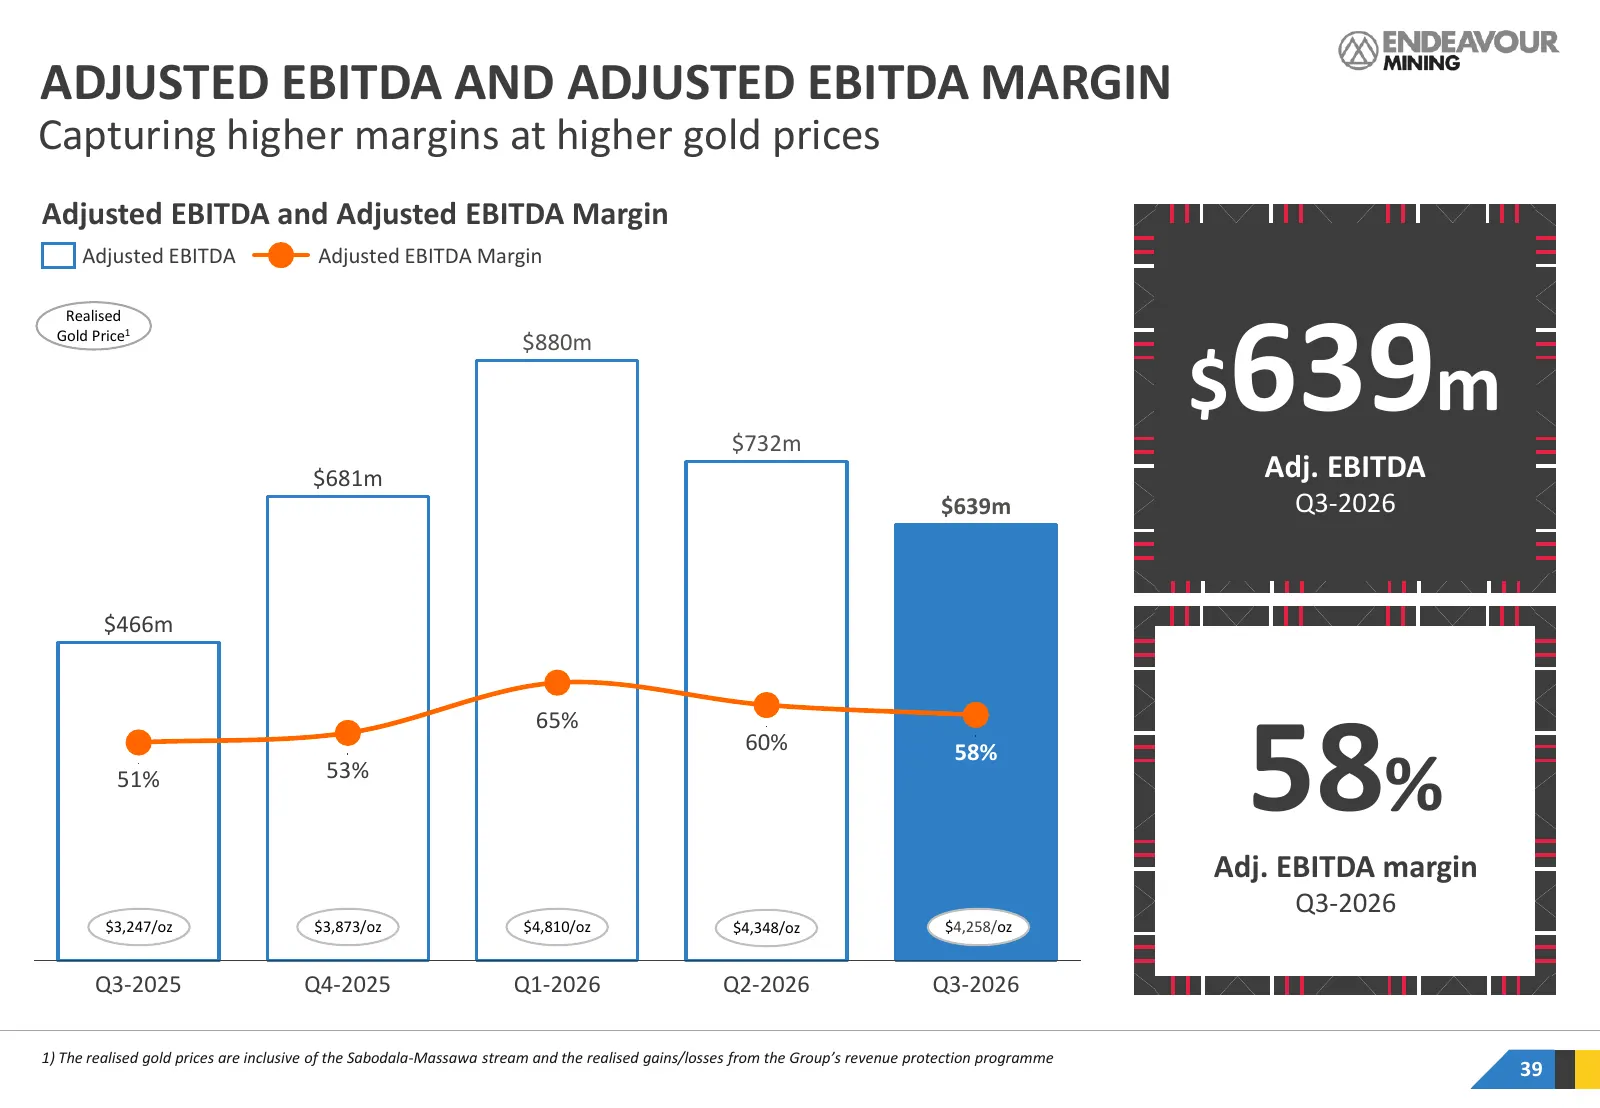
Slide 39: Adjusted EBITDA and Adjusted EBITDA Margin
39 ADJUSTED EBITDA AND ADJUSTED EBITDA MARGIN Capturing higher margins at higher gold prices Adjusted EBITDA and Adjusted EBITDA Margin Adjusted EBITDA Adjusted EBITDA Margin 639m Realised Gold Price1 $880m $732m $ $681m Adj. EBITDA $639m Q3-2026 $466m 58% 65% 60% 58% 51% 53% Adj. EBITDA margin Q3-2
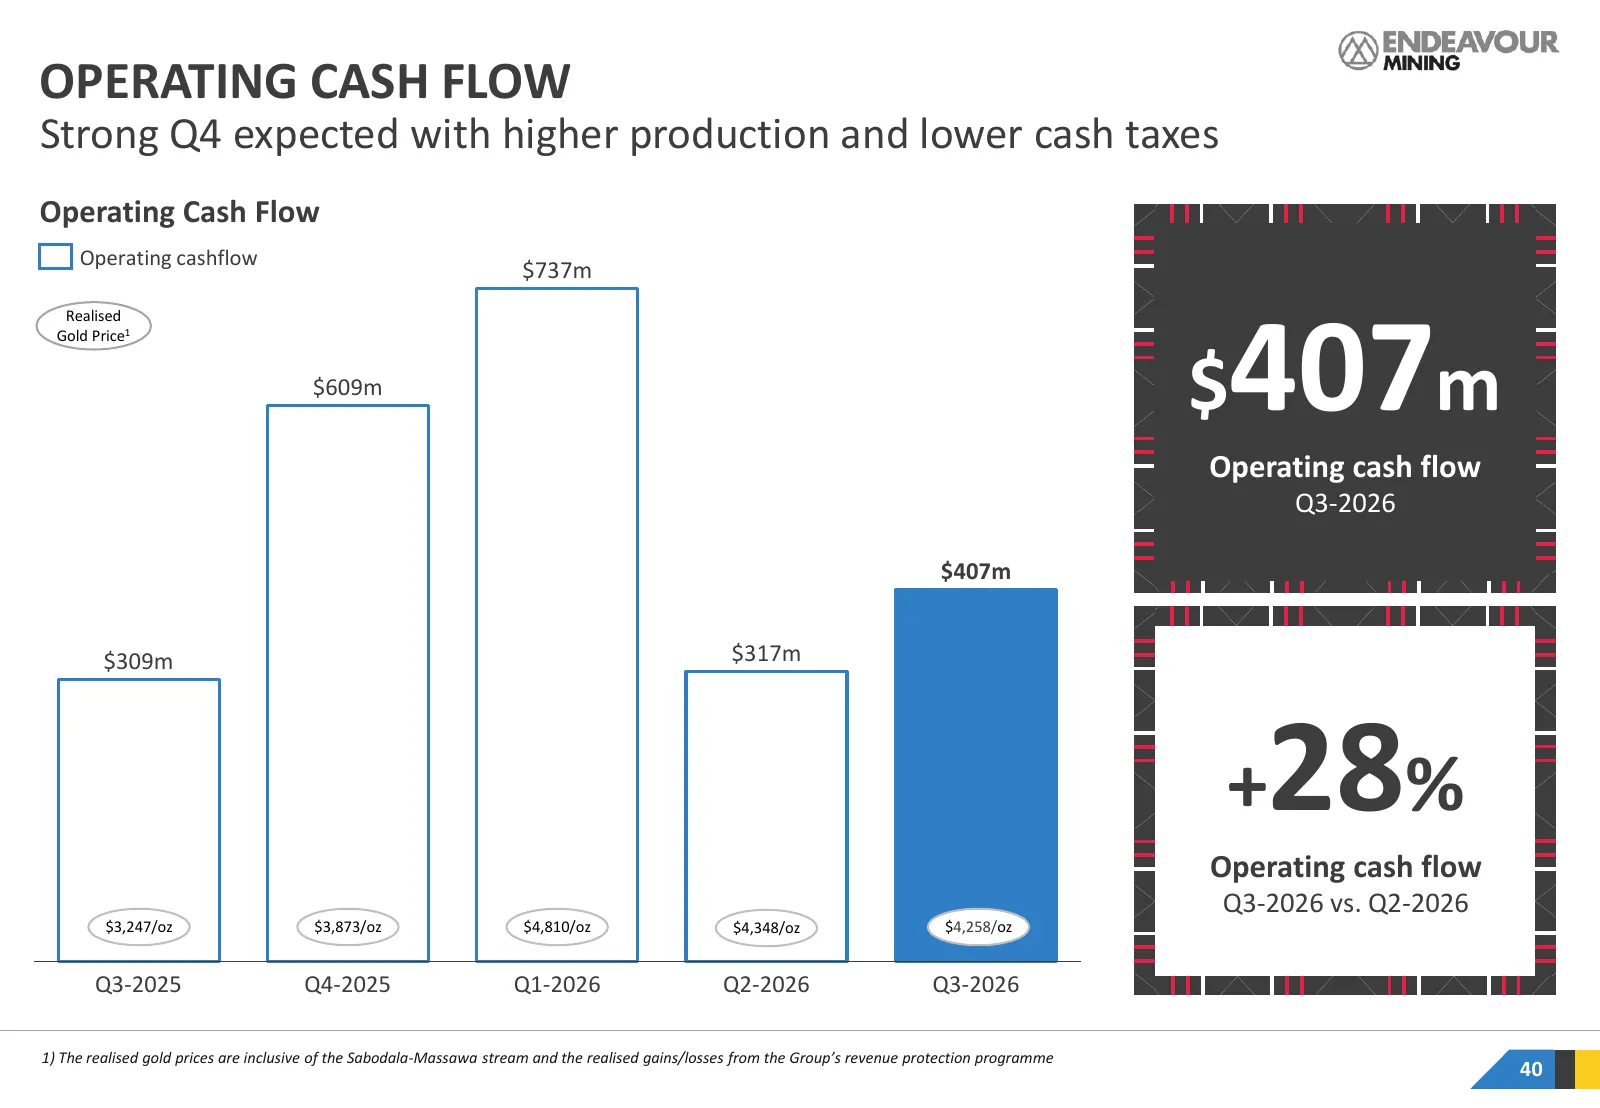
Slide 40: Operating Cash Flow
OPERATING CASH FLOW Strong Q4 expected with higher production and lower cash taxes Operating Cash Flow Operating cashflow $737m 407m Realised Gold Price1 $609m $ Operating cash flow Q3-2026 $407m $309m $317m + 28% Operating cash flow Q3-2026 vs. Q2-2026 $3,247/oz $3,873/oz $4,810/oz $4,348/oz $4,258
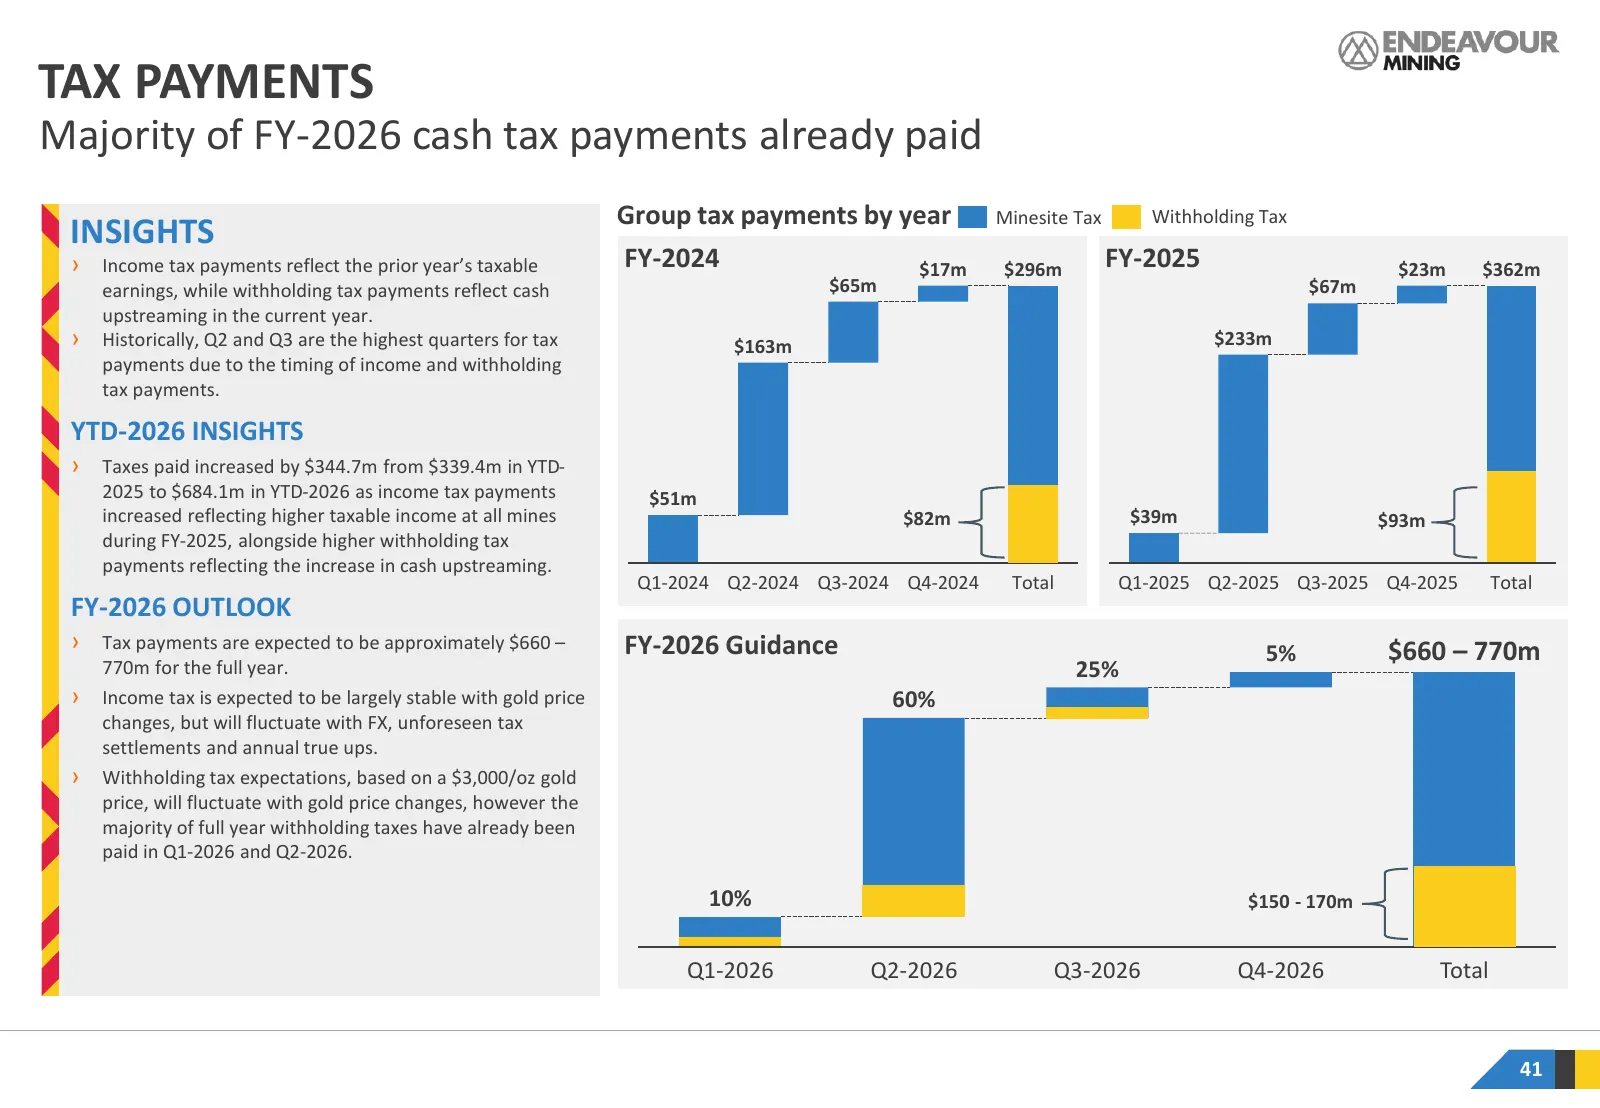
Slide 41: Tax Payments
TAX PAYMENTS Majority of FY-2026 cash tax payments already paid Group tax payments by year Minesite Tax Withholding Tax INSIGHTS › Income tax payments reflect the prior year’s taxable FY-2024 $17m $296m FY-2025 $23m $362m earnings, while withholding tax payments reflect cash $65m $67m upstreaming in
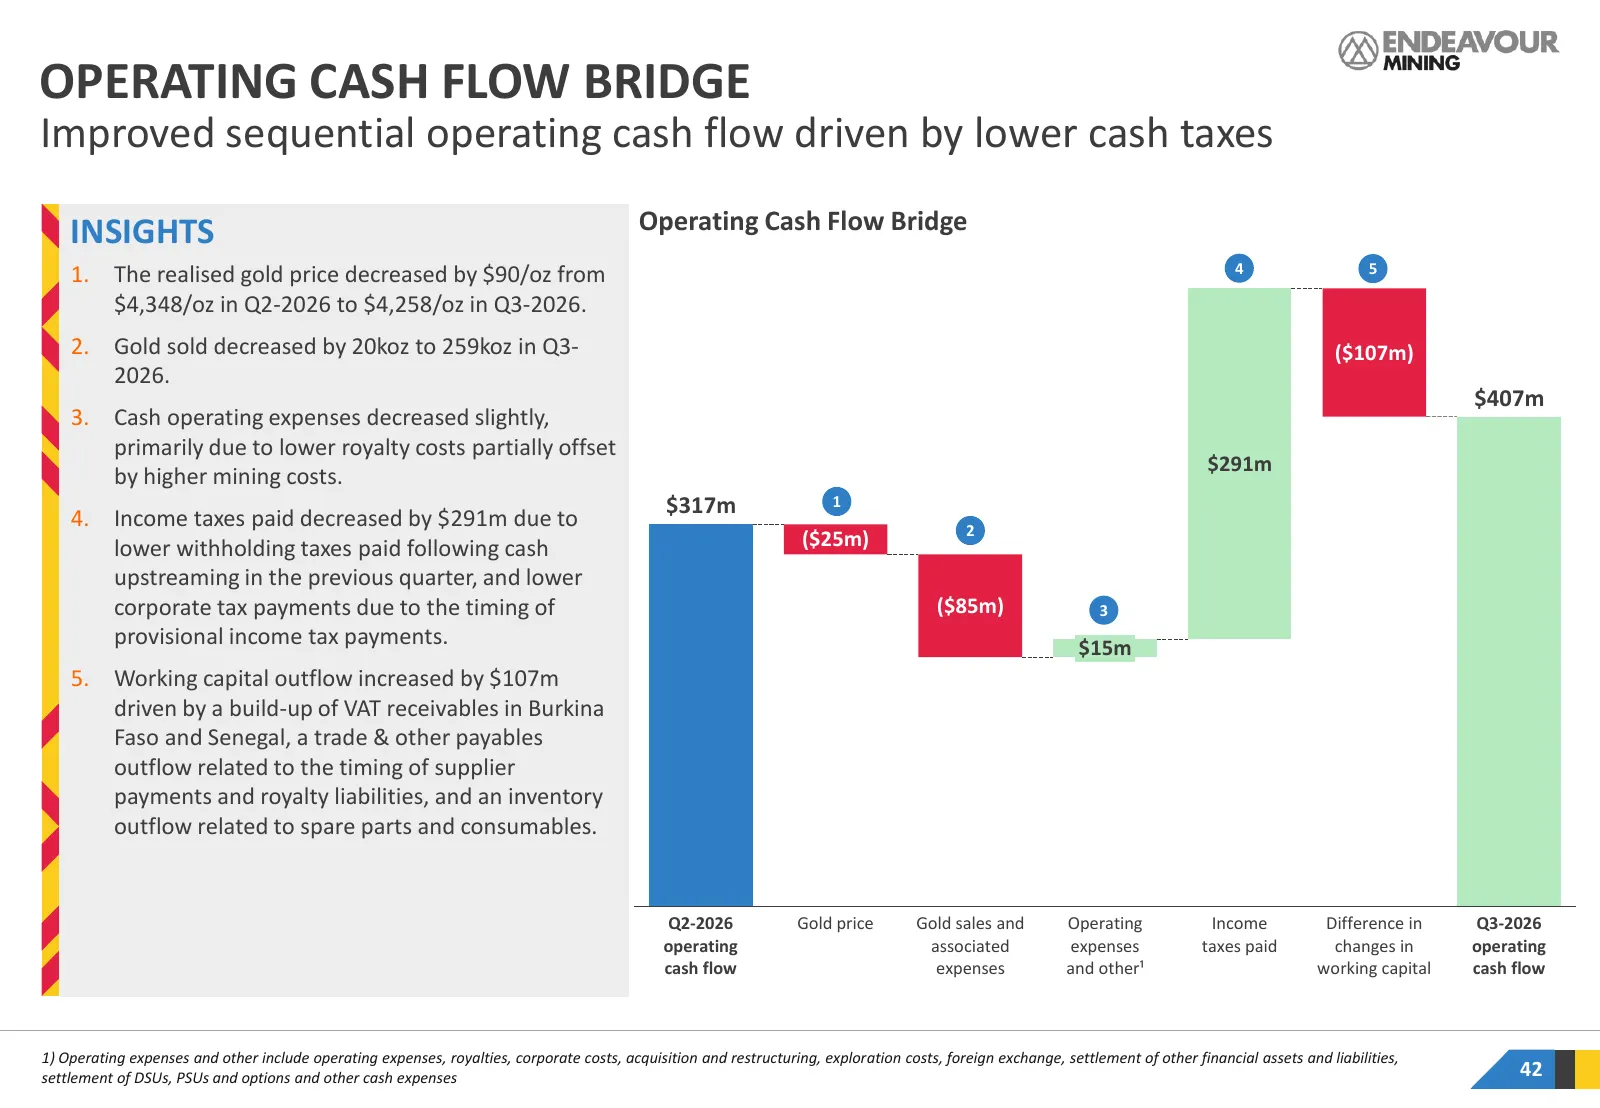
Slide 42: Operating Cash Flow Bridge
OPERATING CASH FLOW BRIDGE Improved sequential operating cash flow driven by lower cash taxes INSIGHTS Operating Cash Flow Bridge 4 5 1. The realised gold price decreased by $90/oz from $4,348/oz in Q2-2026 to $4,258/oz in Q3-2026. 2. Gold sold decreased by 20koz to 259koz in Q3- ($107m) 2026. $407m
Slide 43: Record Free Cash Flow
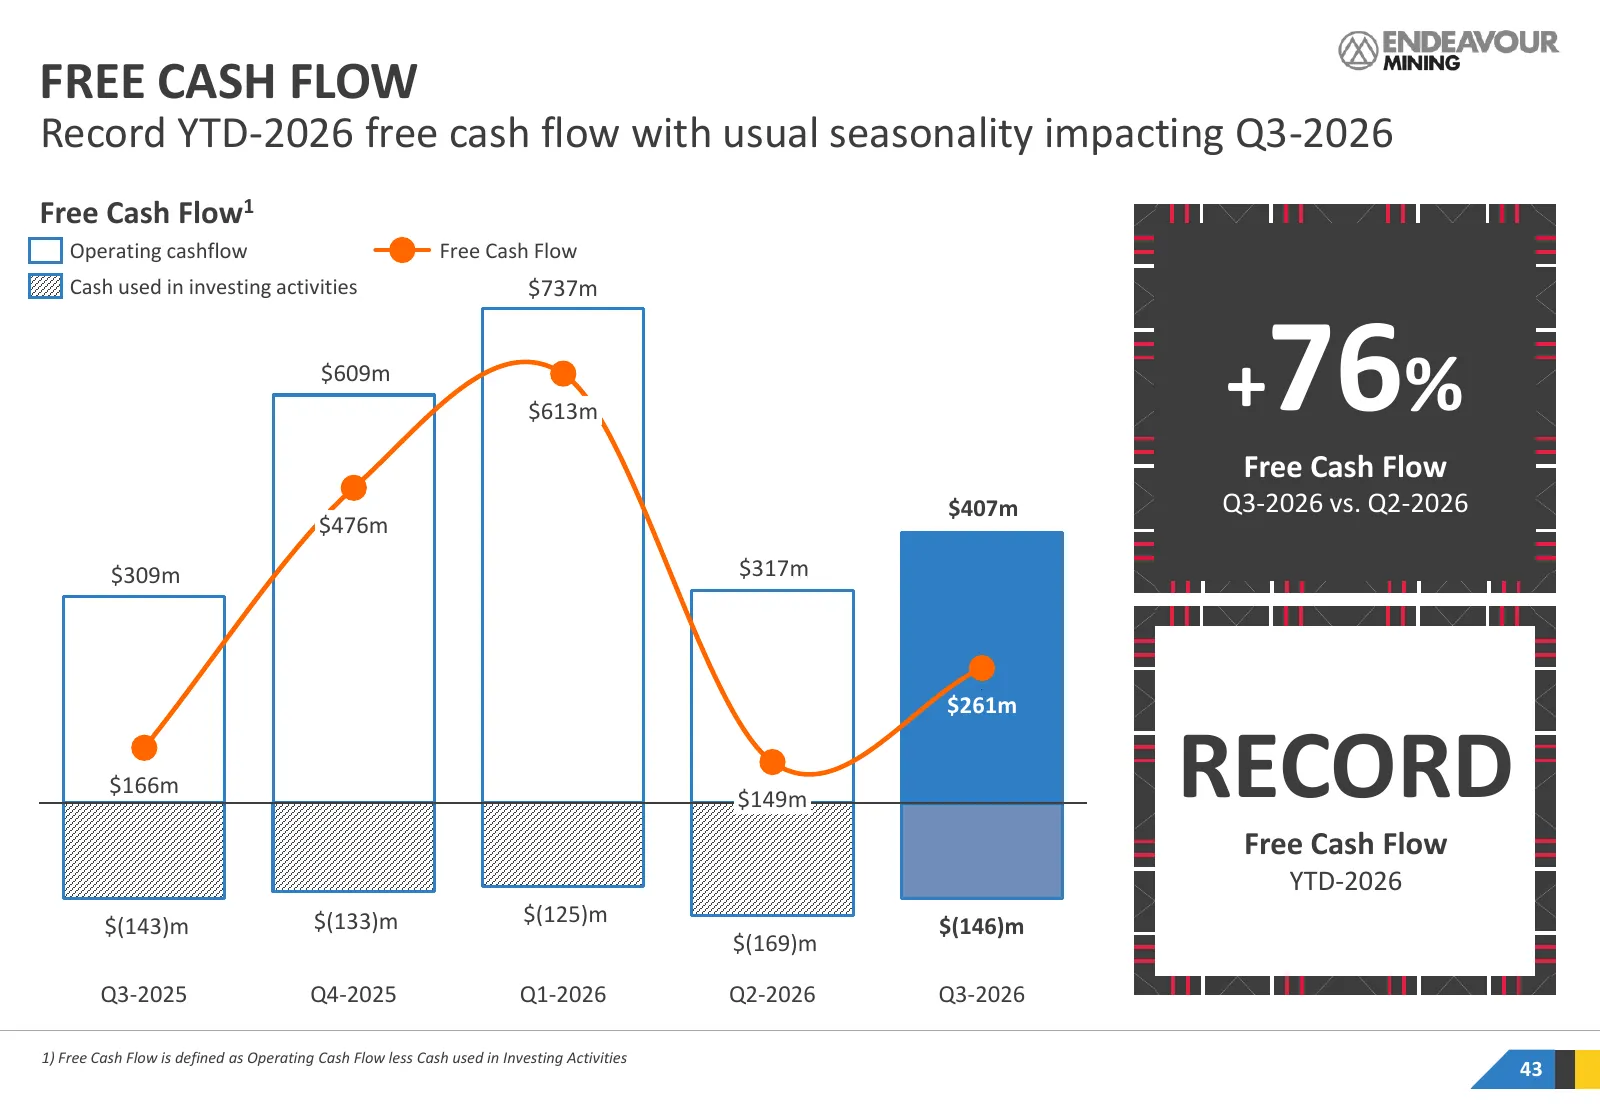
FREE CASH FLOW Record YTD-2026 free cash flow with usual seasonality impacting Q3-2026 Free Cash Flow1 Operating cashflow Free Cash Flow Cash used in investing activities $737m $609m $613m + 76% Free Cash Flow $407m Q3-2026 vs. Q2-2026 $476m $309m $317m $261m $166m $149m RECORD Free Cash Flow YTD-20
Slide 44: Change in Net Debt
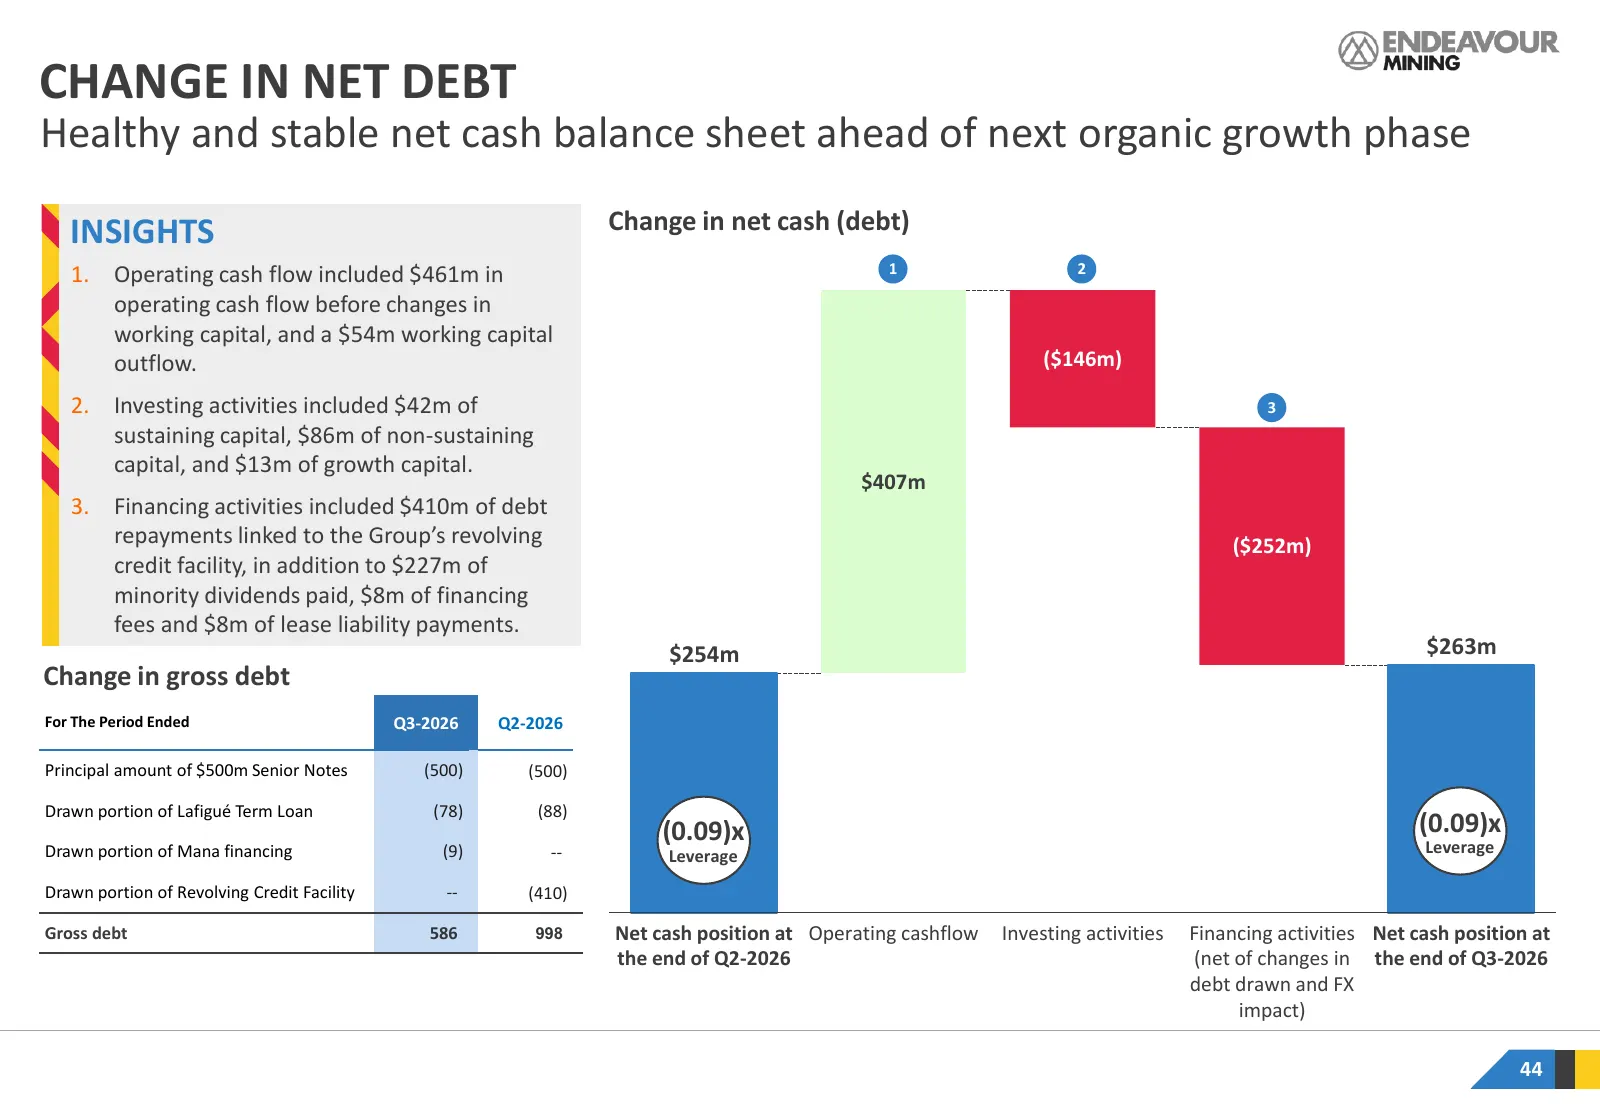
CHANGE IN NET DEBT Healthy and stable net cash balance sheet ahead of next organic growth phase INSIGHTS Change in net cash (debt) 1. Operating cash flow included $461m in 1 2 operating cash flow before changes in working capital, and a $54m working capital outflow. ($146m) 2. Investing activities i
Slide 45: Net Earnings
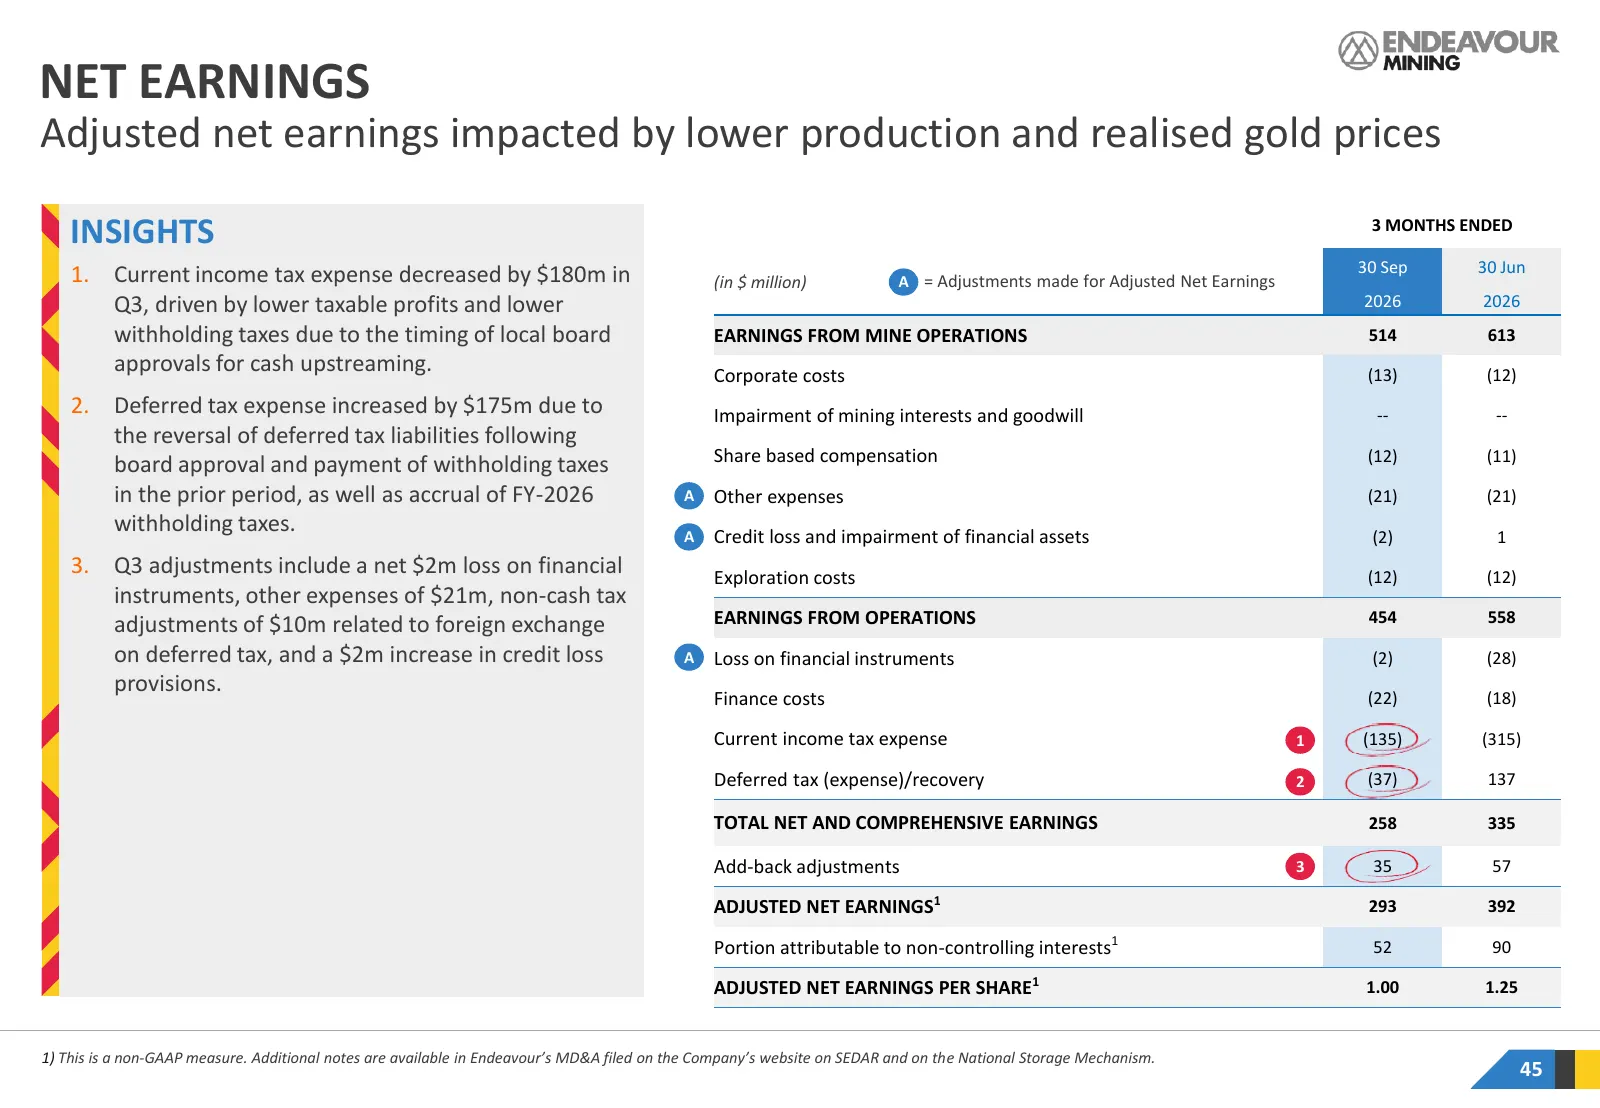
NET EARNINGS Adjusted net earnings impacted by lower production and realised gold prices INSIGHTS 3 MONTHS ENDED 30 Sep 30 Jun 1. Current income tax expense decreased by $180m in (in $ million) A = Adjustments made for Adjusted Net Earnings Q3, driven by lower taxable profits and lower 2026 2026 wit
Slide 46: Debt Structure
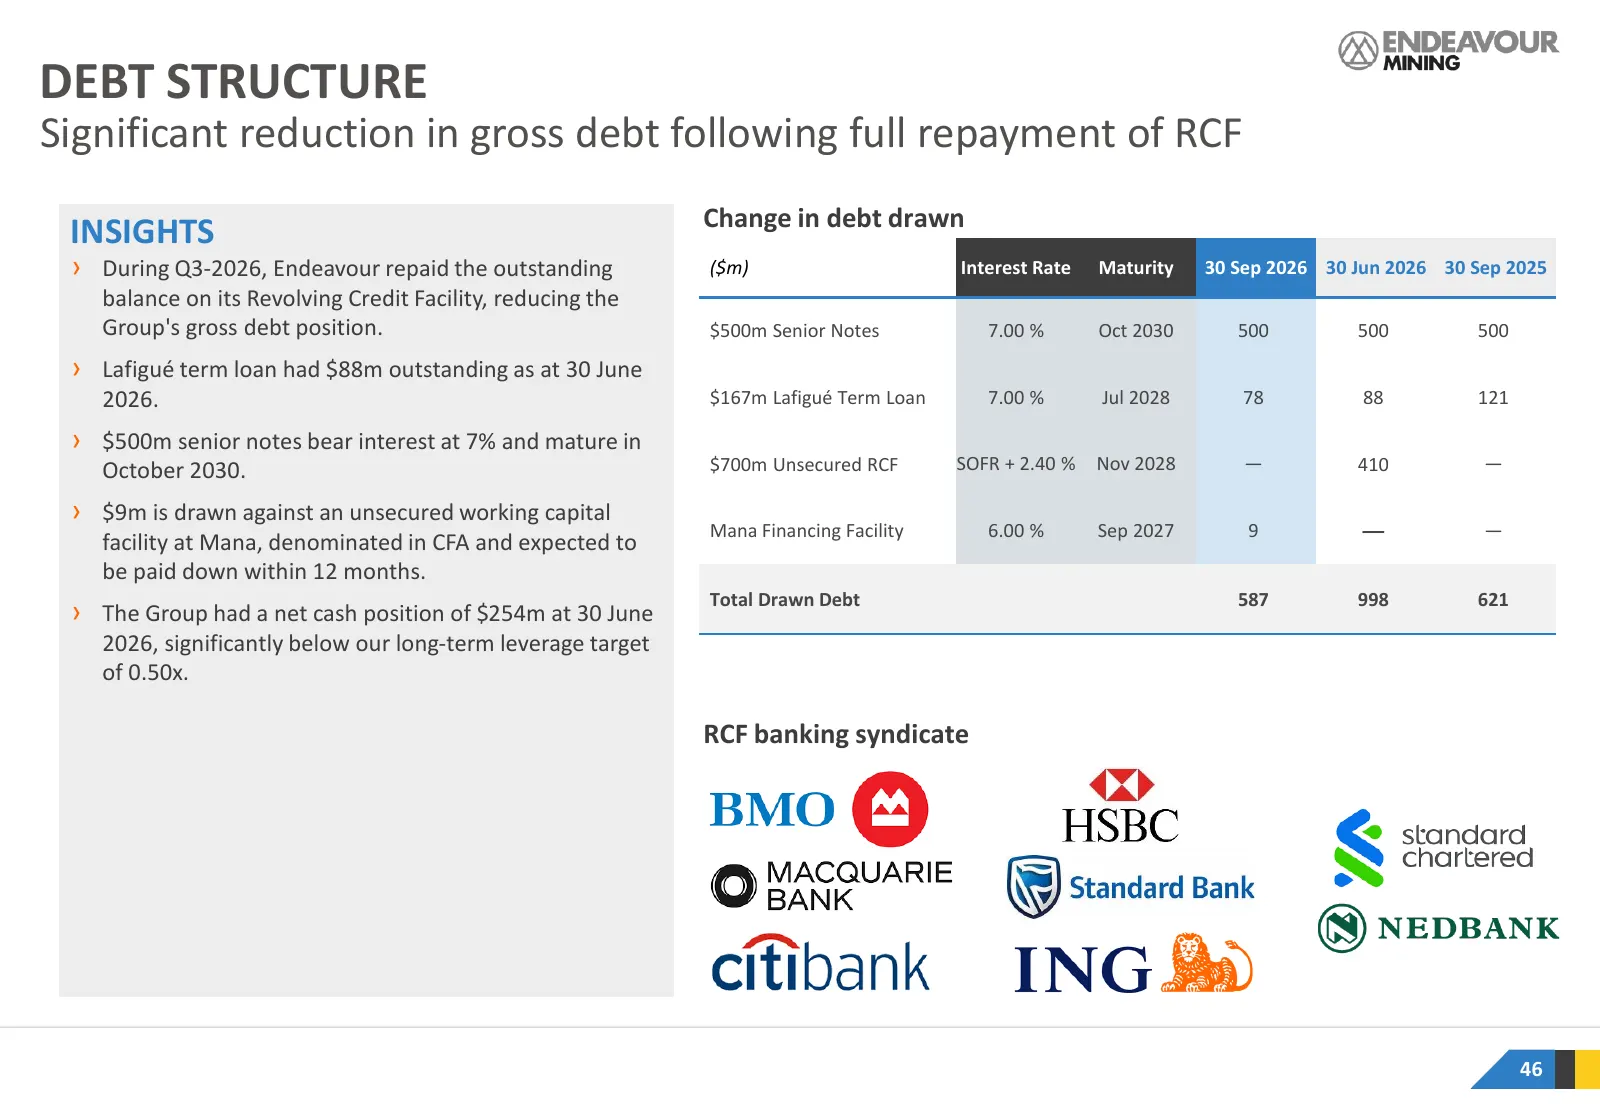
DEBT STRUCTURE Significant reduction in gross debt following full repayment of RCF Change in debt drawn INSIGHTS › During Q3-2026, Endeavour repaid the outstanding ($m) Interest Rate Maturity 30 Sep 2026 30 Jun 2026 30 Sep 2025 balance on its Revolving Credit Facility, reducing the Group's gross deb
Slide 47: Stable Credit Rating
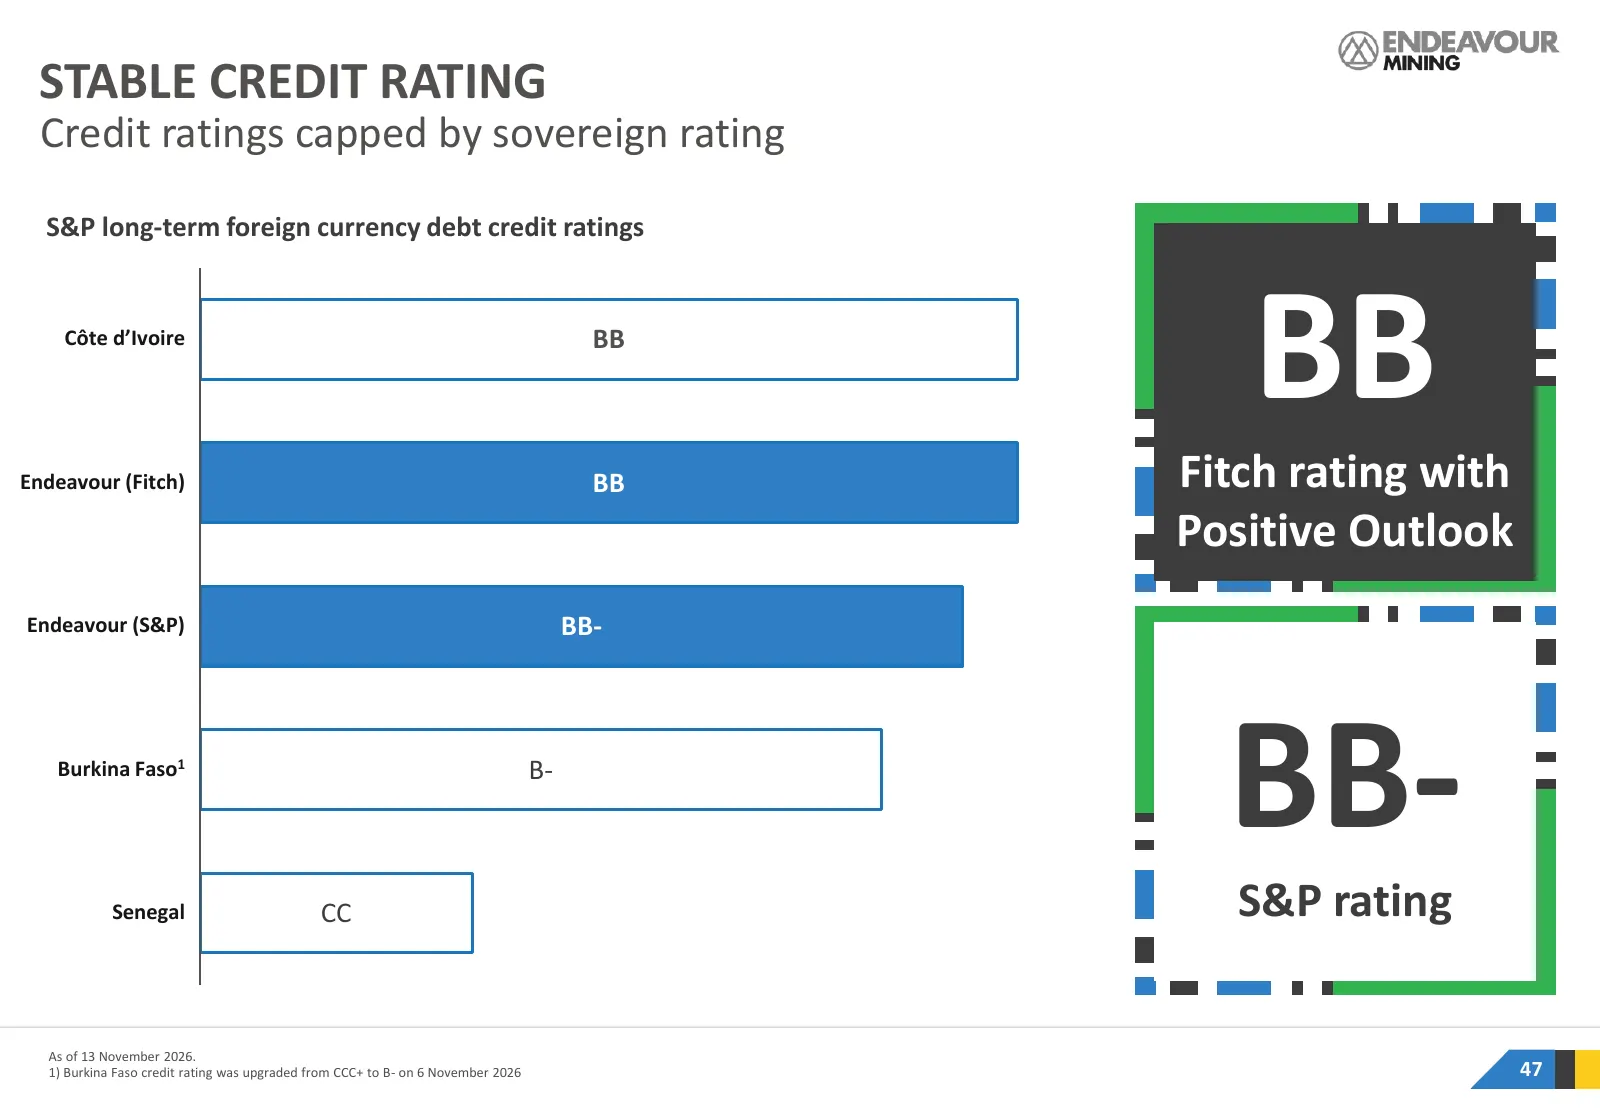
STABLE CREDIT RATING Credit ratings capped by sovereign rating S&P long-term foreign currency debt credit ratings Côte d’Ivoire BB BB Endeavour (Fitch) BB Fitch rating with Positive Outlook Endeavour (S&P) BB- Burkina Faso1 B- BB- Senegal CC S&P rating As of 13 November 2026. 1) Burkina Faso credit
Slide 48: FY-2026 Guidance
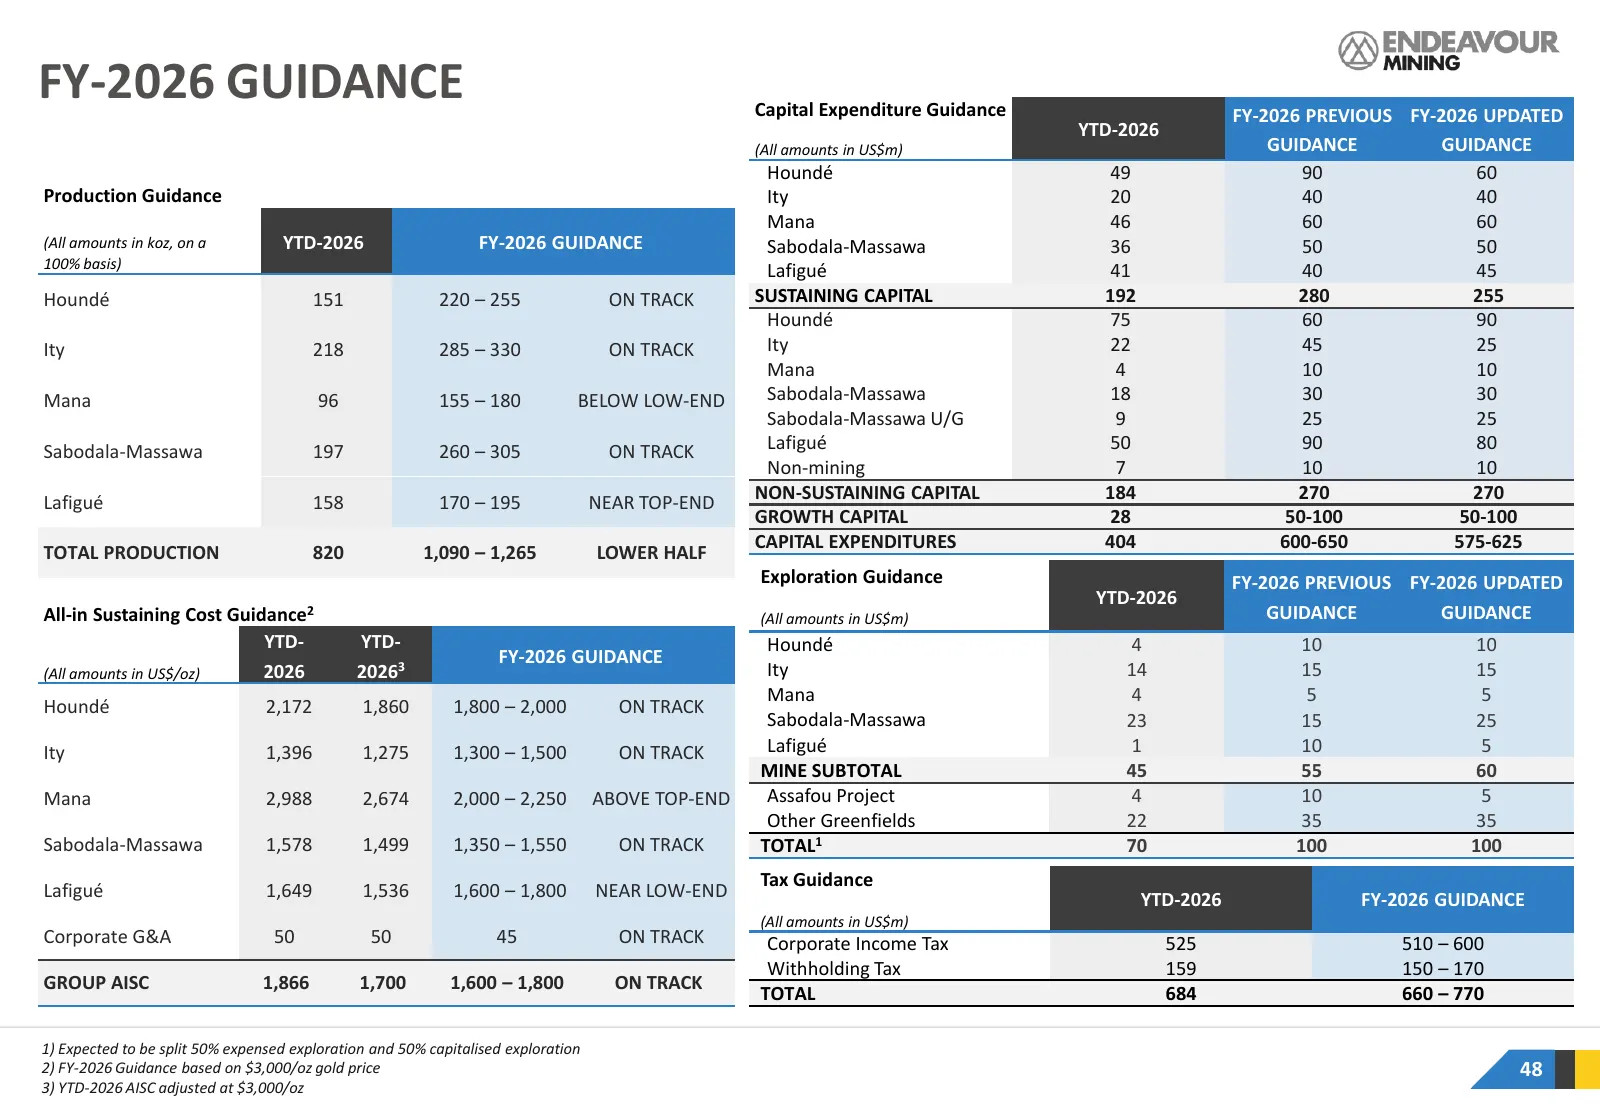
FY-2026 GUIDANCE Capital Expenditure Guidance FY-2026 PREVIOUS FY-2026 UPDATED YTD-2026 (All amounts in US$m) GUIDANCE GUIDANCE Houndé 49 90 60 Production Guidance Ity 20 40 40 Mana 46 60 60 (All amounts in koz, on a YTD-2026 FY-2026 GUIDANCE Sabodala-Massawa 36 50 50 100% basis) Lafigué 41 40 45 Ho
Slide 49: Our High Quality Portfolio
OUR HIGH QUALITY PORTFOLIO 3
Slide 50: Safety Performance
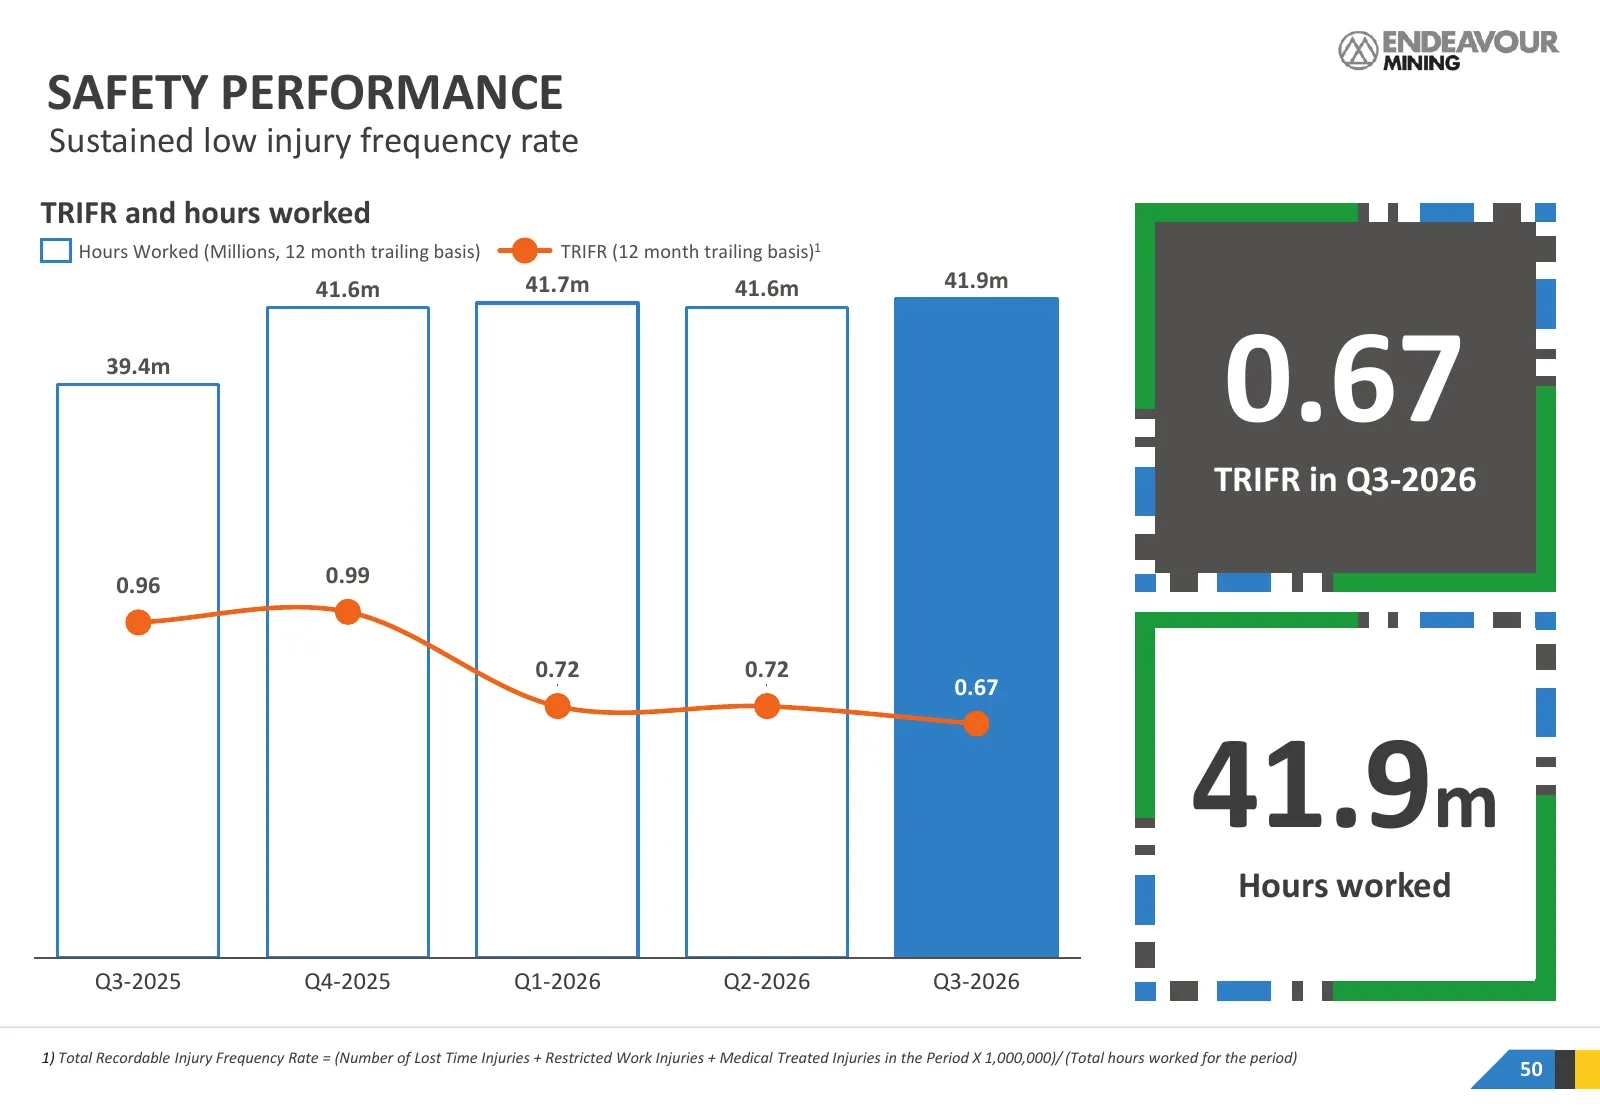
50 SAFETY PERFORMANCE Sustained low injury frequency rate TRIFR and hours worked Hours Worked (Millions, 12 month trailing basis) TRIFR (12 month trailing basis)1 41.6m 41.7m 41.6m 41.9m 39.4m 0.67 TRIFR in Q3-2026 0.96 0.99 0.72 0.72 0.67 41.9m Hours worked Q3-2025 Q4-2025 Q1-2026 Q2-2026 Q3-2026 1
Slide 51: Diversified Portfolio
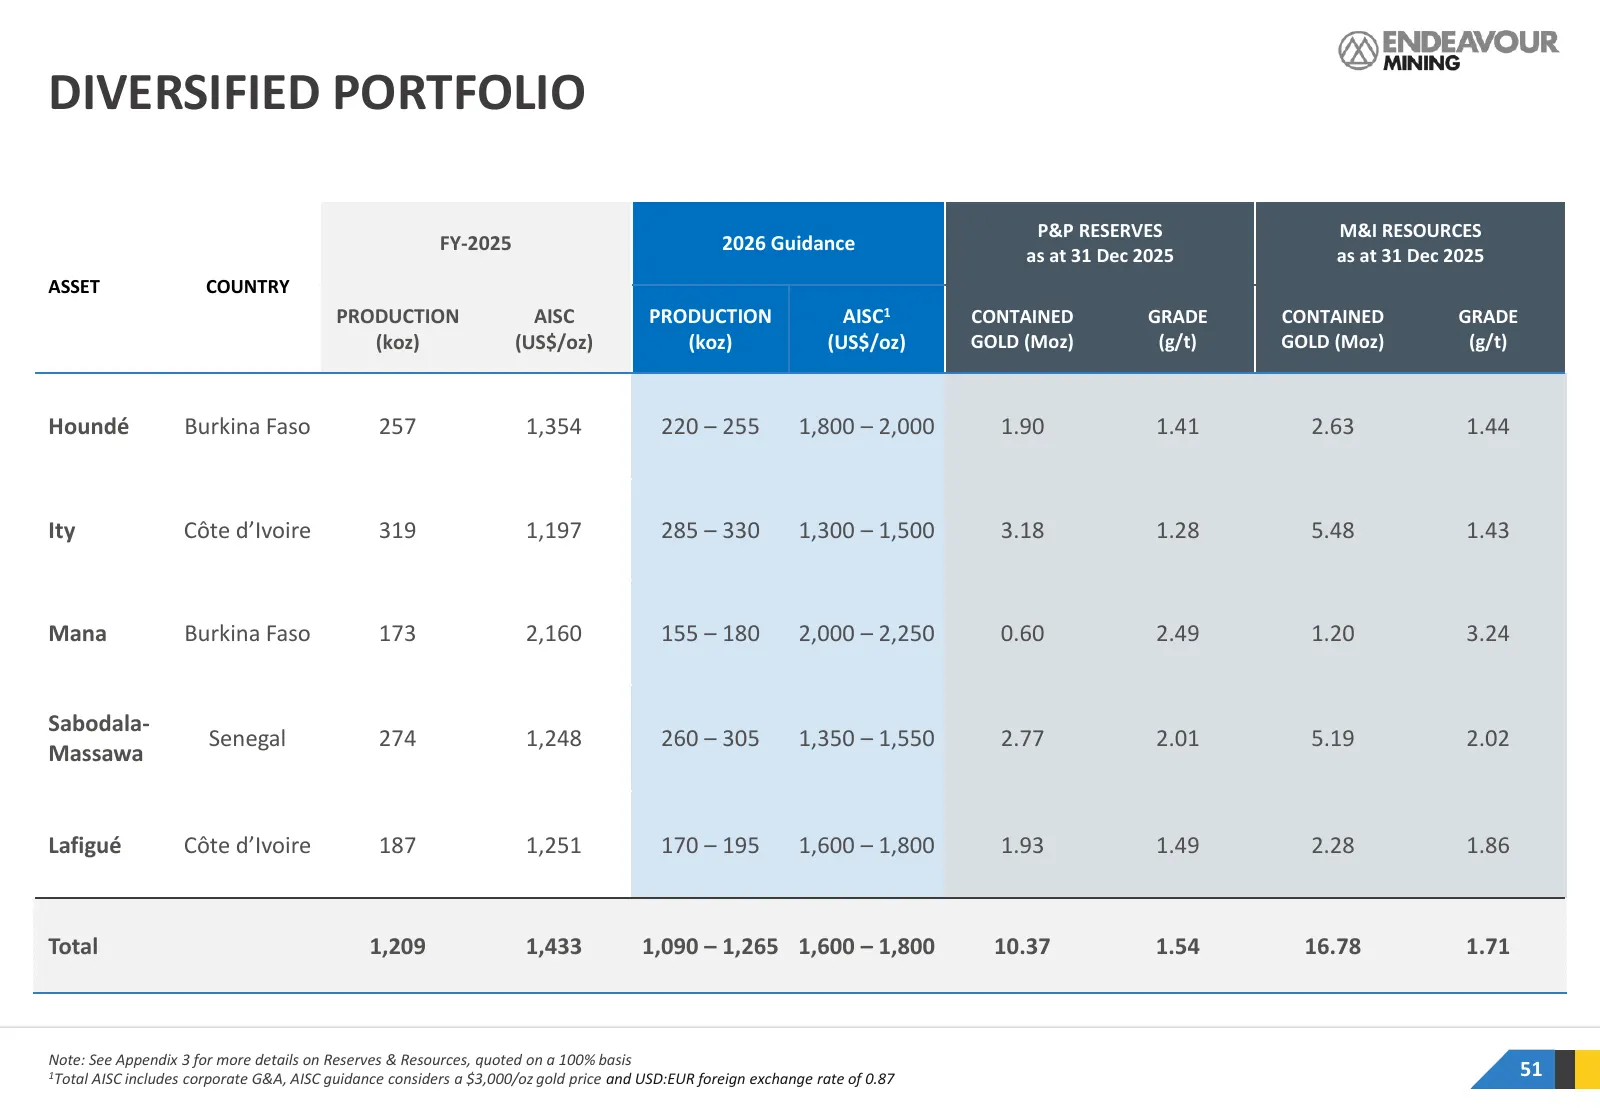
DIVERSIFIED PORTFOLIO P&P RESERVES M&I RESOURCES FY-2025 2026 Guidance as at 31 Dec 2025 as at 31 Dec 2025 ASSET COUNTRY PRODUCTION AISC PRODUCTION AISC1 CONTAINED GRADE CONTAINED GRADE (koz) (US$/oz) (koz) (US$/oz) GOLD (Moz) (g/t) GOLD (Moz) (g/t) Houndé Burkina Faso 257 1,354 220 – 255 1,800 – 2,
Slide 52: Reserve and Resource Evolution
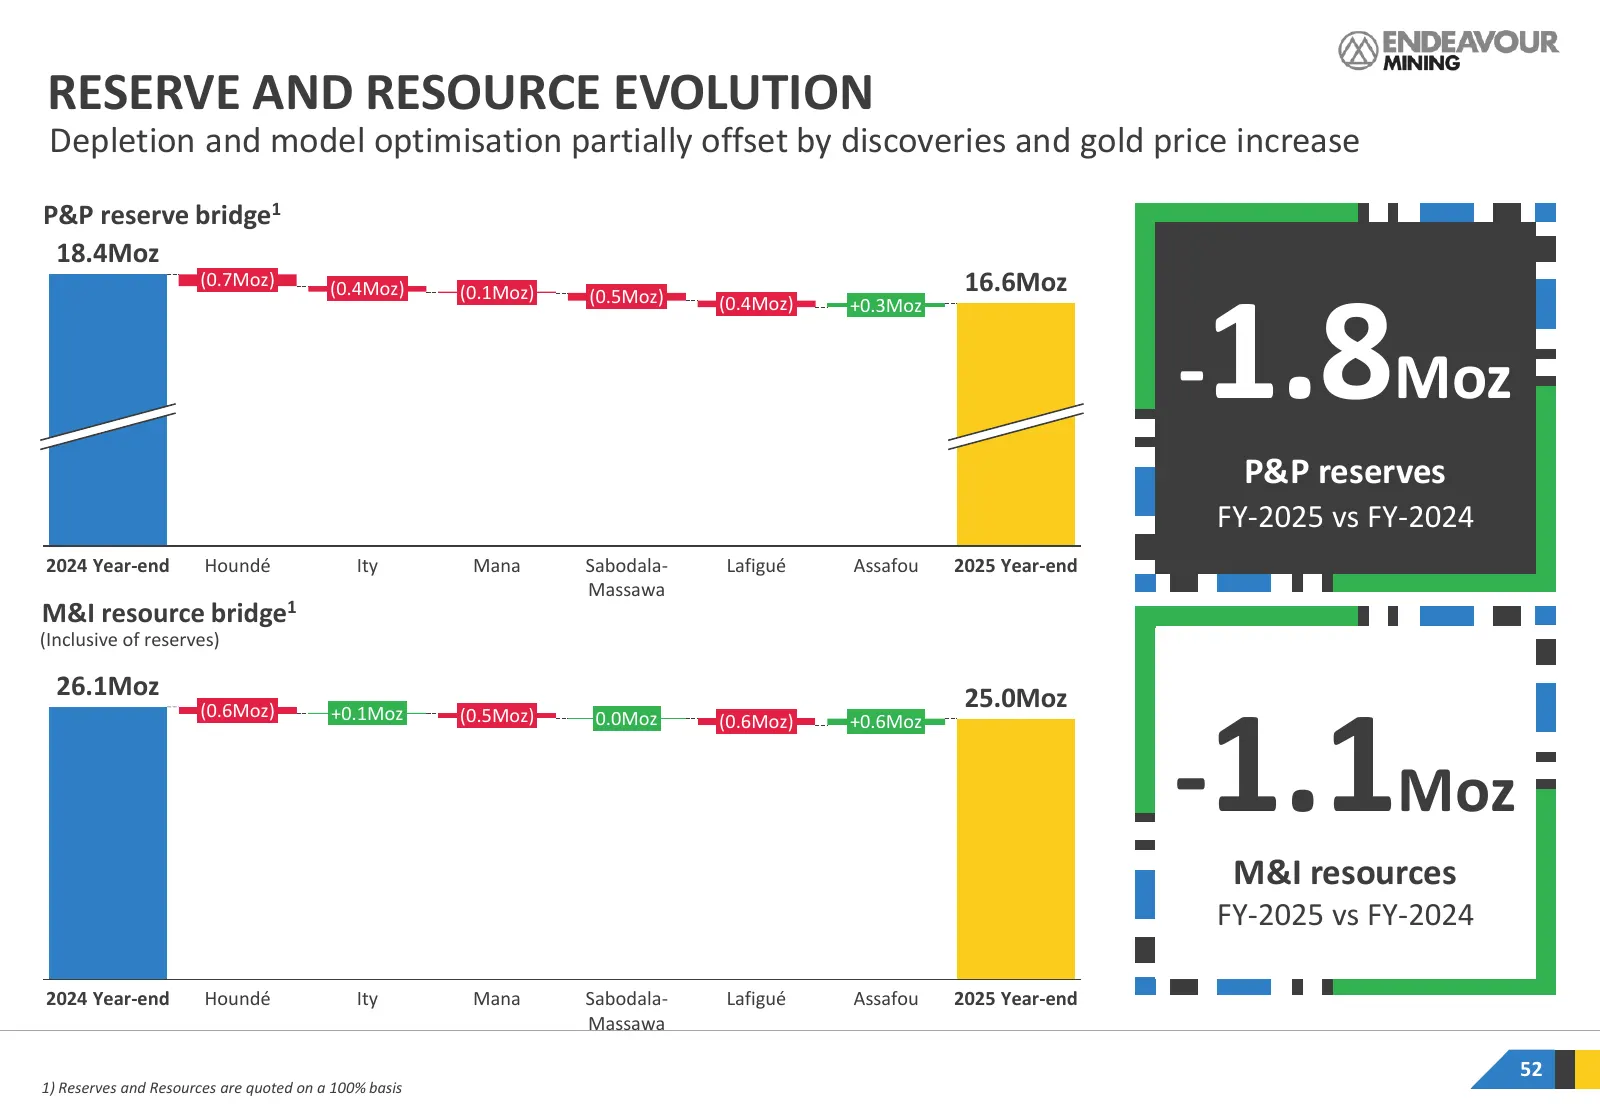
RESERVE AND RESOURCE EVOLUTION Depletion and model optimisation partially offset by discoveries and gold price increase P&P reserve bridge1 18.4Moz (0.7Moz) (0.4Moz) (0.1Moz) 16.6Moz 1.8Moz (0.5Moz) (0.4Moz) +0.3Moz - P&P reserves FY-2025 vs FY-2024 2024 Year-end Houndé Ity Mana Sabodala- Lafigué As
Slide 53: YTD-2026 Performance vs Guidance
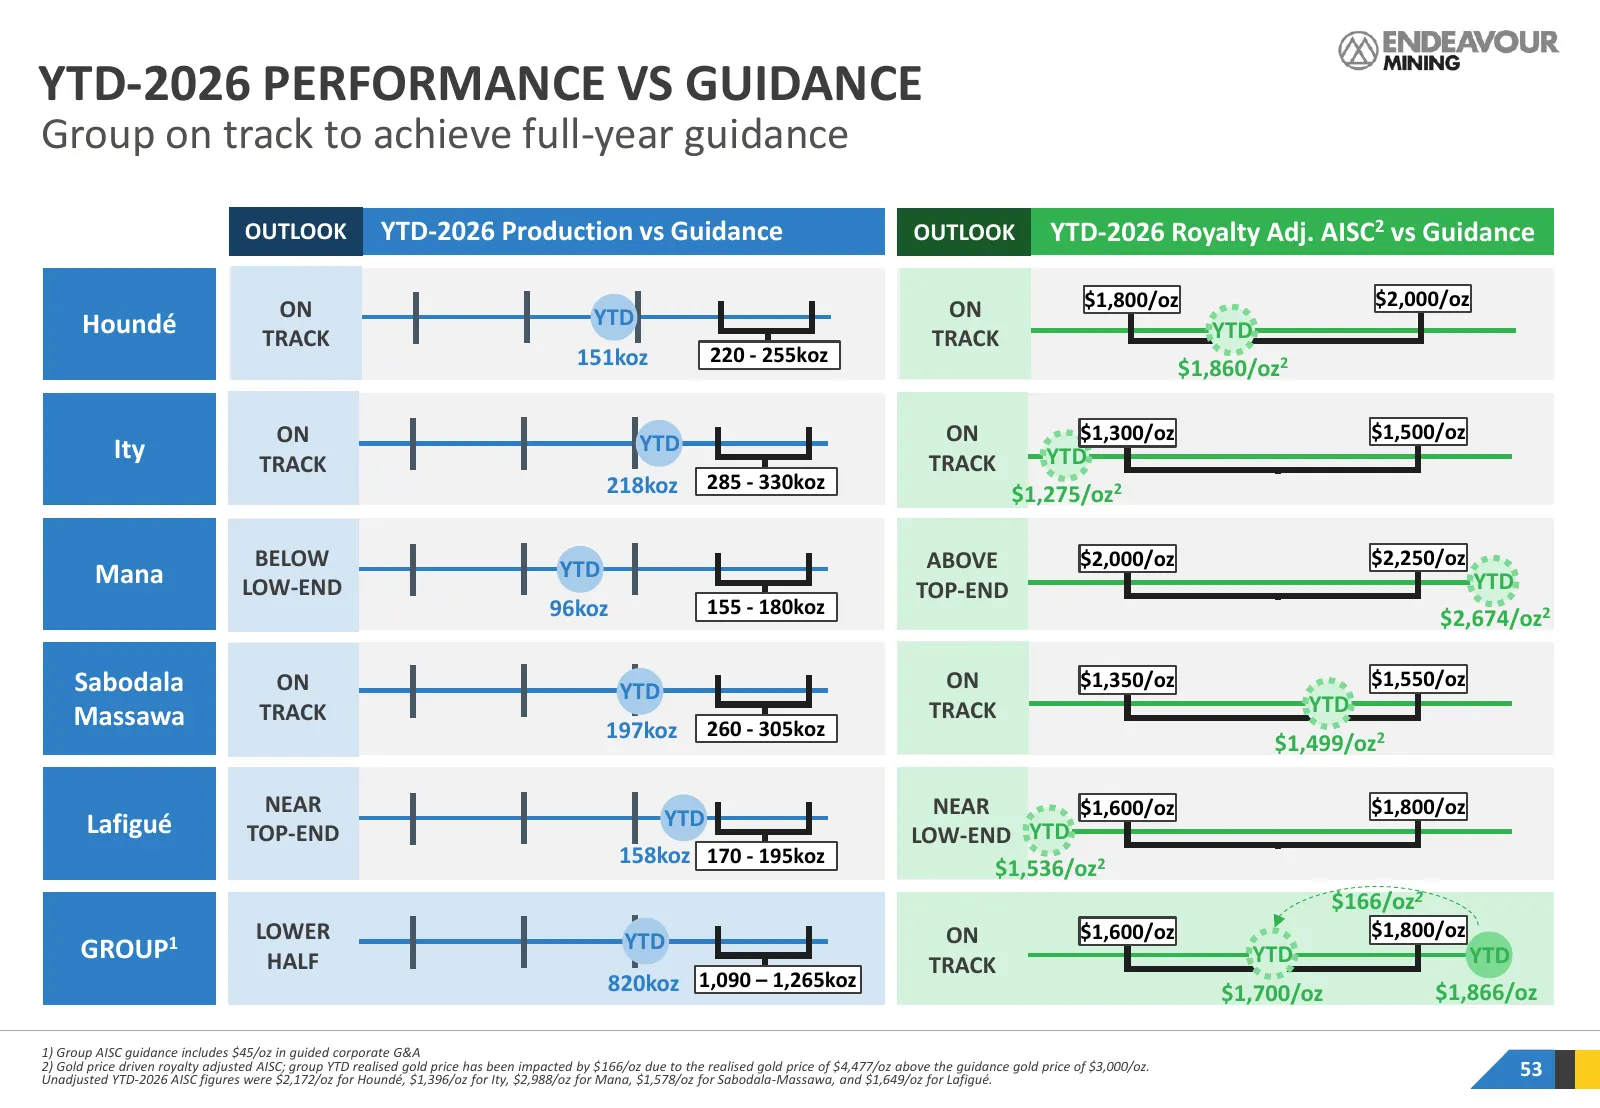
YTD-2026 PERFORMANCE VS GUIDANCE Group on track to achieve full-year guidance OUTLOOK YTD-2026 Production vs Guidance OUTLOOK YTD-2026 Royalty Adj. AISC2 vs Guidance ON ON $1,800/oz $2,000/oz Houndé YTD TRACK TRACK YTD 151koz 220 - 255koz $1,860/oz2 ON ON $1,300/oz $1,500/oz Ity YTD YTD TRACK TRACK
Slide 54: Houndé Mine
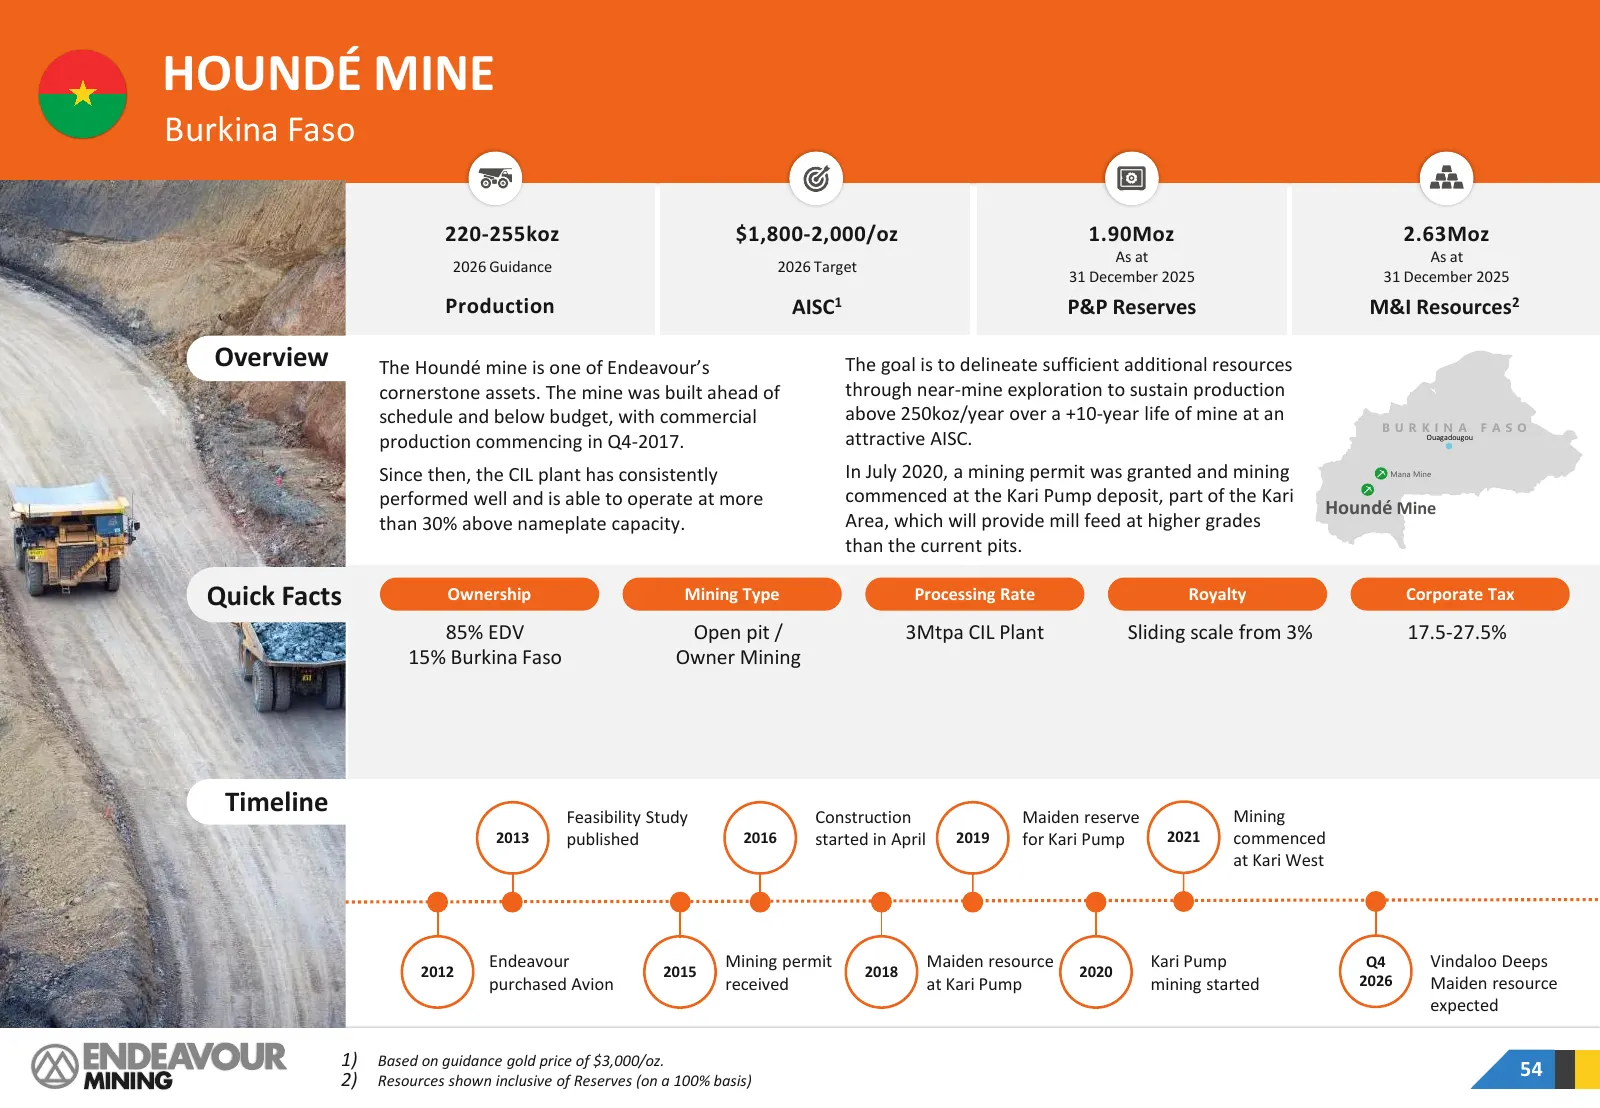
HOUNDÉ MINE Burkina Faso 220-255koz $1,800-2,000/oz 1.90Moz 2.63Moz As at As at 2026 Guidance 2026 Target 31 December 2025 31 December 2025 Production AISC1 P&P Reserves M&I Resources2 Overview The Houndé mine is one of Endeavour’s The goal is to delineate sufficient additional resources cornerstone
Slide 55: Houndé Mine
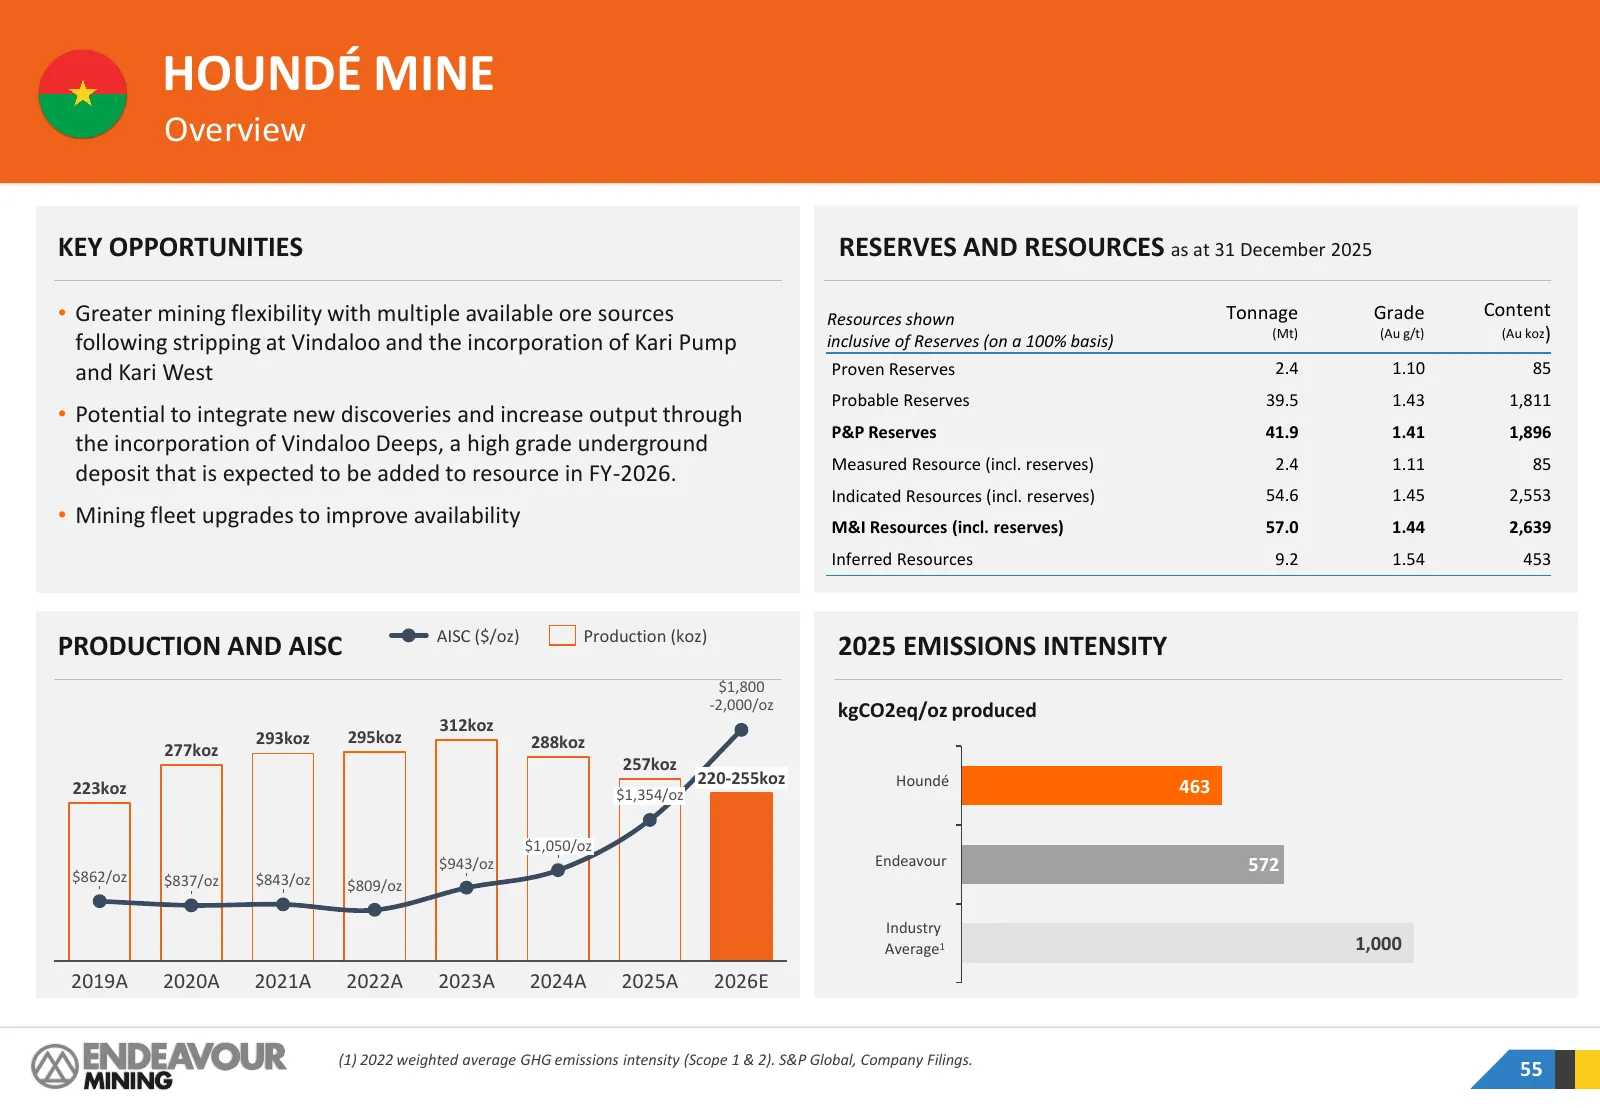
HOUNDÉ MINE Overview KEY OPPORTUNITIES RESERVES AND RESOURCES as at 31 December 2025 • Greater mining flexibility with multiple available ore sources Resources shown Tonnage Grade Content (Mt) (Au g/t) (Au koz) following stripping at Vindaloo and the incorporation of Kari Pump inclusive of Reserves
Slide 56: Houndé Mine
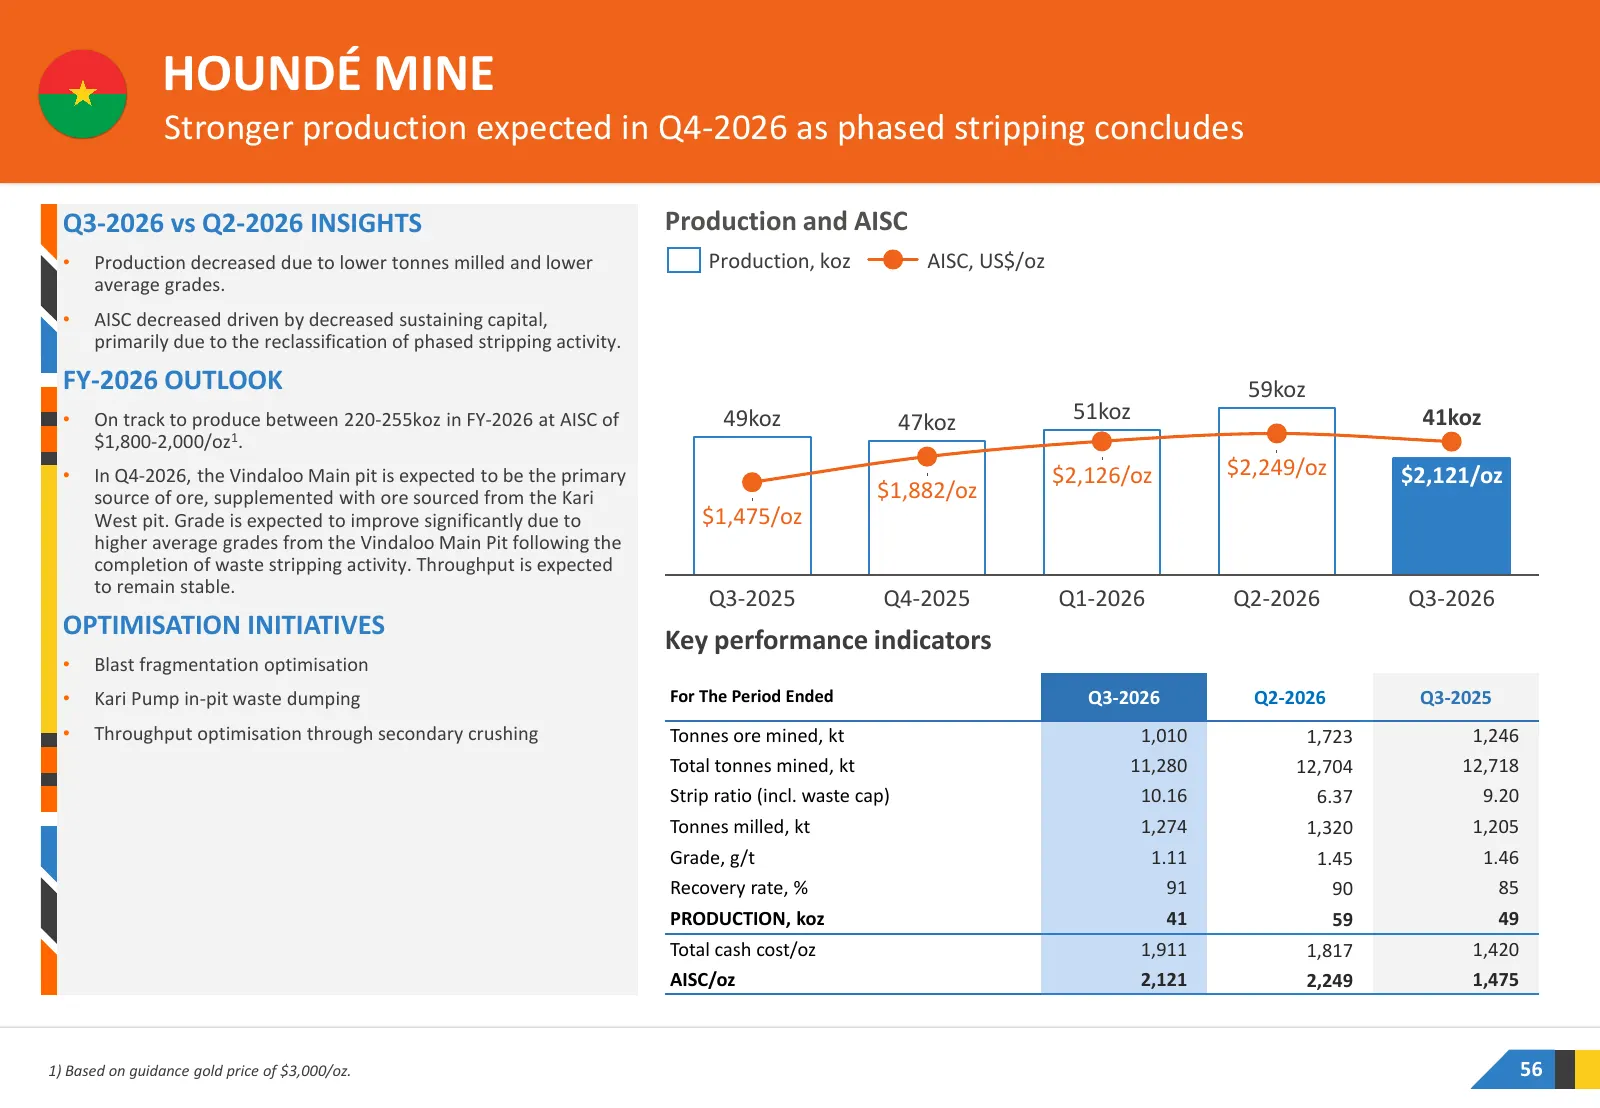
HOUNDÉ MINE Stronger production expected in Q4-2026 as phased stripping concludes Q3-2026 vs Q2-2026 INSIGHTS Production and AISC • Production decreased due to lower tonnes milled and lower Production, koz AISC, US$/oz average grades. • AISC decreased driven by decreased sustaining capital, primaril
Slide 57: Houndé Exploration Overview
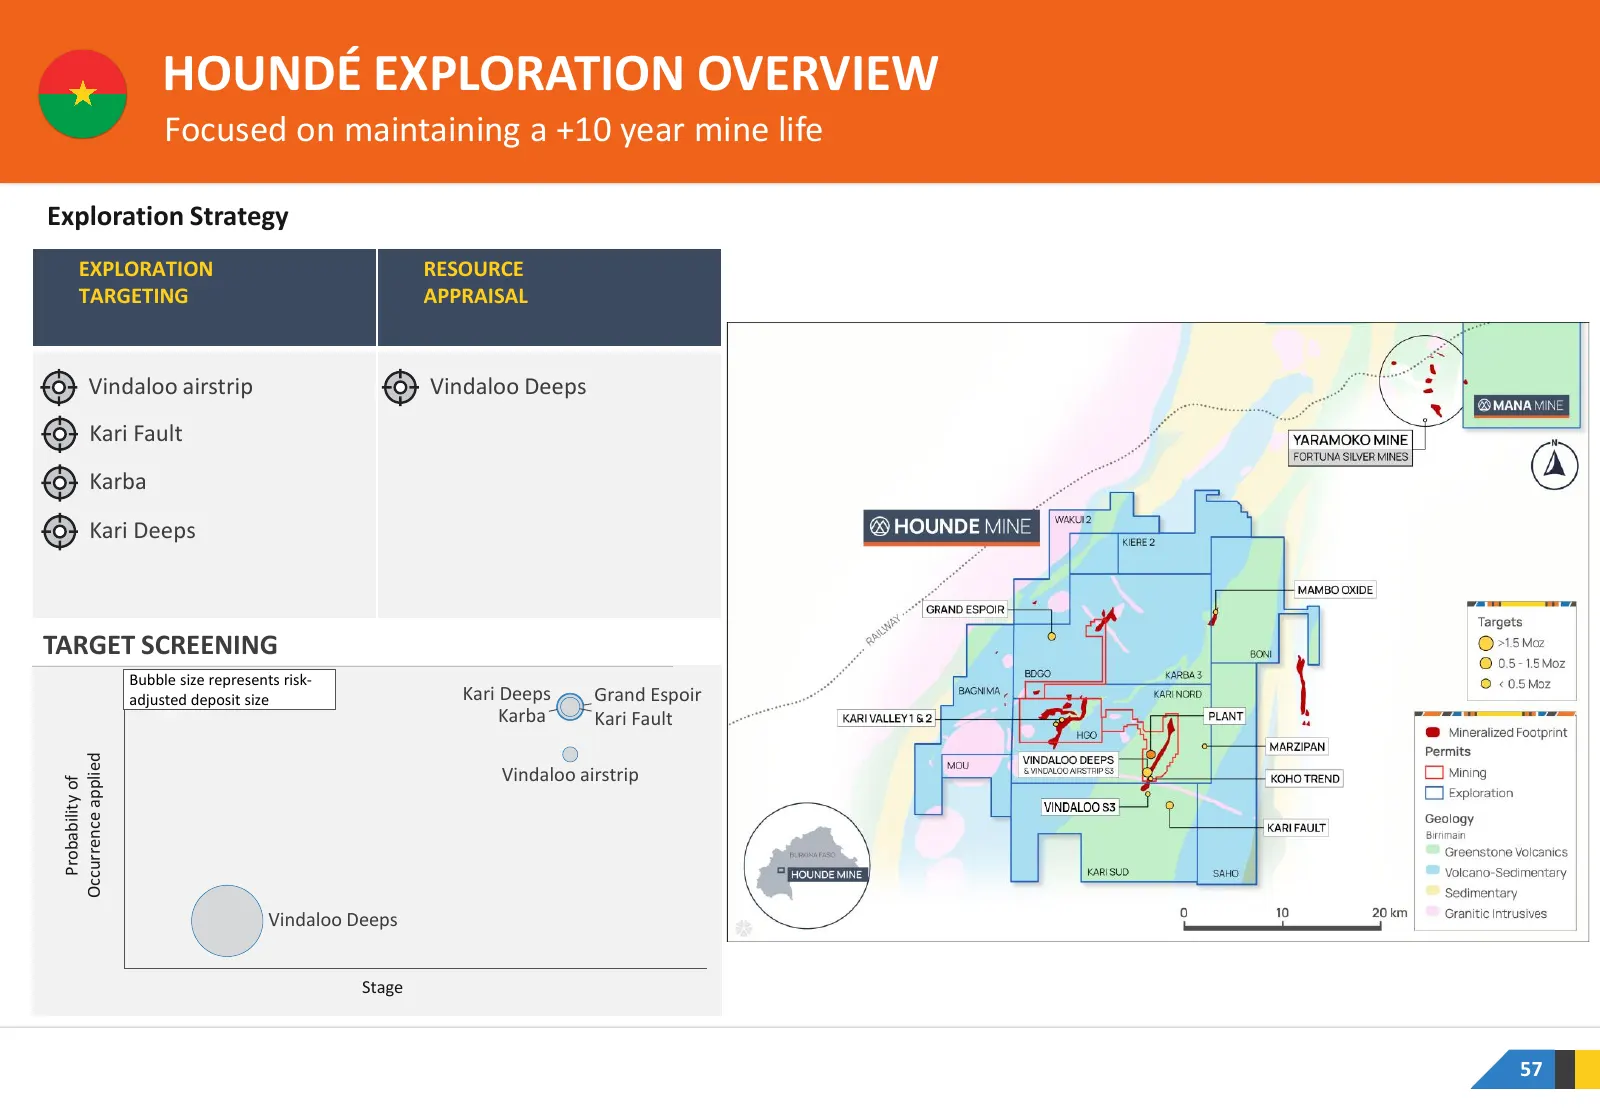
HOUNDÉ EXPLORATION OVERVIEW Focused on maintaining a +10 year mine life Exploration Strategy EXPLORATION RESOURCE TARGETING APPRAISAL Vindaloo airstrip Vindaloo Deeps Kari Fault Karba Kari Deeps TARGET SCREENING Bubble size represents risk- adjusted deposit size Kari Deeps Grand Espoir Karba Kari Fa
Slide 58: Vindaloo Deeps
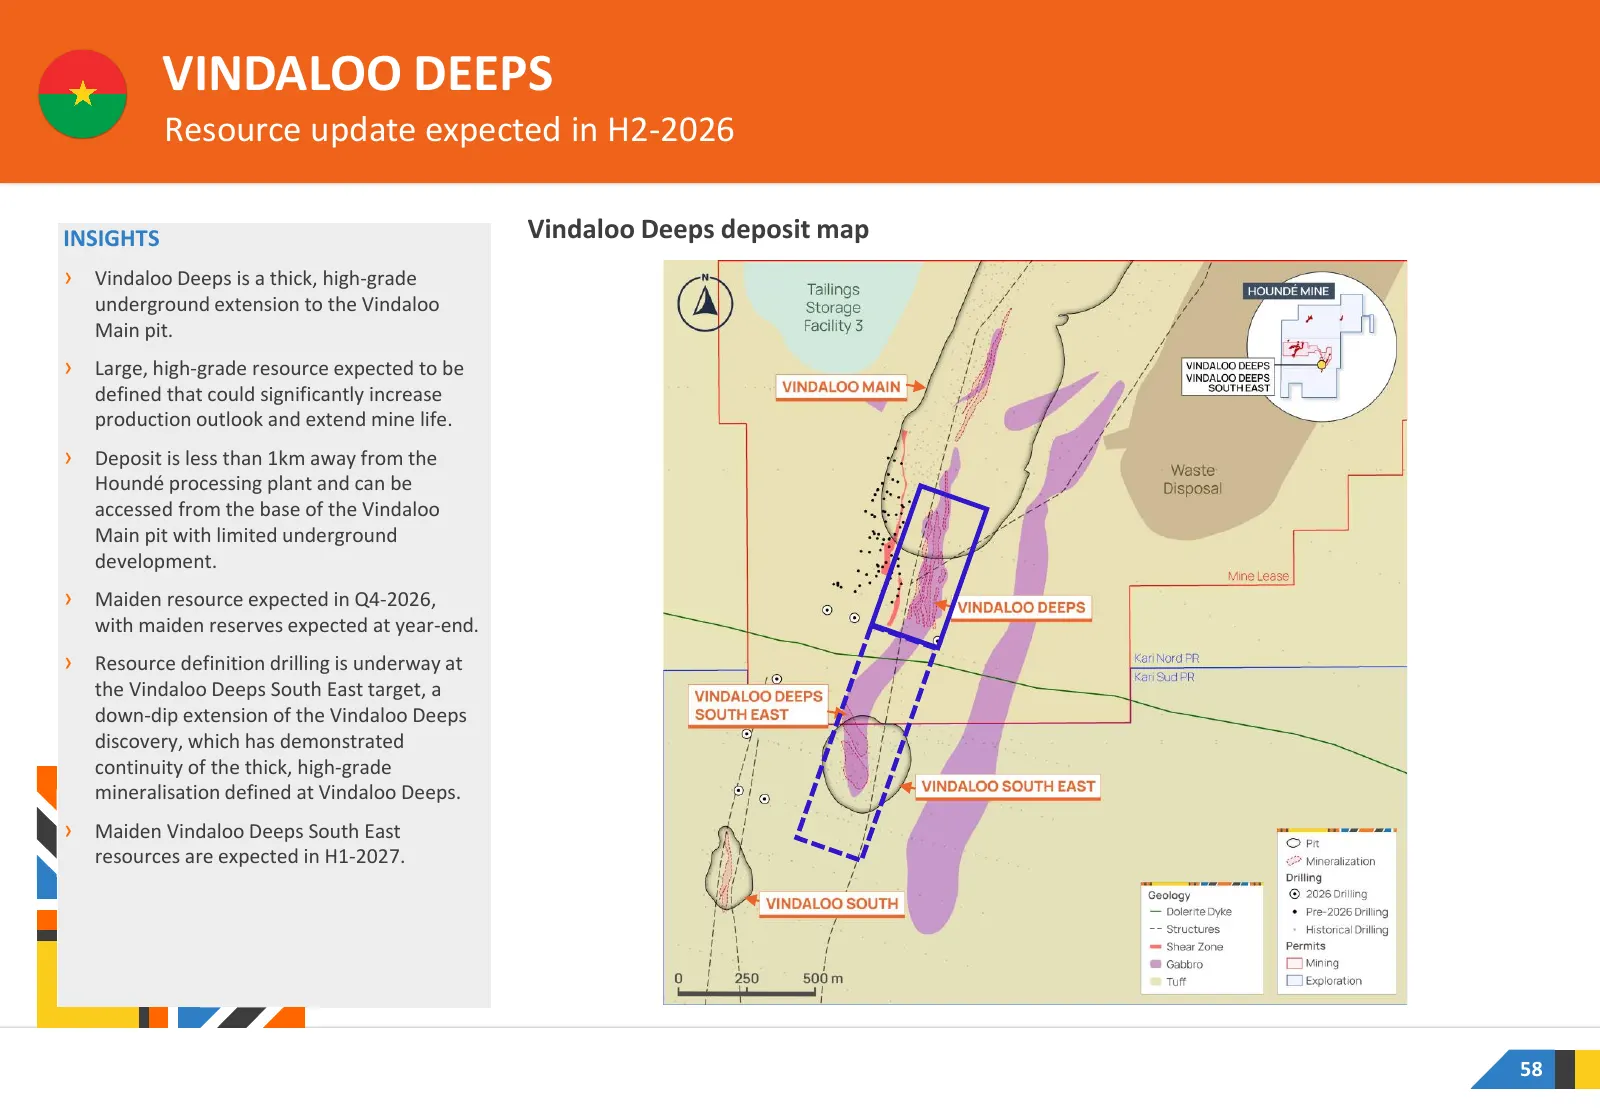
VINDALOO DEEPS Resource update expected in H2-2026 INSIGHTS Vindaloo Deeps deposit map › Vindaloo Deeps is a thick, high-grade underground extension to the Vindaloo Main pit. › Large, high-grade resource expected to be defined that could significantly increase production outlook and extend mine life
Slide 59: Ity Mine
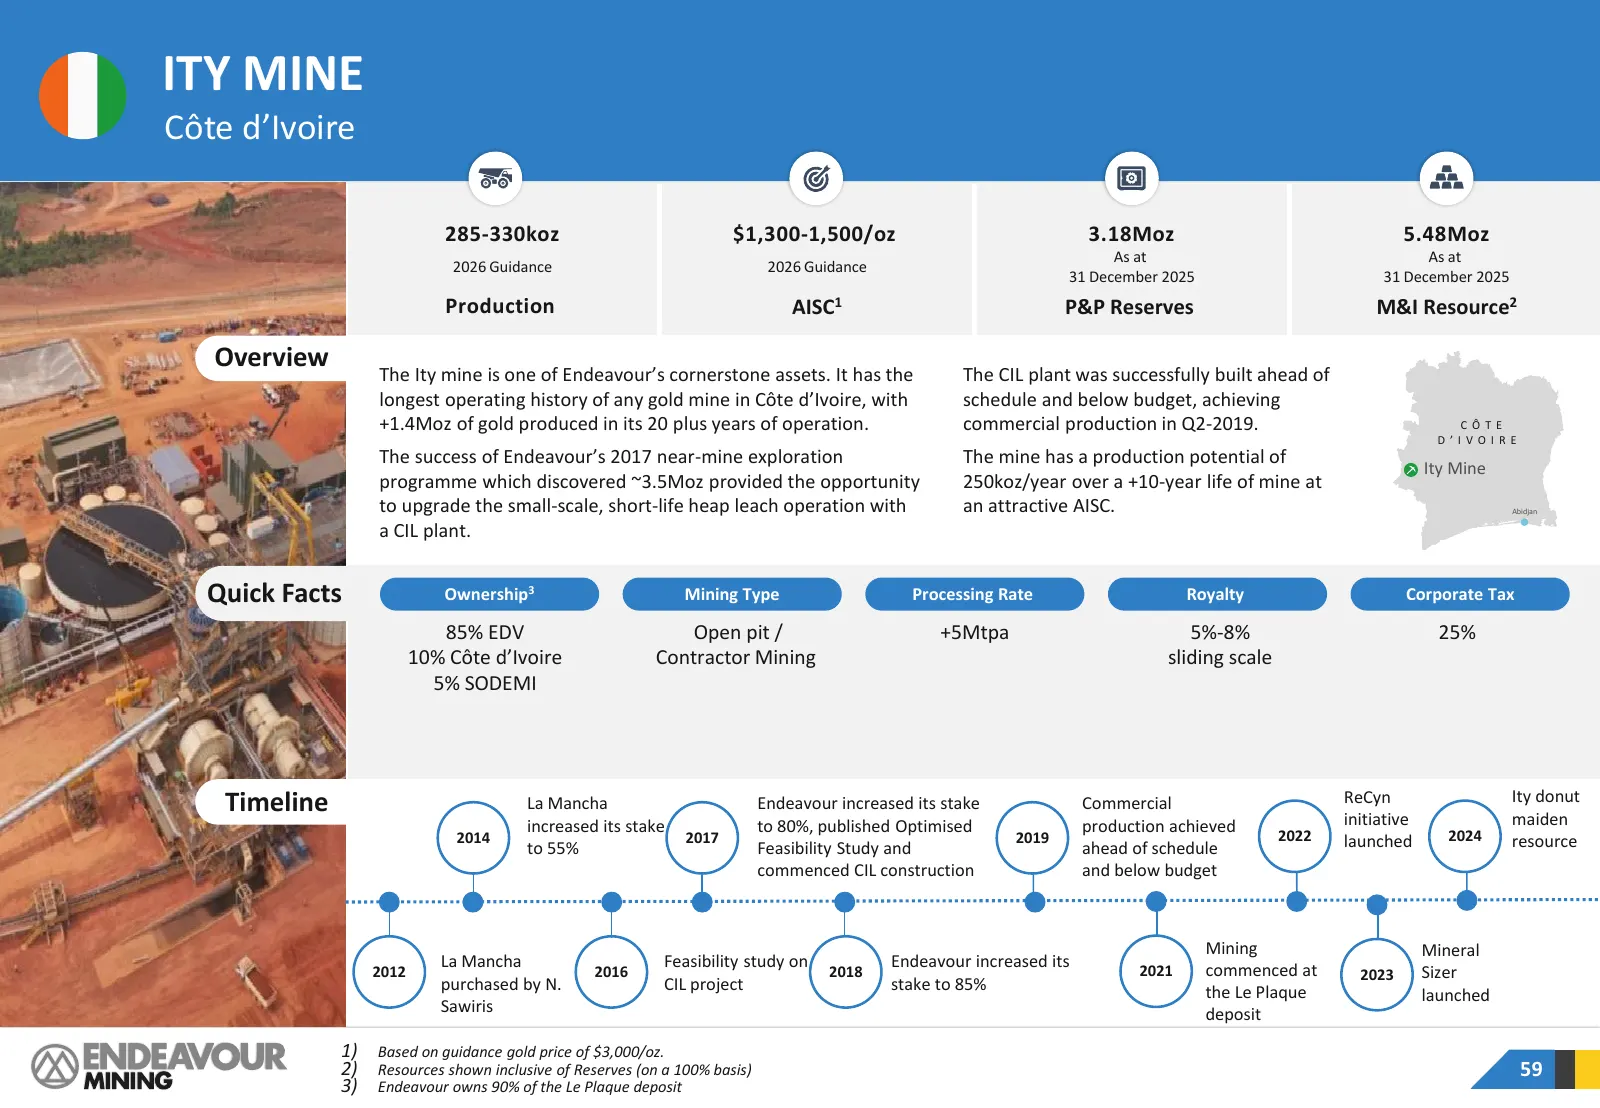
ITY MINE Côte d’Ivoire 285-330koz $1,300-1,500/oz 3.18Moz 5.48Moz As at As at 2026 Guidance 2026 Guidance 31 December 2025 31 December 2025 Production AISC1 P&P Reserves M&I Resource2 Overview The Ity mine is one of Endeavour’s cornerstone assets. It has the The CIL plant was successfully built ahea
Slide 60: Ity Mine
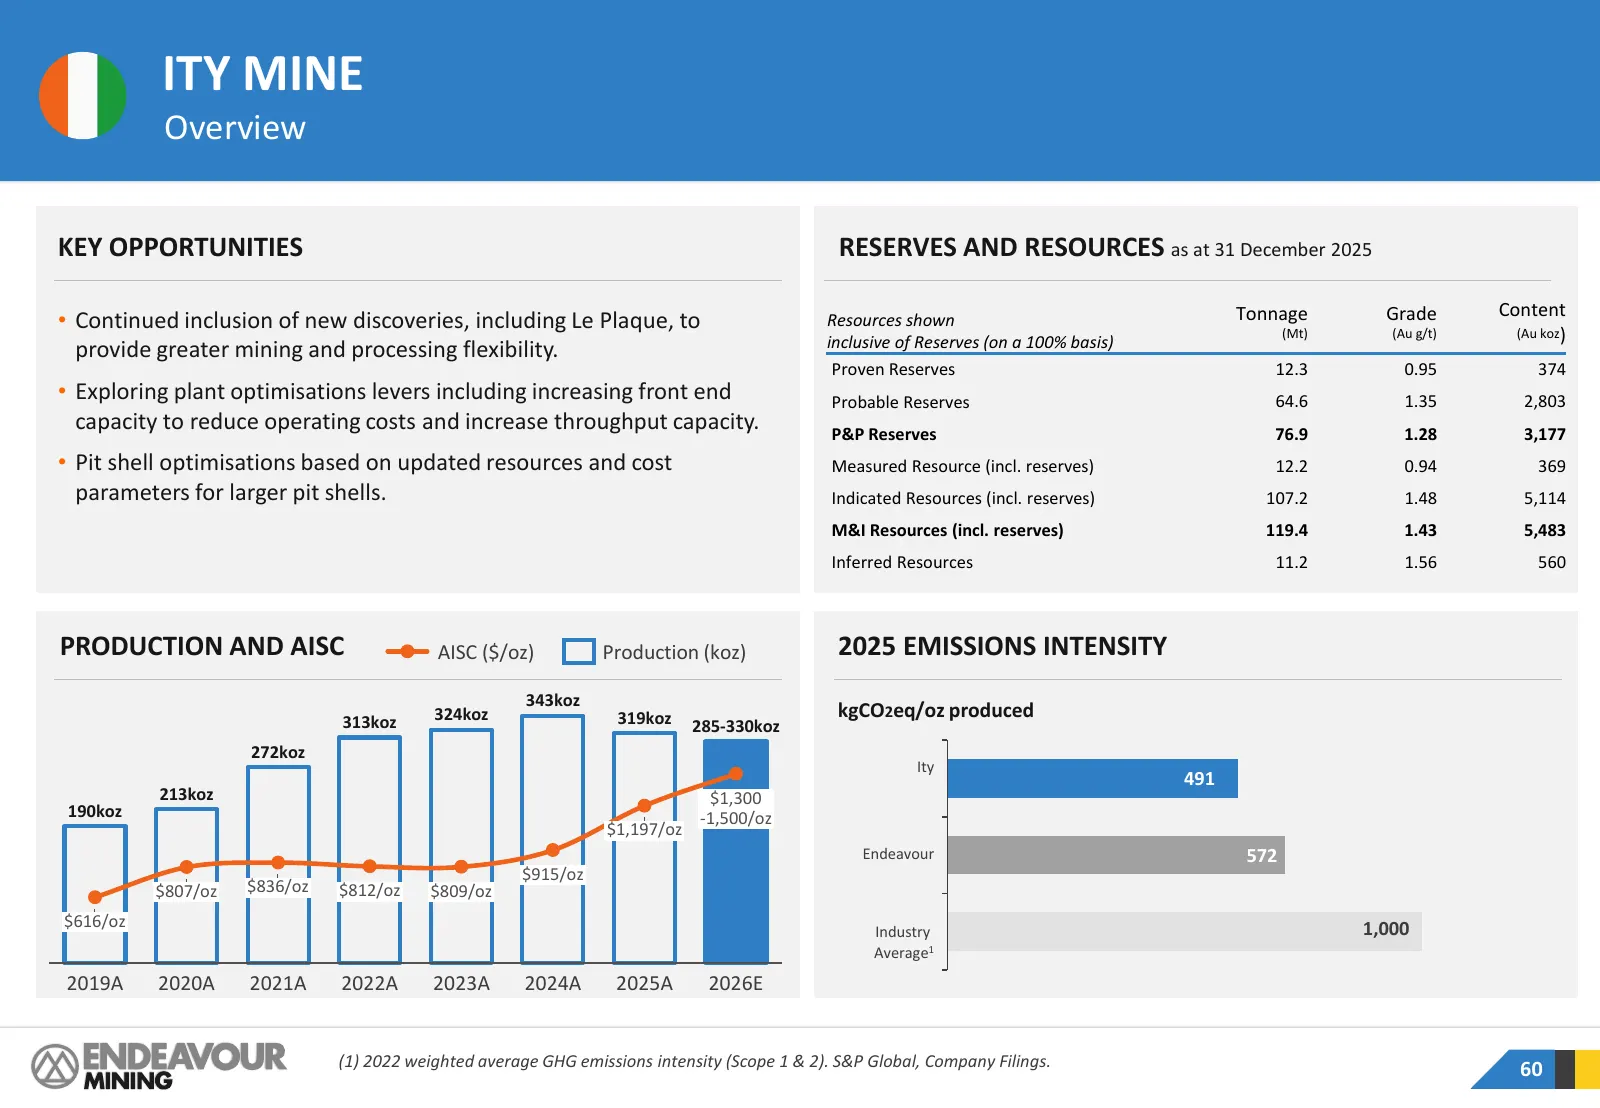
ITY MINE Overview KEY OPPORTUNITIES RESERVES AND RESOURCES as at 31 December 2025 Tonnage Grade Content • Continued inclusion of new discoveries, including Le Plaque, to Resources shown (Mt) (Au g/t) (Au koz) provide greater mining and processing flexibility. inclusive of Reserves (on a 100% basis)
Slide 61: Ity Mine
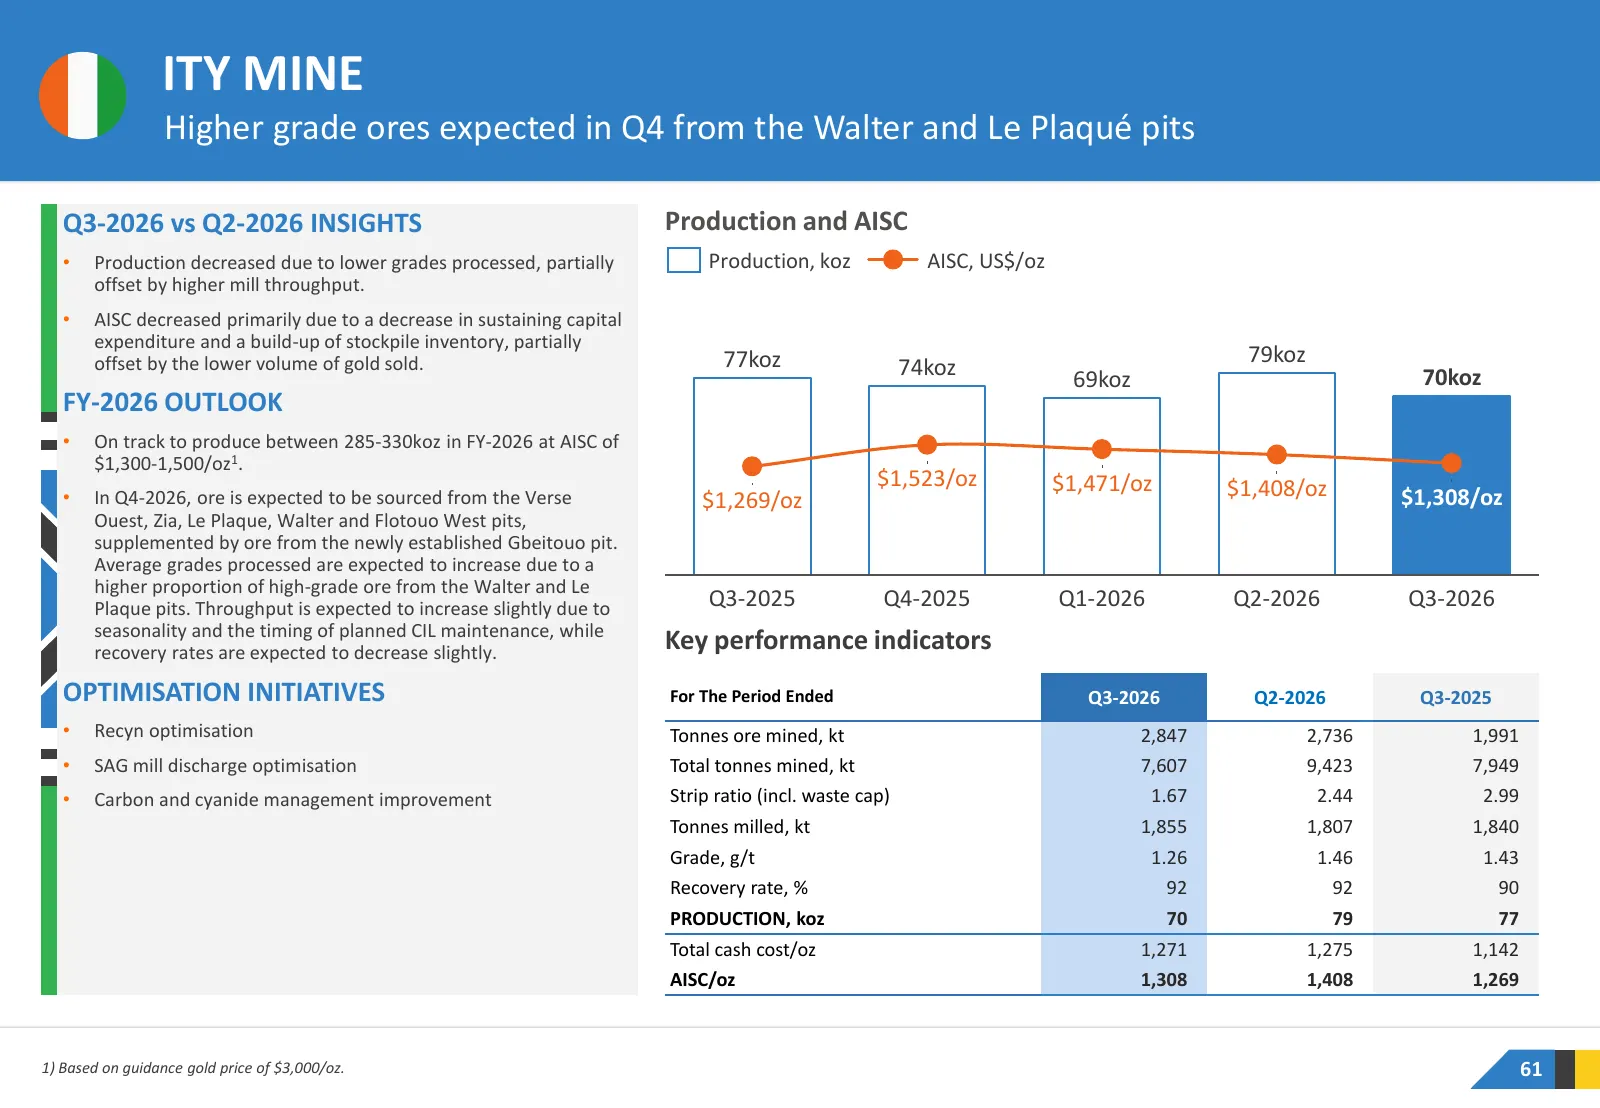
ITY MINE Higher grade ores expected in Q4 from the Walter and Le Plaqué pits Q3-2026 vs Q2-2026 INSIGHTS Production and AISC • Production decreased due to lower grades processed, partially Production, koz AISC, US$/oz offset by higher mill throughput. • AISC decreased primarily due to a decrease in
Slide 62: Ity Exploration Overview
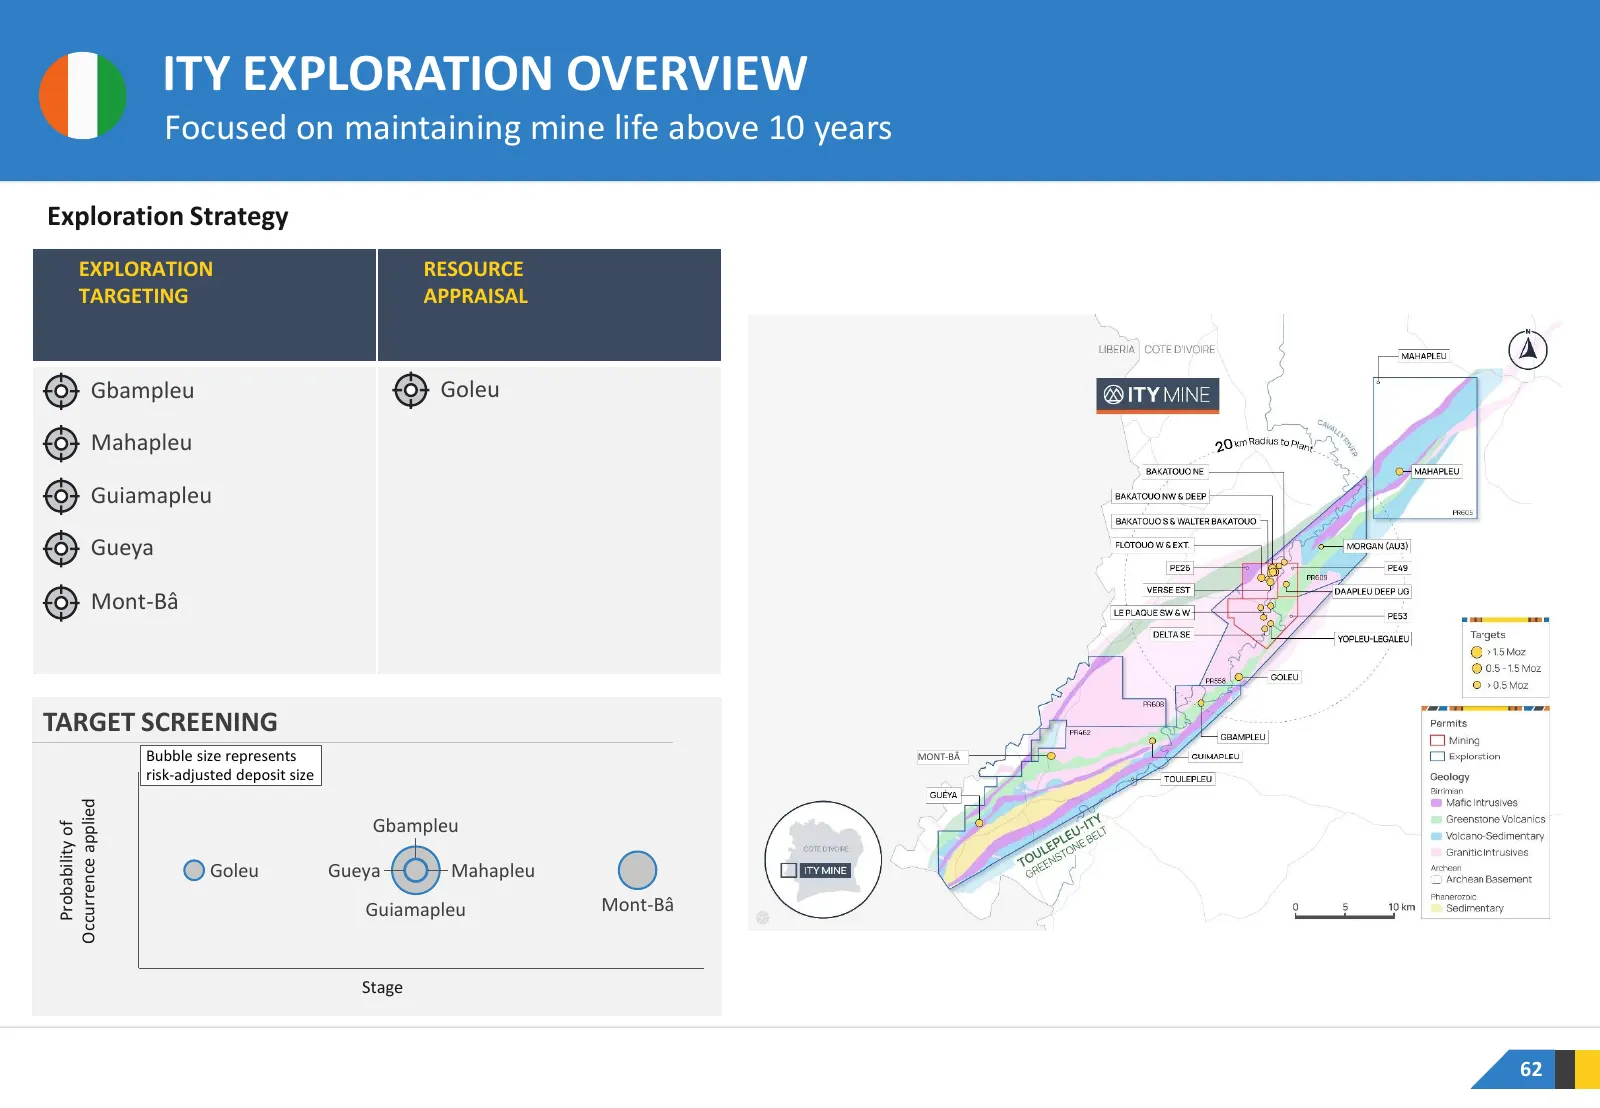
ITY EXPLORATION OVERVIEW Focused on maintaining mine life above 10 years Exploration Strategy EXPLORATION RESOURCE TARGETING APPRAISAL Gbampleu Goleu Mahapleu Guiamapleu Gueya Mont-Bâ TARGET SCREENING Bubble size represents MONT-BÂ risk-adjusted deposit size Occurrence applied Gbampleu Probability o
Slide 63: Ity Resource Model
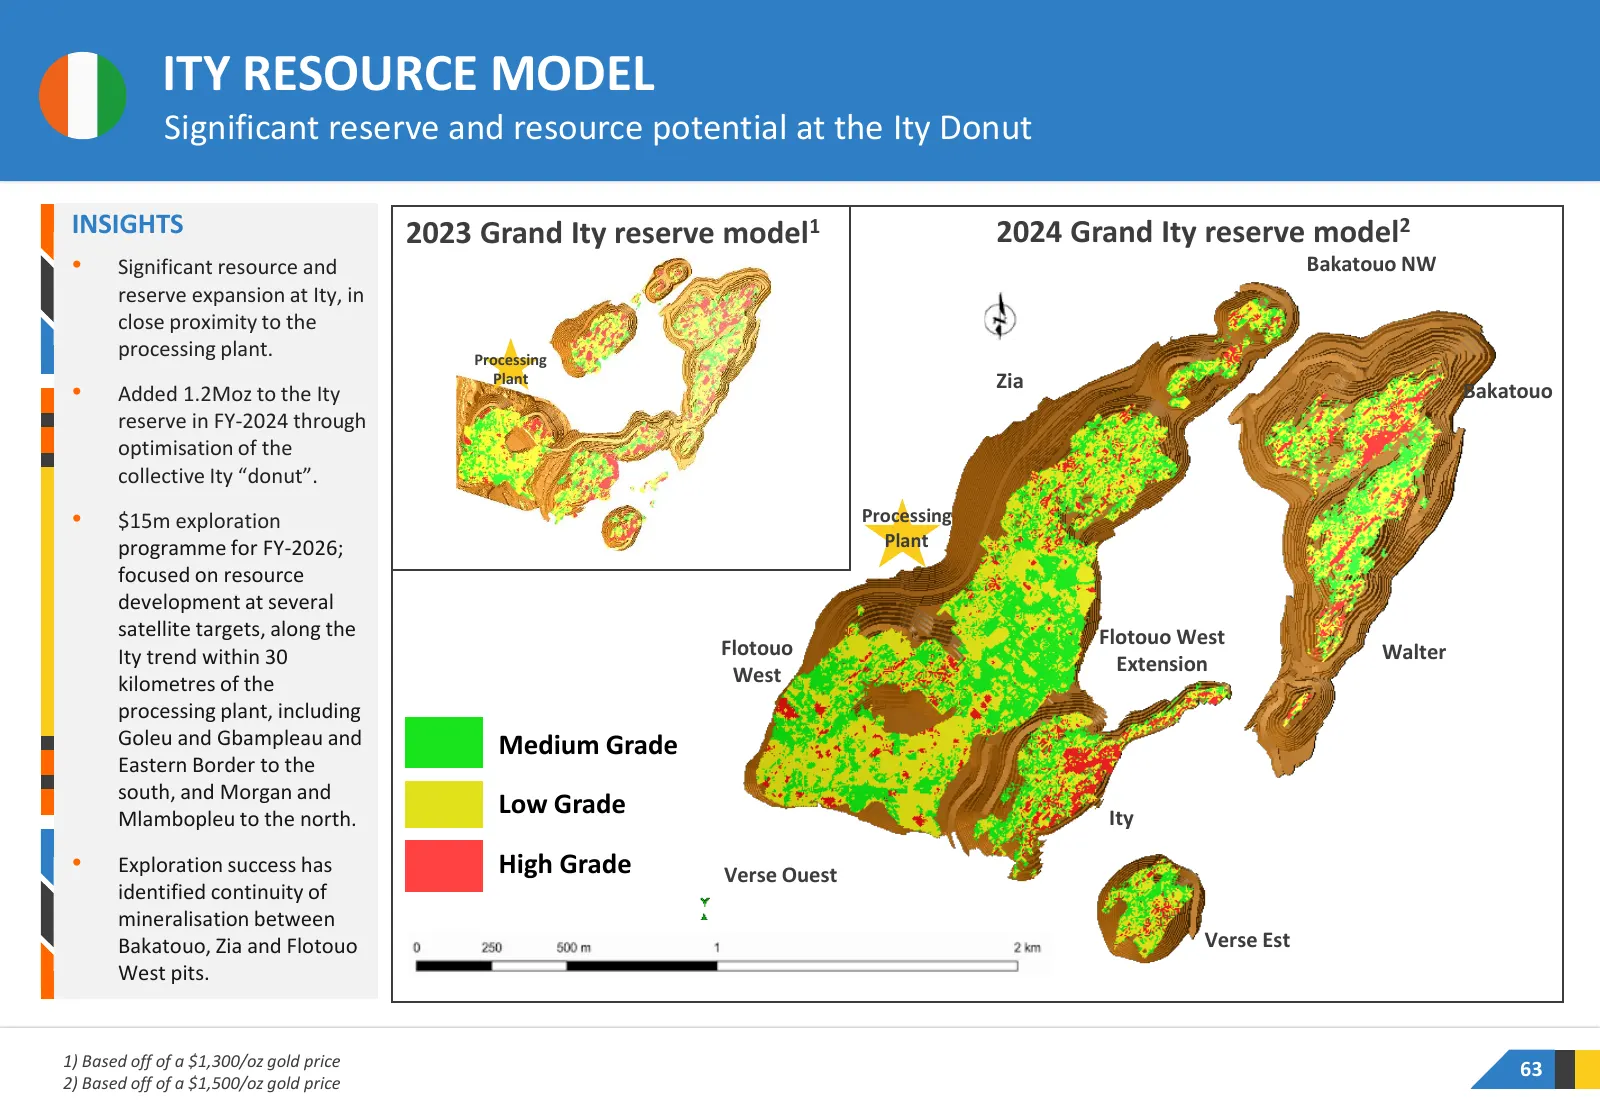
ITY RESOURCE MODEL Significant reserve and resource potential at the Ity Donut INSIGHTS 2023 Grand Ity reserve model1 2024 Grand Ity reserve model2 • Significant resource and Bakatouo NW reserve expansion at Ity, in close proximity to the processing plant. Processing Plant Zia • Added 1.2Moz to the
Slide 64: Goleu
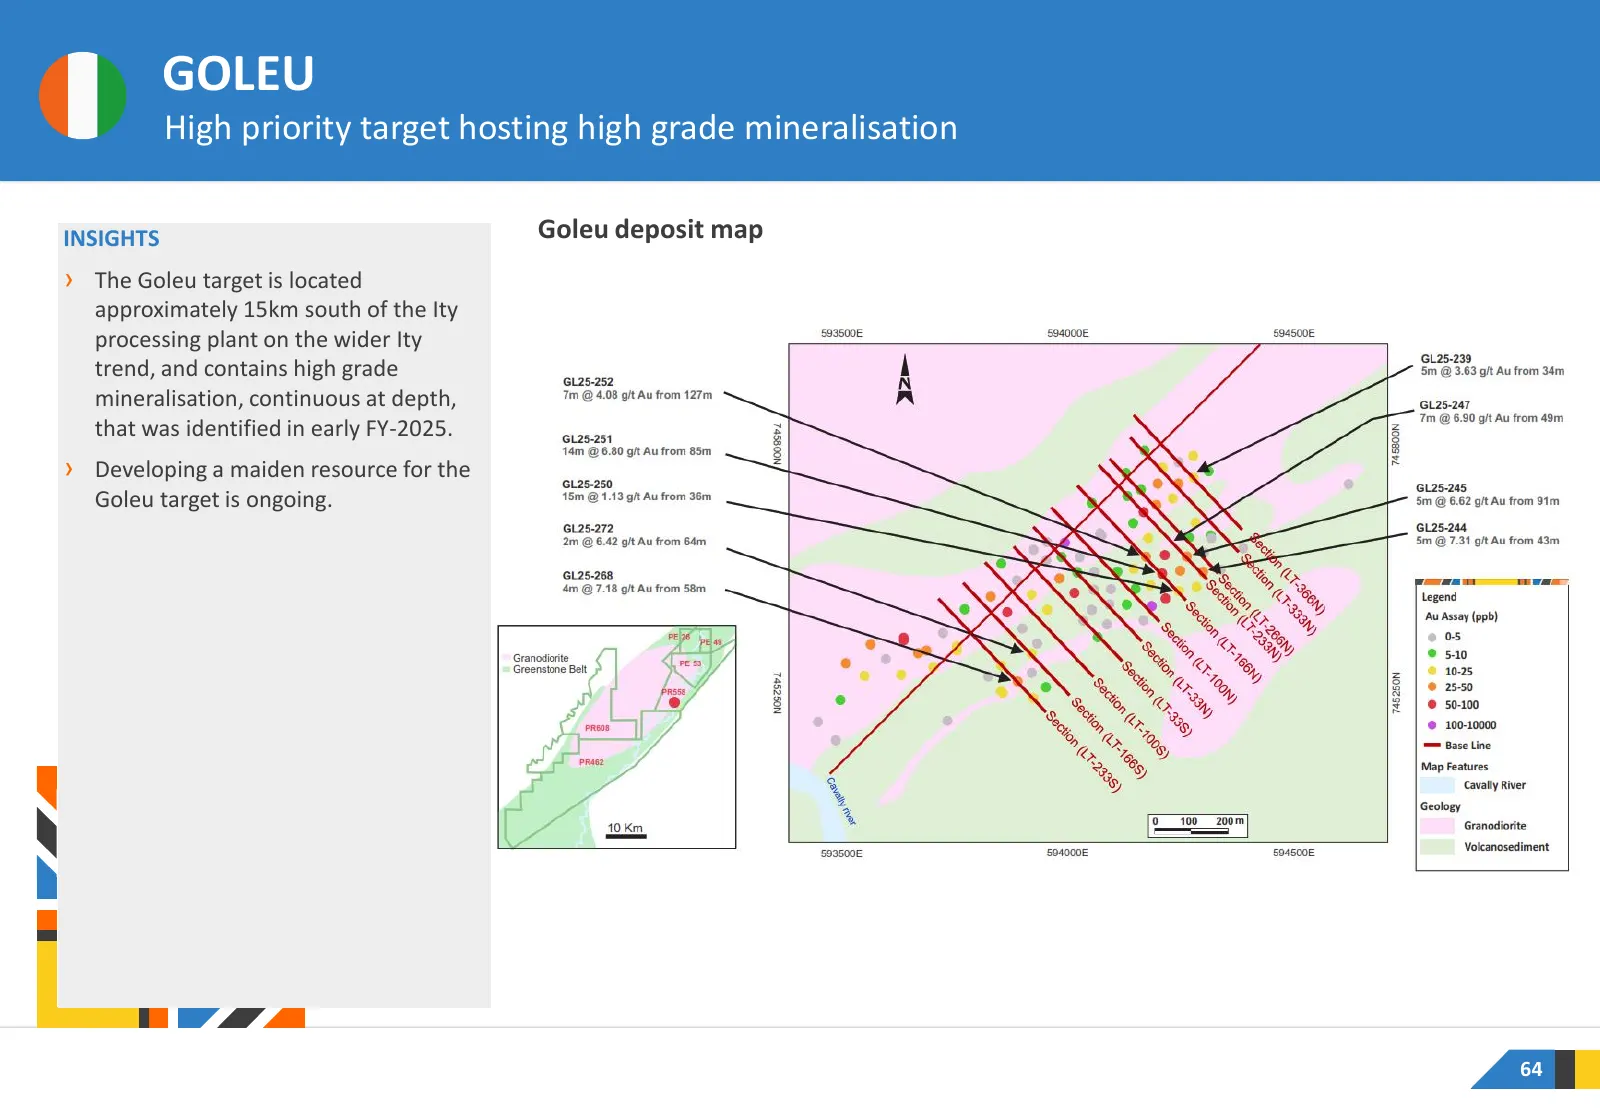
GOLEU High priority target hosting high grade mineralisation INSIGHTS Goleu deposit map › The Goleu target is located approximately 15km south of the Ity processing plant on the wider Ity trend, and contains high grade mineralisation, continuous at depth, that was identified in early FY-2025. › Deve
Slide 65: Gbampleu
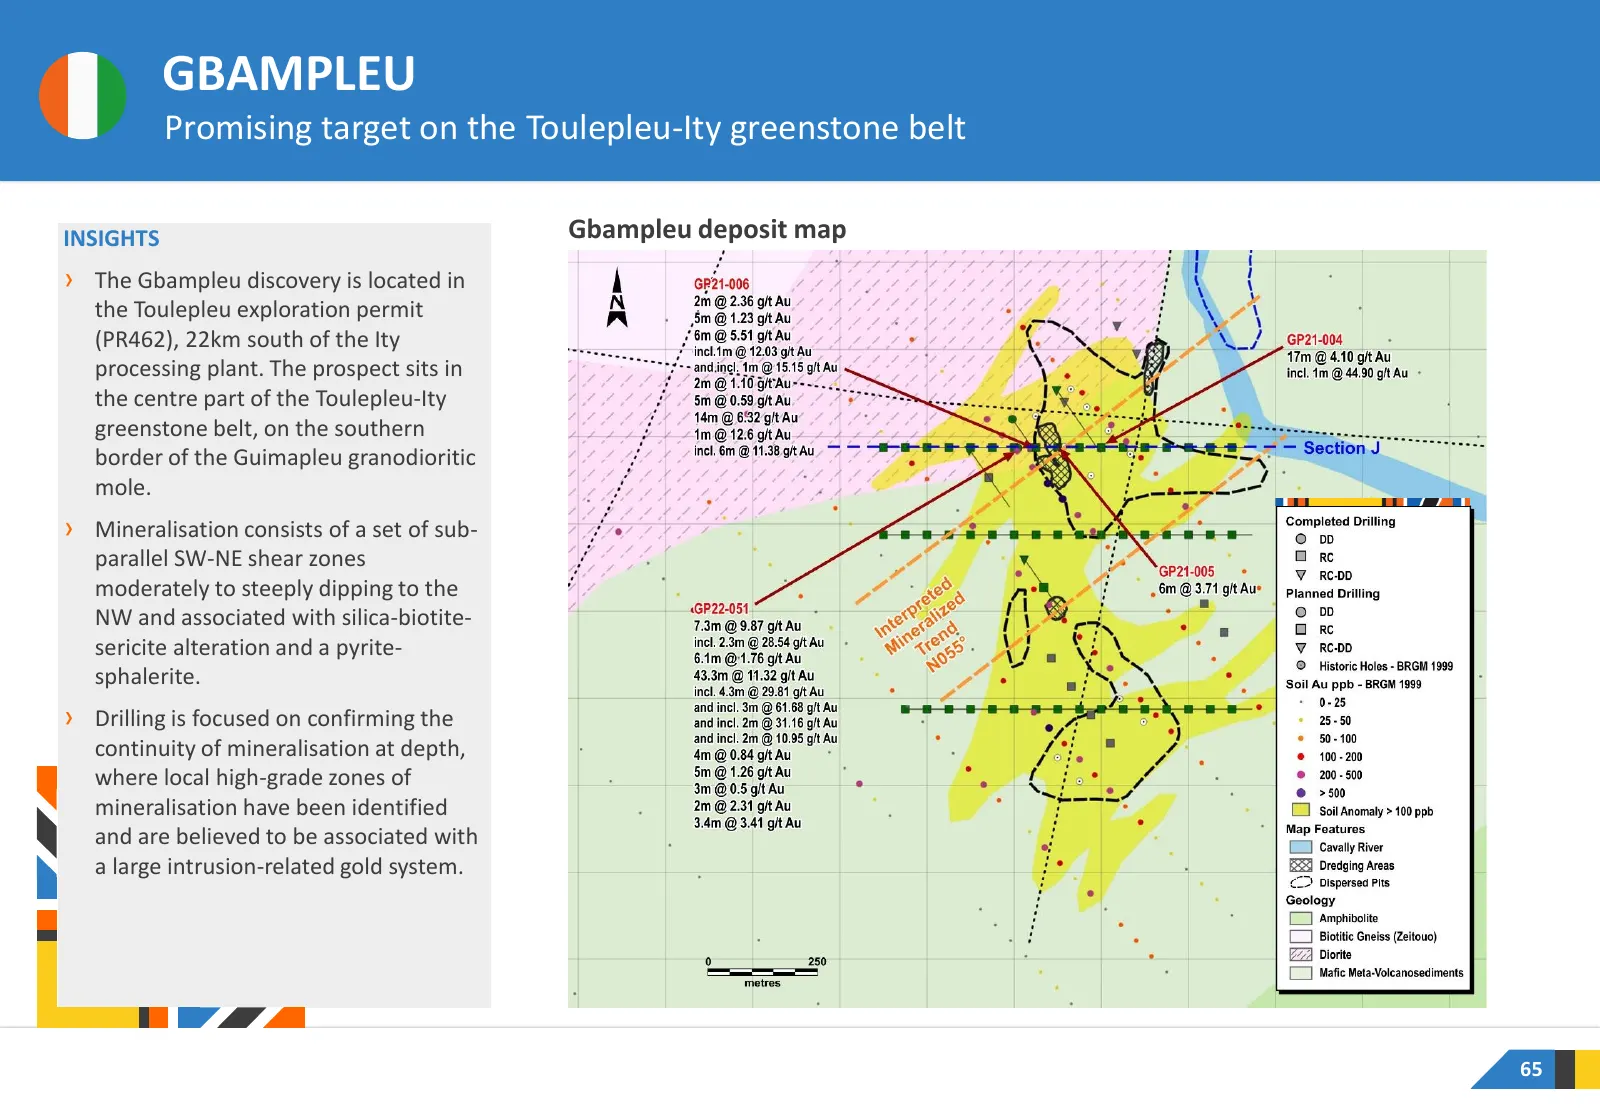
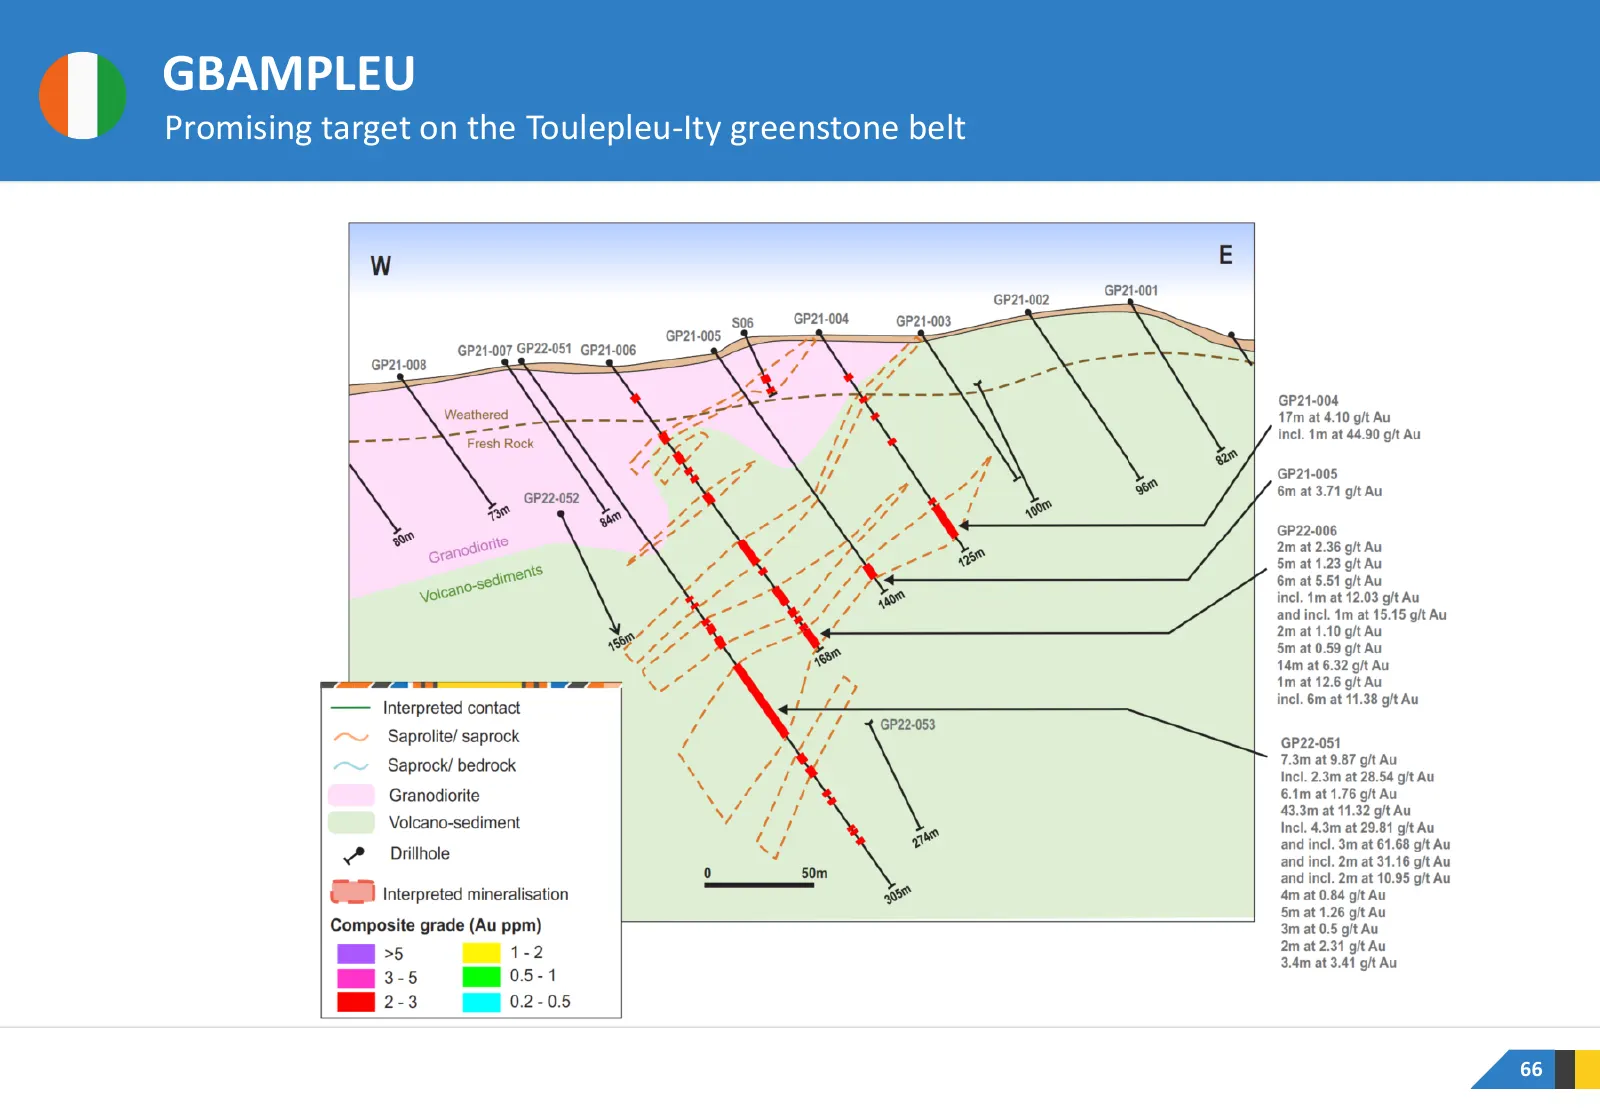
GBAMPLEU Promising target on the Toulepleu-Ity greenstone belt INSIGHTS Gbampleu deposit map › The Gbampleu discovery is located in the Toulepleu exploration permit (PR462), 22km south of the Ity processing plant. The prospect sits in the centre part of the Toulepleu-Ity greenstone belt, on the sout
Slide 66: Gbampleu
GBAMPLEU Promising target on the Toulepleu-Ity greenstone belt 66
Slide 67: Mana Mine
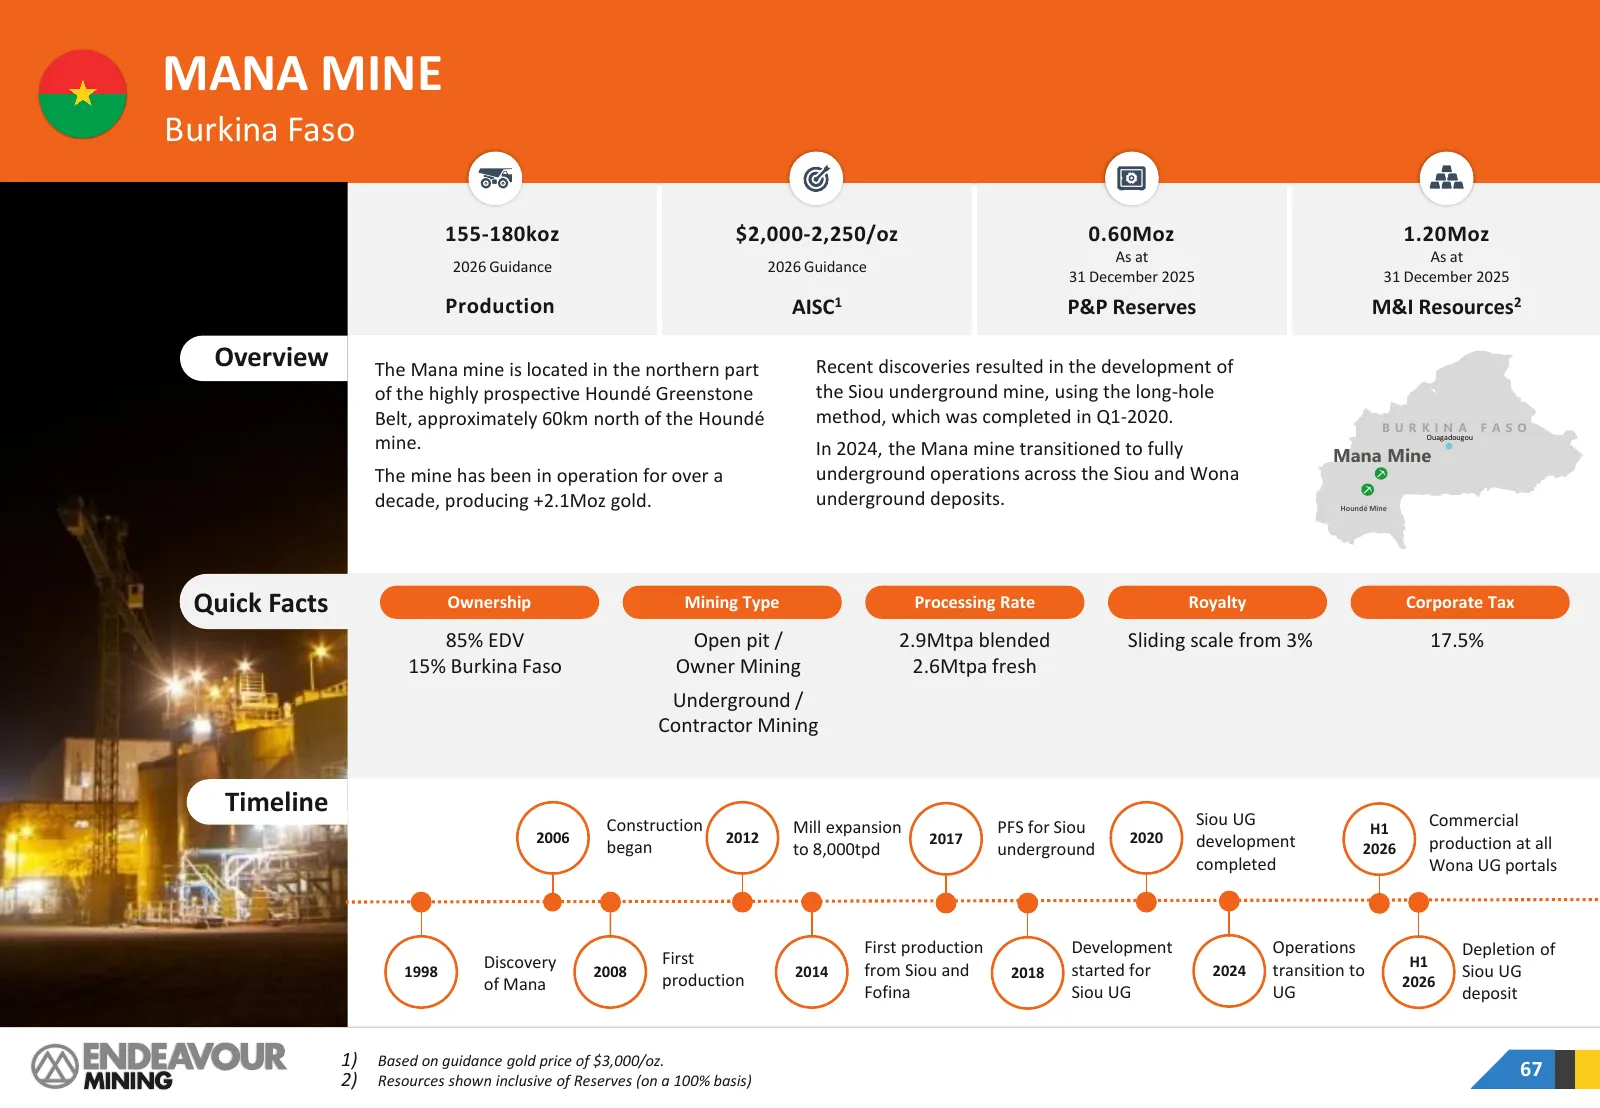
MANA MINE Burkina Faso 155-180koz $2,000-2,250/oz 0.60Moz 1.20Moz As at As at 2026 Guidance 2026 Guidance 31 December 2025 31 December 2025 Production AISC1 P&P Reserves M&I Resources2 Overview The Mana mine is located in the northern part Recent discoveries resulted in the development of of the hig
Slide 68: Mana Mine
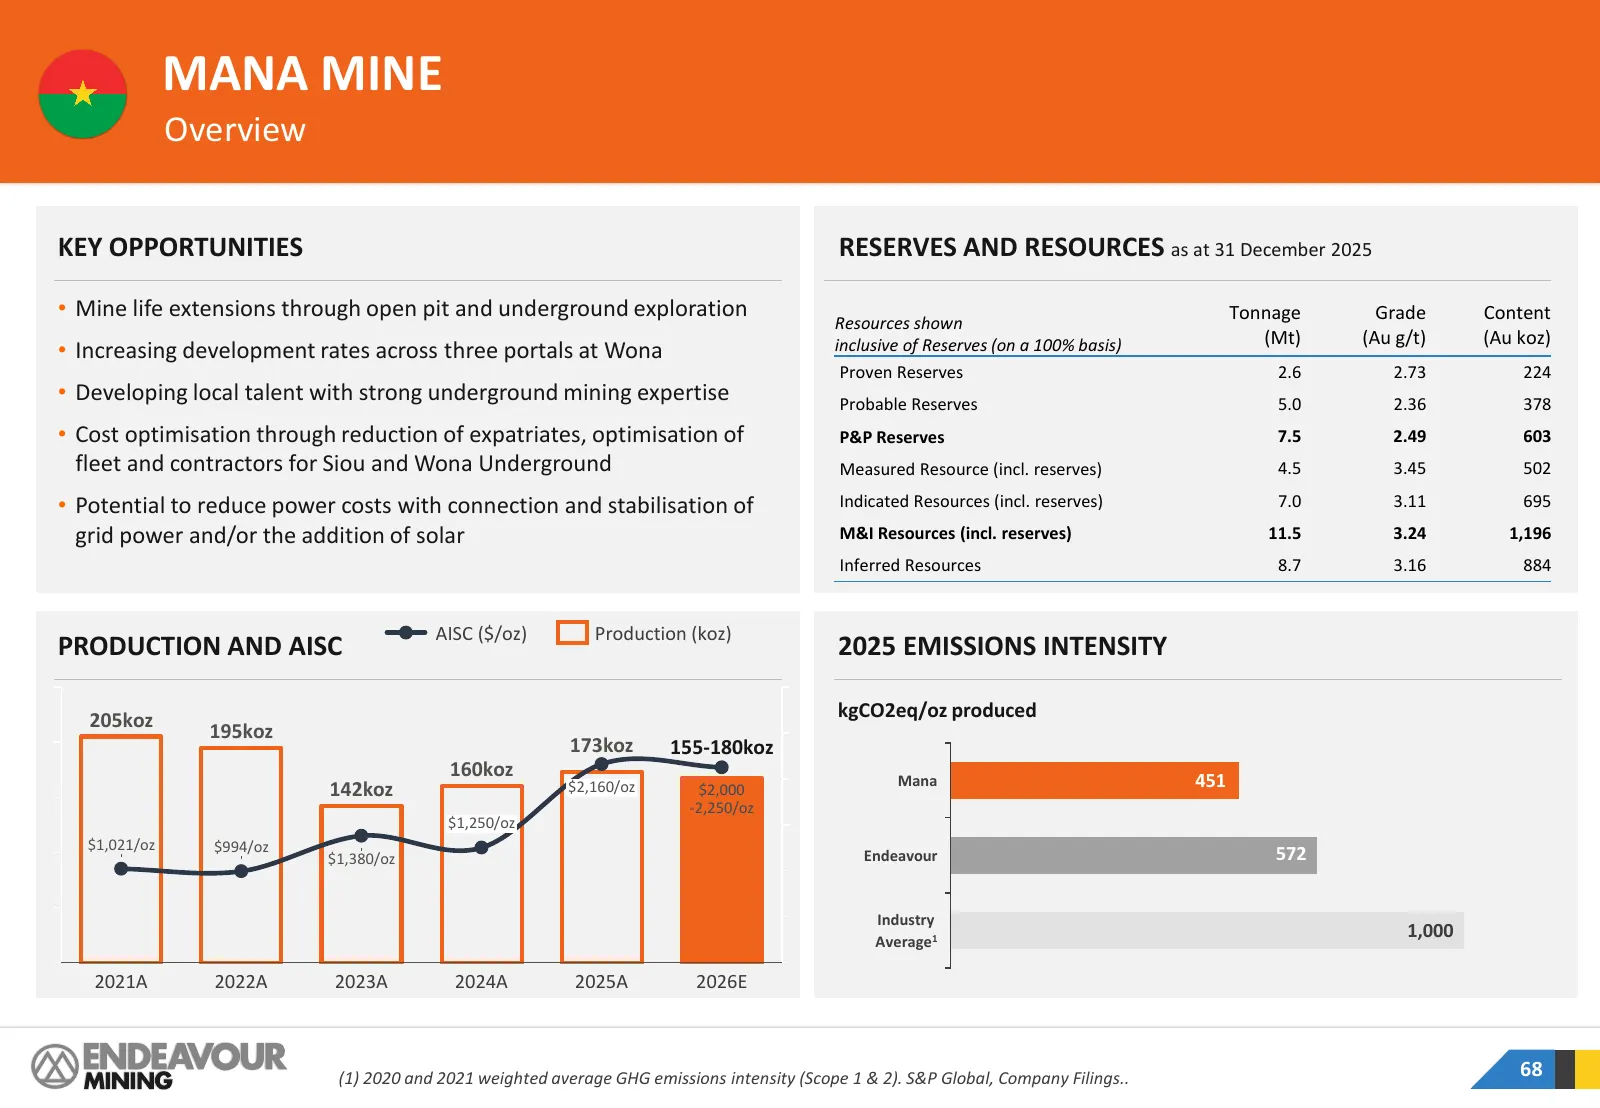
MANA MINE Overview KEY OPPORTUNITIES RESERVES AND RESOURCES as at 31 December 2025 • Mine life extensions through open pit and underground exploration Tonnage Grade Content Resources shown (Mt) (Au g/t) (Au koz) • Increasing development rates across three portals at Wona inclusive of Reserves (on a
Slide 69: Mana Mine
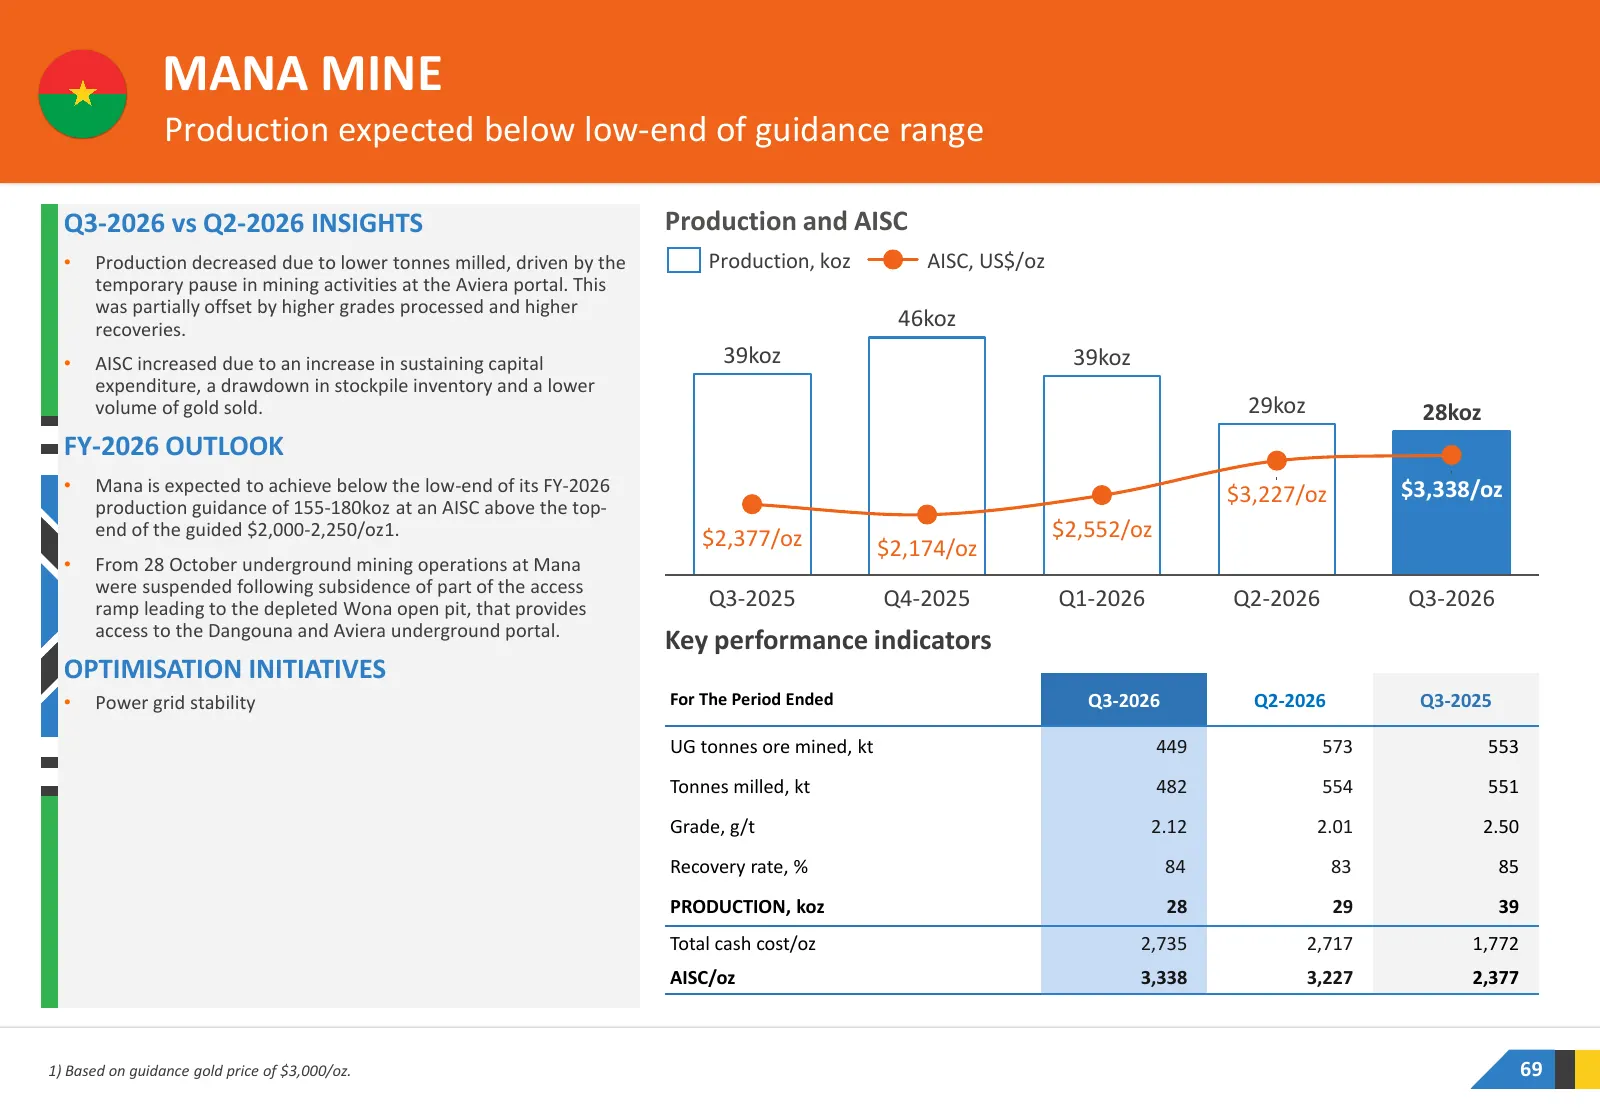
MANA MINE Production expected below low-end of guidance range Q3-2026 vs Q2-2026 INSIGHTS Production and AISC • Production decreased due to lower tonnes milled, driven by the Production, koz AISC, US$/oz temporary pause in mining activities at the Aviera portal. This was partially offset by higher g
Slide 70: Mana Mine: Geotechnical Review Underway
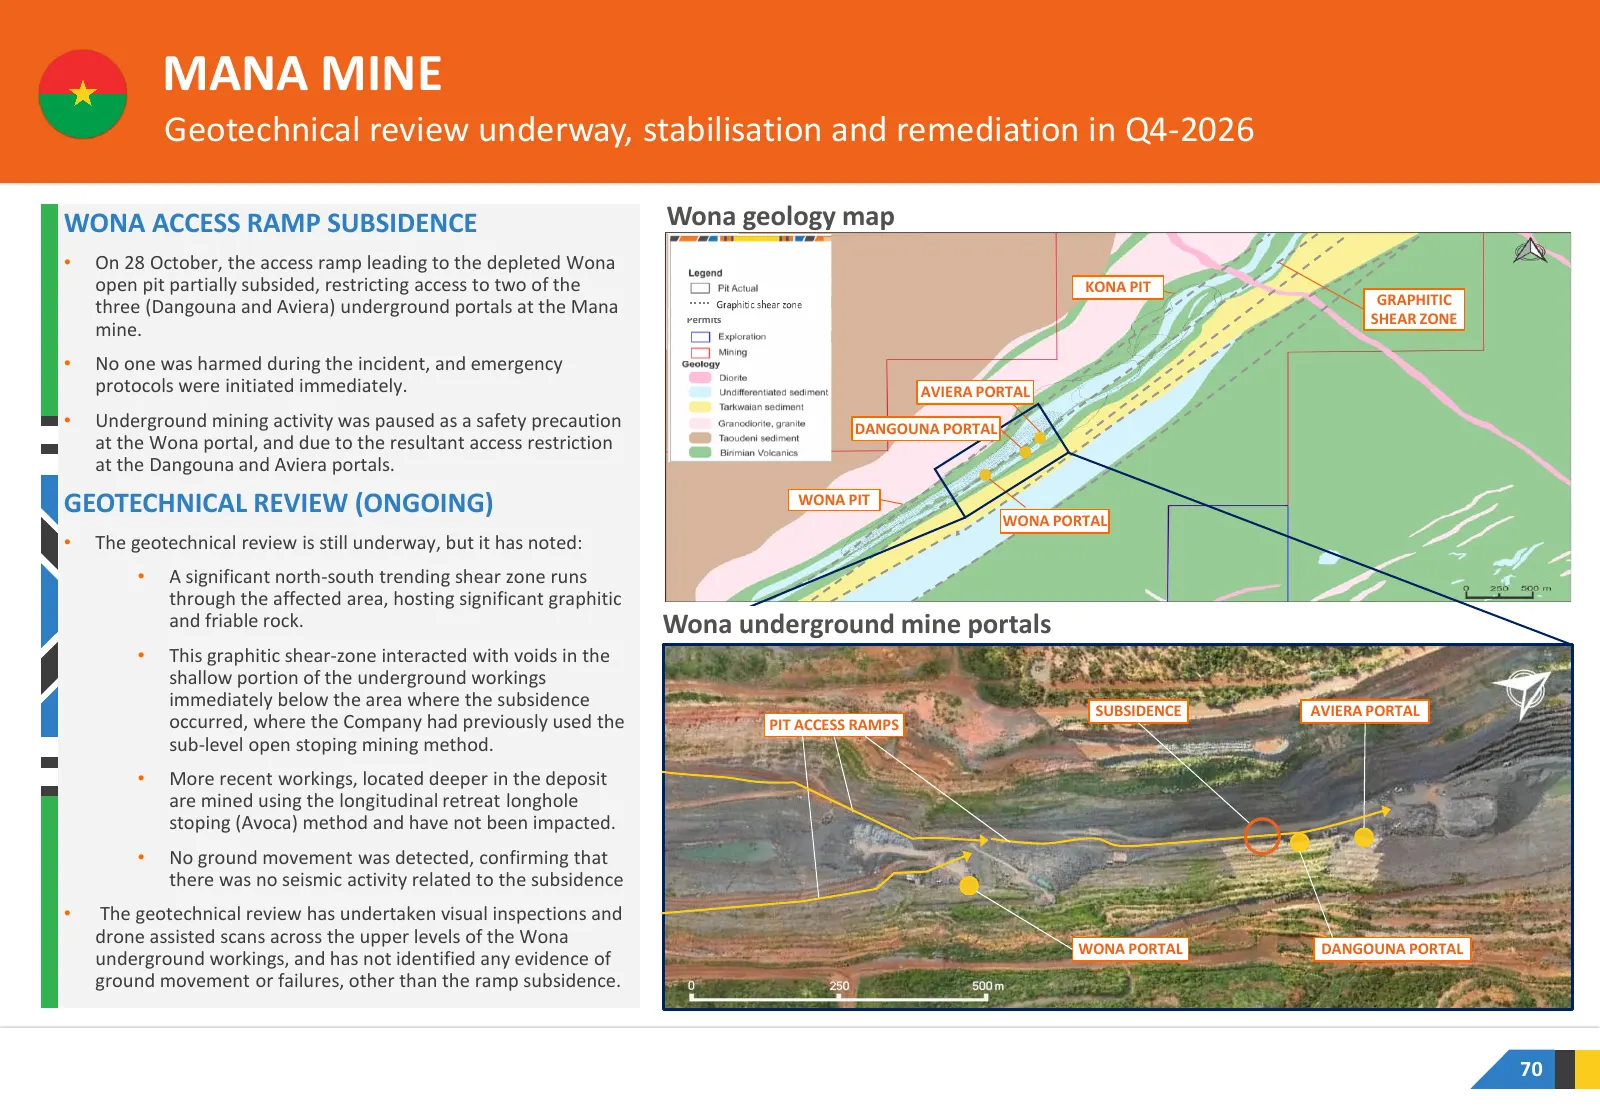
MANA MINE Geotechnical review underway, stabilisation and remediation in Q4-2026 WONA ACCESS RAMP SUBSIDENCE Wona geology map • On 28 October, the access ramp leading to the depleted Wona open pit partially subsided, restricting access to two of the KONA PIT GRAPHITIC three (Dangouna and Aviera) und
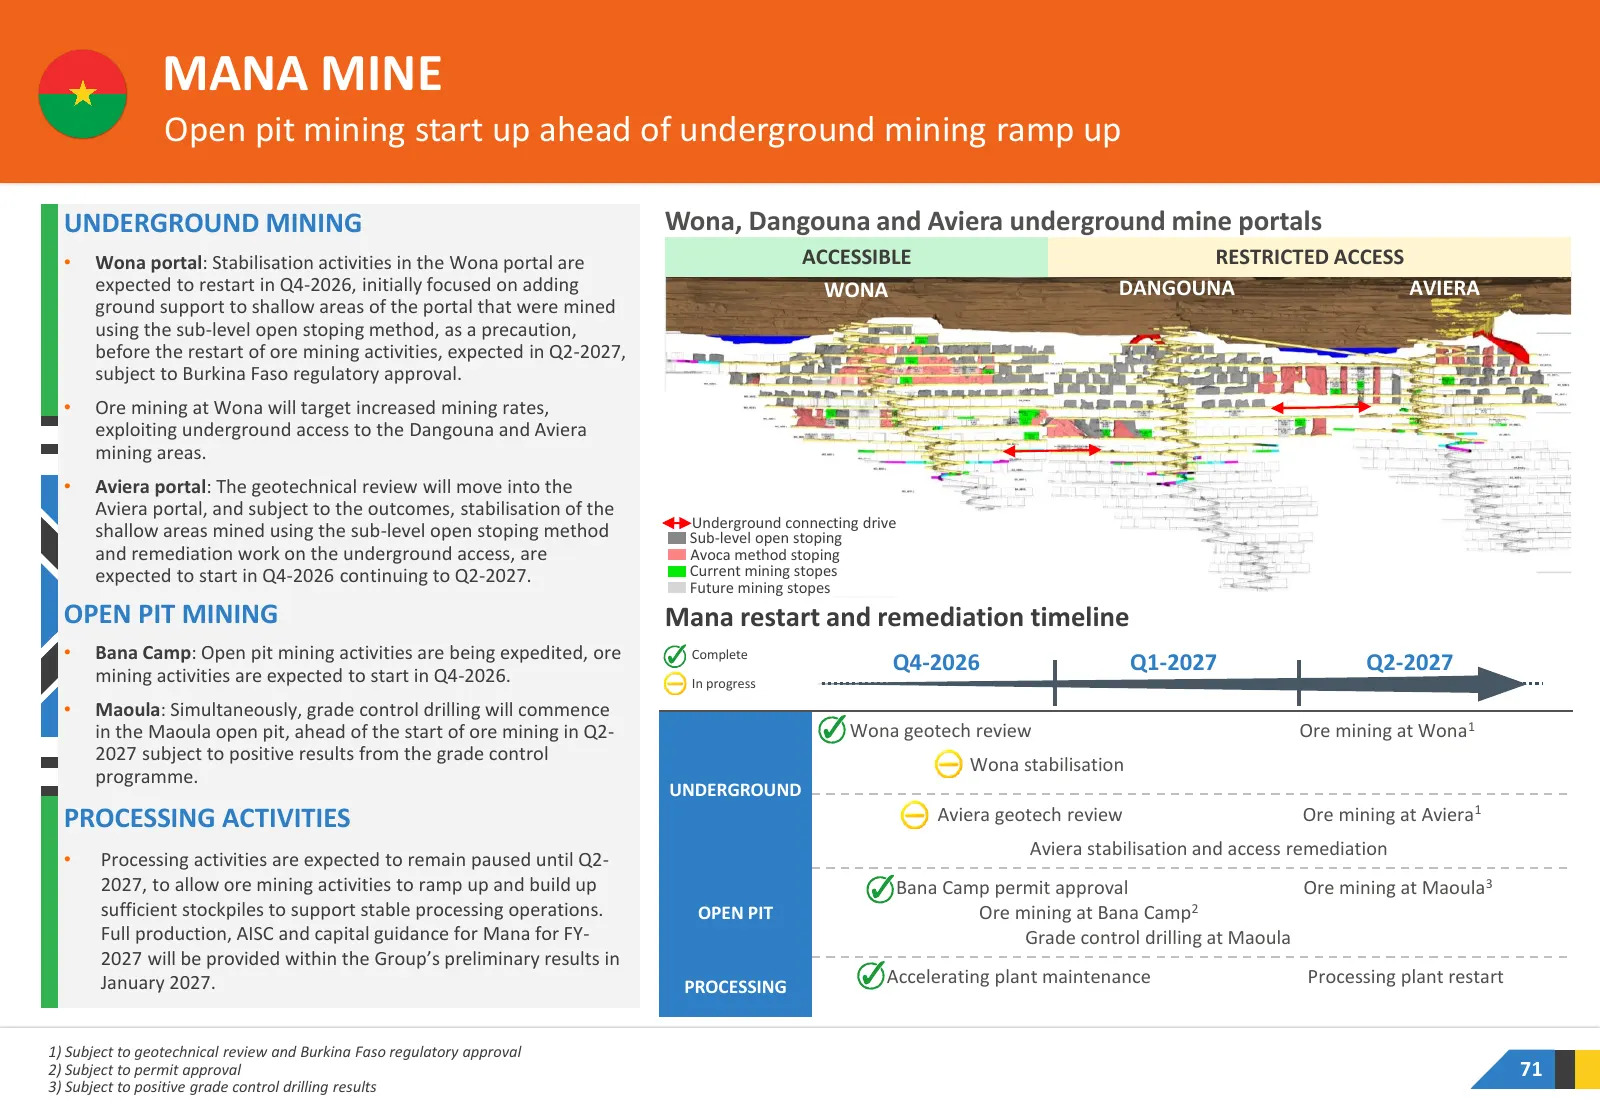
Slide 71: Mana Mine: Open Pit Start Up
MANA MINE Open pit mining start up ahead of underground mining ramp up UNDERGROUND MINING Wona, Dangouna and Aviera underground mine portals • Wona portal: Stabilisation activities in the Wona portal are ACCESSIBLE RESTRICTED ACCESS expected to restart in Q4-2026, initially focused on adding WONA DA
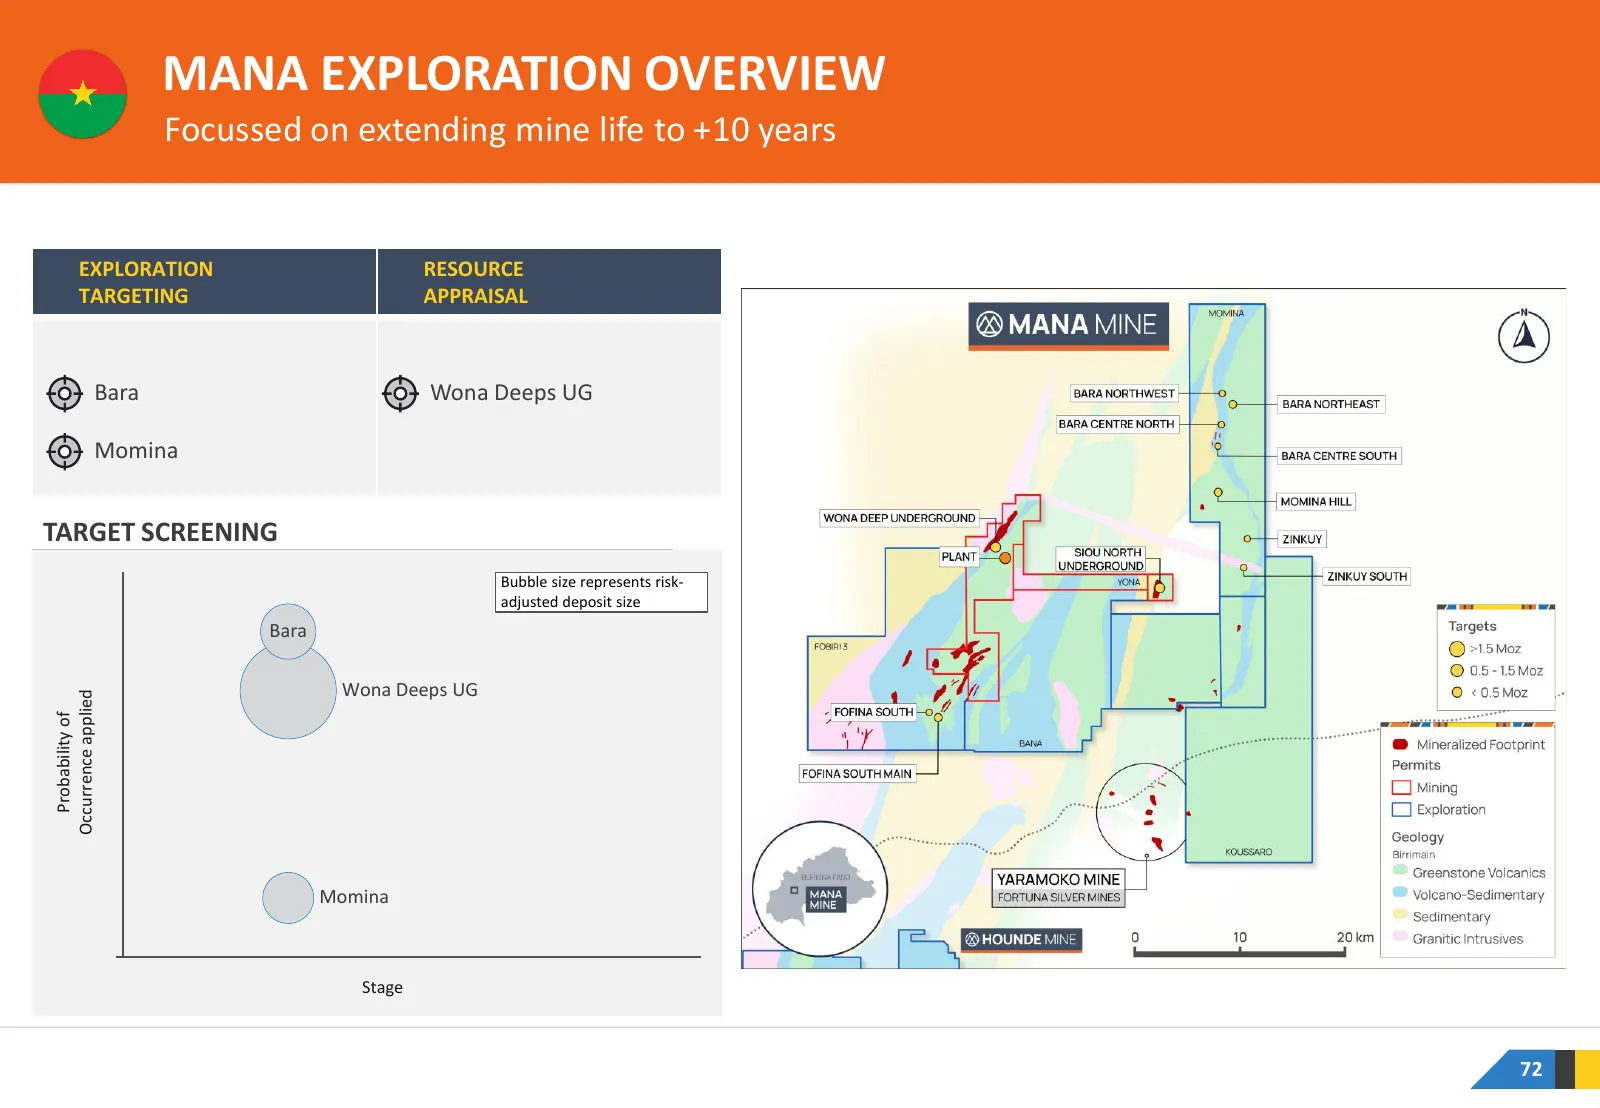
Slide 72: Mana Exploration Overview
MANA EXPLORATION OVERVIEW Focussed on extending mine life to +10 years EXPLORATION RESOURCE TARGETING APPRAISAL Bara Wona Deeps UG Momina TARGET SCREENING Bubble size represents risk- adjusted deposit size Bara Wona Deeps UG Occurrence applied Probability of Momina Stage 72
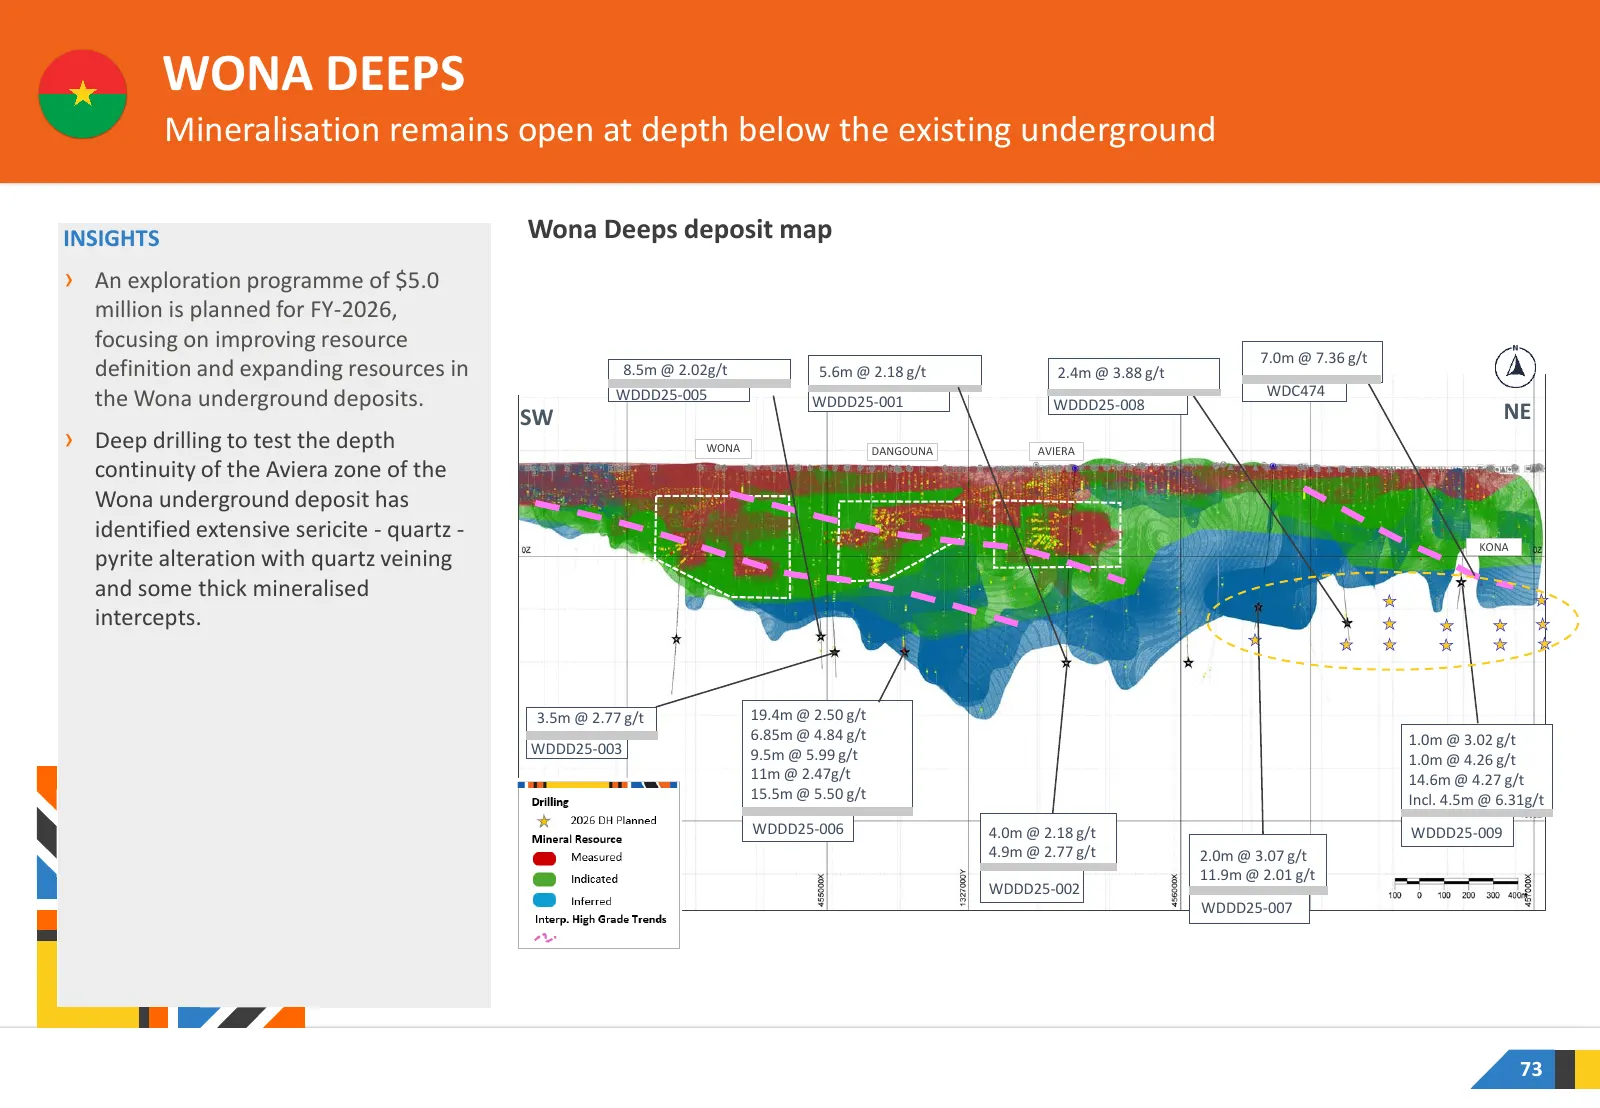
Slide 73: Wona Deeps
WONA DEEPS Mineralisation remains open at depth below the existing underground INSIGHTS Wona Deeps deposit map › An exploration programme of $5.0 million is planned for FY-2026, focusing on improving resource Wona Deeps Long Section showing Grade Control8.5m Resources 7.0m @ 7.36 g/t definition and
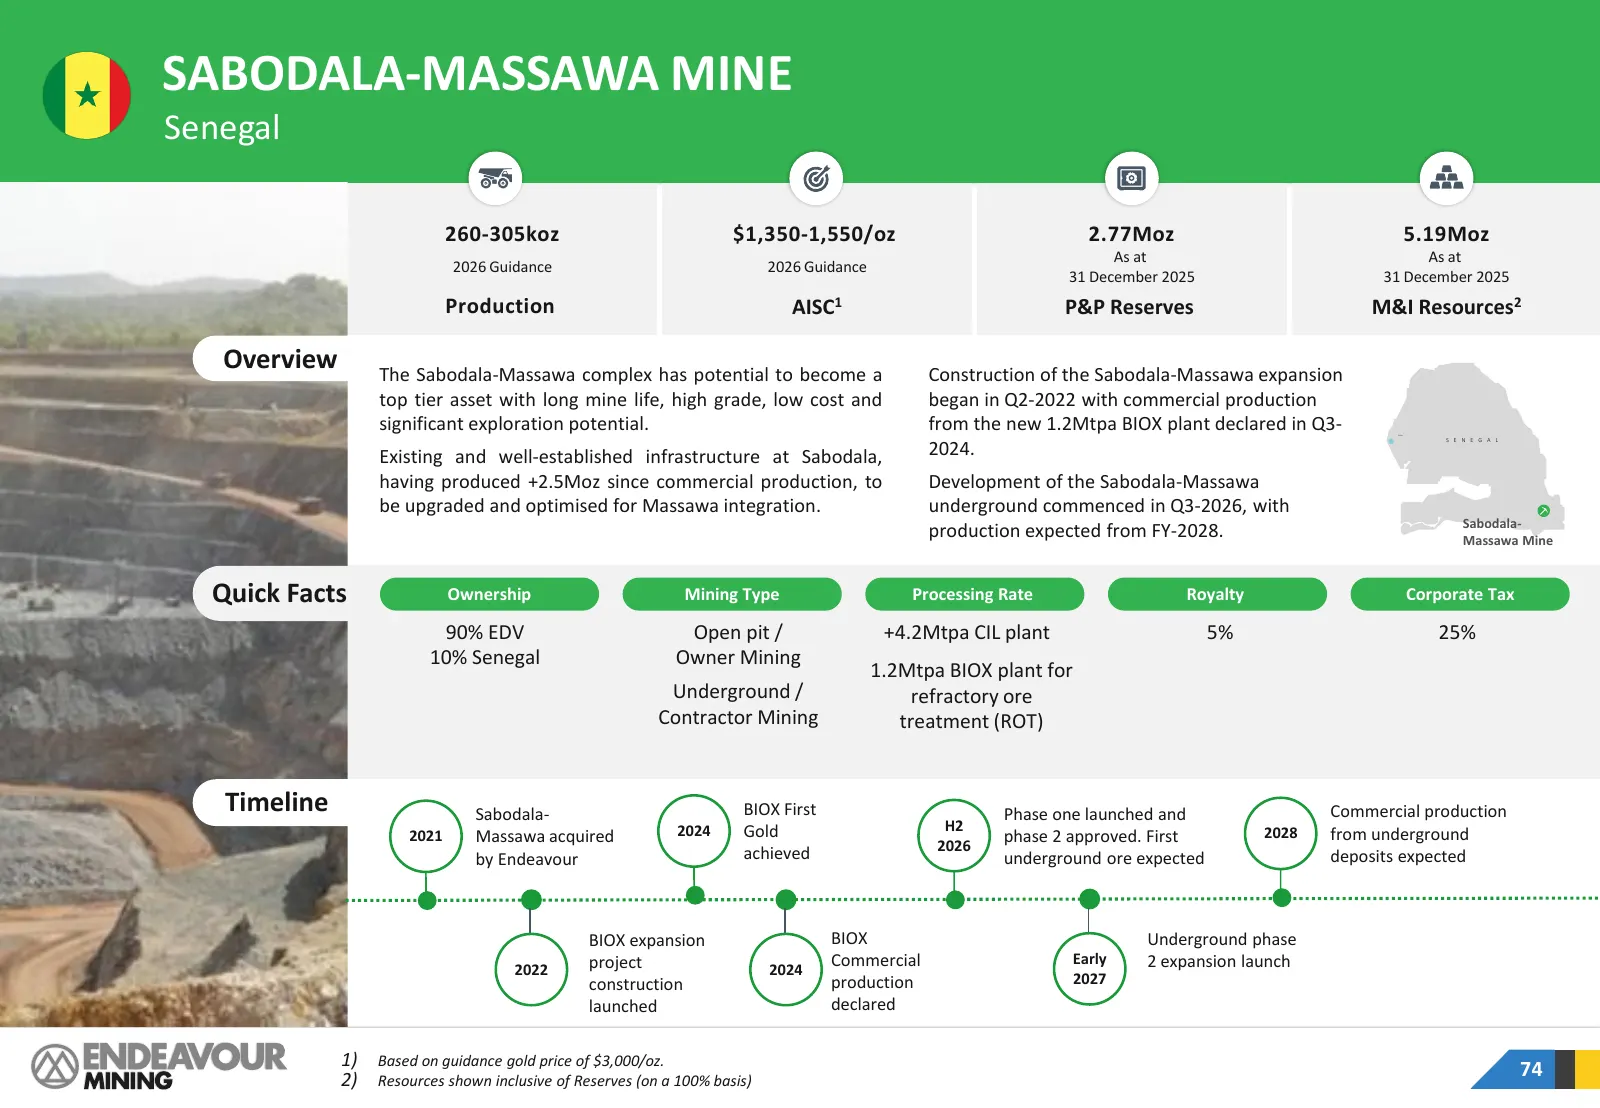
Slide 74: Sabodala-Massawa Mine
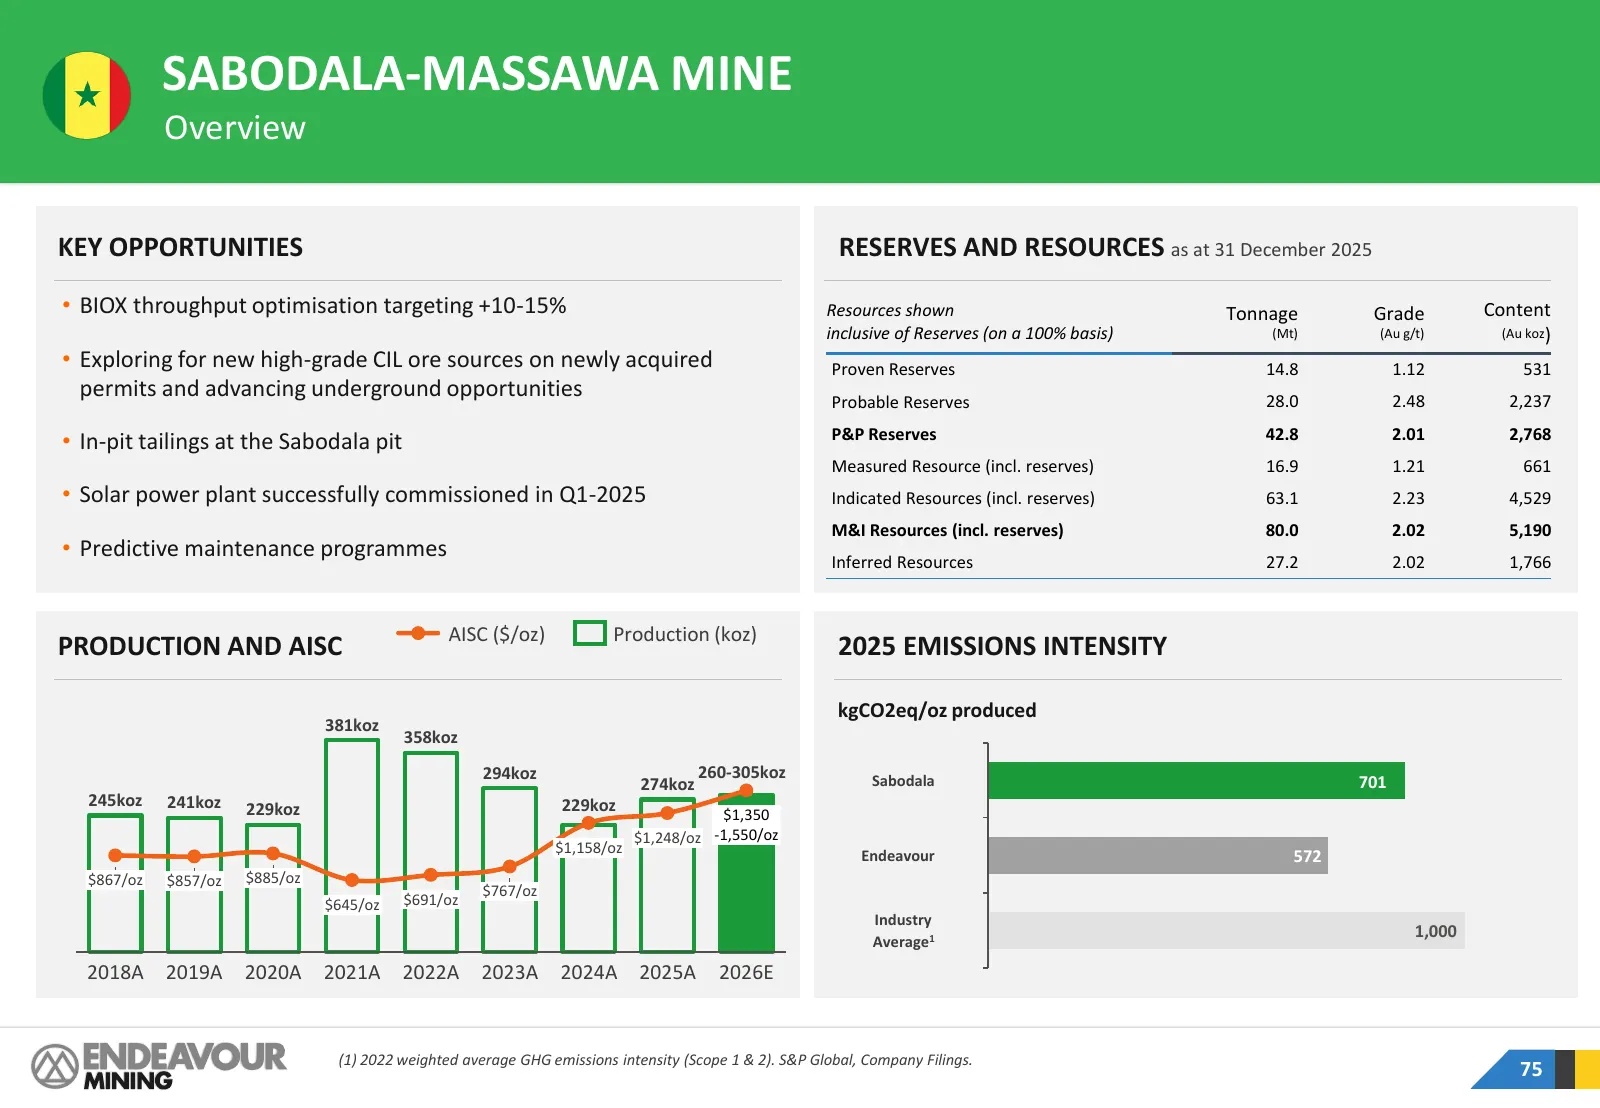
SABODALA-MASSAWA MINE Senegal 260-305koz $1,350-1,550/oz 2.77Moz 5.19Moz As at As at 2026 Guidance 2026 Guidance 31 December 2025 31 December 2025 Production AISC1 P&P Reserves M&I Resources2 Overview The Sabodala-Massawa complex has potential to become a Construction of the Sabodala-Massawa expansi
Slide 75: Sabodala-Massawa Mine
SABODALA-MASSAWA MINE Overview KEY OPPORTUNITIES RESERVES AND RESOURCES as at 31 December 2025 • BIOX throughput optimisation targeting +10-15% Resources shown Tonnage Grade Content inclusive of Reserves (on a 100% basis) (Mt) (Au g/t) (Au koz) • Exploring for new high-grade CIL ore sources on newly
Slide 76: Sabodala-Massawa Mine
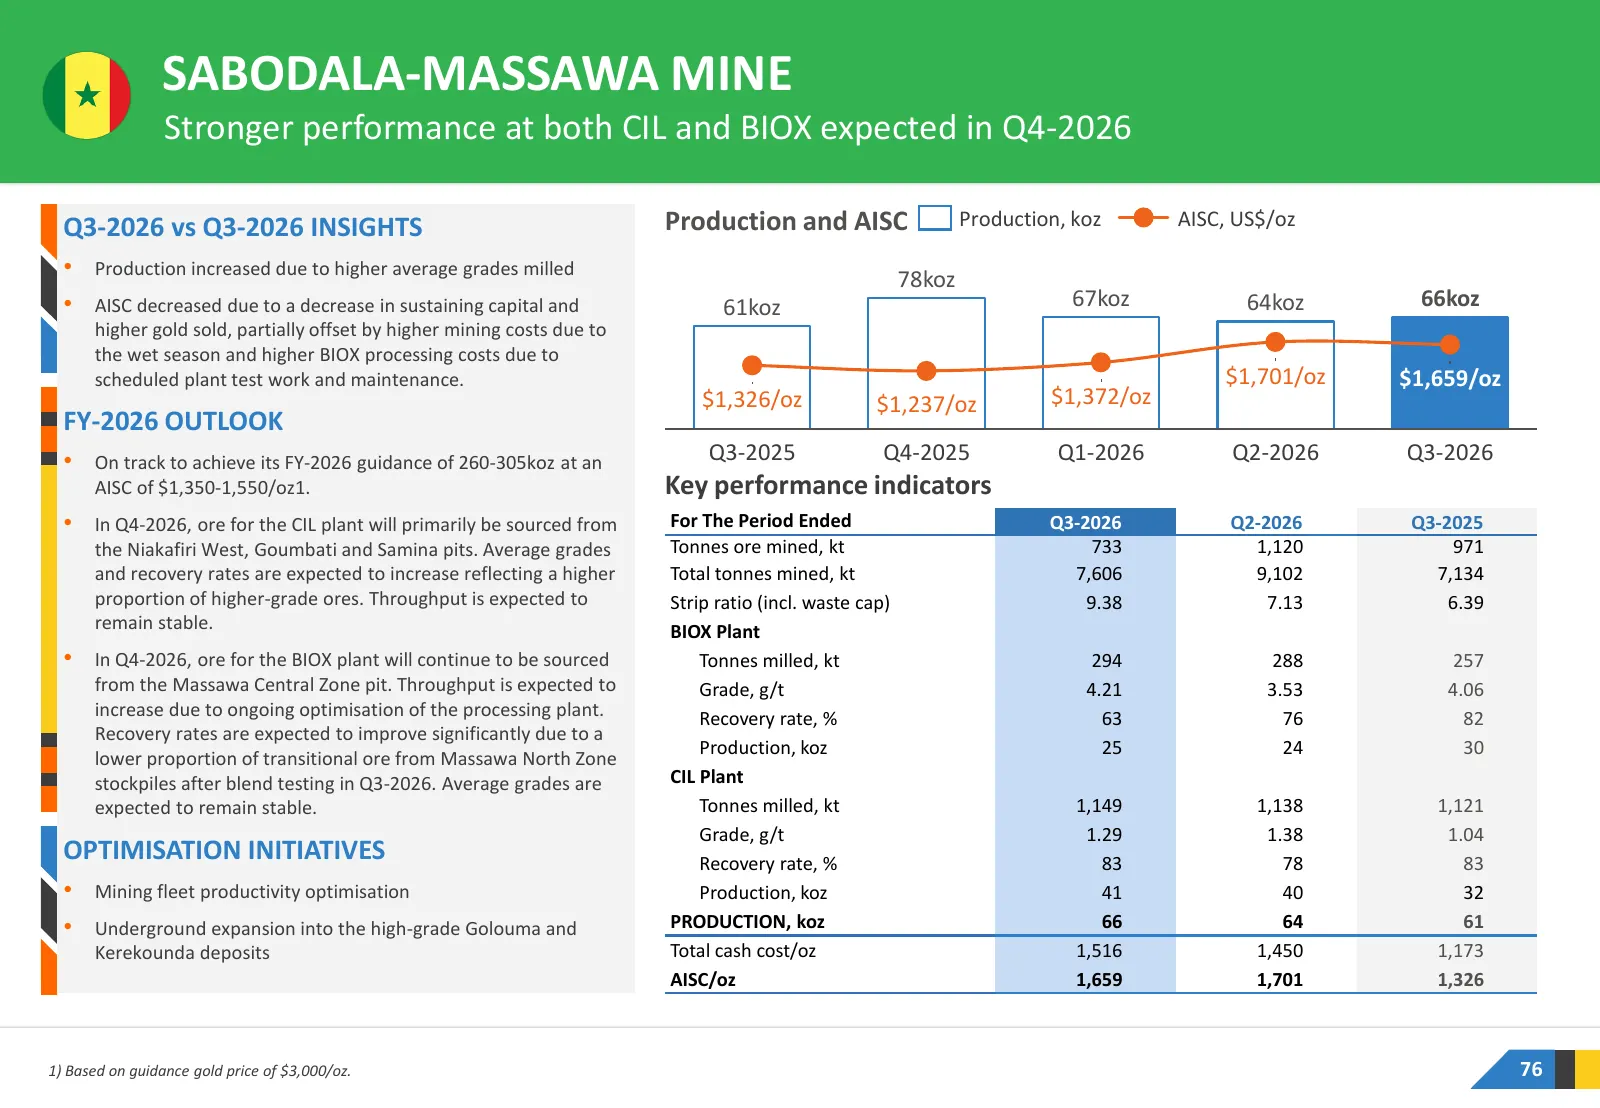
SABODALA-MASSAWA MINE Stronger performance at both CIL and BIOX expected in Q4-2026 Q3-2026 vs Q3-2026 INSIGHTS Production and AISC Production, koz AISC, US$/oz • Production increased due to higher average grades milled 78koz • AISC decreased due to a decrease in sustaining capital and 61koz 67koz 6
Slide 77: Sabodala-Massawa Underground Expansion
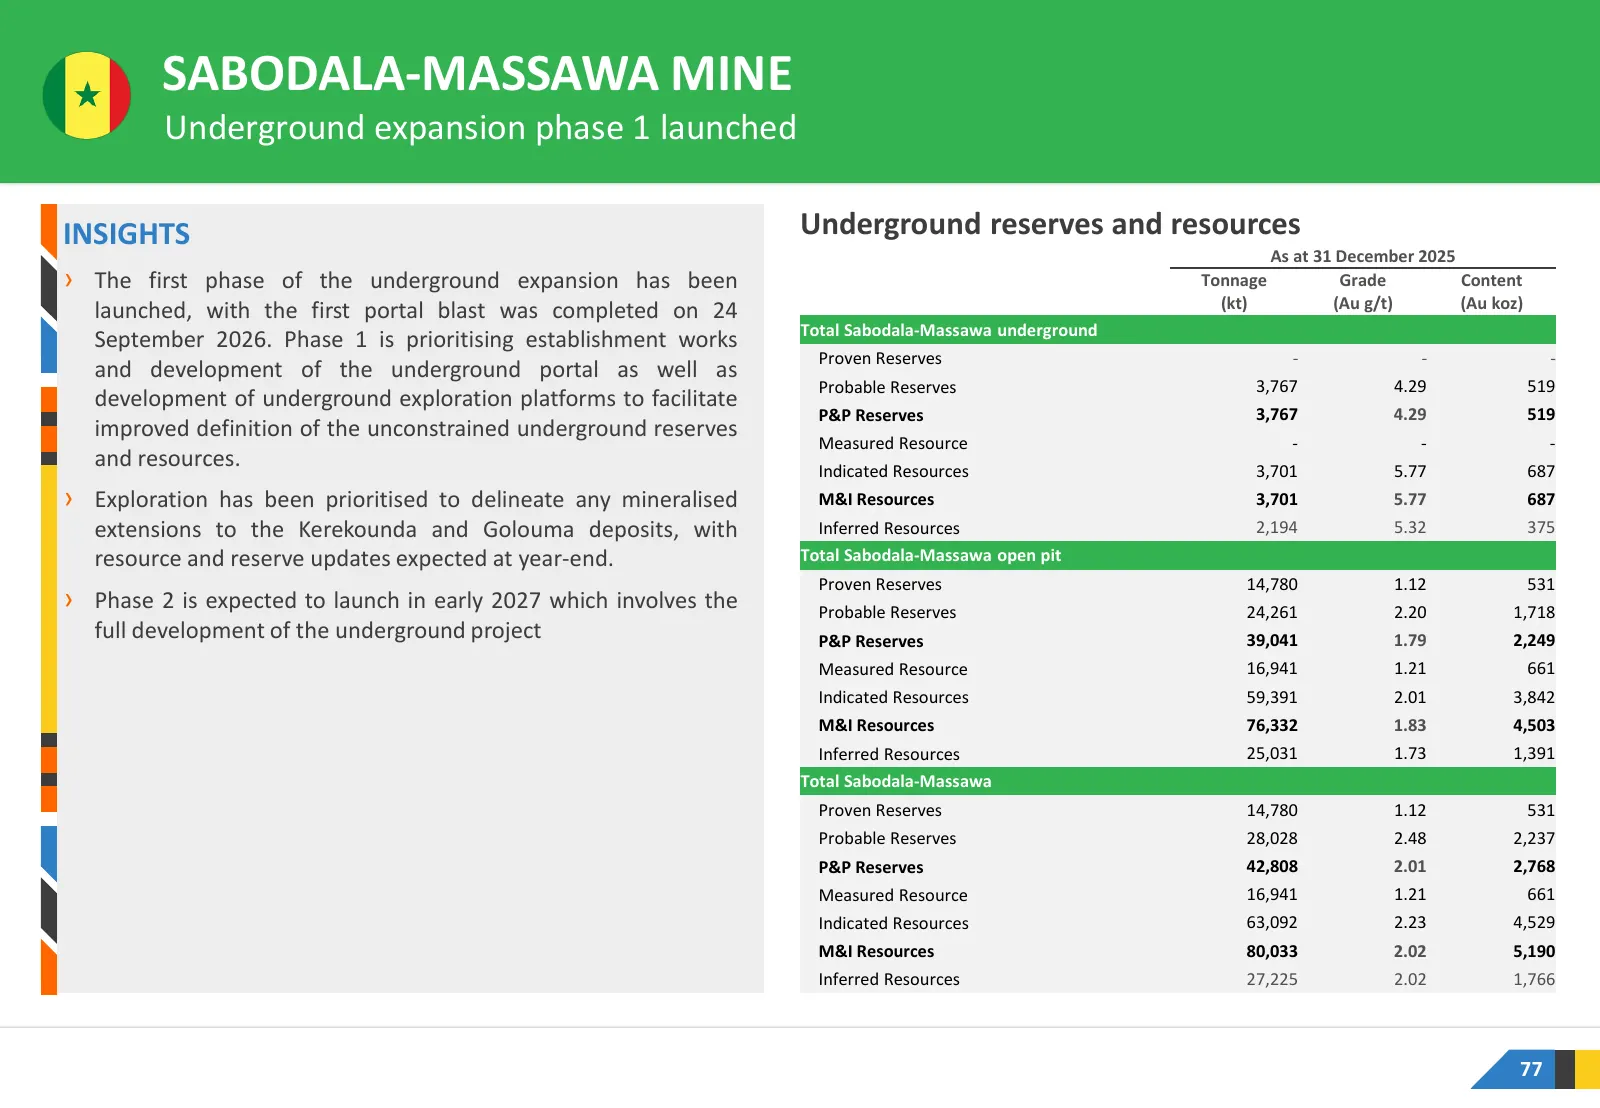
SABODALA-MASSAWA MINE Underground expansion phase 1 launched INSIGHTS Underground reserves and resources As at 31 December 2025 › The first phase of the underground expansion has been Tonnage Grade Content launched, with the first portal blast was completed on 24 (kt) (Au g/t) (Au koz) Total Sabodal
Slide 78: Unlocking BIOX Throughput and Recoveries
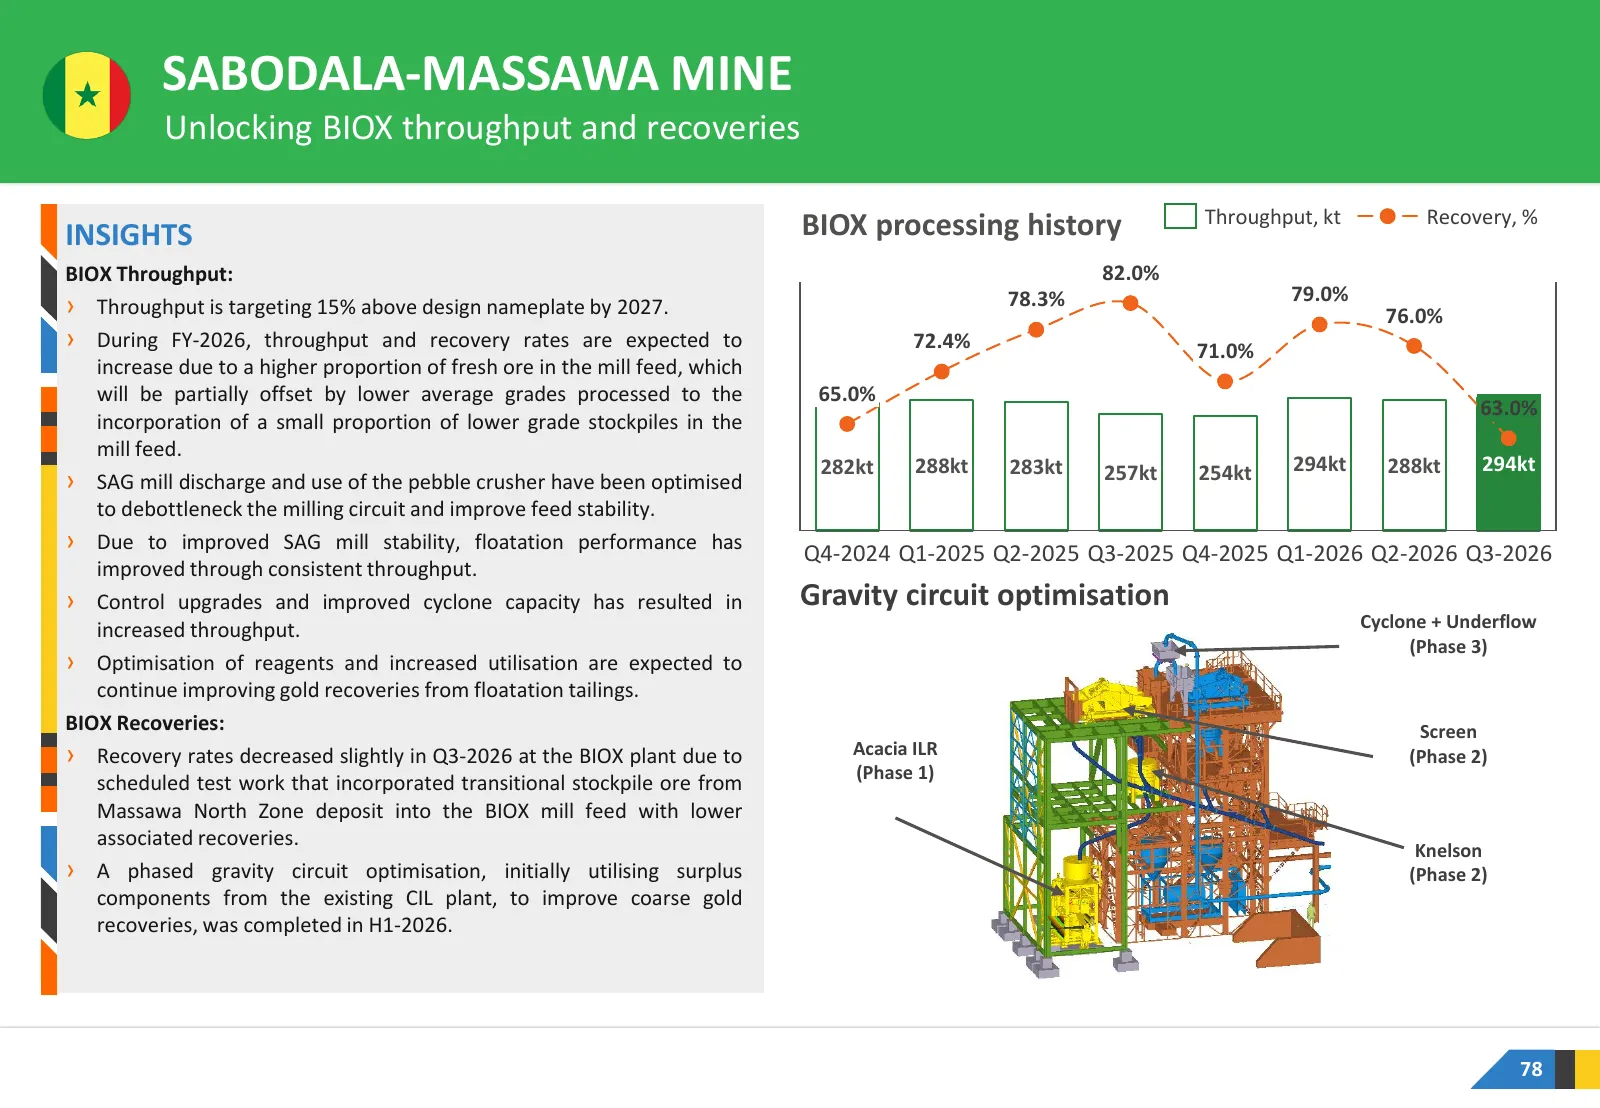
SABODALA-MASSAWA MINE Unlocking BIOX throughput and recoveries BIOX processing history Throughput, kt Recovery, % INSIGHTS BIOX Throughput: 82.0% 78.3% 79.0% › Throughput is targeting 15% above design nameplate by 2027. 76.0% › During FY-2026, throughput and recovery rates are expected to 72.4% 71.0
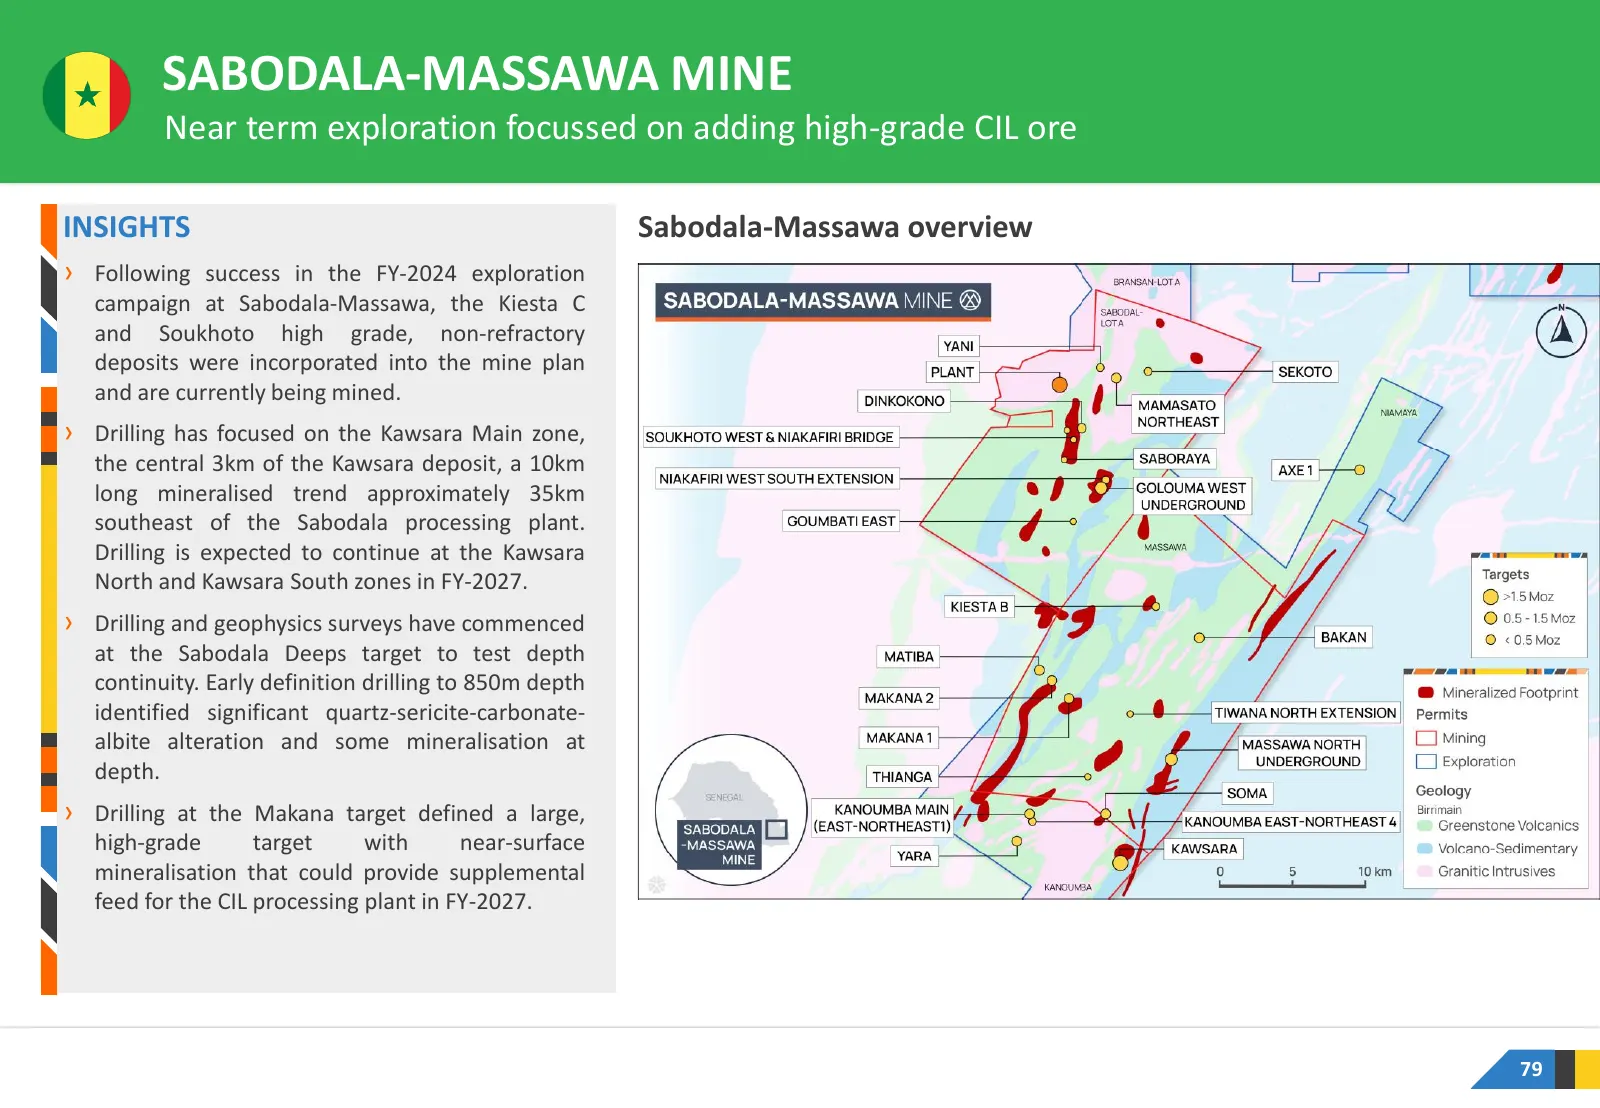
Slide 79: Sabodala-Massawa Near Term Exploration
SABODALA-MASSAWA MINE Near term exploration focussed on adding high-grade CIL ore INSIGHTS Sabodala-Massawa overview › Following success in the FY-2024 exploration campaign at Sabodala-Massawa, the Kiesta C and Soukhoto high grade, non-refractory deposits were incorporated into the mine plan and are
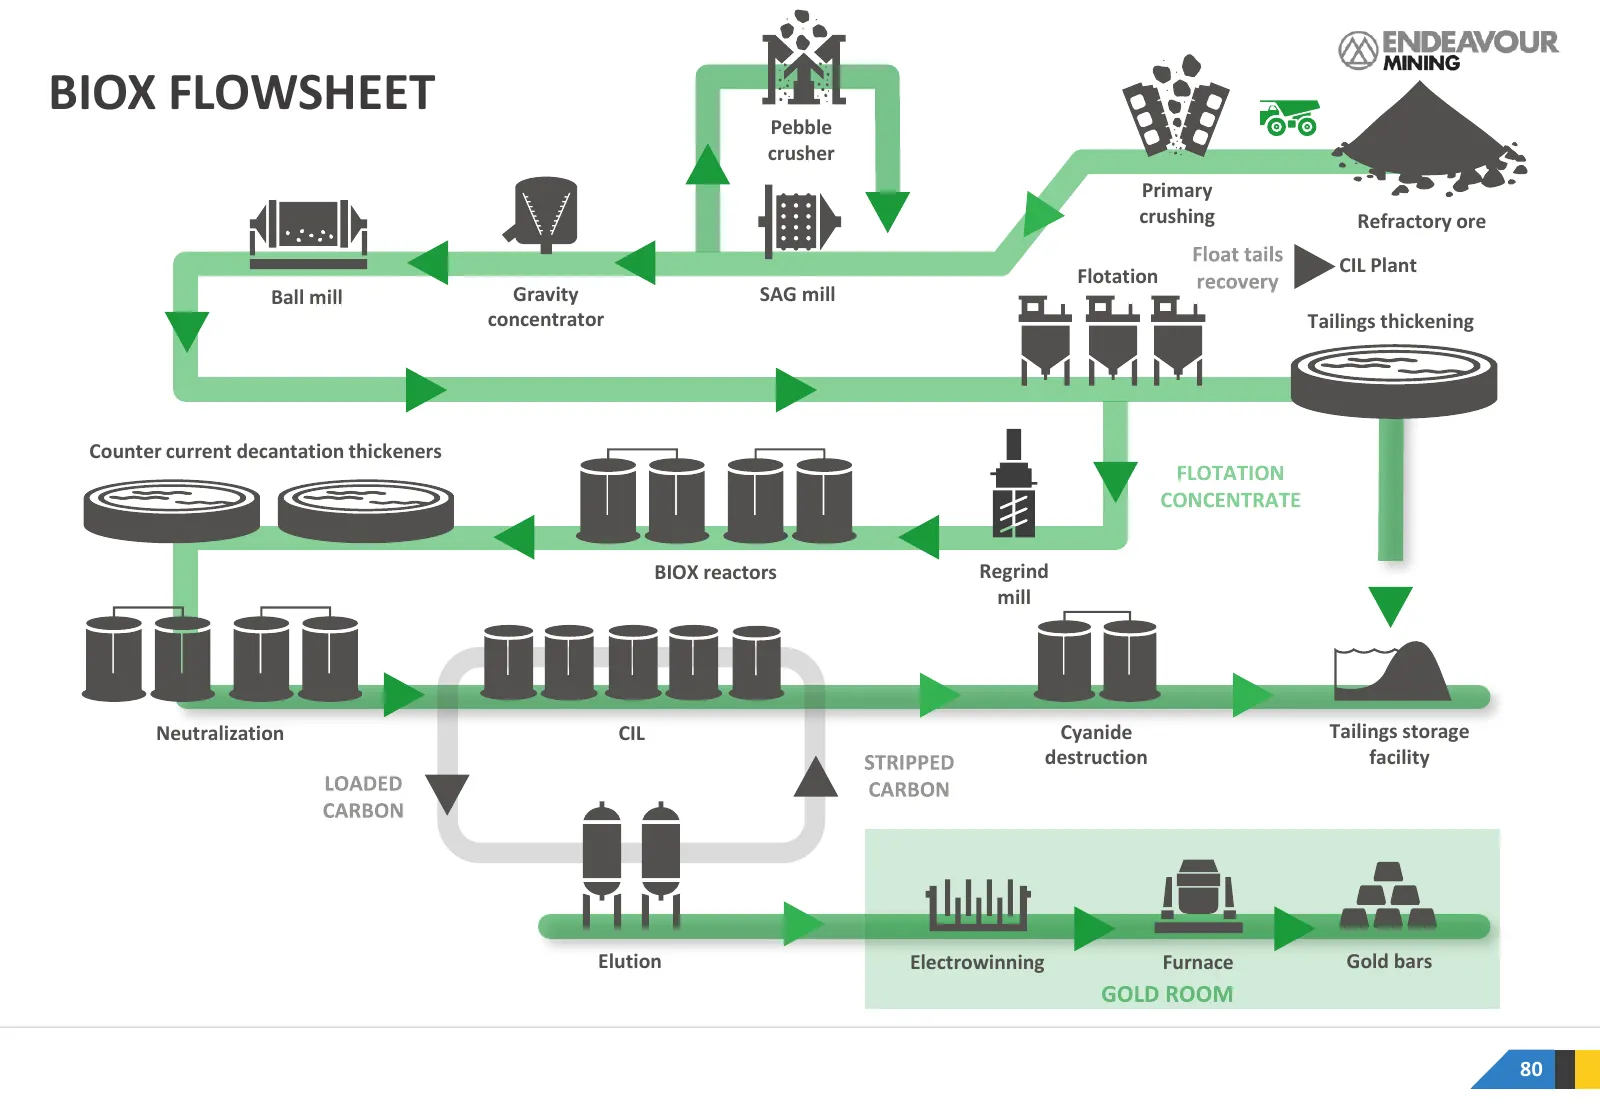
Slide 80: BIOX Flowsheet
BIOX FLOWSHEET Pebble crusher Primary crushing Refractory ore CIL Plant Flotation Ball mill Gravity SAG mill concentrator Tailings thickening Counter current decantation thickeners BIOX reactors Regrind mill Neutralization CIL Cyanide Tailings storage destruction facility Elution Electrowinning Furn
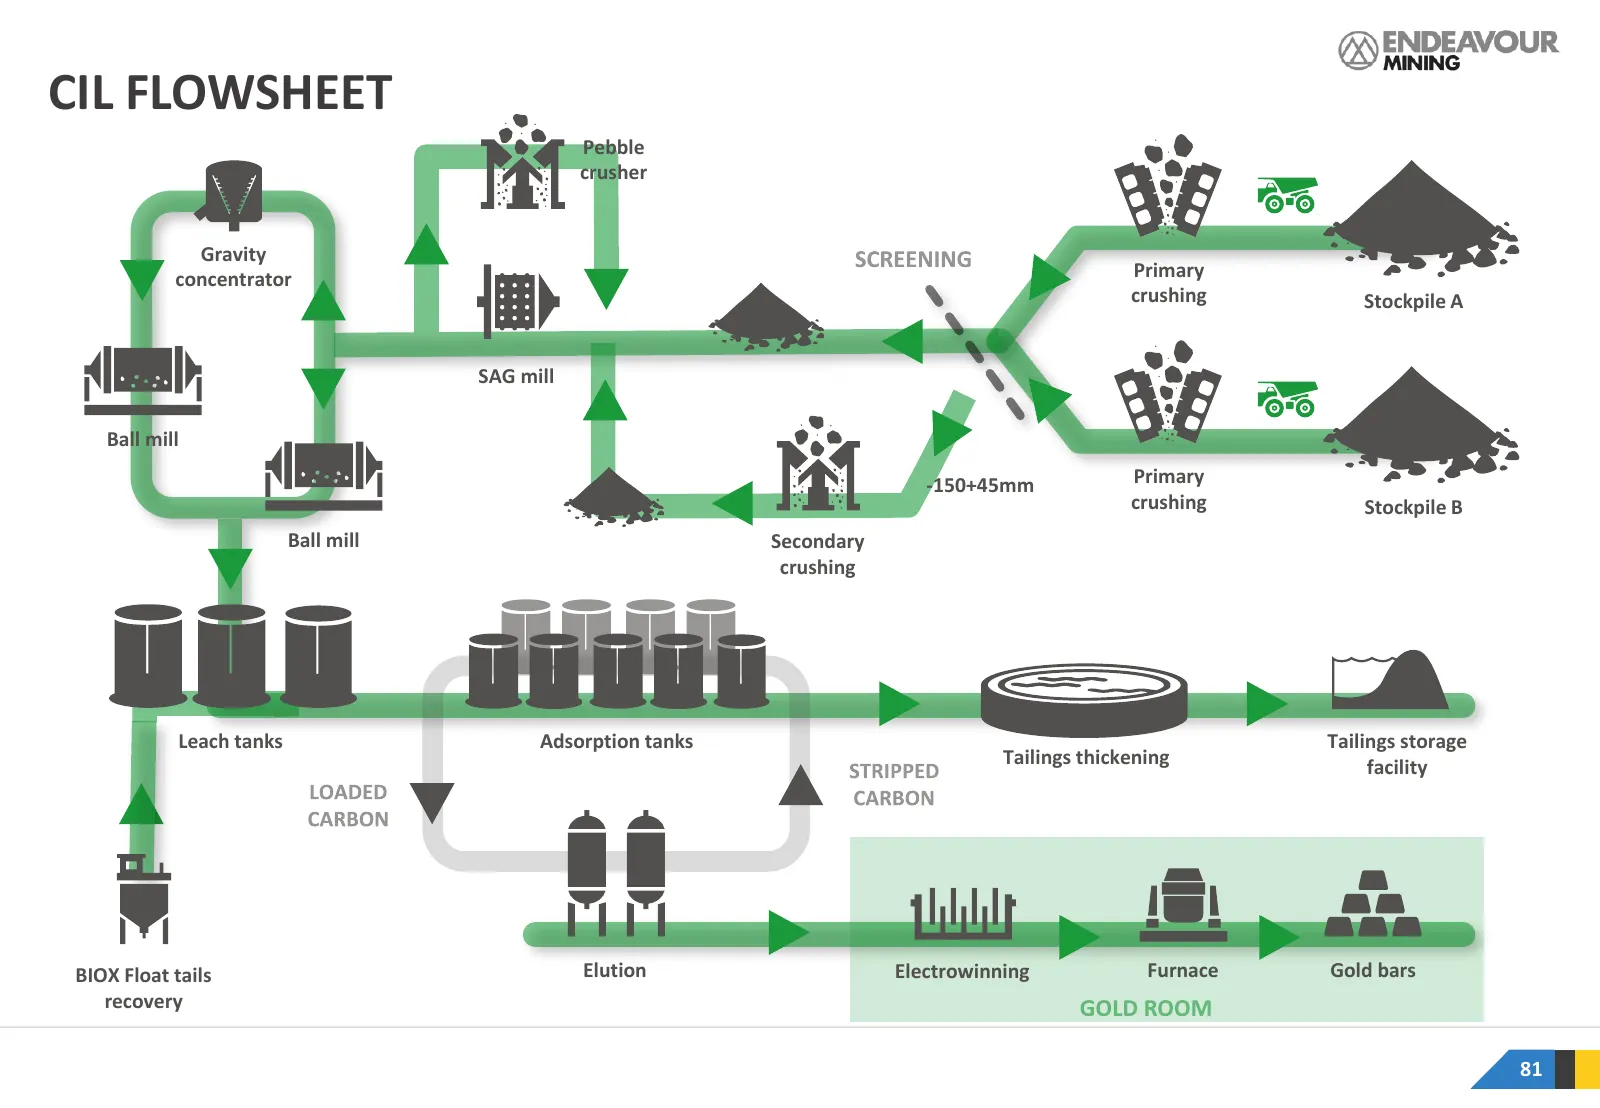
Slide 81: CIL Flowsheet
CIL FLOWSHEET Pebble crusher Gravity concentrator Primary crushing Stockpile A SAG mill Ball mill -150+45mm Primary crushing Stockpile B Ball mill Secondary crushing Leach tanks Adsorption tanks Tailings storage Tailings thickening facility BIOX Float tails Elution Electrowinning Furnace Gold bars r
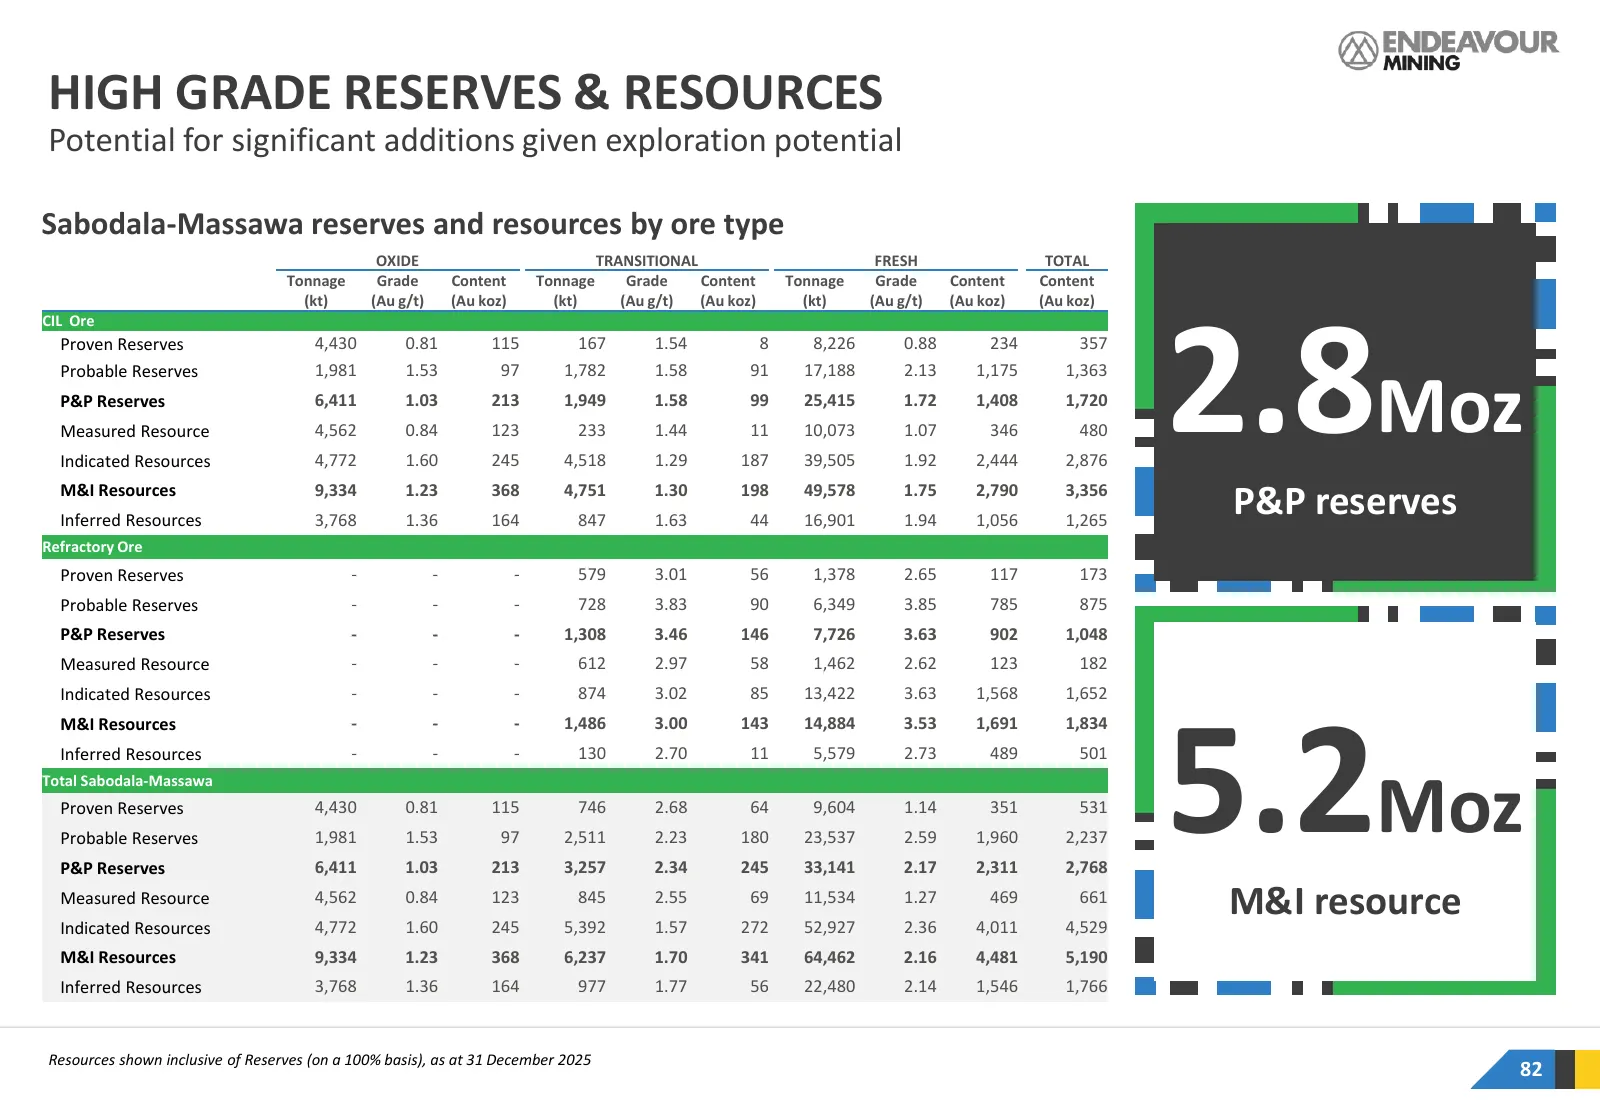
Slide 82: High Grade Reserves & Resources
HIGH GRADE RESERVES & RESOURCES Potential for significant additions given exploration potential Sabodala-Massawa reserves and resources by ore type OXIDE TRANSITIONAL FRESH TOTAL Tonnage Grade Content Tonnage Grade Content Tonnage Grade Content Content (kt) (Au g/t) (Au koz) (kt) (Au g/t) (Au koz) (
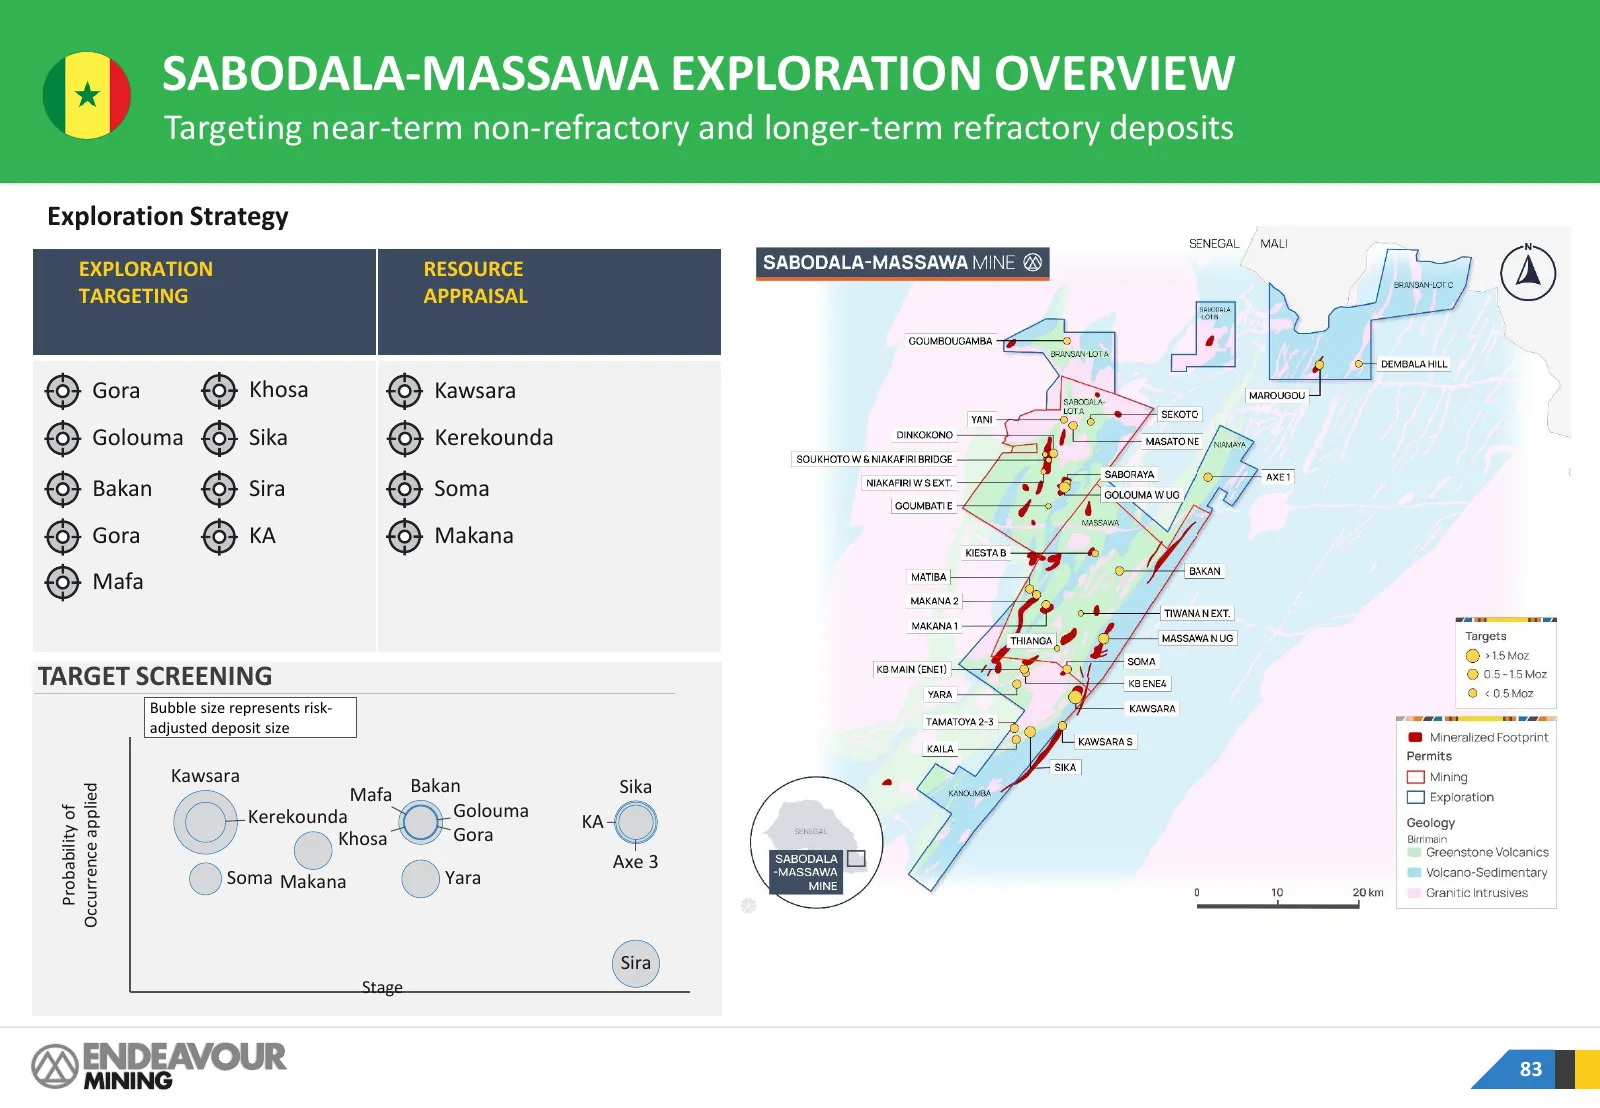
Slide 83: Sabodala-Massawa Exploration Overview
SABODALA-MASSAWA EXPLORATION OVERVIEW Targeting near-term non-refractory and longer-term refractory deposits Exploration Strategy EXPLORATION RESOURCE TARGETING APPRAISAL Gora Khosa Kawsara Golouma Sika Kerekounda Bakan Sira Soma Gora KA Makana Mafa TARGET SCREENING Bubble size represents risk- adju
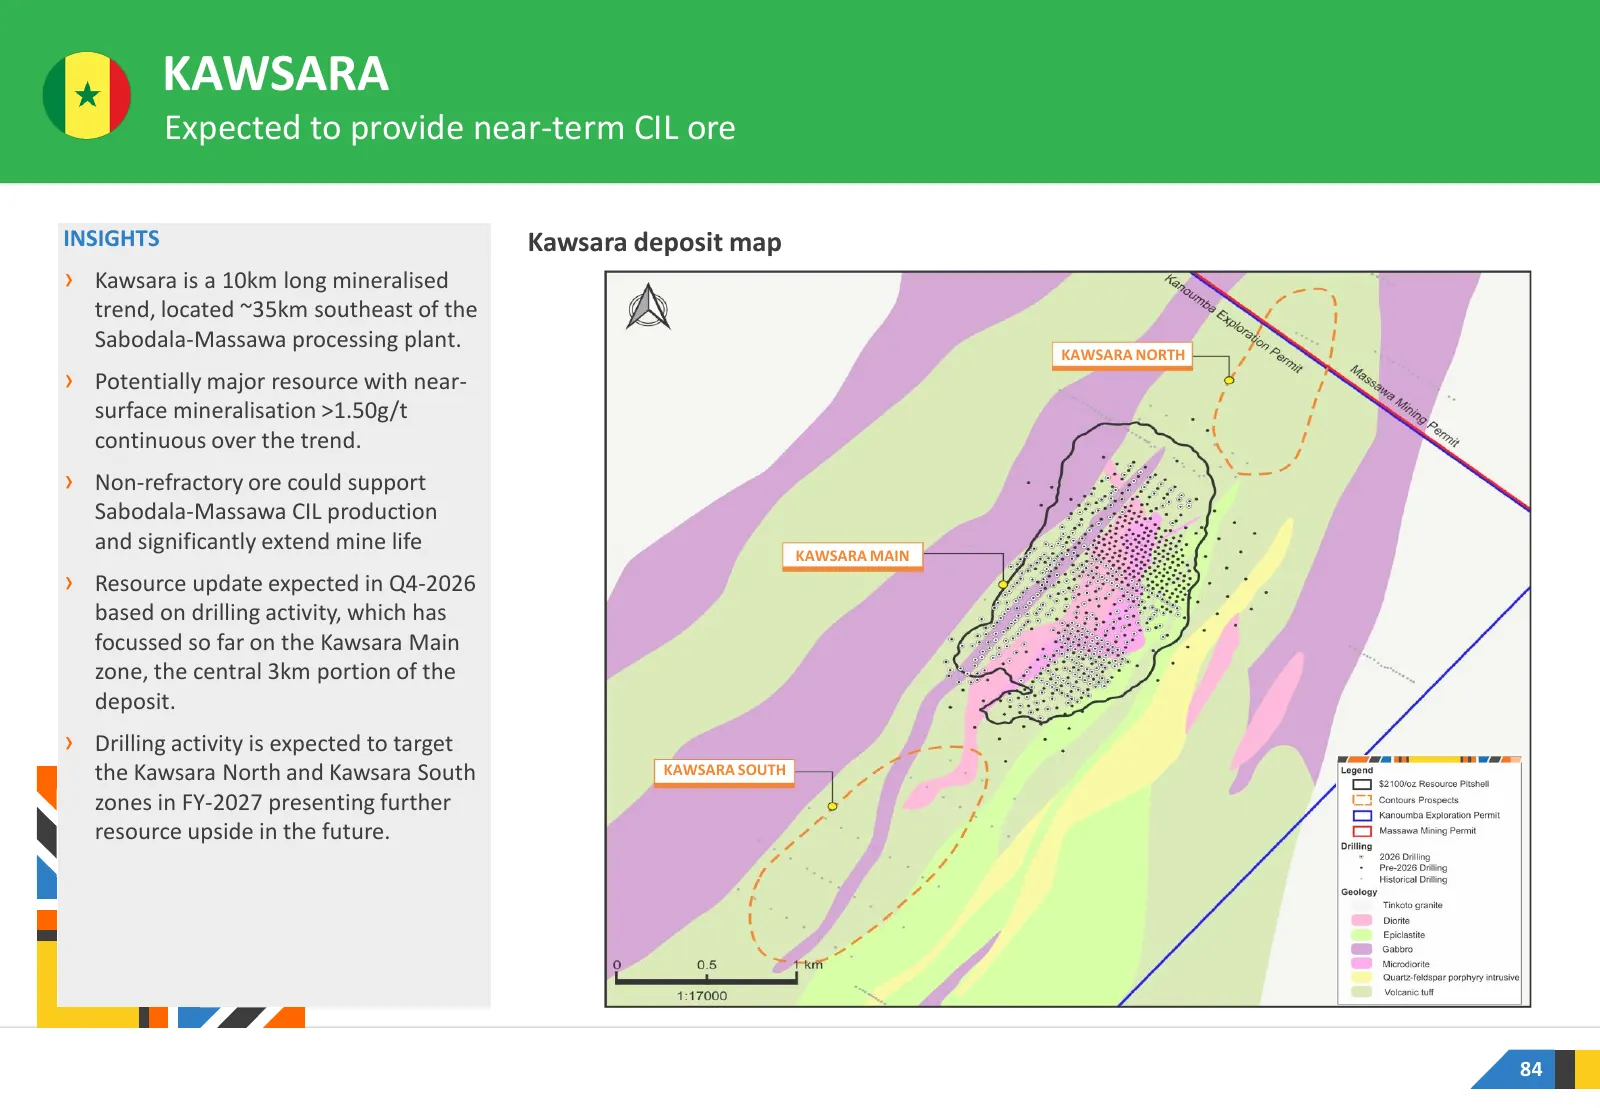
Slide 84: Kawsara
KAWSARA Expected to provide near-term CIL ore INSIGHTS Kawsara deposit map › Kawsara is a 10km long mineralised trend, located ~35km southeast of the Sabodala-Massawa processing plant. KAWSARA NORTH › Potentially major resource with near- surface mineralisation >1.50g/t continuous over the trend. ›
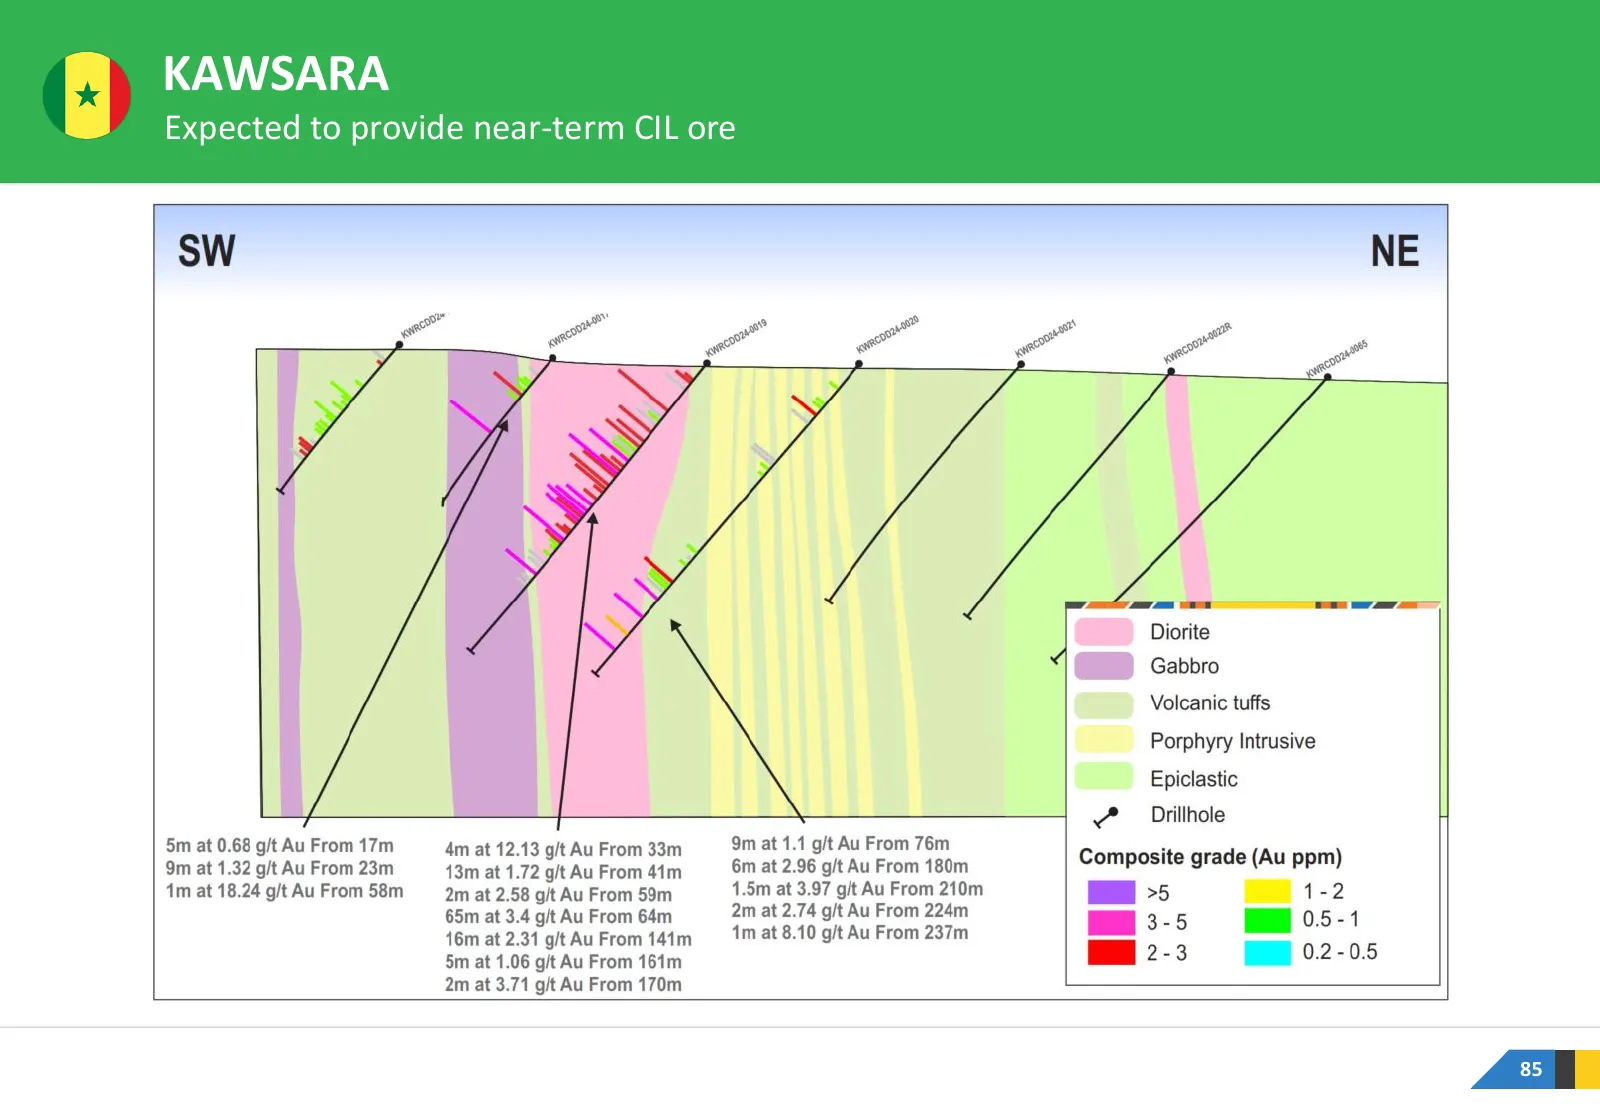
Slide 85: Kawsara
KAWSARA Expected to provide near-term CIL ore 85
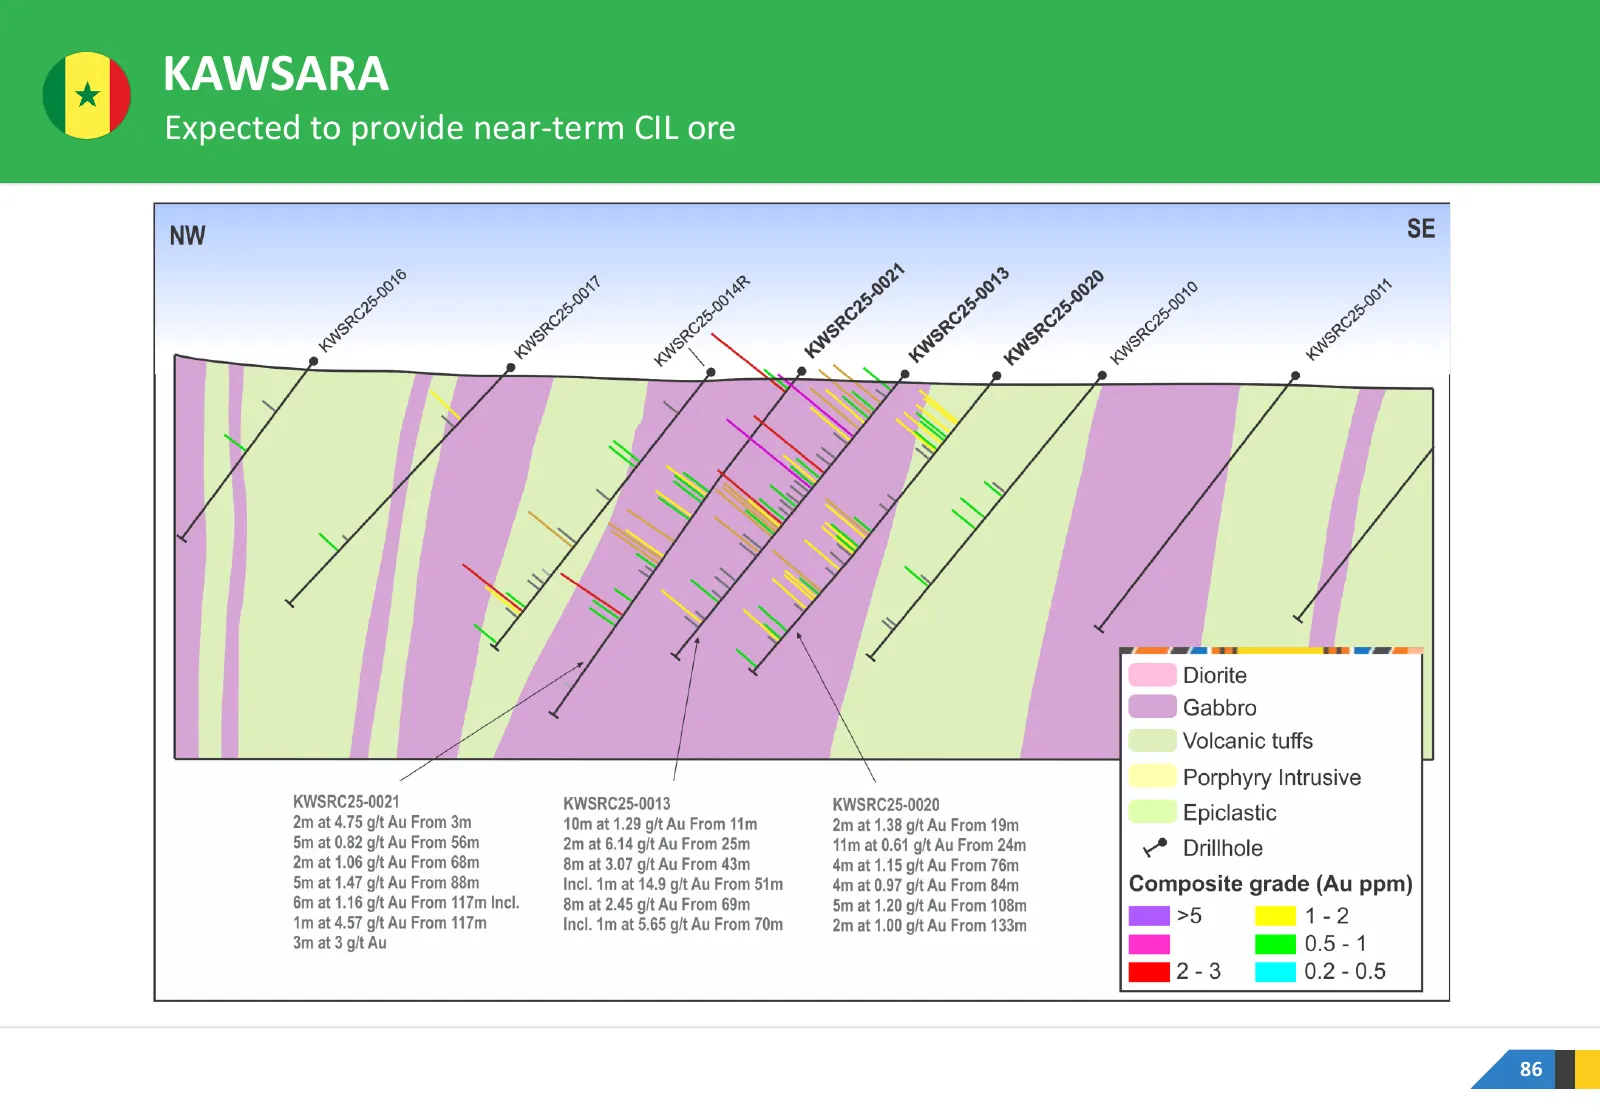
Slide 86: Kawsara
KAWSARA Expected to provide near-term CIL ore 86
Slide 87: Makana
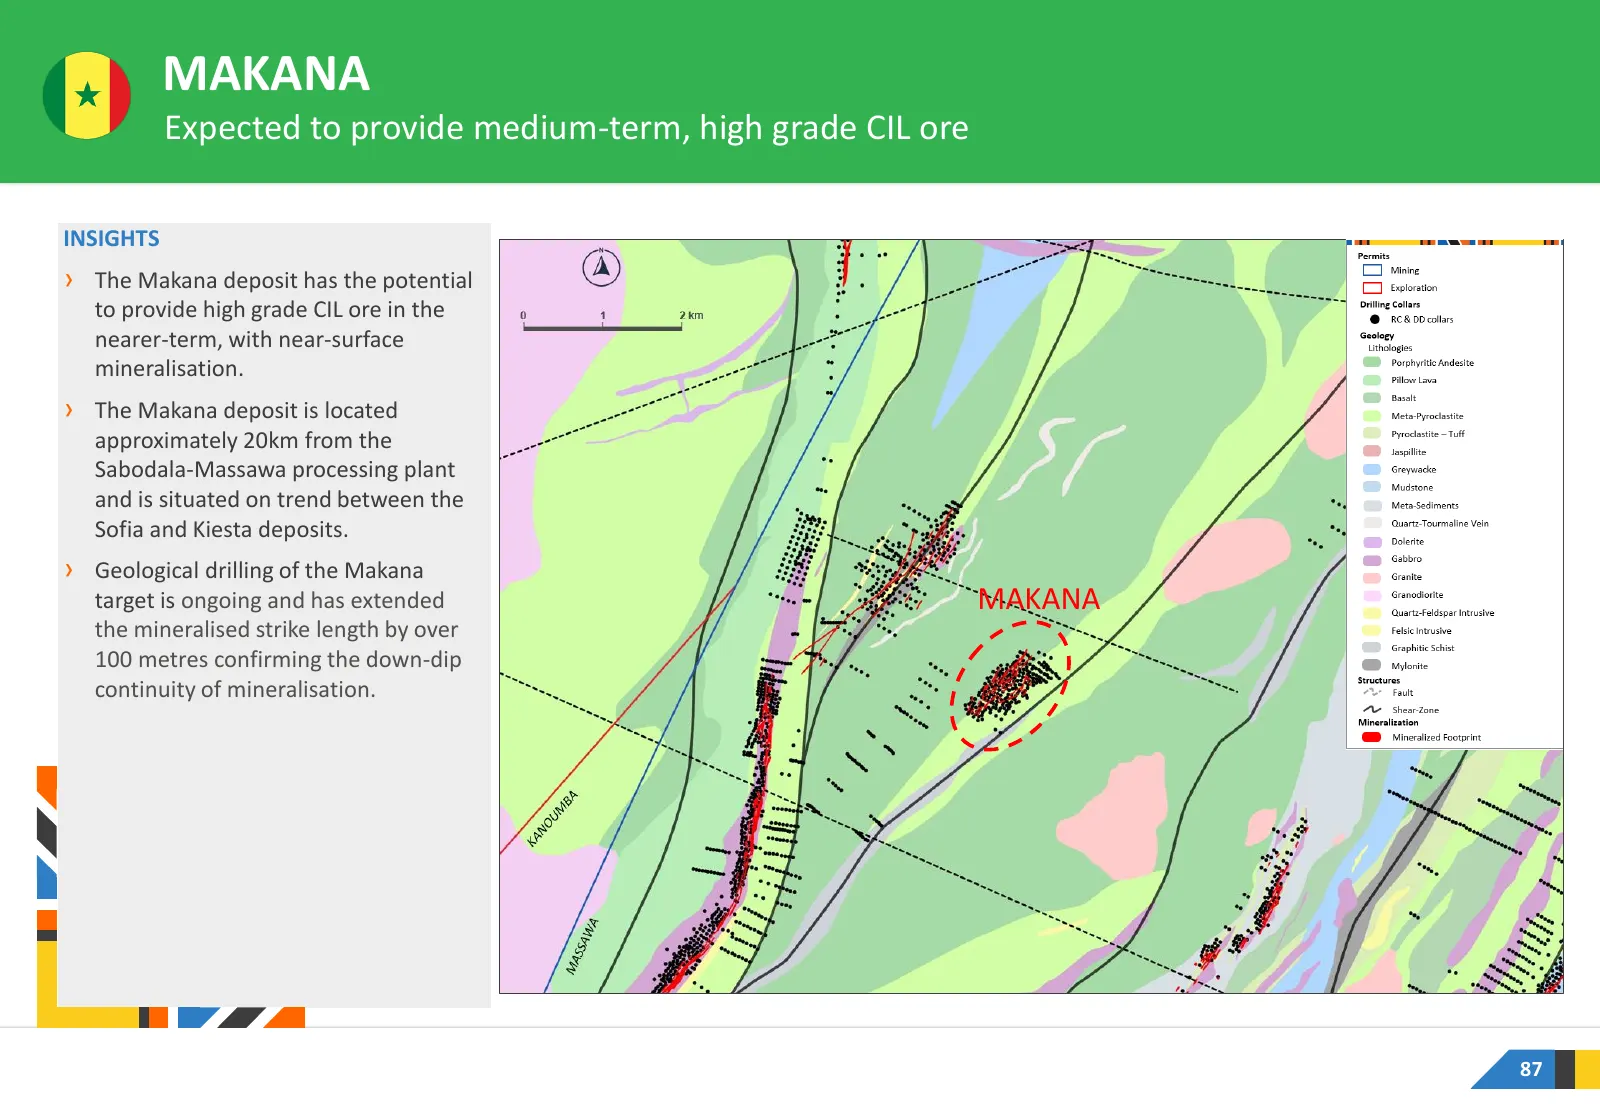
MAKANA Expected to provide medium-term, high grade CIL ore INSIGHTS › The Makana deposit has the potential to provide high grade CIL ore in the nearer-term, with near-surface mineralisation. › The Makana deposit is located approximately 20km from the Sabodala-Massawa processing plant and is situated
Slide 88: Lafigué Mine
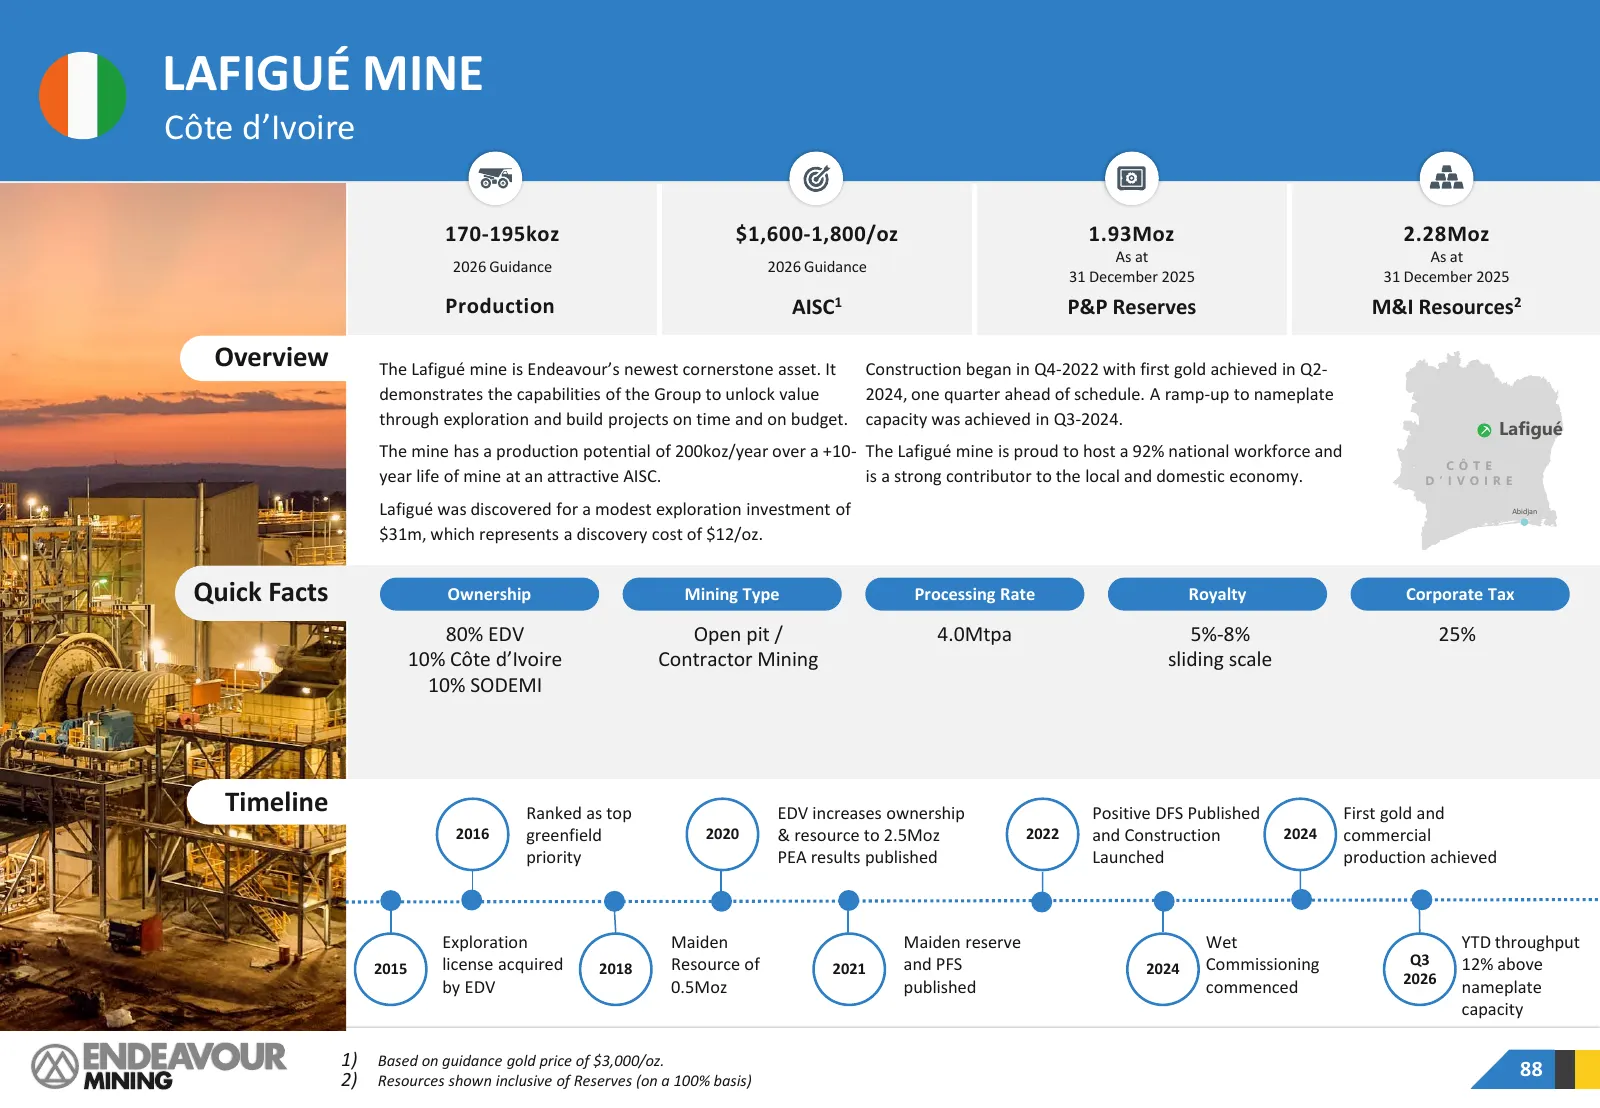
LAFIGUÉ MINE Côte d’Ivoire 170-195koz $1,600-1,800/oz 1.93Moz 2.28Moz As at As at 2026 Guidance 2026 Guidance 31 December 2025 31 December 2025 Production AISC1 P&P Reserves M&I Resources2 Overview The Lafigué mine is Endeavour’s newest cornerstone asset. It Construction began in Q4-2022 with first
Slide 89: Lafigué Mine
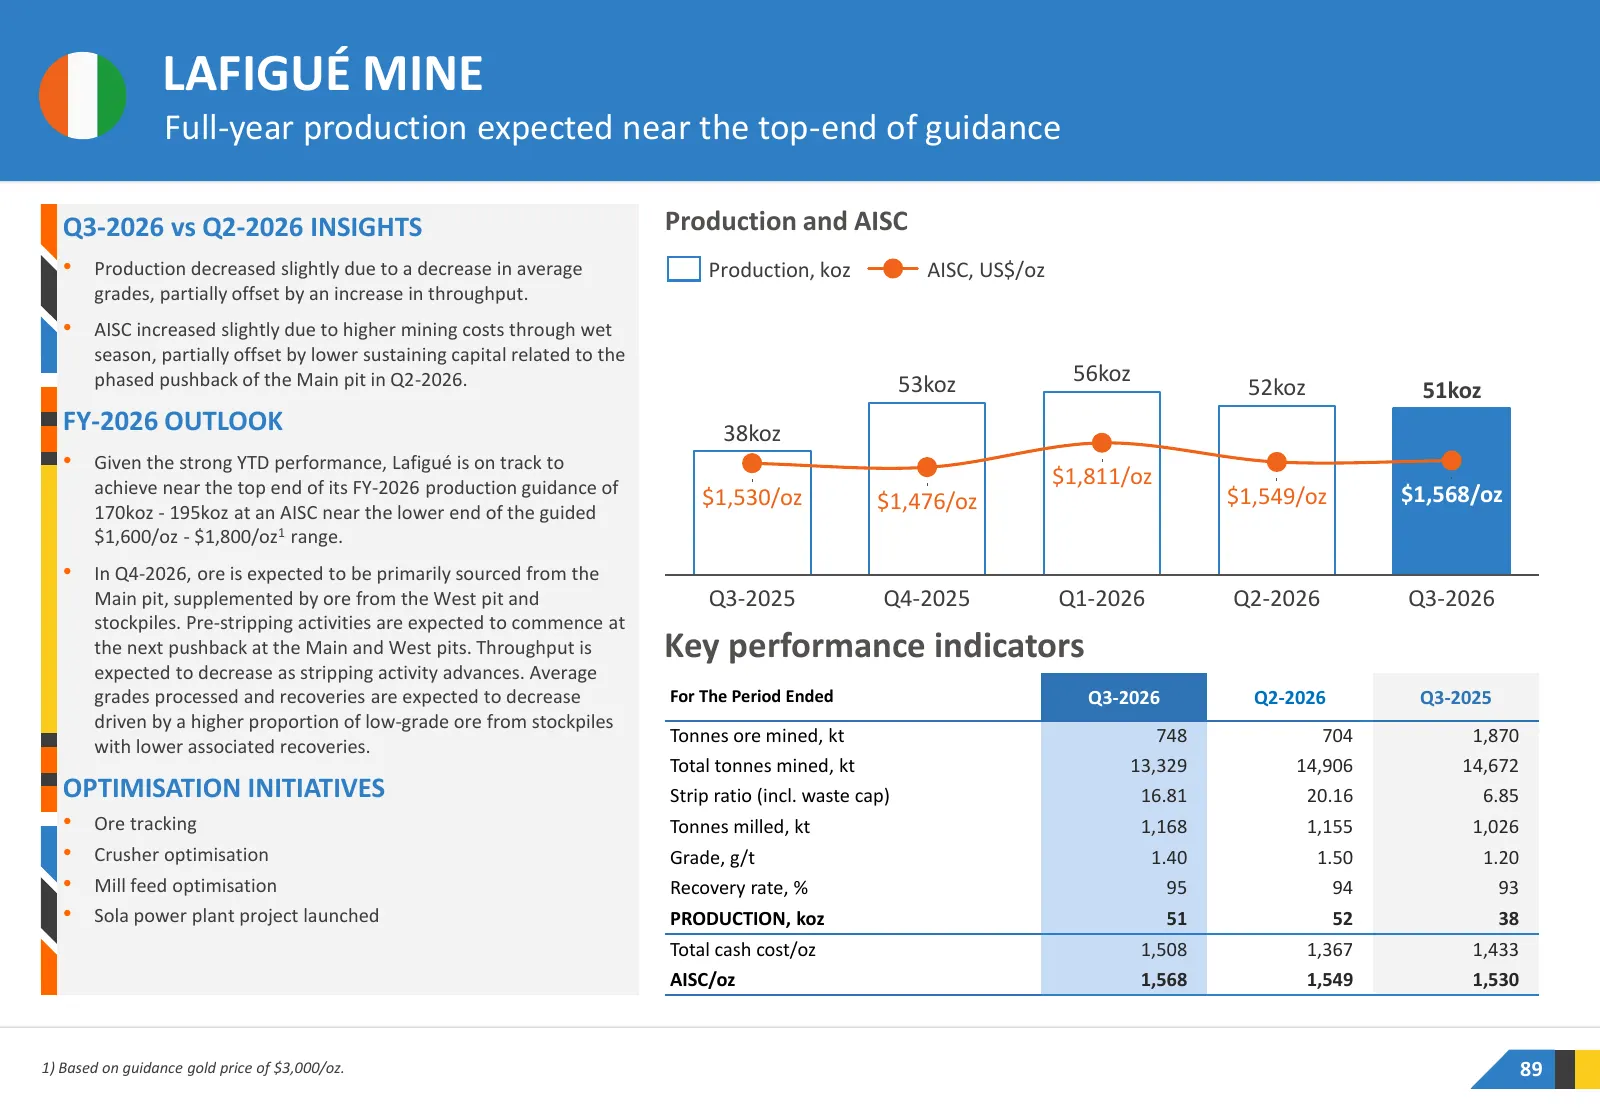
LAFIGUÉ MINE Full-year production expected near the top-end of guidance Q3-2026 vs Q2-2026 INSIGHTS Production and AISC • Production decreased slightly due to a decrease in average Production, koz AISC, US$/oz grades, partially offset by an increase in throughput. • AISC increased slightly due to hi
Slide 90: Lafigué Exploration Overview
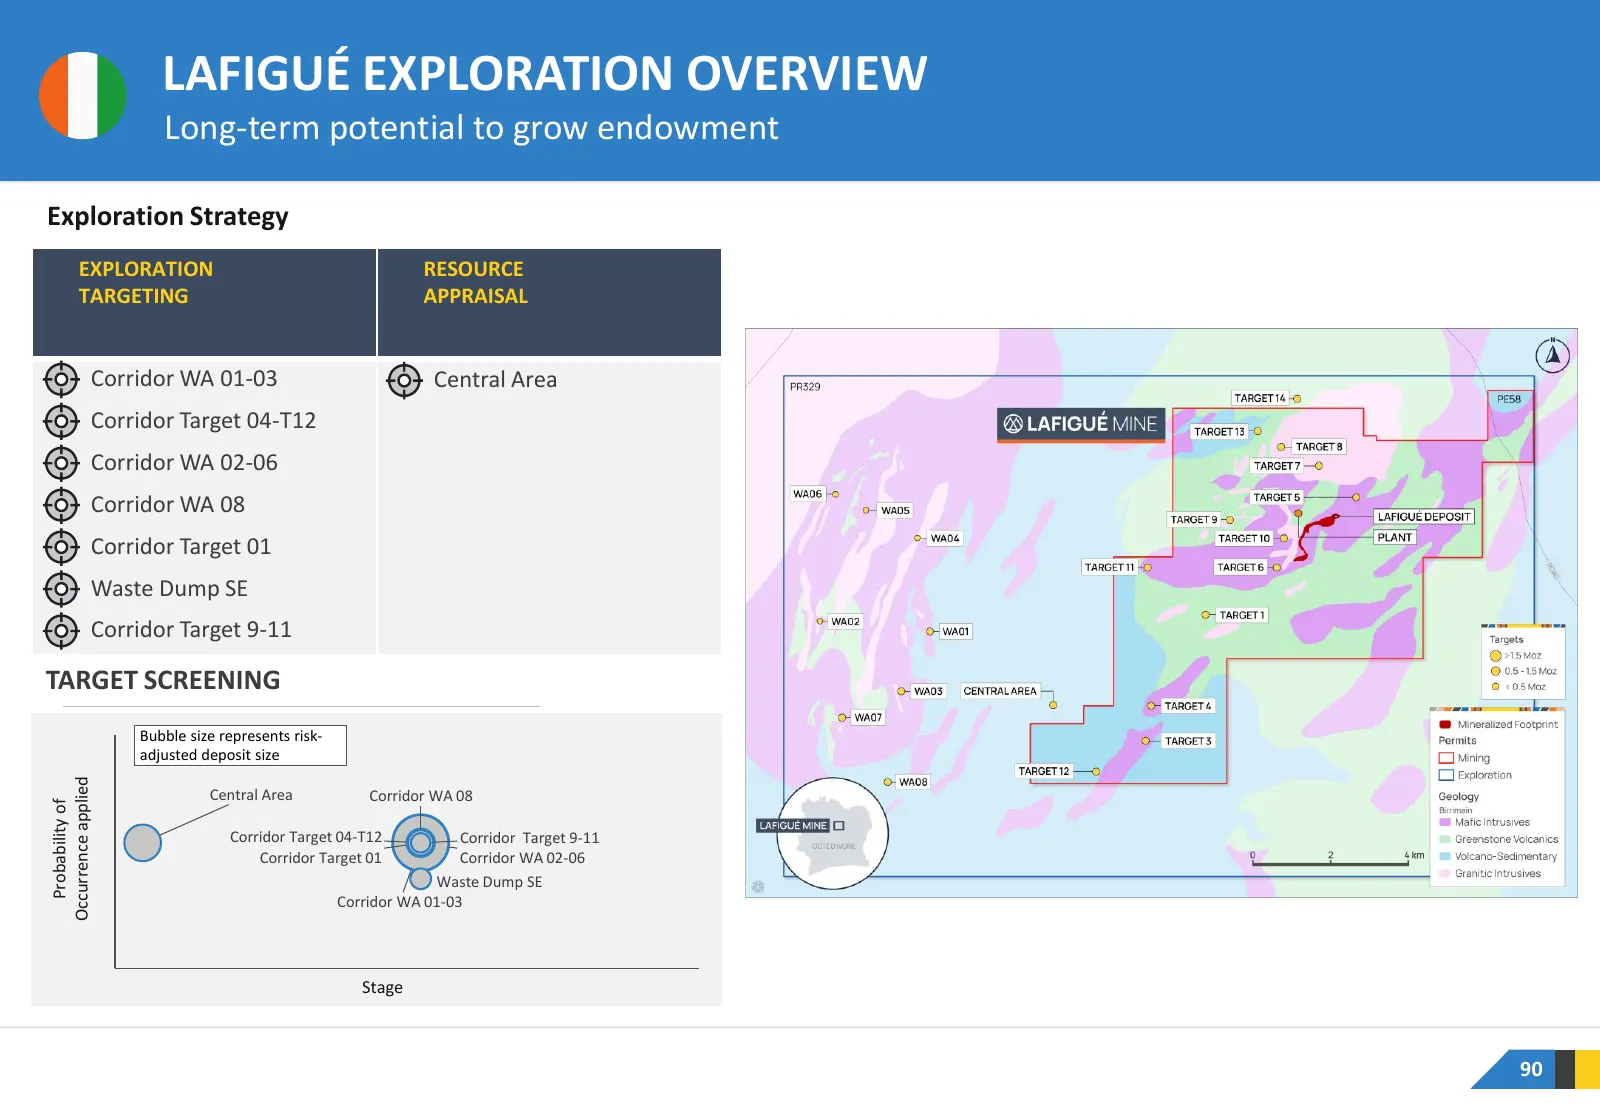
LAFIGUÉ EXPLORATION OVERVIEW Long-term potential to grow endowment Exploration Strategy EXPLORATION RESOURCE TARGETING APPRAISAL Corridor WA 01-03 Central Area Corridor Target 04-T12 Corridor WA 02-06 Corridor WA 08 Corridor Target 01 Waste Dump SE Corridor Target 9-11 TARGET SCREENING Bubble size r
Slide 91: Assafou Project
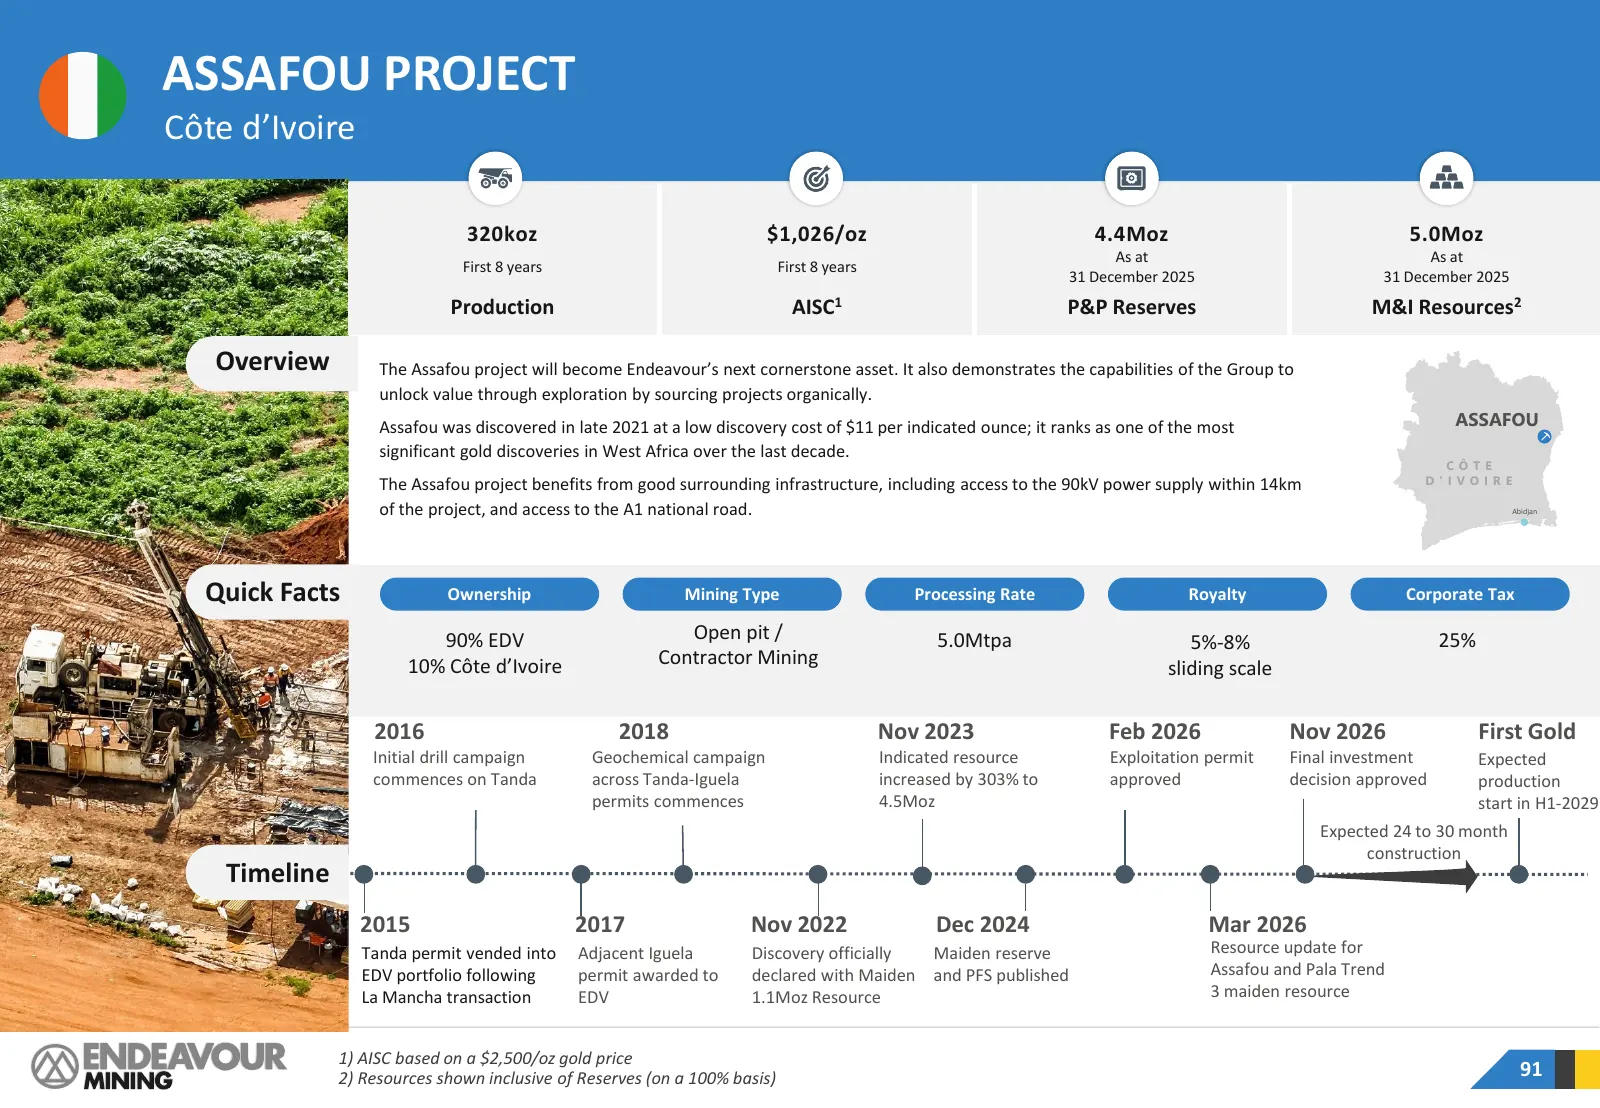
ASSAFOU PROJECT Côte d’Ivoire 320koz $1,026/oz 4.4Moz 5.0Moz As at As at First 8 years First 8 years 31 December 2025 31 December 2025 Production AISC1 P&P Reserves M&I Resources2 Overview The Assafou project will become Endeavour’s next cornerstone asset. It also demonstrates the capabilities of th
Slide 92: Assafou: Endeavour's Next Cornerstone Asset
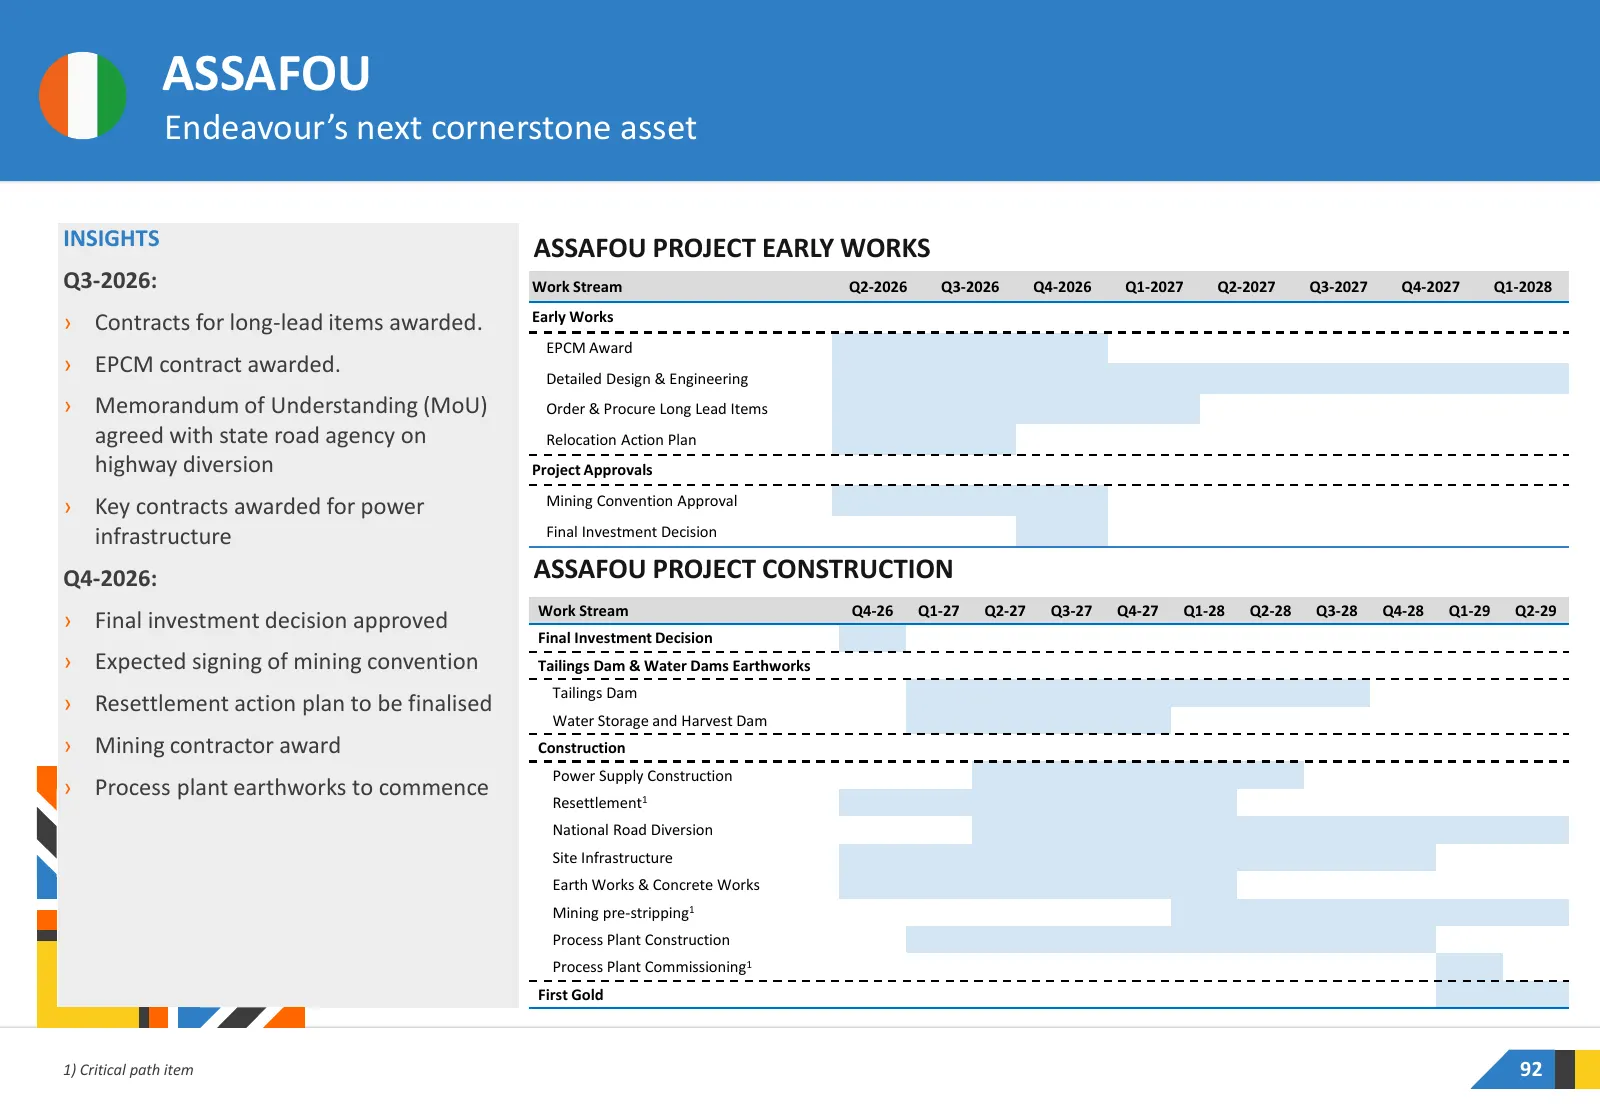
ASSAFOU Endeavour’s next cornerstone asset INSIGHTS ASSAFOU PROJECT EARLY WORKS Q3-2026: Work Stream Q2-2026 Q3-2026 Q4-2026 Q1-2027 Q2-2027 Q3-2027 Q4-2027 Q1-2028 › Contracts for long-lead items awarded. Early Works EPCM Award › EPCM contract awarded. Detailed Design & Engineering › Memorandum of
Slide 93: Assafou Project Capital Cost Estimate
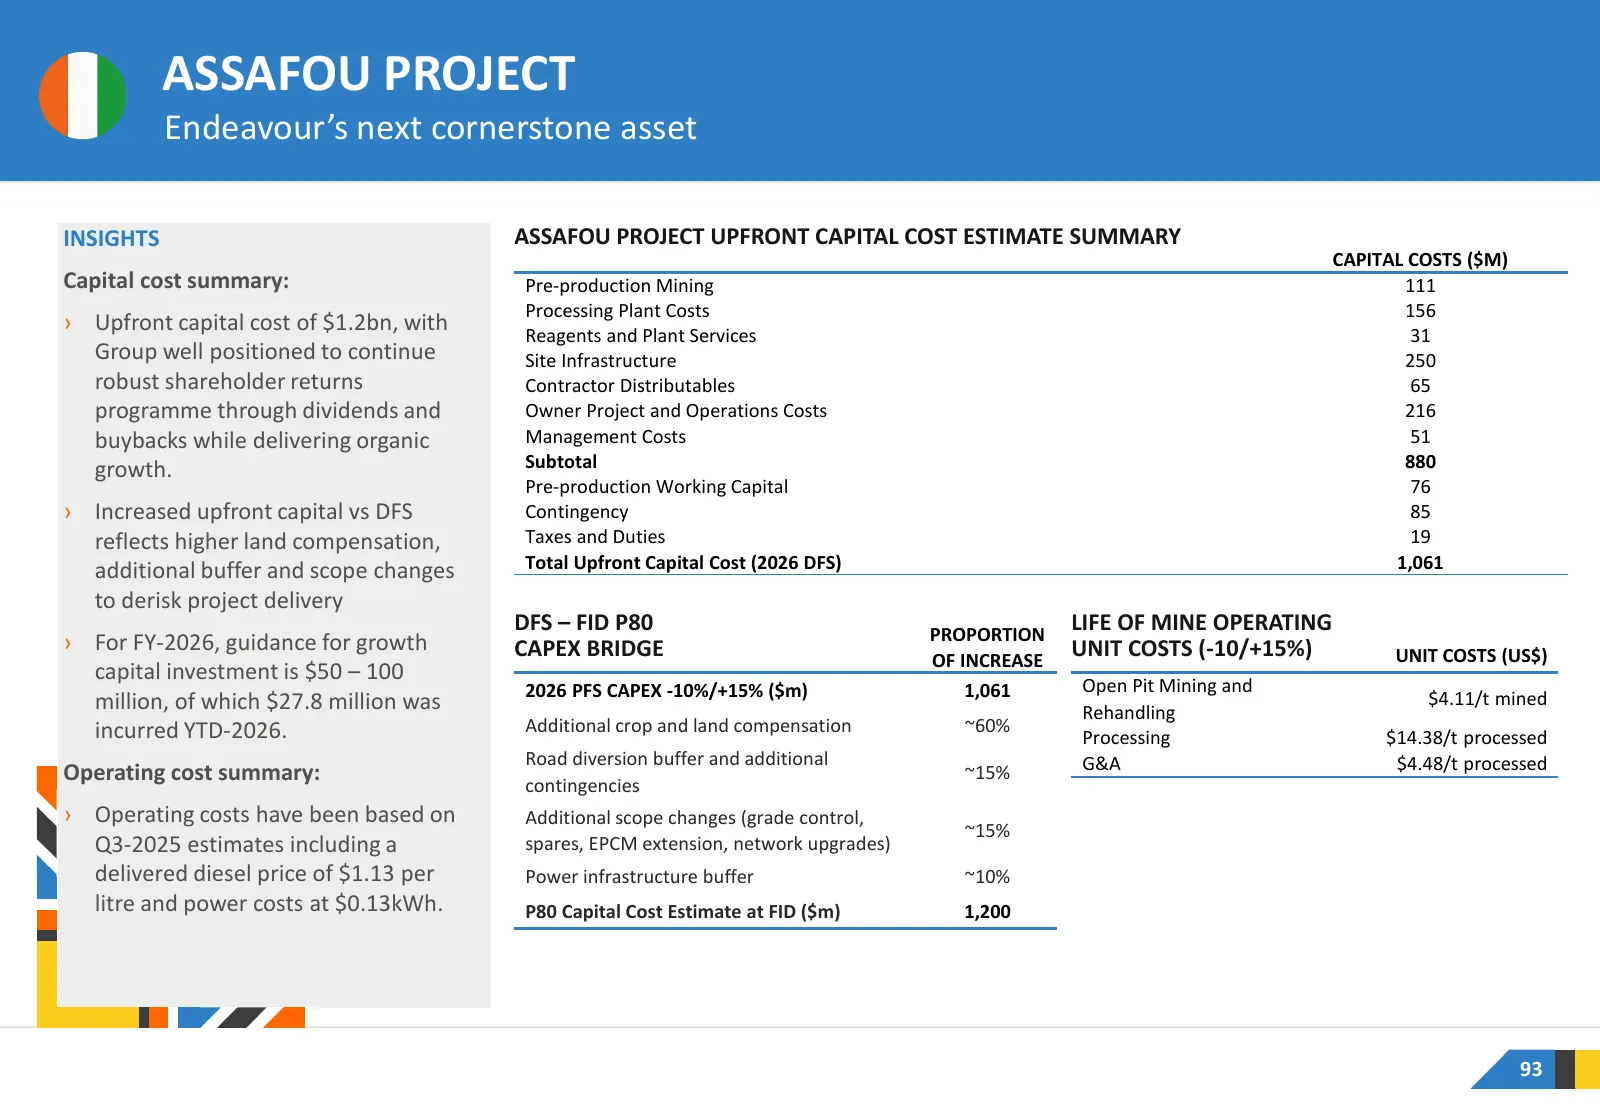
ASSAFOU PROJECT Endeavour’s next cornerstone asset INSIGHTS ASSAFOU PROJECT UPFRONT CAPITAL COST ESTIMATE SUMMARY CAPITAL COSTS ($M) Capital cost summary: Pre-production Mining 111 Processing Plant Costs 156 › Upfront capital cost of $1.2bn, with Reagents and Plant Services 31 Group well positioned
Slide 94: Assafou Project DFS
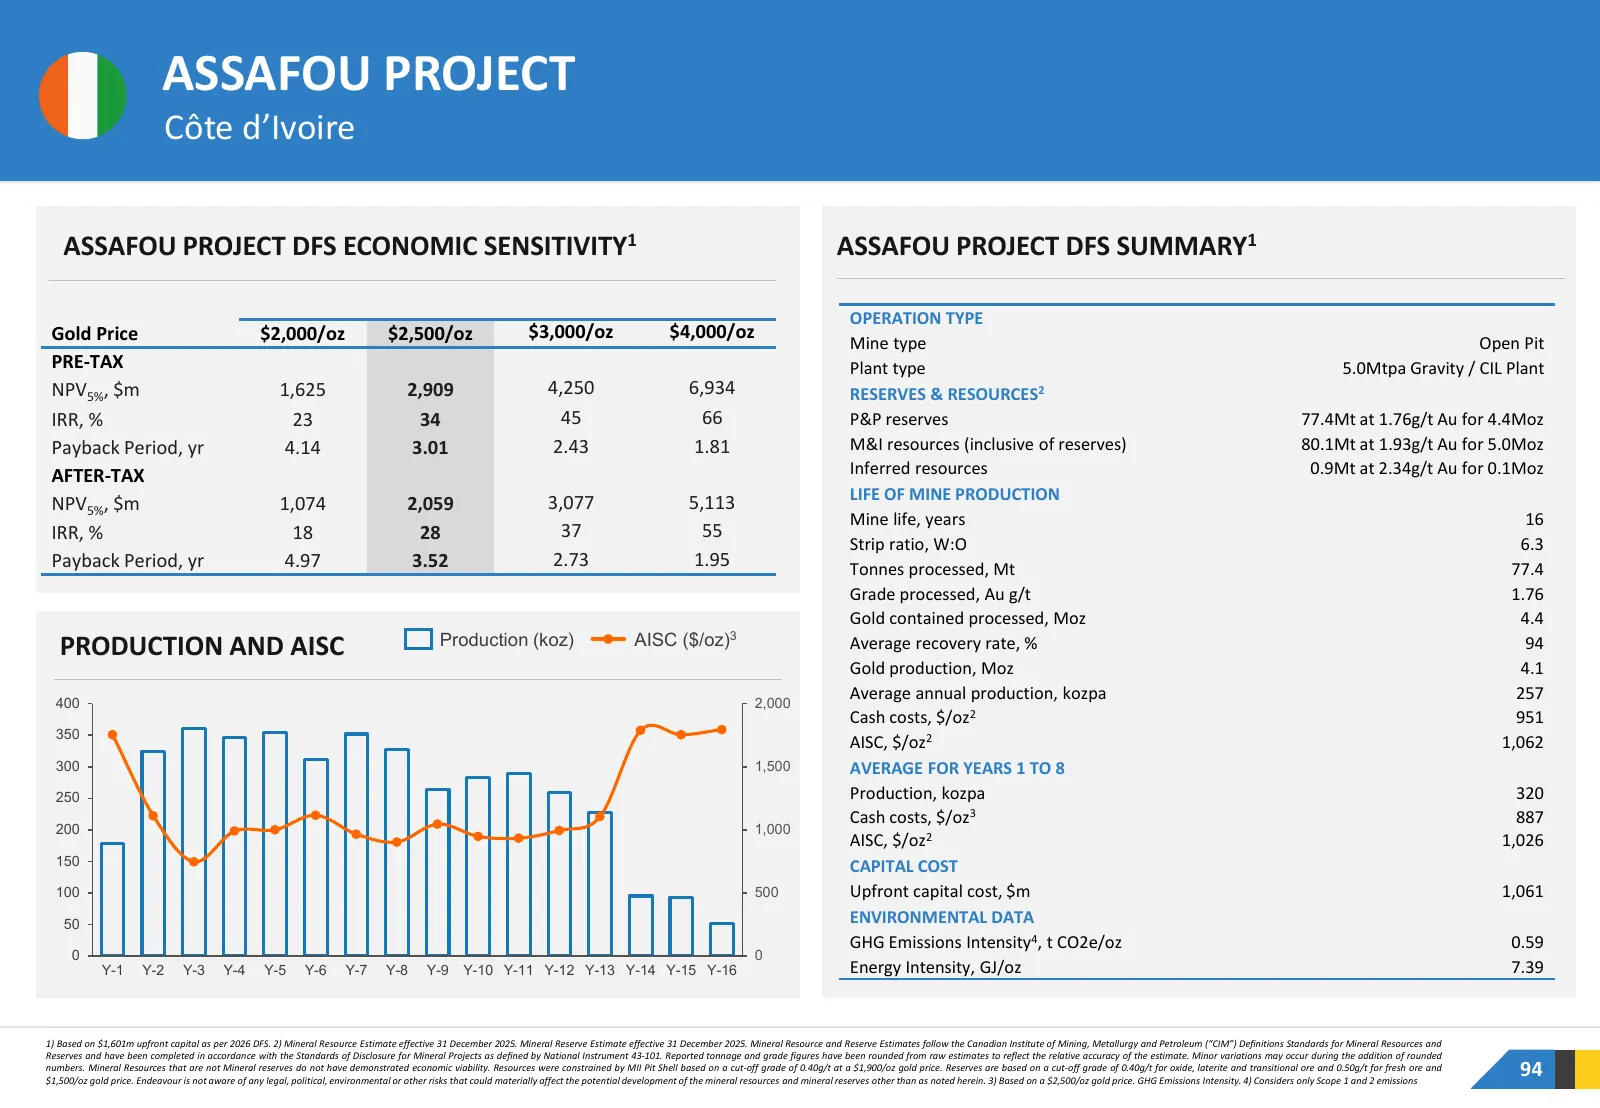
ASSAFOU PROJECT Côte d’Ivoire ASSAFOU PROJECT DFS ECONOMIC SENSITIVITY1 ASSAFOU PROJECT DFS SUMMARY1 OPERATION TYPE Gold Price $2,000/oz $2,500/oz $3,000/oz $4,000/oz Mine type Open Pit PRE-TAX Plant type 5.0Mtpa Gravity / CIL Plant NPV5%, $m 1,625 2,909 4,250 6,934 RESERVES & RESOURCES2 IRR, % 23 3
Slide 95: Assafou Exploration Overview
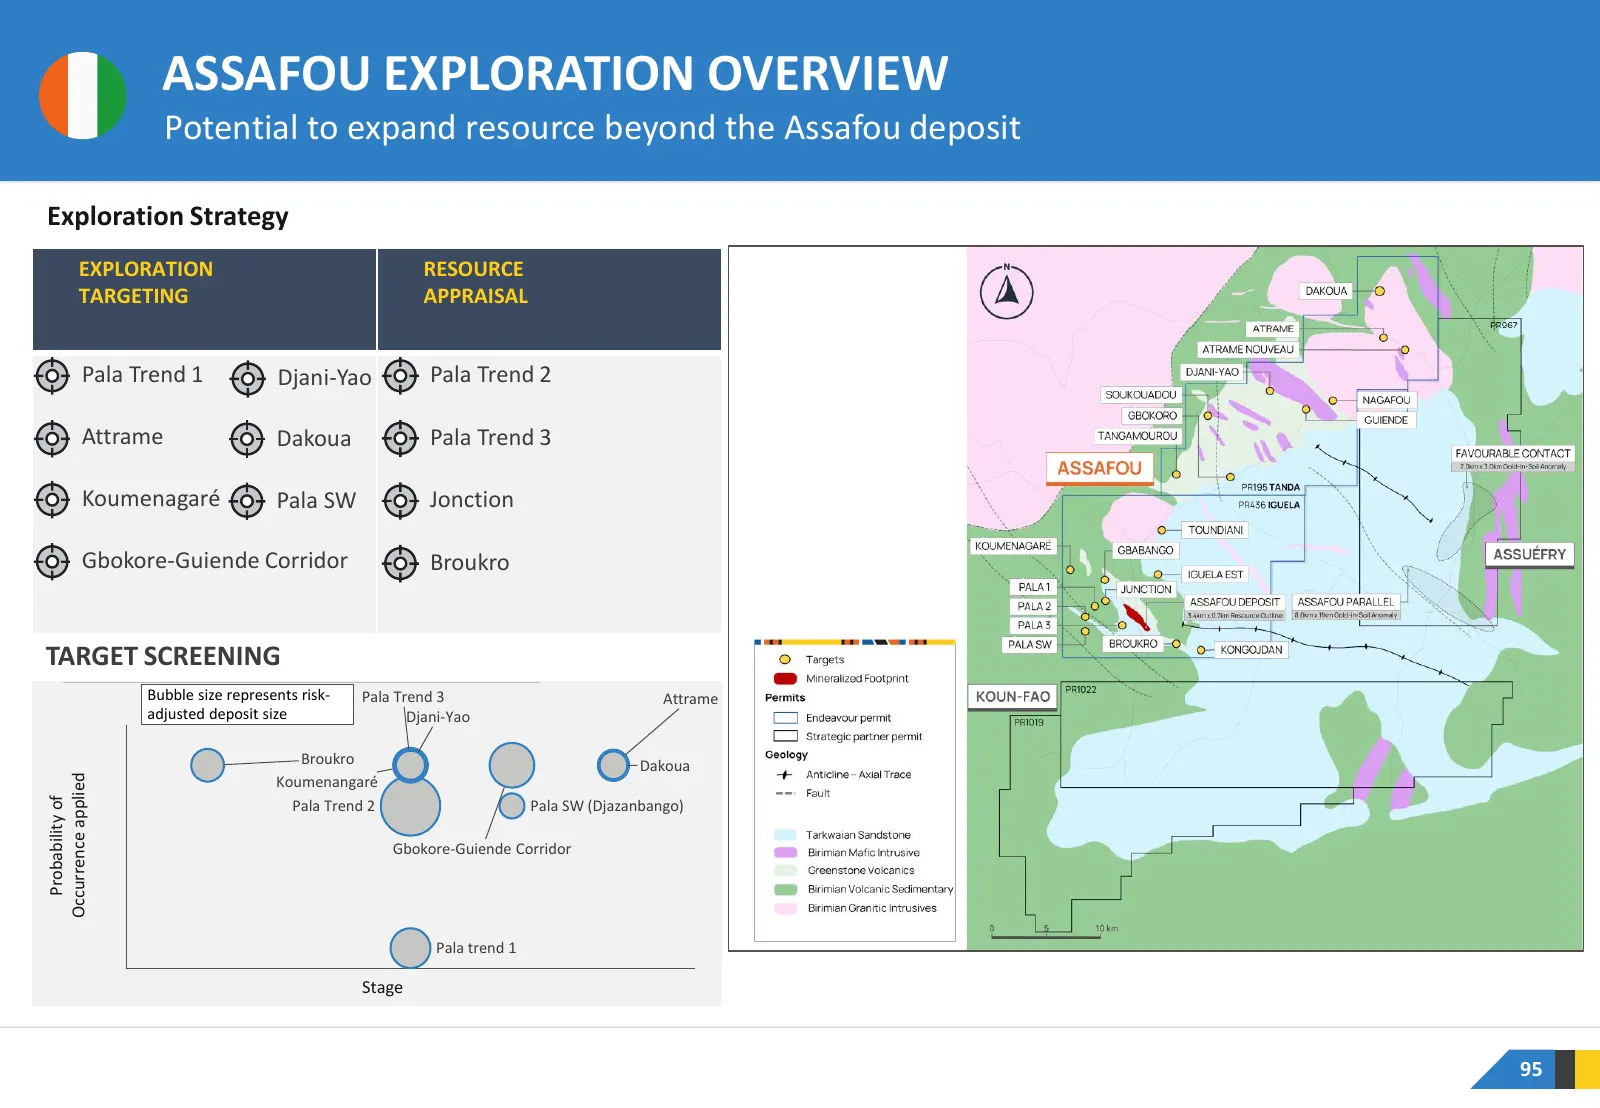
ASSAFOU EXPLORATION OVERVIEW Potential to expand resource beyond the Assafou deposit Exploration Strategy EXPLORATION RESOURCE TARGETING APPRAISAL Pala Trend 1 Djani-Yao Pala Trend 2 Attrame Dakoua Pala Trend 3 Koumenagaré Pala SW Jonction Gbokore-Guiende Corridor Broukro TARGET SCREENING Bubble siz
Slide 96: Assafou: Resource Growth
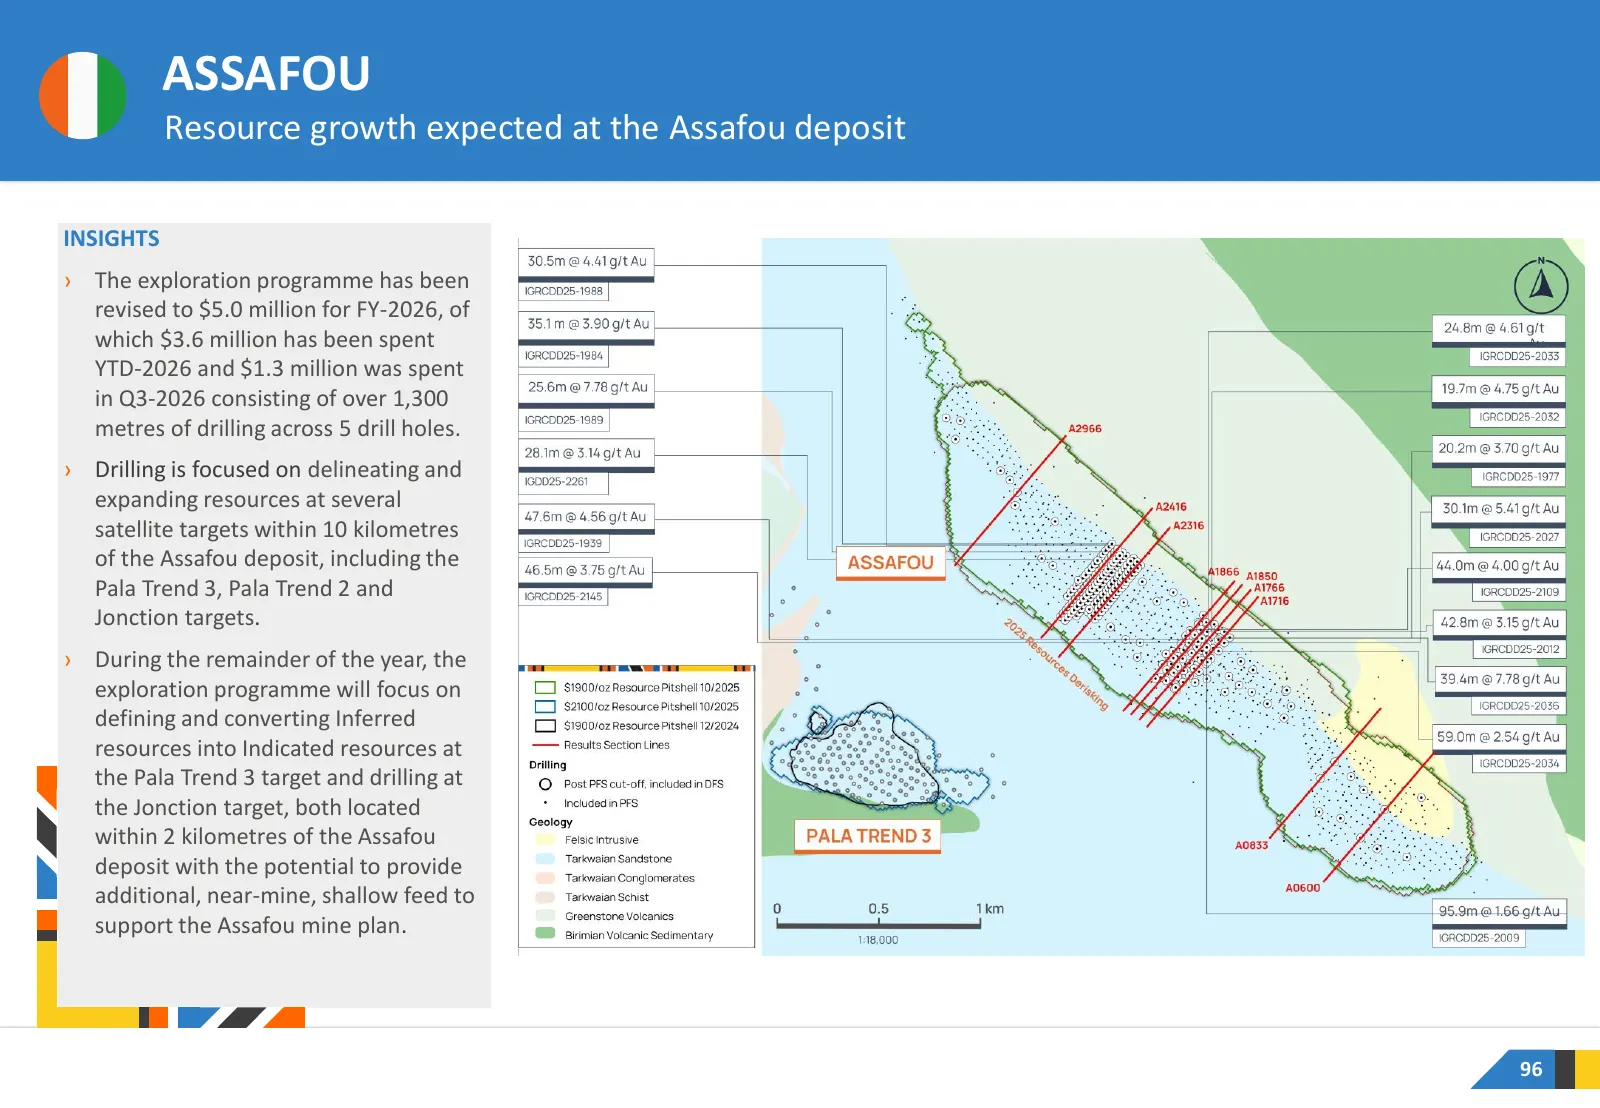
ASSAFOU Resource growth expected at the Assafou deposit INSIGHTS › The exploration programme has been revised to $5.0 million for FY-2026, of which $3.6 million has been spent YTD-2026 and $1.3 million was spent in Q3-2026 consisting of over 1,300 metres of drilling across 5 drill holes. › Drilling
Slide 97: Assafou Cross Section A0600
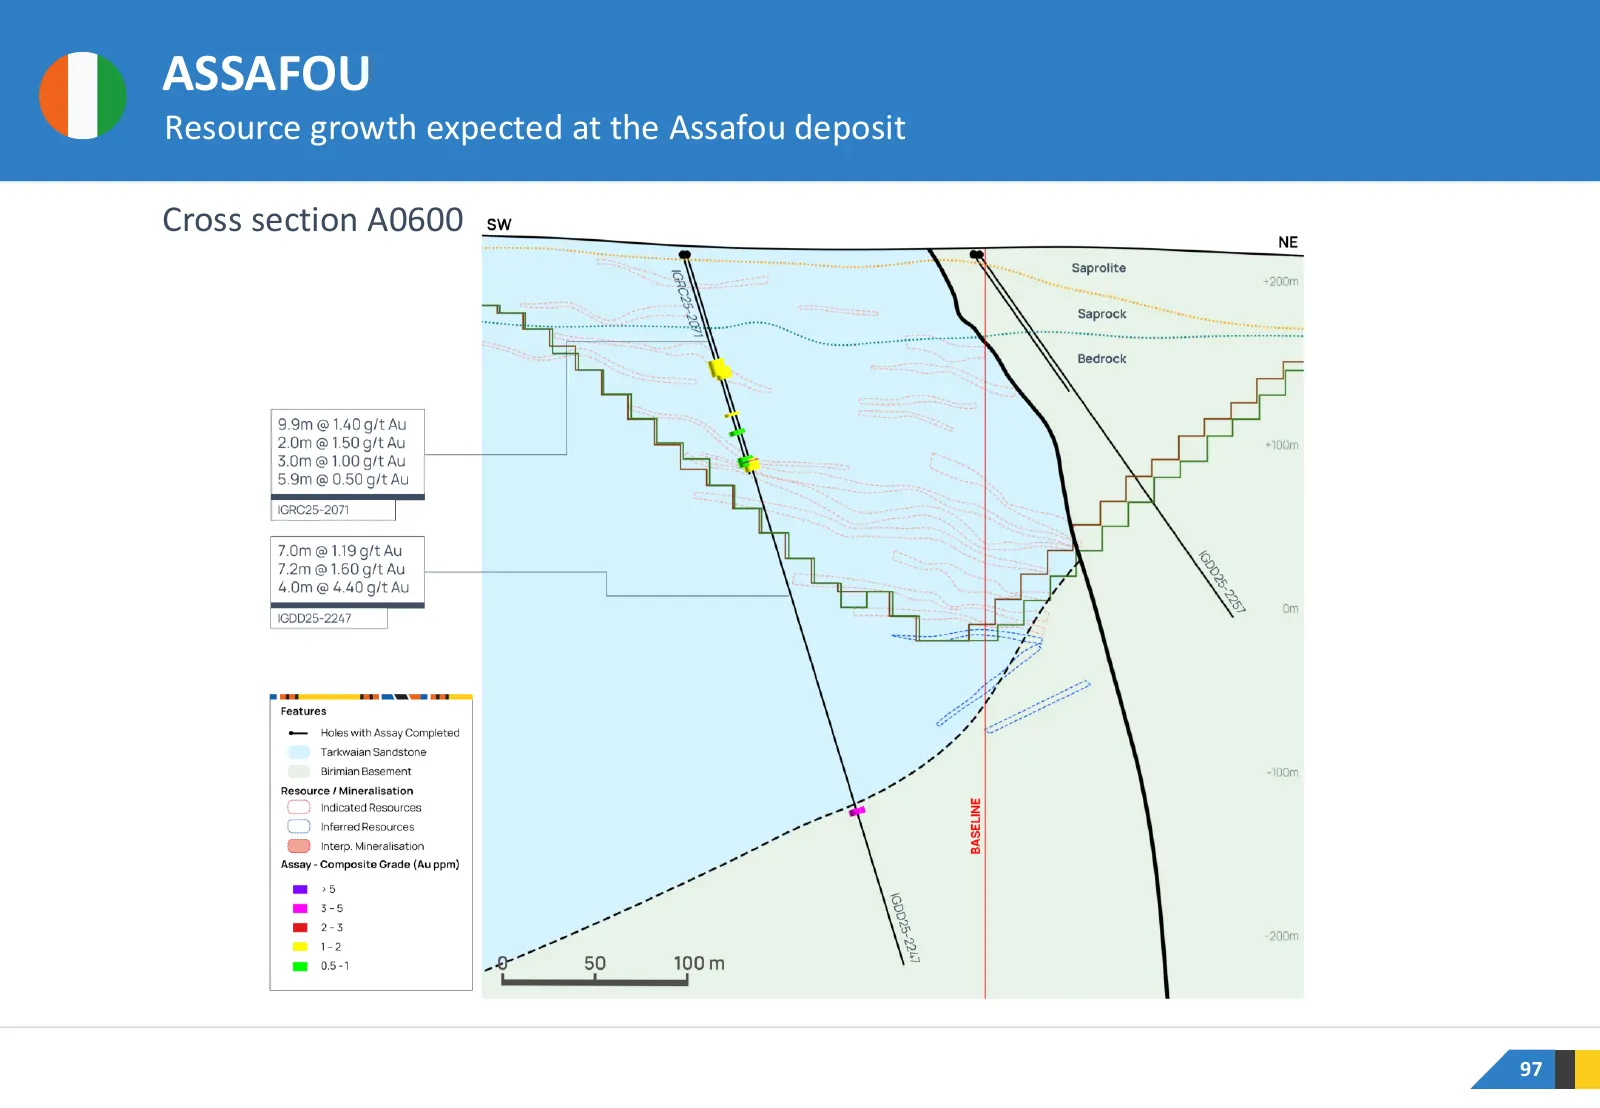
ASSAFOU Resource growth expected at the Assafou deposit Cross section A0600 97
Slide 98: Assafou Cross Section A0833
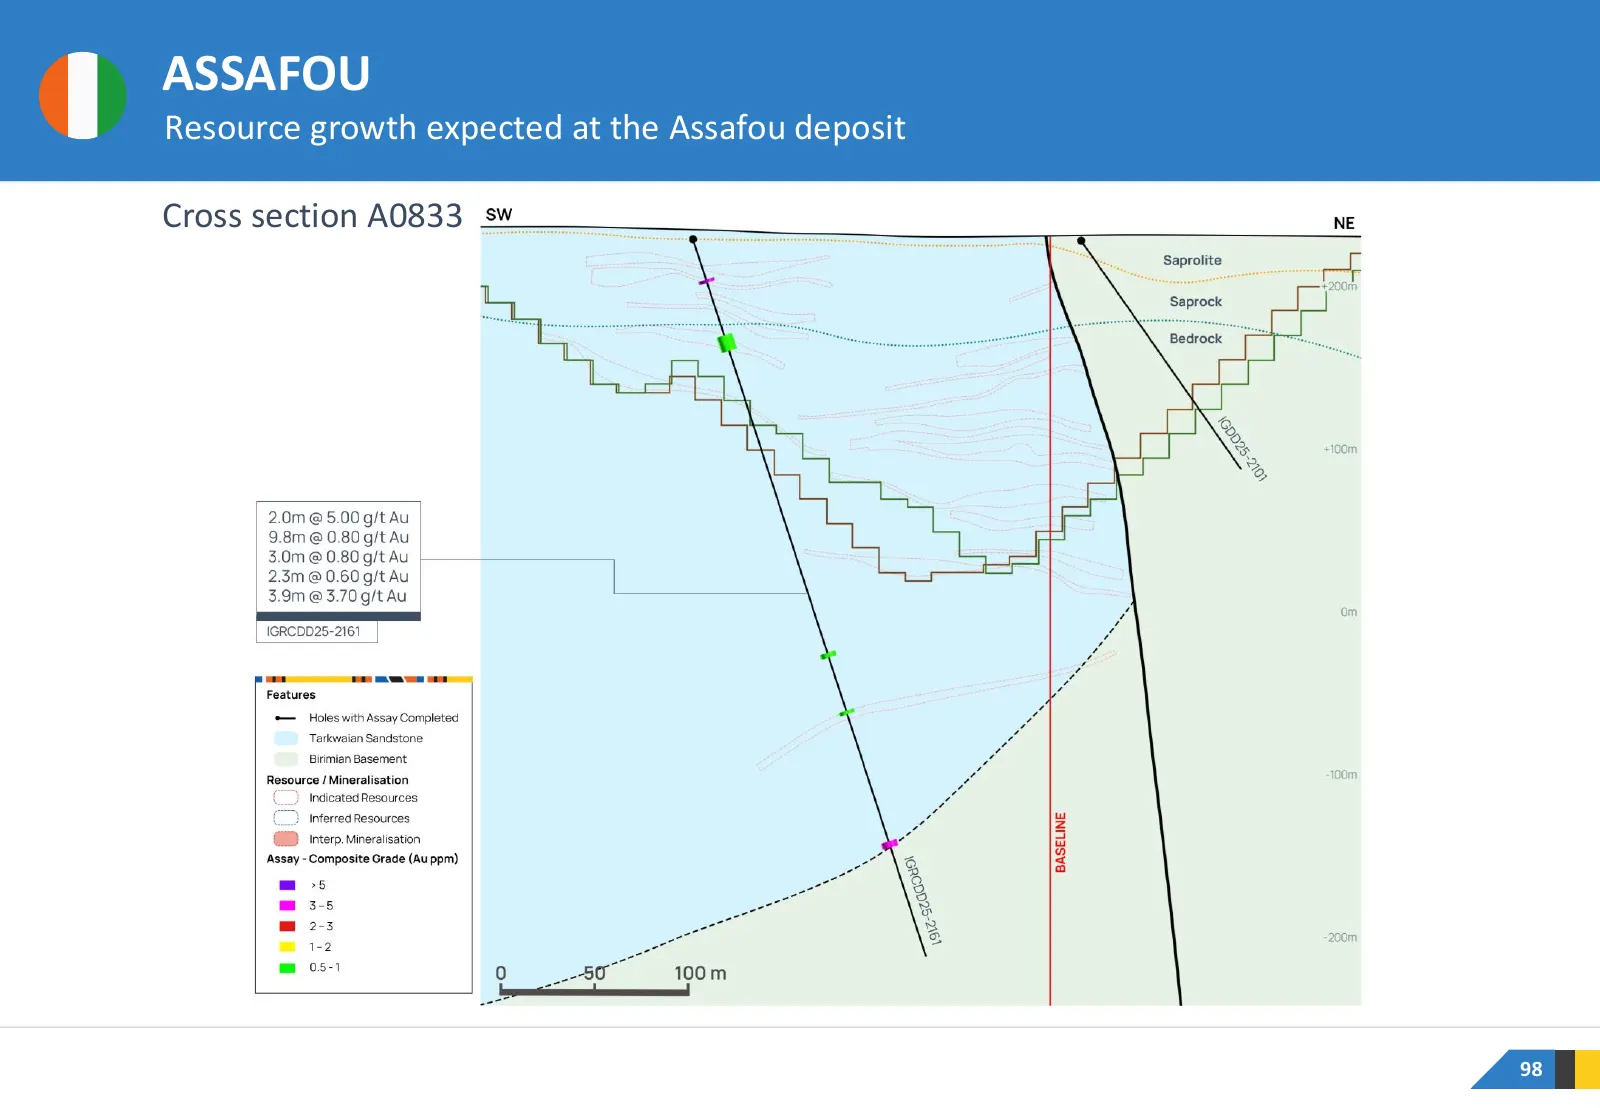
ASSAFOU Resource growth expected at the Assafou deposit Cross section A0833 98
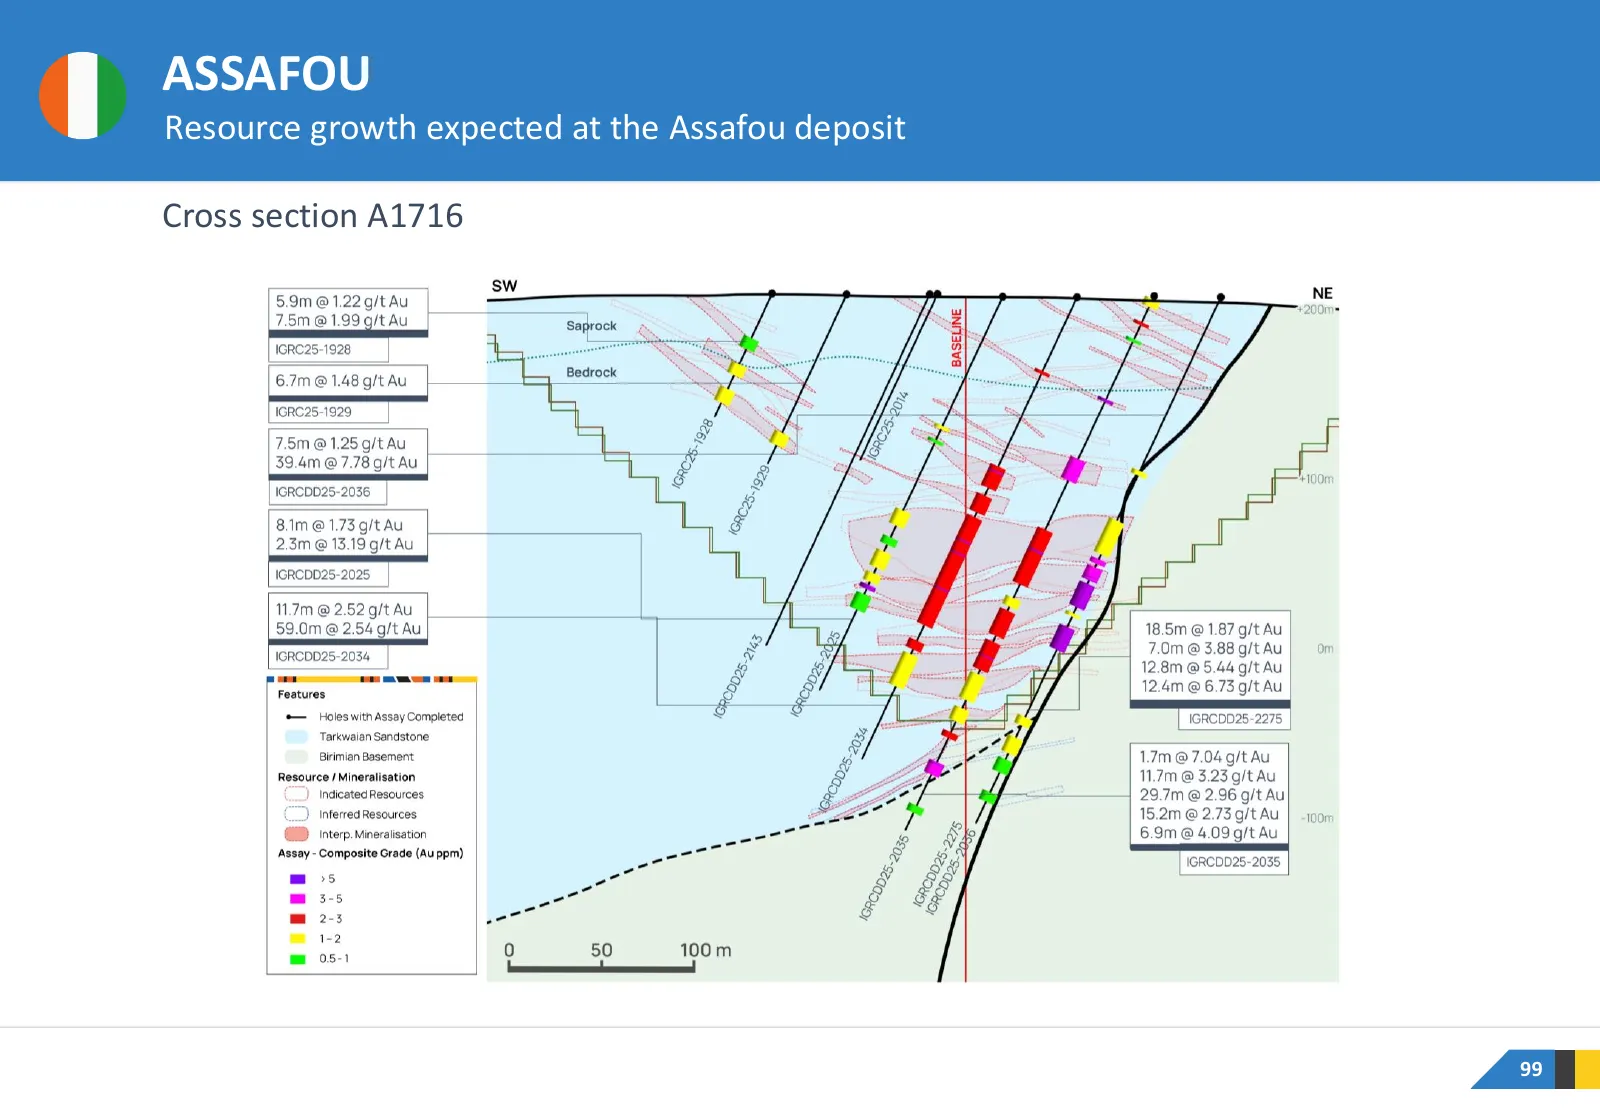
Slide 99: Assafou Cross Section A1716
ASSAFOU Resource growth expected at the Assafou deposit Cross section A1716 99
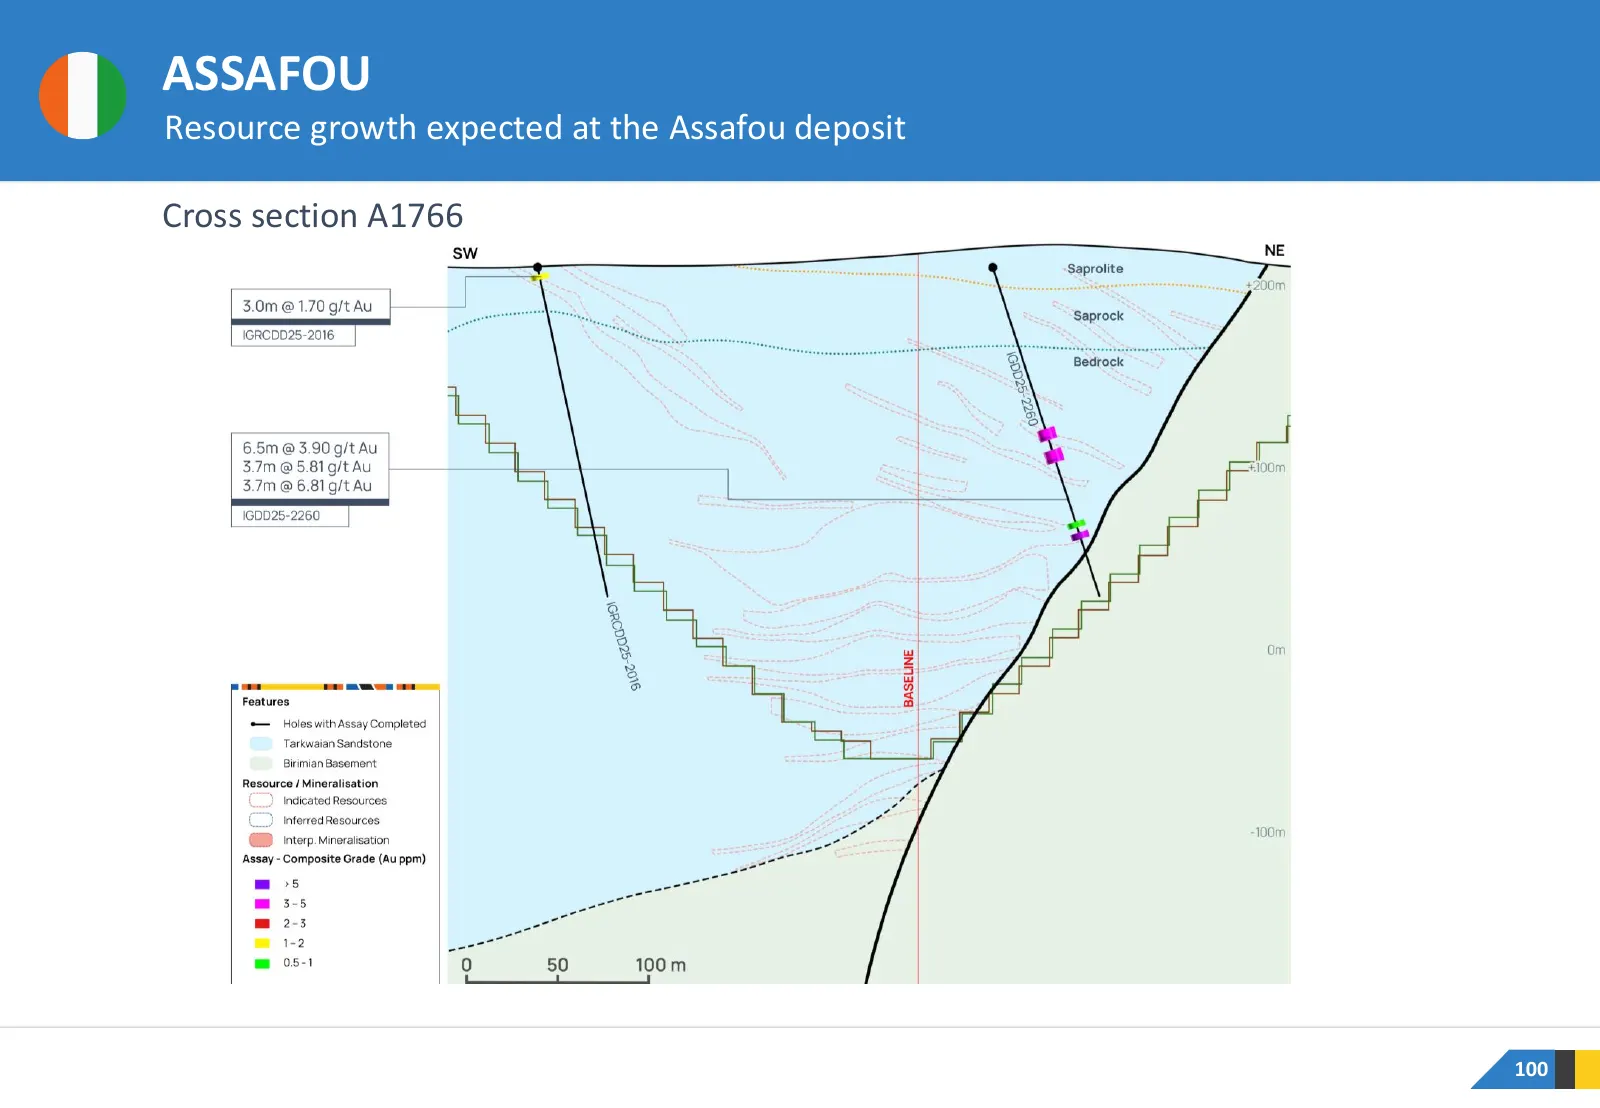
Slide 100: Assafou Cross Section A1766
ASSAFOU Resource growth expected at the Assafou deposit Cross section A1766 100
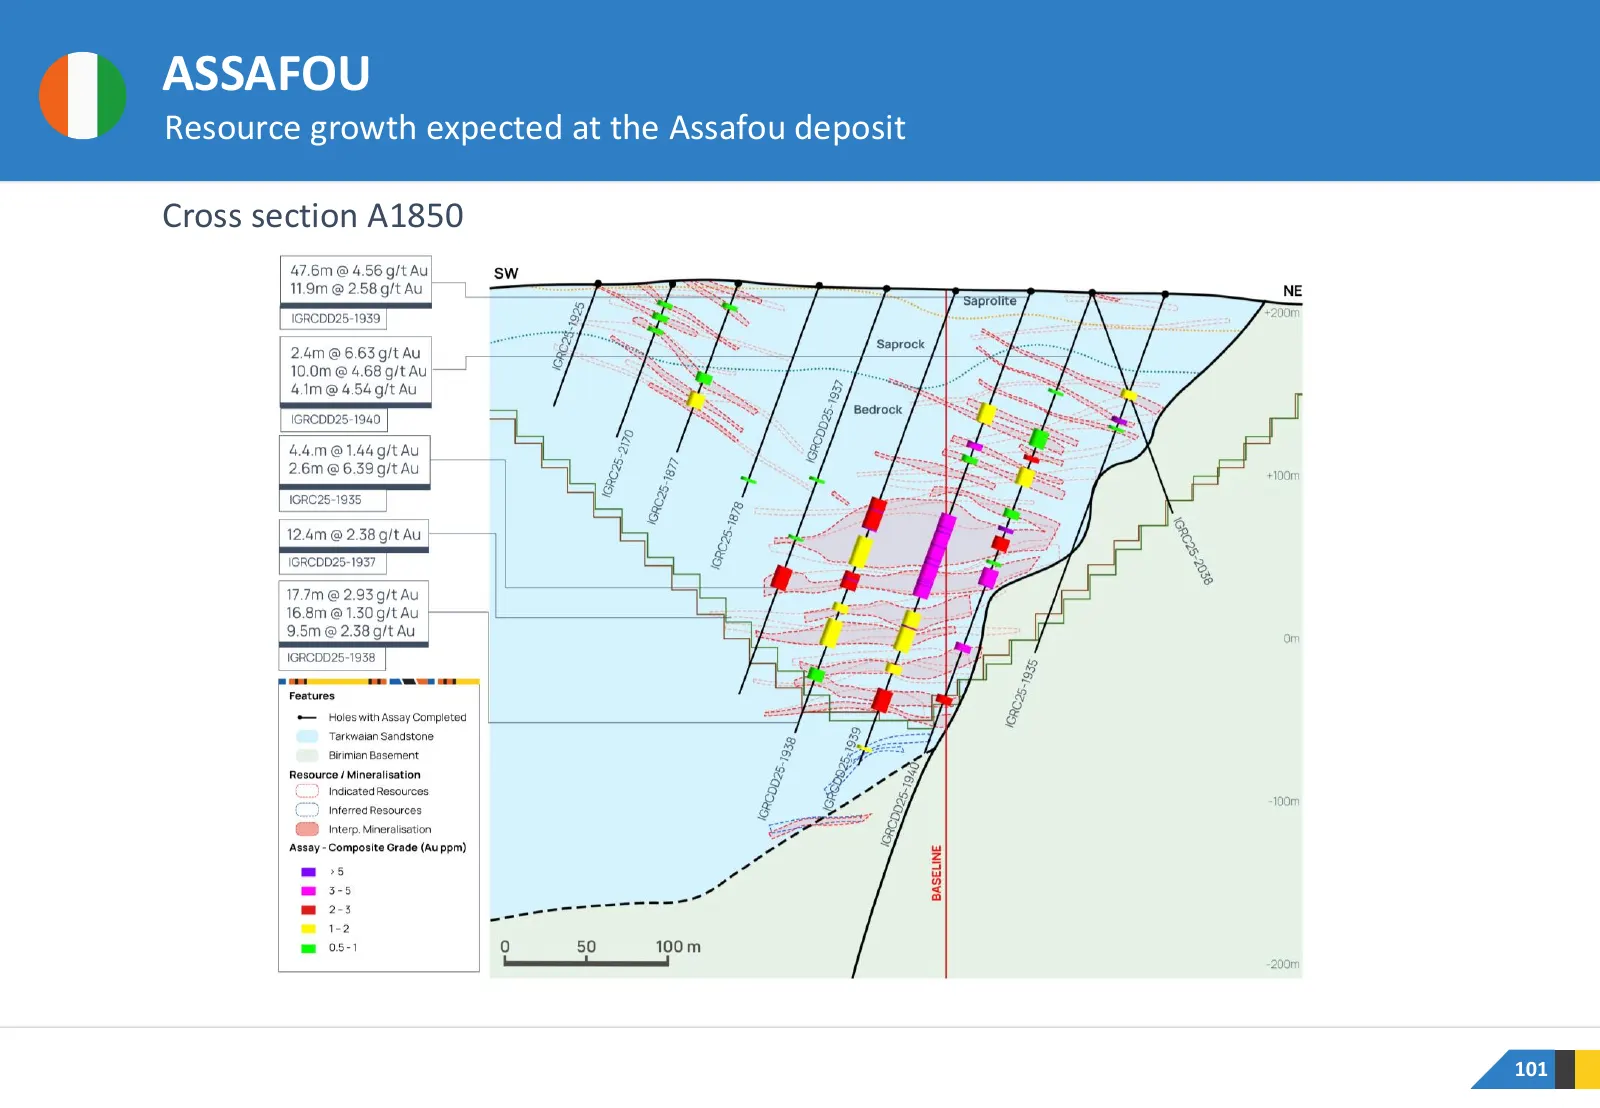
Slide 101: Assafou Cross Section A1850
ASSAFOU Resource growth expected at the Assafou deposit Cross section A1850 101
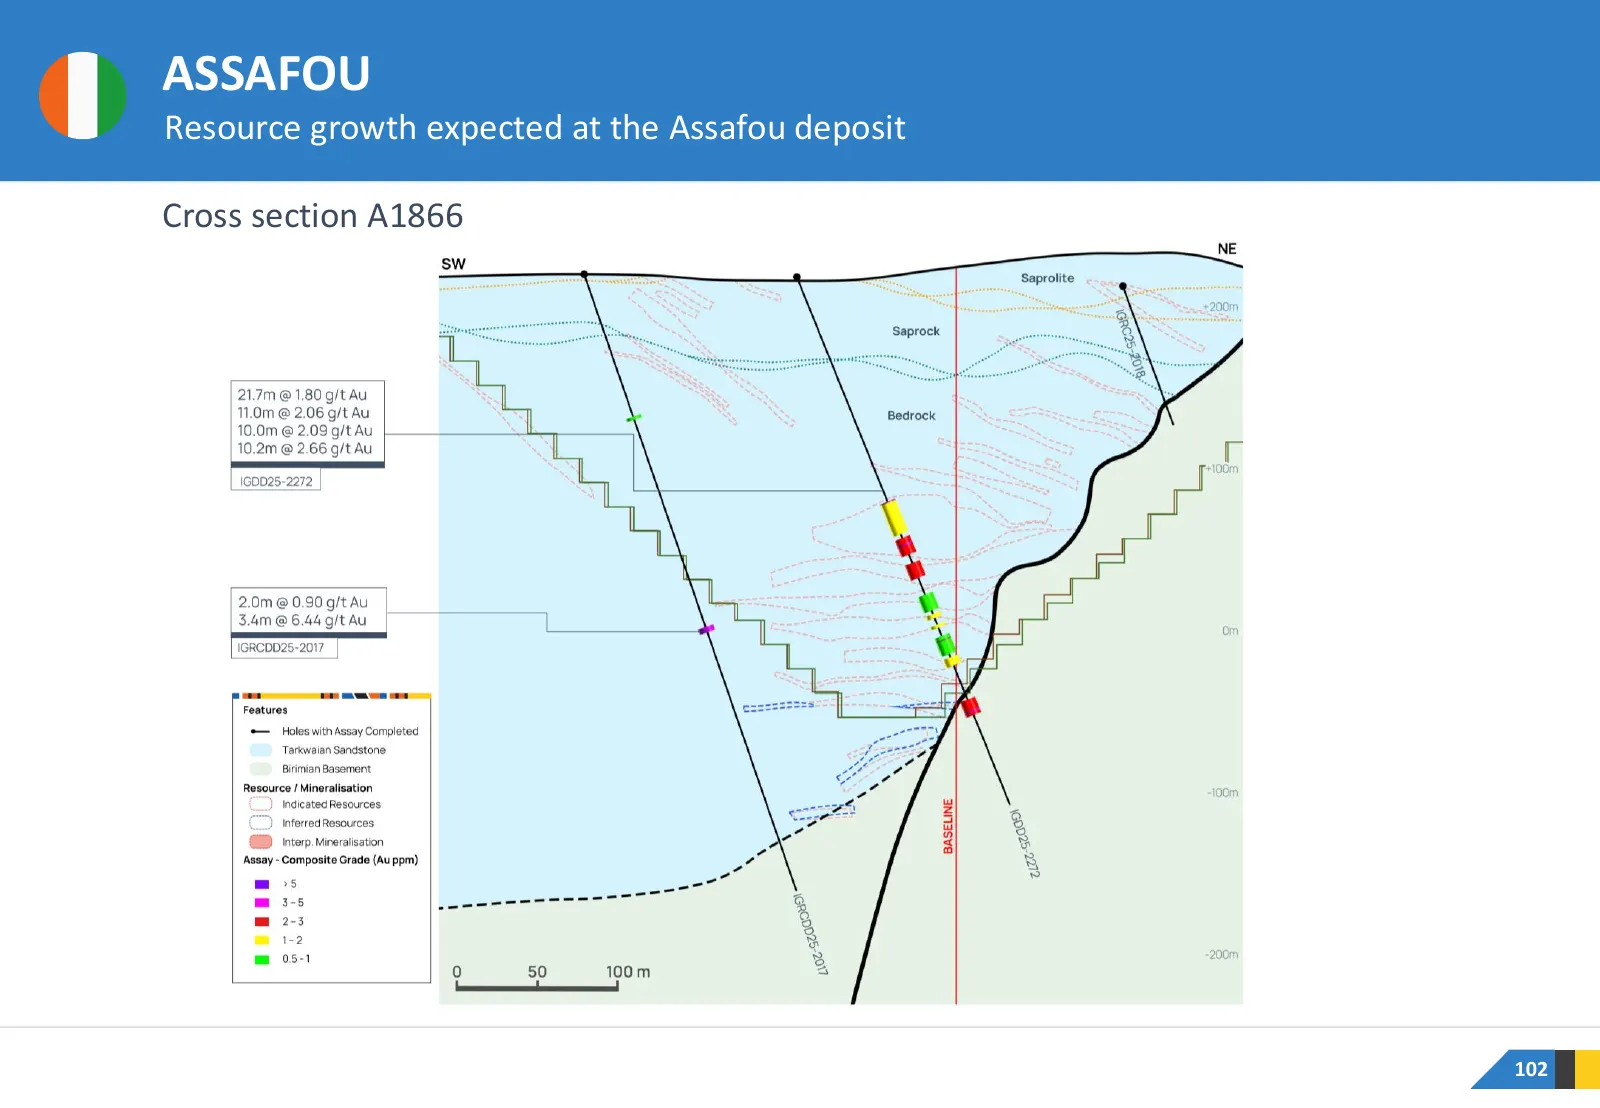
Slide 102: Assafou Cross Section A1866
ASSAFOU Resource growth expected at the Assafou deposit Cross section A1866 102
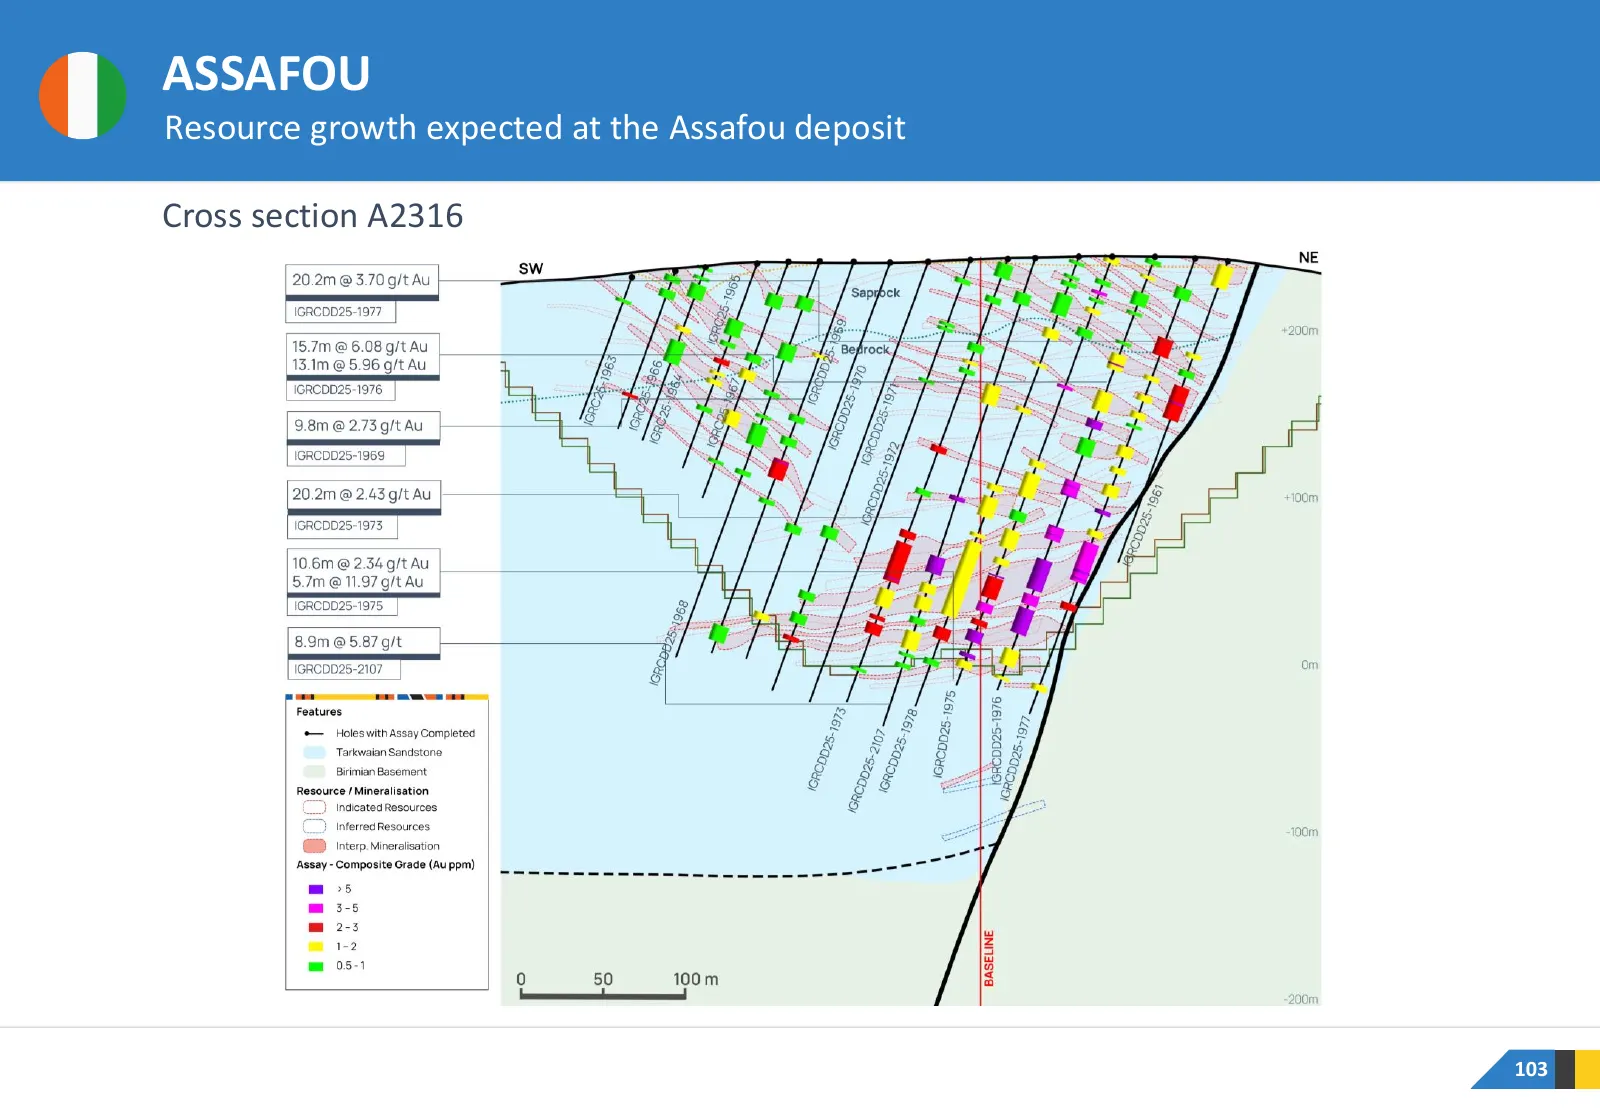
Slide 103: Assafou Cross Section A2316
ASSAFOU Resource growth expected at the Assafou deposit Cross section A2316 103
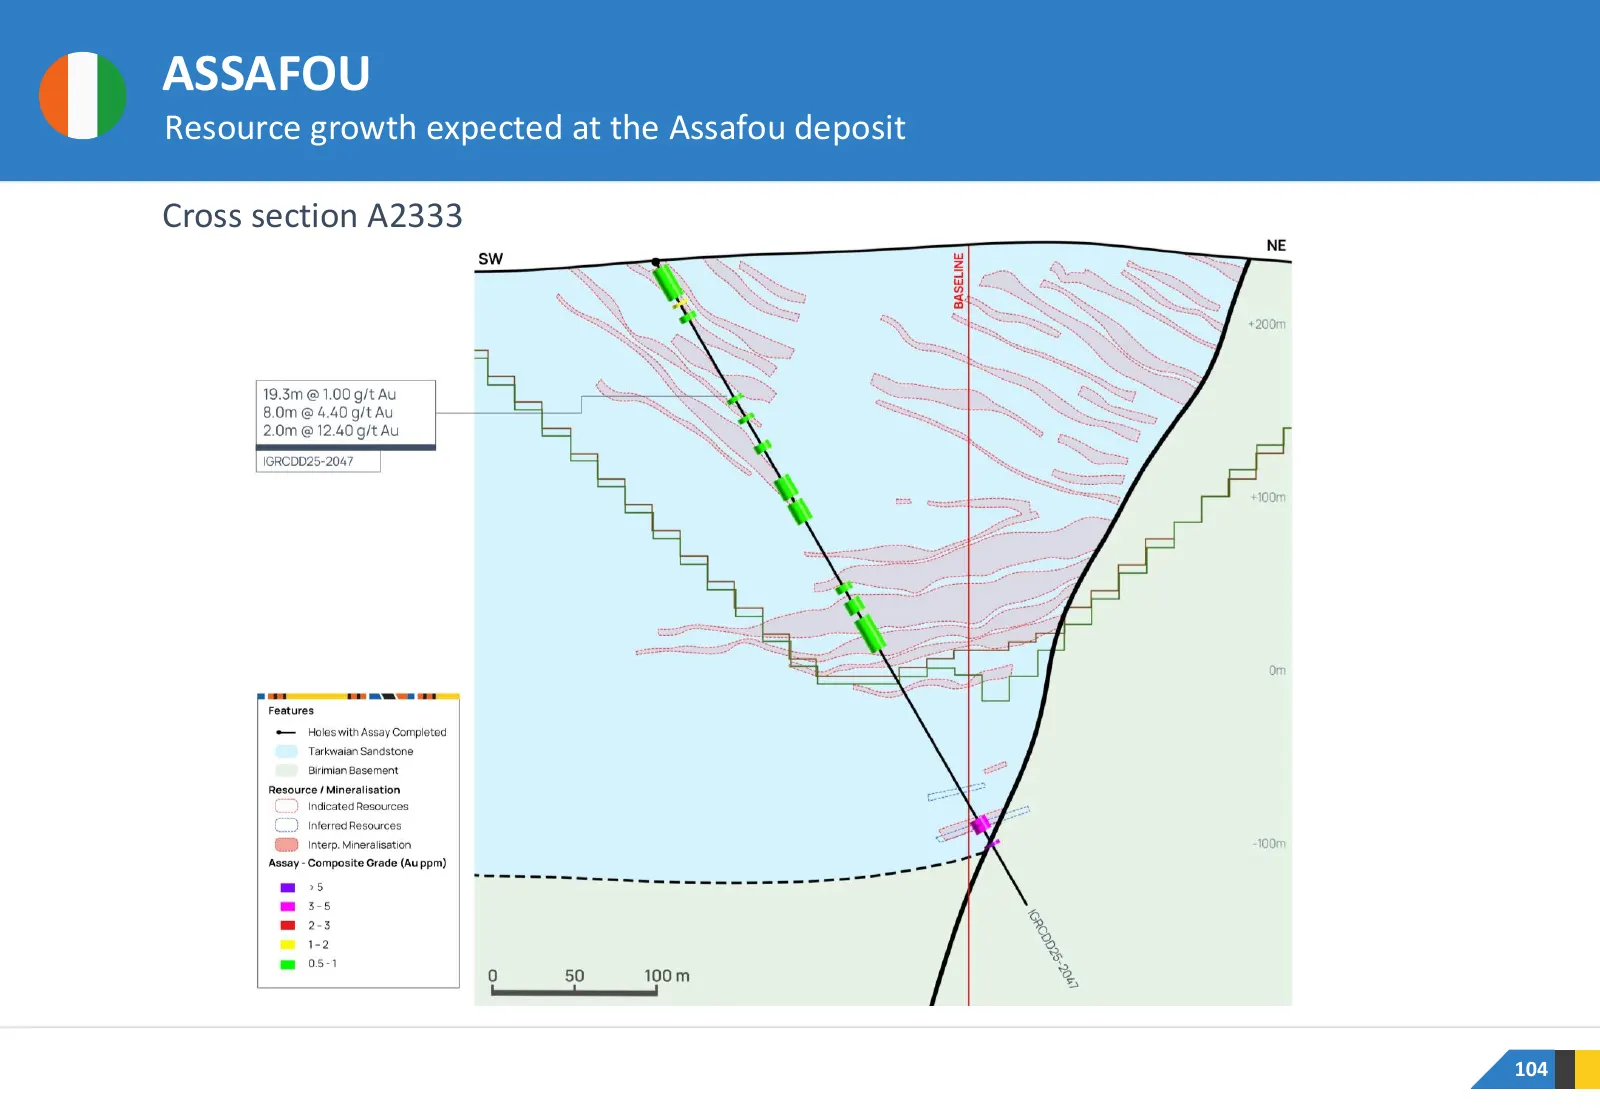
Slide 104: Assafou Cross Section A2333
ASSAFOU Resource growth expected at the Assafou deposit Cross section A2333 104
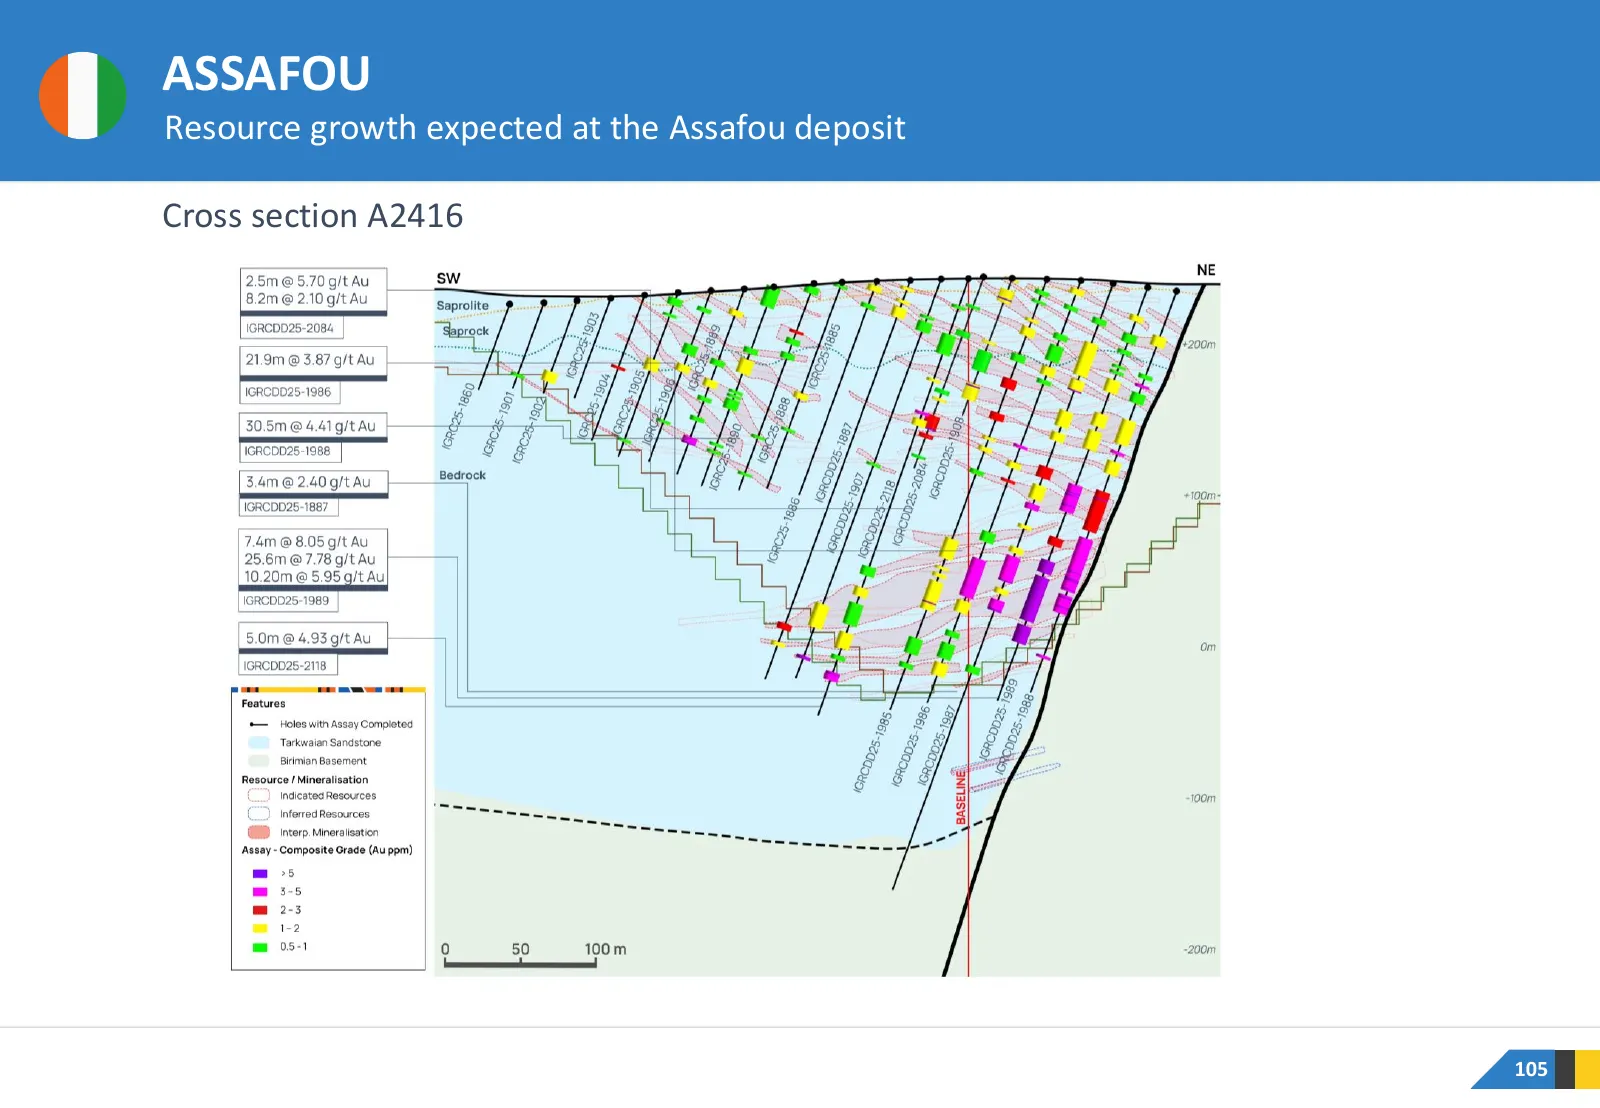
Slide 105: Assafou Cross Section A2416
ASSAFOU Resource growth expected at the Assafou deposit Cross section A2416 105
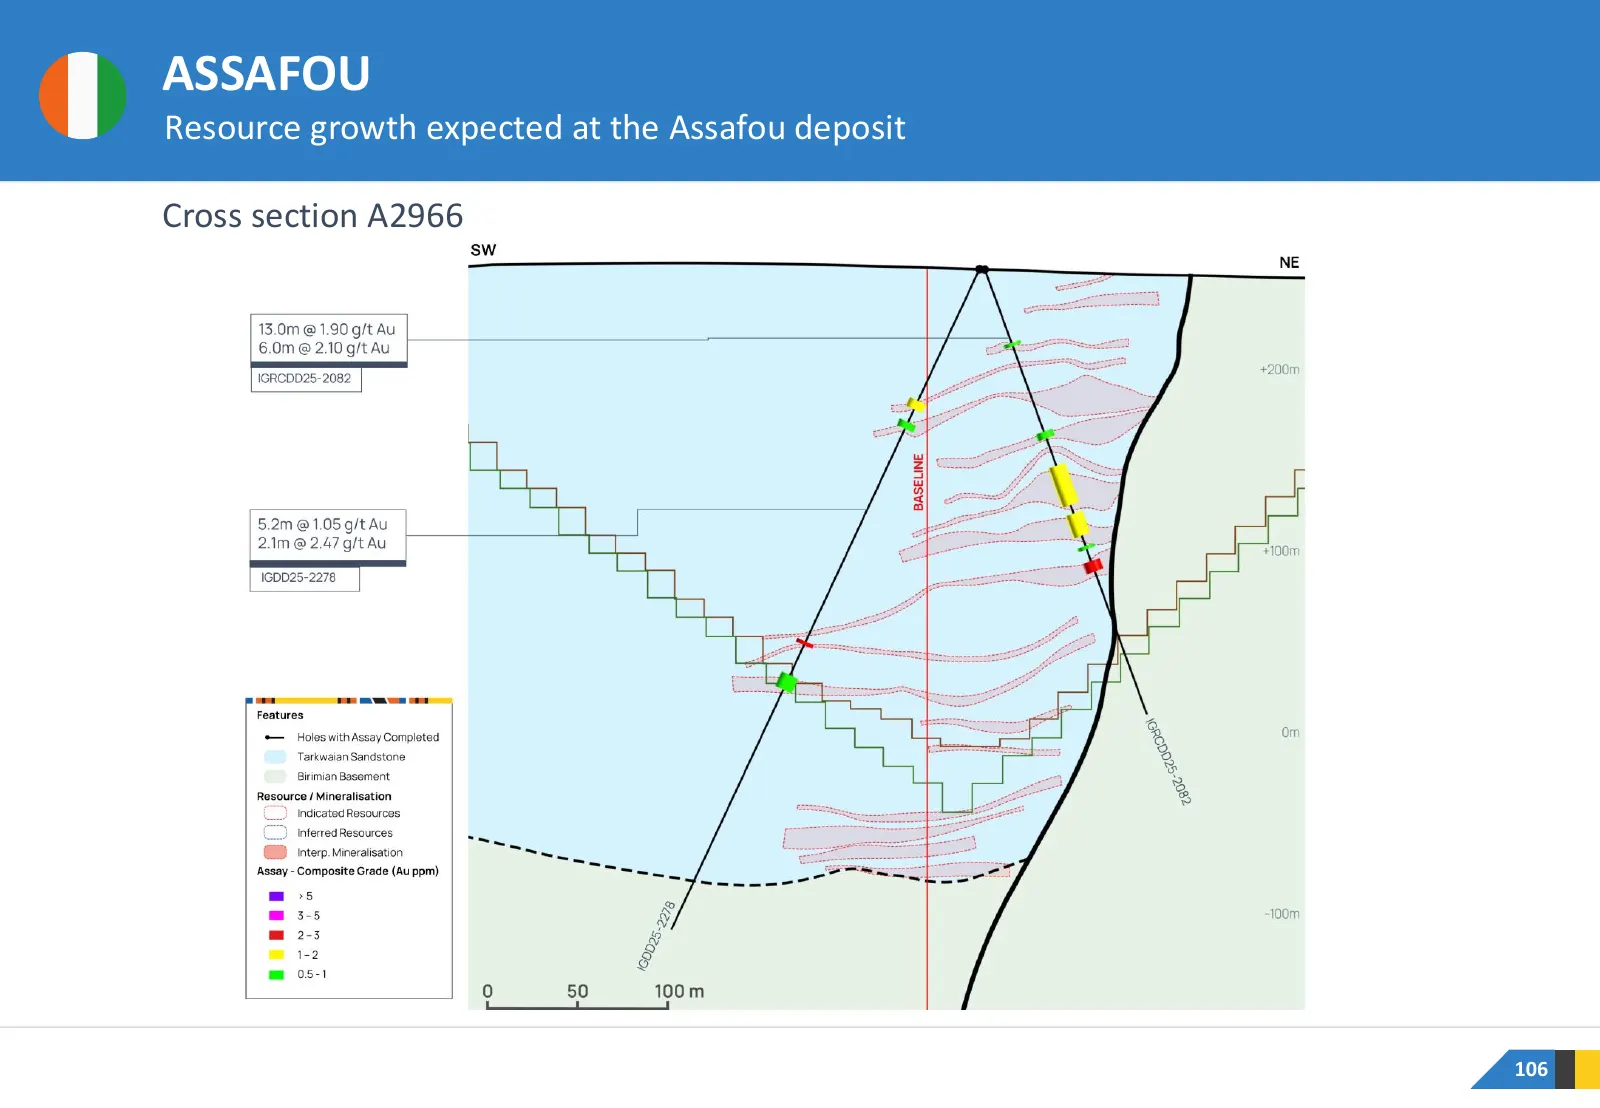
Slide 106: Assafou Cross Section A2966
ASSAFOU Resource growth expected at the Assafou deposit Cross section A2966 106
Slide 107: Pala Trend 2 and 3
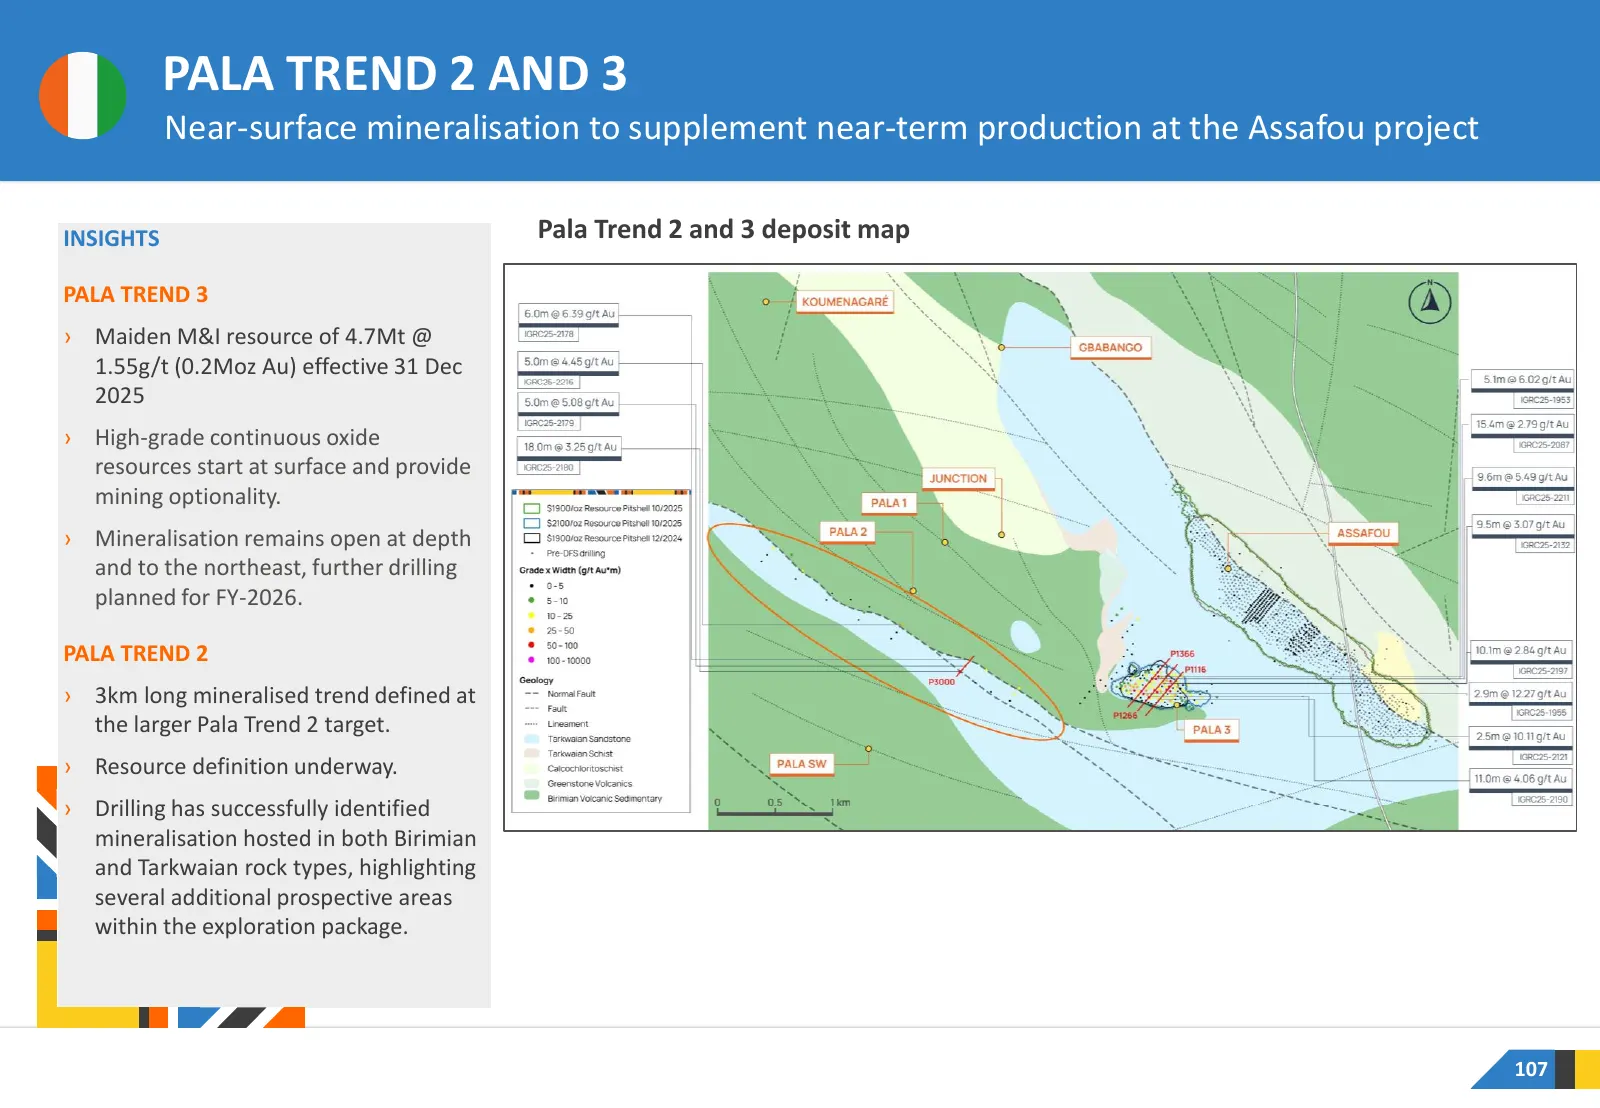
PALA TREND 2 AND 3 Near-surface mineralisation to supplement near-term production at the Assafou project INSIGHTS Pala Trend 2 and 3 deposit map PALA TREND 3 › Maiden M&I resource of 4.7Mt @ 1.55g/t (0.2Moz Au) effective 31 Dec 2025 › High-grade continuous oxide resources start at surface and provid
Slide 108: Pala Cross Section A1166
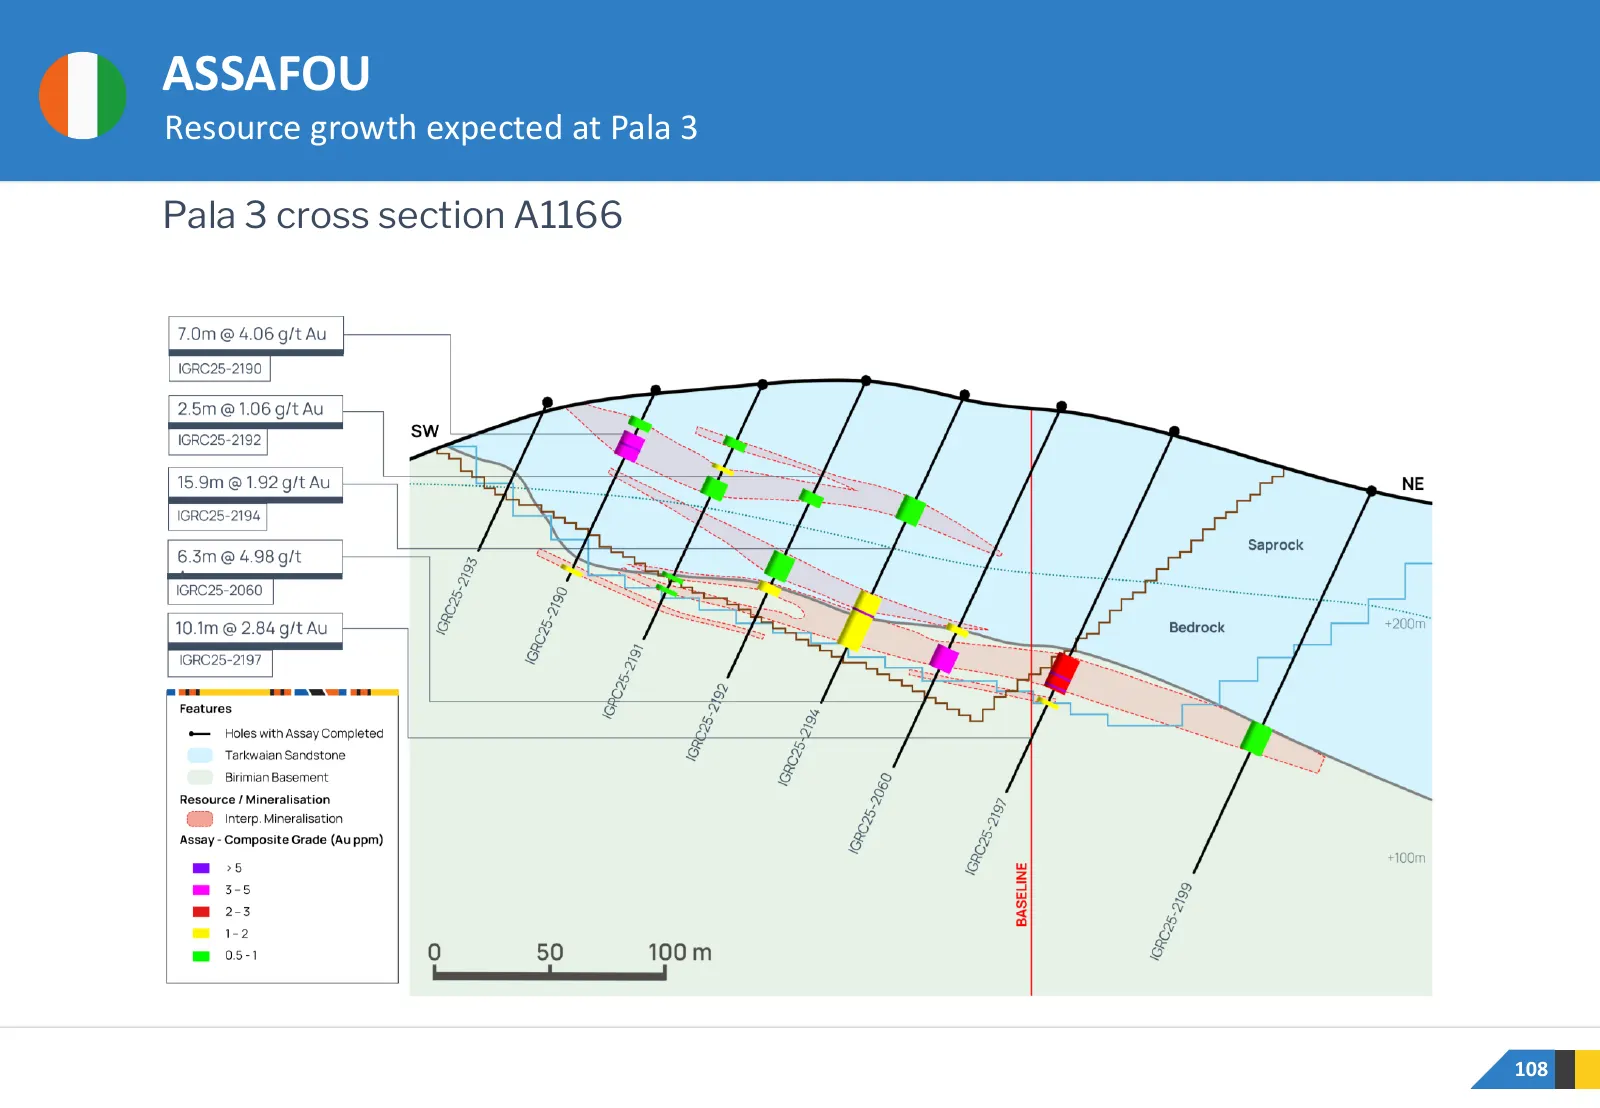
ASSAFOU Resource growth expected at Pala 3 Pala 3 cross section A1166 108
Slide 109: Pala Cross Section A1266
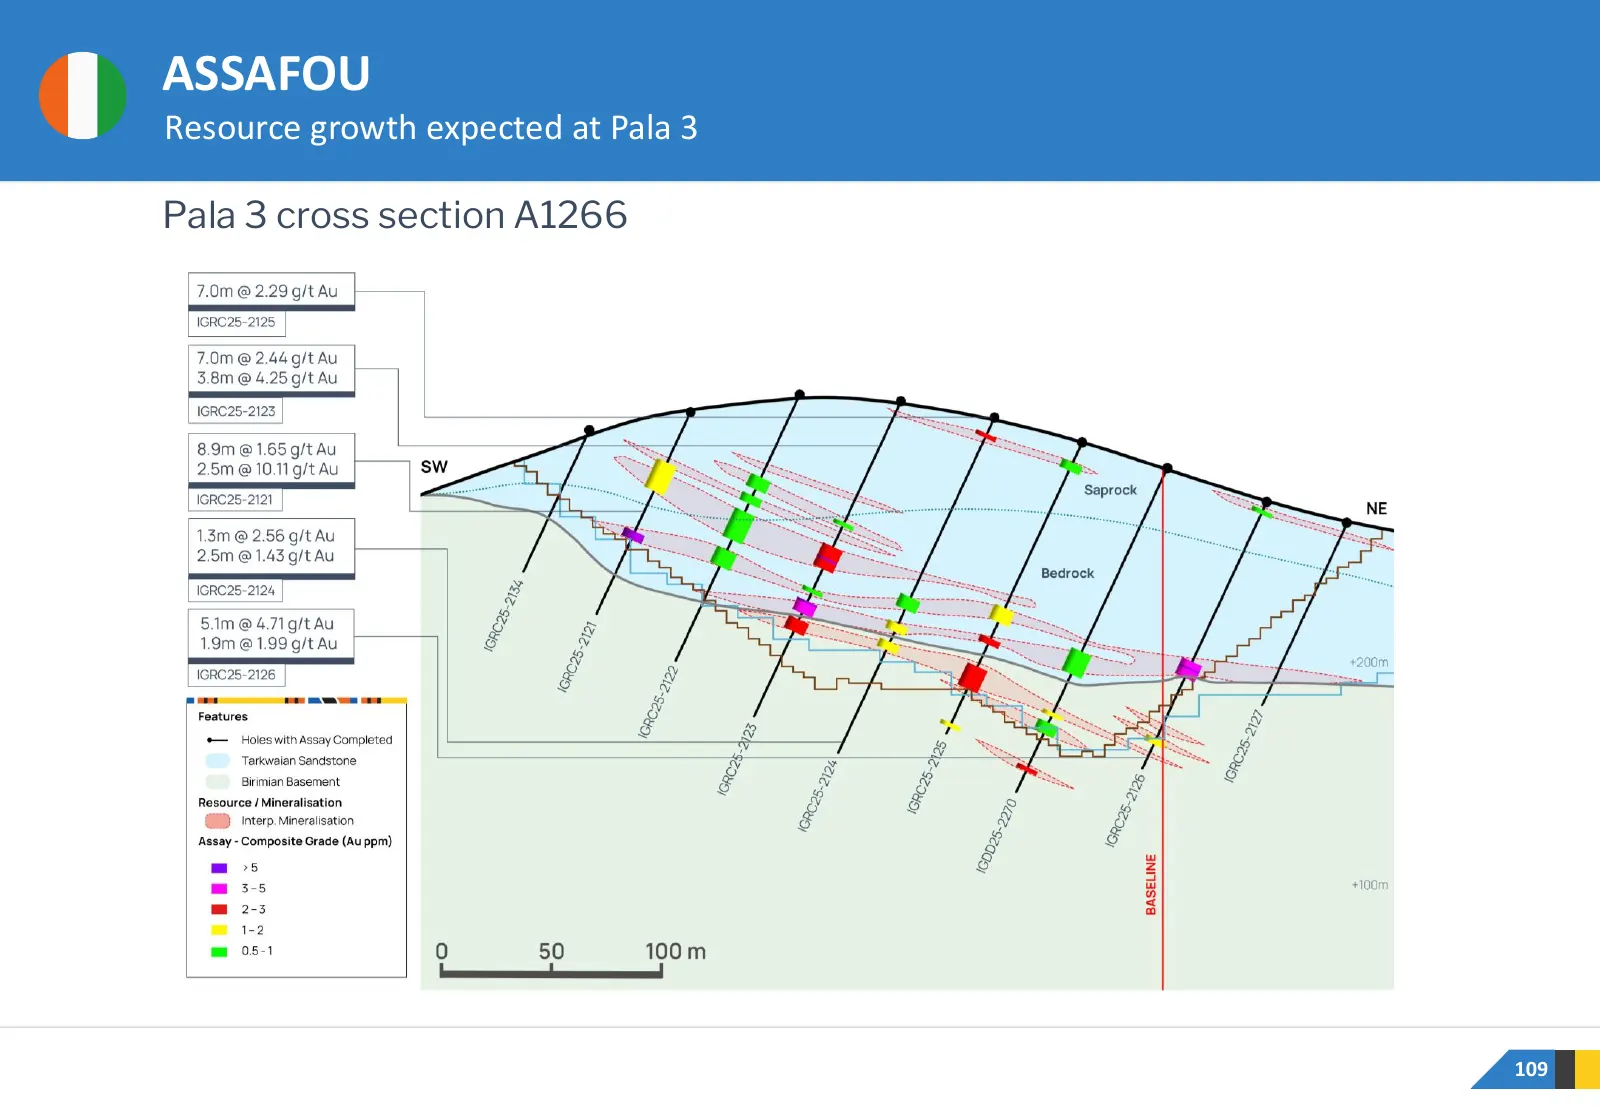
ASSAFOU Resource growth expected at Pala 3 Pala 3 cross section A1266 109
Slide 110: Pala Cross Section A1366
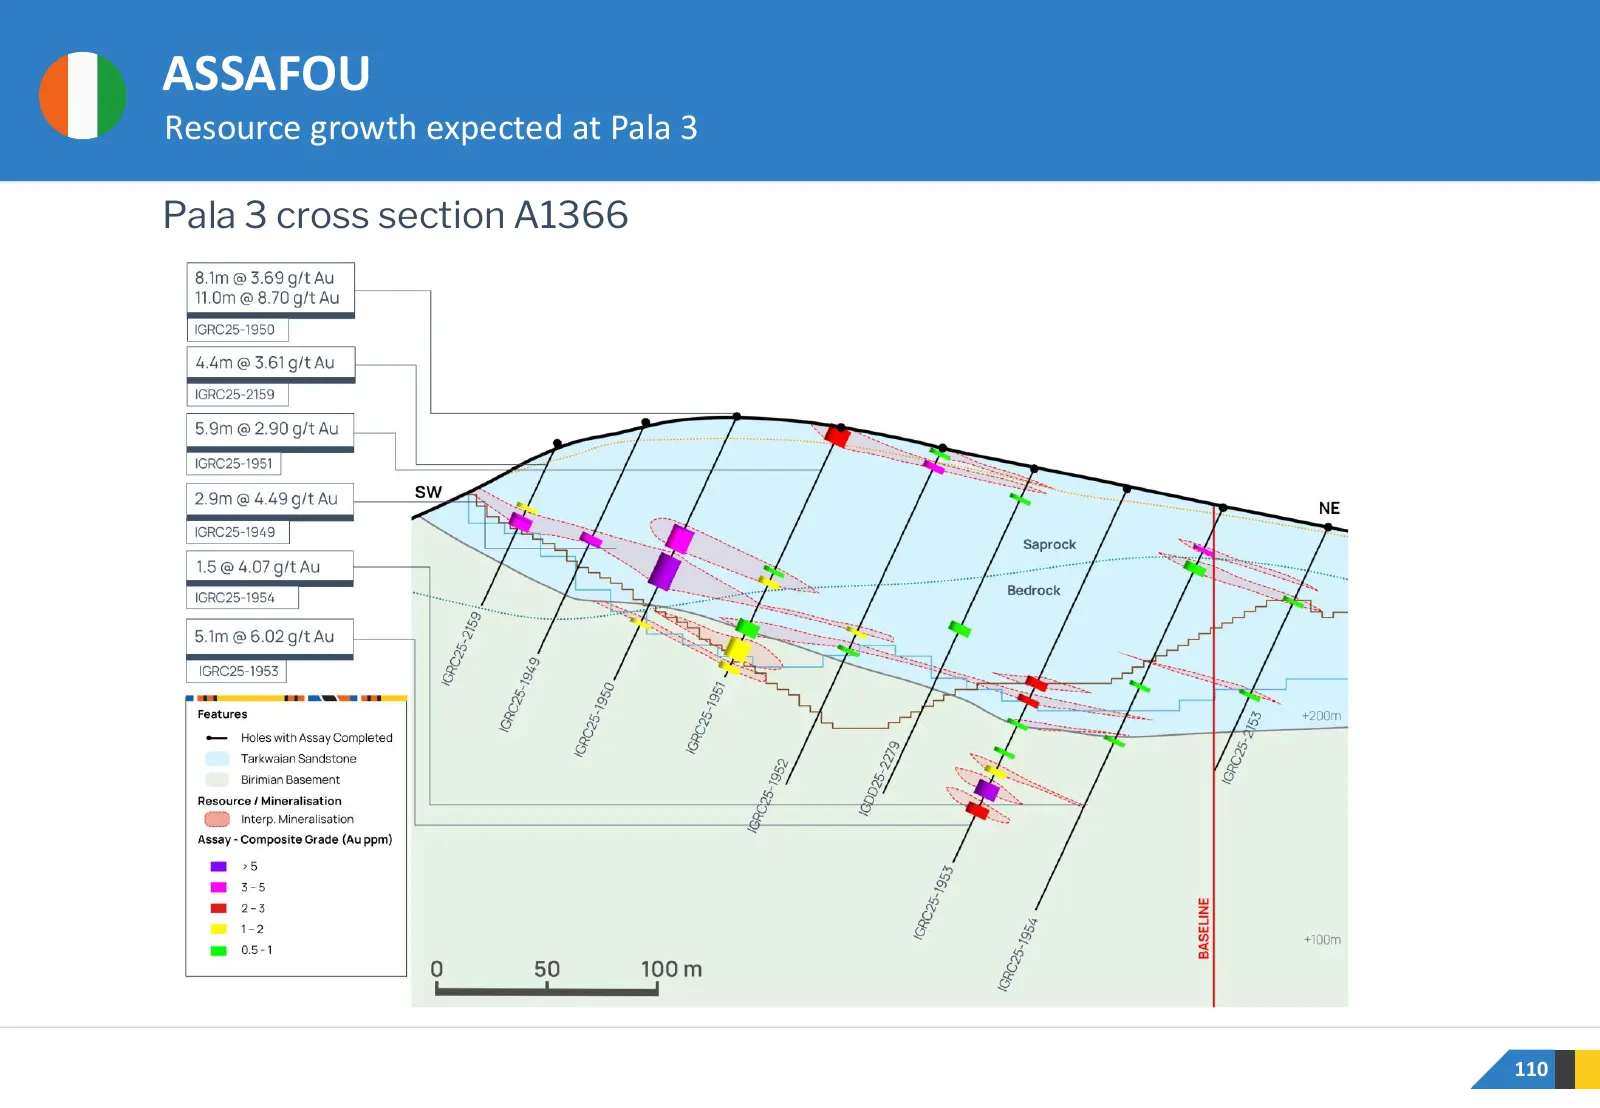
ASSAFOU Resource growth expected at Pala 3 Pala 3 cross section A1366 110
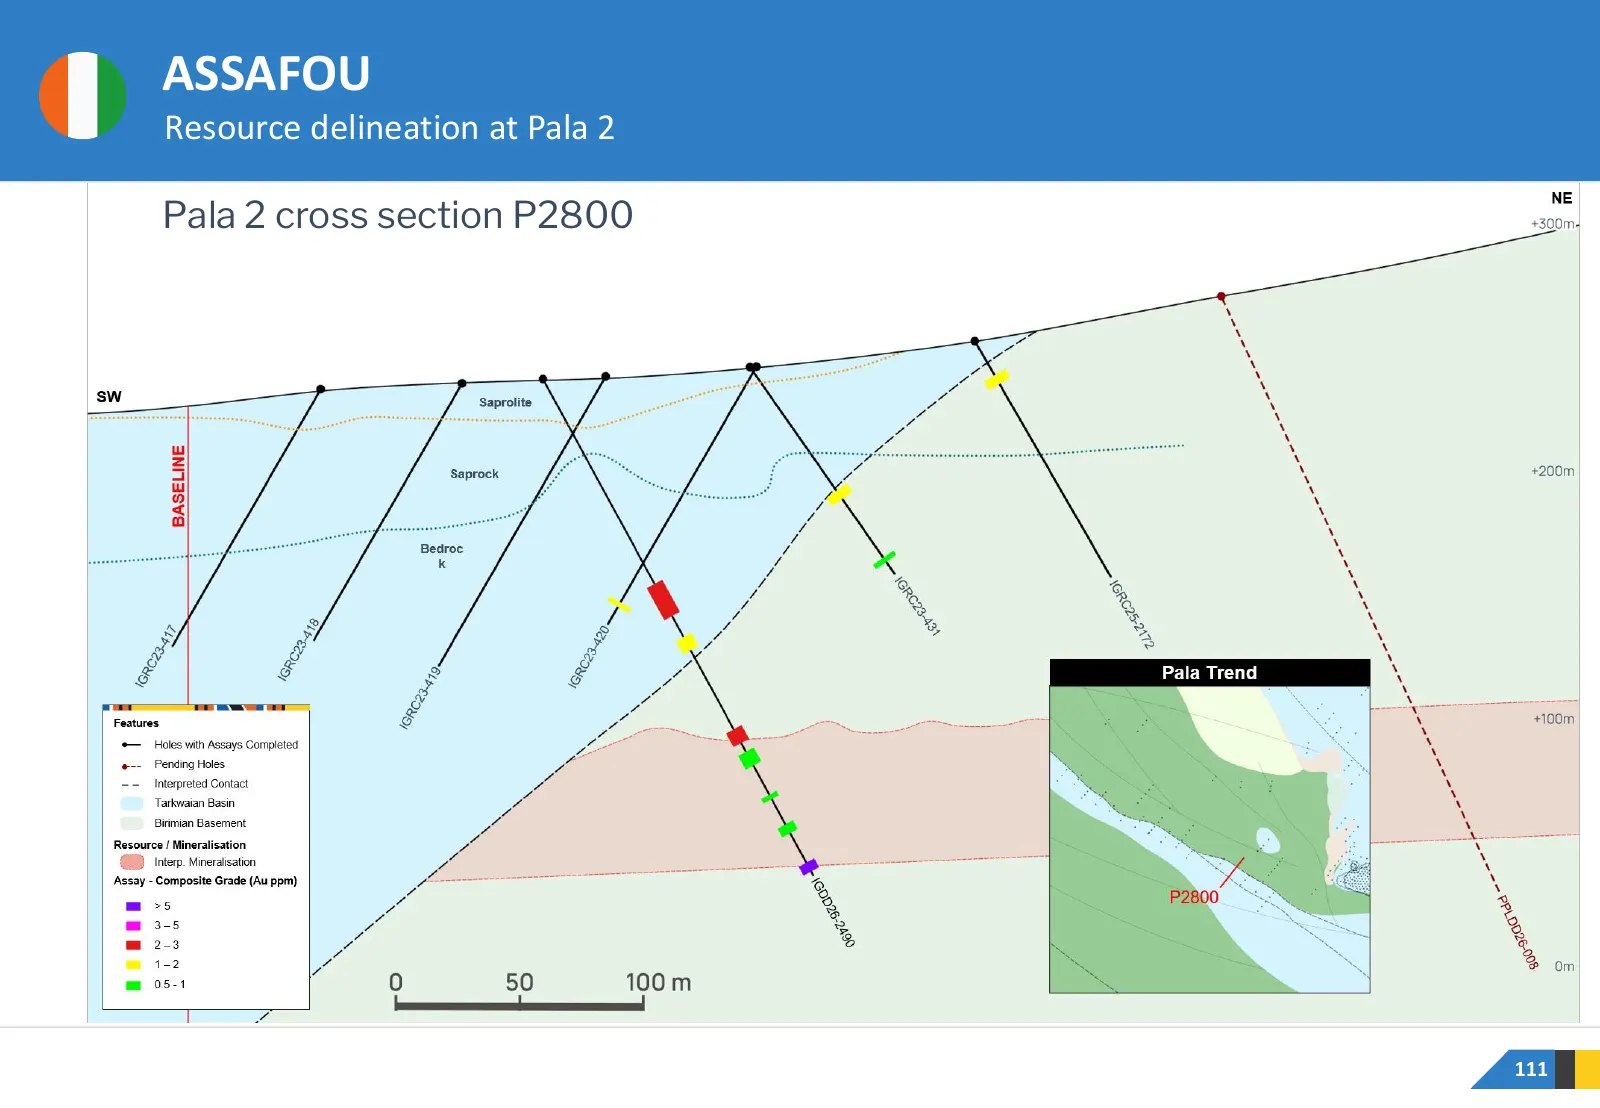
Slide 111: Resource Delineation at Pala: Section P2800
ASSAFOU Resource delineation at Pala 2 Pala 2 cross section P2800 111
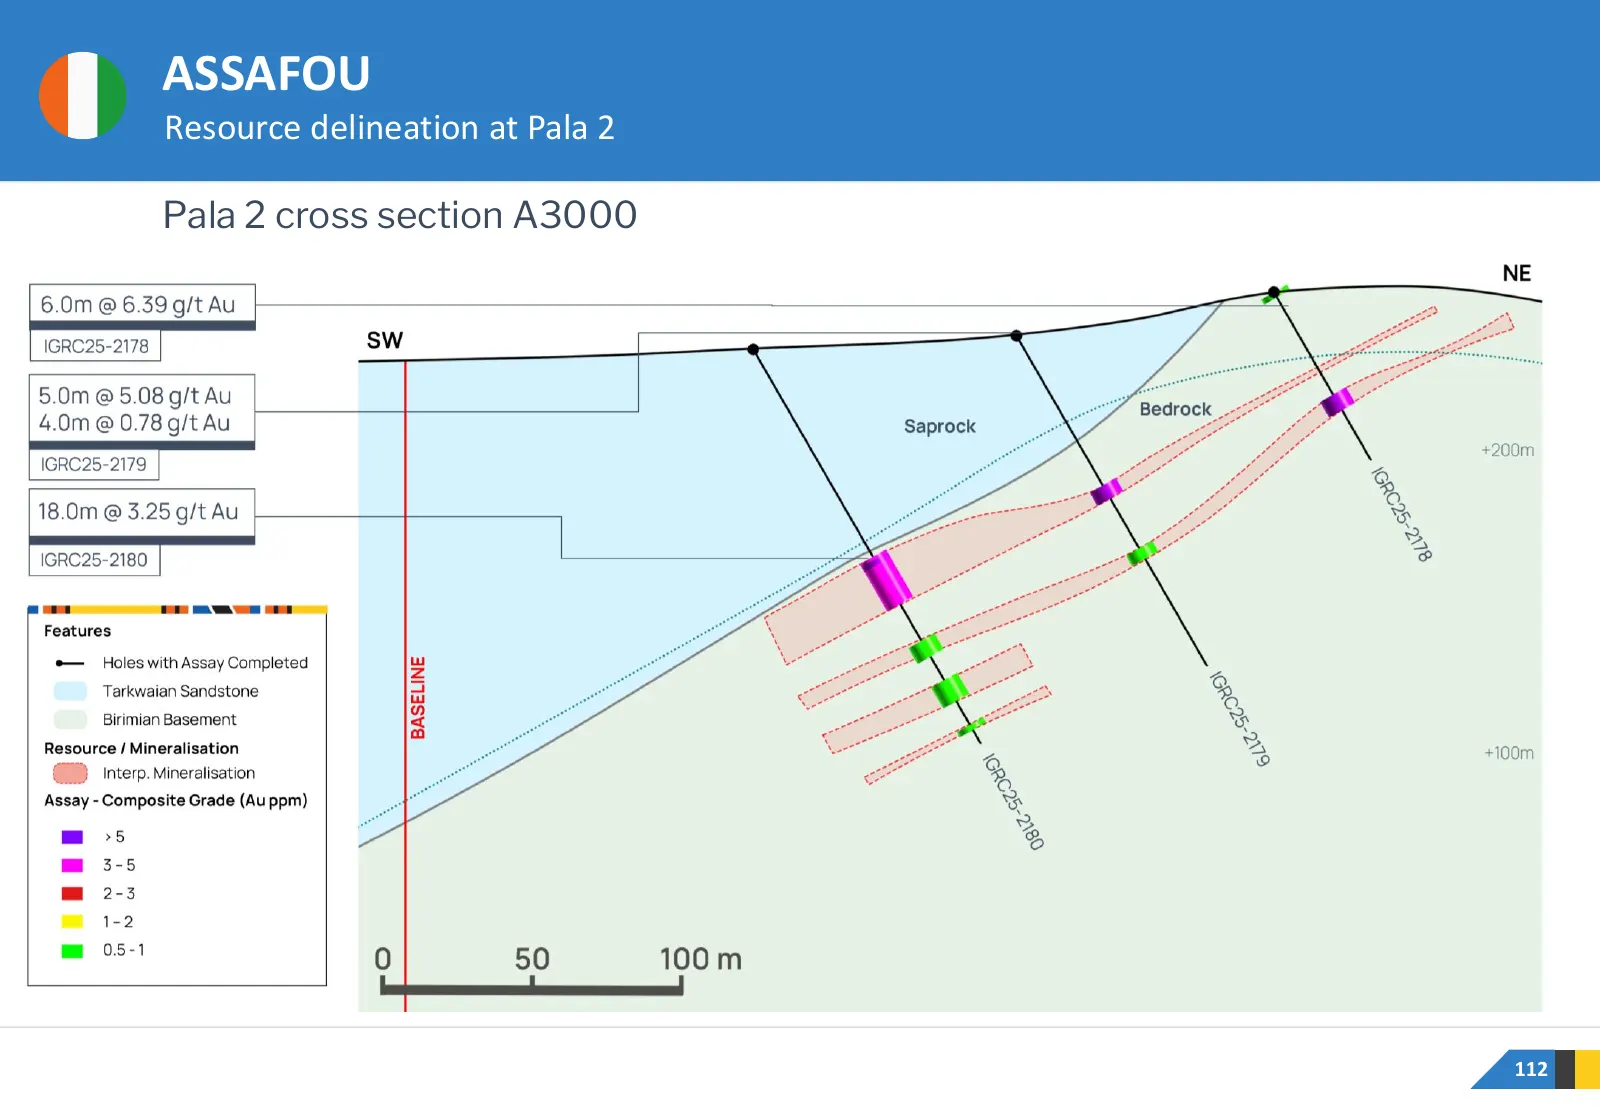
Slide 112: Resource Delineation at Pala: Section A3000
ASSAFOU Resource delineation at Pala 2 Pala 2 cross section A3000 112
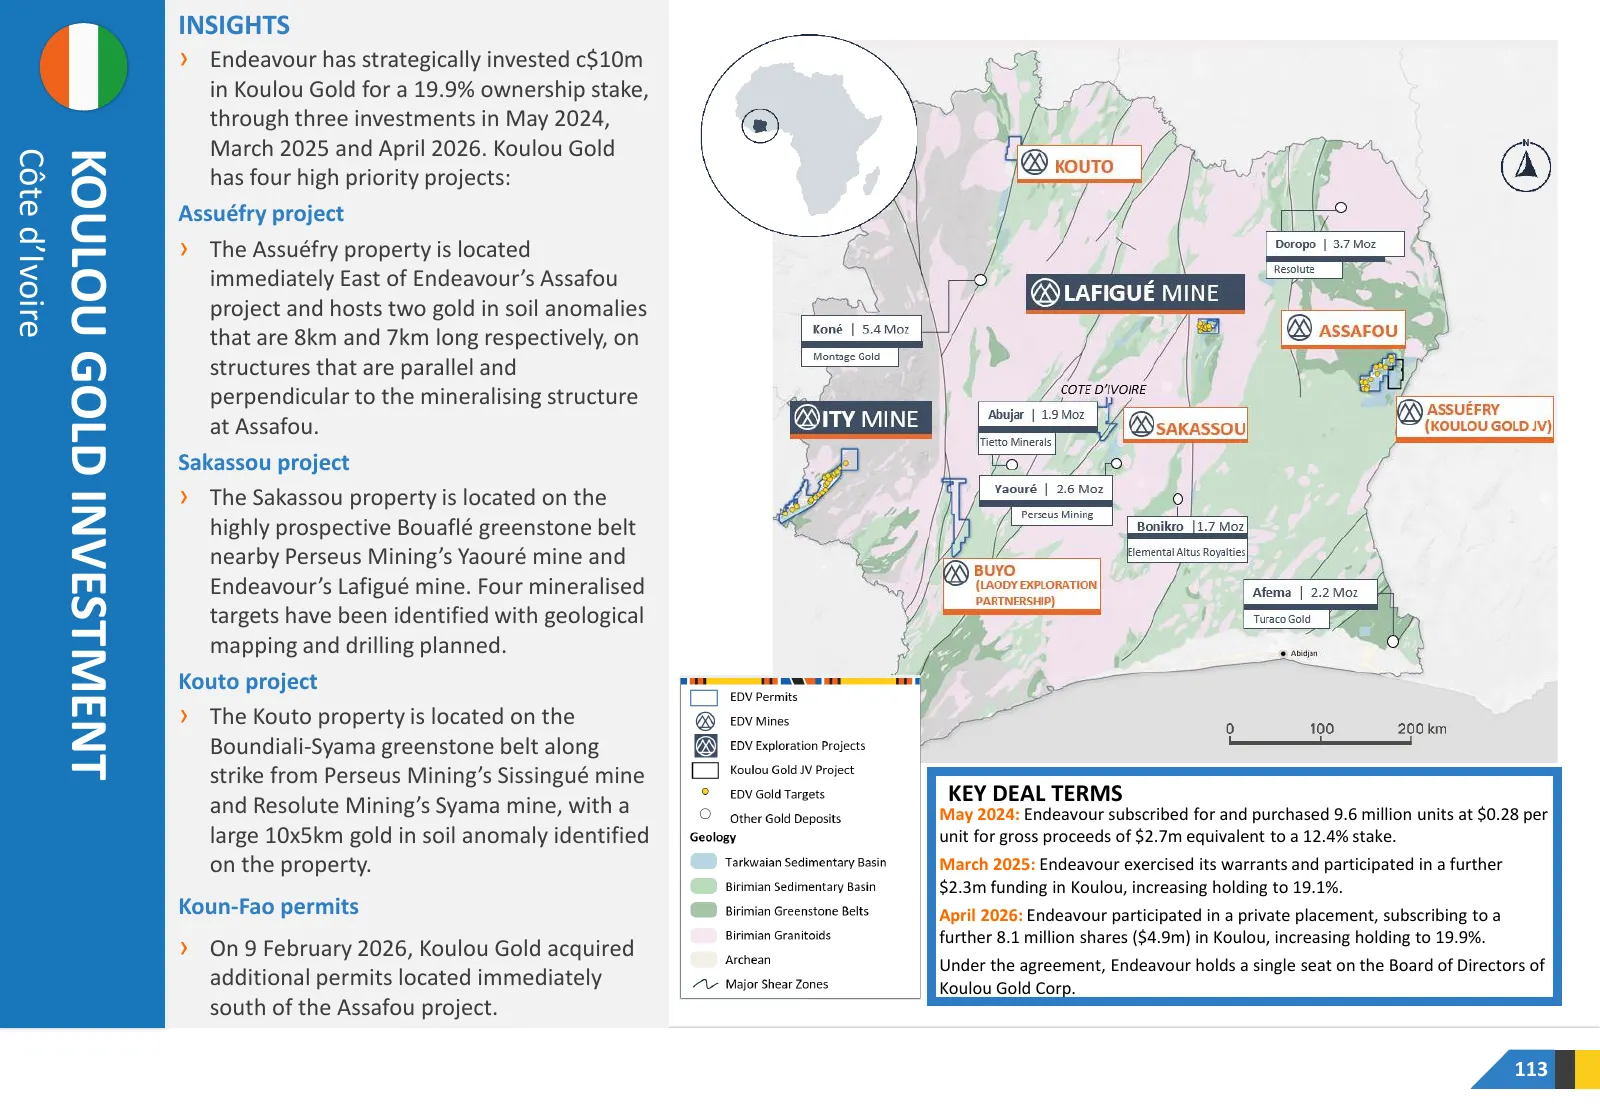
Slide 113: Koulou Gold Investment
INSIGHTS › Endeavour has strategically invested c$10m in Koulou Gold for a 19.9% ownership stake, through three investments in May 2024, March 2025 and April 2026. Koulou Gold Côte d’Ivoire KOULOU GOLD INVESTMENT has four high priority projects: Assuéfry project › The Assuéfry property is located im
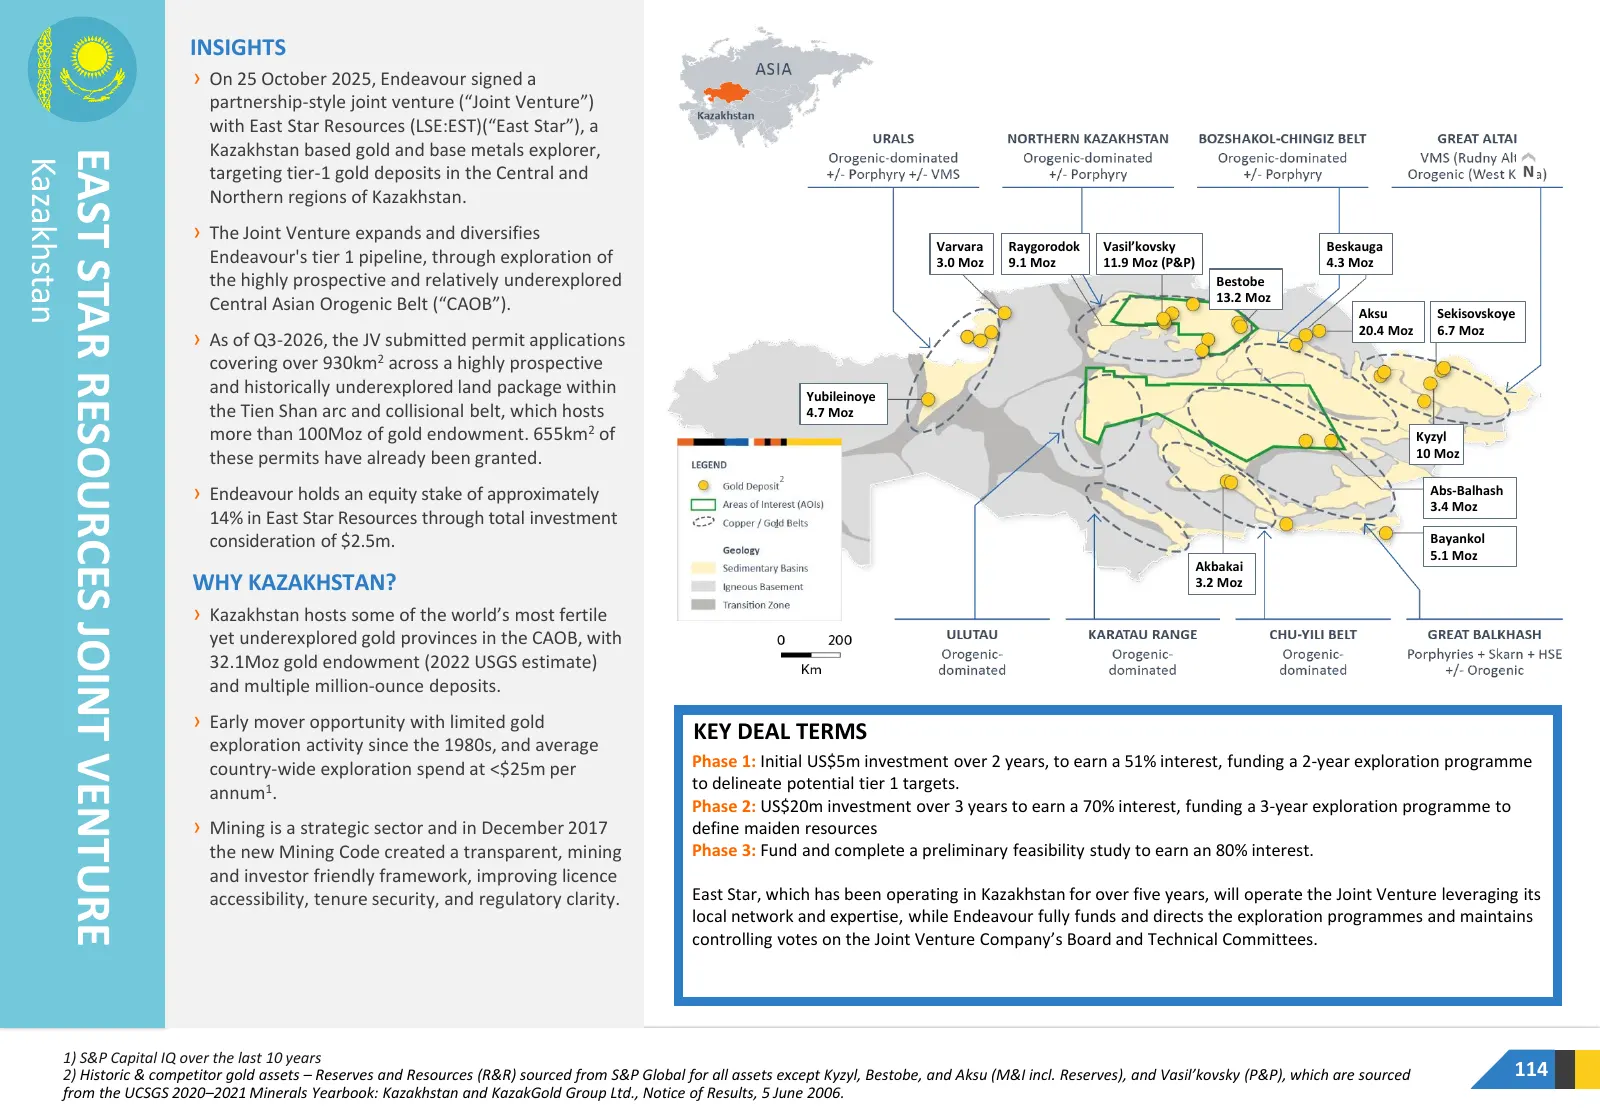
Slide 114: East Star Resources Joint Venture
INSIGHTS › On 25 October 2025, Endeavour signed a partnership-style joint venture (“Joint Venture”) with East Star Resources (LSE:EST)(“East Star”), a Kazakhstan based gold and base metals explorer, EAST STAR RESOURCES JOINT VENTURE Kazakhstan targeting tier-1 gold deposits in the Central and Northe
Slide 115: The Kazakh Economy
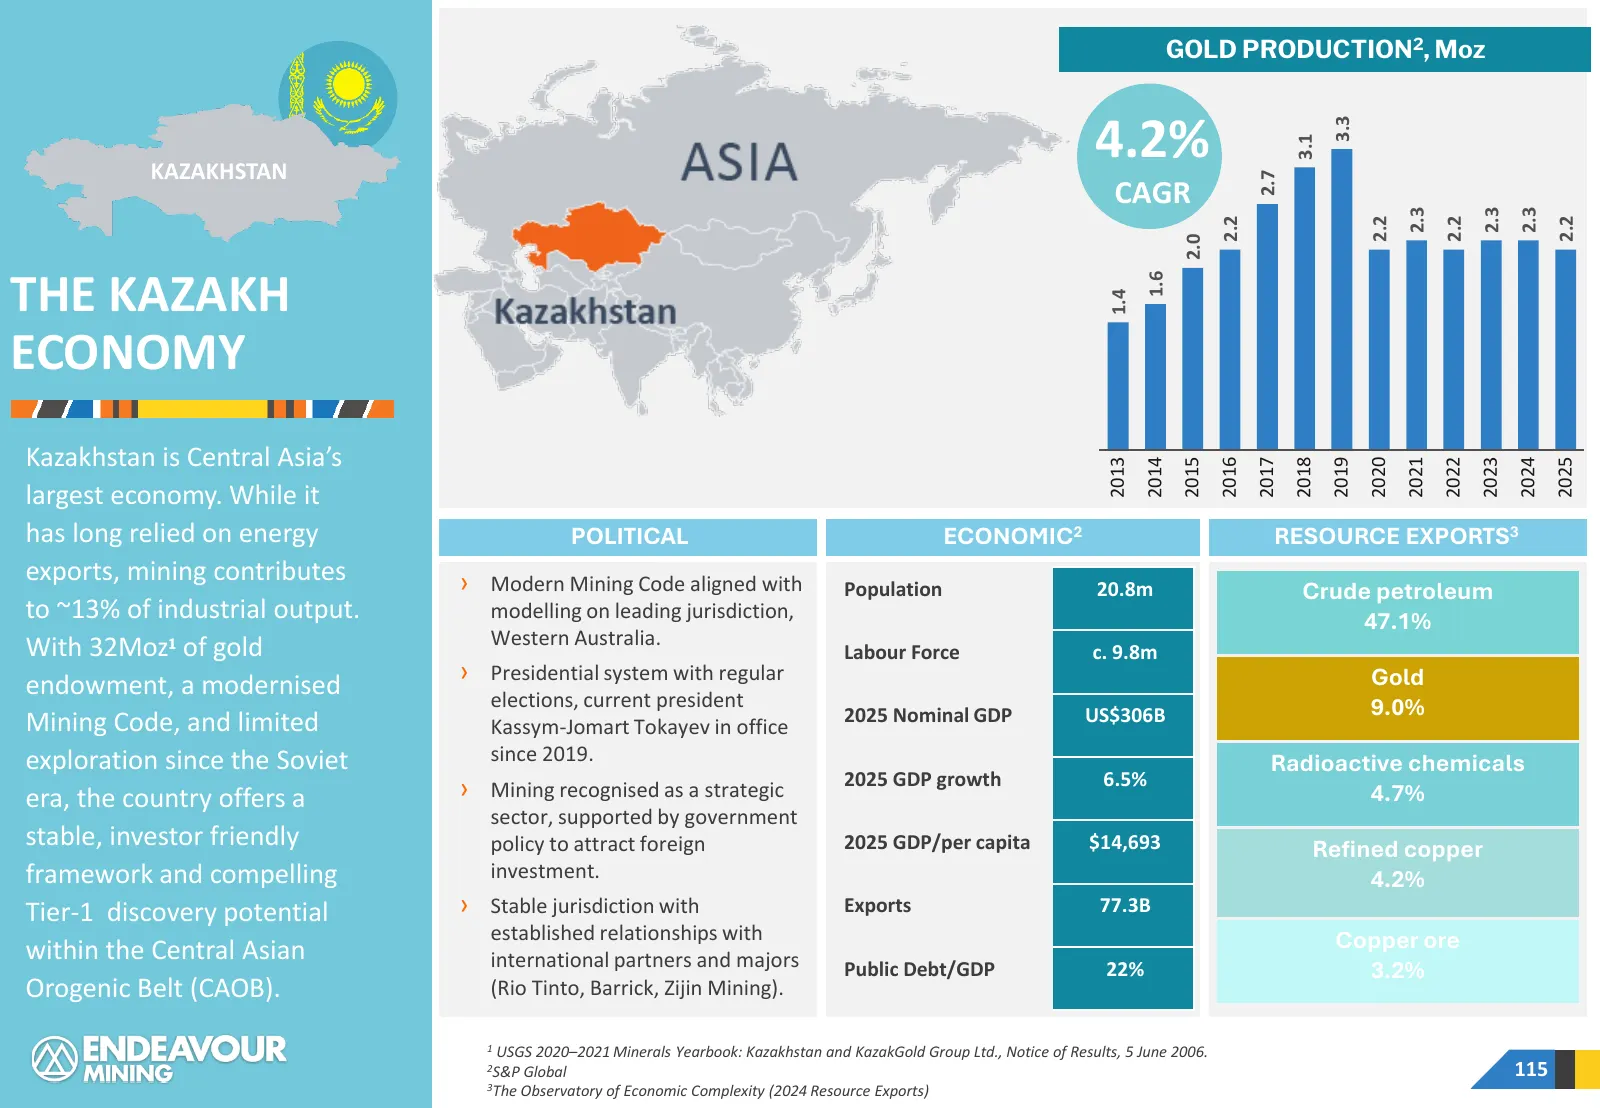
GOLD PRODUCTION2, Moz 4.2% 3.3 3.1 KAZAKHSTAN 2.7 CAGR 2.3 2.3 2.3 2.2 2.2 2.2 2.2 2.0 1.6 THE KAZAKH 1.4 ECONOMY Kazakhstan is Central Asia’s 2021 2013 2014 2015 2016 2017 2018 2019 2020 2022 2023 2024 2025 largest economy. While it has long relied on energy POLITICAL ECONOMIC2 RESOURCE EXPORTS3 ex
Slide 116: The Guiana Shield
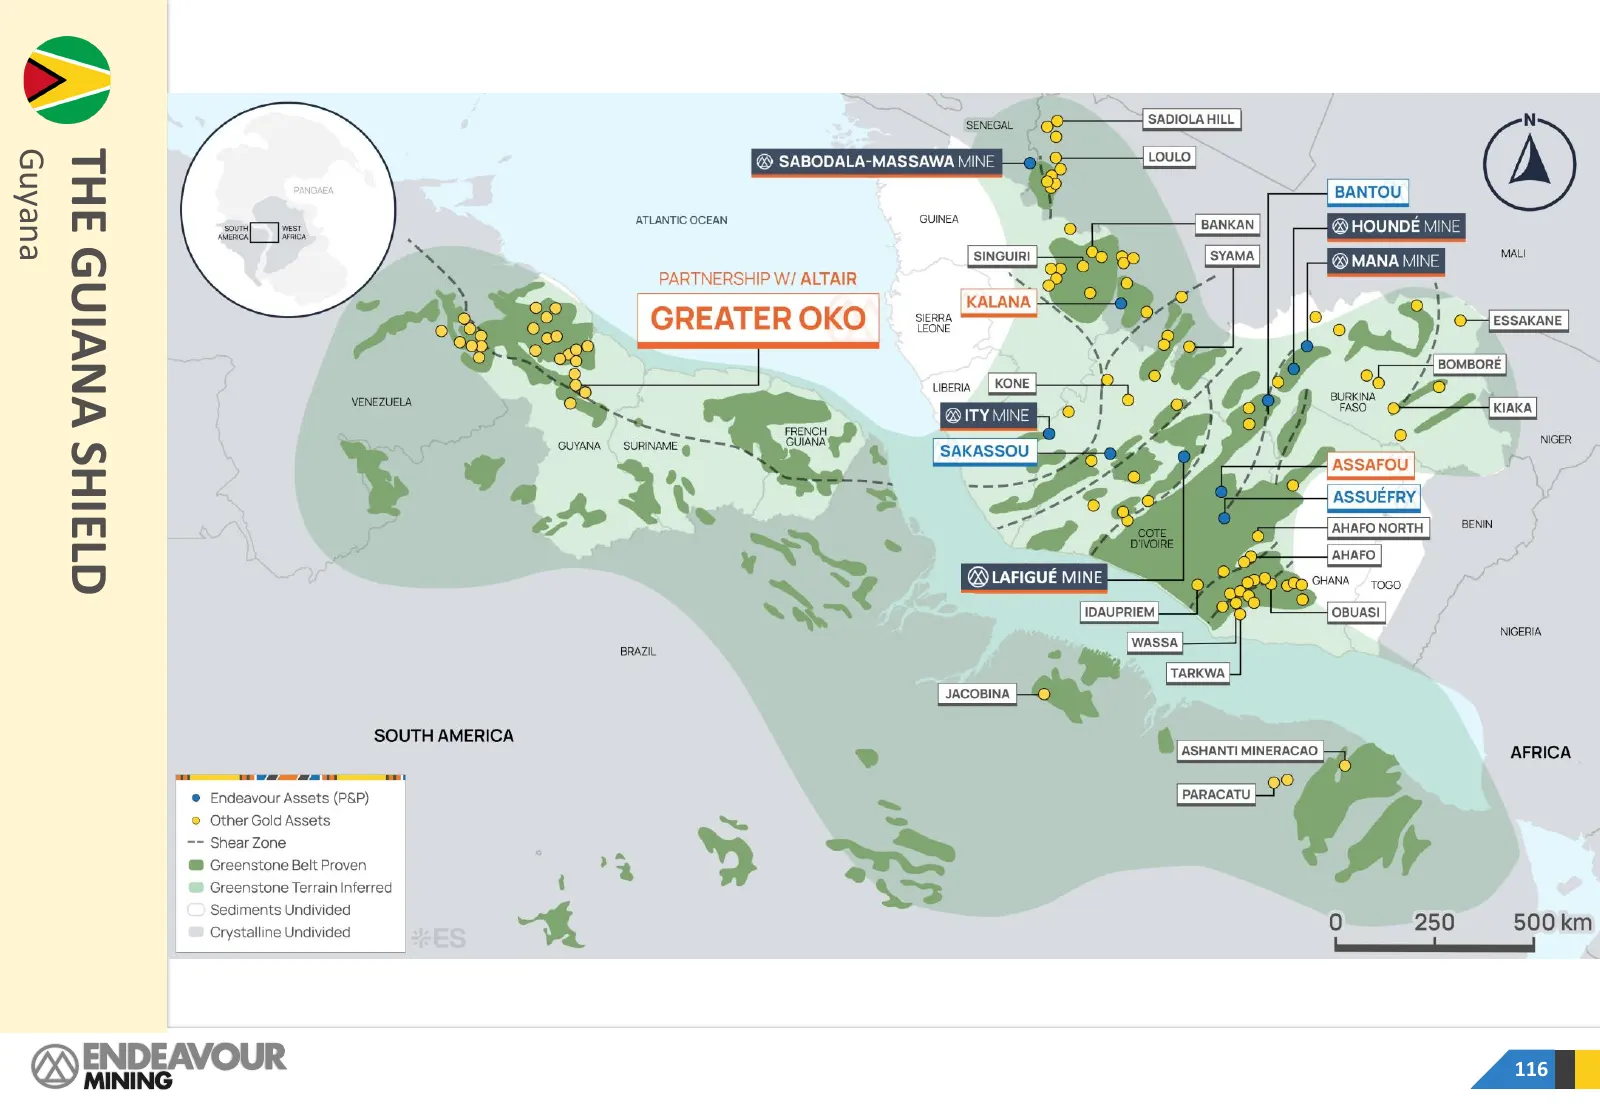
“ ATLANTIC OCEAN eueAny Q1SIHS VNVIND JHL PARTNERSHIP W/ ALTAIR | GREATER OKO | KALANA H tee om ») BOMBORE : os smu LIBERIA BRAZIL SOUTH AMERICA AFRICA © Endeavour Assets (PEP) © Other Gold Assets ~ = Shear Zone : @ Greenstone Belt Proven ' > Greenstone Terrain Inferred ru Sediments Undivided Crysta
Slide 117: Altair Minerals
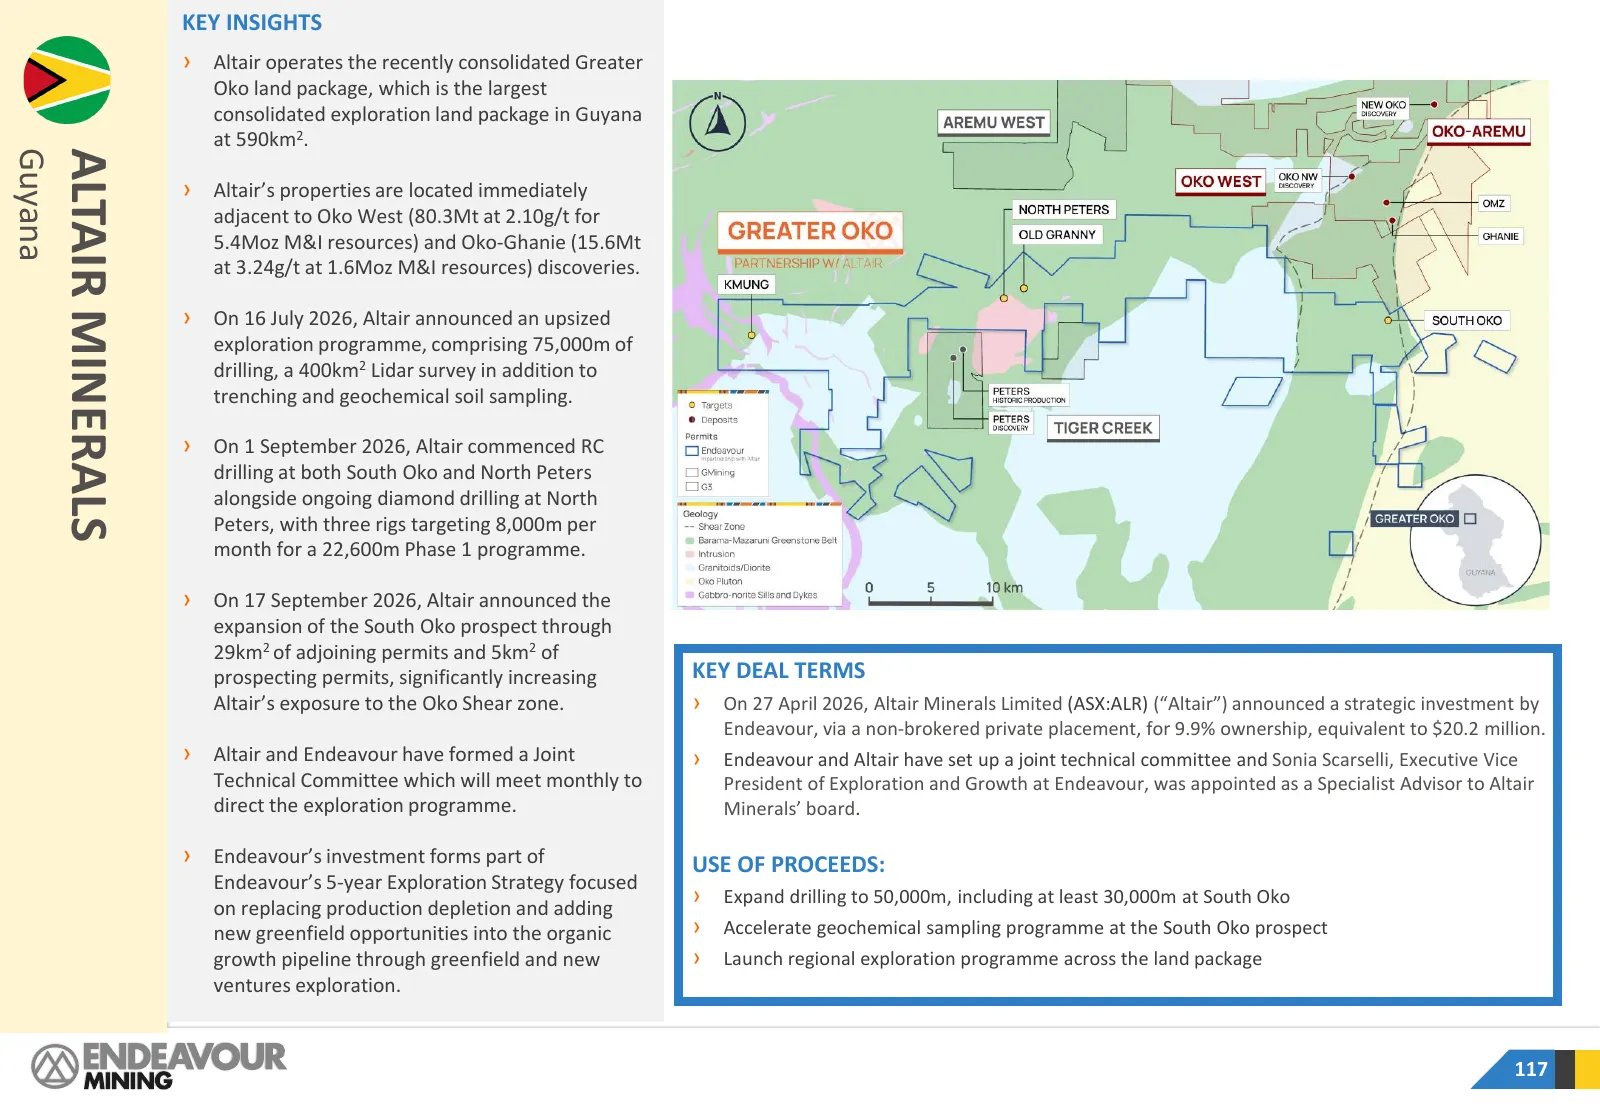
KEY INSIGHTS › Altair operates the recently consolidated Greater Oko land package, which is the largest consolidated exploration land package in Guyana at 590km2. Guyana ALTAIR MINERALS › Altair’s properties are located immediately adjacent to Oko West (80.3Mt at 2.10g/t for 5.4Moz M&I resources) an
Slide 118: The Guyanese Economy
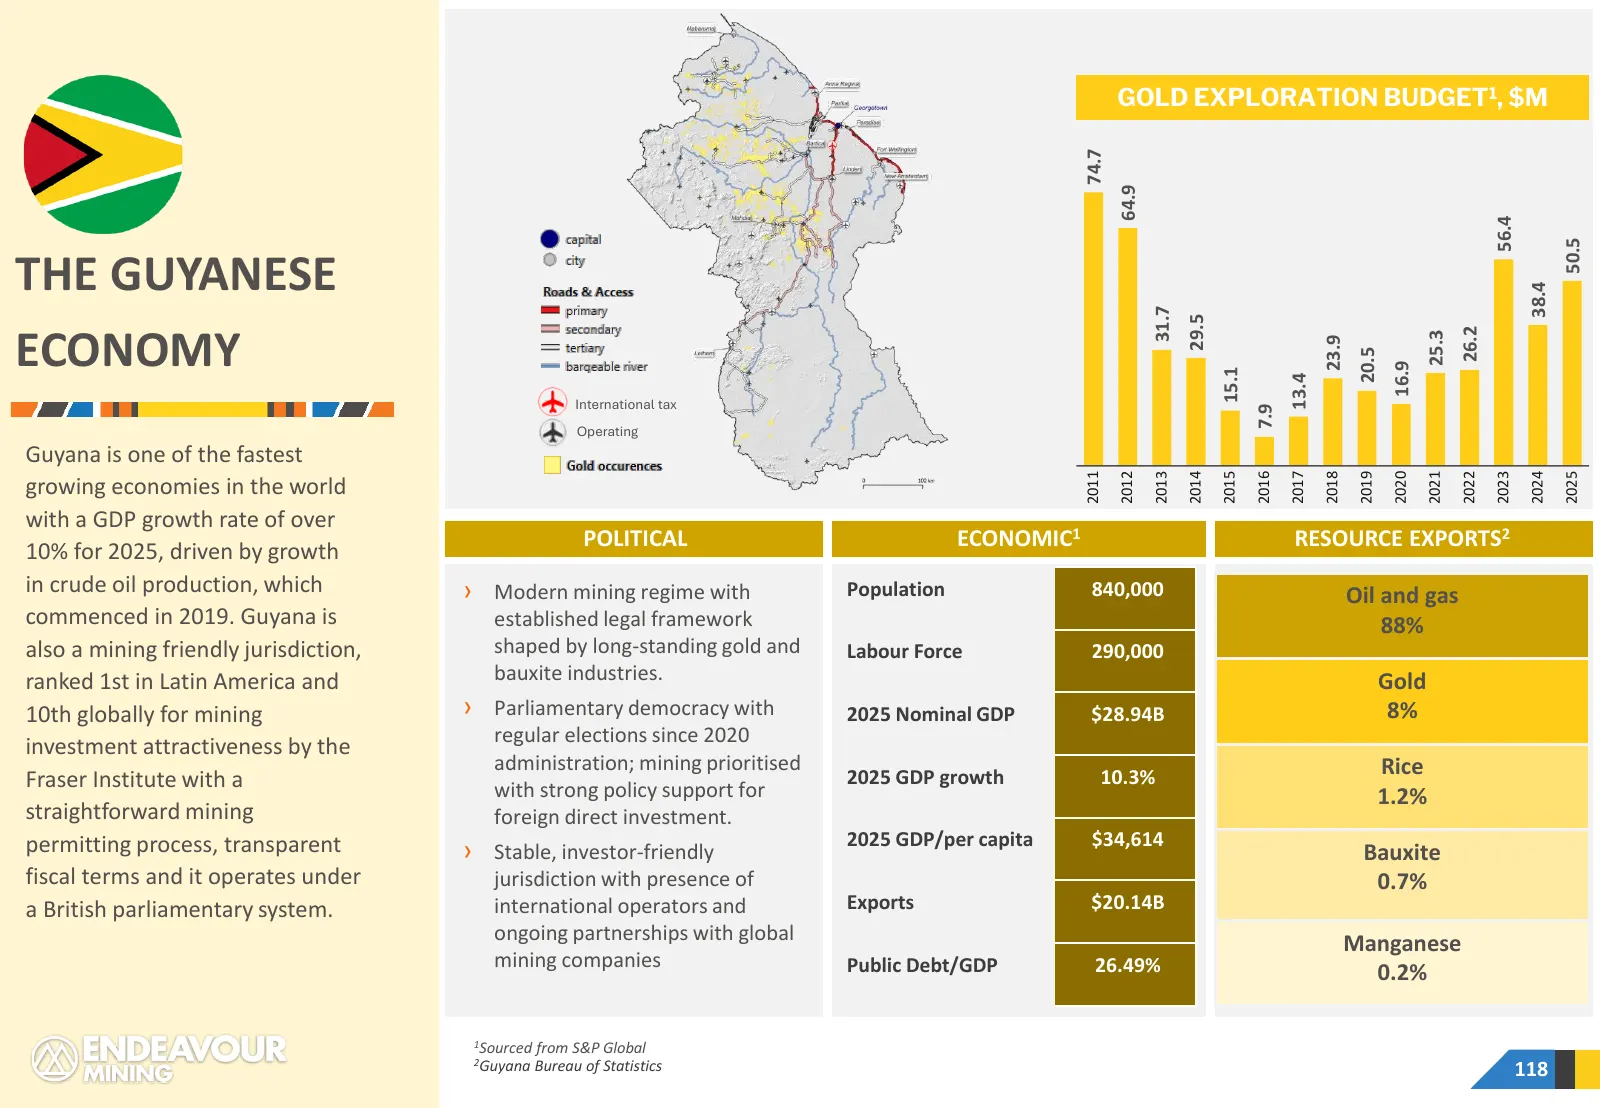
GOLD EXPLORATION BUDGET1, $M 74.7 64.9 56.4 50.5 THE GUYANESE 38.4 31.7 29.5 26.2 ECONOMY 25.3 23.9 20.5 16.9 15.1 13.4 International tax 7.9 Operating Guyana is one of the fastest 2011 2012 2013 2014 2015 2016 2017 2018 2019 2020 2021 2022 2023 2024 2025 growing economies in the world with a GDP gr
Slide 119: Kalana Project
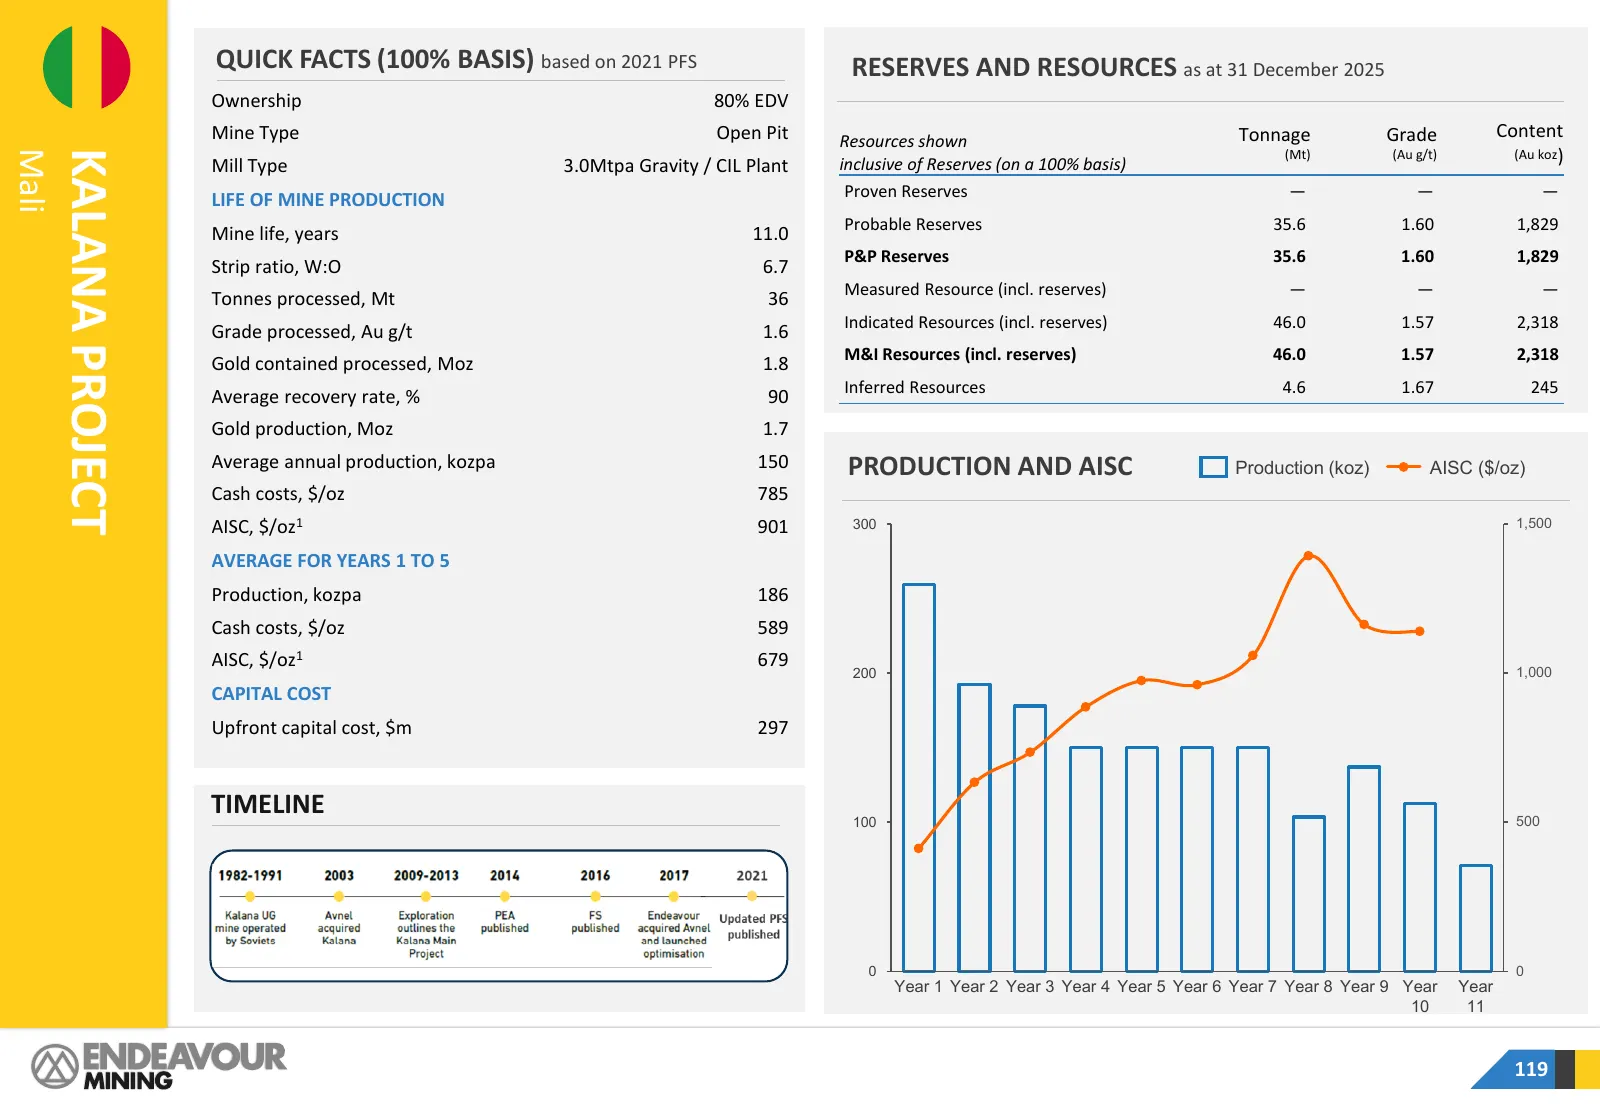
QUICK FACTS (100% BASIS) based on 2021 PFS RESERVES AND RESOURCES as at 31 December 2025 Ownership 80% EDV Mine Type Open Pit Tonnage Grade Content Resources shown (Au koz) Mali KALANA PROJECT (Mt) (Au g/t) Mill Type 3.0Mtpa Gravity / CIL Plant inclusive of Reserves (on a 100% basis) LIFE OF MINE PR
Slide 120: Working as a Trusted Partner
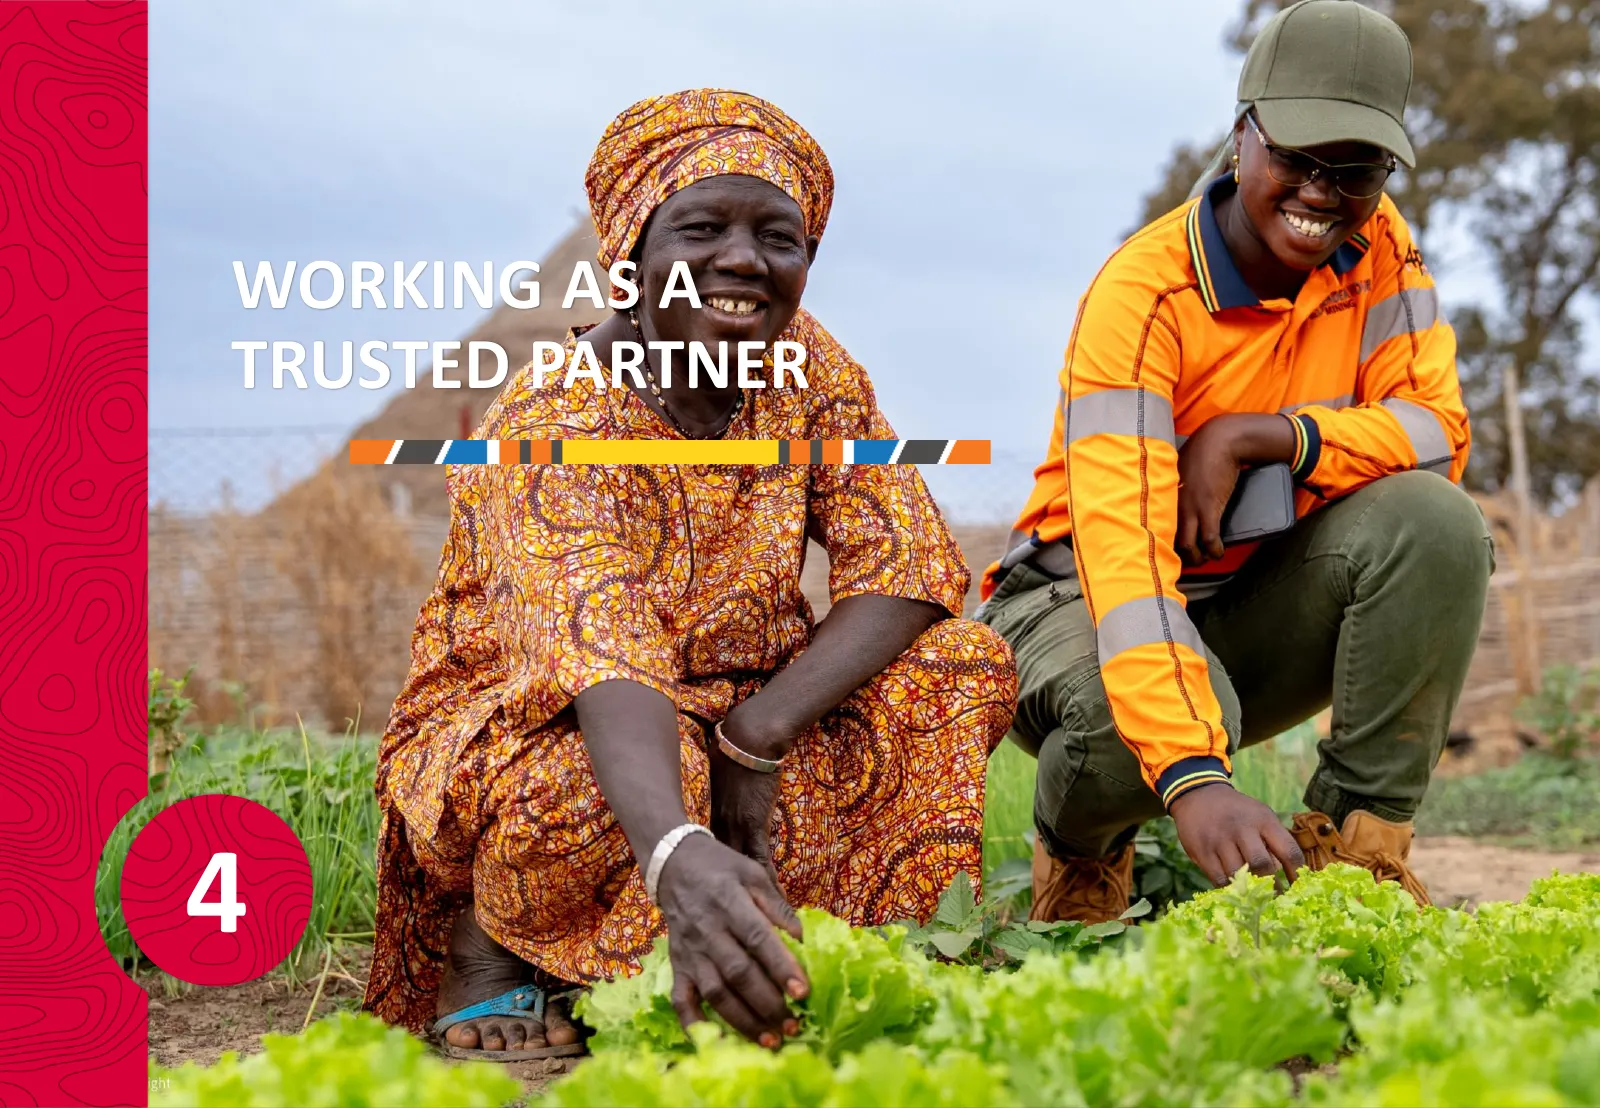
WORKING AS A TRUSTED PARTNER 4
Slide 121: Launching ESG 2030
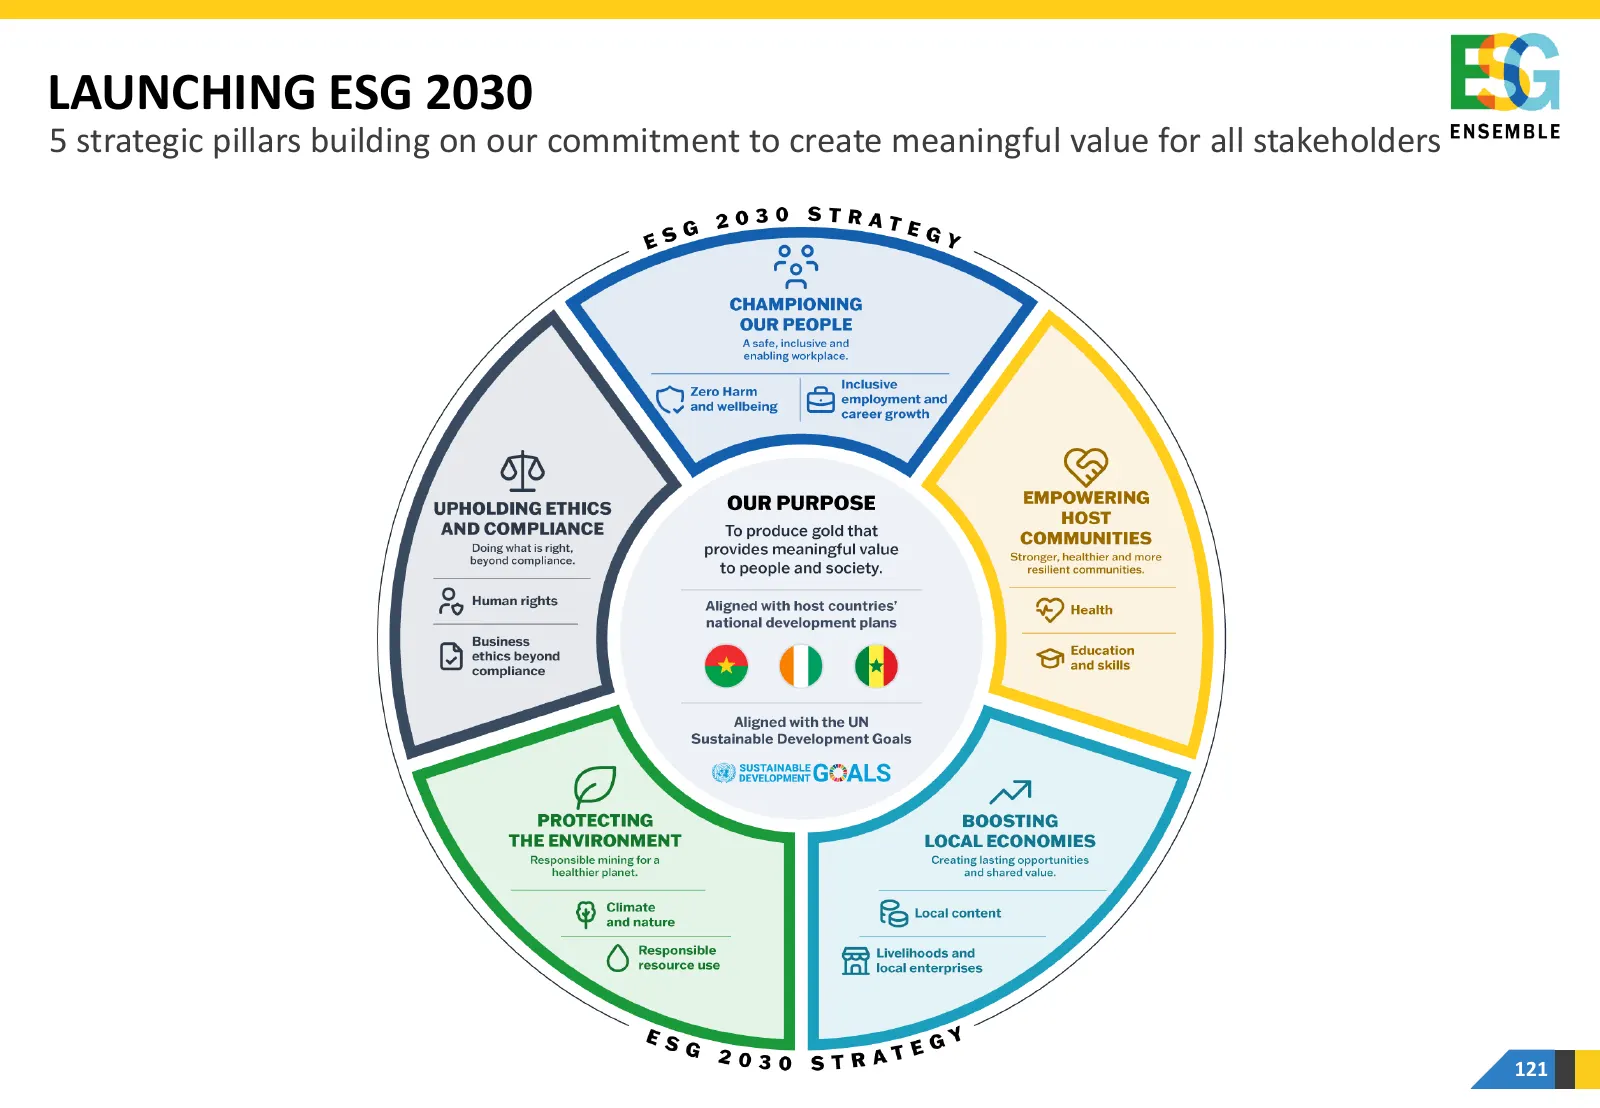
LAUNCHING ESG 2030 5 strategic pillars building on our commitment to create meaningful value for all stakeholders 121
Slide 122: Vision: ESG 2030
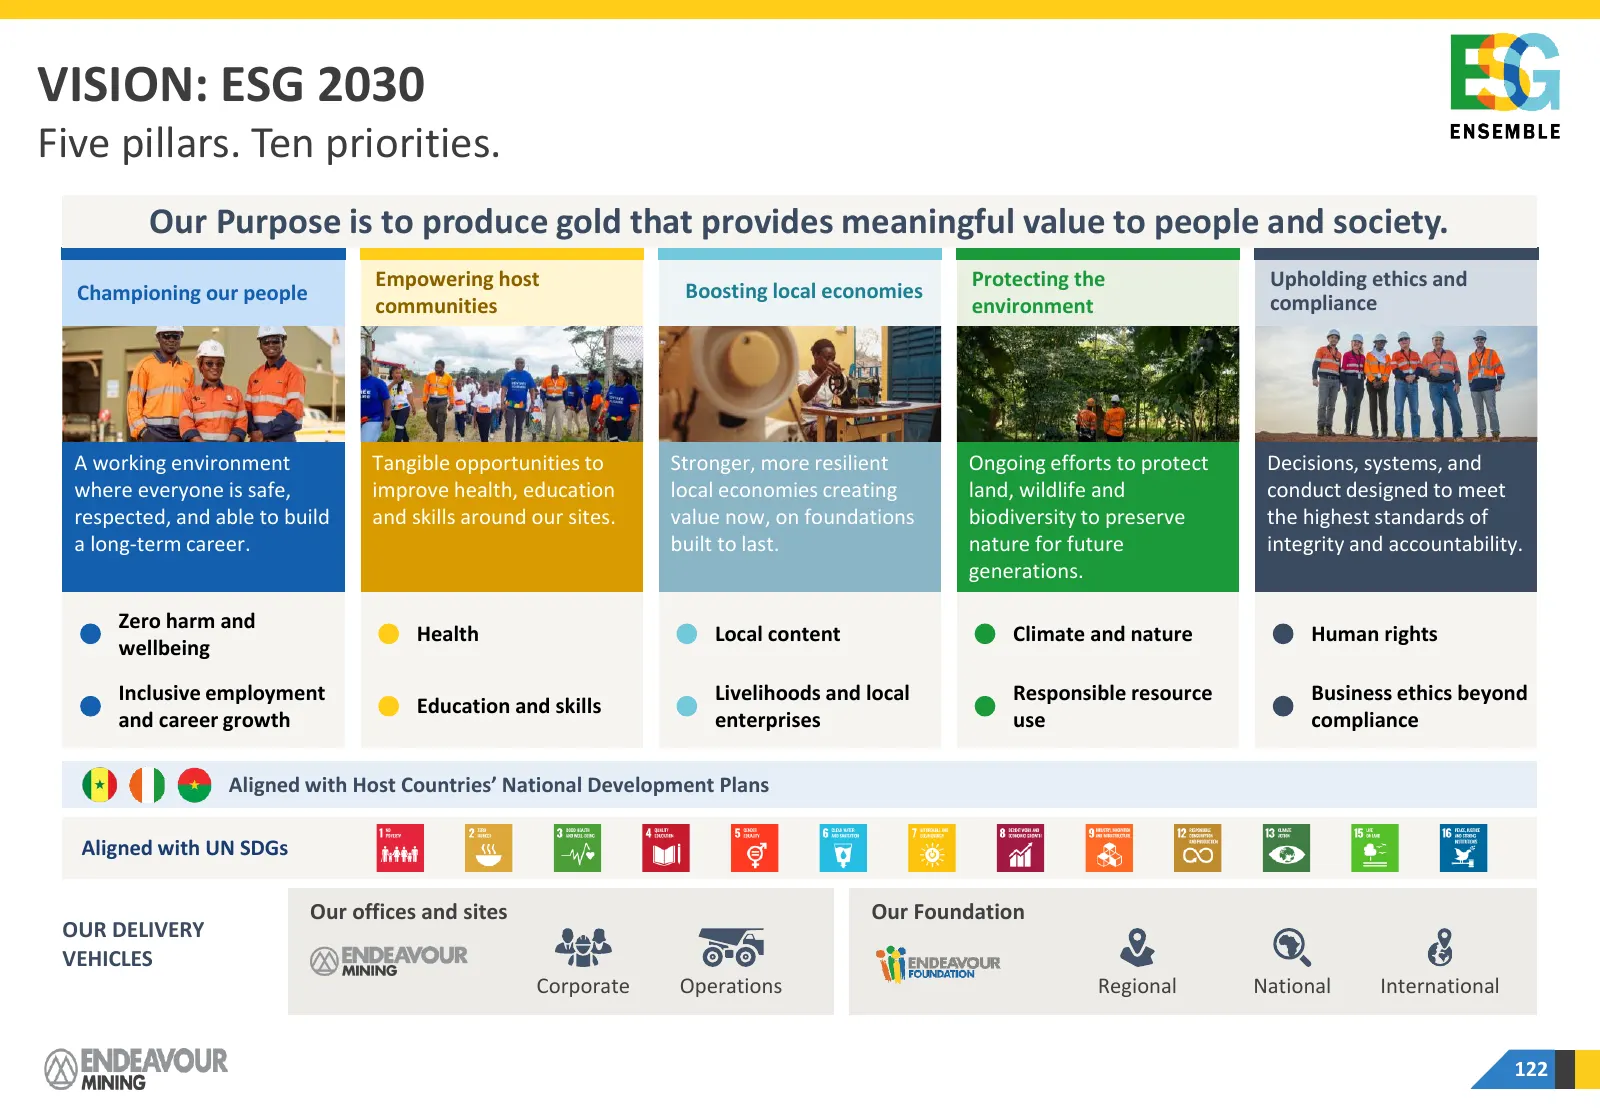
VISION: ESG 2030 Five pillars. Ten priorities. Our Purpose is to produce gold that provides meaningful value to people and society. Empowering host Protecting the Upholding ethics and Championing our people Boosting local economies communities environment compliance A working environment Tangible op
Slide 123: Being a Trusted Partner
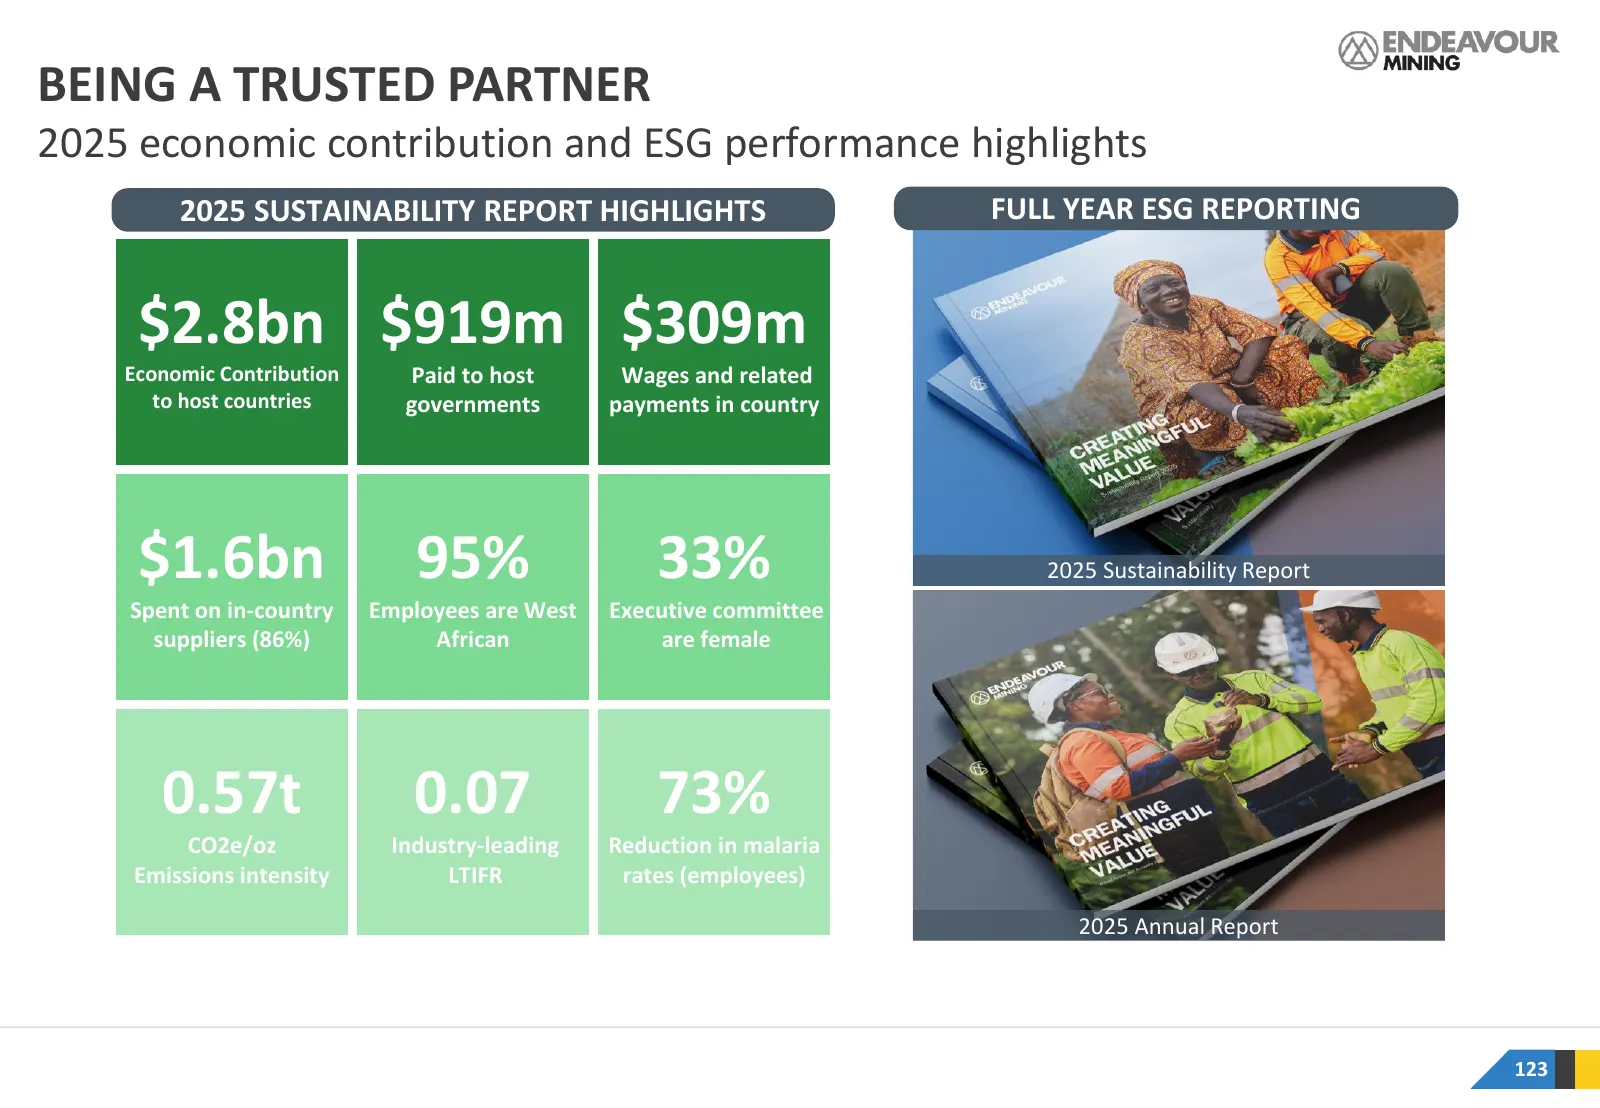
BEING A TRUSTED PARTNER 2025 economic contribution and ESG performance highlights 2025 SUSTAINABILITY REPORT HIGHLIGHTS FULL YEAR ESG REPORTING $2.8bn $919m $309m Economic Contribution Paid to host Wages and related to host countries governments payments in country $1.6bn 95% 33% 2025 Sustainability
Slide 124: Being a Trusted Partner: ESG Phase 1 Impact
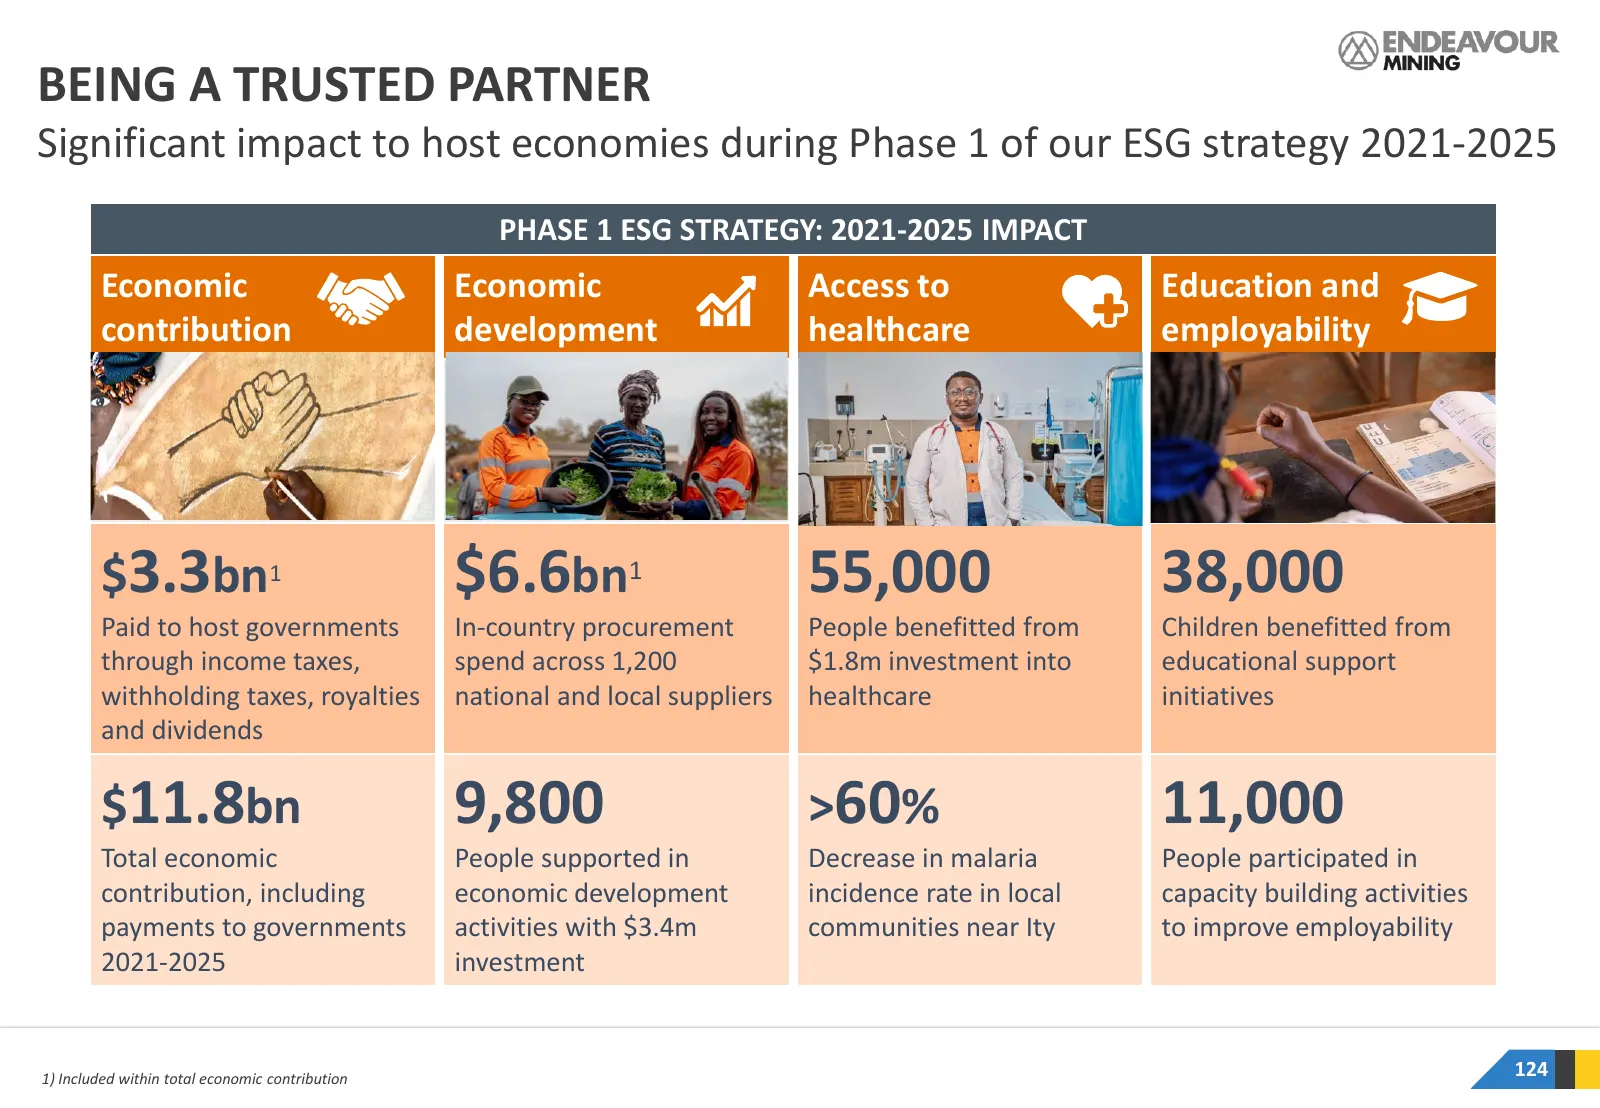
BEING A TRUSTED PARTNER Significant impact to host economies during Phase 1 of our ESG strategy 2021-2025 PHASE 1 ESG STRATEGY: 2021-2025 IMPACT Economic Economic Access to Education and contribution development healthcare employability $3.3bn1 $6.6bn1 55,000 38,000 Paid to host governments In-count
Slide 125: Continuous Improvement in ESG Ratings
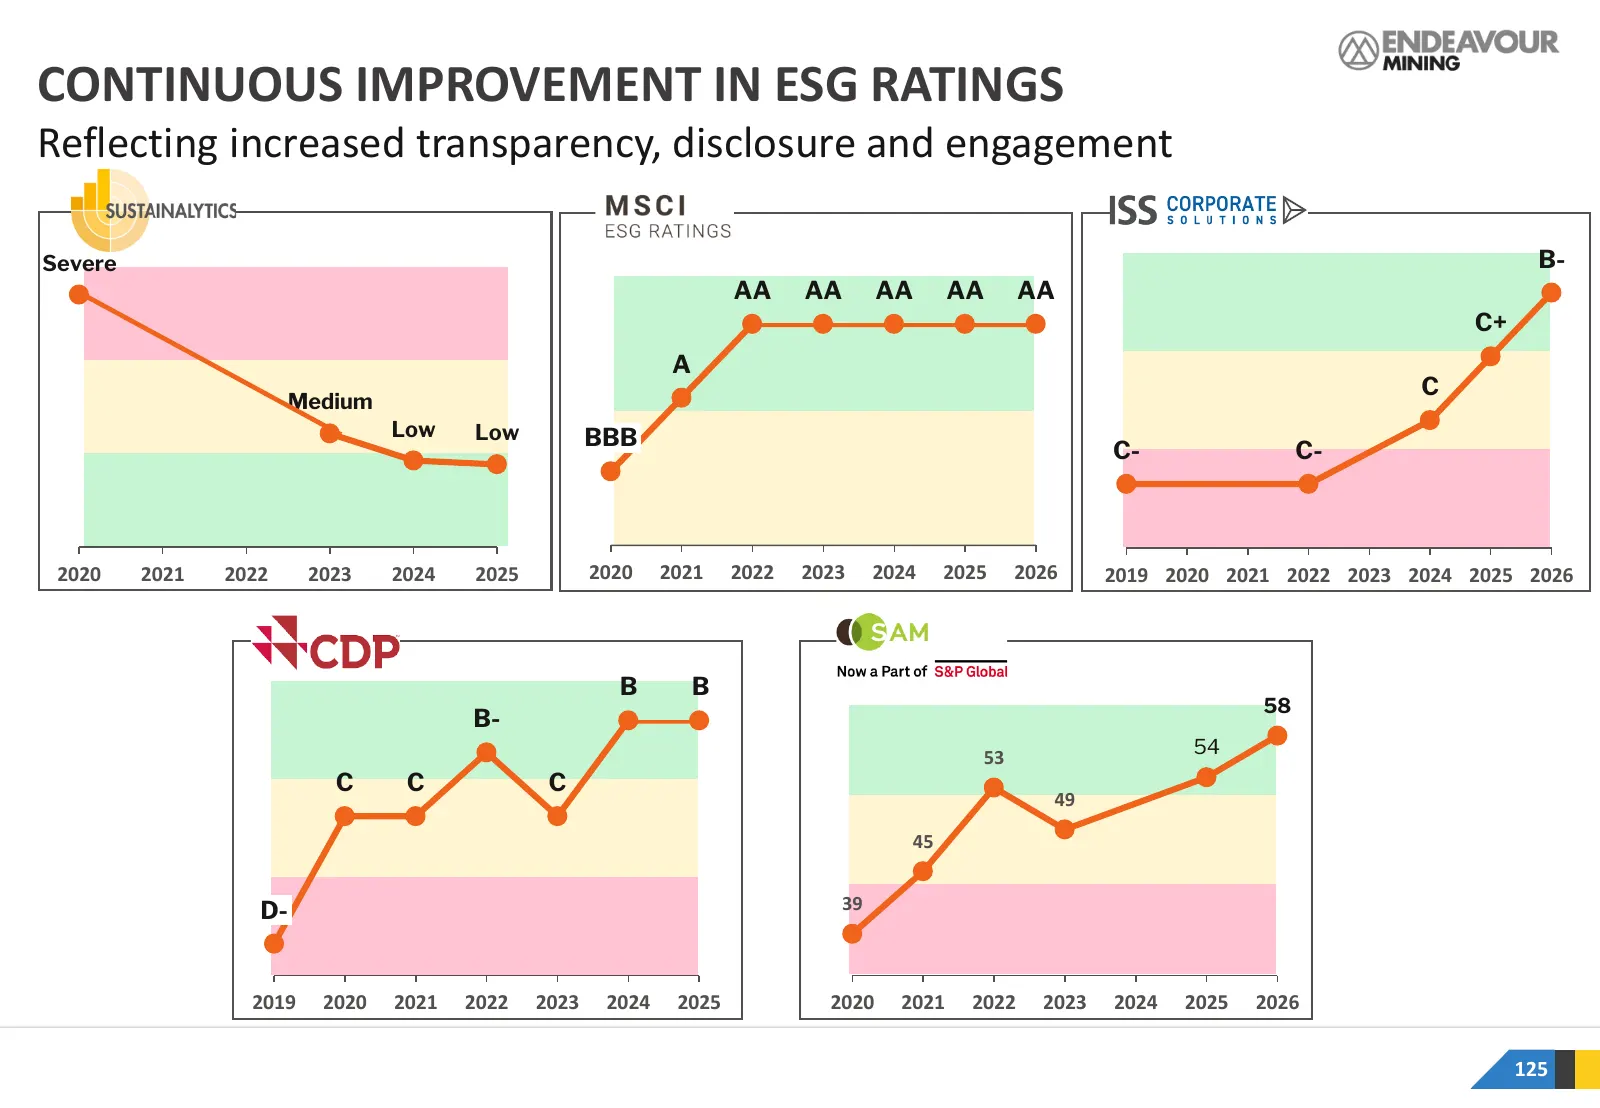
CONTINUOUS IMPROVEMENT IN ESG RATINGS Reflecting increased transparency, disclosure and engagement Severe B- AA AA AA AA AA C+ A C Medium Low Low BBB C- C- 2020 2021 2022 2023 2024 2025 2020 2021 2022 2023 2024 2025 2026 2019 2020 2021 2022 2023 2024 2025 2026 B B 58 B- 54 53 C C C 49 45 D- 39 2019
Slide 126: Towards Net Zero
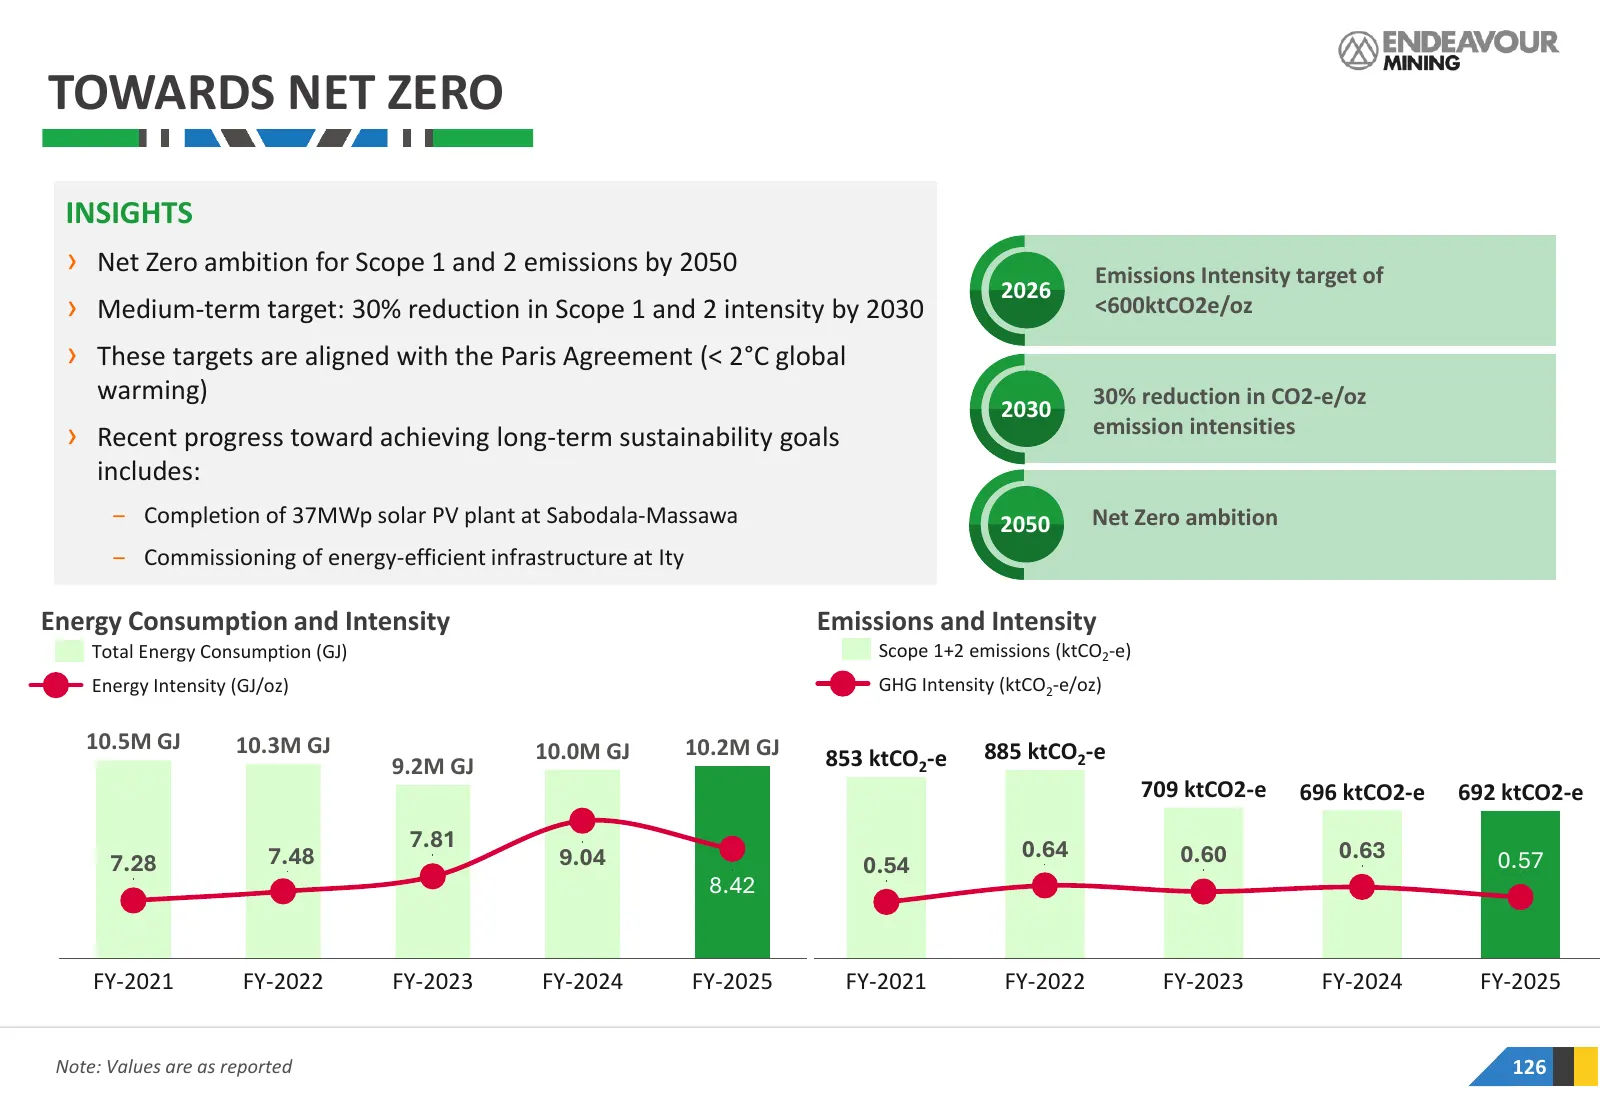
TOWARDS NET ZERO INSIGHTS › Net Zero ambition for Scope 1 and 2 emissions by 2050 Emissions Intensity target of 2026 › Medium-term target: 30% reduction in Scope 1 and 2 intensity by 2030 <600ktCO2e/oz › These targets are aligned with the Paris Agreement (< 2°C global warming) 30% reduction in CO2-e
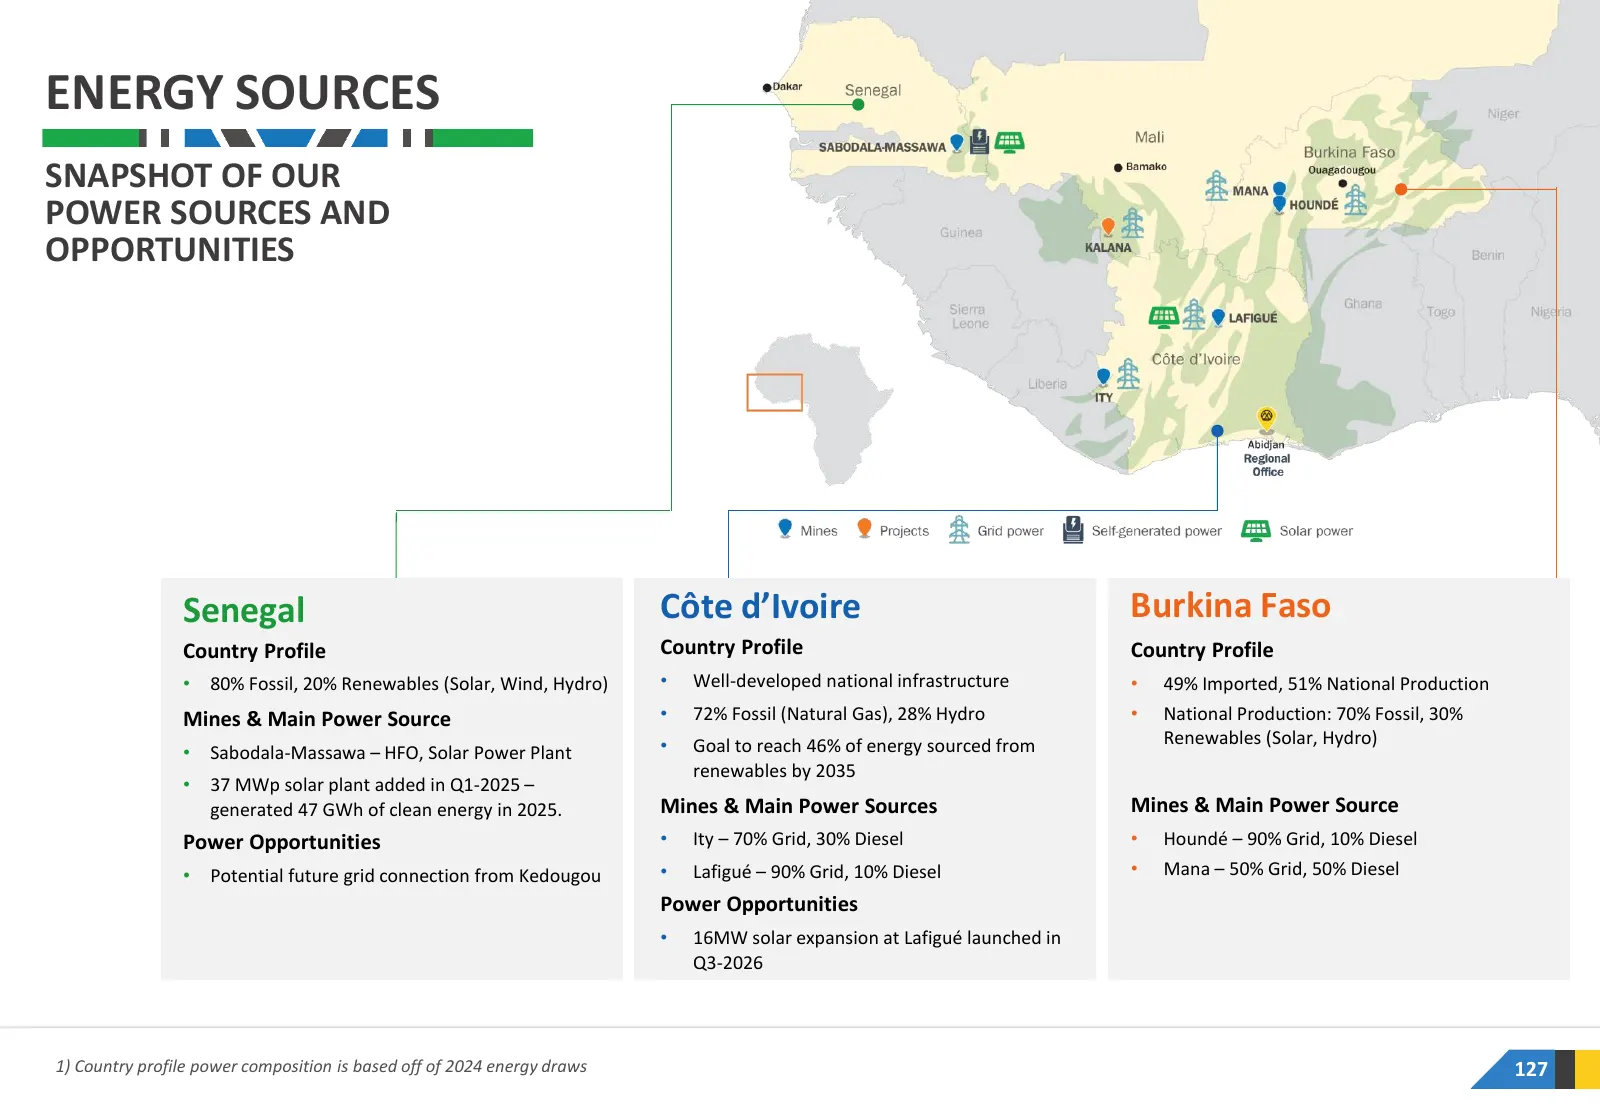
Slide 127: Energy Sources
ENERGY SOURCES SNAPSHOT OF OUR POWER SOURCES AND OPPORTUNITIES Senegal Côte d’Ivoire Burkina Faso Country Profile Country Profile Country Profile • 80% Fossil, 20% Renewables (Solar, Wind, Hydro) • Well-developed national infrastructure • 49% Imported, 51% National Production Mines & Main Power Sour
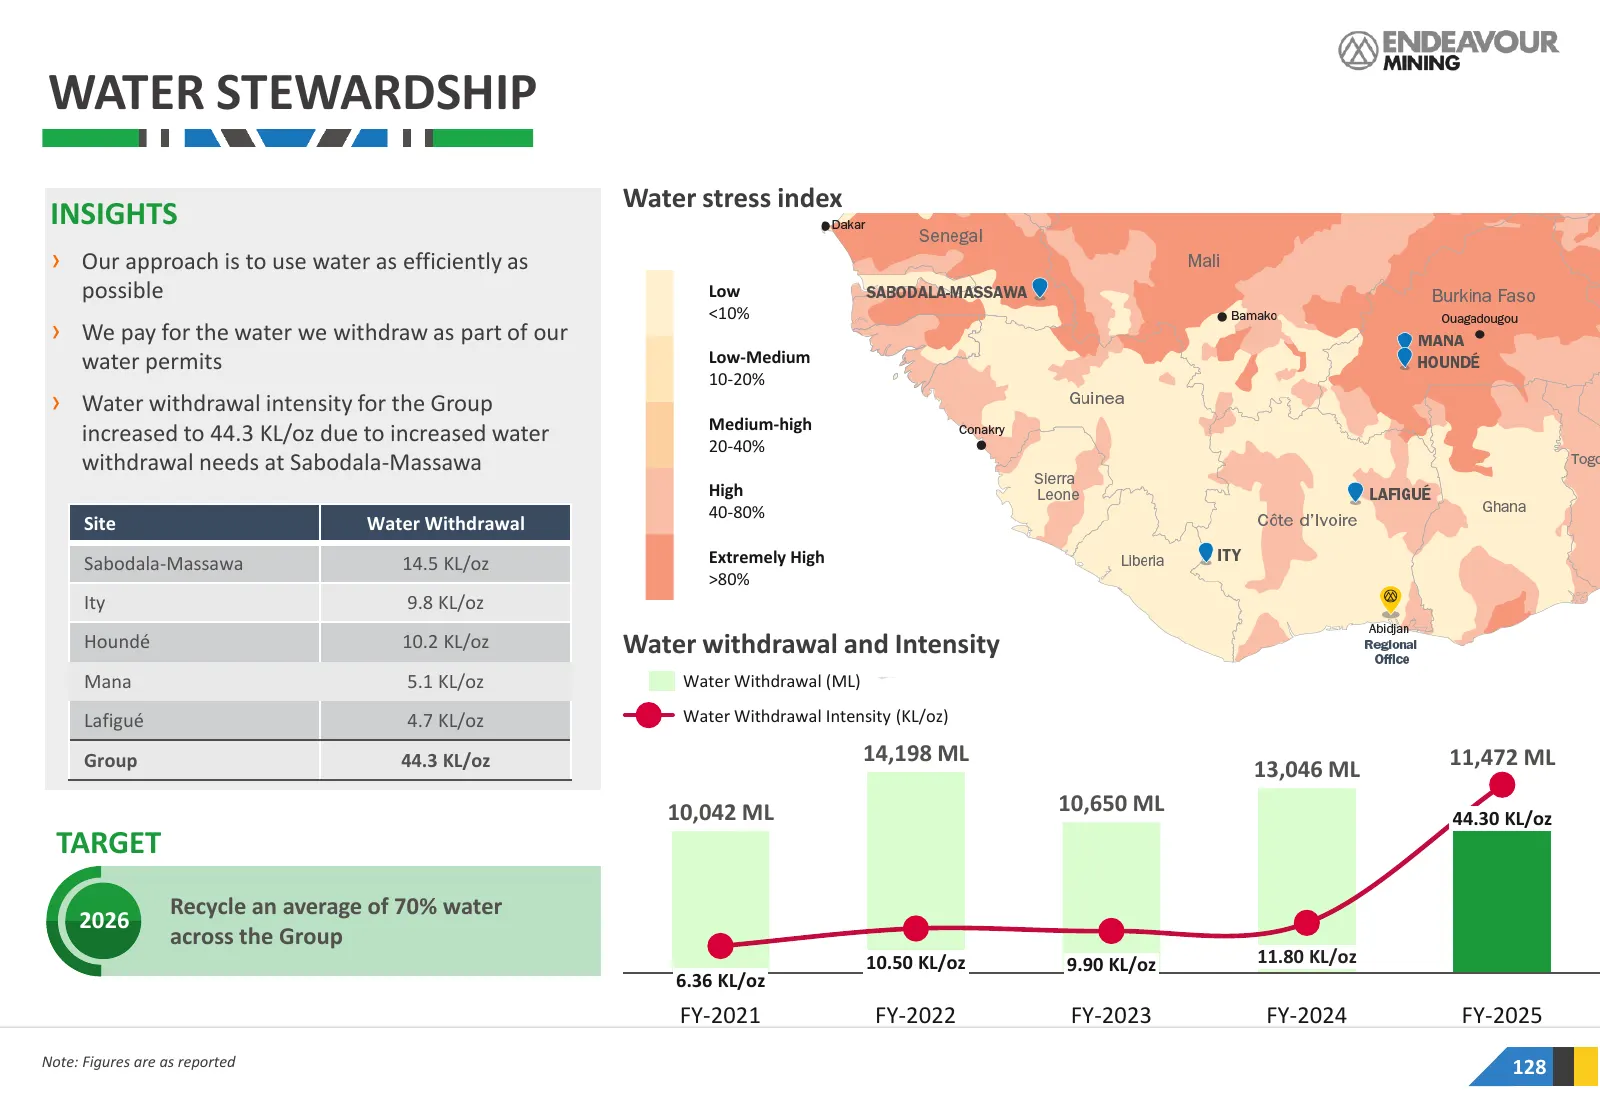
Slide 128: Water Stewardship
WATER STEWARDSHIP Water stress index INSIGHTS › Our approach is to use water as efficiently as possible Low <10% › We pay for the water we withdraw as part of our water permits Low-Medium 10-20% › Water withdrawal intensity for the Group Medium-high increased to 44.3 KL/oz due to increased water 20-
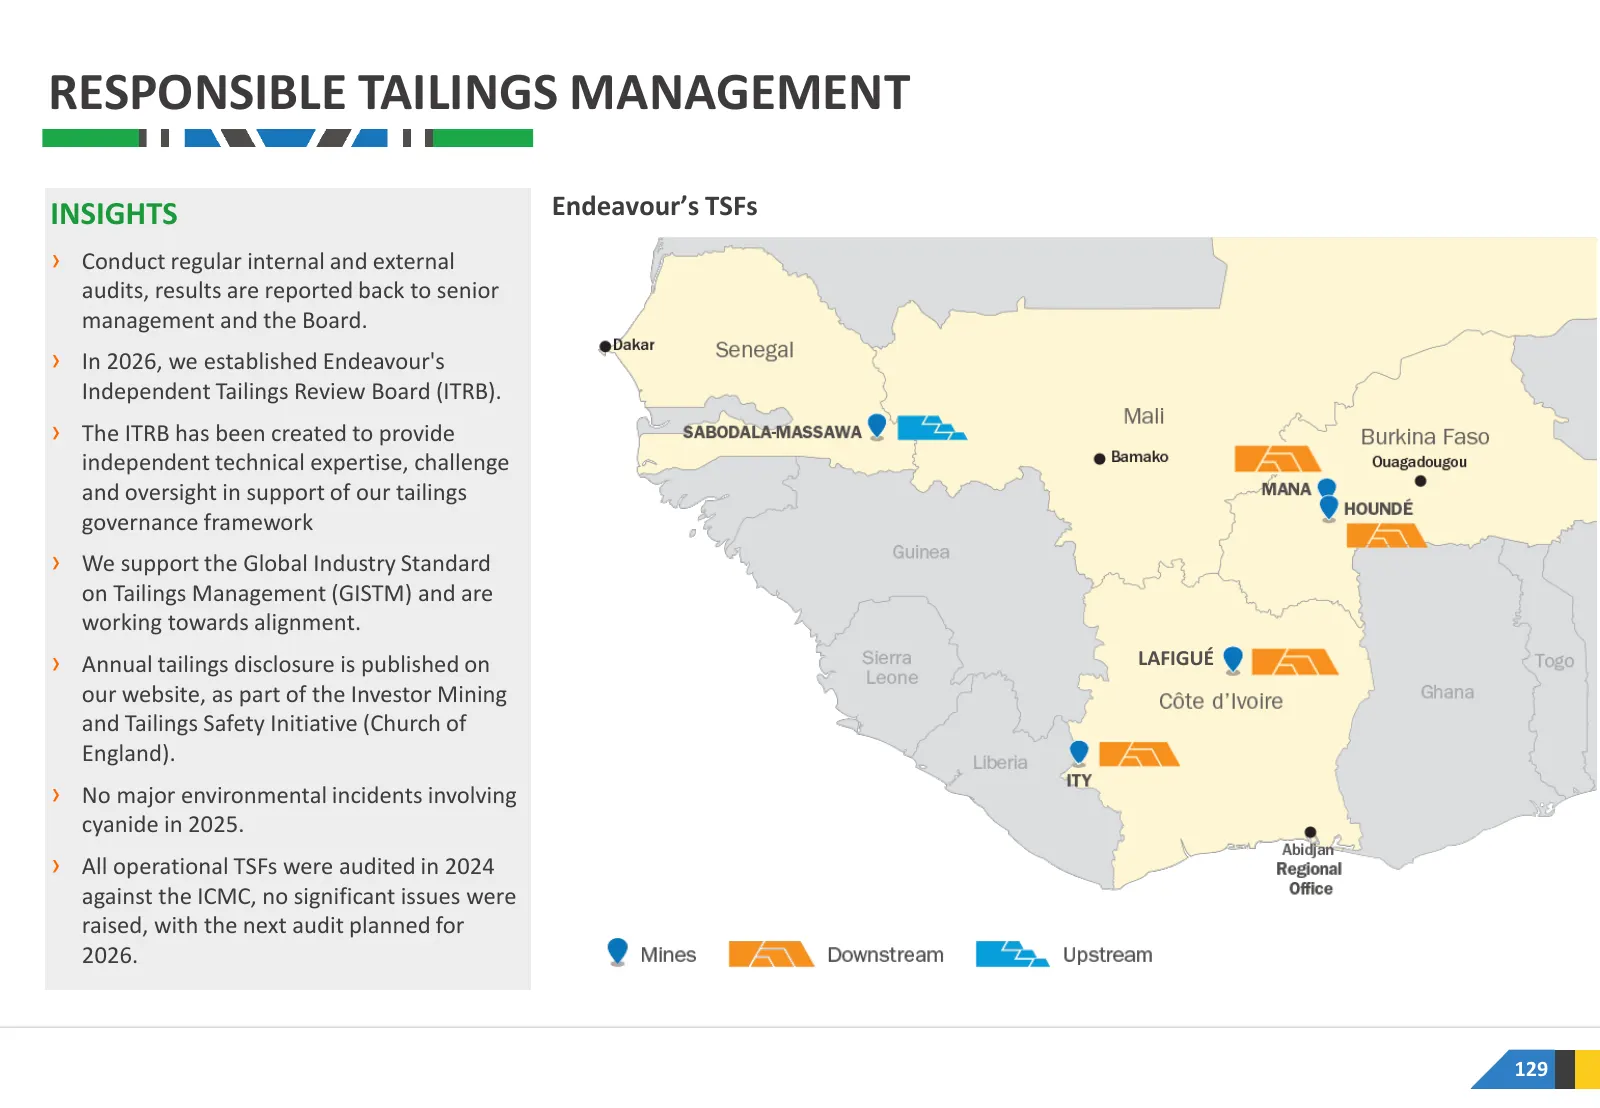
Slide 129: Responsible Tailings Management
RESPONSIBLE TAILINGS MANAGEMENT INSIGHTS Endeavour’s TSFs › Conduct regular internal and external audits, results are reported back to senior management and the Board. › In 2026, we established Endeavour's Independent Tailings Review Board (ITRB). › The ITRB has been created to provide independent t
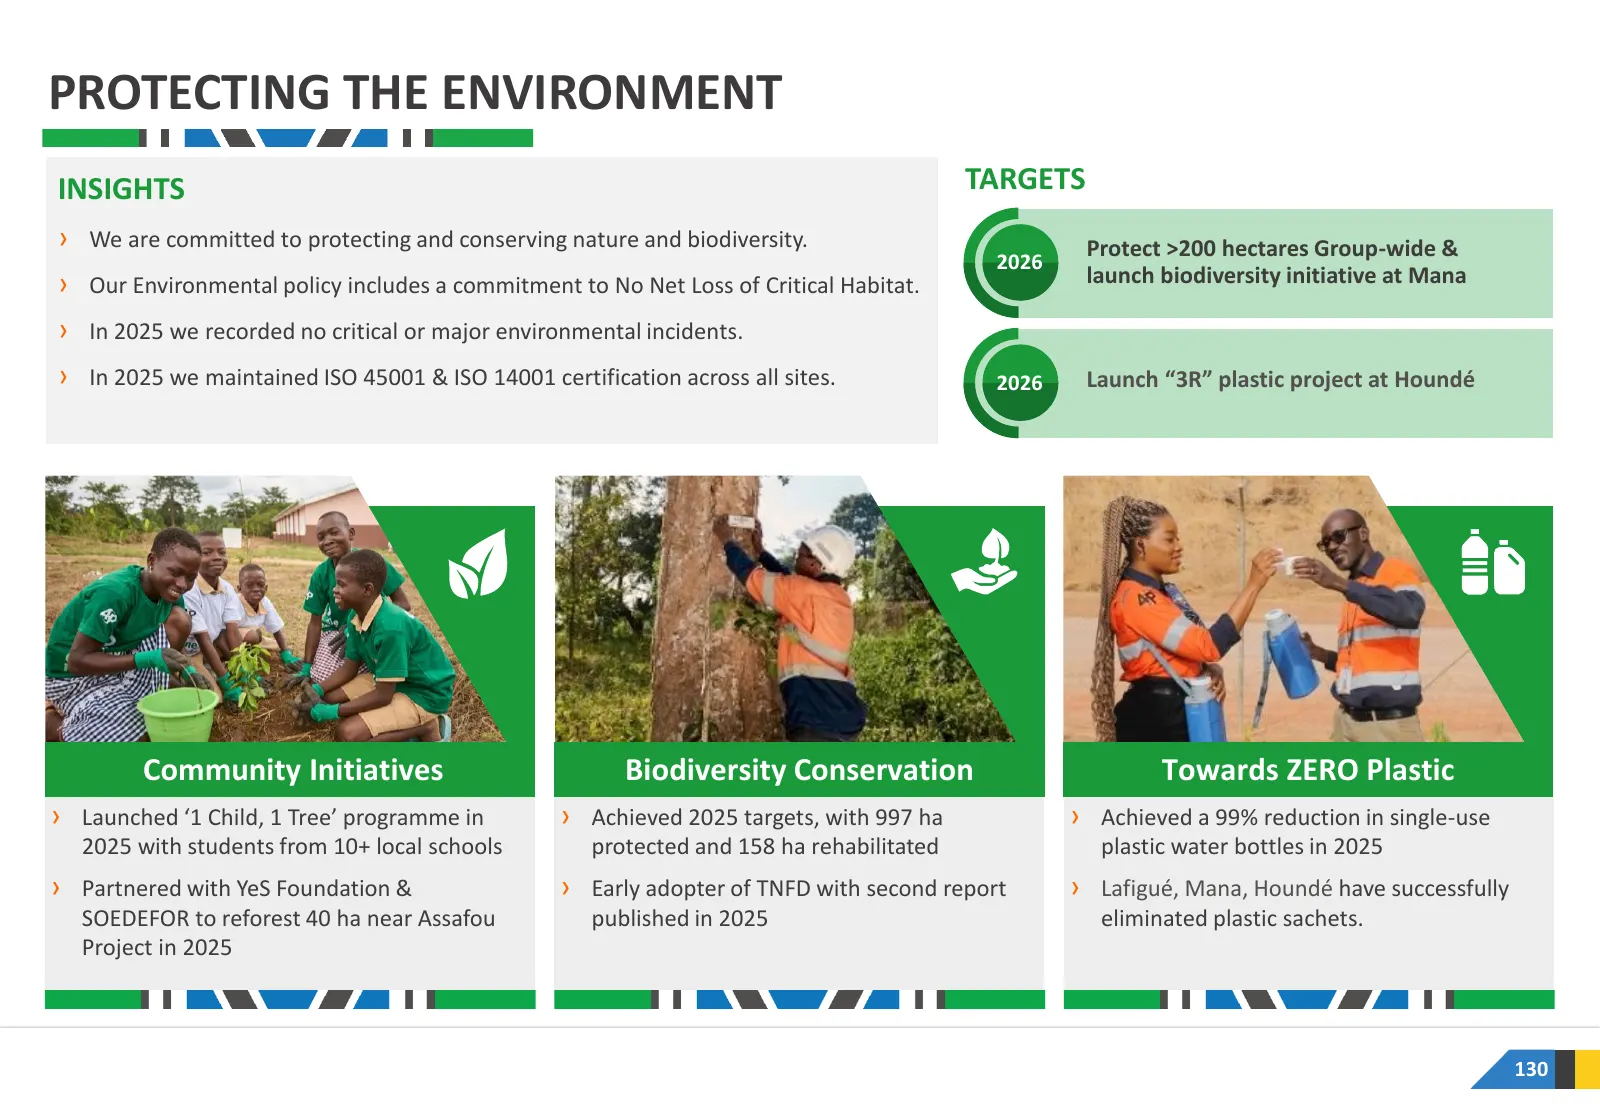
Slide 130: Protecting the Environment
PROTECTING THE ENVIRONMENT PROTECTING INSIGHTS THE ENVIRONMENT TARGETS › We are committed to protecting and conserving nature and biodiversity. Protect >200 hectares Group-wide & 2026 › Our Environmental policy includes a commitment to No Net Loss of Critical Habitat. launch biodiversity initiative
Slide 131: Creating Jobs & Upskilling Talent
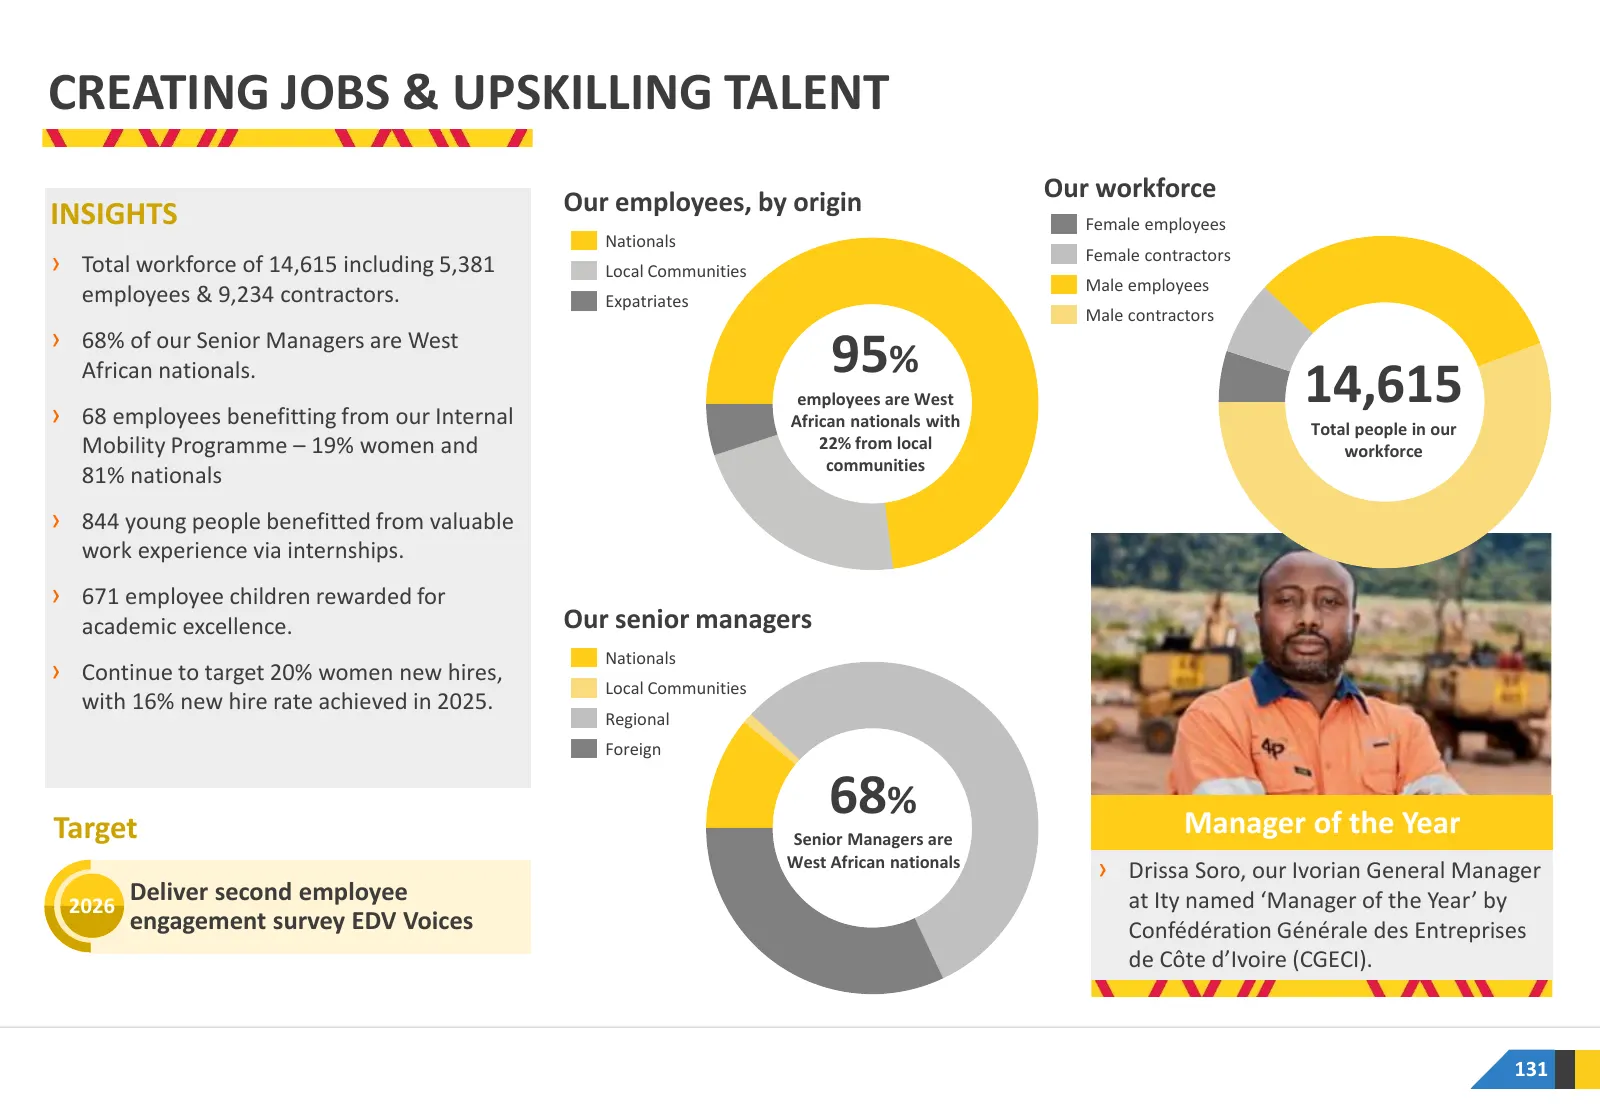
CREATING JOBS & UPSKILLING TALENT Our workforce INSIGHTS Our employees, by origin Female employees Nationals Female contractors › Total workforce of 14,615 including 5,381 Local Communities Male employees employees & 9,234 contractors. Expatriates Male contractors › 68% of our Senior Managers are We
Slide 132: Boosting Host Economies
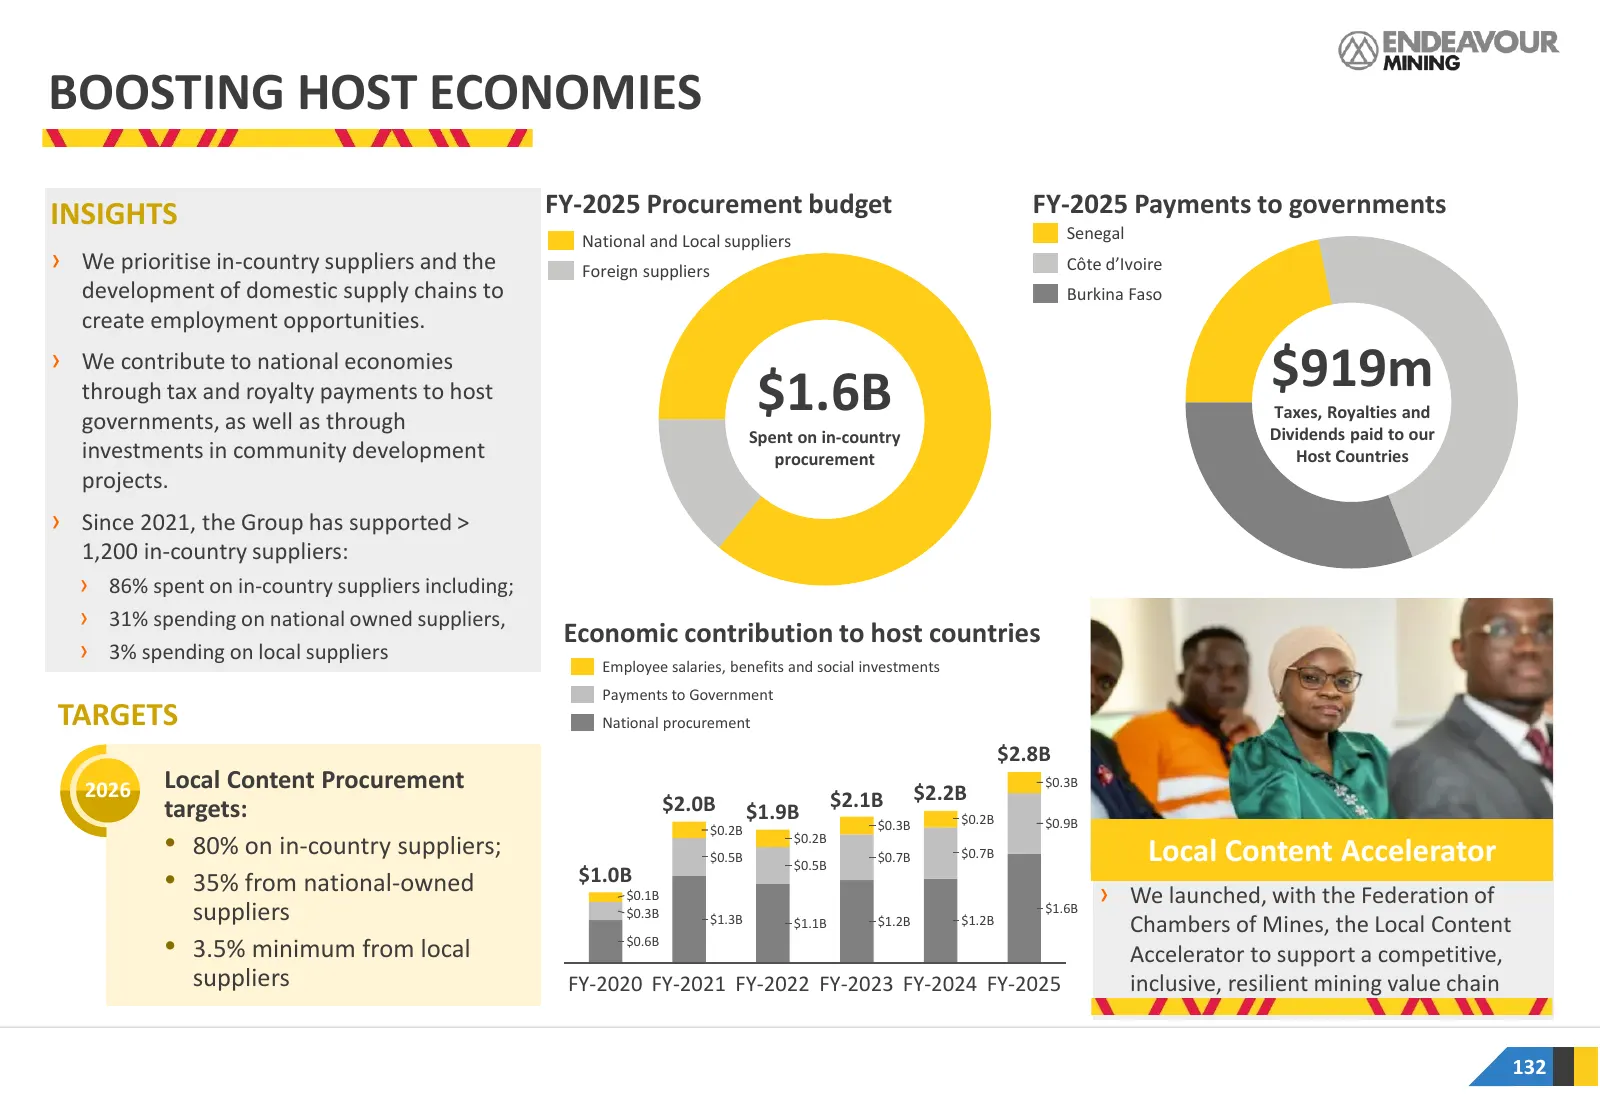
BOOSTING HOST ECONOMIES INSIGHTS FY-2025 Procurement budget FY-2025 Payments to governments National and Local suppliers Senegal › We prioritise in-country suppliers and the Foreign suppliers Côte d’Ivoire development of domestic supply chains to Burkina Faso create employment opportunities. › We co
Slide 133: Community Engagement
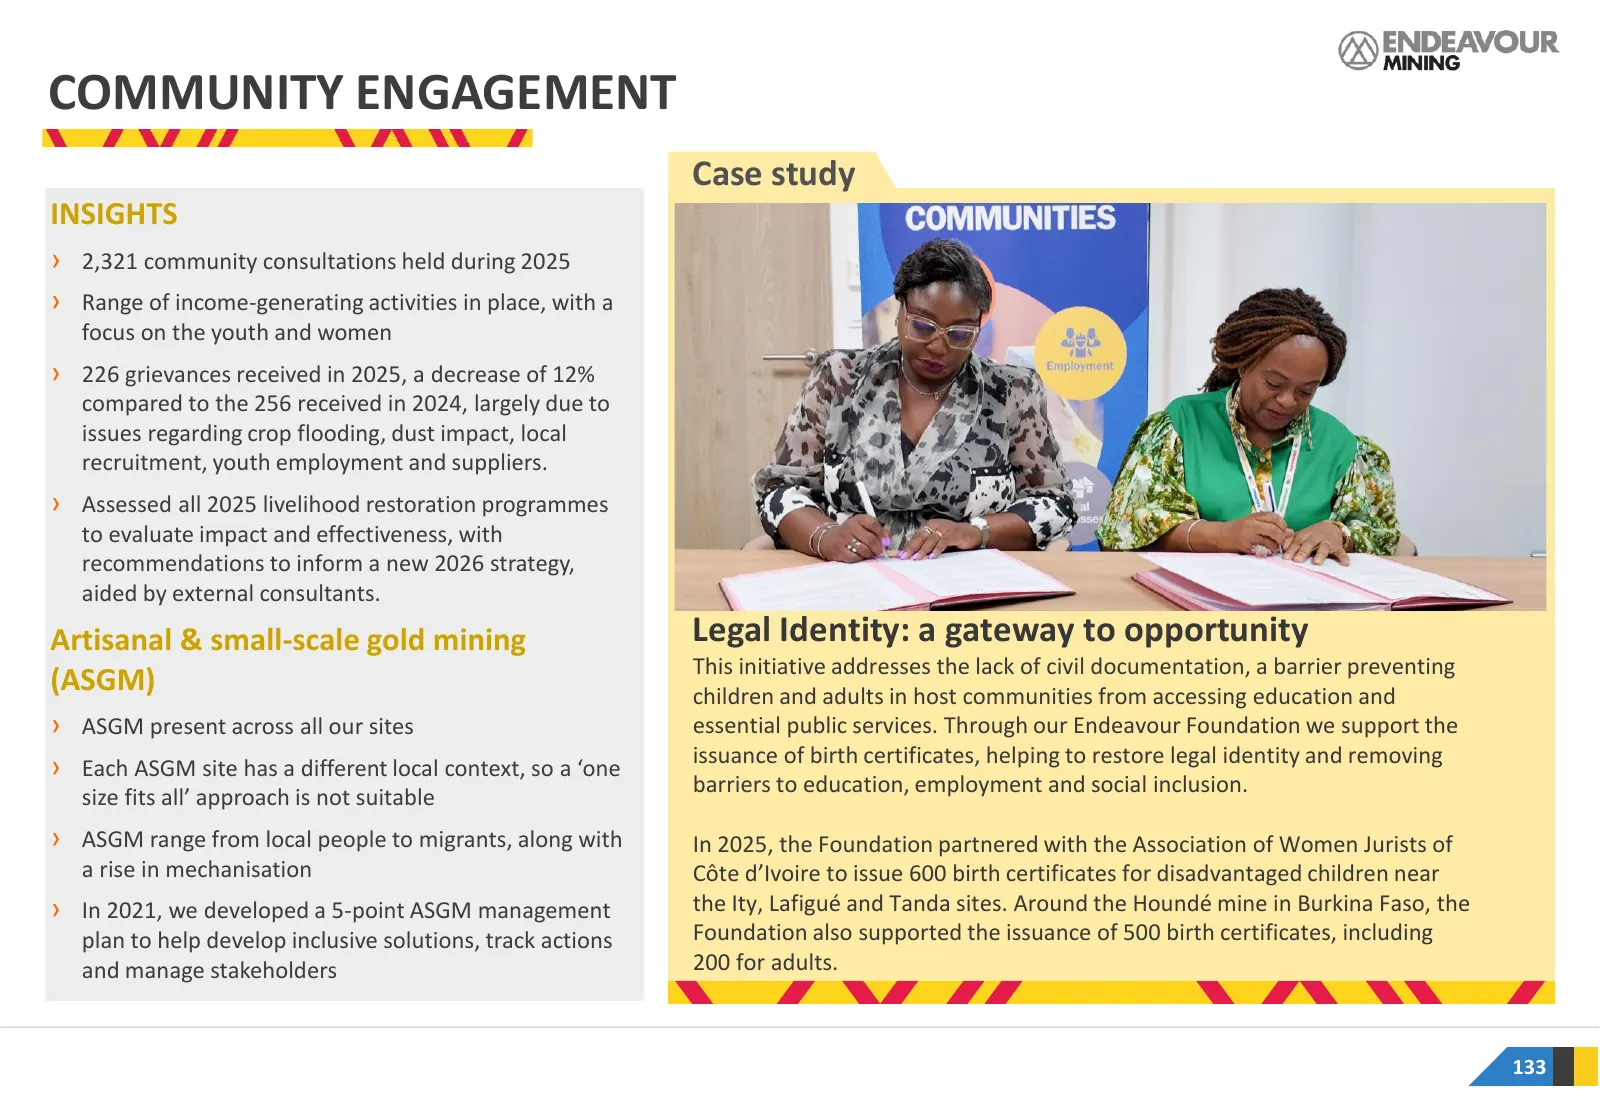
COMMUNITY ENGAGEMENT Case study INSIGHTS › 2,321 community consultations held during 2025 › Range of income-generating activities in place, with a focus on the youth and women › 226 grievances received in 2025, a decrease of 12% compared to the 256 received in 2024, largely due to issues regarding c
Slide 134: Education
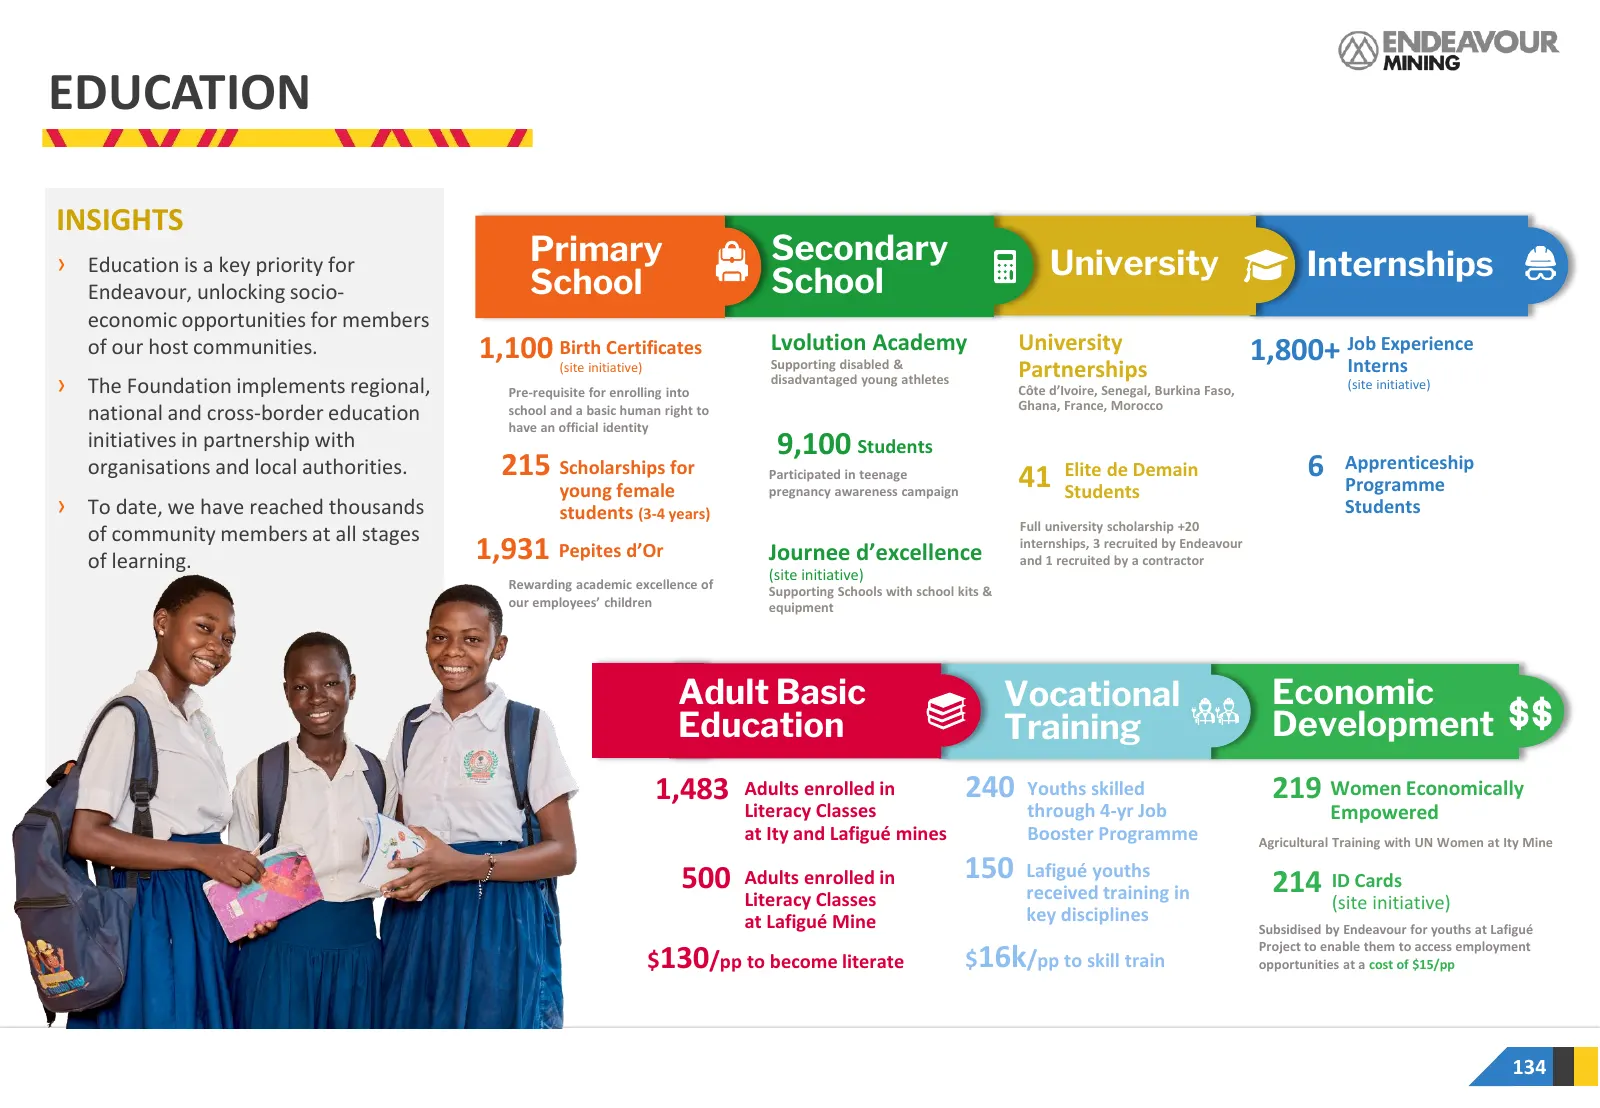
EDUCATION INSIGHTS › Education is a key priority for Primary Secondary University Internships Endeavour, unlocking socio- School School economic opportunities for members of our host communities. 1,100 Birth Certificates Lvolution Academy University 1,800+ Job Experience (site initiative) Supporting
Slide 135: Targeting Zero Harm
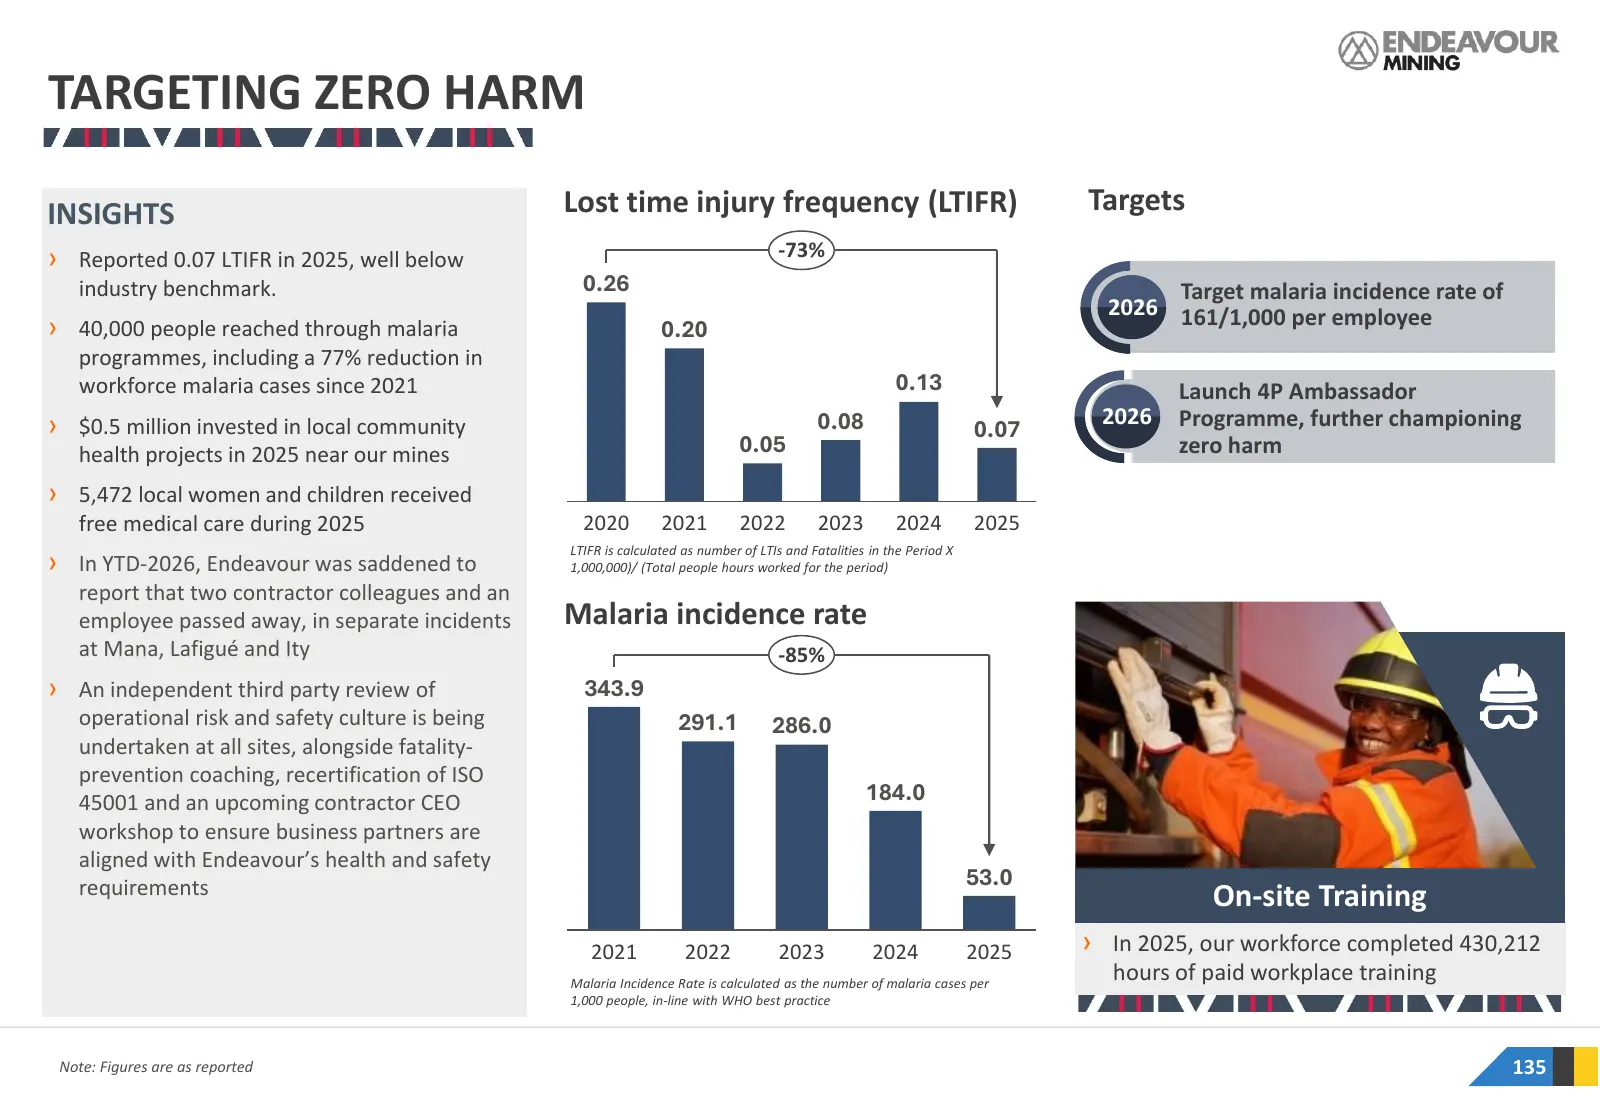
TARGETING ZERO HARM INSIGHTS Lost time injury frequency (LTIFR) Targets › Reported 0.07 LTIFR in 2025, well below -73% industry benchmark. 0.26 Target malaria incidence rate of 2026 161/1,000 per employee › 40,000 people reached through malaria 0.20 programmes, including a 77% reduction in workforce
Slide 136: Diversity and Inclusion
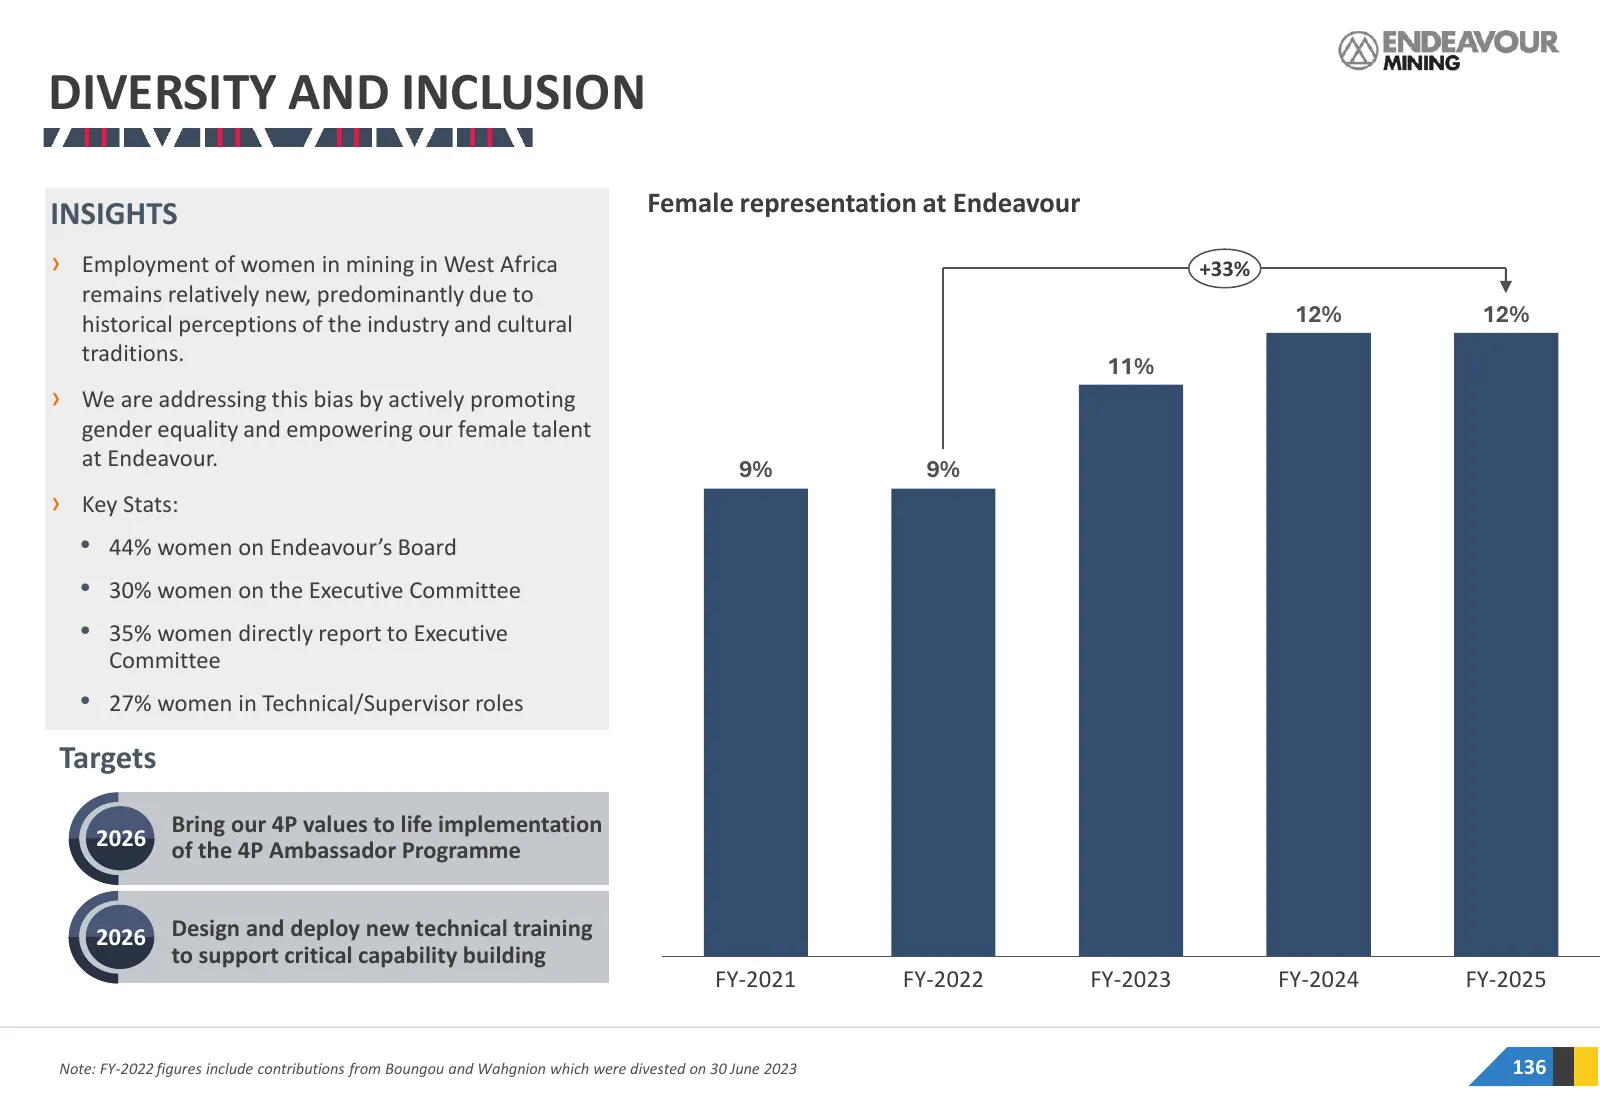
DIVERSITY AND INCLUSION INSIGHTS Female representation at Endeavour › Employment of women in mining in West Africa +33% remains relatively new, predominantly due to historical perceptions of the industry and cultural 12% 12% traditions. 11% › We are addressing this bias by actively promoting gender
Slide 137: Ethical Business
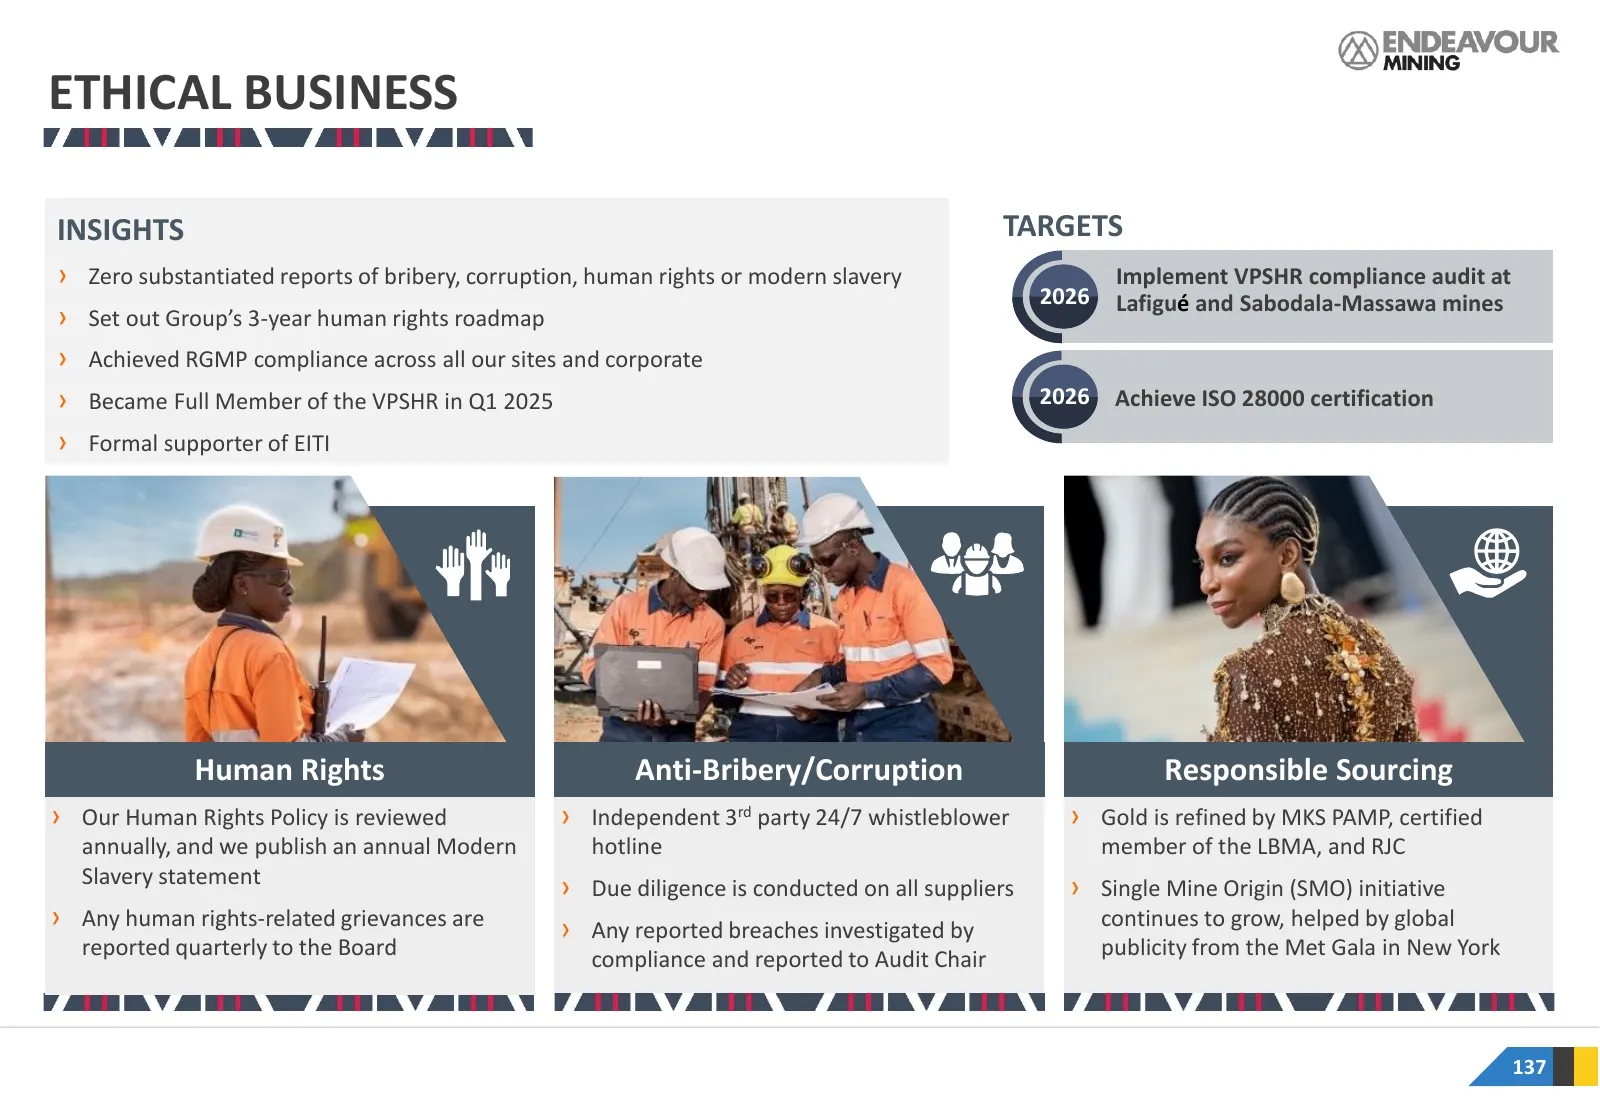
ETHICAL BUSINESS INSIGHTS TARGETS › Zero substantiated reports of bribery, corruption, human rights or modern slavery Implement VPSHR compliance audit at 2026 Lafigué and Sabodala-Massawa mines › Set out Group’s 3-year human rights roadmap › Achieved RGMP compliance across all our sites and corporat
Slide 138: Governance Framework
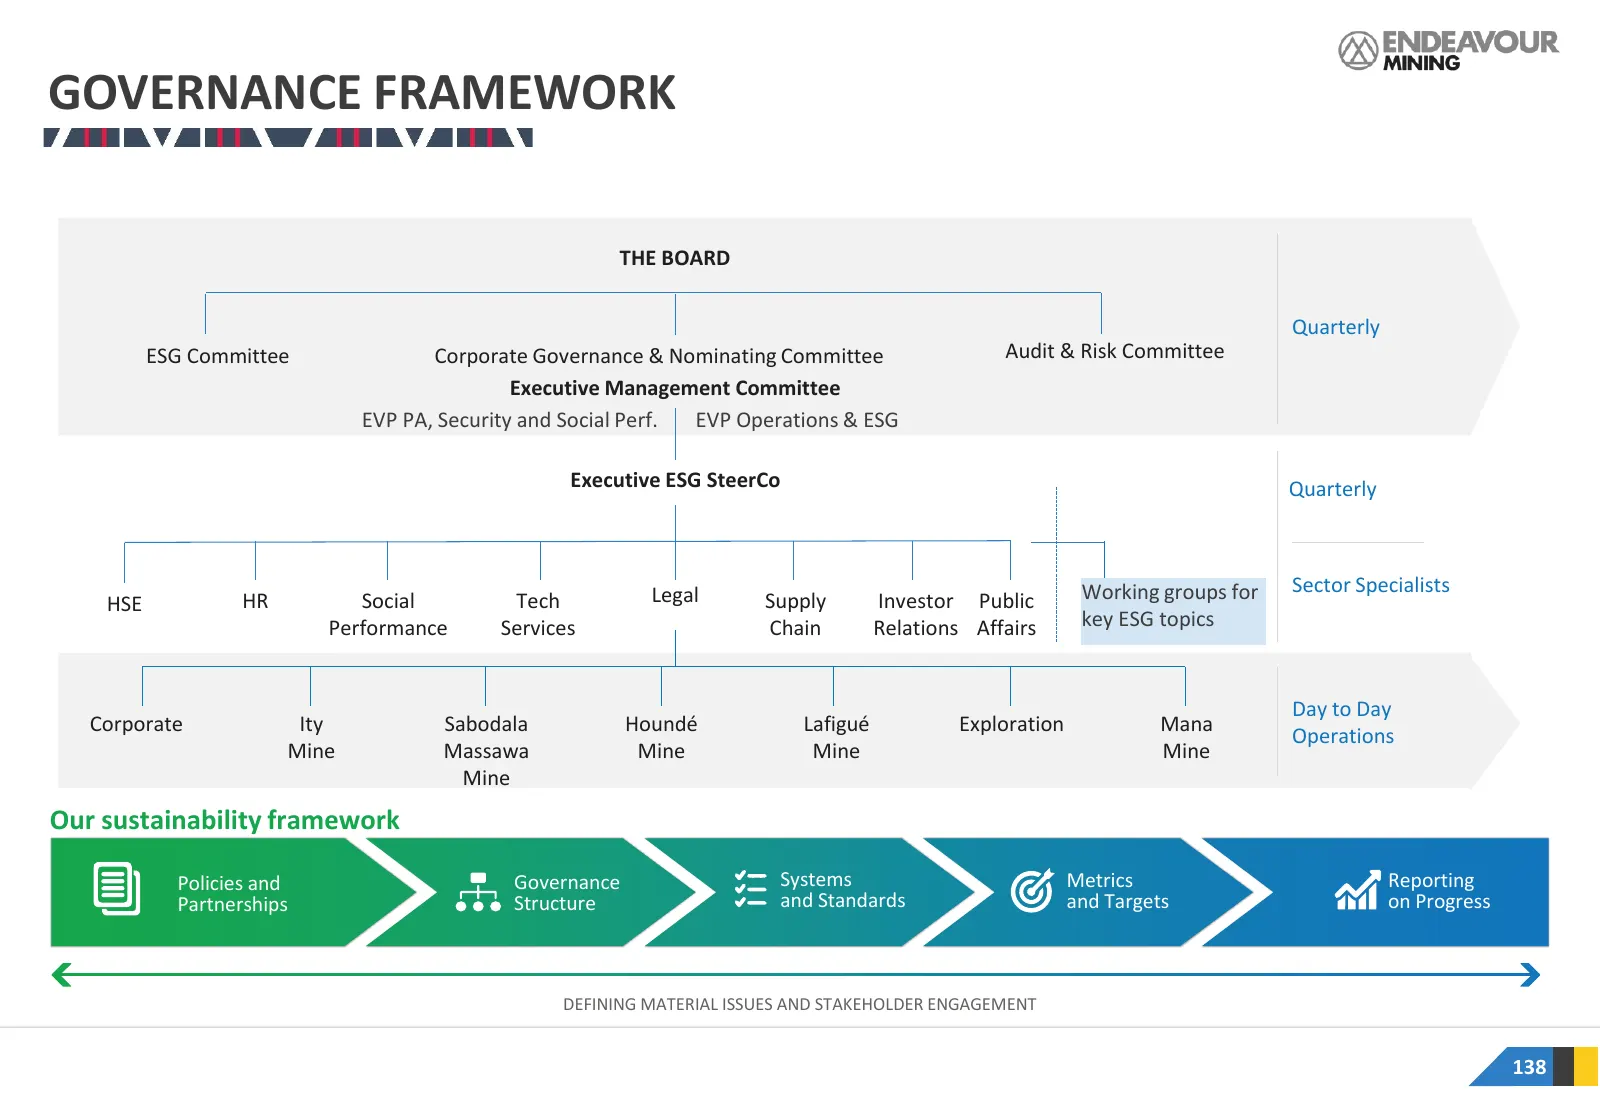
GOVERNANCE FRAMEWORK THE BOARD Quarterly ESG Committee Corporate Governance & Nominating Committee Audit & Risk Committee Executive Management Committee EVP PA, Security and Social Perf. EVP Operations & ESG Executive ESG SteerCo Quarterly Legal Working groups for Sector Specialists HSE HR Social Te
Slide 139: Experienced and Diverse Board
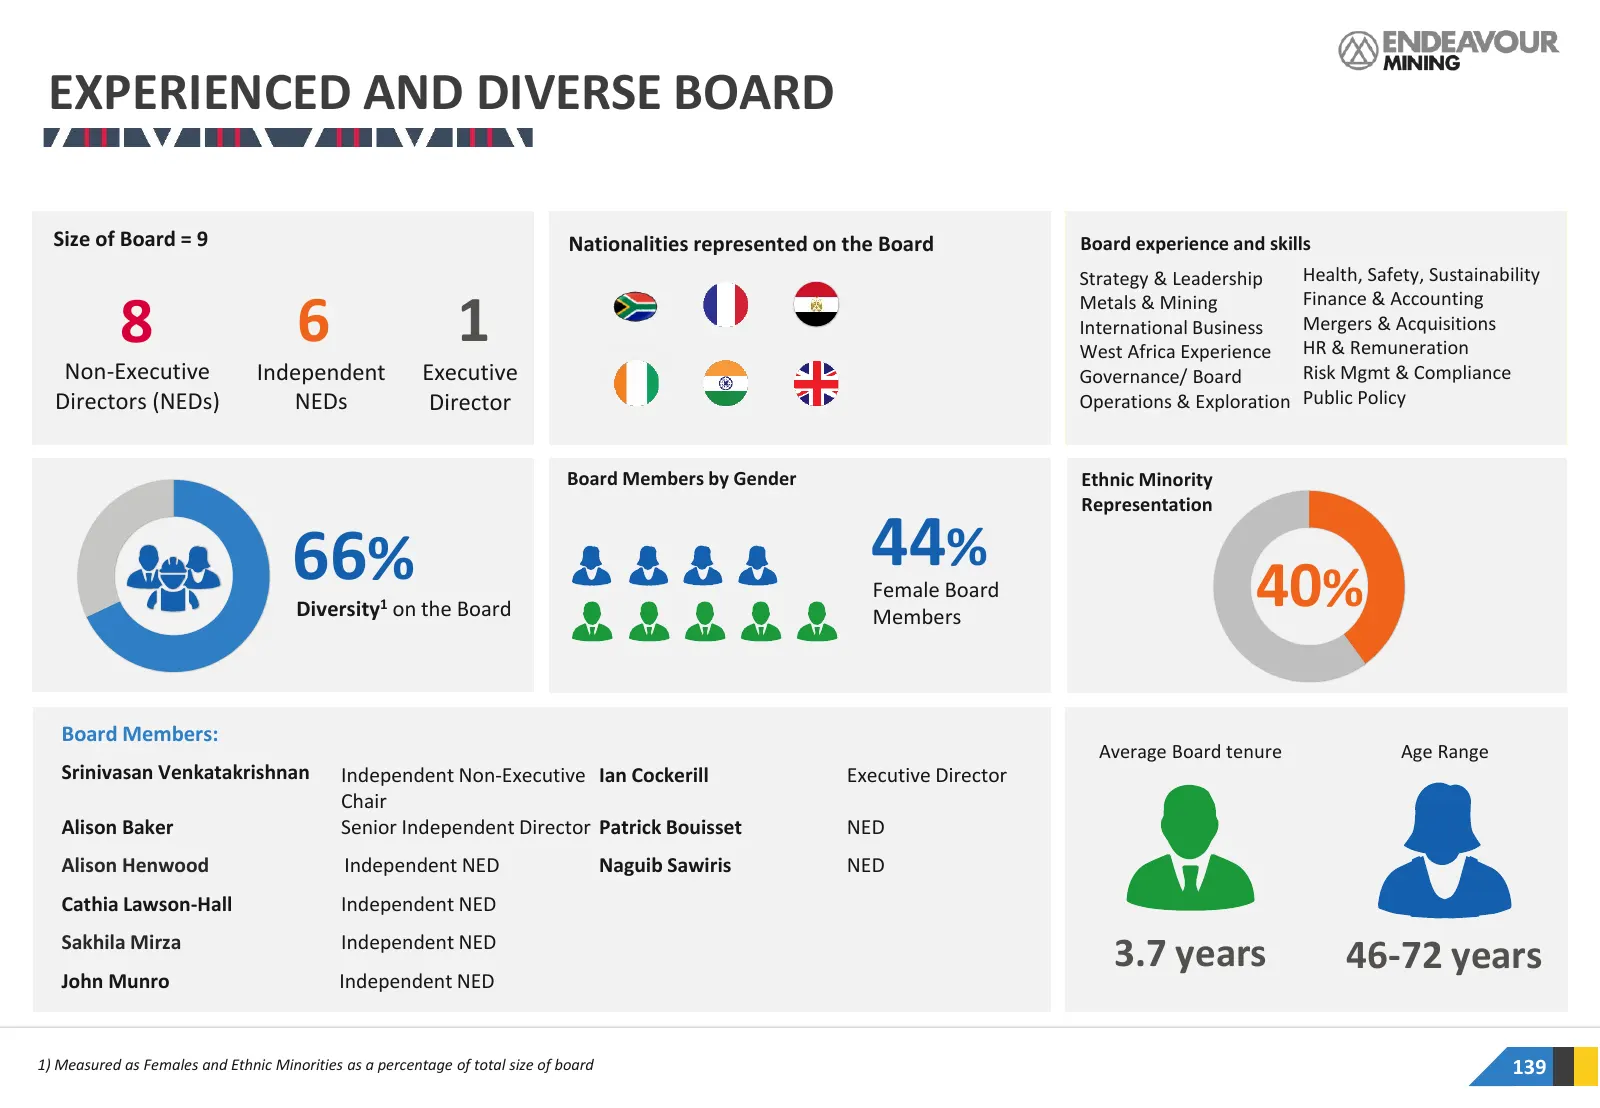
EXPERIENCED AND DIVERSE BOARD Size of Board = 9 Nationalities represented on the Board Board experience and skills Strategy & Leadership Health, Safety, Sustainability Finance & Accounting 8 6 1 Metals & Mining International Business West Africa Experience Mergers & Acquisitions HR & Remuneration No
Slide 140: West Africa Insights
WEST AFRICA INSIGHTS 5
Slide 141: West Africa's Competitive Advantage
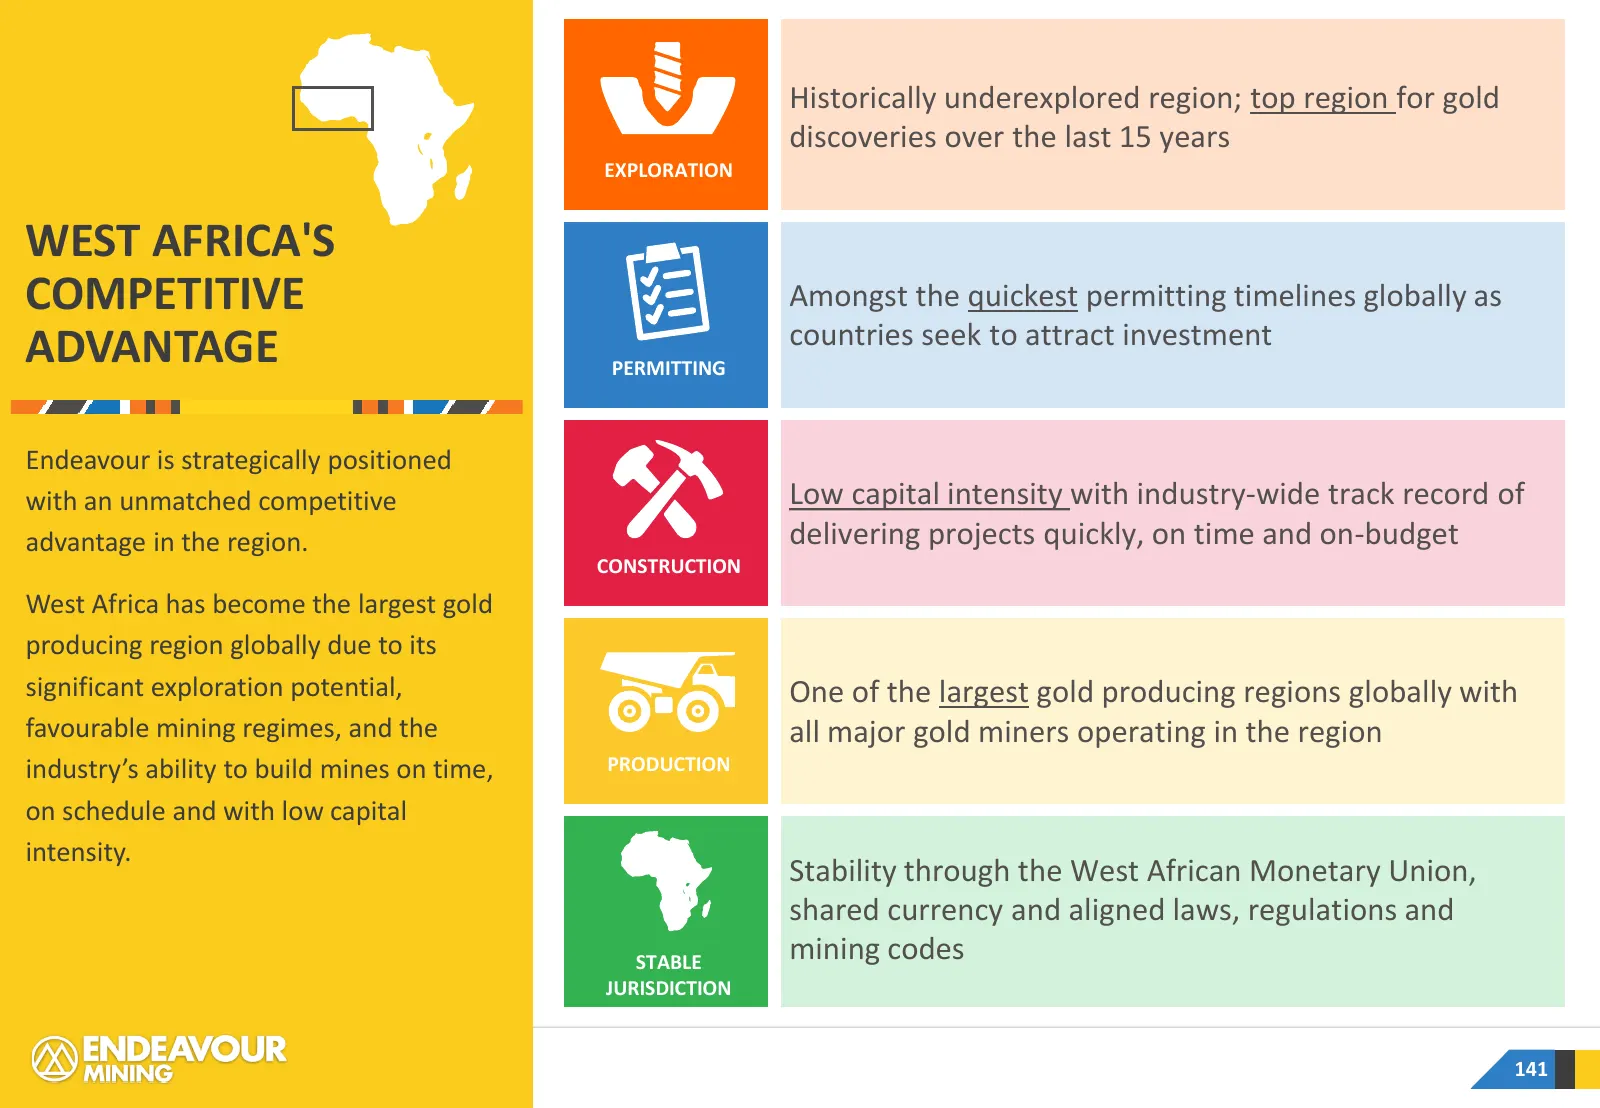
Historically underexplored region; top region for gold discoveries over the last 15 years EXPLORATION WEST AFRICA'S COMPETITIVE Amongst the quickest permitting timelines globally as countries seek to attract investment ADVANTAGE PERMITTING Endeavour is strategically positioned with an unmatched comp
Slide 142: West Africa Ranks 1st for Discoveries
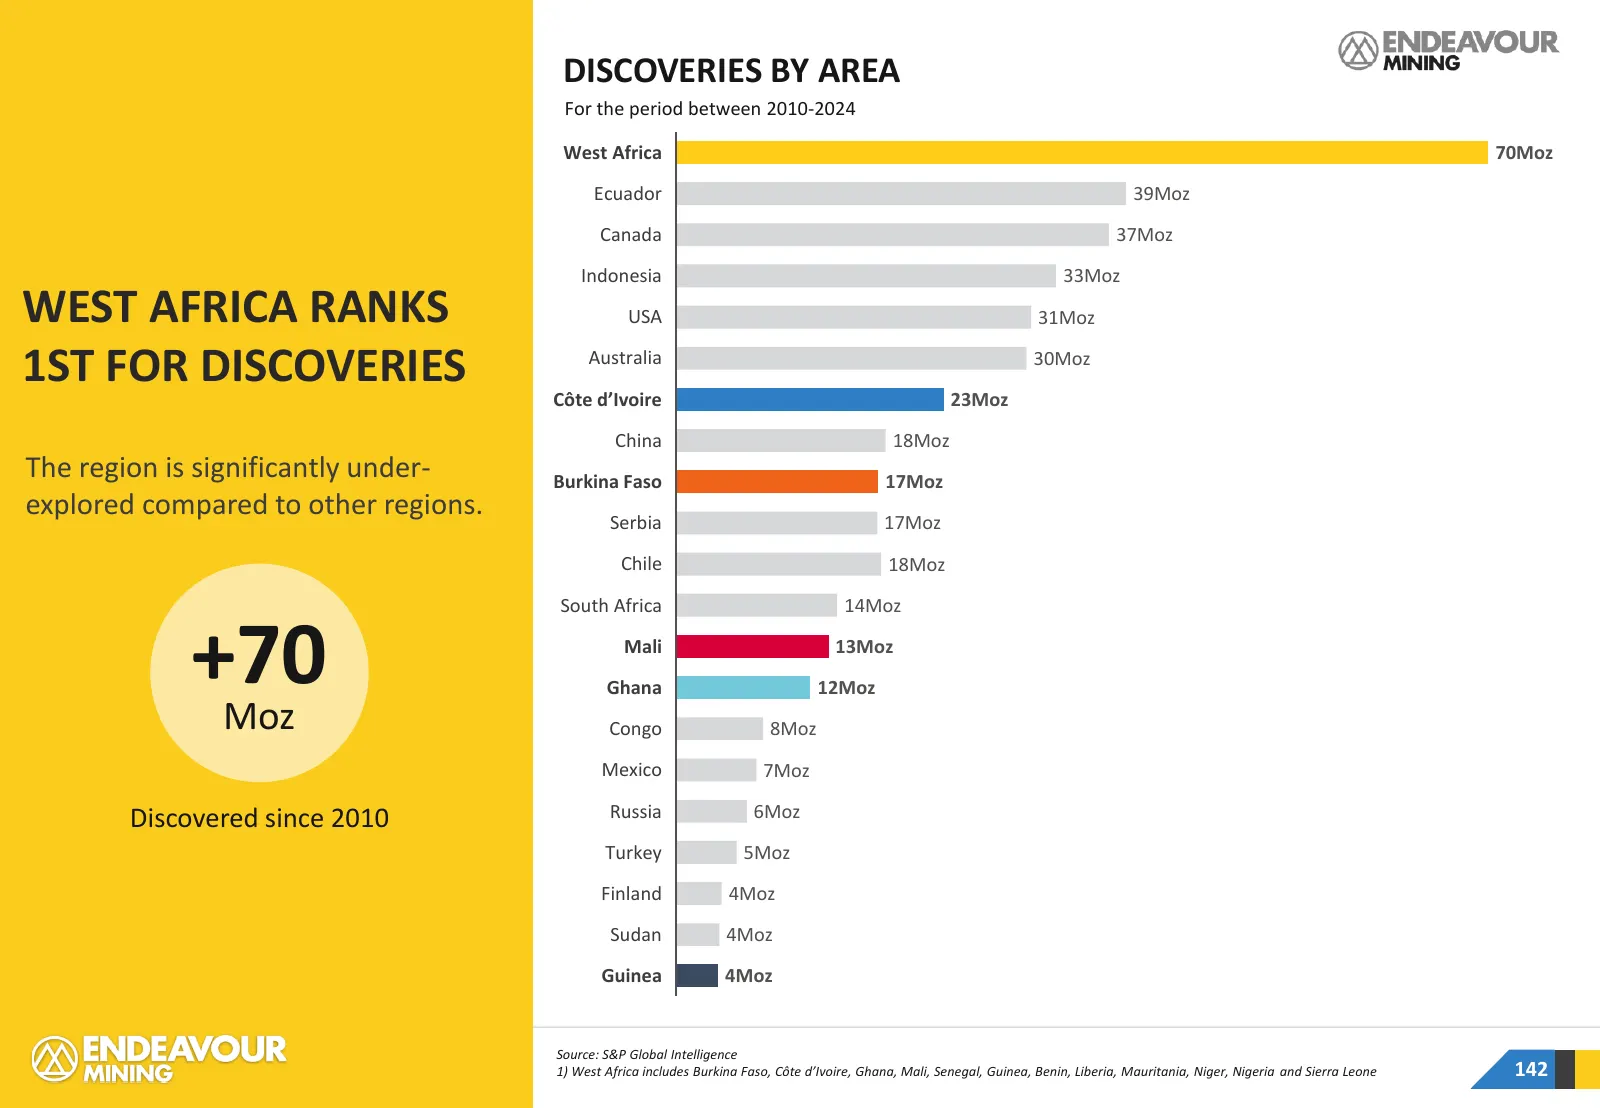
• INDUSTRY EXPLORATION SPEND DISCOVERIES BY AREA For the period between 2010-2024 West Africa 70Moz Ecuador 39Moz Canada 37Moz Indonesia 33Moz WEST AFRICA RANKS USA 31Moz 1ST FOR DISCOVERIES Australia Côte d’Ivoire 30Moz 23Moz China 18Moz The region is significantly under- Burkina Faso 17Moz explore
Slide 143: Endeavour Holds One of the Largest Land Tenement Holdings
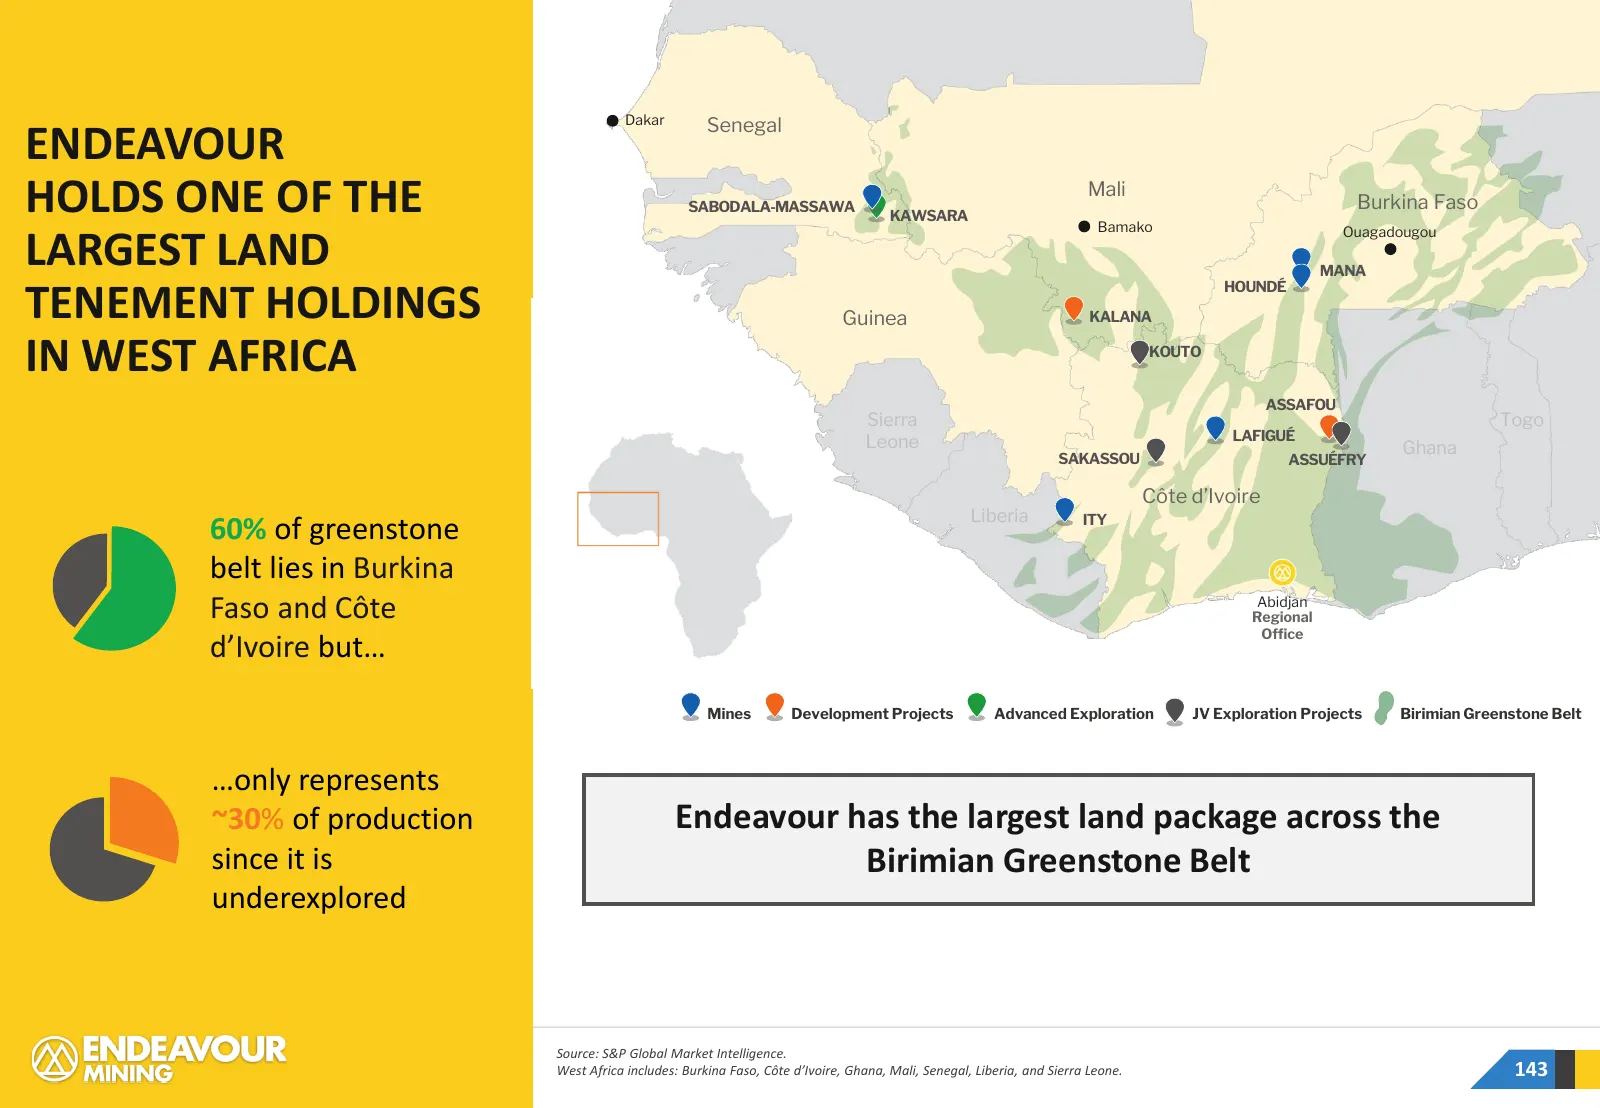
UNDER-EXPLORED REGION Dakar Senegal ENDEAVOUR HOLDS ONE OF THE SABODALA-MASSAWA KAWSARA Mali Bamako Burkina Faso Ouagadougou LARGEST LAND MANA HOUNDÉ TENEMENT HOLDINGS Guinea KALANA IN WEST AFRICA KOUTO ASSAFOU Sierra Togo Leone LAFIGUÉ Ghana SAKASSOU ASSUÉFRY Côte d’Ivoire Liberia ITY 60% of greens
Slide 144: West Africa Is the 4th Largest Exploration Focus
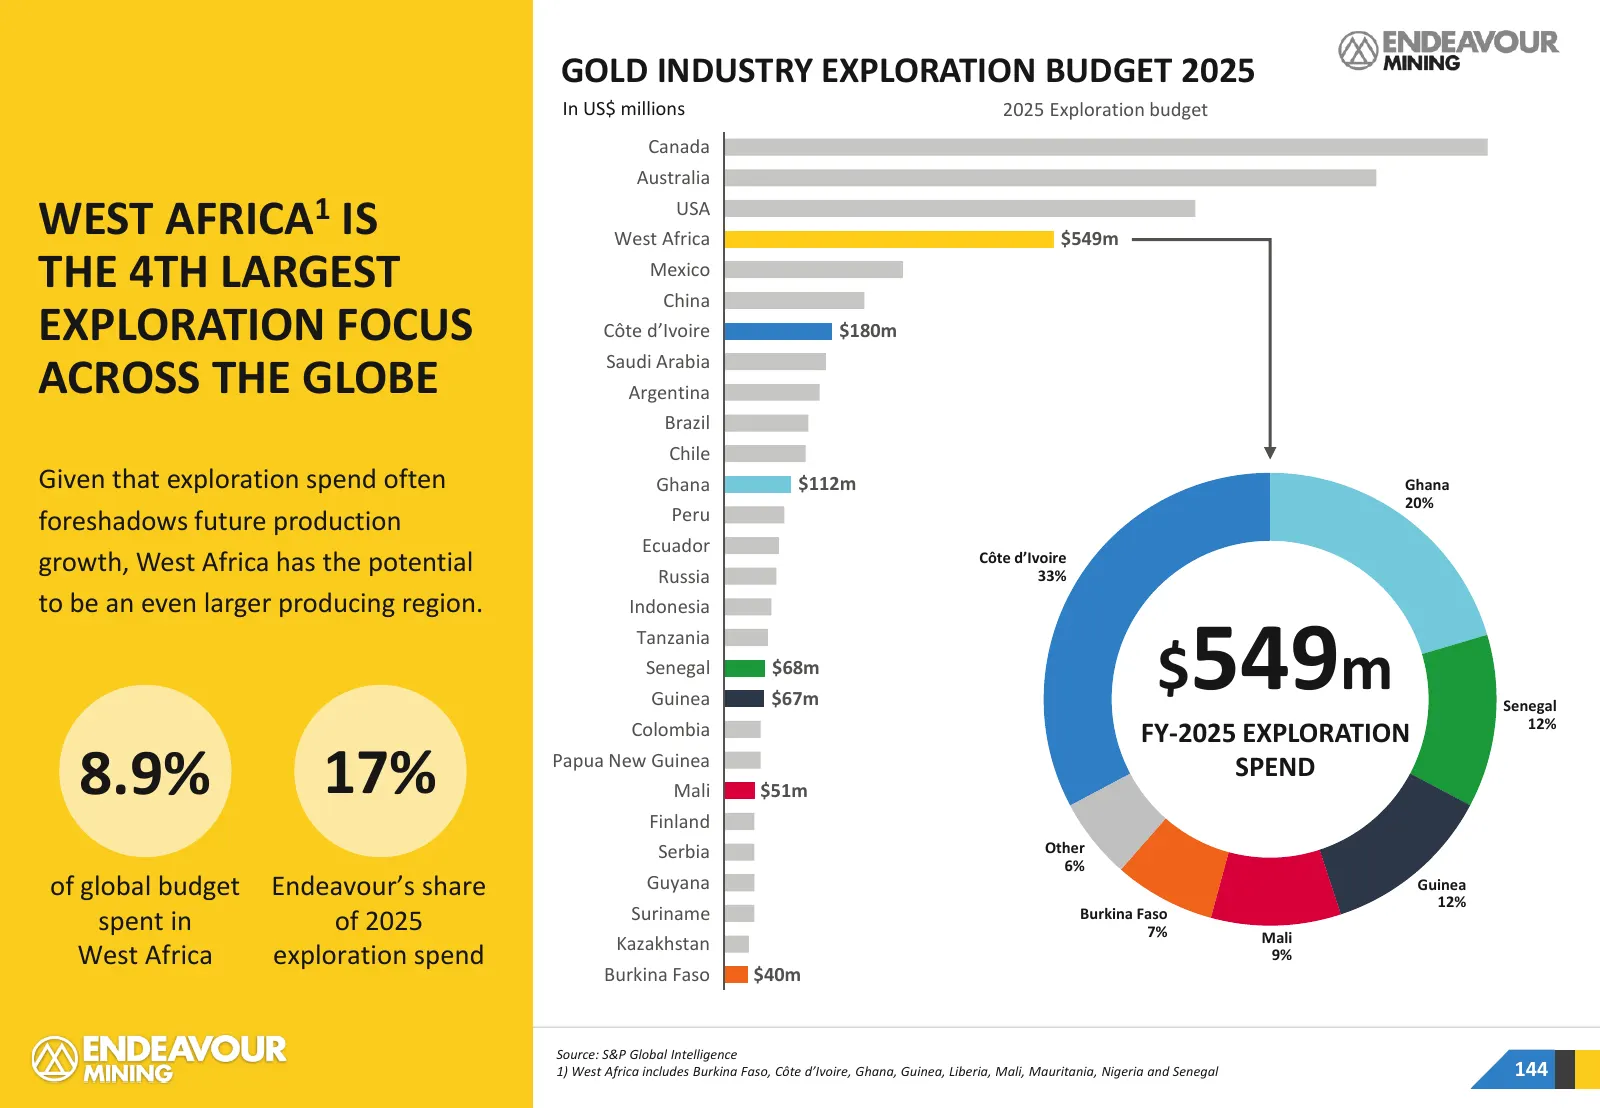
GOLD INDUSTRY EXPLORATION BUDGET 2025 In US$ millions 2025 Exploration budget Canada Australia WEST AFRICA1 IS USA West Africa $549m THE 4TH LARGEST Mexico China EXPLORATION FOCUS Côte d’Ivoire $180m Saudi Arabia ACROSS THE GLOBE Argentina Brazil Chile Given that exploration spend often Ghana $112m
Slide 145: Discovery to Production for Gold Mines
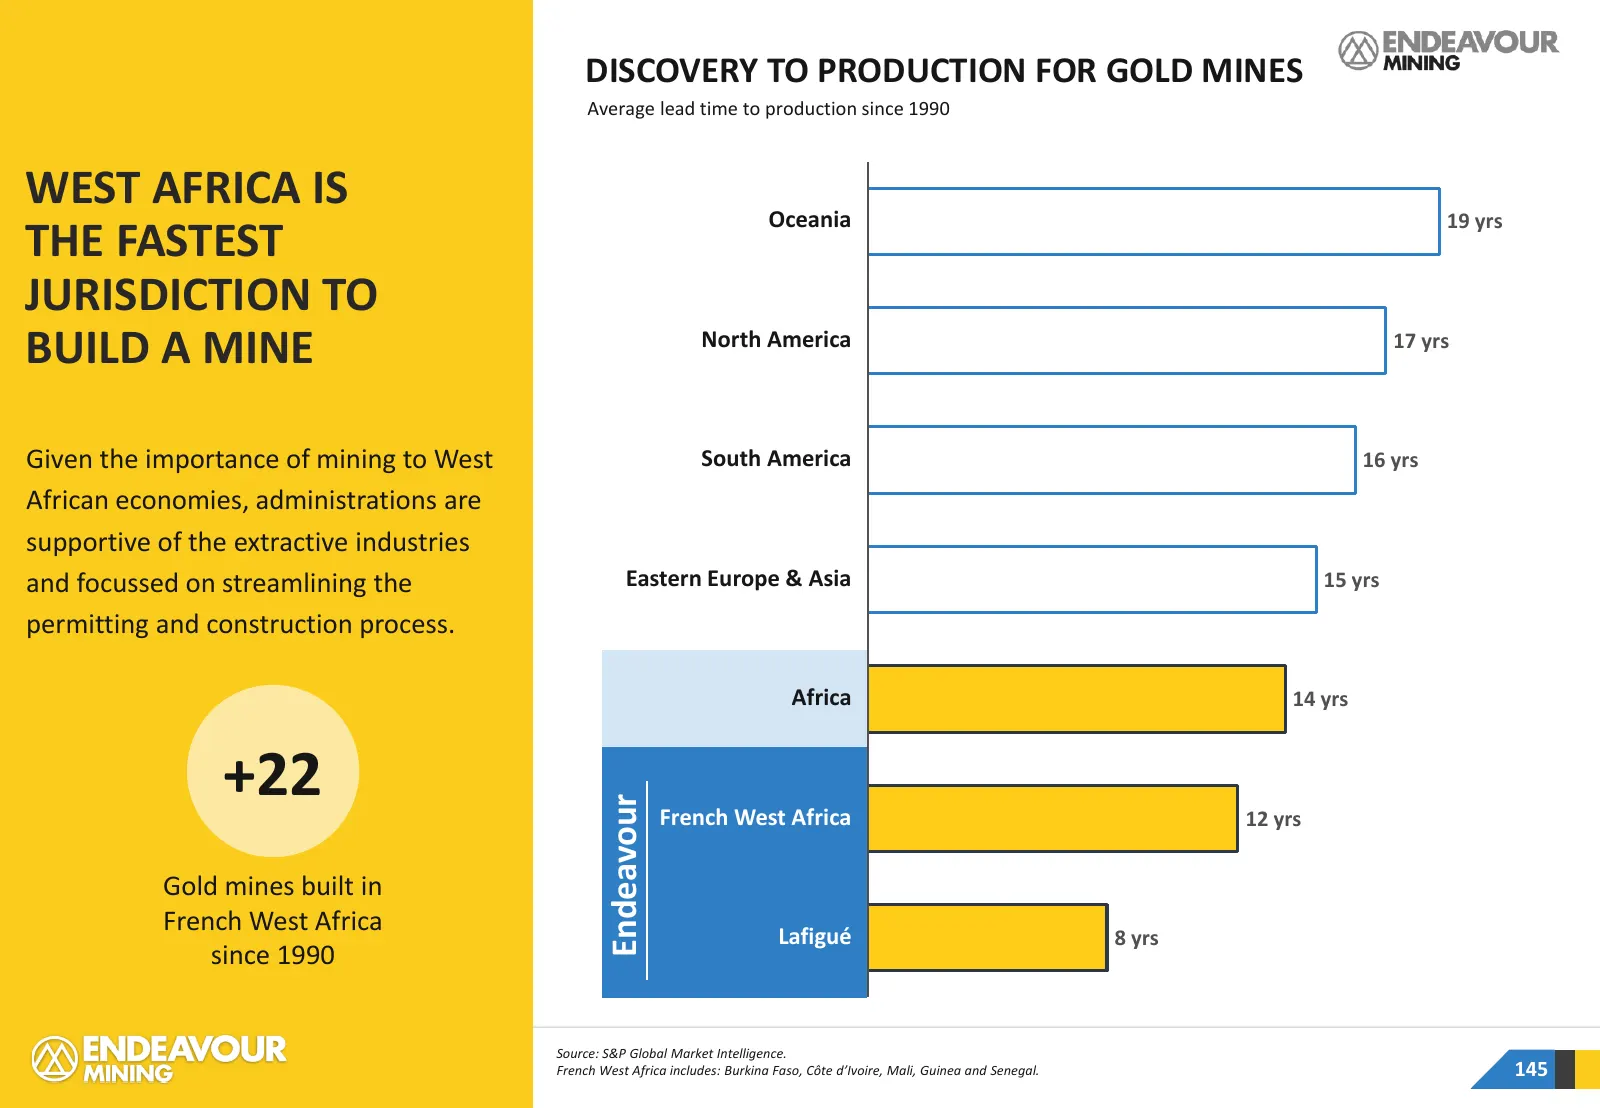
DISCOVERY TO PRODUCTION FOR GOLD MINES Average lead time to production since 1990 WEST AFRICA IS Oceania 19 yrs THE FASTEST JURISDICTION TO BUILD A MINE North America 17 yrs Given the importance of mining to West South America 16 yrs African economies, administrations are supportive of the extractiv
Slide 146: West African Projects Are Built Quicker, On-Time and On-Budget
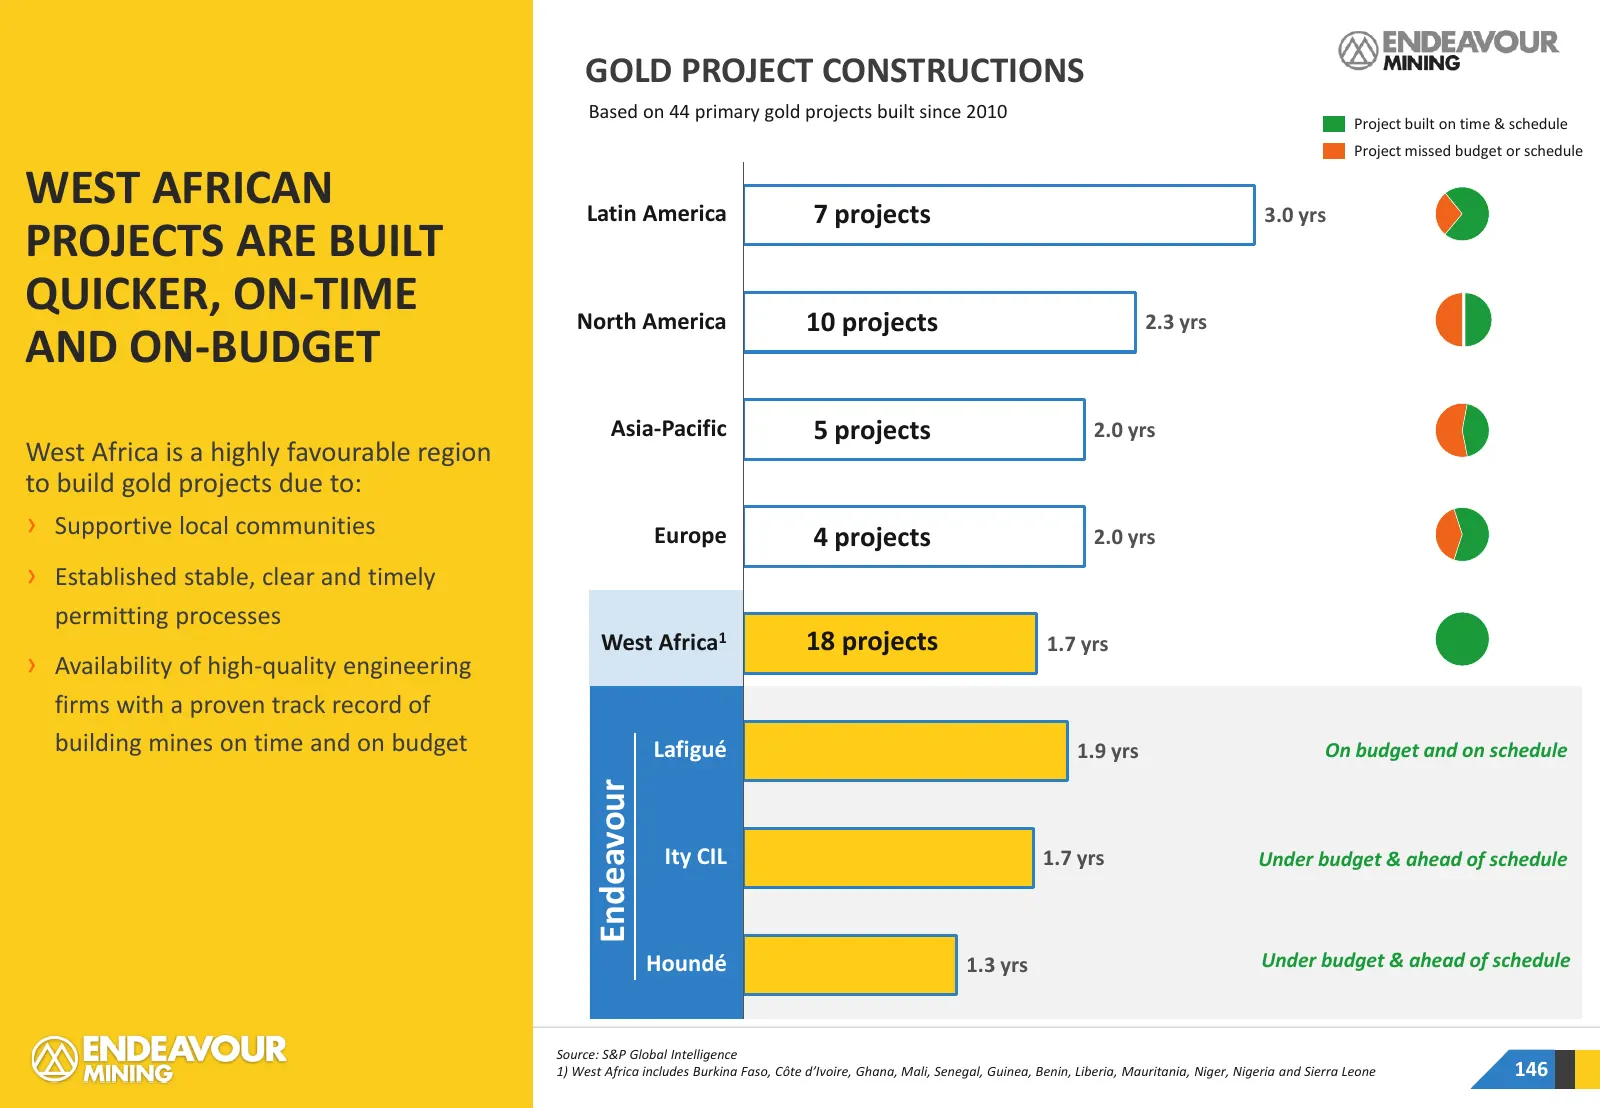
• PRODUCTION GOLD PROJECT CONSTRUCTIONS Based on 44 primary gold projects built since 2010 Project built on time & schedule Project missed budget or schedule WEST AFRICAN Latin America 7 projects 3.0 yrs PROJECTS ARE BUILT QUICKER, ON-TIME North America 10 projects 2.3 yrs AND ON-BUDGET Asia-Pacific
Slide 147: West African Projects Have Low Capital Intensity
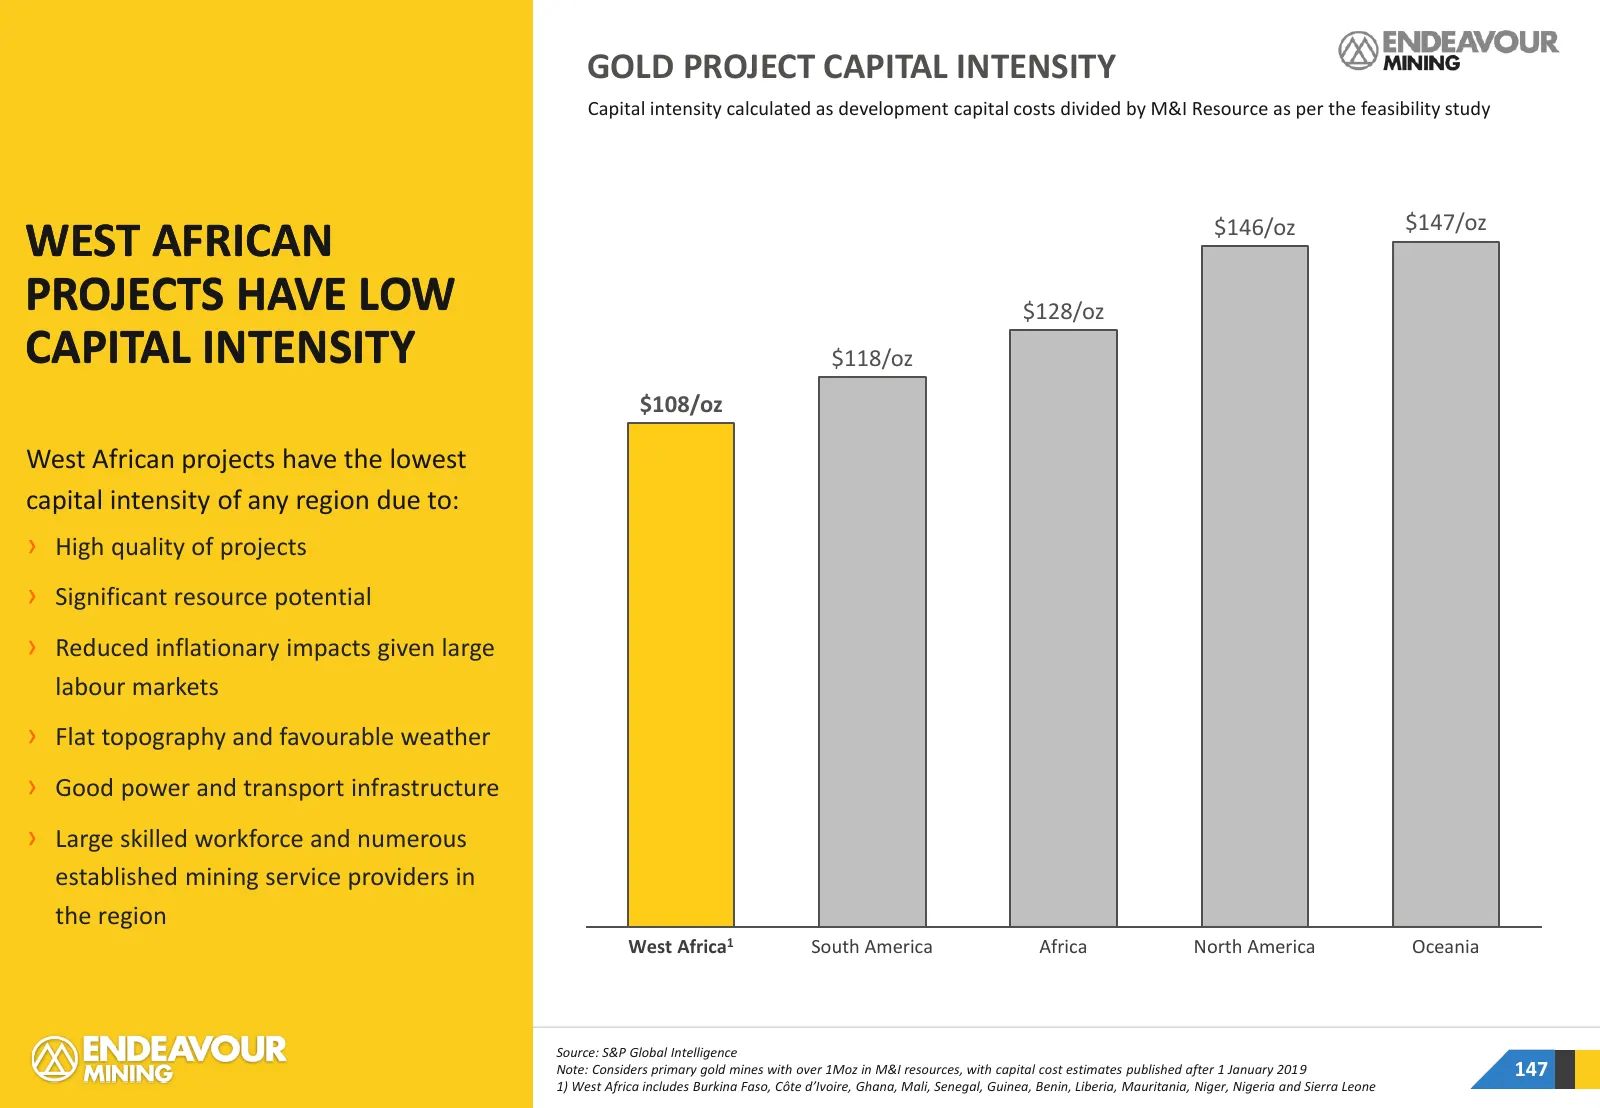
GOLD PROJECT CAPITAL INTENSITY Capital intensity calculated as development capital costs divided by M&I Resource as per the feasibility study $146/oz $147/oz WEST AFRICAN PROJECTS HAVE LOW $128/oz CAPITAL INTENSITY $118/oz $108/oz West African projects have the lowest capital intensity of any region
Slide 148: West Africa Is the Fastest-Growing Gold Producing Region
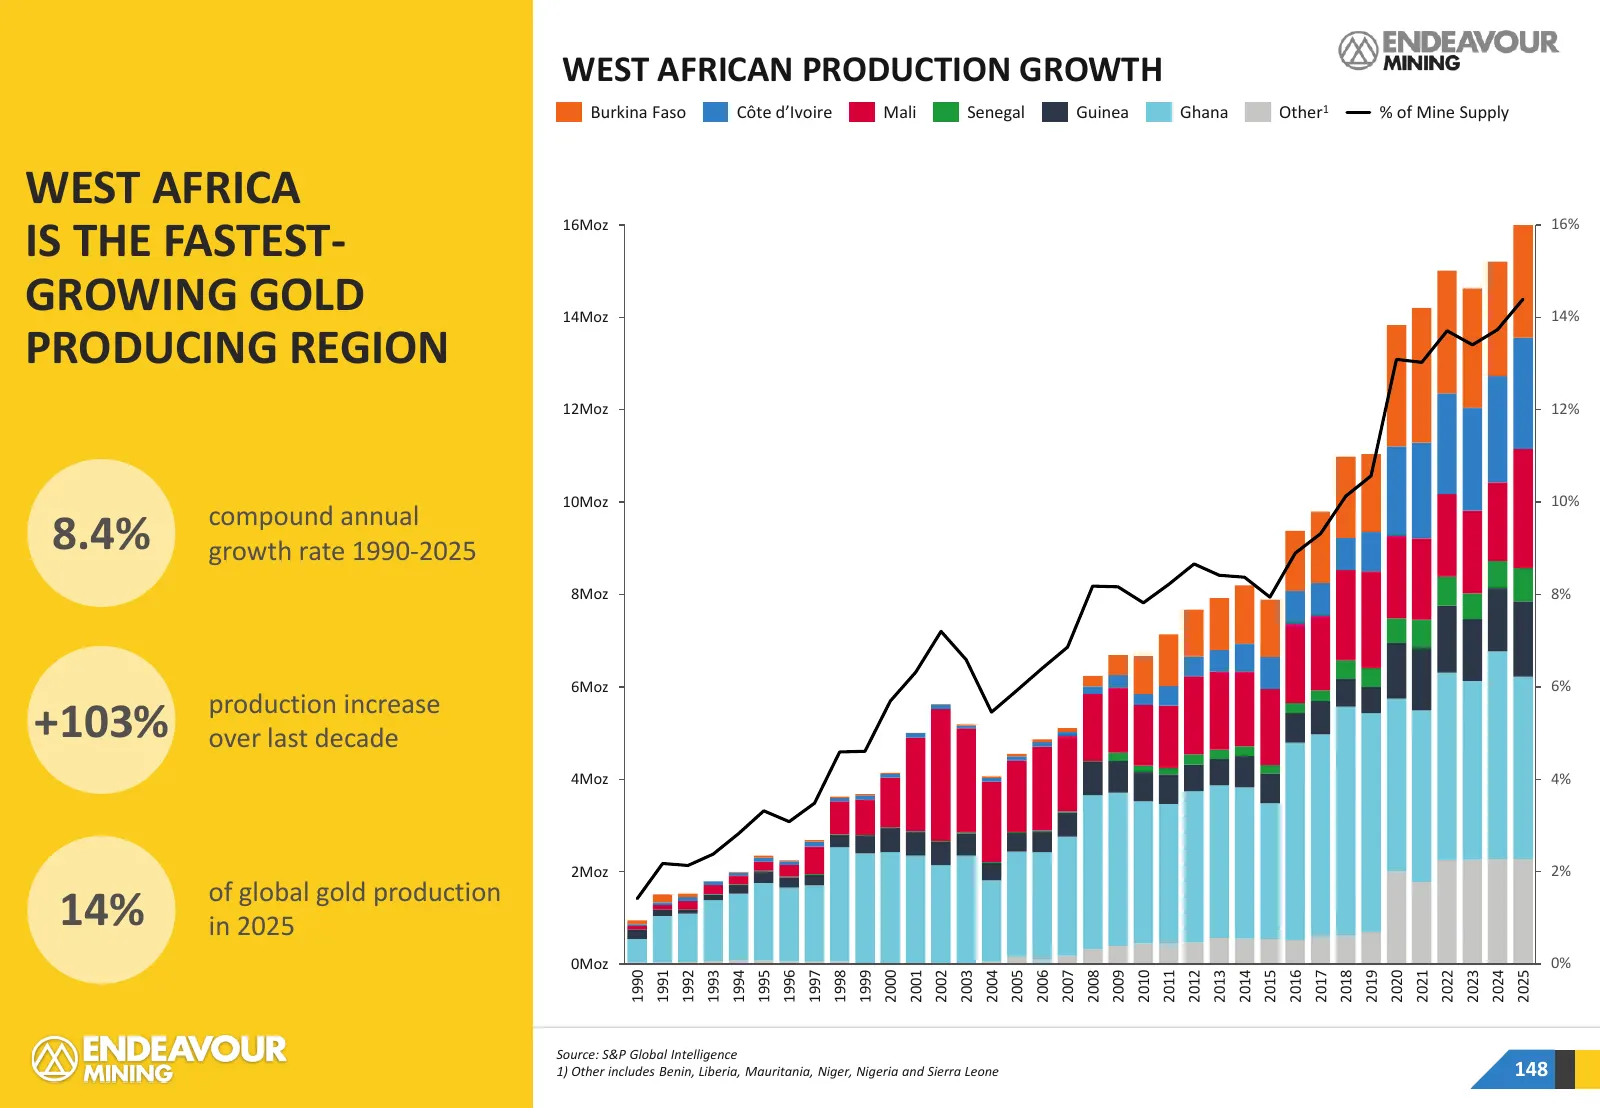
WEST AFRICAN PRODUCTION GROWTH Burkina Faso Côte d’Ivoire Mali Senegal Guinea Ghana Other1 % of Mine Supply WEST AFRICA 16Moz 16% IS THE FASTEST- GROWING GOLD 14Moz 14% PRODUCING REGION 12Moz 12% 10Moz 10% compound annual 8.4% growth rate 1990-2025 8Moz 8% 6Moz 6% production increase +103% over last
Slide 149: West African Gold Production by Country
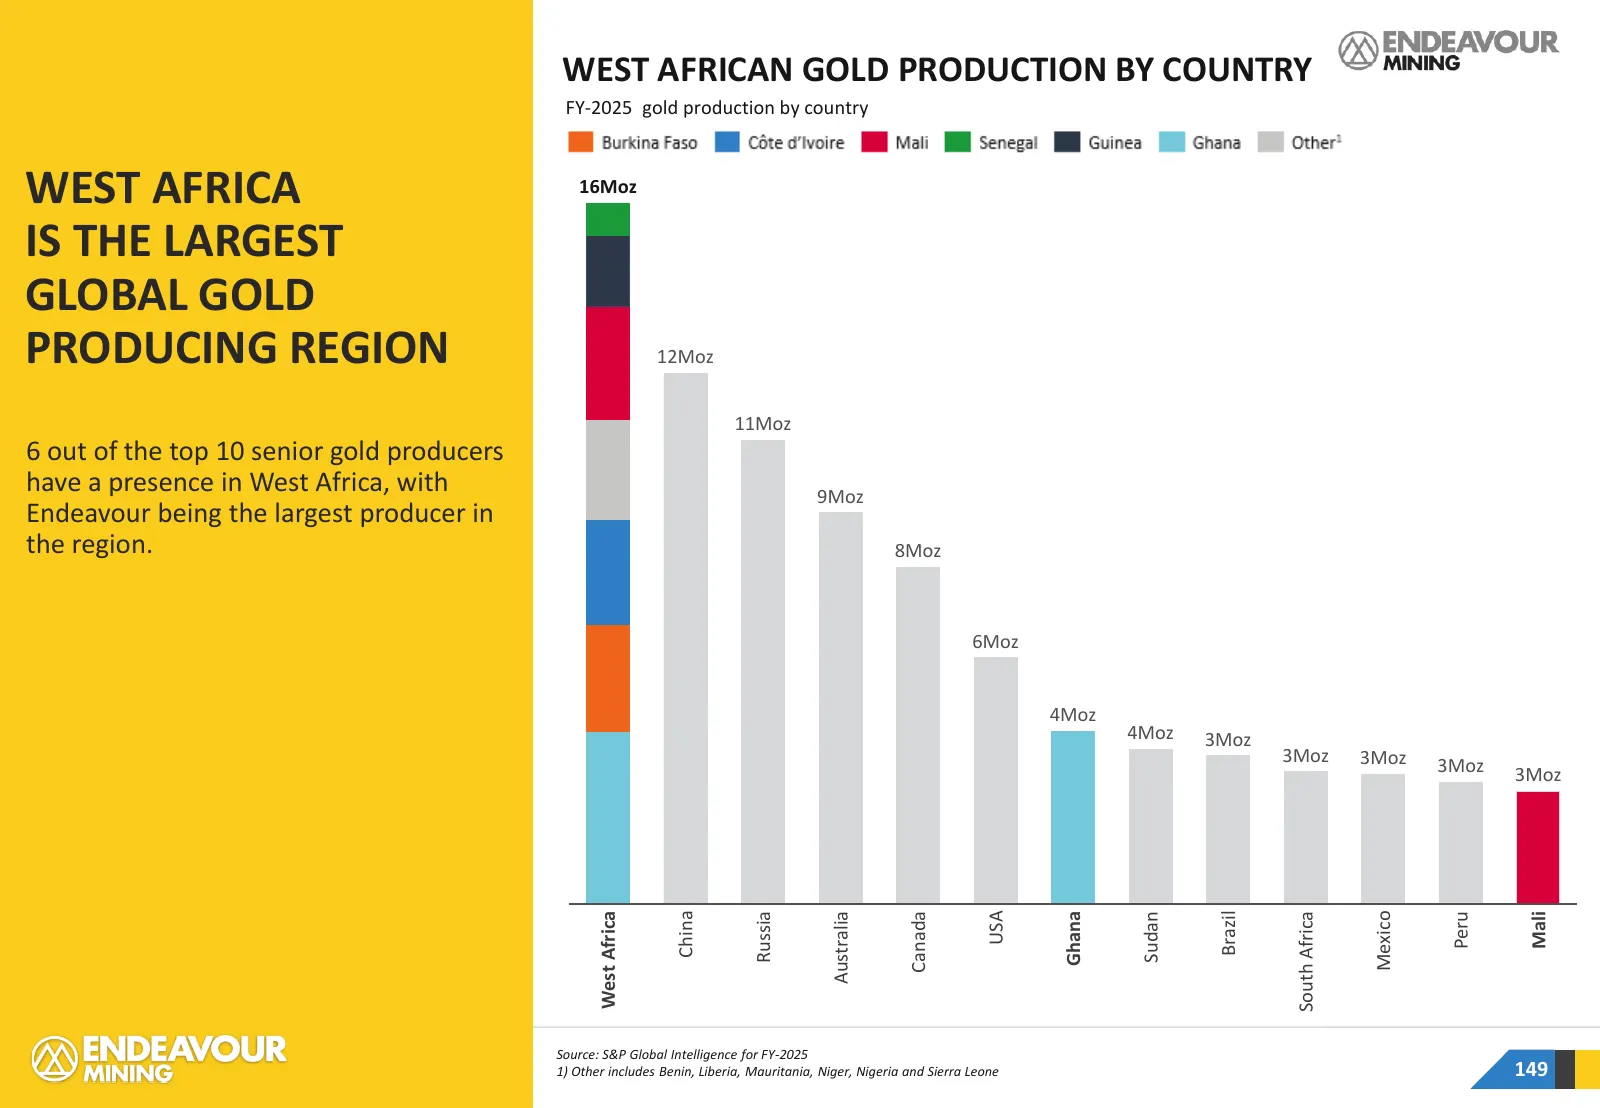
WEST AFRICAN GOLD PRODUCTION BY COUNTRY FY-2025 gold production by country WEST AFRICA 16Moz IS THE LARGEST GLOBAL GOLD PRODUCING REGION 12Moz 11Moz 6 out of the top 10 senior gold producers have a presence in West Africa, with 9Moz Endeavour being the largest producer in the region. 8Moz 6Moz 4Moz
Slide 150: Favourable Mining Jurisdictions
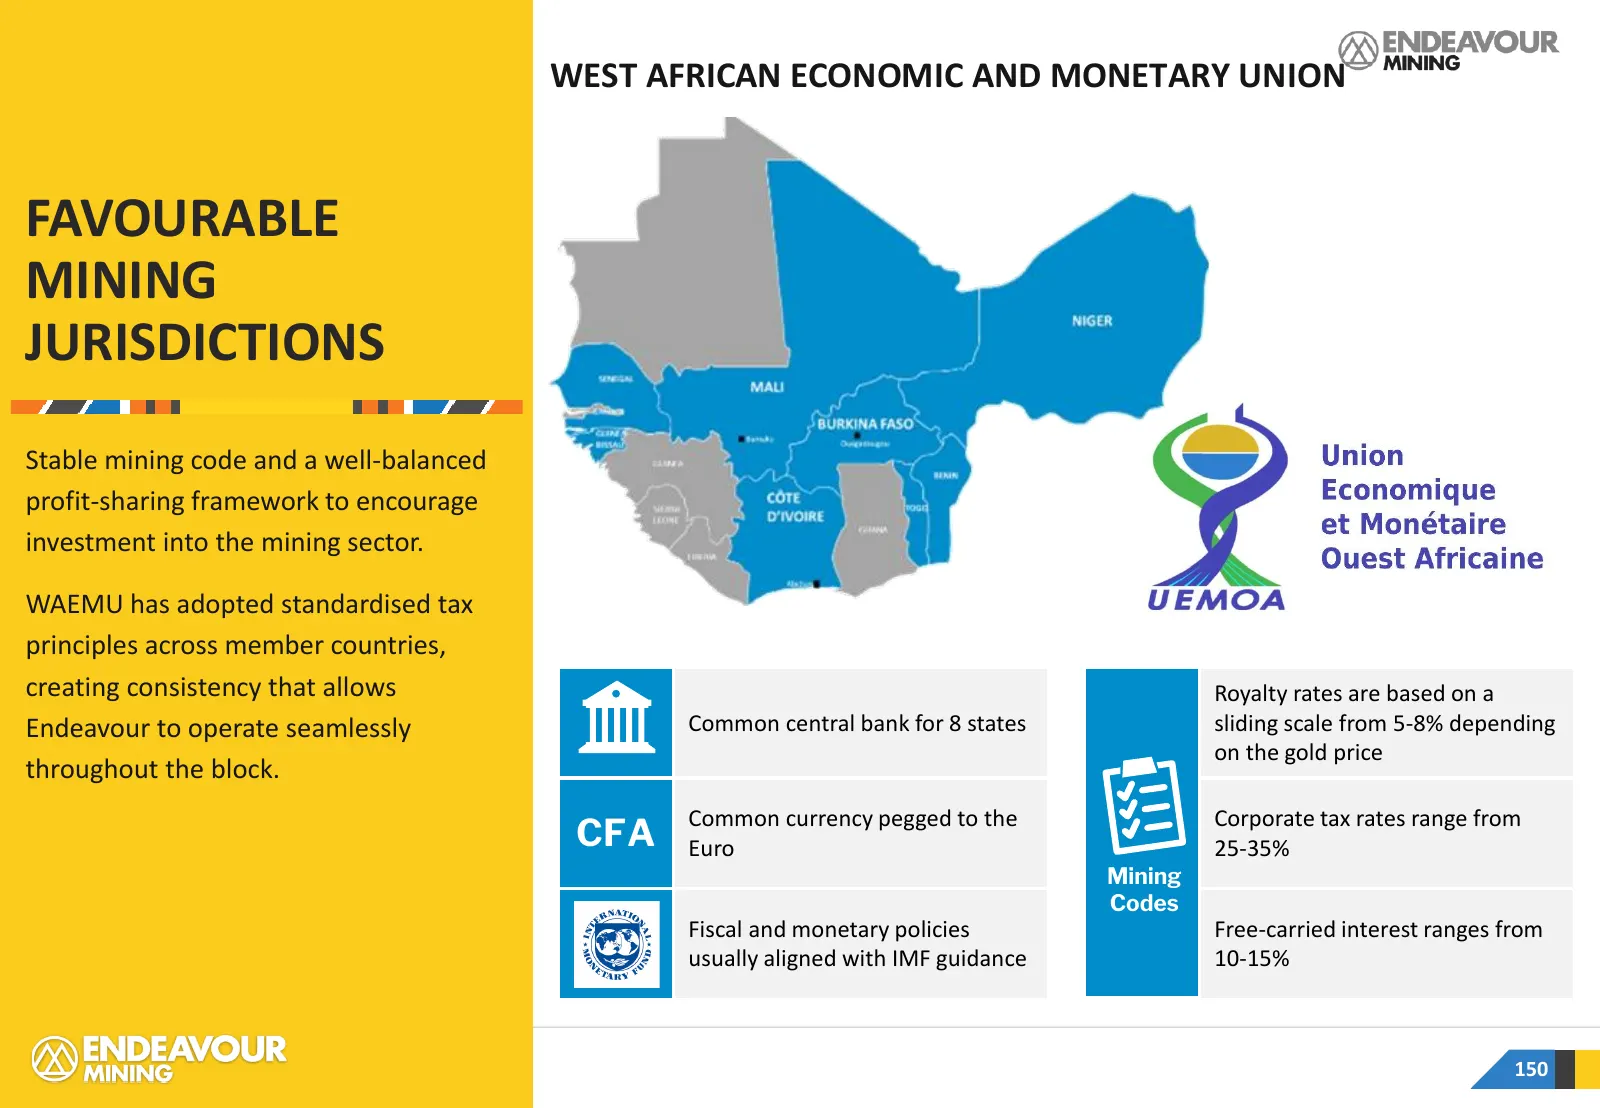
WEST AFRICAN ECONOMIC AND MONETARY UNION FAVOURABLE MINING JURISDICTIONS Stable mining code and a well-balanced profit-sharing framework to encourage investment into the mining sector. WAEMU has adopted standardised tax principles across member countries, creating consistency that allows Royalty rat
Slide 151: Alignment of Mining Codes
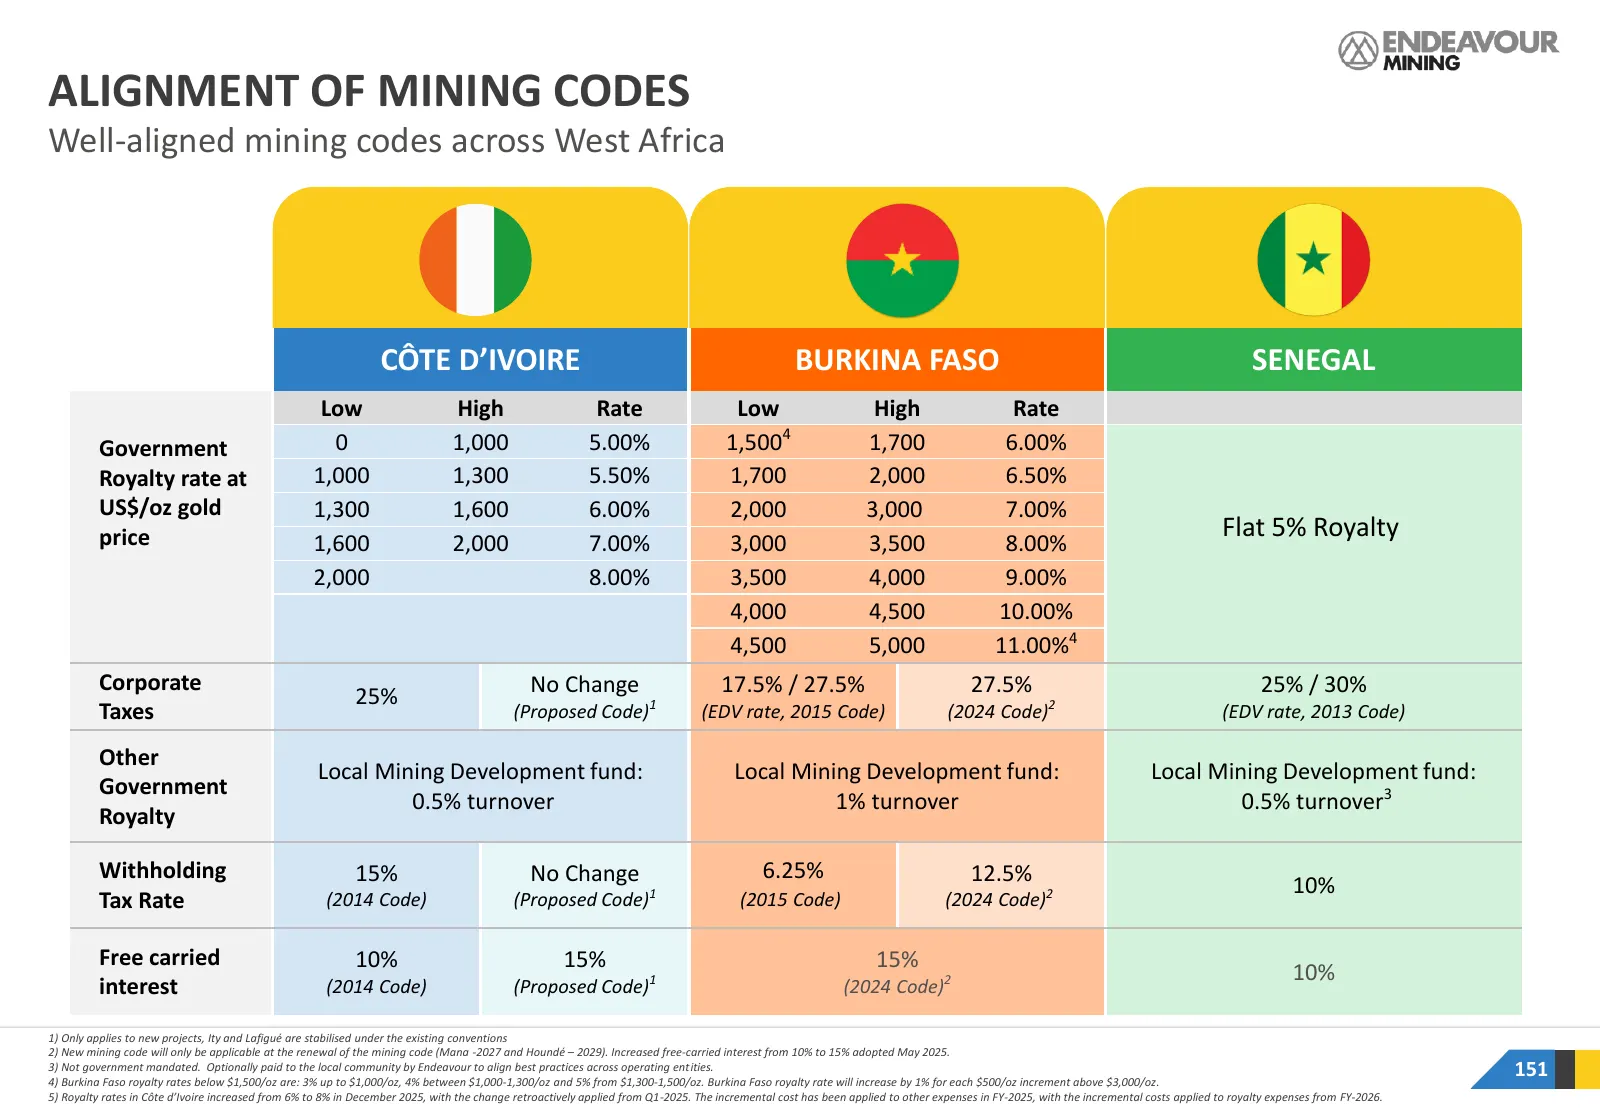
ALIGNMENT OF MINING CODES Well-aligned mining codes across West Africa CÔTE D’IVOIRE BURKINA FASO SENEGAL Low High Rate Low High Rate Government 0 1,000 5.00% 1,5004 1,700 6.00% Royalty rate at 1,000 1,300 5.50% 1,700 2,000 6.50% US$/oz gold 1,300 1,600 6.00% 2,000 3,000 7.00% price Flat 5% Royalty
Slide 152: Enhanced Security Platform Due to Scale in the Region
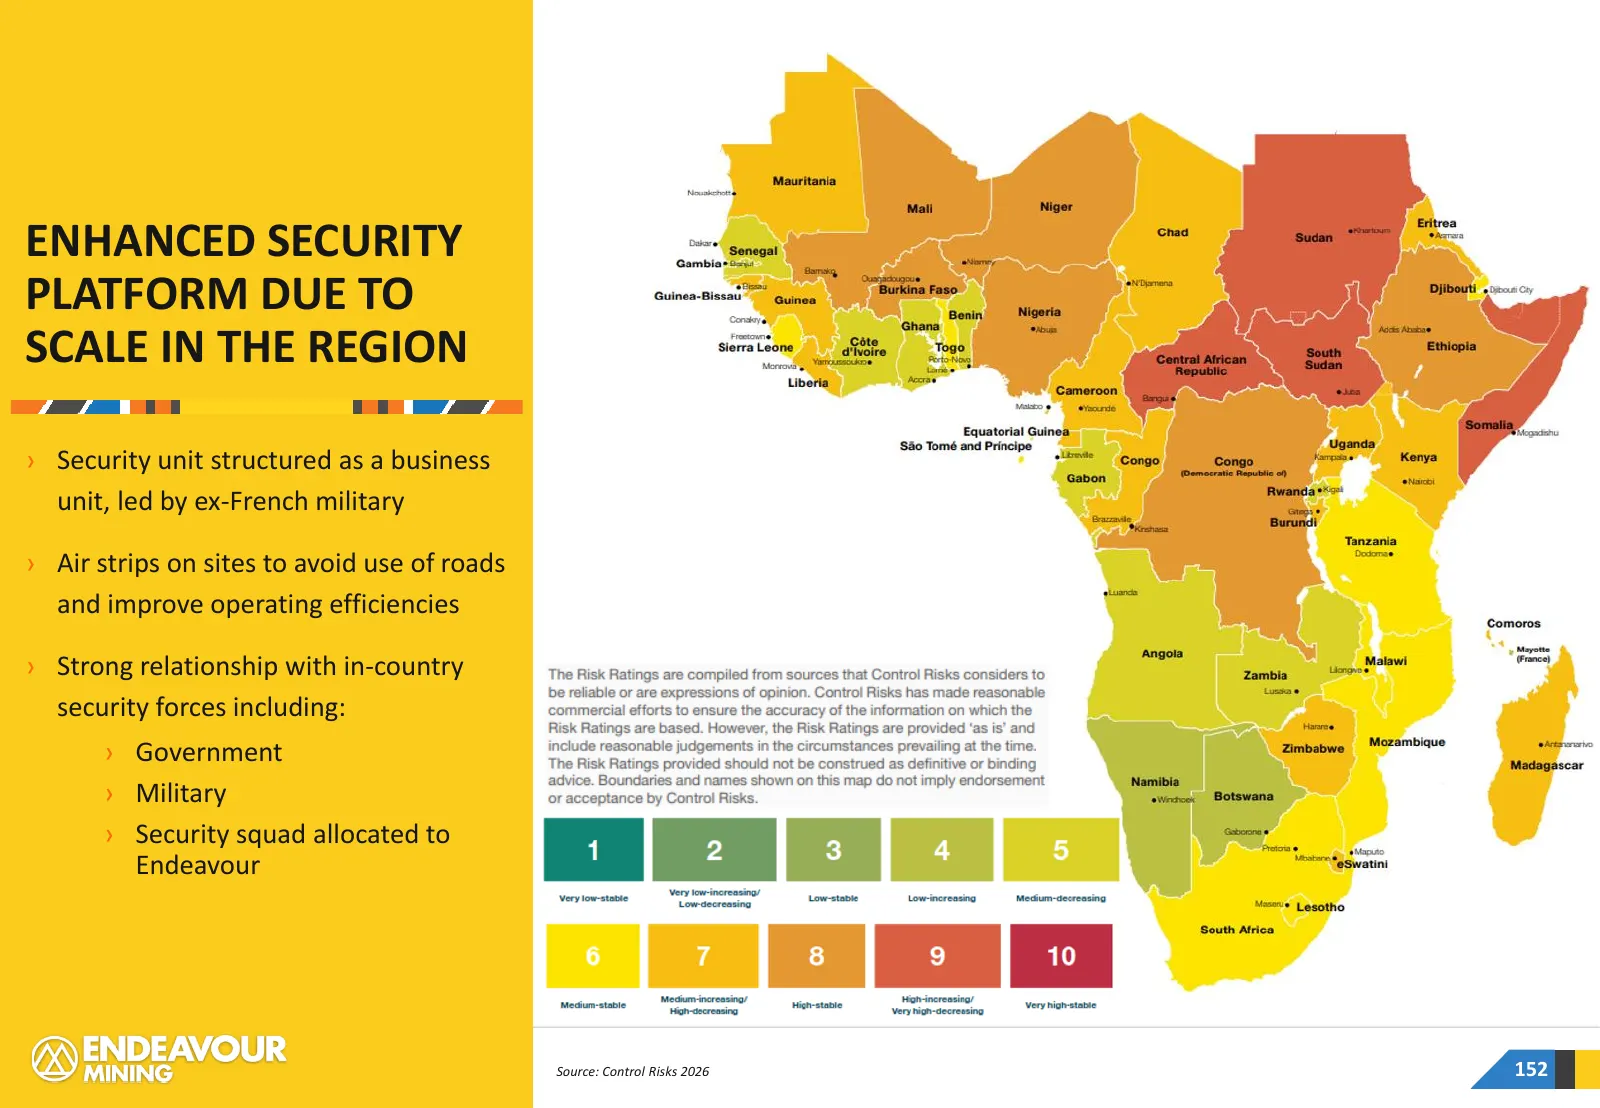
ENHANCED SECURITY PLATFORM DUE TO SCALE IN THE REGION › Security unit structured as a business unit, led by ex-French military › Air strips on sites to avoid use of roads and improve operating efficiencies › Strong relationship with in-country security forces including: › Government › Military › Sec
Slide 153: The Senegalese Economy
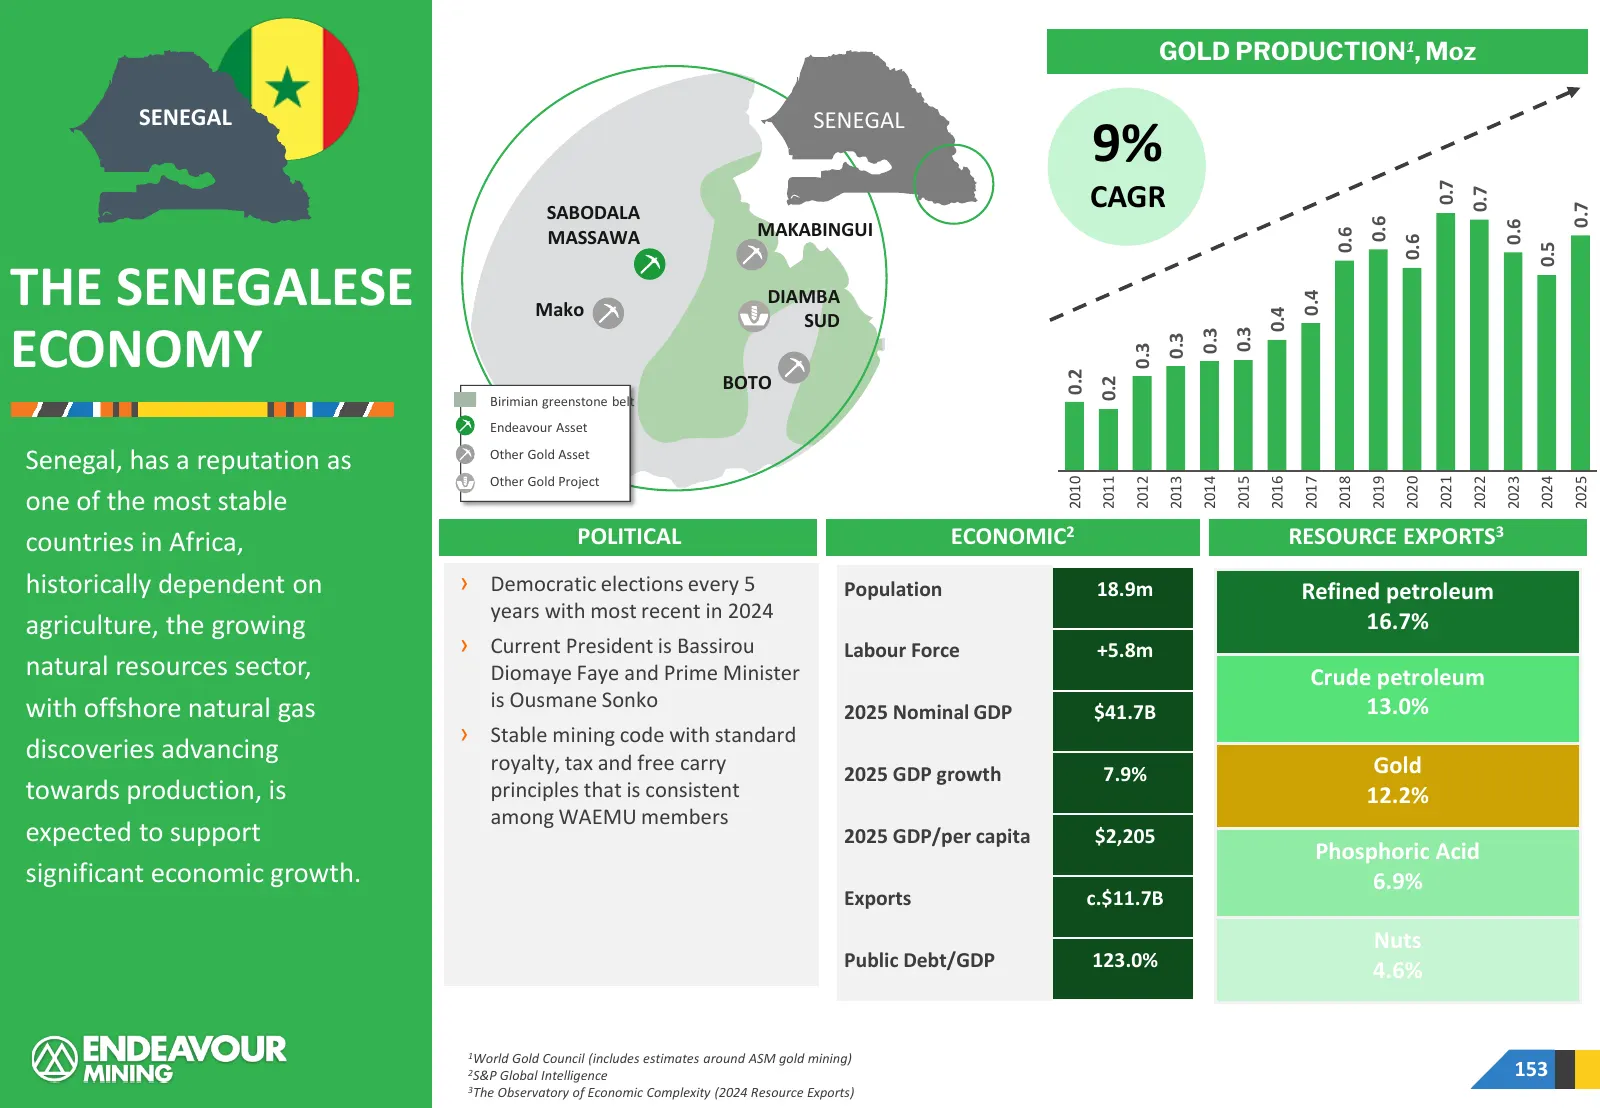
GOLD PRODUCTION1, Moz SENEGAL SENEGAL 9% 0.7 CAGR 0.7 0.7 SABODALA 0.6 0.6 MAKABINGUI 0.6 MASSAWA 0.6 0.5 THE SENEGALESE DIAMBA 0.4 Mako 0.4 SUD ECONOMY 0.3 0.3 0.3 0.3 0.2 BOTO 0.2 Birimian greenstone belt Endeavour Asset Senegal, has a reputation as Other Gold Asset Other Gold Project 2010 2011 20
Slide 154: The Ivorian Economy
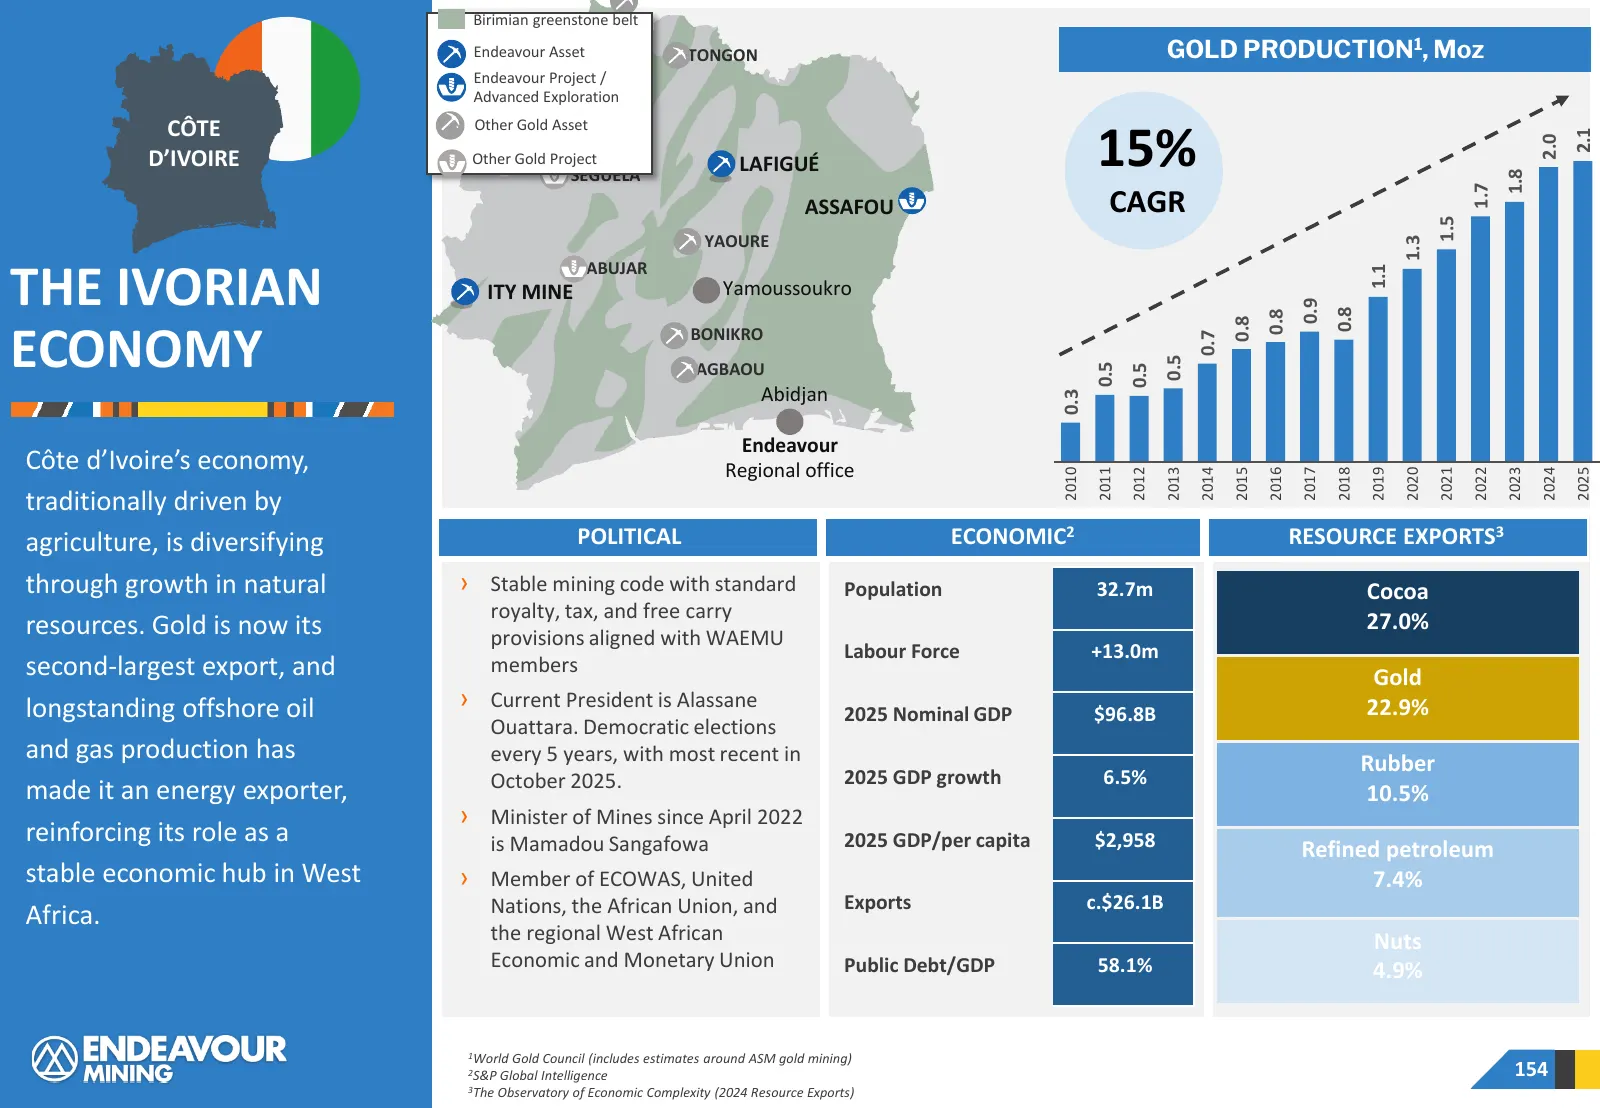
Birimian greenstone belt Endeavour Asset TONGON GOLD PRODUCTION1, Moz Endeavour Project / Advanced Exploration CÔTE Other Gold Asset 15% 2.1 KONE 2.0 D’IVOIRE Other Gold Project LAFIGUÉ SEGUELA 1.8 1.7 ASSAFOU CAGR 1.5 YAOURE 1.3 ABUJAR THE IVORIAN 1.1 ITY MINE Yamoussoukro 0.9 0.8 0.8 0.8 ECONOMY B
Slide 155: The Burkinabe Economy
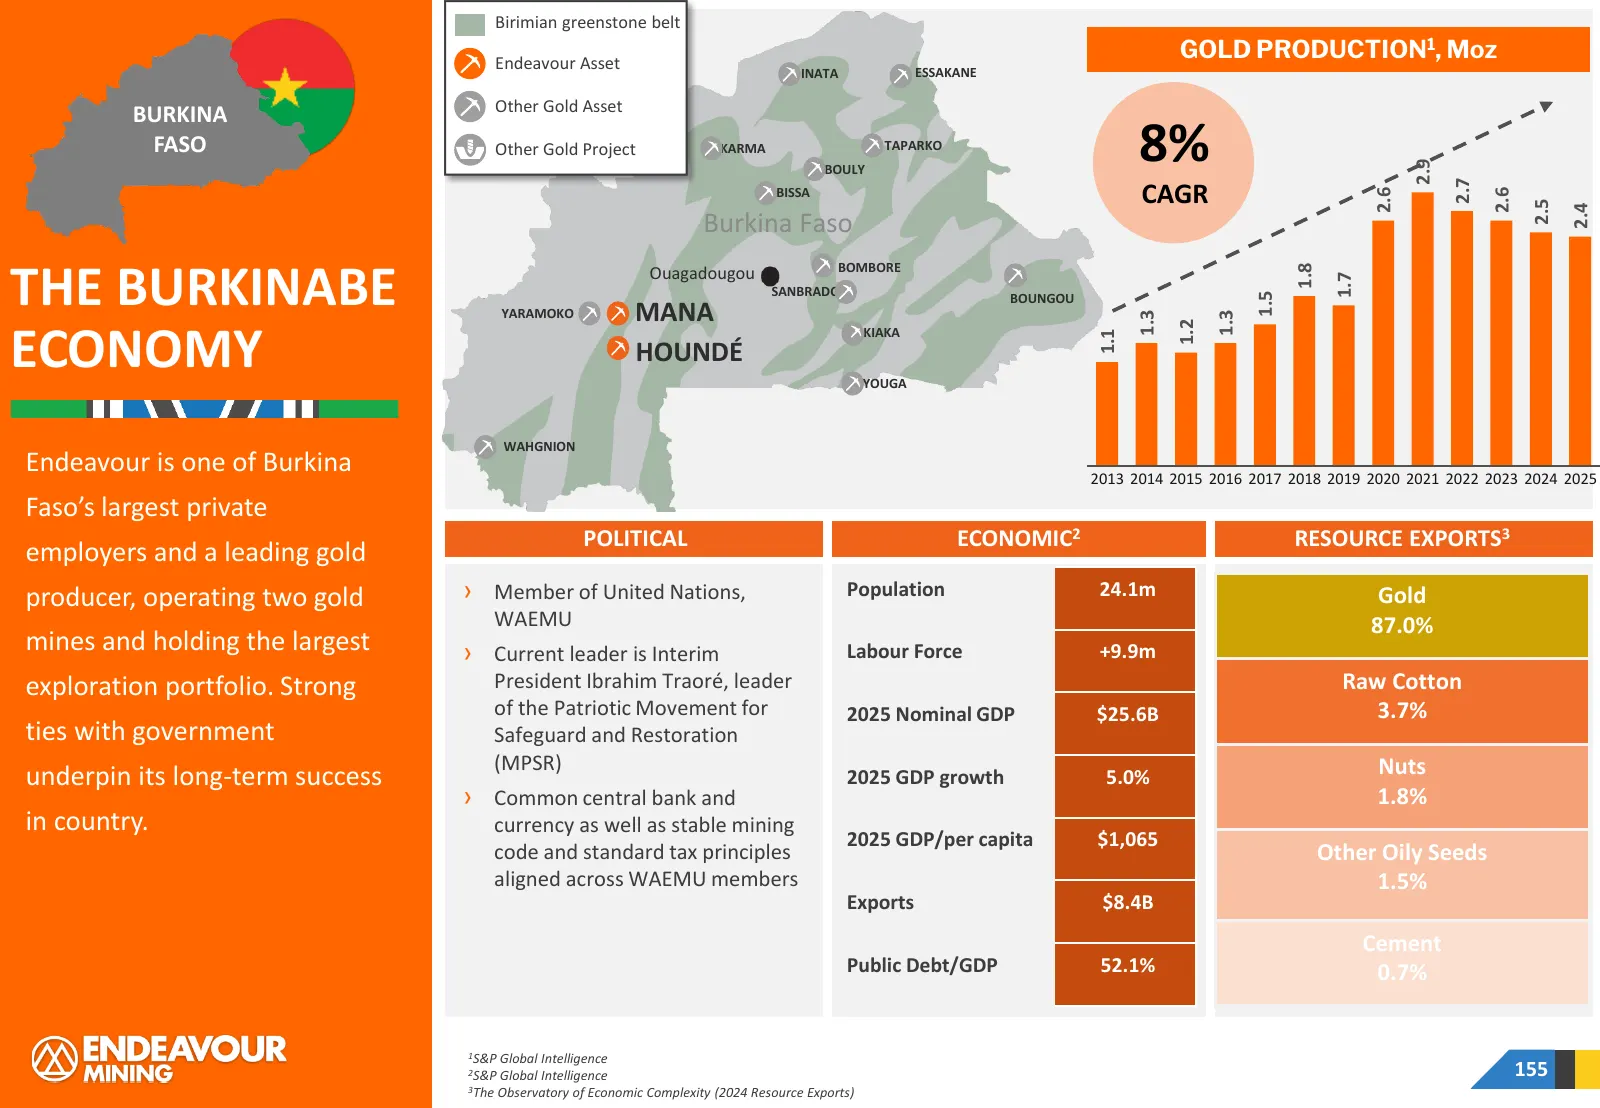
Birimian greenstone belt Endeavour Asset GOLD PRODUCTION1, Moz INATA ESSAKANE Other Gold Asset BURKINA FASO Other Gold Project KARMA TAPARKO 8% 2.9 BOULY 2.7 BISSA CAGR 2.6 2.6 2.5 2.4 Burkina Faso BOMBORE THE BURKINABE 1.8 Ouagadougou 1.7 SANBRADO 1.5 BOUNGOU YARAMOKO MANA 1.3 1.3 1.2 ECONOMY KIAKA
Slide 156: Appendix
APPENDIX 7/t / vA
Slide 157: Appendix 1: Management, Board, Corporate Structure & Remuneration Plans
01 APPENDIX 1 Management, Board, Corporate Structure & Remuneration Plans
Slide 158: Executive Management Team
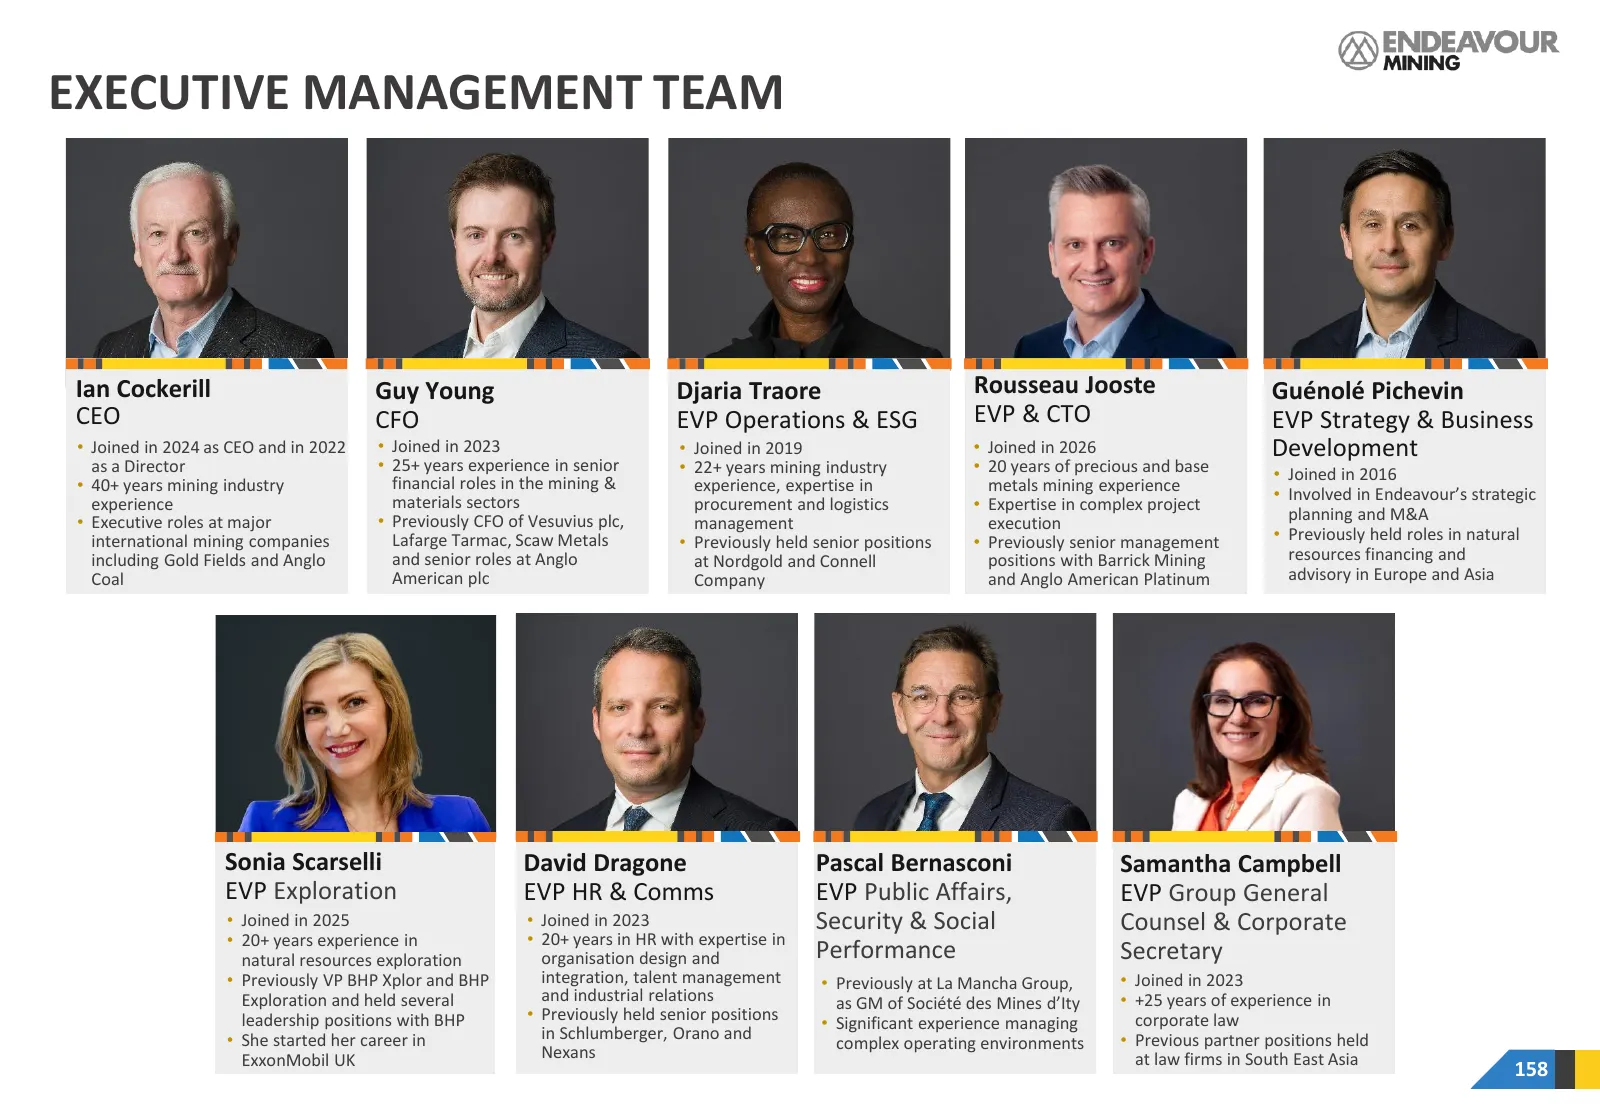
EXECUTIVE MANAGEMENT TEAM Ian Cockerill Guy Young Djaria Traore Rousseau Jooste Guénolé Pichevin CEO CFO EVP Operations & ESG EVP & CTO EVP Strategy & Business • Joined in 2024 as CEO and in 2022 • Joined in 2023 • Joined in 2019 • Joined in 2026 Development as a Director • 25+ years experience in s
Slide 159: Board Members
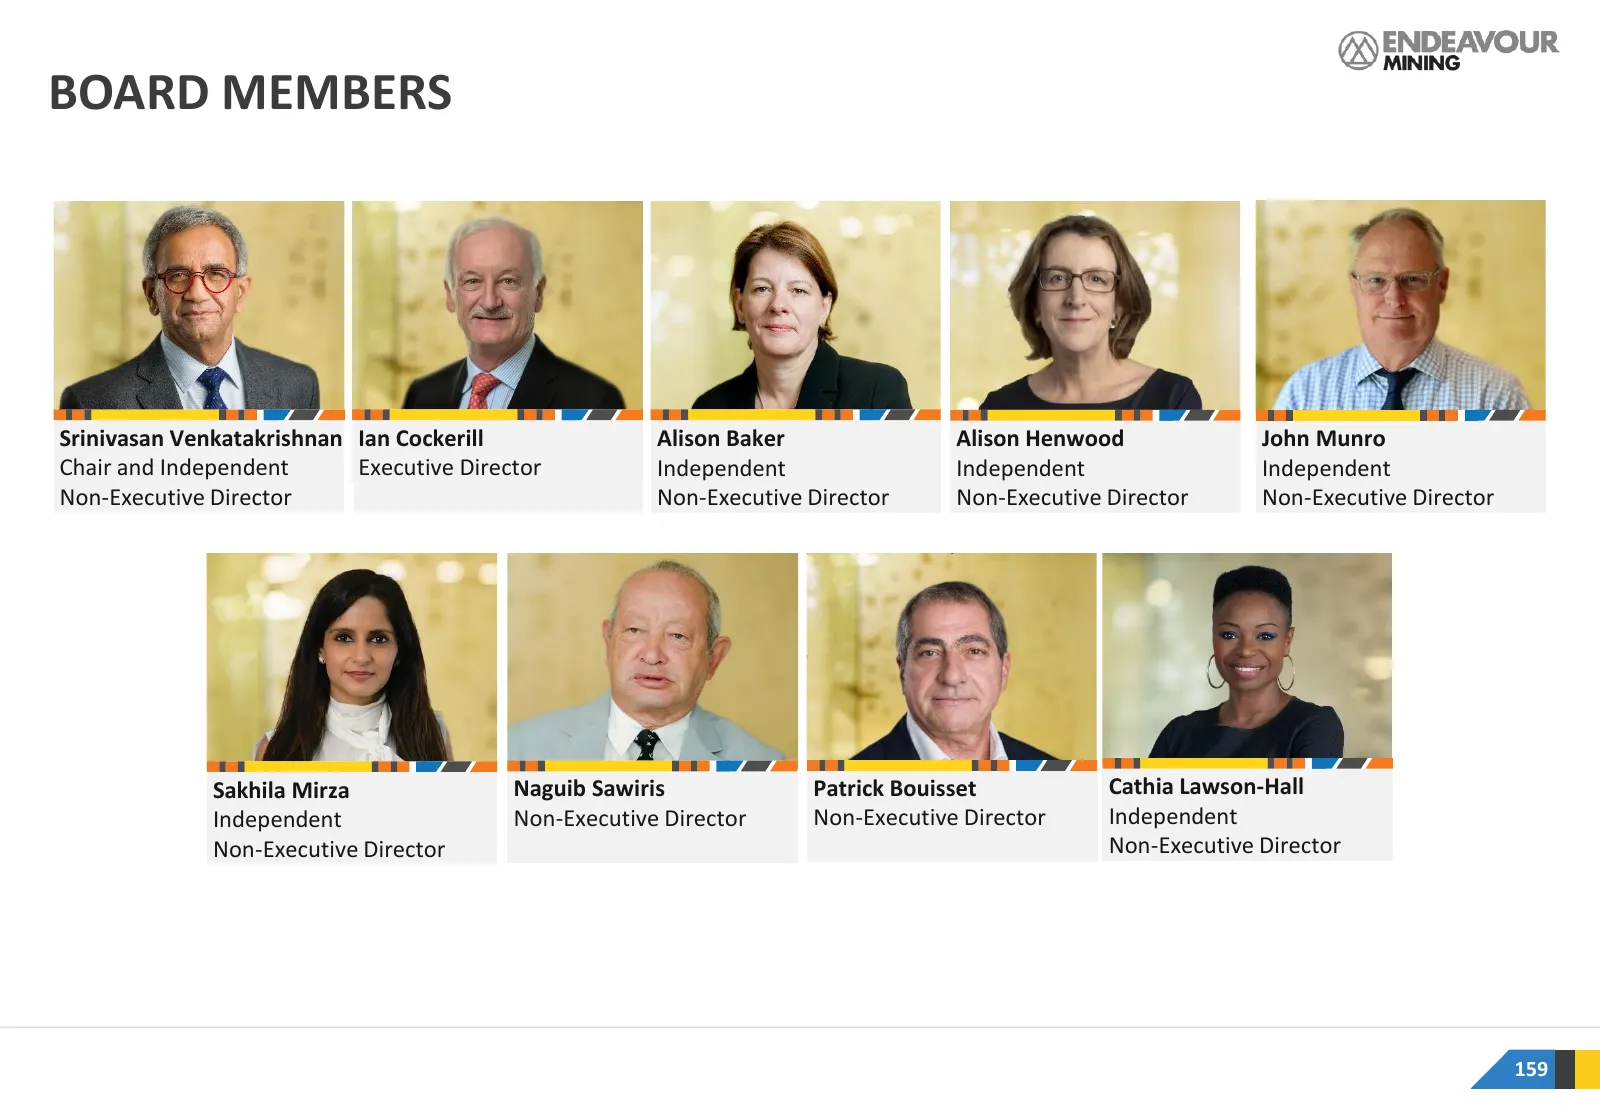
BOARD MEMBERS Srinivasan Venkatakrishnan Ian Cockerill Alison Baker Alison Henwood John Munro Chair and Independent Executive Director Independent Independent Independent Non-Executive Director Non-Executive Director Non-Executive Director Non-Executive Director Sakhila Mirza Naguib Sawiris Patrick
Slide 160: Corporate Structure
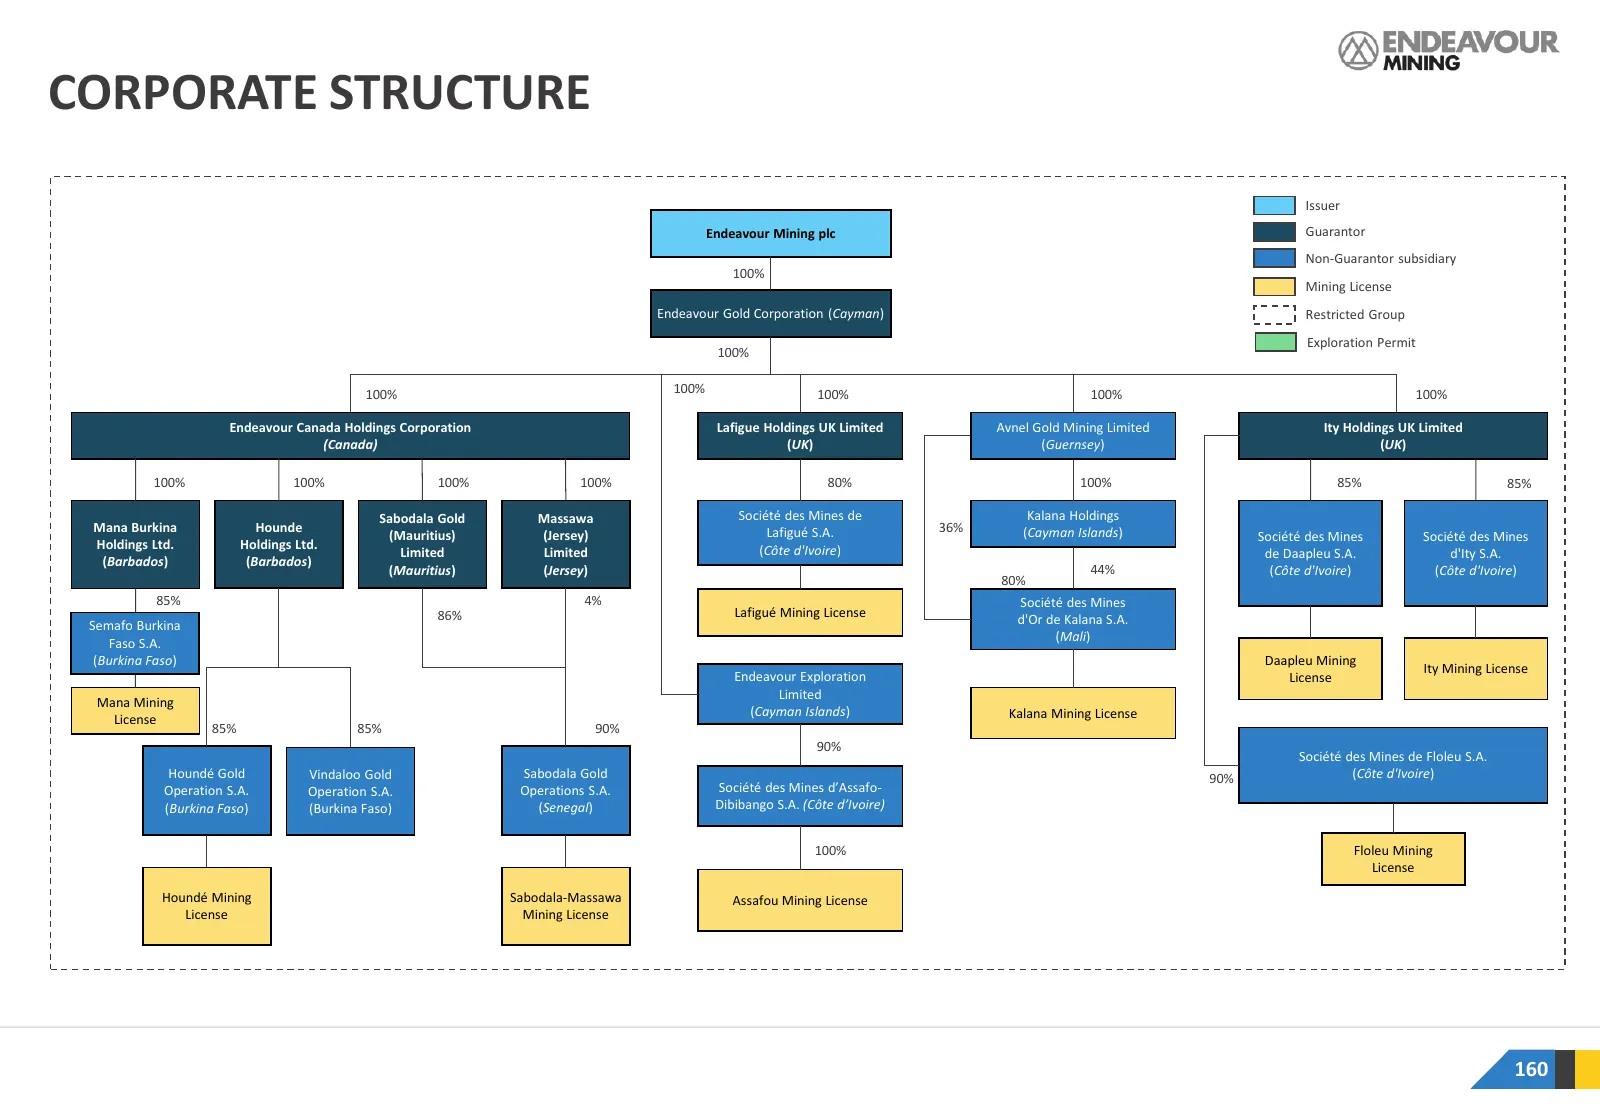
CORPORATE STRUCTURE Issuer Endeavour Mining plc Guarantor Non-Guarantor subsidiary 100% Mining License Endeavour Gold Corporation (Cayman) Restricted Group Exploration Permit 100% 100% 100% 100% 100% 100% Endeavour Canada Holdings Corporation Lafigue Holdings UK Limited Avnel Gold Mining Limited Ity
Slide 161: Short Term Incentive Plan
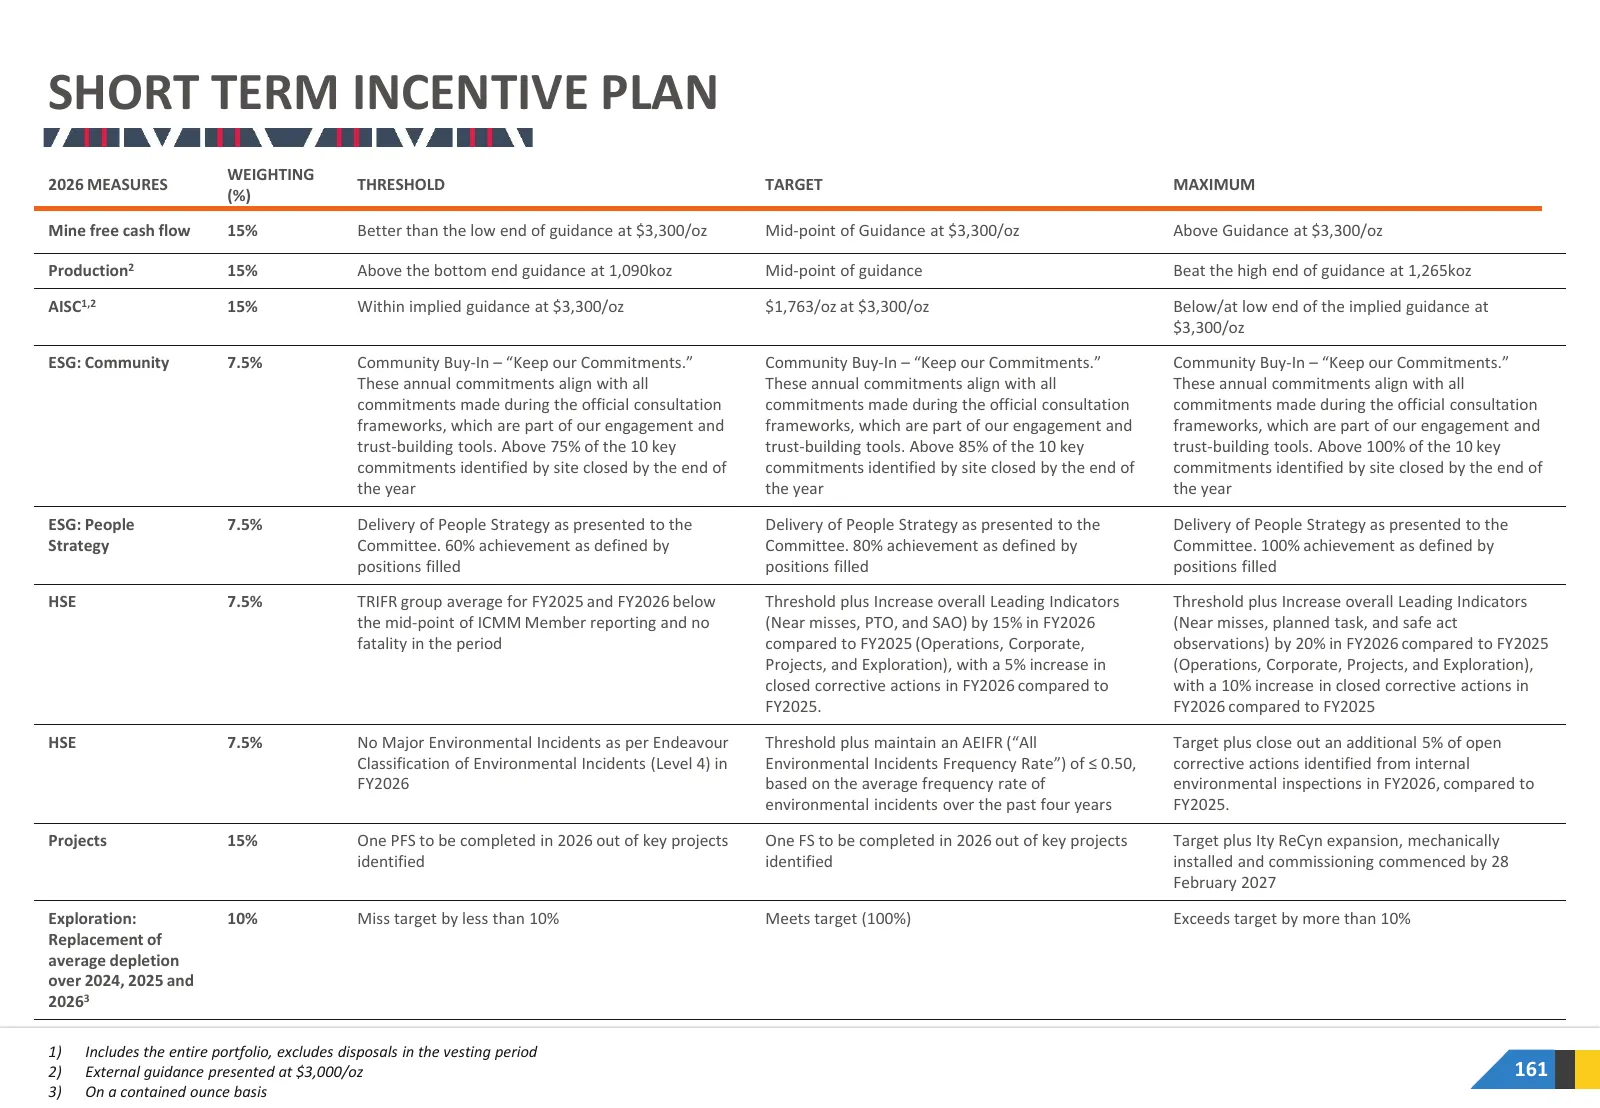
SHORT TERM INCENTIVE PLAN WEIGHTING 2026 MEASURES THRESHOLD TARGET MAXIMUM (%) Mine free cash flow 15% Better than the low end of guidance at $3,300/oz Mid-point of Guidance at $3,300/oz Above Guidance at $3,300/oz Production2 15% Above the bottom end guidance at 1,090koz Mid-point of guidance Beat
Slide 162: Long Term Incentive Plan
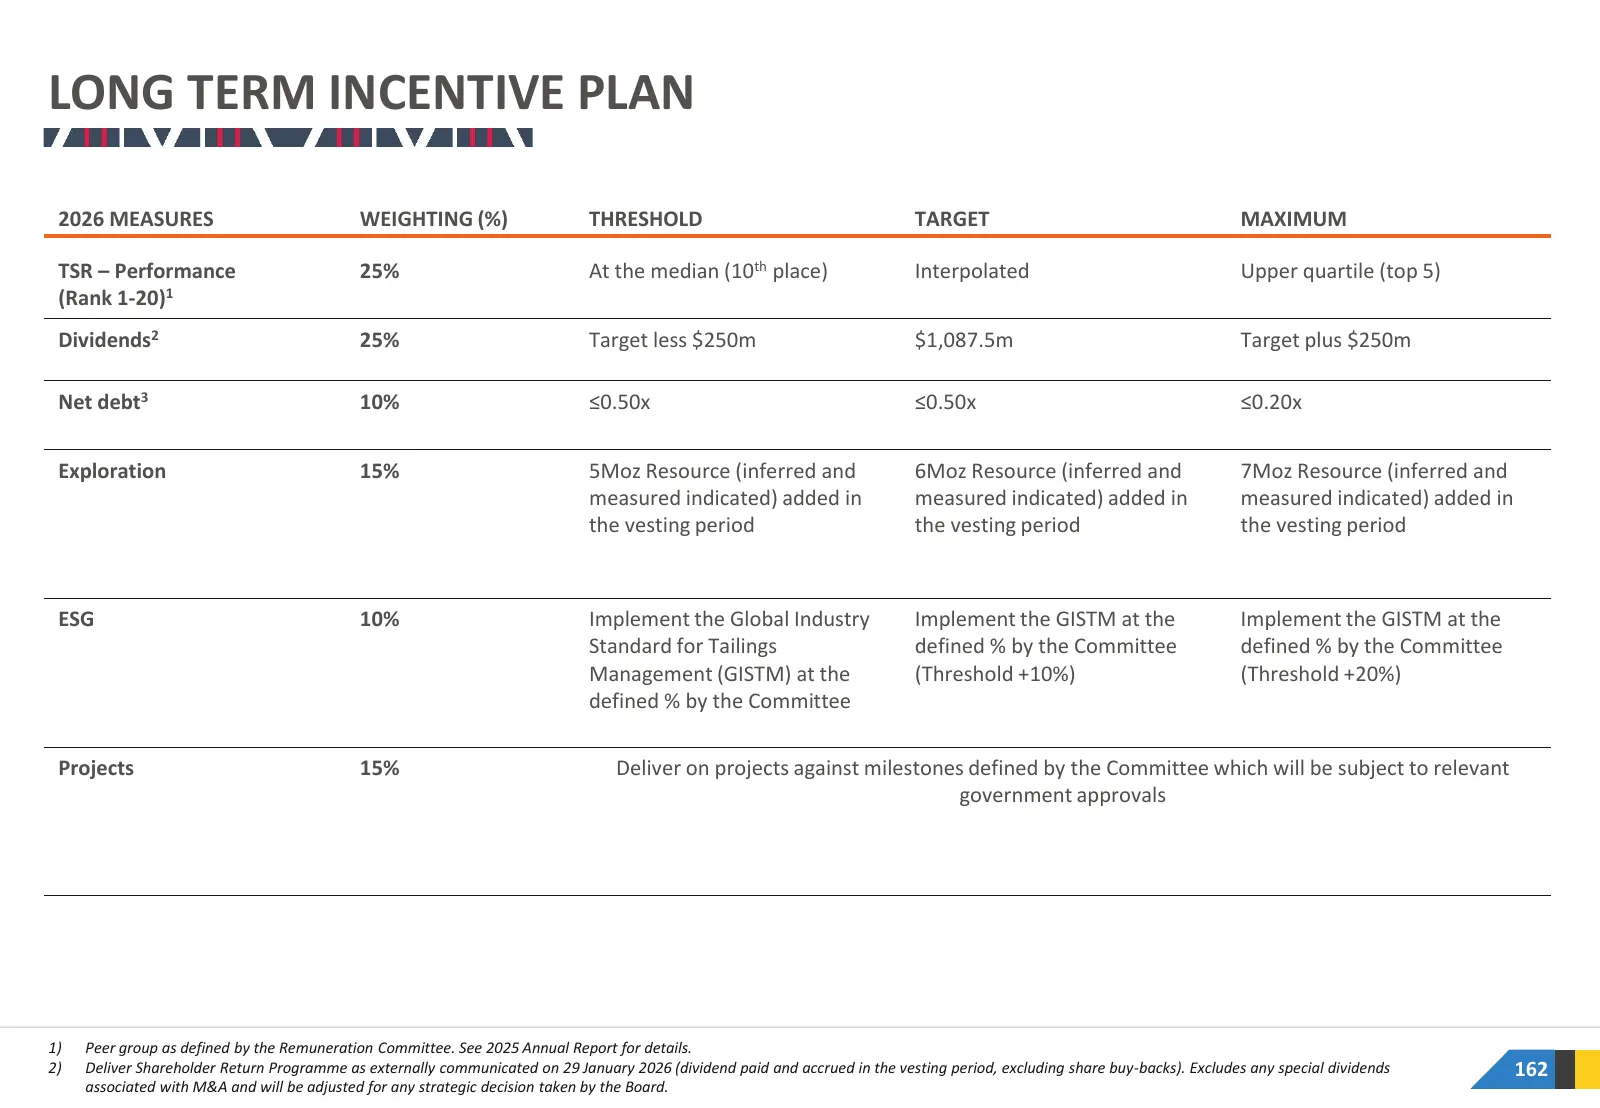
LONG TERM INCENTIVE PLAN 2026 MEASURES WEIGHTING (%) THRESHOLD TARGET MAXIMUM TSR – Performance 25% At the median (10th place) Interpolated Upper quartile (top 5) (Rank 1-20)1 Dividends2 25% Target less $250m $1,087.5m Target plus $250m Net debt3 10% ≤0.50x ≤0.50x ≤0.20x Exploration 15% 5Moz Resourc
Slide 163: Appendix 2: Mine Statistics & Additional Information
02 APPENDIX 2 Mine Statistics & Additional Information
Slide 164: Mine Statistics: Quarterly
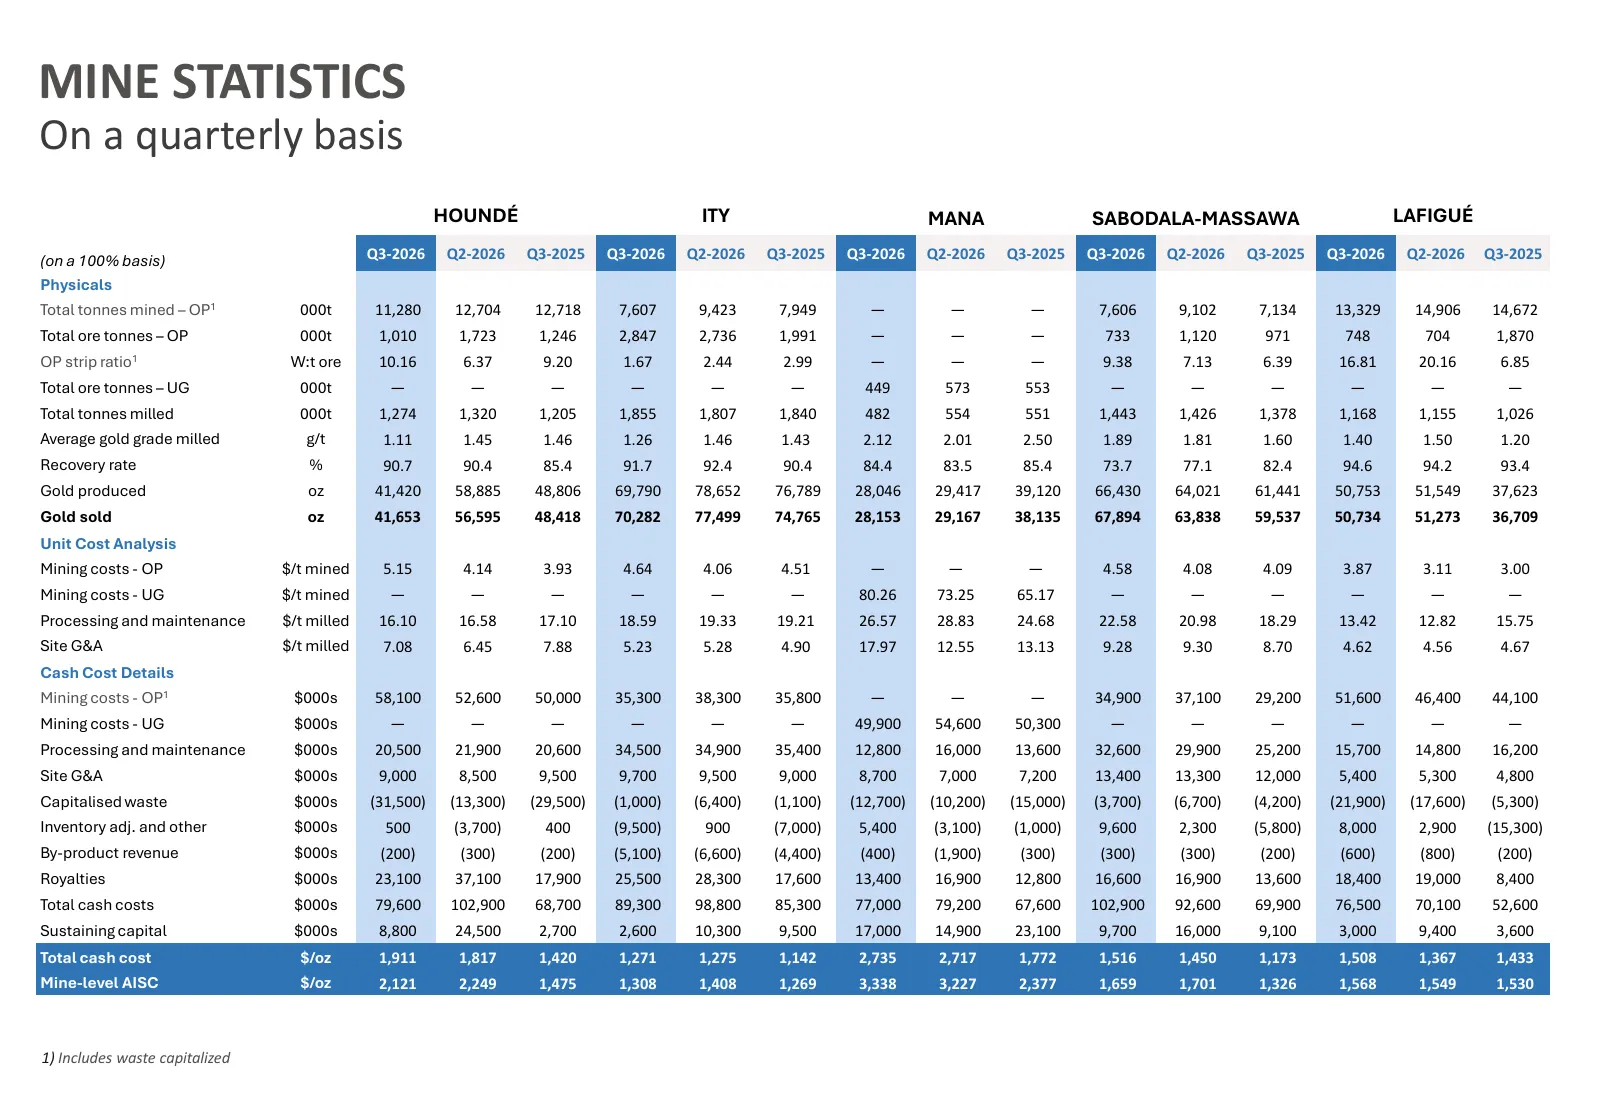
64 MINE STATISTICS On a quarterly basis HOUNDÉ ITY MANA SABODALA-MASSAWA LAFIGUÉ (on a 100% basis) Q3-2026 Q2-2026 Q3-2025 Q3-2026 Q2-2026 Q3-2025 Q3-2026 Q2-2026 Q3-2025 Q3-2026 Q2-2026 Q3-2025 Q3-2026 Q2-2026 Q3-2025 Physicals Total tonnes mined – OP1 000t 11,280 12,704 12,718 7,607 9,423 7,949 —
Slide 165: Mine Statistics: Year-to-Date
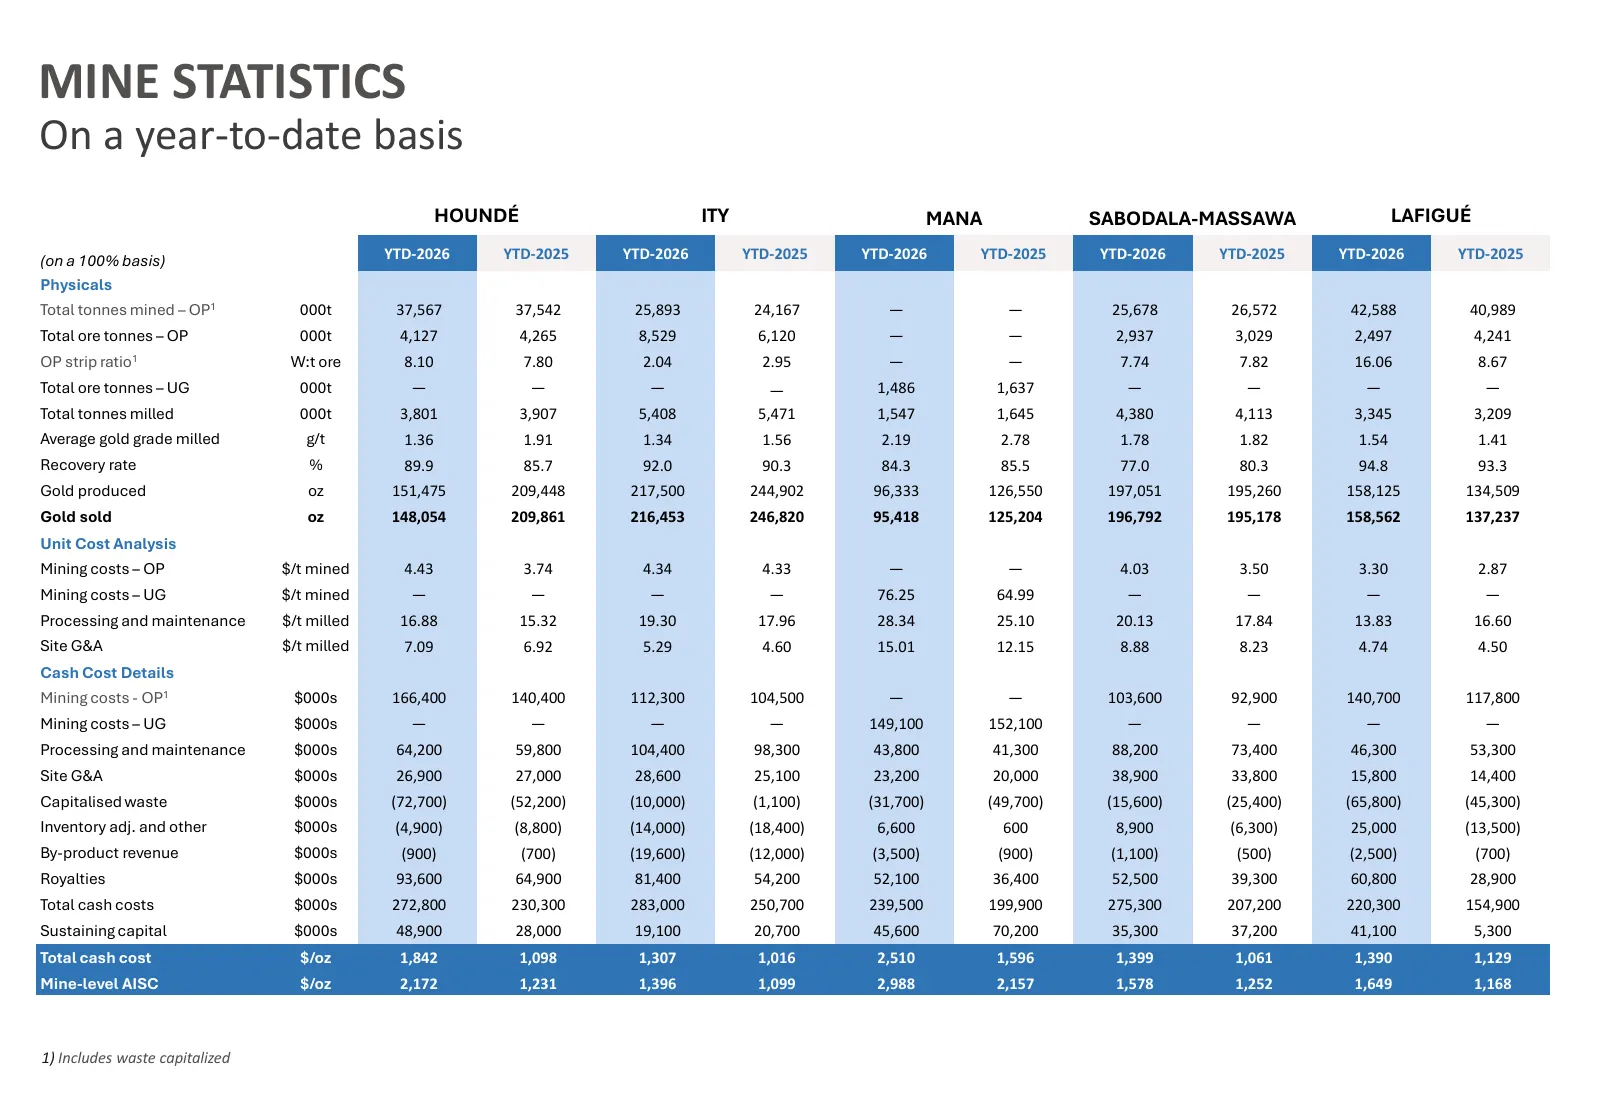
65 MINE STATISTICS On a year-to-date basis HOUNDÉ ITY MANA SABODALA-MASSAWA LAFIGUÉ (on a 100% basis) YTD-2026 YTD-2025 YTD-2026 YTD-2025 YTD-2026 YTD-2025 YTD-2026 YTD-2025 YTD-2026 YTD-2025 Physicals Total tonnes mined – OP1 000t 37,567 37,542 25,893 24,167 — — 25,678 26,572 42,588 40,989 Total or
Slide 166: Appendix 3: Reserves and Resources, 5-Year Exploration Target
03 APPENDIX 3 Reserves and Resources, 5-year exploration target
Slide 167: Reserves and Resources
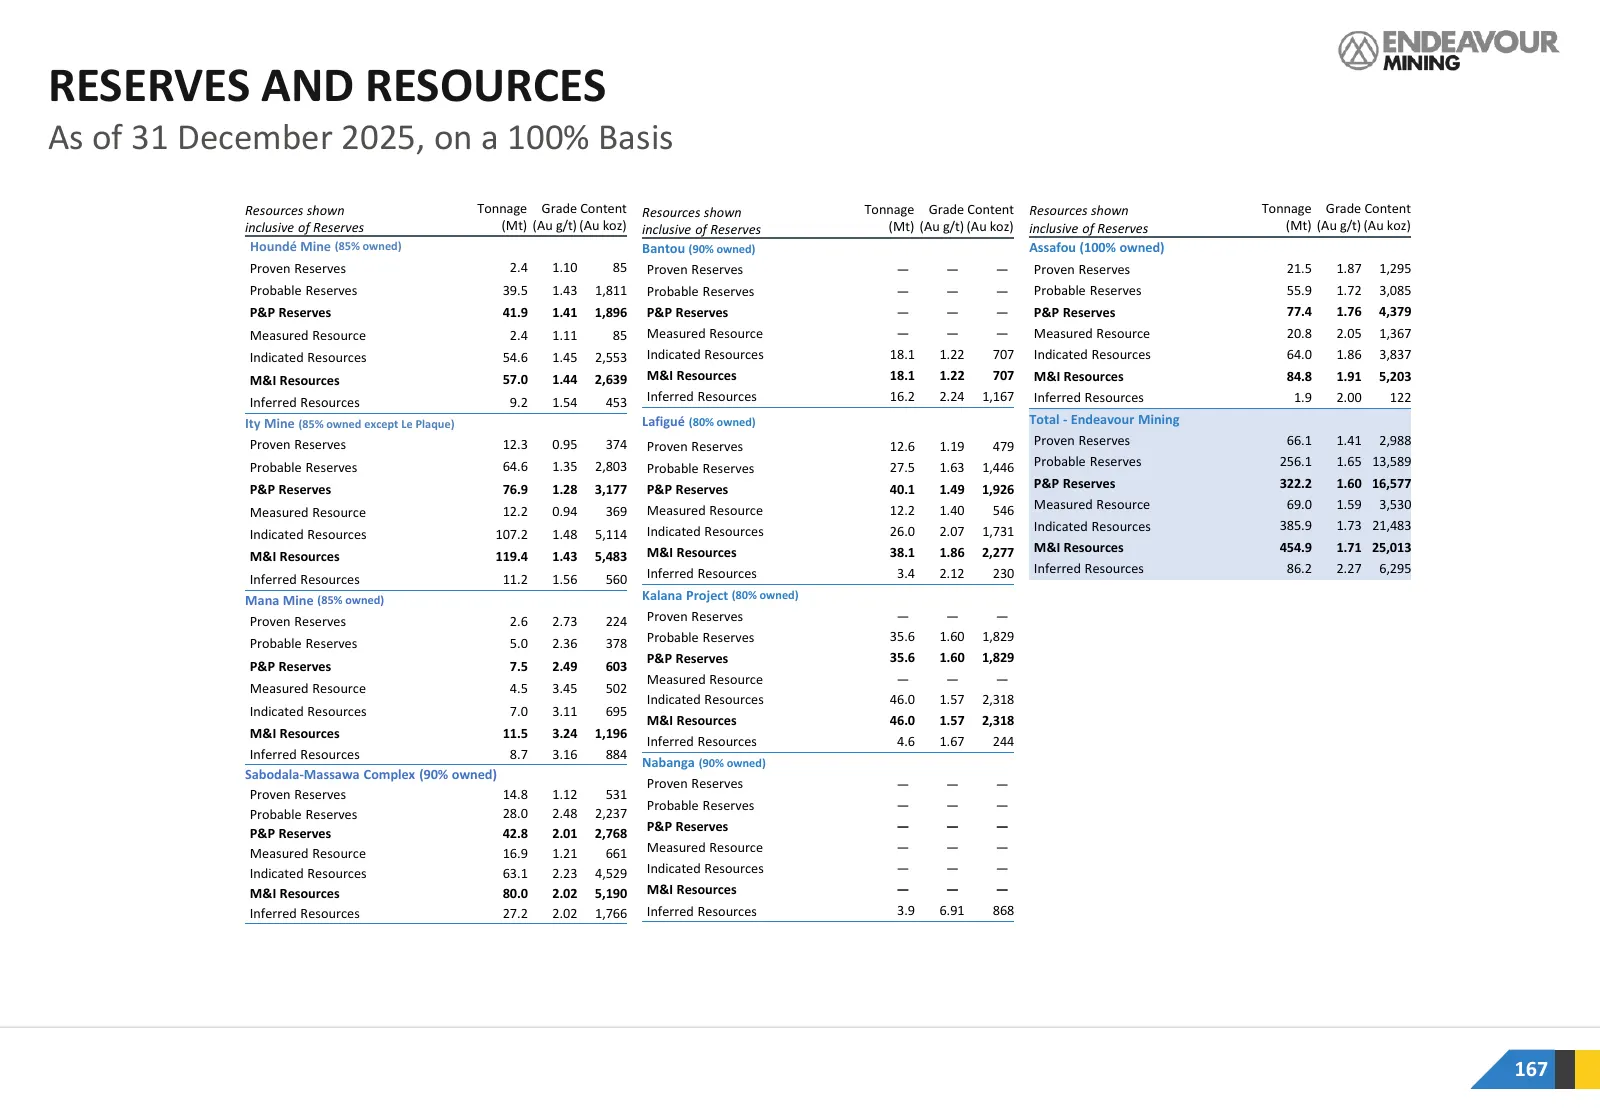
RESERVES AND RESOURCES As of 31 December 2025, on a 100% Basis Resources shown Tonnage Grade Content Resources shown Tonnage Grade Content Resources shown Tonnage Grade Content inclusive of Reserves (Mt) (Au g/t) (Au koz) inclusive of Reserves (Mt) (Au g/t) (Au koz) inclusive of Reserves (Mt) (Au g/
Slide 168: Notes to Reserves and Resources
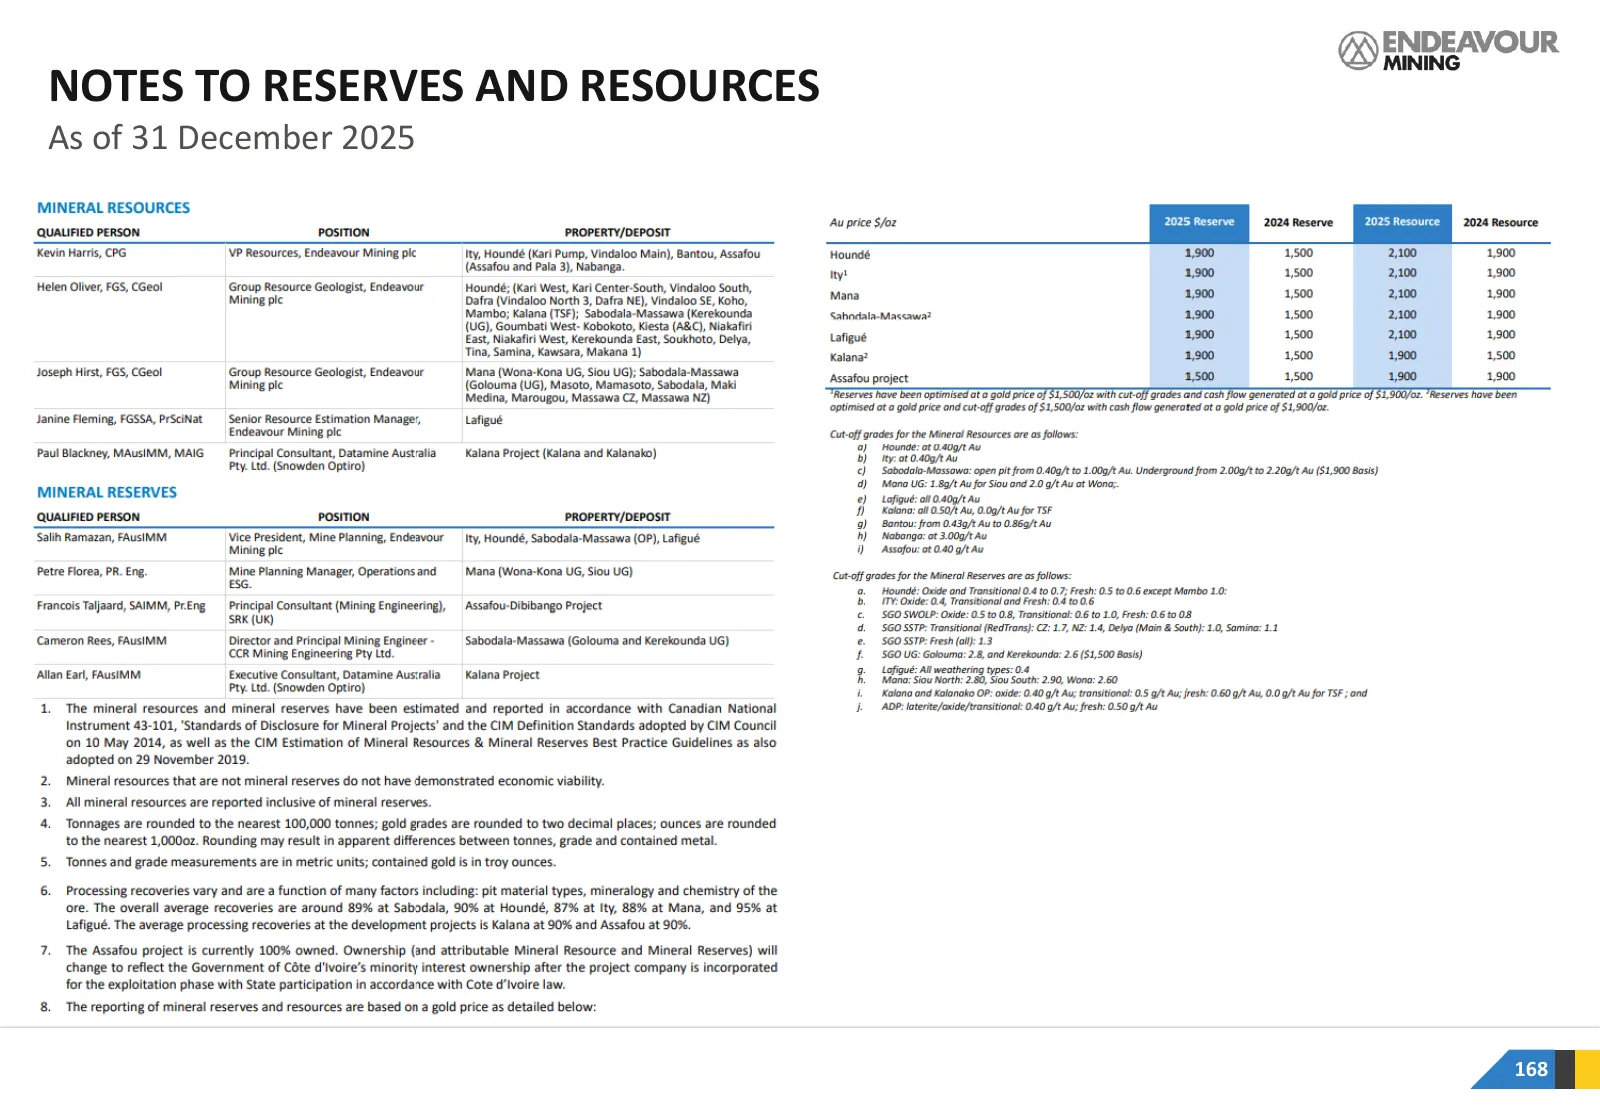
NOTES TO RESERVES AND RESOURCES As of 31 December 2025 168
Slide 169: Exploration Target Methodology
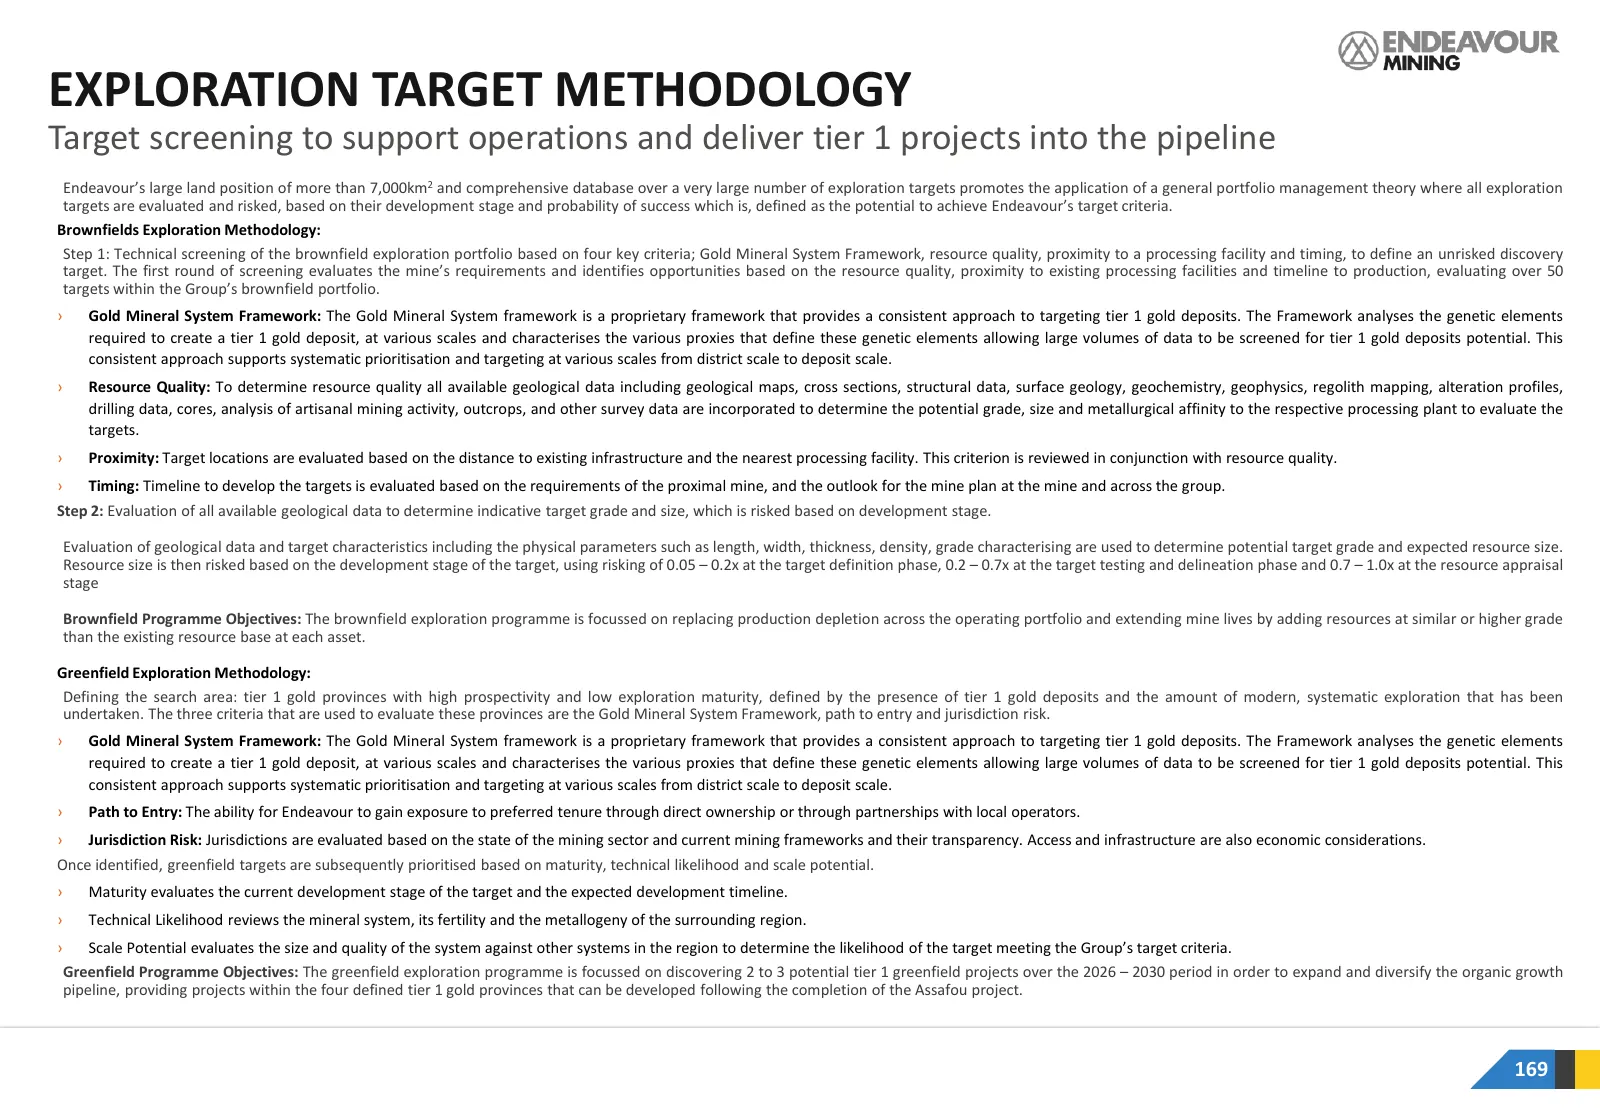
EXPLORATION TARGET METHODOLOGY Target screening to support operations and deliver tier 1 projects into the pipeline Endeavour’s large land position of more than 7,000km2 and comprehensive database over a very large number of exploration targets promotes the application of a general portfolio managem
Slide 170: Contact Us
CORPORATE OFFICE 5 Young Street, London W8 5EH, United Kingdom T: +44 203 011 2723 OPERATIONS OFFICE Abidjan Office, Route du Lycée Technique, Abidjan, 08 BP 872 Abidjan 08, Côte d’Ivoire T: +225 27 22 48 99 00 CONTACT US investor@endeavourmining.com Follow us: TSX.EDV endeavourmining.com LSE.EDV
Source: company website
More decks from Endeavour Mining PLC
 Q3 2026 Earnings Presentation51 slides · Nov 12, 2026
 Investor Presentation (October 2026)167 slides · October 2026
 Investor Presentation (September 2026)167 slides · September 2026
 Investor Presentation (August 2026)167 slides · August 2026
 Q2 2026 Earnings Presentation50 slides · Jul 30, 2026
 Investor Presentation (June 2026)163 slides · June 2026