Comerica — Comerica Inc /New/ — Credit Suisse Financial Services Forum 2014
21 slides from Comerica's conference presentation, Feb 7, 2014
Slide 1: Comerica Incorporated Credit Suisse Financial Services Forum
Comerica Incorporated Credit Suisse Financial Services ForumFebruary 10-11, 2014 Curt FarmerVice Chairman, The Retail Bank and Wealth Management Karen ParkhillVice Chairman andChief Financial Officer 2 Safe Harbor Statement Any statements in this presentation that are not historical facts are forwar
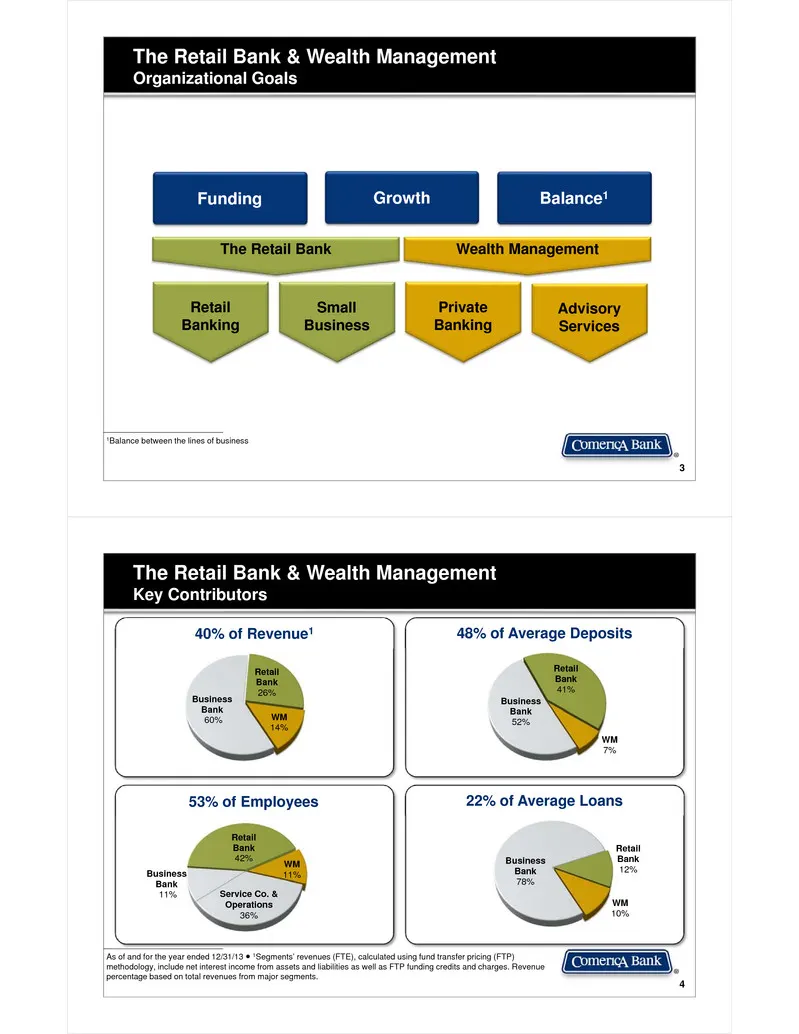
Slide 2: The Retail Bank & Wealth Management Key Contributors
3 The Retail Bank & Wealth Management Organizational Goals 1Balance between the lines of business RetailBanking Small Business PrivateBanking Advisory Services The Retail Bank Wealth Management Balance1Funding Growth 4 The Retail Bank & Wealth ManagementKey Contributors As of and for the year ended
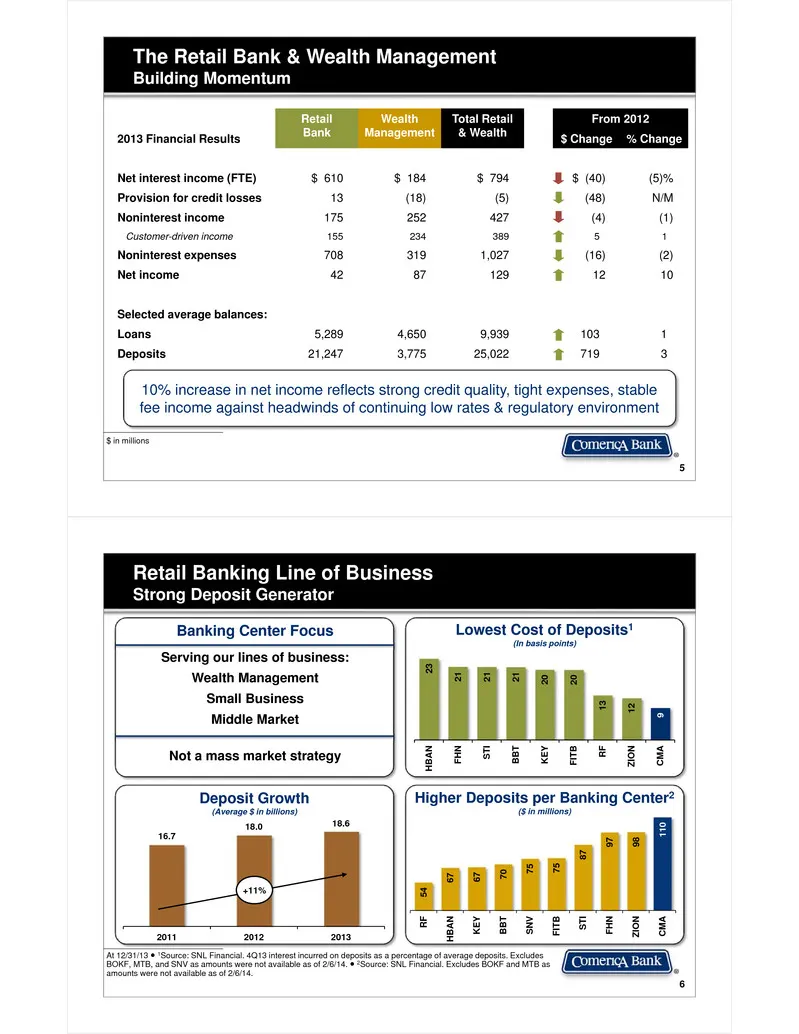
Slide 3: Retail Bank & Wealth Management: Building Momentum
5 The Retail Bank & Wealth ManagementBuilding Momentum $ in millions 2013 Financial Results Retail Bank Wealth Management Total Retail & Wealth From 2012$ Change % Change Net interest income (FTE) $ 610 $ 184 $ 794 $ (40) (5)% Provision for credit losses 13 (18) (5) (48) N/M Noninterest income 175 2
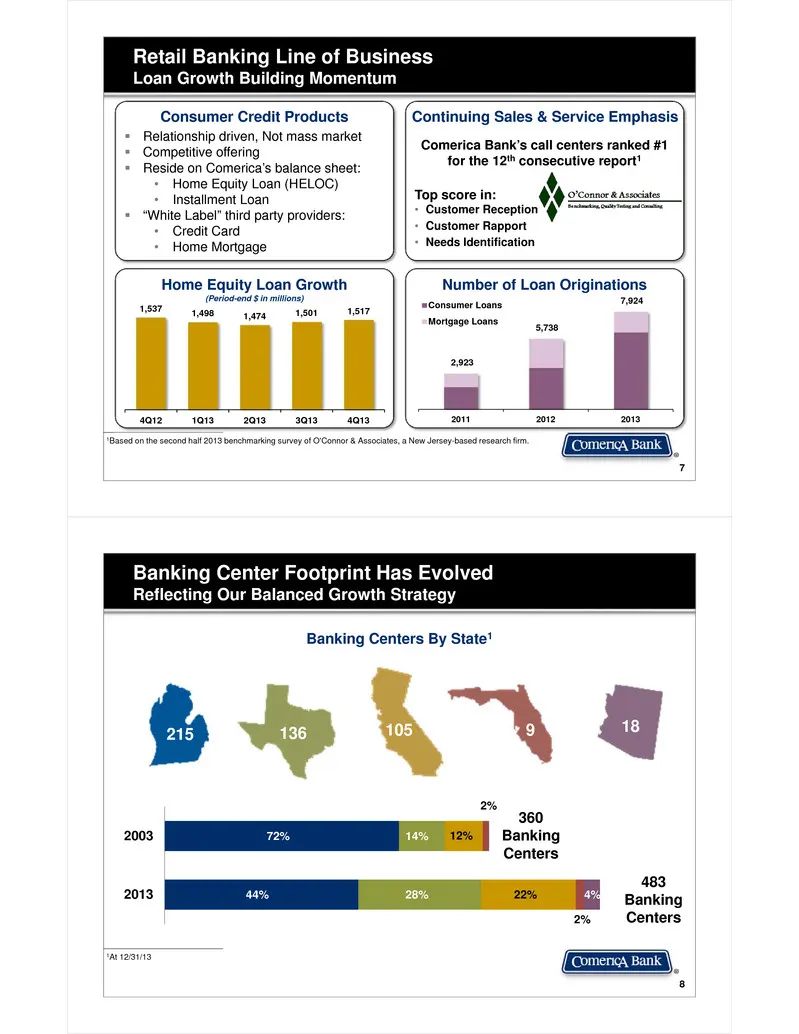
Slide 4: Retail Banking Loan Growth Building Momentum
Relationship driven, Not mass market Competitive offering Reside on Comerica’s balance sheet:• Home Equity Loan (HELOC)• Installment Loan “White Label” third party providers:• Credit Card• Home Mortgage 7 Retail Banking Line of BusinessLoan Growth Building Momentum 1Based on the second half
Slide 5: Banking Center Evolution
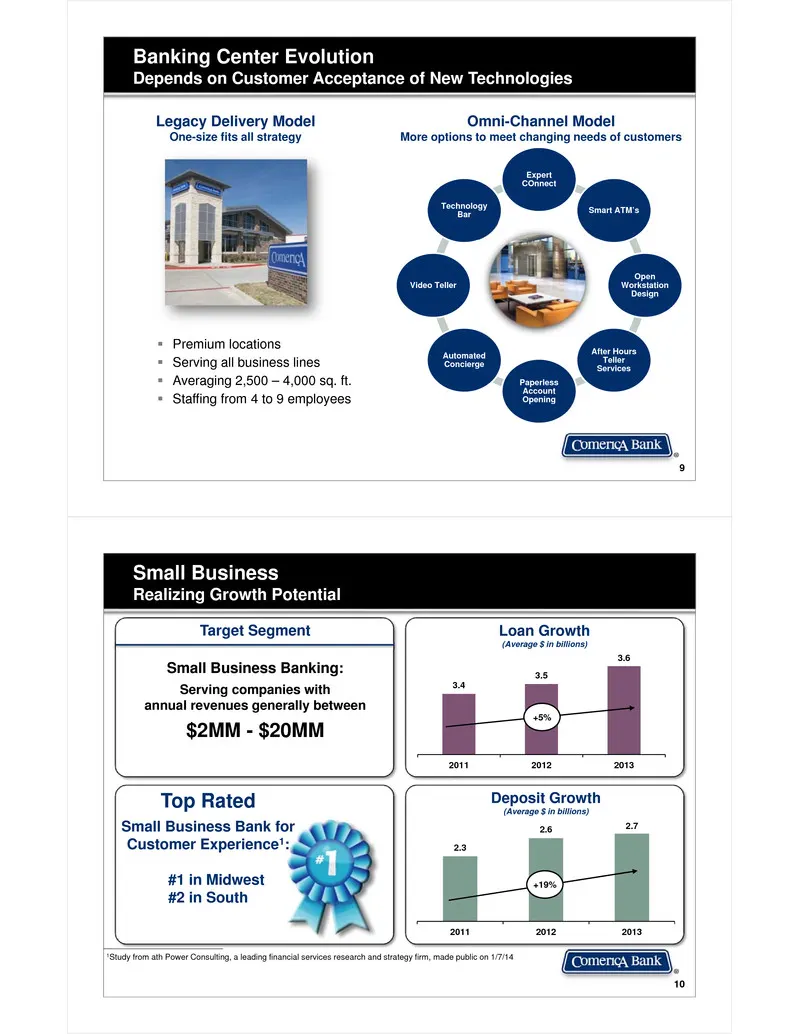
Banking Center EvolutionDepends on Customer Acceptance of New Technologies 9 Legacy Delivery ModelOne-size fits all strategy Premium locations Serving all business lines Averaging 2,500 – 4,000 sq. ft. Staffing from 4 to 9 employees Expert COnnect Smart ATM’s Open Workstation Design After Ho
Slide 6: Small Business Focus on Efficiency
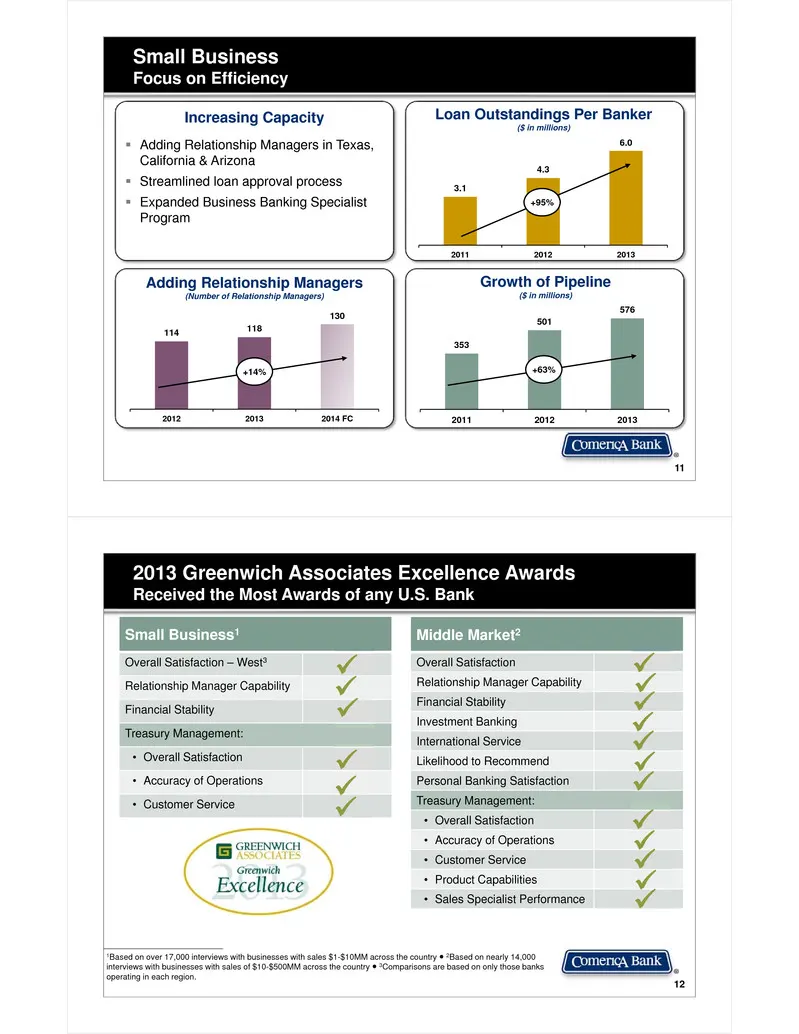
Small BusinessFocus on Efficiency 11 Adding Relationship Managers in Texas, California & Arizona Streamlined loan approval process Expanded Business Banking Specialist Program 353 501 576 2011 2012 2013 Adding Relationship Managers(Number of Relationship Managers) Growth of Pipeline($ in milli
Slide 7: Private Banking and Advisory Services
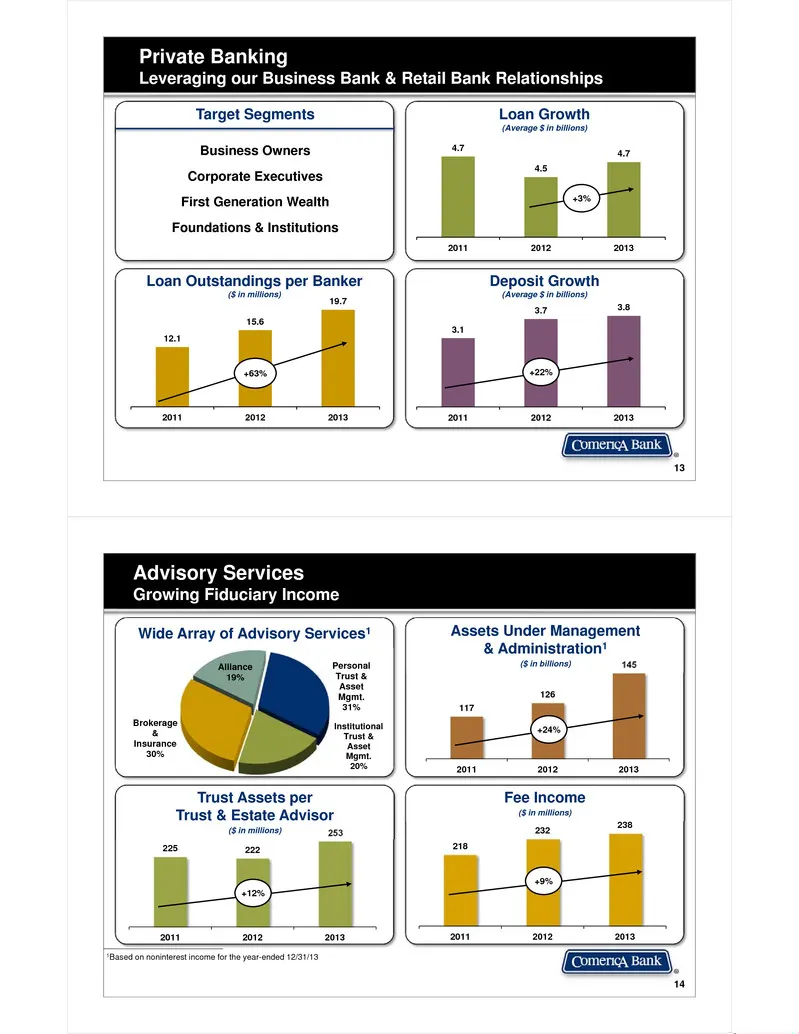
Private BankingLeveraging our Business Bank & Retail Bank Relationships 13 4.7 4.5 4.7 2011 2012 2013 Loan Growth(Average $ in billions) 3.1 3.7 3.8 2011 2012 2013 Deposit Growth(Average $ in billions)Loan Outstandings per Banker($ in millions) Target Segments Business Owners Corporate Executives Fi
Slide 8: Comerica Professional Trust Alliance
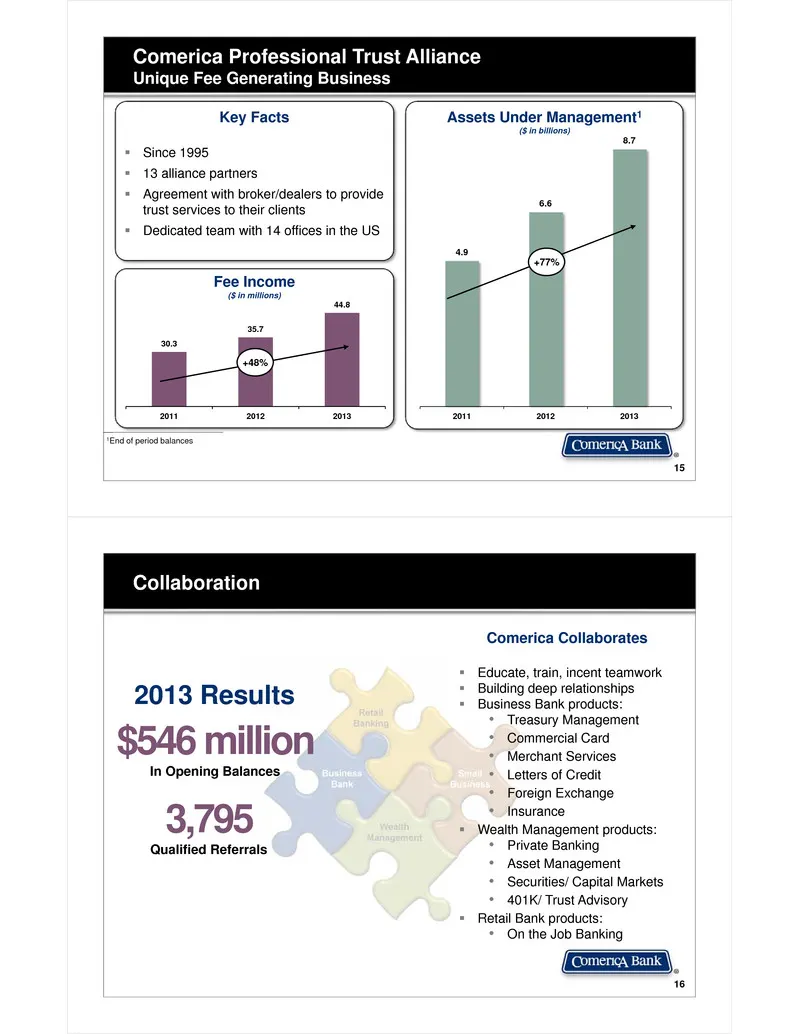
Since 1995 13 alliance partners Agreement with broker/dealers to provide trust services to their clients Dedicated team with 14 offices in the US 15 Comerica Professional Trust AllianceUnique Fee Generating Business 1End of period balances Assets Under Management1($ in billions) 4.9 6.6 8.7
Slide 9: Industry Evolution
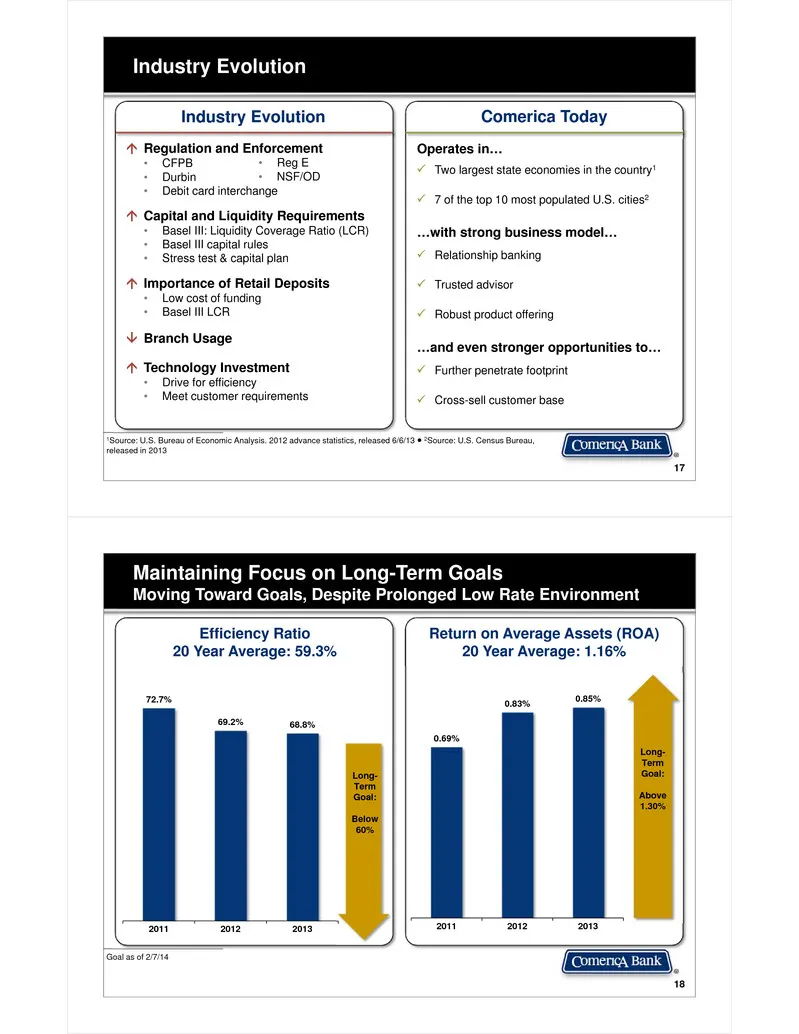
17 Industry Evolution 1Source: U.S. Bureau of Economic Analysis. 2012 advance statistics, released 6/6/13 ● 2Source: U.S. Census Bureau, released in 2013 Industry Evolution Regulation and Enforcement• CFPB• Durbin• Debit card interchange Capital and Liquidity Requirements• Basel III: Liquidity C
Slide 10: Controlling What We Can Control: Loans and Deposits
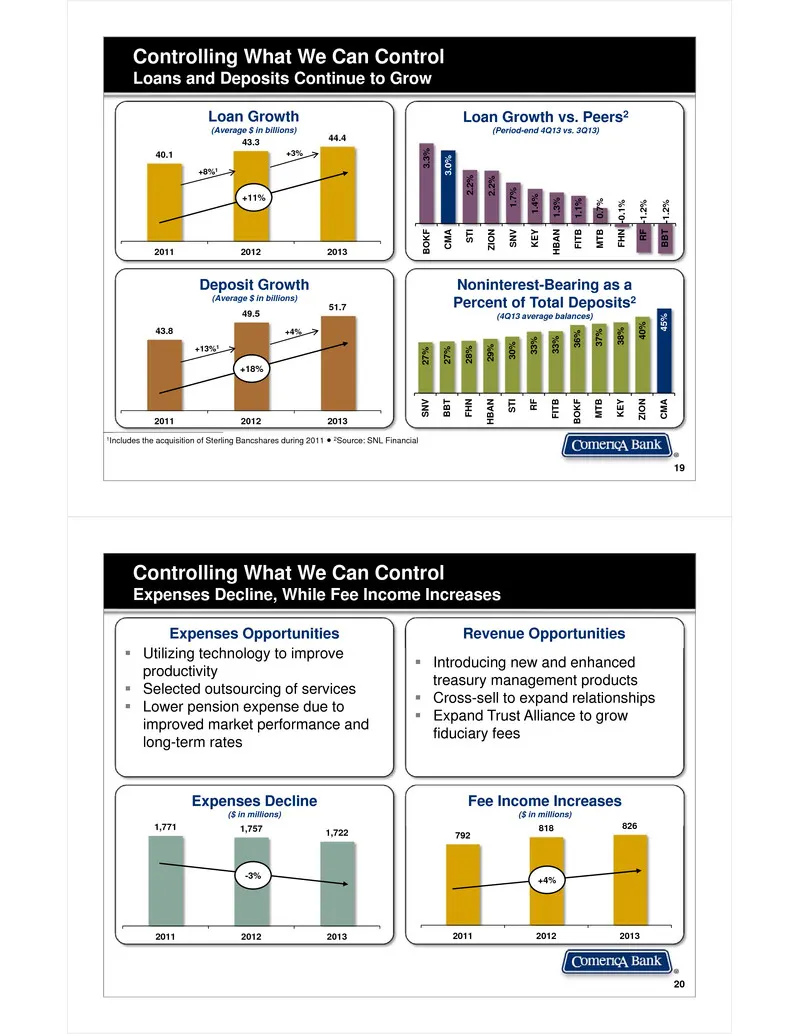
19 Controlling What We Can Control Loans and Deposits Continue to Grow 1Includes the acquisition of Sterling Bancshares during 2011 ● 2Source: SNL Financial 40.1 43.3 44.4 2011 2012 2013 Loan Growth(Average $ in billions) +11% 3.3% 3.0% 2.2% 2.2% 1.7% 1.4% 1.3% 1.1% 0.7% -0.1 % -1.2 % -1.2 % BOK F C
Slide 11: Continued Strong Credit Quality and Shareholder Return
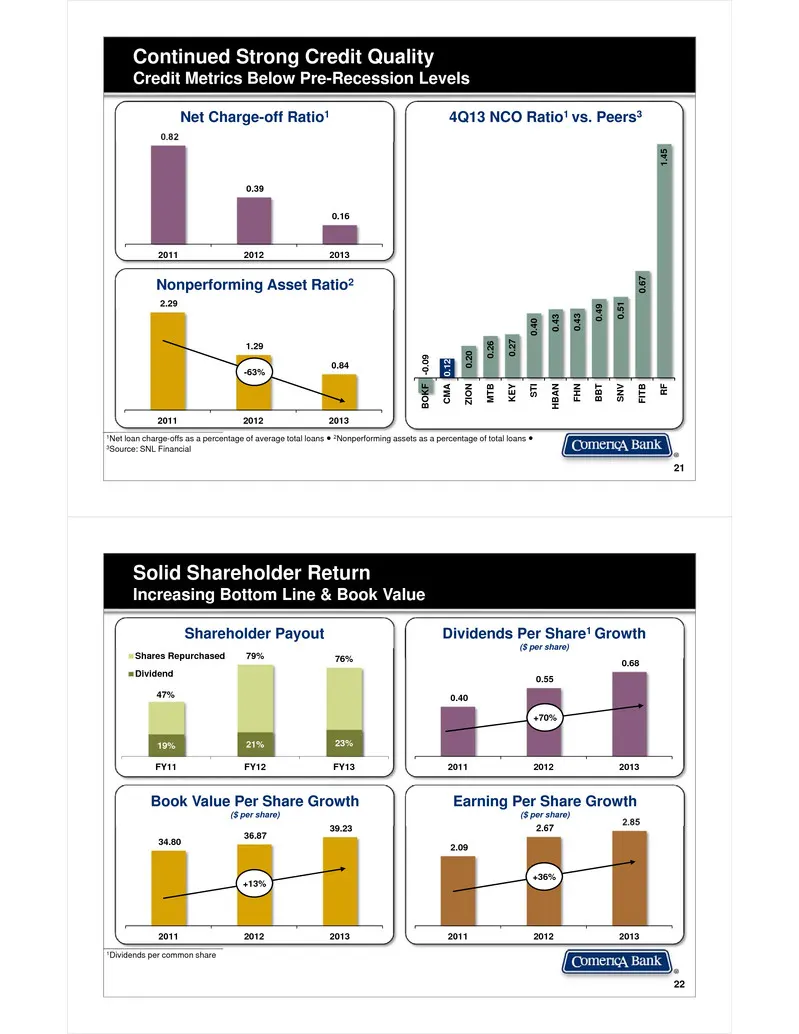
21 Continued Strong Credit QualityCredit Metrics Below Pre-Recession Levels 1Net loan charge-offs as a percentage of average total loans ● 2Nonperforming assets as a percentage of total loans ●3Source: SNL Financial 0.82 0.39 0.16 2011 2012 2013 Net Charge-off Ratio1 -0.0 9 0.12 0. 20 0.2 6 0.27 0.4
Slide 12: Appendix Financial Summary
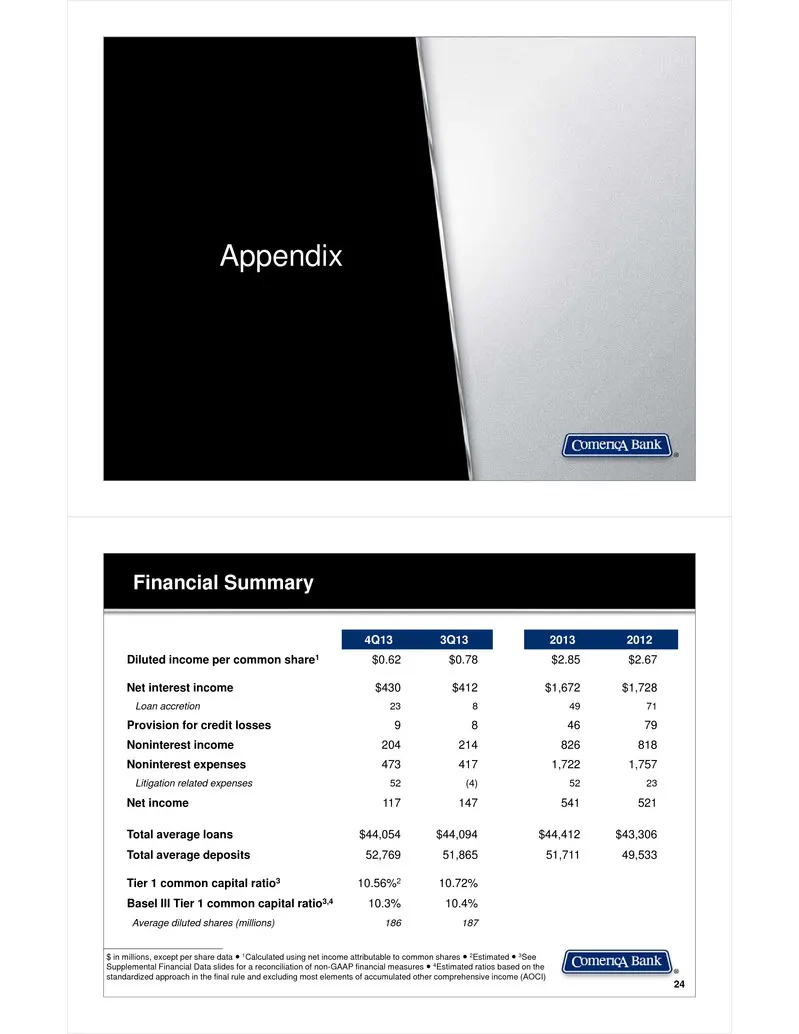
Appendix 24 Financial Summary $ in millions, except per share data ● 1Calculated using net income attributable to common shares ● 2Estimated ● 3See Supplemental Financial Data slides for a reconciliation of non-GAAP financial measures ● 4Estimated ratios based on the standardized approach in the fin
Slide 13: Full-Year 2013 Results
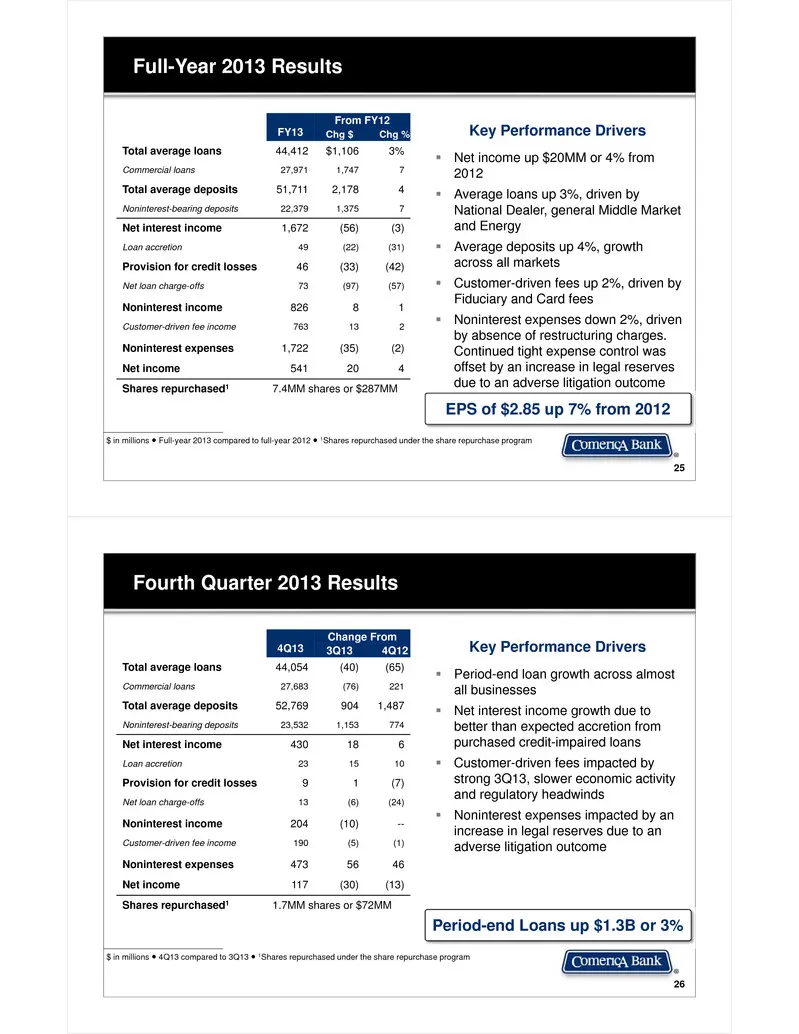
25 Full-Year 2013 Results $ in millions ● Full-year 2013 compared to full-year 2012 ● 1Shares repurchased under the share repurchase program Net income up $20MM or 4% from 2012 Average loans up 3%, driven by National Dealer, general Middle Market and Energy Average deposits up 4%, growth acros
Slide 14: Loans by Business and Market
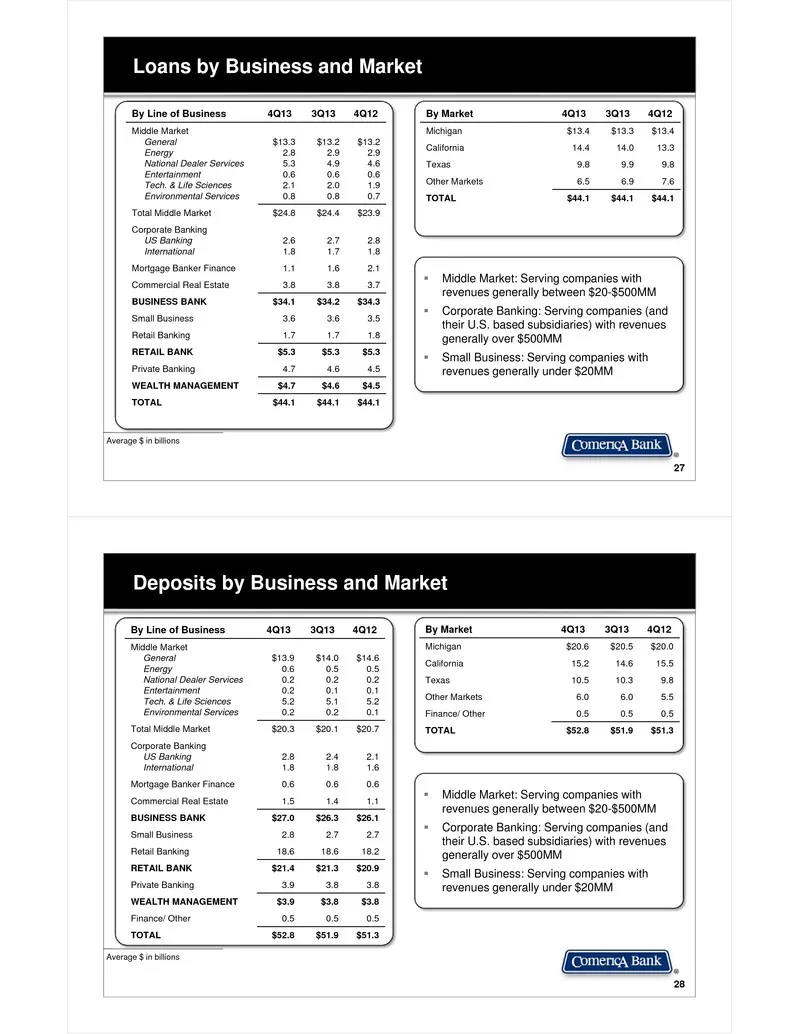
27 Loans by Business and Market Average $ in billions Middle Market: Serving companies with revenues generally between $20-$500MM Corporate Banking: Serving companies (and their U.S. based subsidiaries) with revenues generally over $500MM Small Business: Serving companies with revenues general
Slide 15: General Middle Market
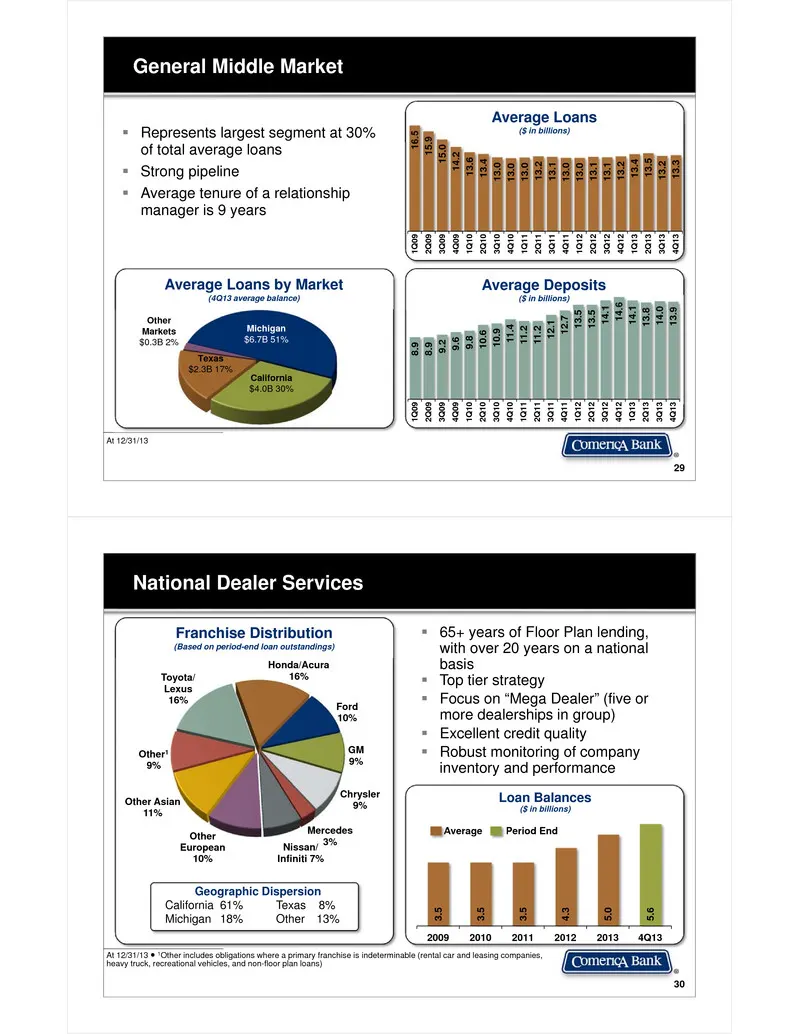
29 General Middle Market At 12/31/13 Represents largest segment at 30% of total average loans Strong pipeline Average tenure of a relationship manager is 9 years 8.9 8.9 9.2 9.6 9.8 10 .6 10.9 11. 4 11.2 11.2 12 .1 12.7 13 .5 13.5 14. 1 14.6 14.1 13.8 14.0 13.9 1Q0 9 2Q0 9 3Q0 9 4Q0 9 1Q1 0 2Q
Slide 16: Mortgage Banker Finance and Energy
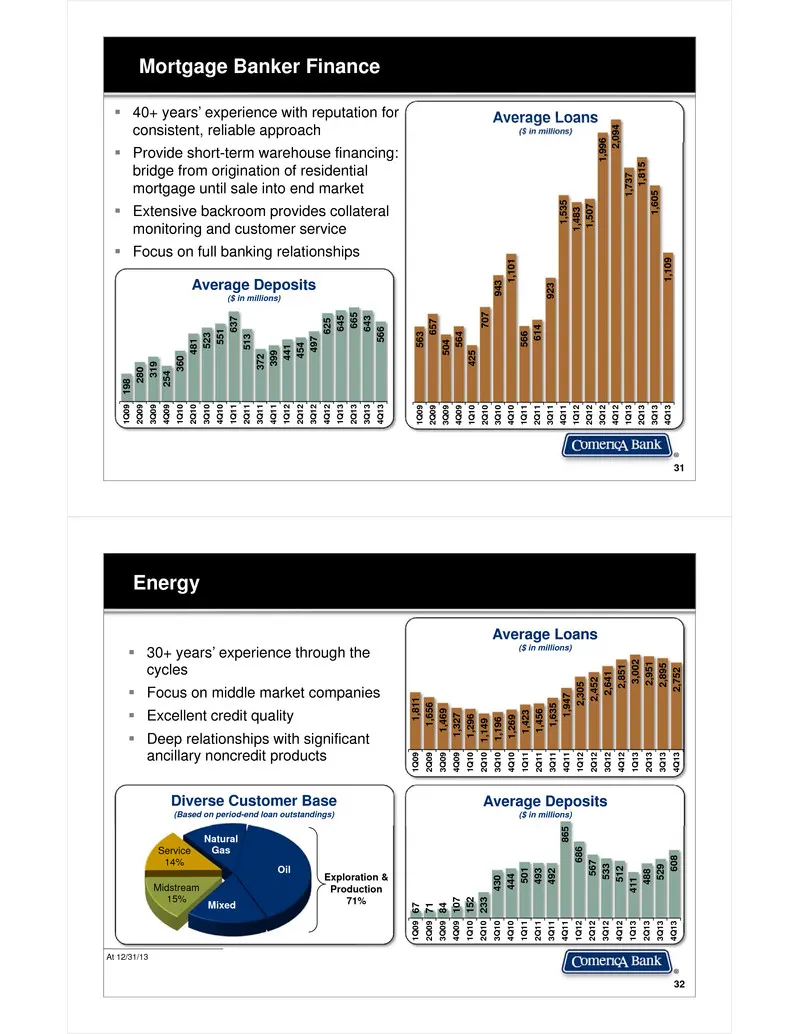
Mortgage Banker Finance 31 Average Deposits($ in millions) Average Loans($ in millions) 40+ years’ experience with reputation for consistent, reliable approach Provide short-term warehouse financing: bridge from origination of residential mortgage until sale into end market Extensive backroom p
Slide 17: Technology and Life Sciences
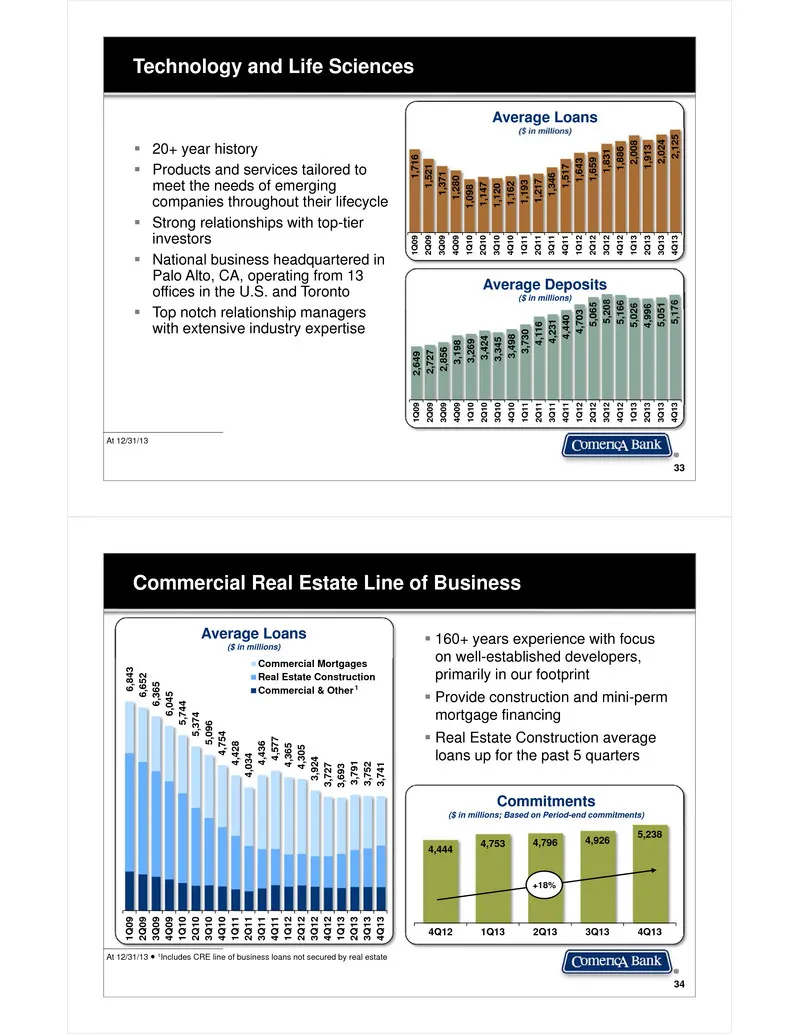
33 Technology and Life Sciences At 12/31/13 20+ year history Products and services tailored to meet the needs of emerging companies throughout their lifecycle Strong relationships with top-tier investors National business headquartered in Palo Alto, CA, operating from 13 offices in the U.S.
Slide 18: Shared National Credit Relationships
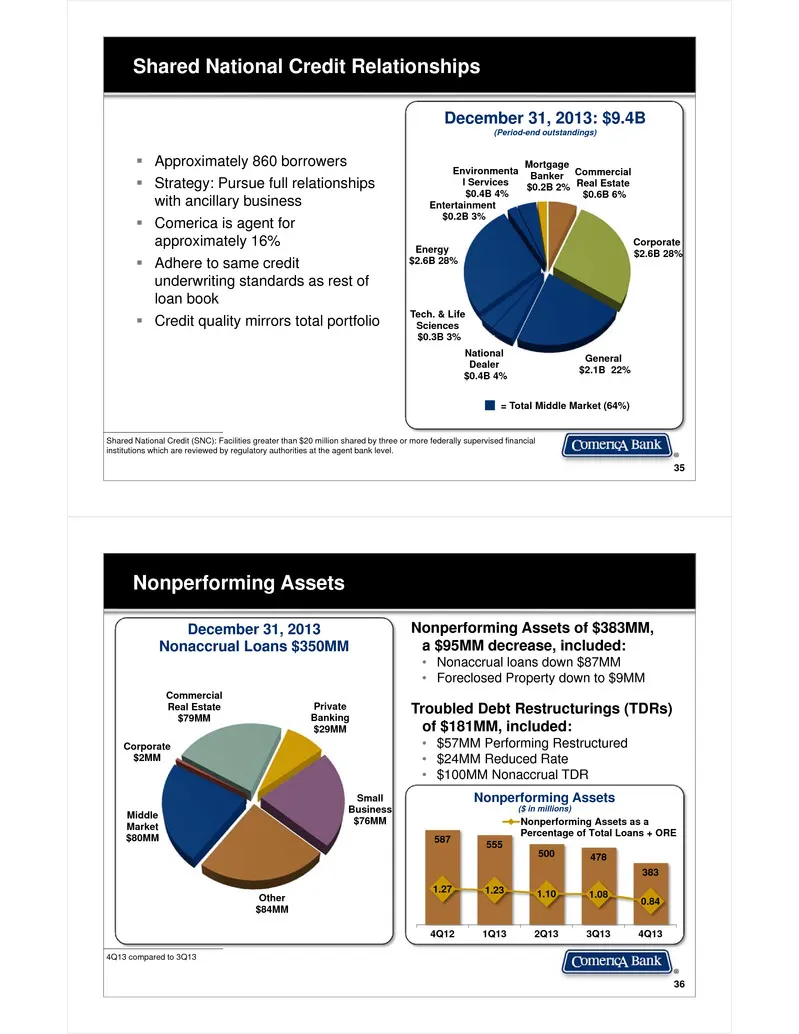
35 Shared National Credit Relationships Shared National Credit (SNC): Facilities greater than $20 million shared by three or more federally supervised financial institutions which are reviewed by regulatory authorities at the agent bank level. December 31, 2013: $9.4B(Period-end outstandings) Commer
Slide 19: Government Card Programs
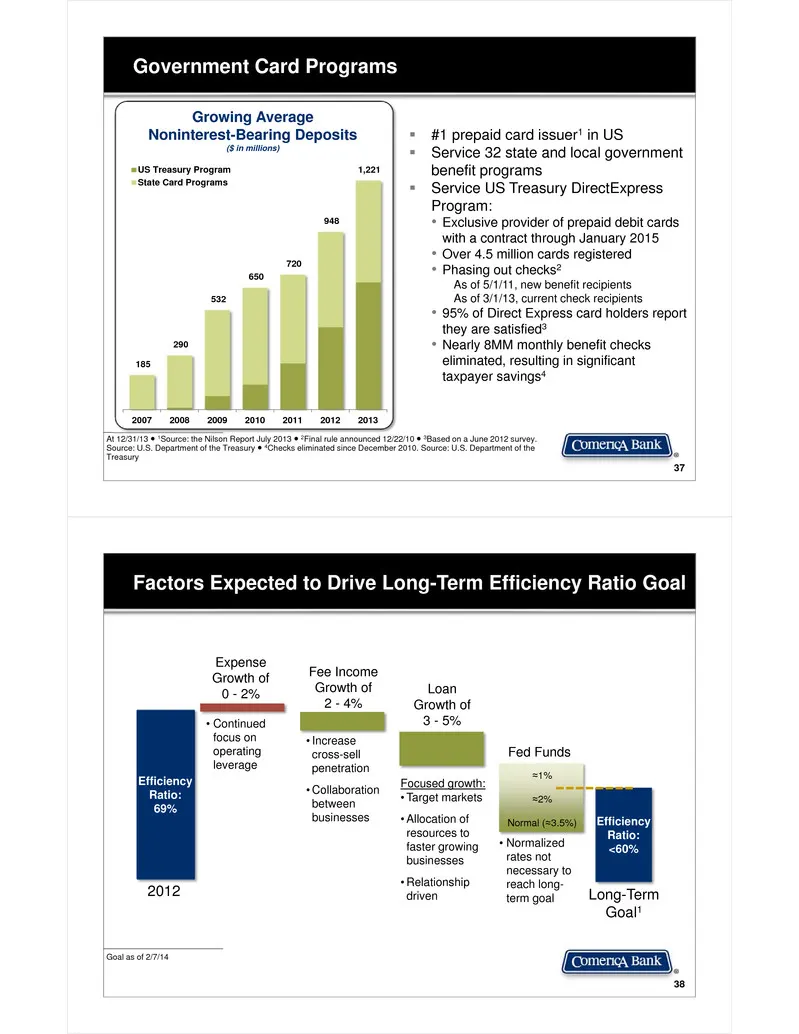
37 Government Card Programs At 12/31/13 ● 1Source: the Nilson Report July 2013 ● 2Final rule announced 12/22/10 ● 3Based on a June 2012 survey. Source: U.S. Department of the Treasury ● 4Checks eliminated since December 2010. Source: U.S. Department of the Treasury Growing Average Noninterest-Bearin
Slide 20: Holding Company Debt Rating
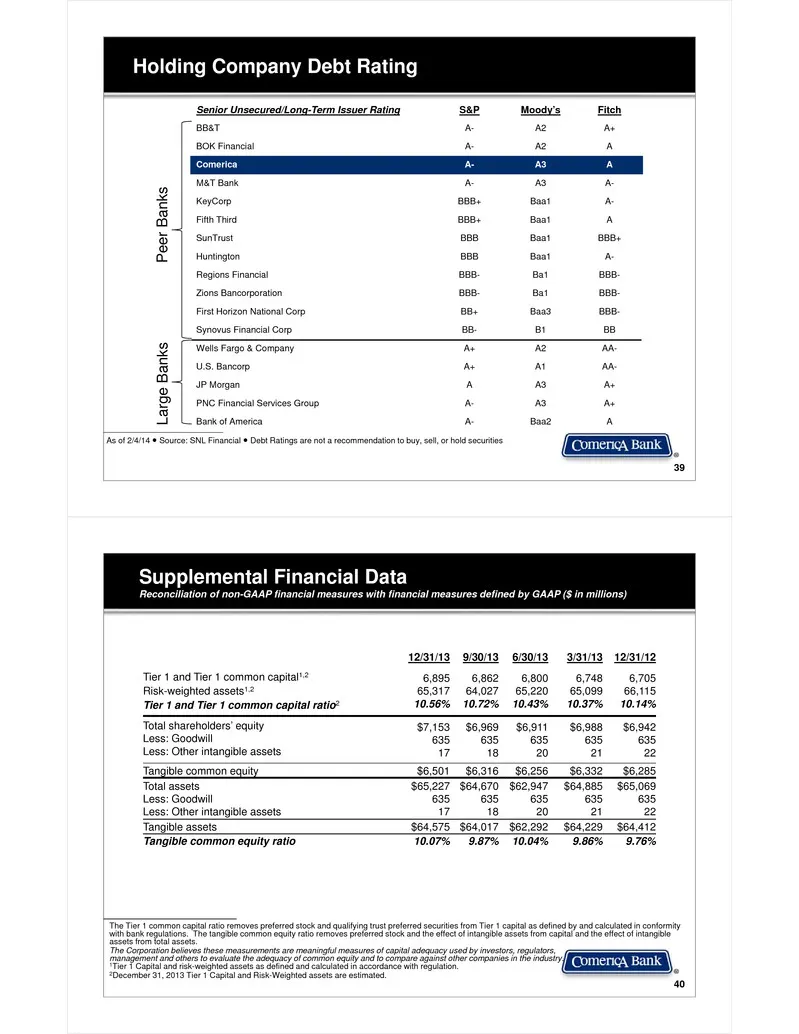
39 Holding Company Debt Rating As of 2/4/14 ● Source: SNL Financial ● Debt Ratings are not a recommendation to buy, sell, or hold securities Senior Unsecured/Long-Term Issuer Rating S&P Moody’s Fitch BB&T A- A2 A+ BOK Financial A- A2 A Comerica A- A3 A M&T Bank A- A3 A- KeyCorp BBB+ Baa1 A- Fifth Th
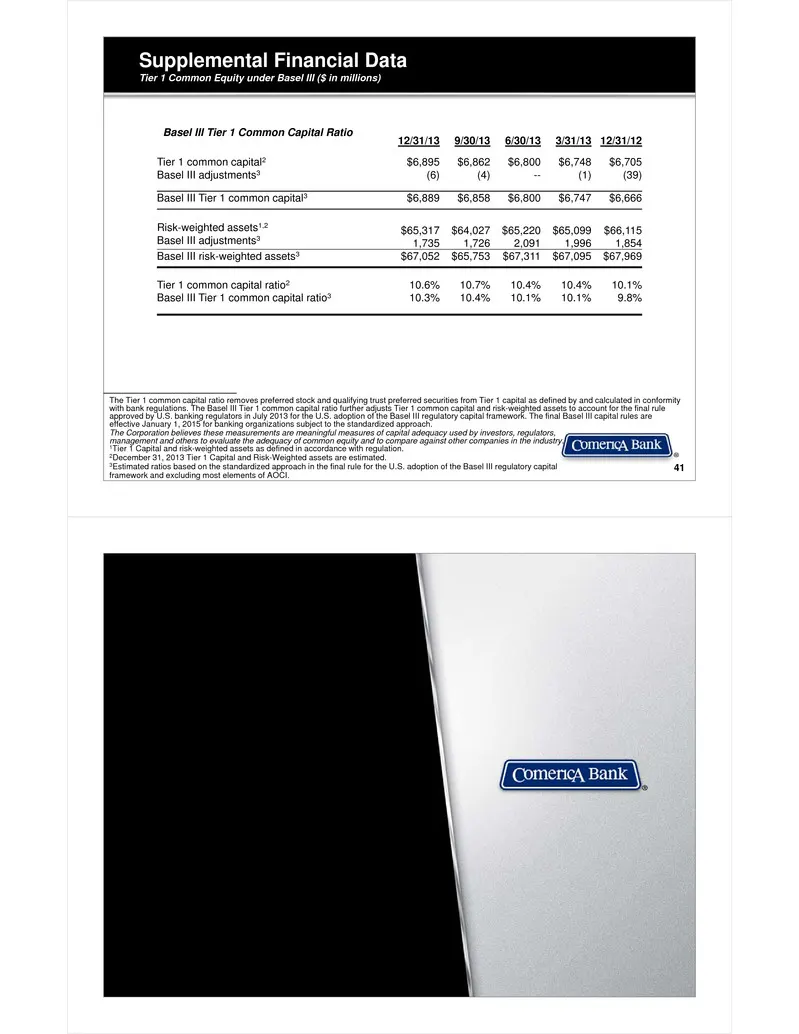
Slide 21: Supplemental Financial Data: Tier 1 Common Equity under Basel III
Supplemental Financial DataTier 1 Common Equity under Basel III ($ in millions) 41 The Tier 1 common capital ratio removes preferred stock and qualifying trust preferred securities from Tier 1 capital as defined by and calculated in conformity with bank regulations. The Basel III Tier 1 common capit
Source: SEC EDGAR · 8-K filed Feb 7, 2014
More decks from Comerica Incorporated
 Goldman Sachs Financial Services Conference 202520 slides · Dec 11, 2025
 Merger or Acquisition (October 2025)18 slides · Oct 6, 2025
 Barclays Global Financial Services Conference 202524 slides · Sep 8, 2025
 Q2 2025 Earnings Presentation24 slides · Jul 18, 2025
 Q1 2025 Earnings Presentation21 slides · Apr 21, 2025
 Q4 2024 Earnings Presentation24 slides · Jan 22, 2025