U.S. Concrete — Southwest IDEAS Investor Conference 2014
27 slides from U.S. Concrete's conference presentation, Nov 20, 2014
Slide 1: Investor Presentation
Investor Presentation Three Part Advisors, LLC Southwest IDEAS Investor Conference Dallas, TX November 20, 2014
Slide 2: Forward-Looking Statements
Forward-Looking Statements Certain statements and information provided in this presentation are “forward-looking statements” within the meaning of the Private Securities Litigation Reform Act of 1995. These forward-looking statements include, without limitation, statements concerning plans, objectiv
Slide 3: Company Overview
US CONCRETE Company Overview
Slide 4: U.S. Concrete Overview
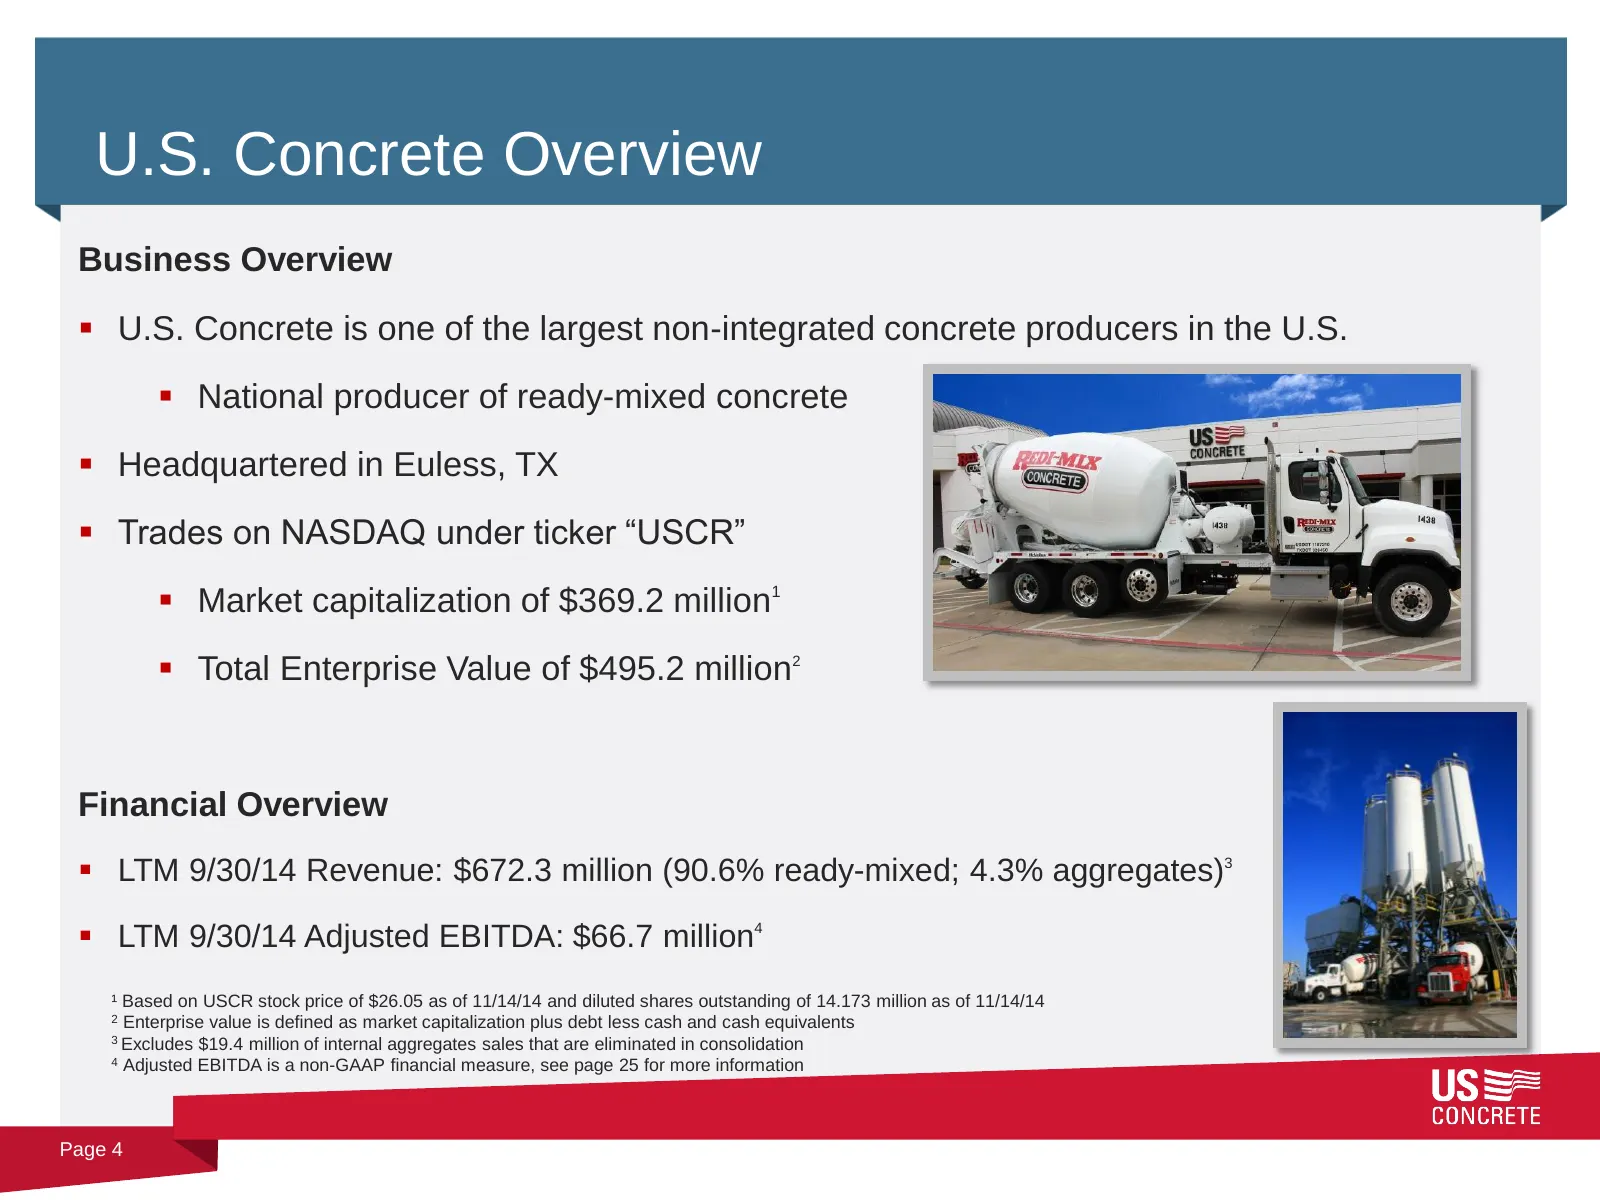
U.S. Concrete Overview Business Overview U.S. Concrete is one of the largest non-integrated concrete producers in the U.S. National producer of ready-mixed concrete Headquartered in Euless, TX Trades on NASDAQ under ticker “USCR” Market capitalization of $369.2 million1 Total Enterprise
Slide 5: Strong Positions in Attractive Markets
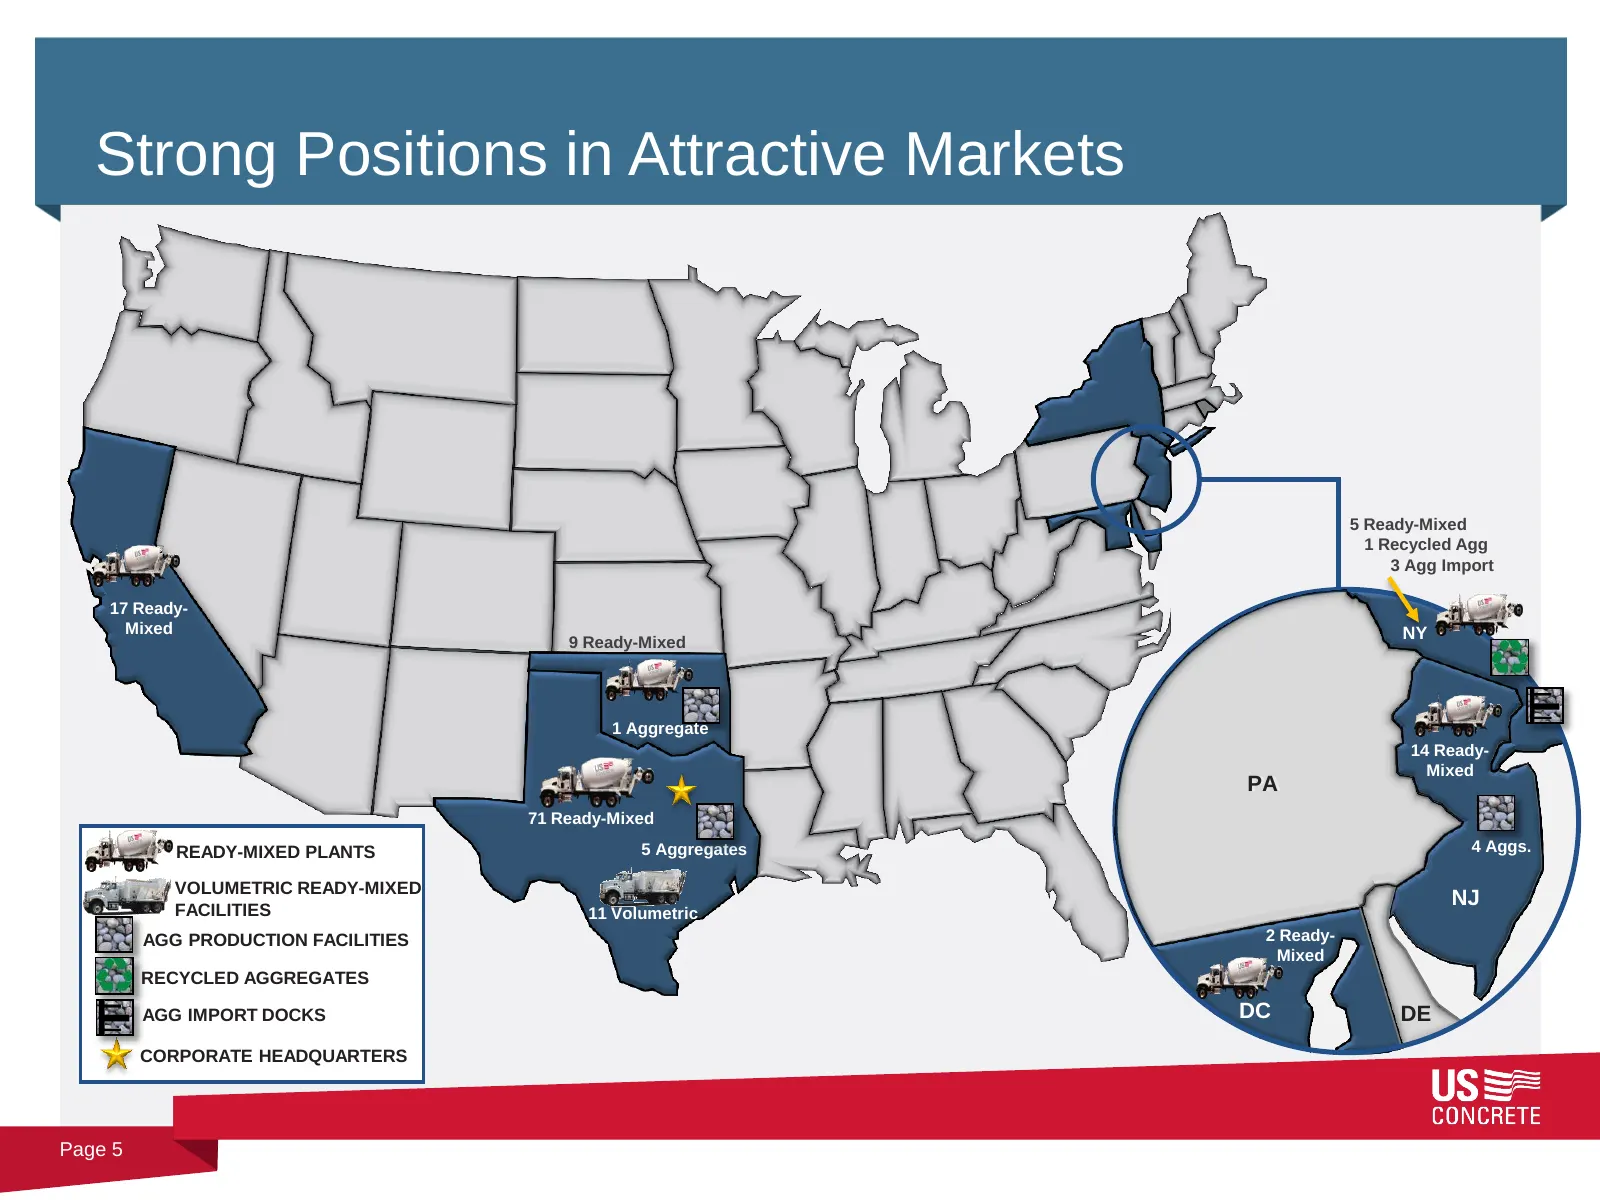
Strong Positions in Attractive Markets 5 Ready-Mixed 1 Recycled Agg 3 Agg Import 17 Ready- Mixed NY 9 Ready-Mixed 1 Aggregate 14 Ready- Mixed PA PA 71 Ready-Mixed READY-MIXED PLANTS 5 Aggregates 4 Aggs. VOLUMETRIC READY-MIXED FACILITIES NJ 11 Volumetric AGG PRODUCTION FACILITIES 2 Ready- Mixed RECYC
Slide 6: Growth Driven by Key Sectors
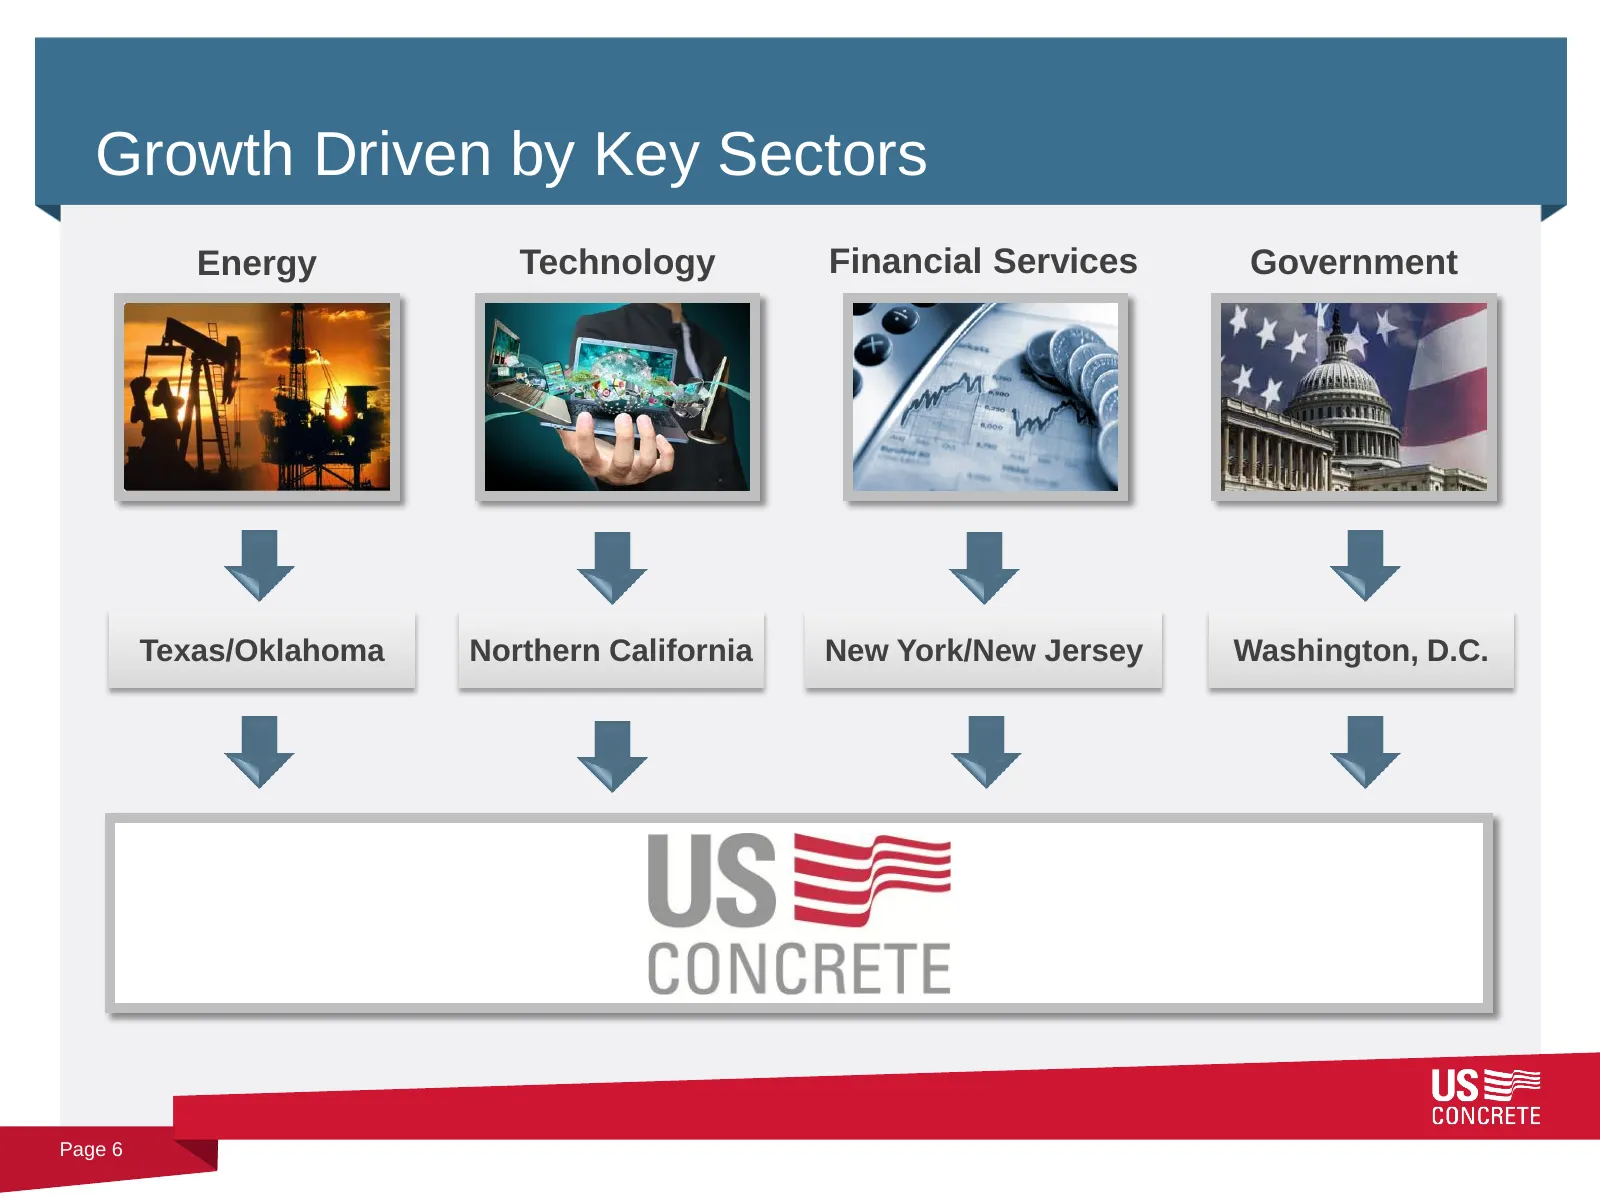
Growth Driven by Key Sectors Energy Technology Financial Services Government Texas/Oklahoma Northern California New York/New Jersey Washington, D.C. Page 6
Slide 7: Significant Quality Asset Base
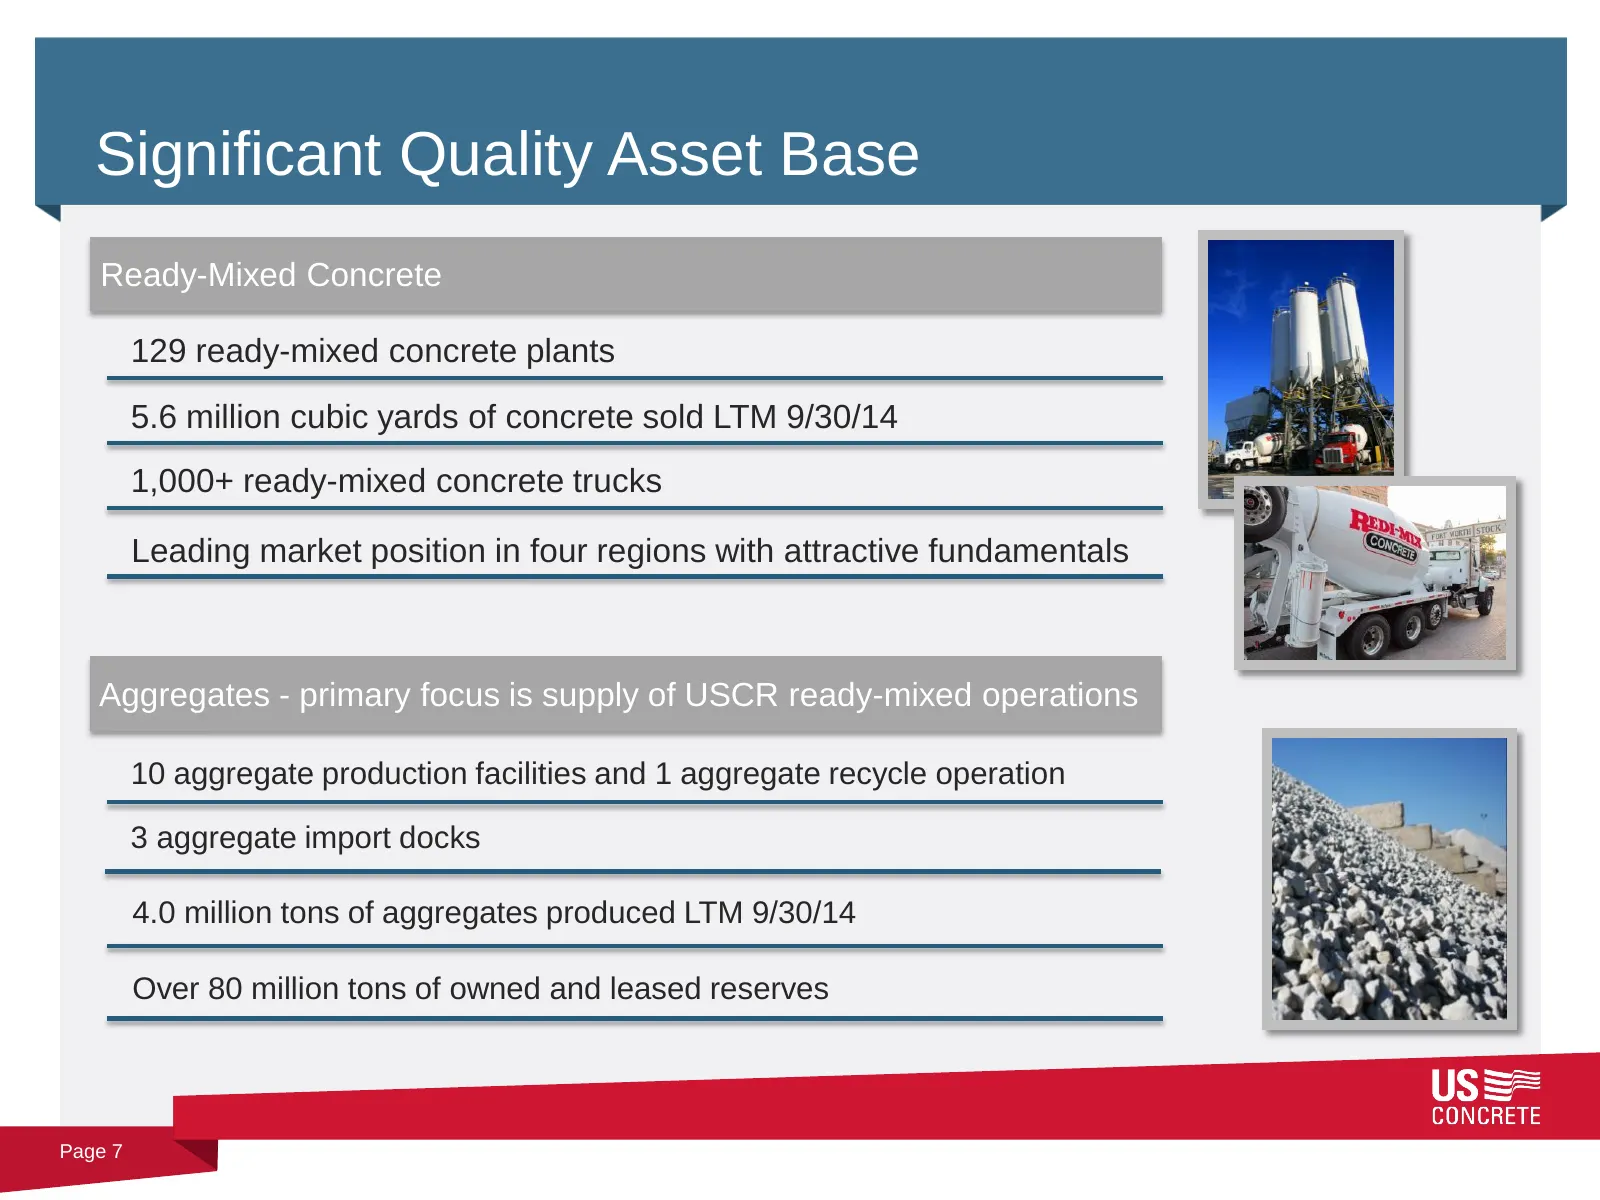
Significant Quality Asset Base Ready-Mixed Concrete 129 ready-mixed concrete plants 5.6 million cubic yards of concrete sold LTM 9/30/14 1,000+ ready-mixed concrete trucks Leading market position in four regions with attractive fundamentals Aggregates - primary focus is supply of USCR ready-mixed op
Slide 8: Strong Historical Performance Trend
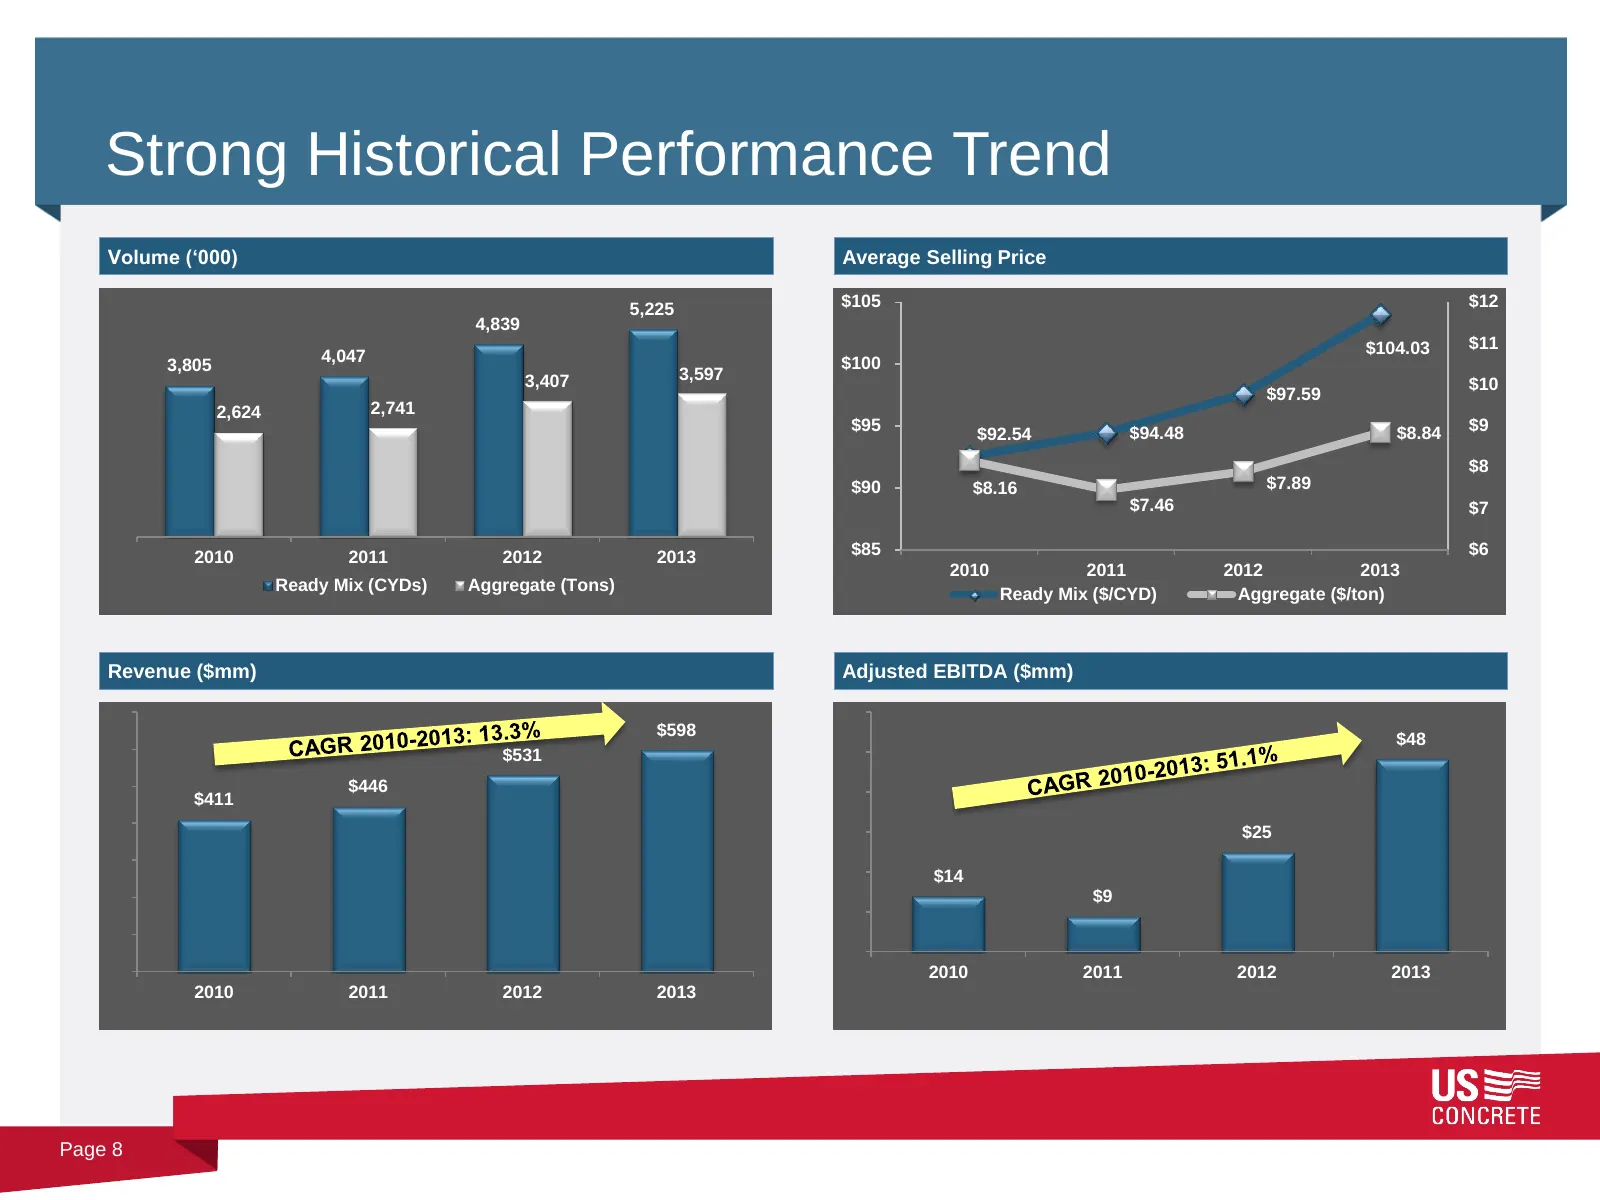
Strong Historical Performance Trend Volume („000) Average Selling Price 5,225 $105 $12 4,839 $104.03 $11 4,047 $100 3,805 3,597 3,407 $10 $97.59 2,624 2,741 $95 $94.48 $8.84 $9 $92.54 $8 $90 $8.16 $7.89 $7.46 $7 2010 2011 2012 2013 $85 $6 2010 2011 2012 2013 Ready Mix (CYDs) Aggregate (Tons) Ready M
Slide 9: Improved Year-over-Year Performance
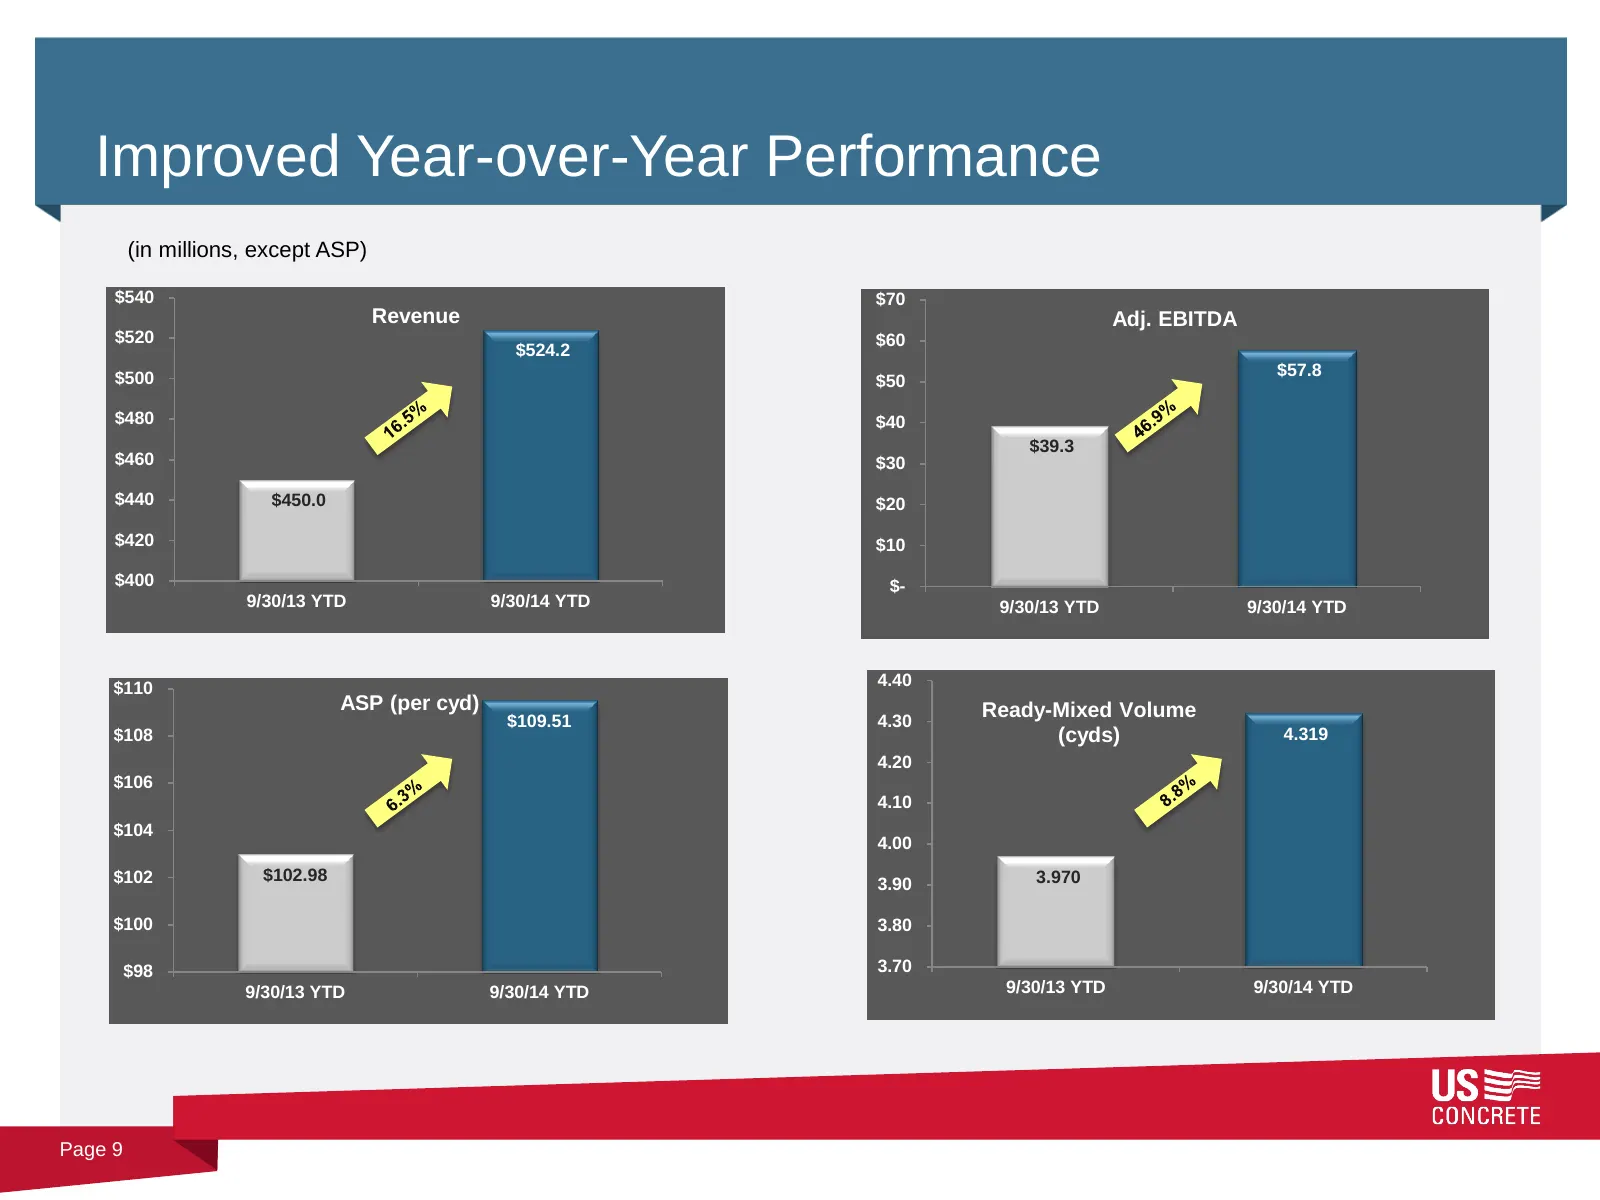
Improved Year-over-Year Performance (in millions, except ASP) $540 $70 Revenue Adj. EBITDA $520 $60 $524.2 $500 $57.8 $50 $480 $40 $39.3 $460 $30 $440 $450.0 $20 $420 $10 $400 $- 9/30/13 YTD 9/30/14 YTD 9/30/13 YTD 9/30/14 YTD $110 4.40 ASP (per cyd) Ready-Mixed Volume $109.51 4.30 $108 (cyds) 4.319
Slide 10: Ready-Mixed Top Line Drivers
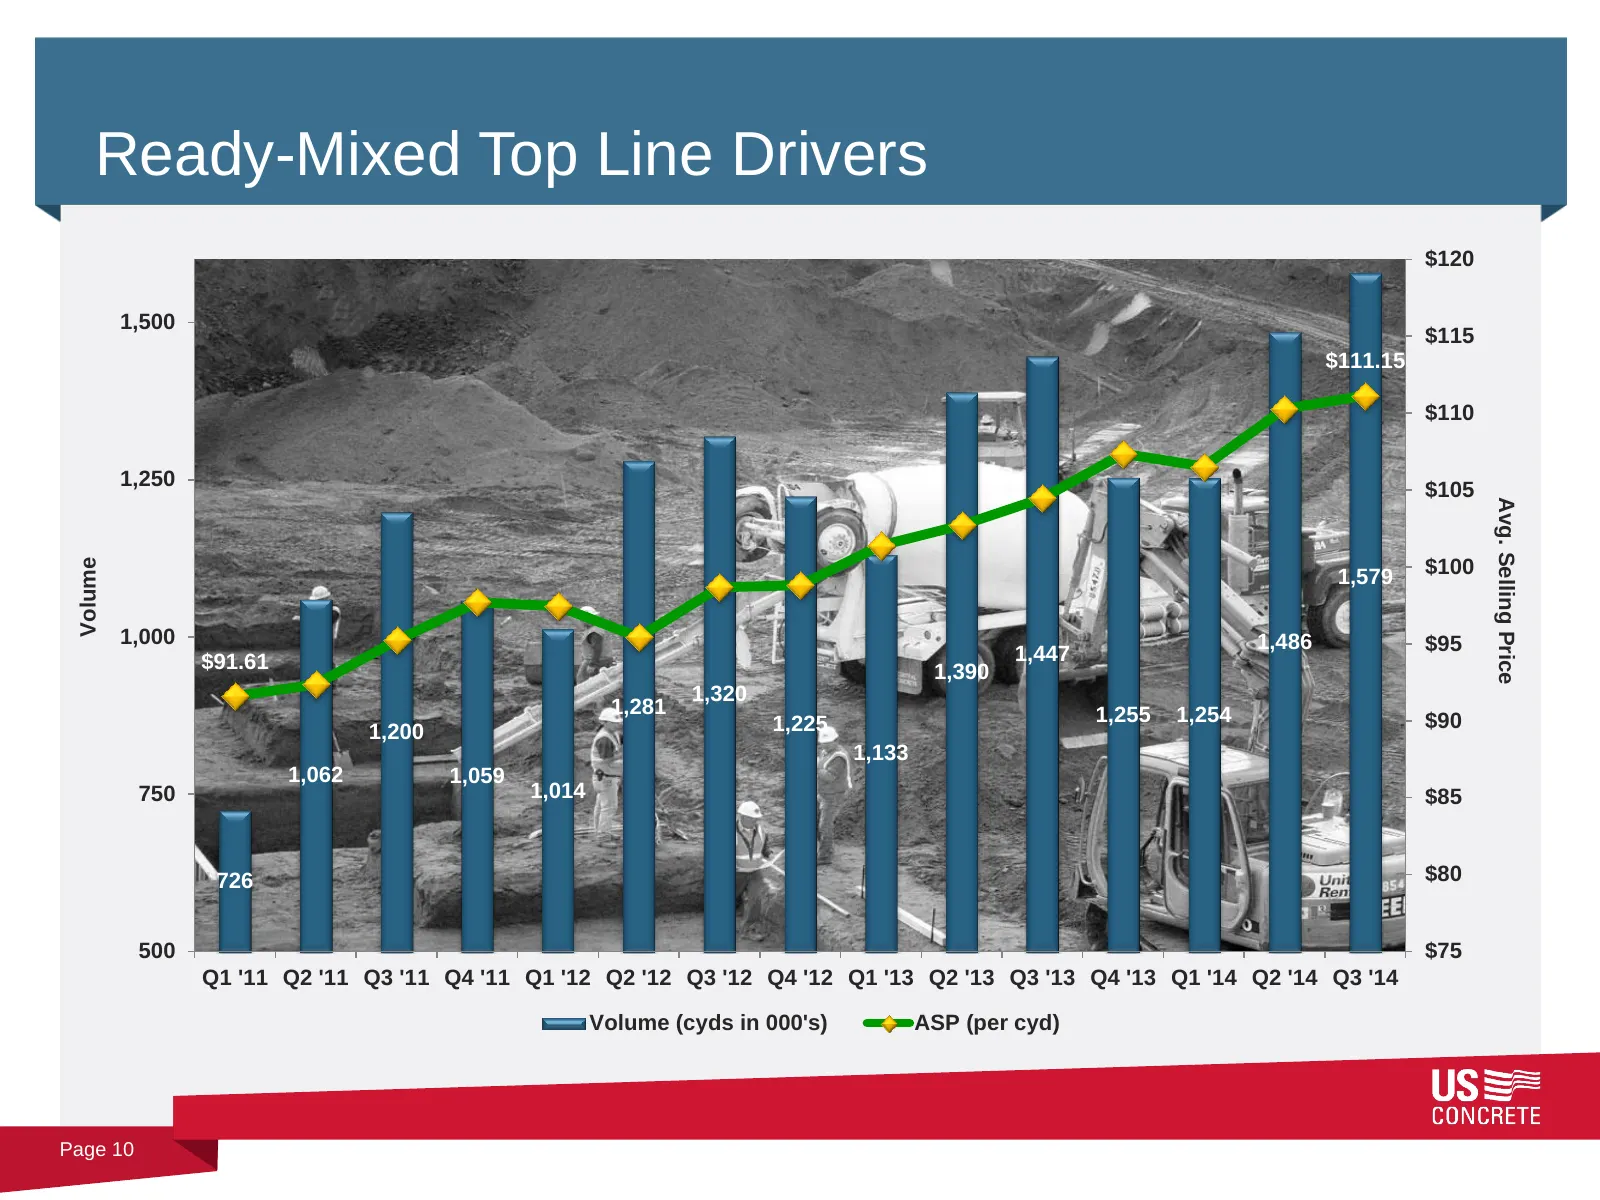
Ready-Mixed Top Line Drivers $120 1,500 $115 $111.15 $110 1,250 $105 Avg. Selling Price Volume 1,579 $100 1,000 1,486 $95 $91.61 1,447 1,390 1,320 1,281 1,255 1,254 1,225 $90 1,200 1,133 1,062 1,059 750 1,014 $85 726 $80 500 $75 Q1 '11 Q2 '11 Q3 '11 Q4 '11 Q1 '12 Q2 '12 Q3 '12 Q4 '12 Q1 '13 Q2 '13 Q
Slide 11: Solid Capital Structure
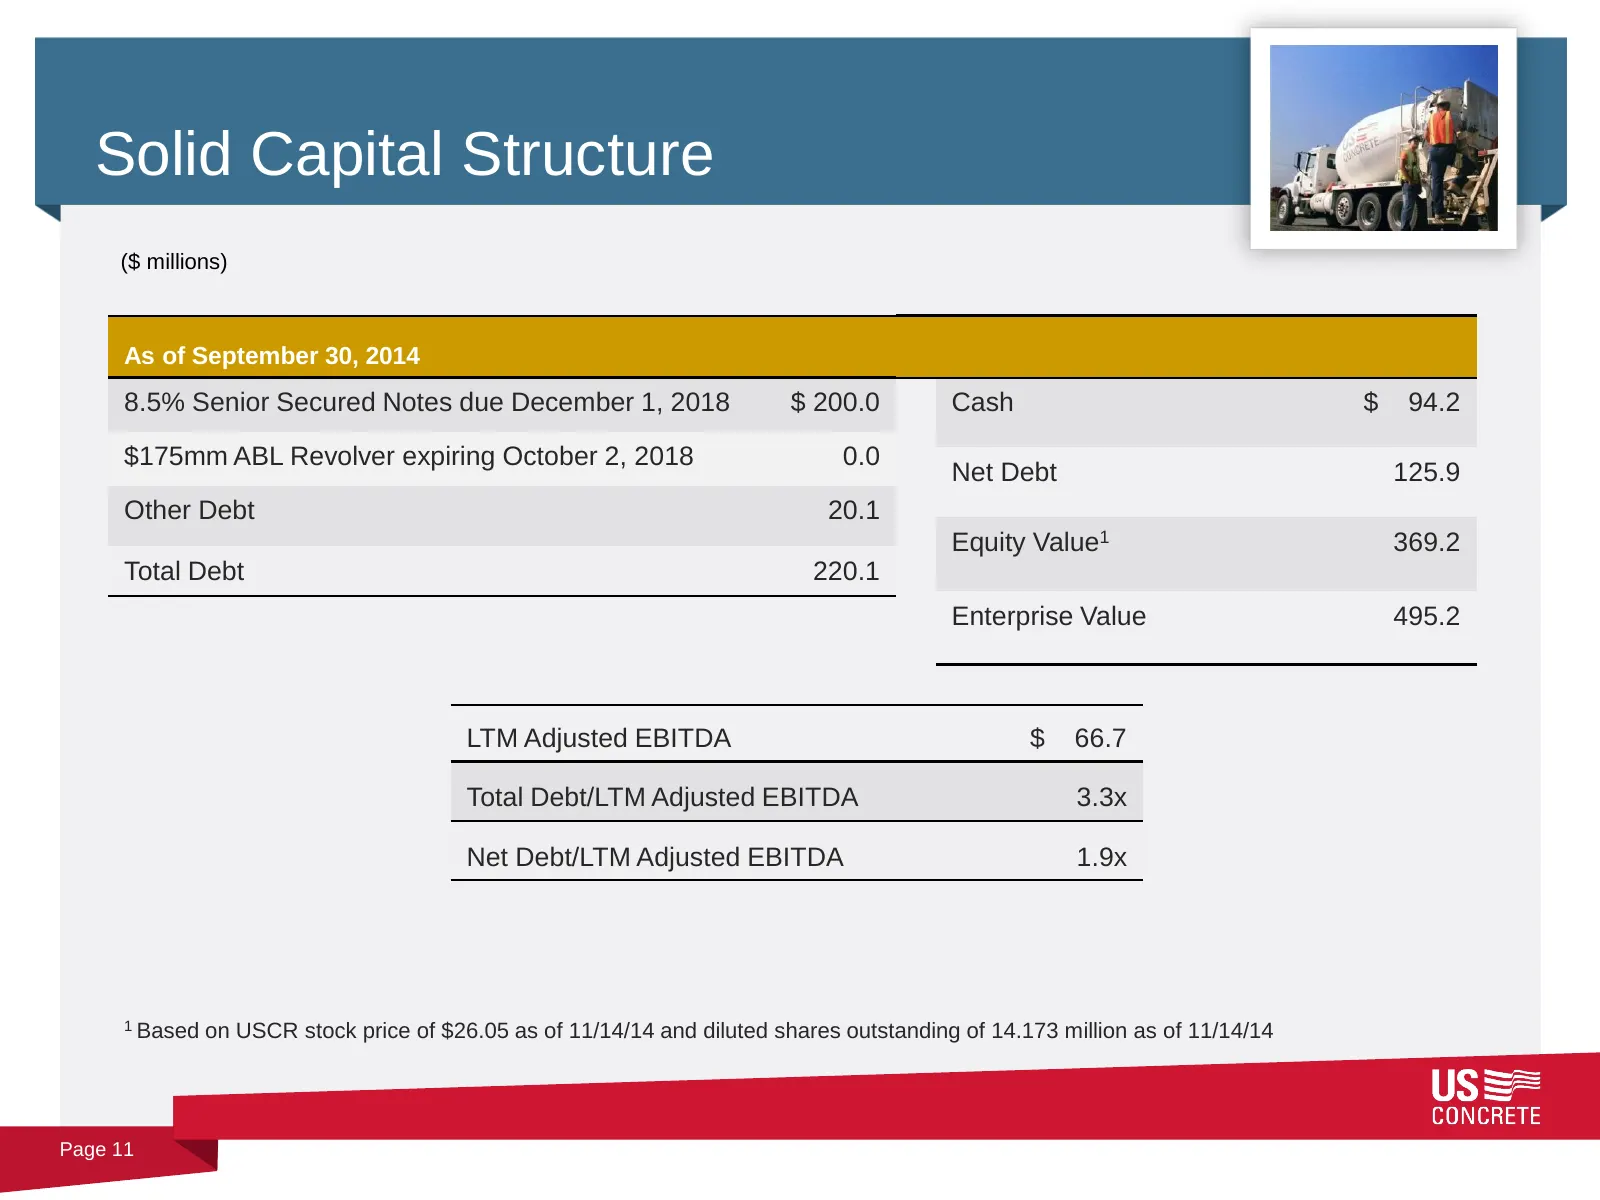
Solid Capital Structure ($ millions) As of September 30, 2014 8.5% Senior Secured Notes due December 1, 2018 $ 200.0 Cash $ 94.2 $175mm ABL Revolver expiring October 2, 2018 0.0 Net Debt 125.9 Other Debt 20.1 Equity Value1 369.2 Total Debt 220.1 Enterprise Value 495.2 LTM Adjusted EBITDA $ 66.7 Tota
Slide 12: Historical Stock Price
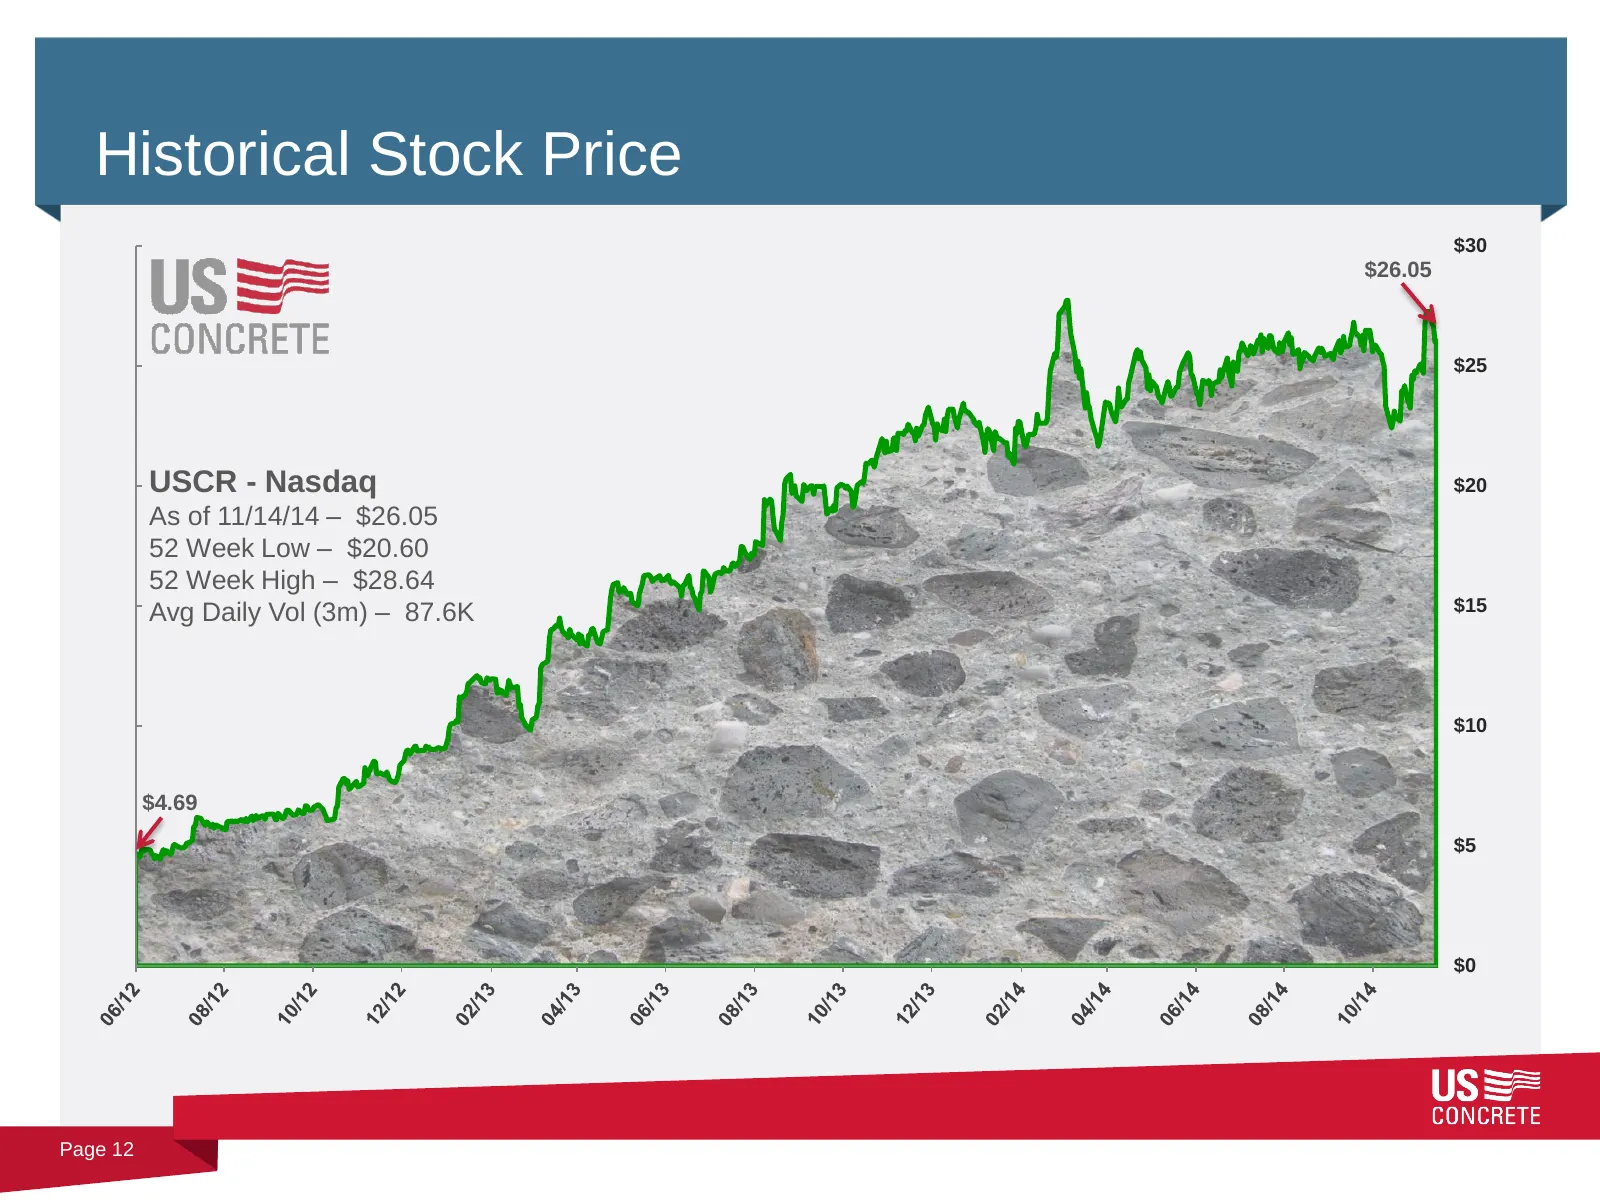
Historical Stock Price $30 $26.05 $25 USCR - Nasdaq $20 As of 11/14/14 – $26.05 52 Week Low – $20.60 52 Week High – $28.64 Avg Daily Vol (3m) – 87.6K $15 $10 $4.69 $5 $0 Page 12
Slide 13: Industry Overview
US CONCRETE Industry Overview
Slide 14: Large, Fragmented Market
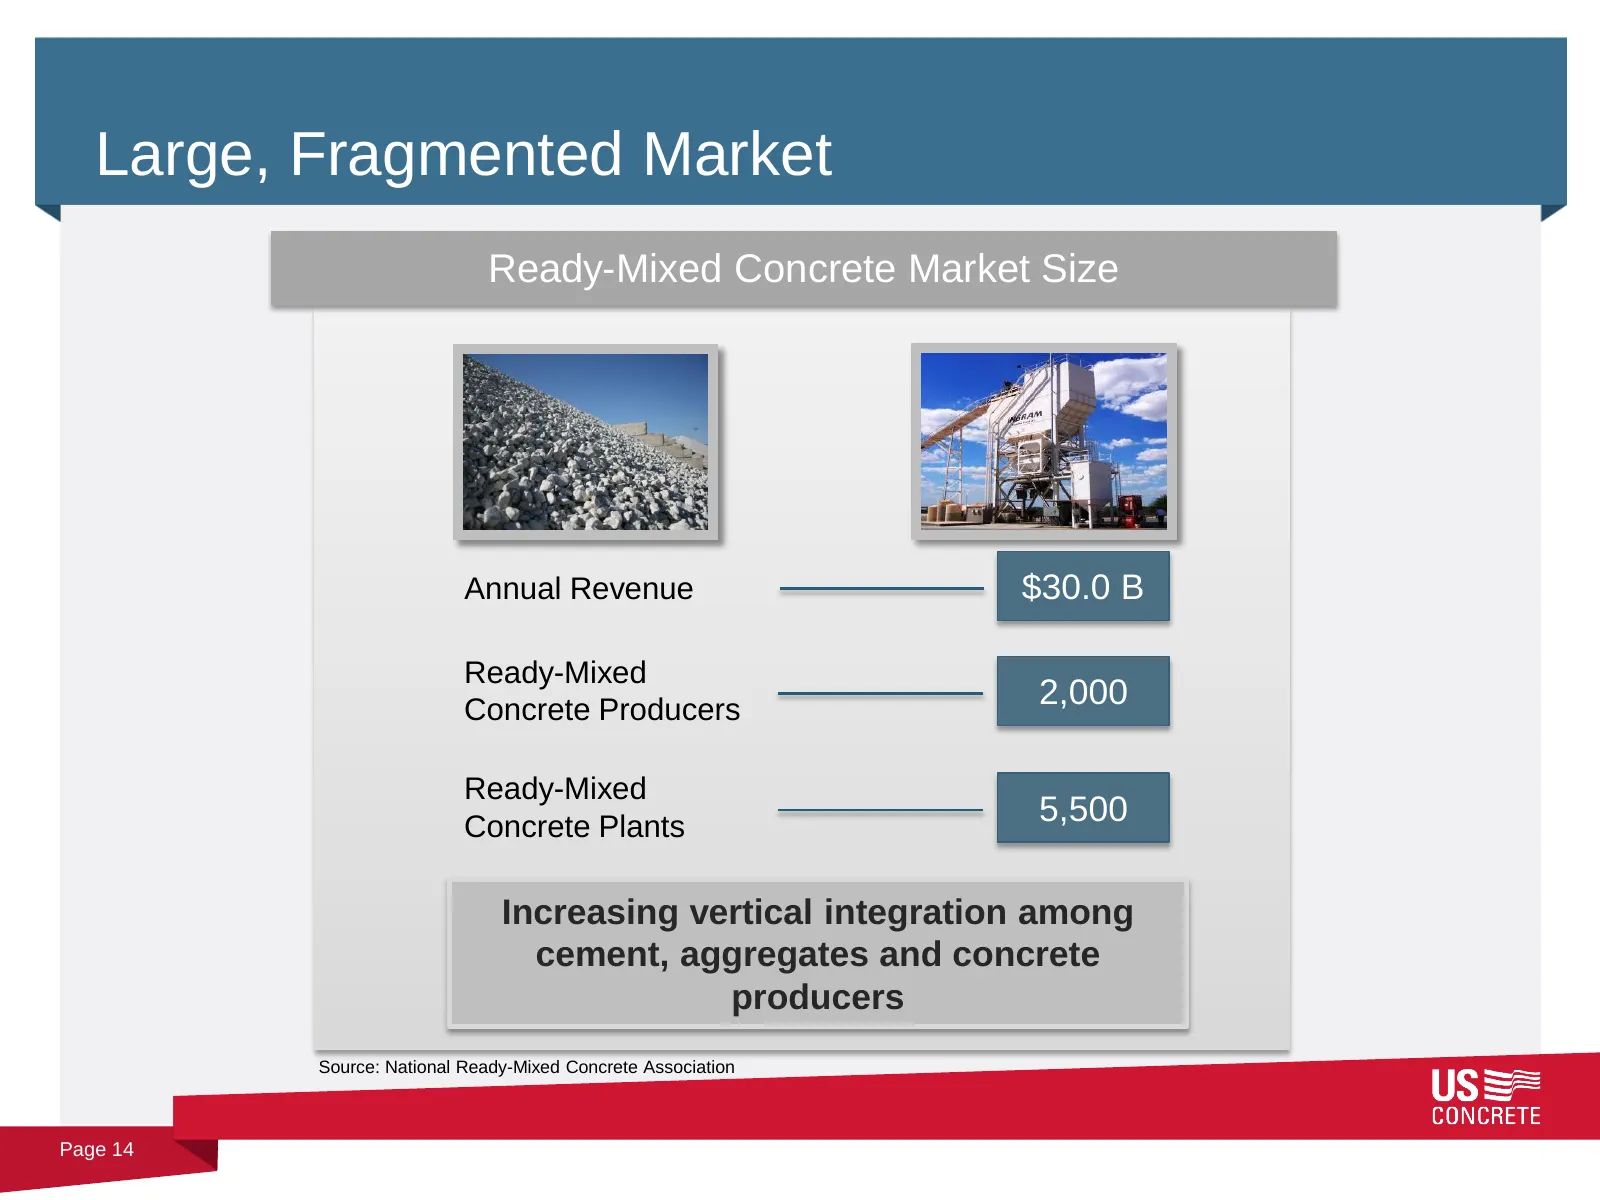
Large, Fragmented Market Ready-Mixed Concrete Market Size Annual Revenue $30.0 B Ready-Mixed Concrete Producers 2,000 Ready-Mixed Concrete Plants 5,500 Increasing vertical integration among cement, aggregates and concrete producers Source: National Ready-Mixed Concrete Association Page 14
Slide 15: Focused on Key End Use Markets
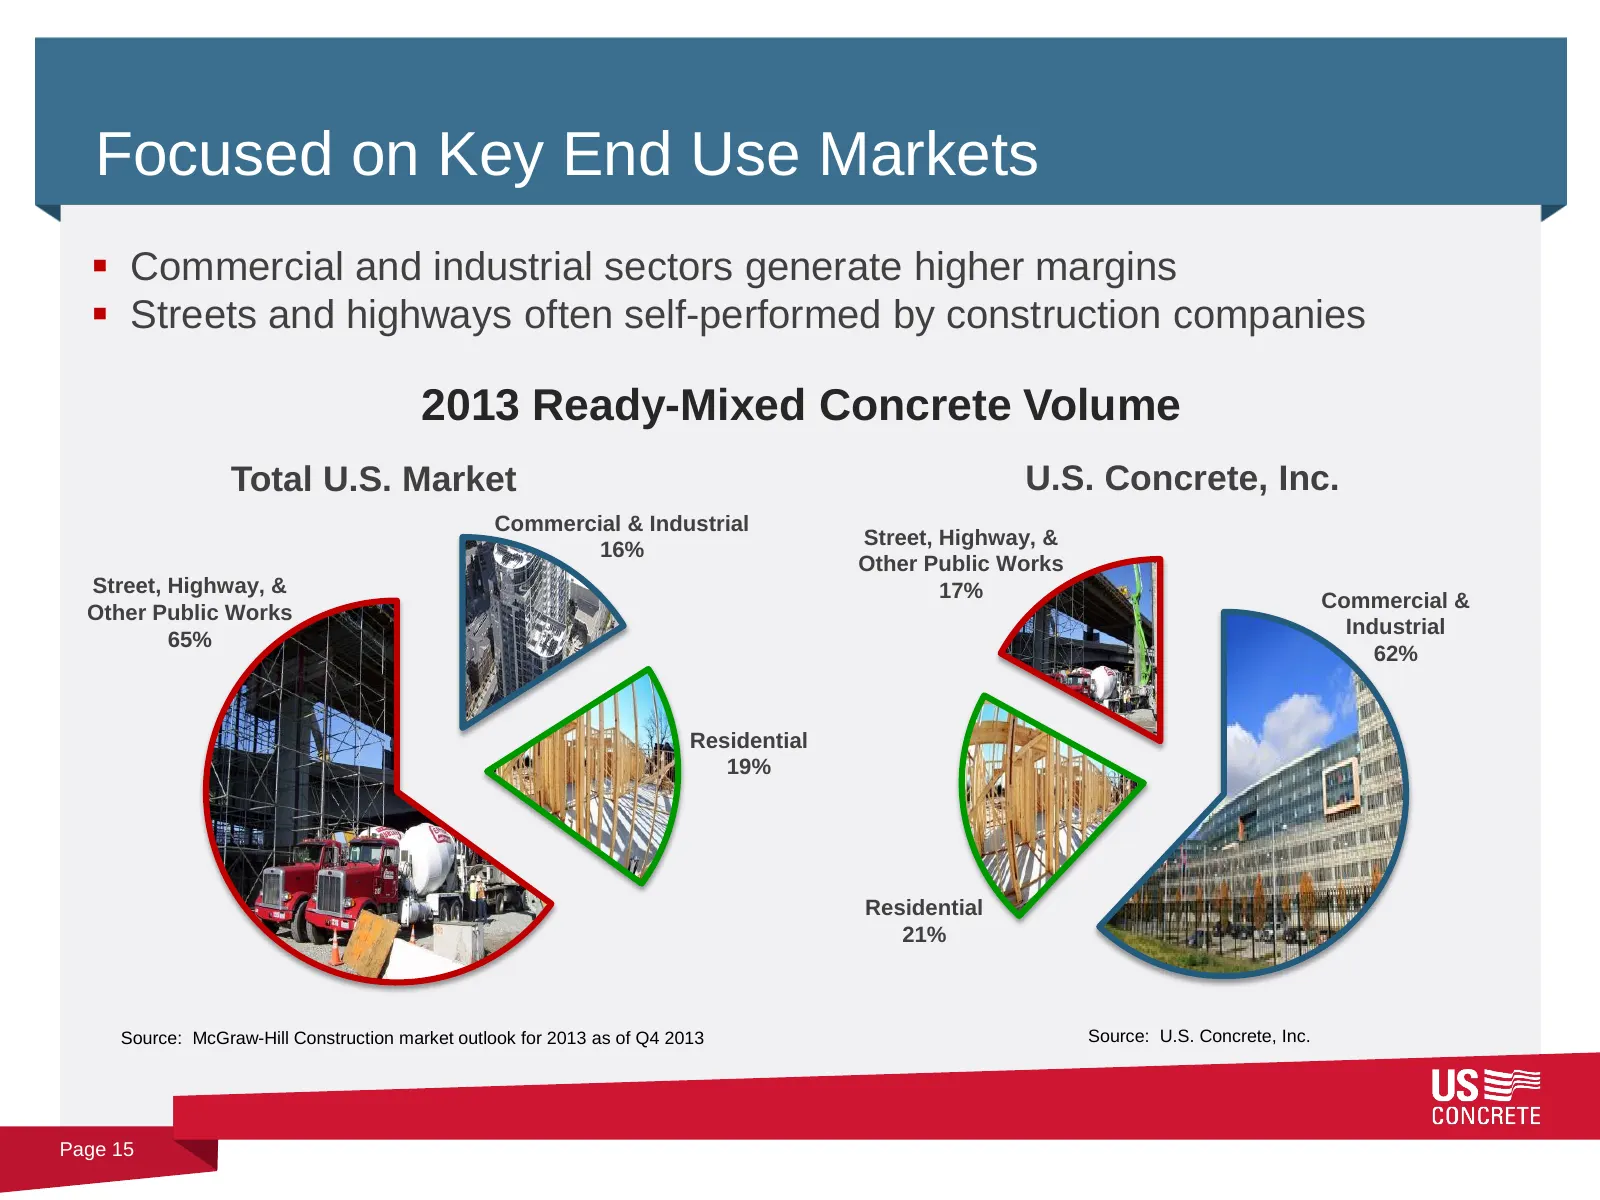
Focused on Key End Use Markets Commercial and industrial sectors generate higher margins Streets and highways often self-performed by construction companies 2013 Ready-Mixed Concrete Volume Total U.S. Market U.S. Concrete, Inc. Commercial & Industrial Street, Highway, & 16% Other Public Works St
Slide 16: Evidence of Strength in our Regional Markets
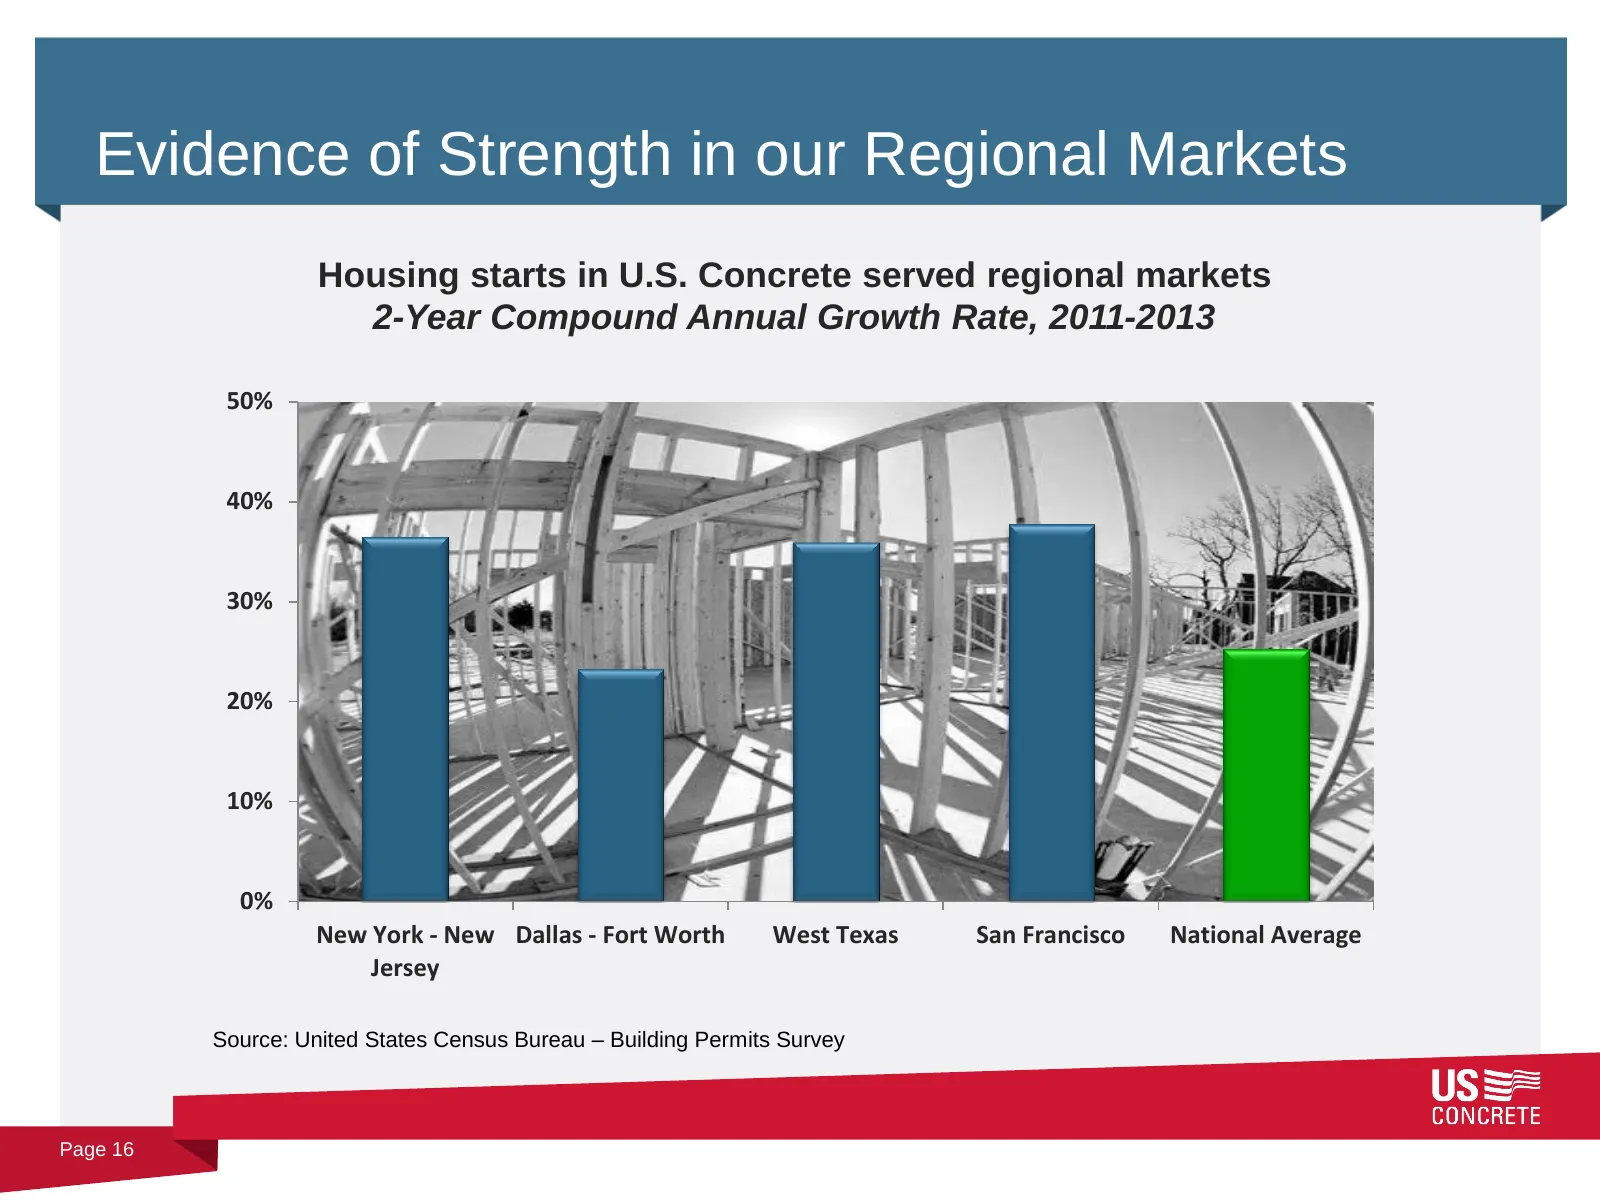
Evidence of Strength in our Regional Markets Housing starts in U.S. Concrete served regional markets 2-Year Compound Annual Growth Rate, 2011-2013 50% 40% 30% 20% 10% 0% New York - New Dallas - Fort Worth West Texas San Francisco National Average Jersey Source: United States Census Bureau – Building
Slide 17: Company Focus and Strategy
US CONCRETE Company Focus and Strategy
Slide 18: Continued Focus on Improved Performance
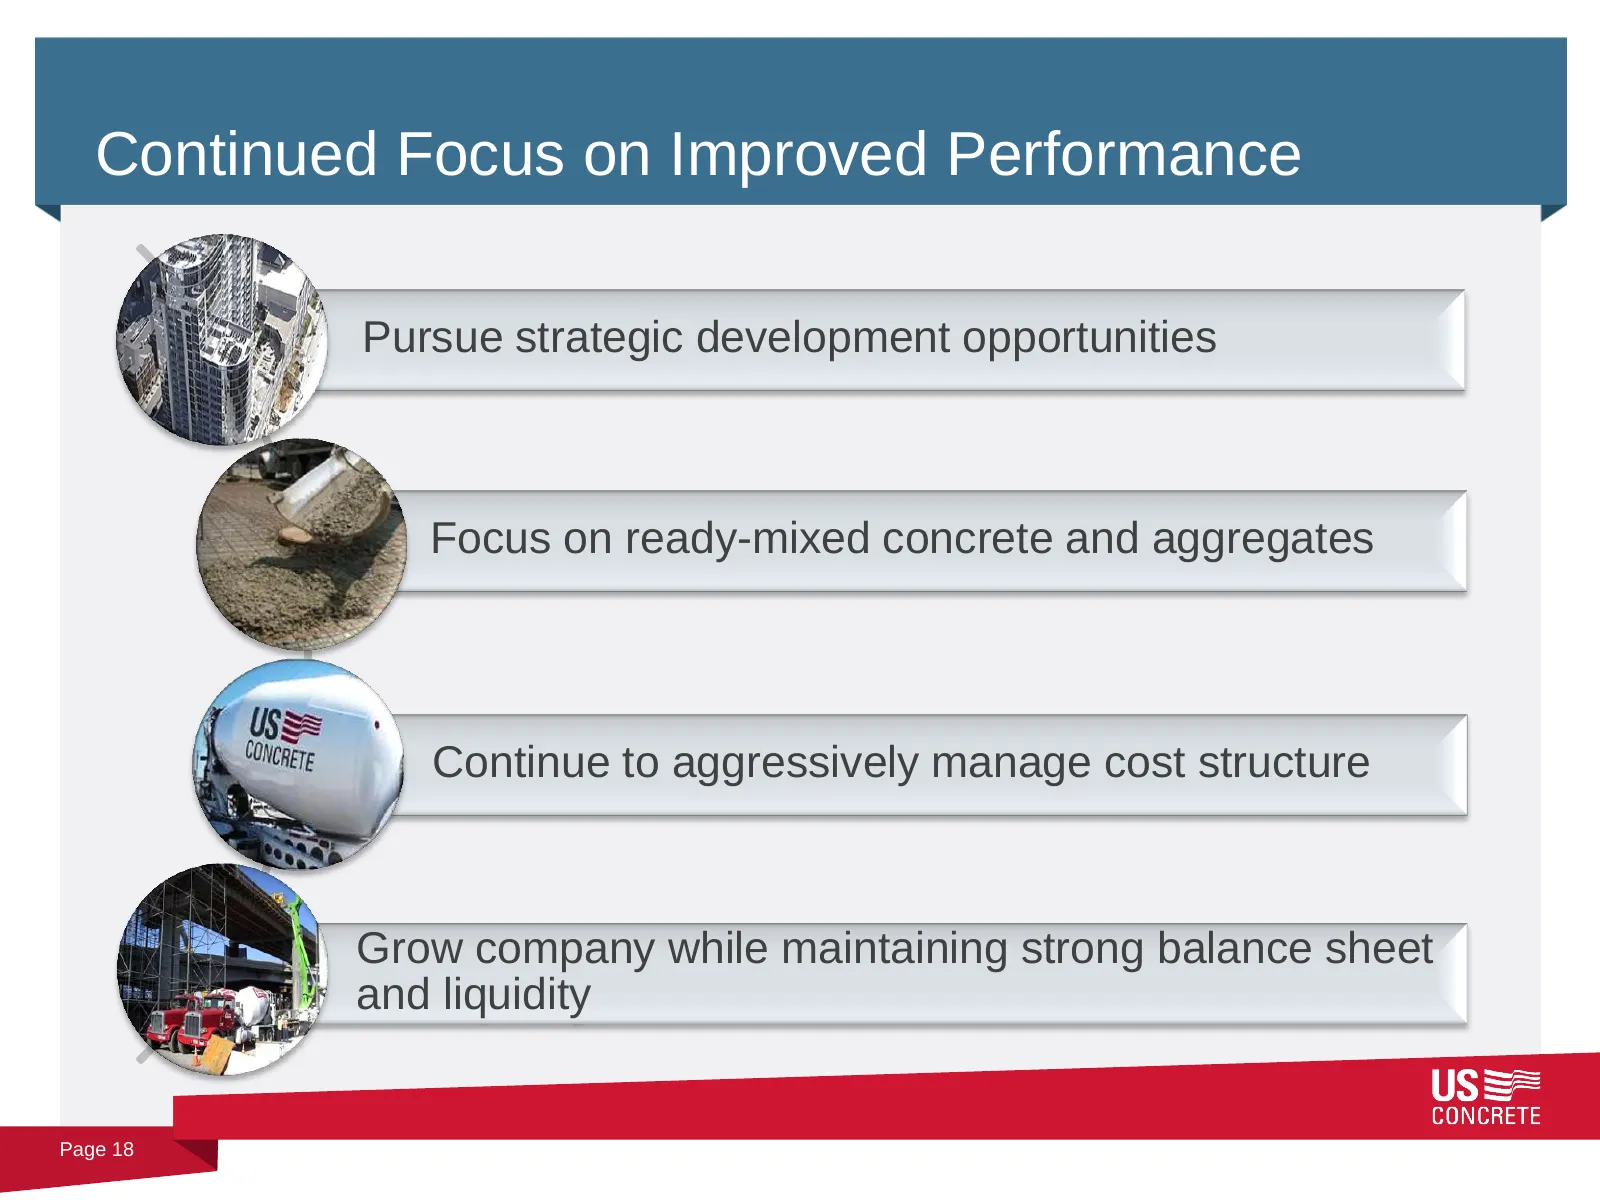
Continued Focus on Improved Performance Pursue strategic development opportunities Focus on ready-mixed concrete and aggregates Continue to aggressively manage cost structure Grow company while maintaining strong balance sheet and liquidity Page 18
Slide 19: Acquisition Strategy
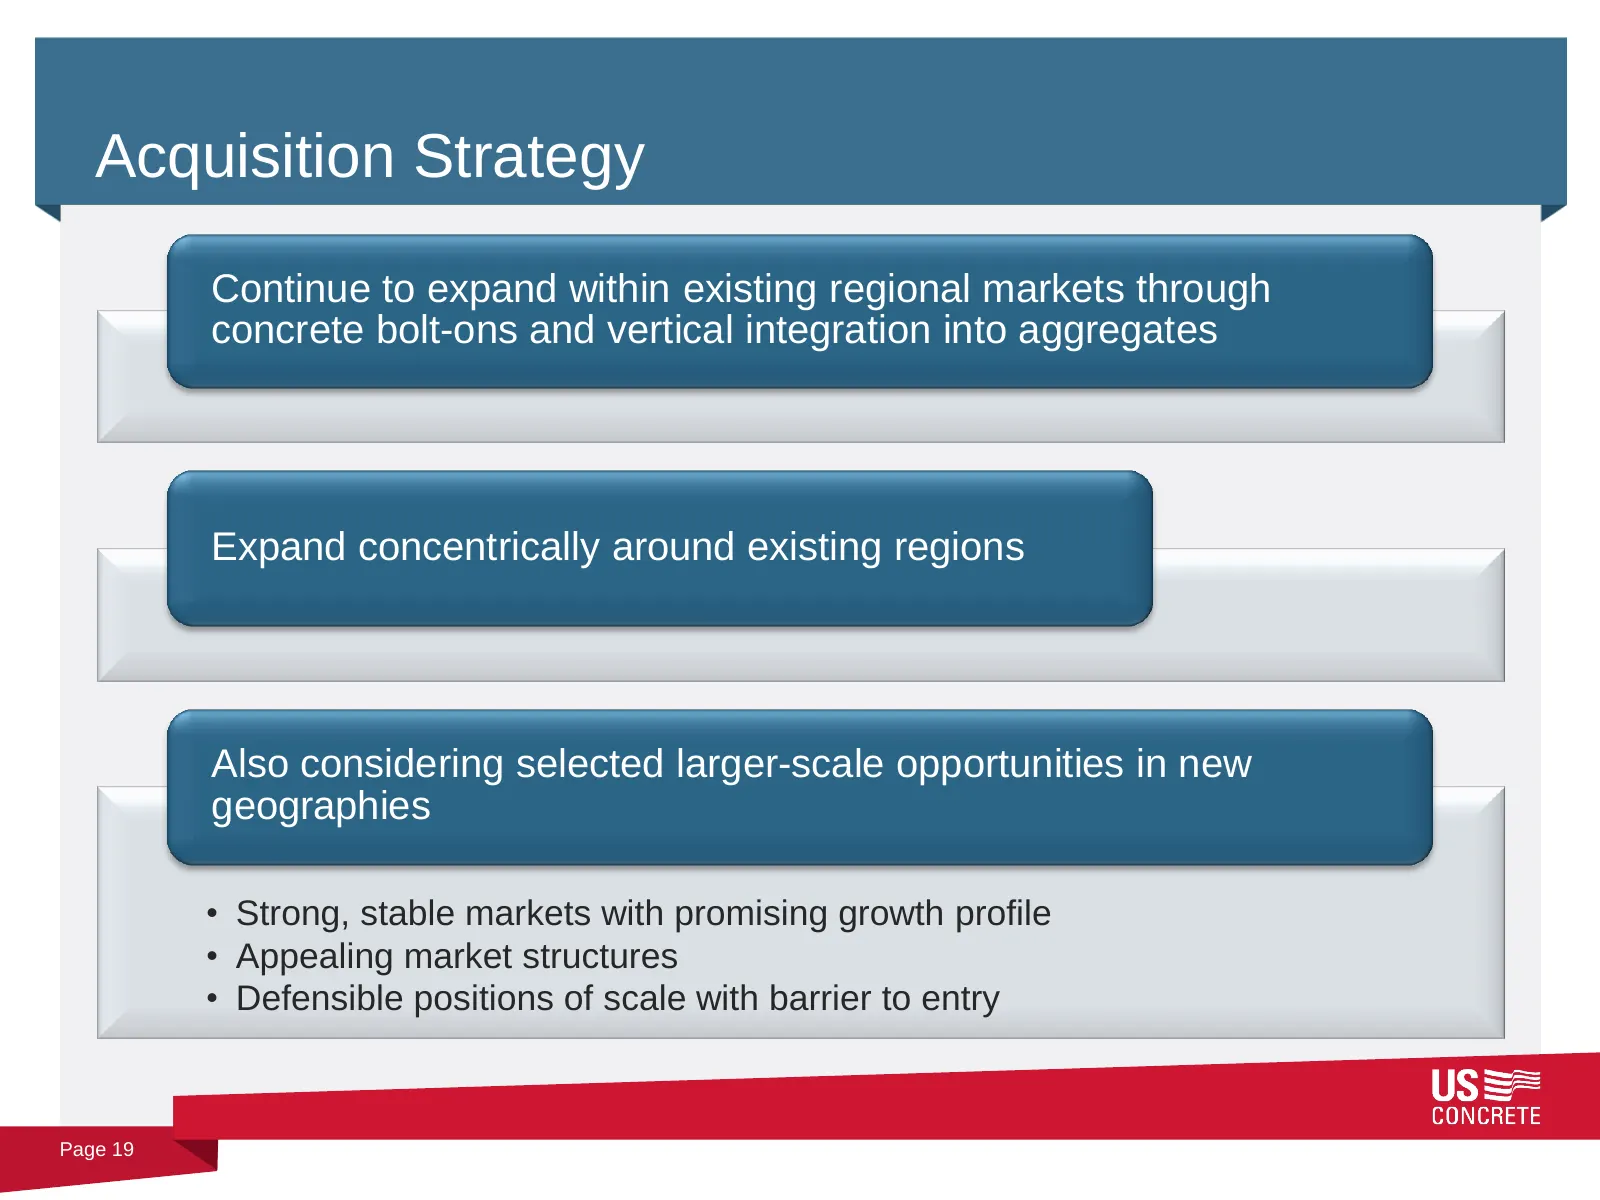
Acquisition Strategy Continue to expand within existing regional markets through concrete bolt-ons and vertical integration into aggregates Expand concentrically around existing regions Also considering selected larger-scale opportunities in new geographies • Strong, stable markets with promising gr
Slide 20: Recent Acquisitions
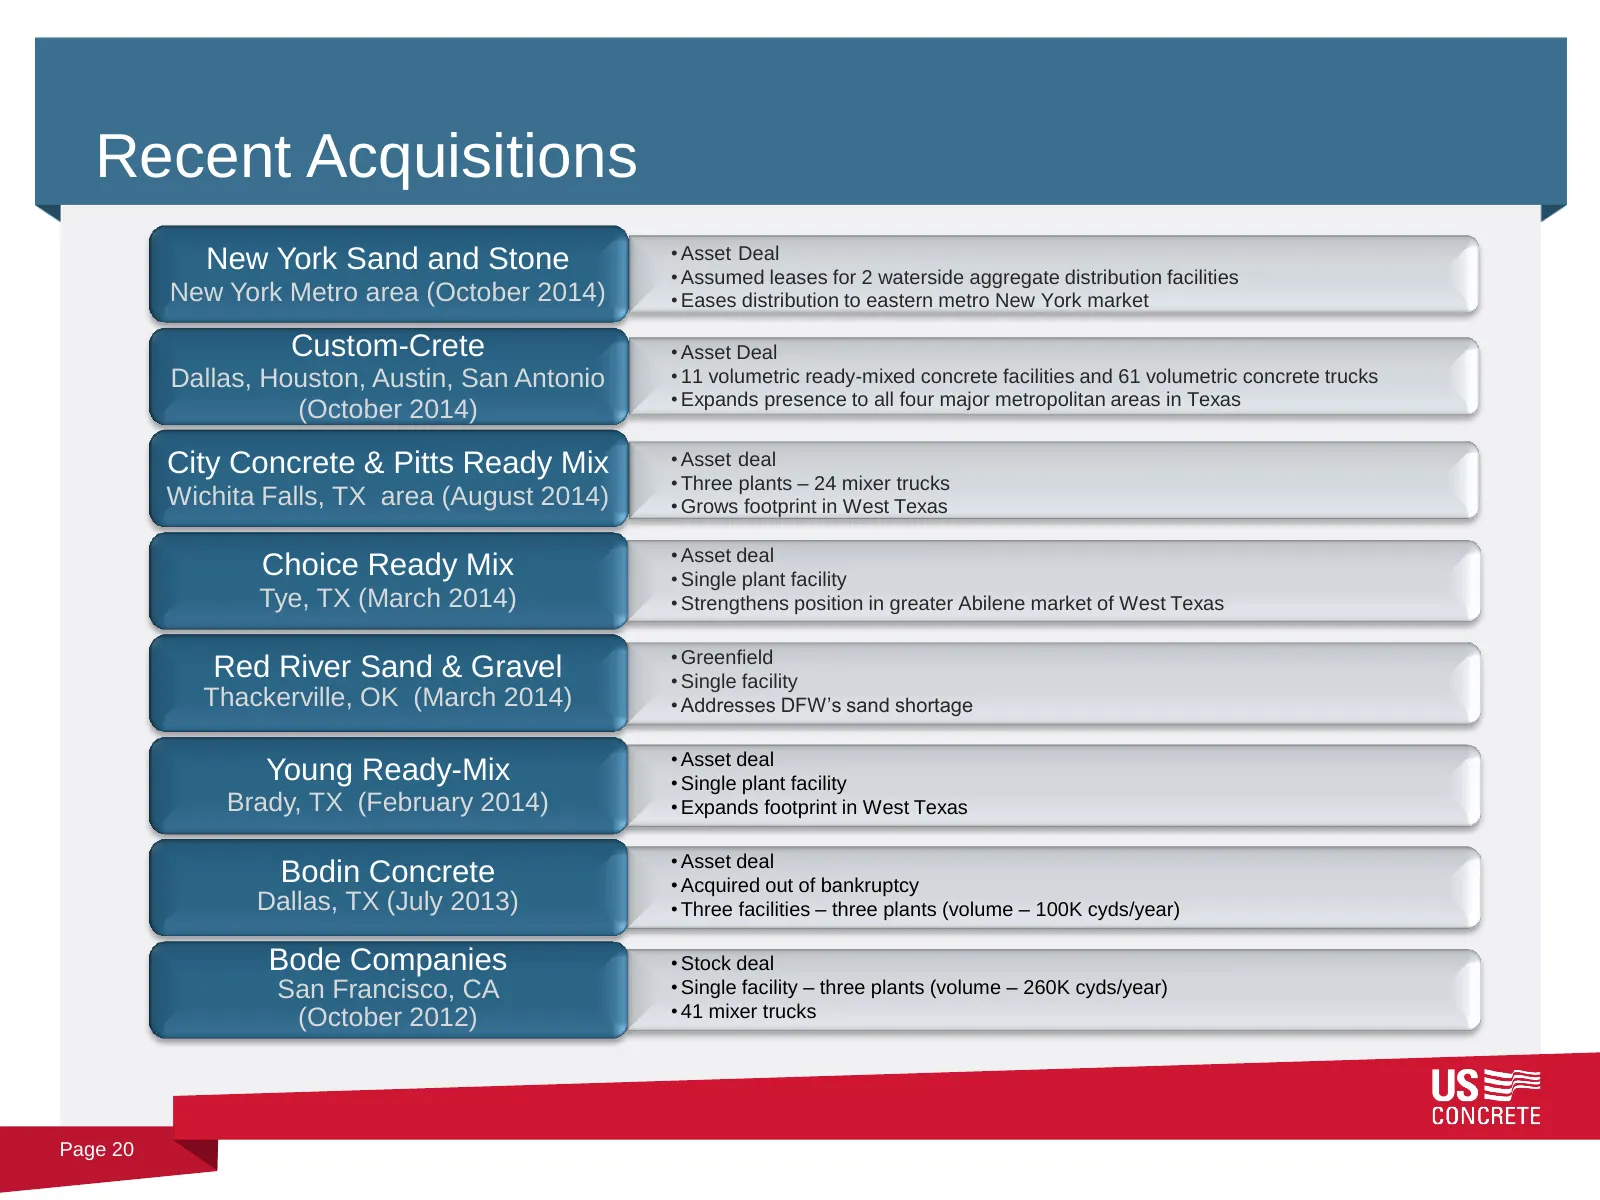
Recent Acquisitions New York Sand and Stone • Asset Deal • Assumed leases for 2 waterside aggregate distribution facilities New York Metro area (October 2014) • Eases distribution to eastern metro New York market Custom-Crete • Asset Deal Dallas, Houston, Austin, San Antonio • 11 volumetric ready-mi
Slide 21: USCR Competitive Advantage
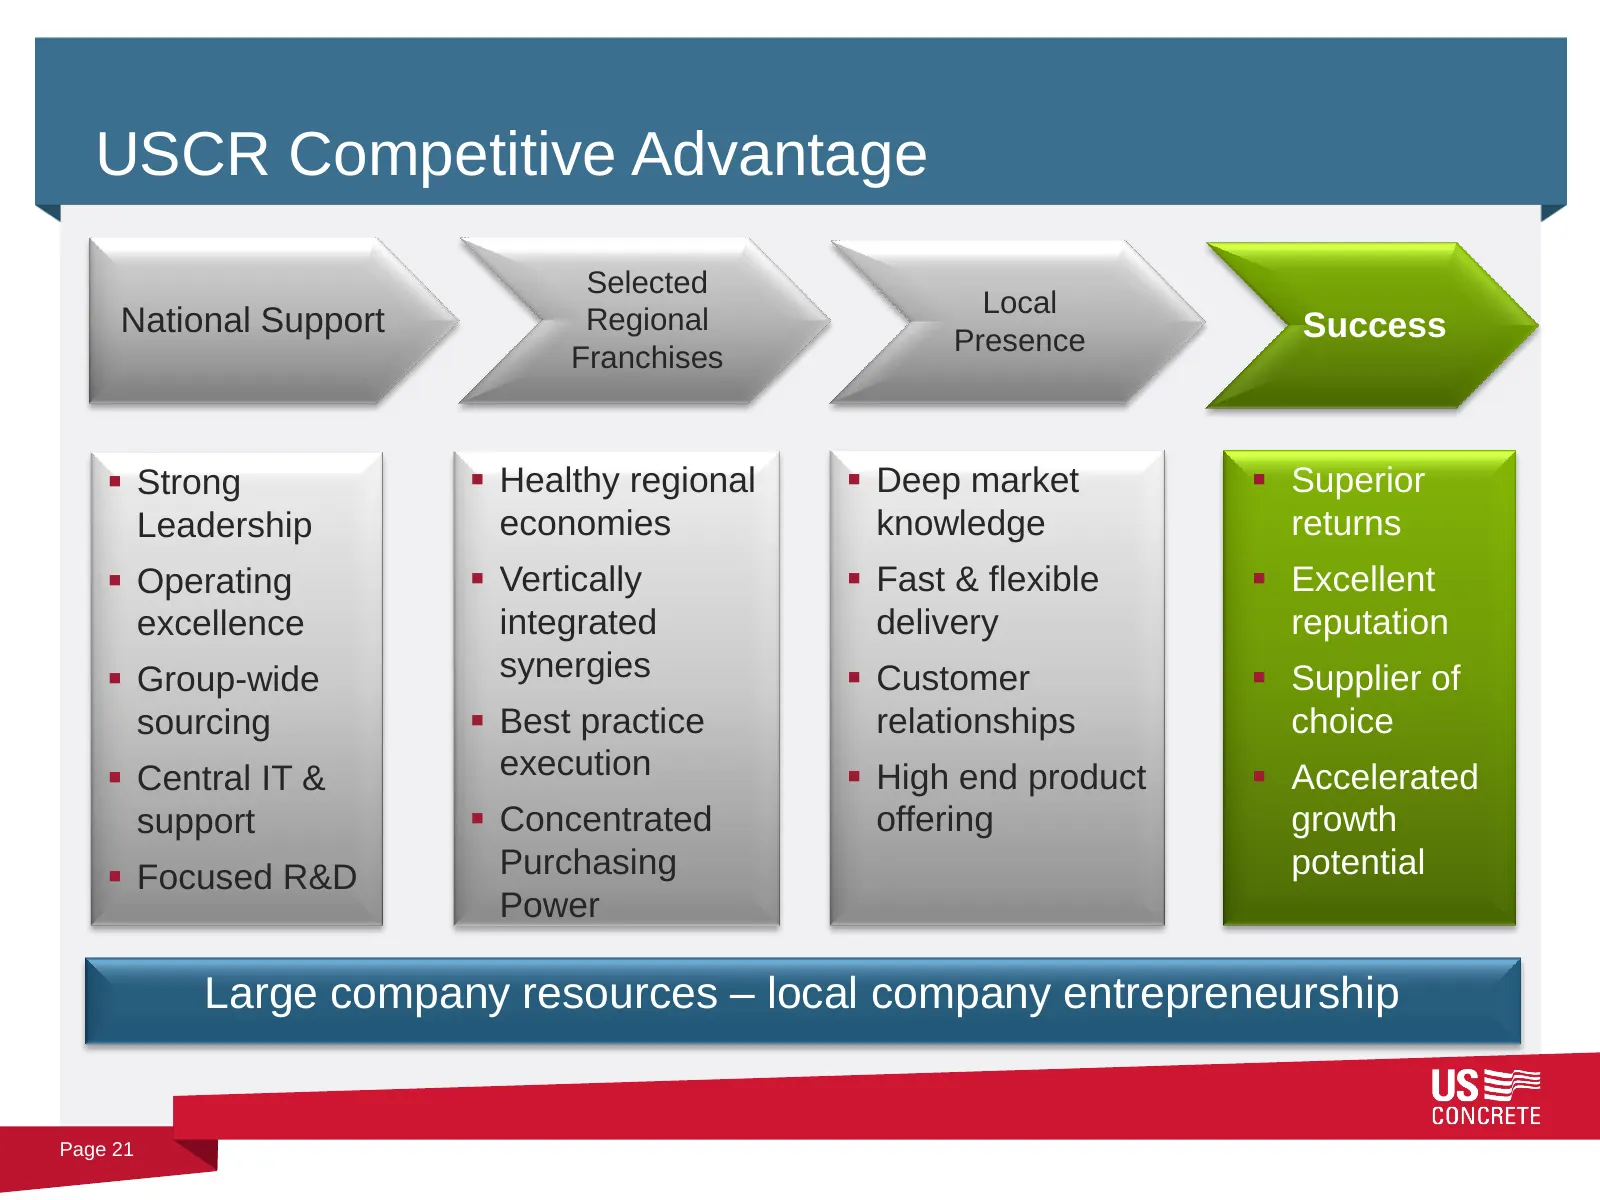
USCR Competitive Advantage Selected Local National Support Regional Success Presence Franchises Strong Healthy regional Deep market Superior Leadership economies knowledge returns Operating Vertically Fast & flexible Excellent excellence integrated delivery reputation Group-wide sy
Slide 22: Sustainability Leadership
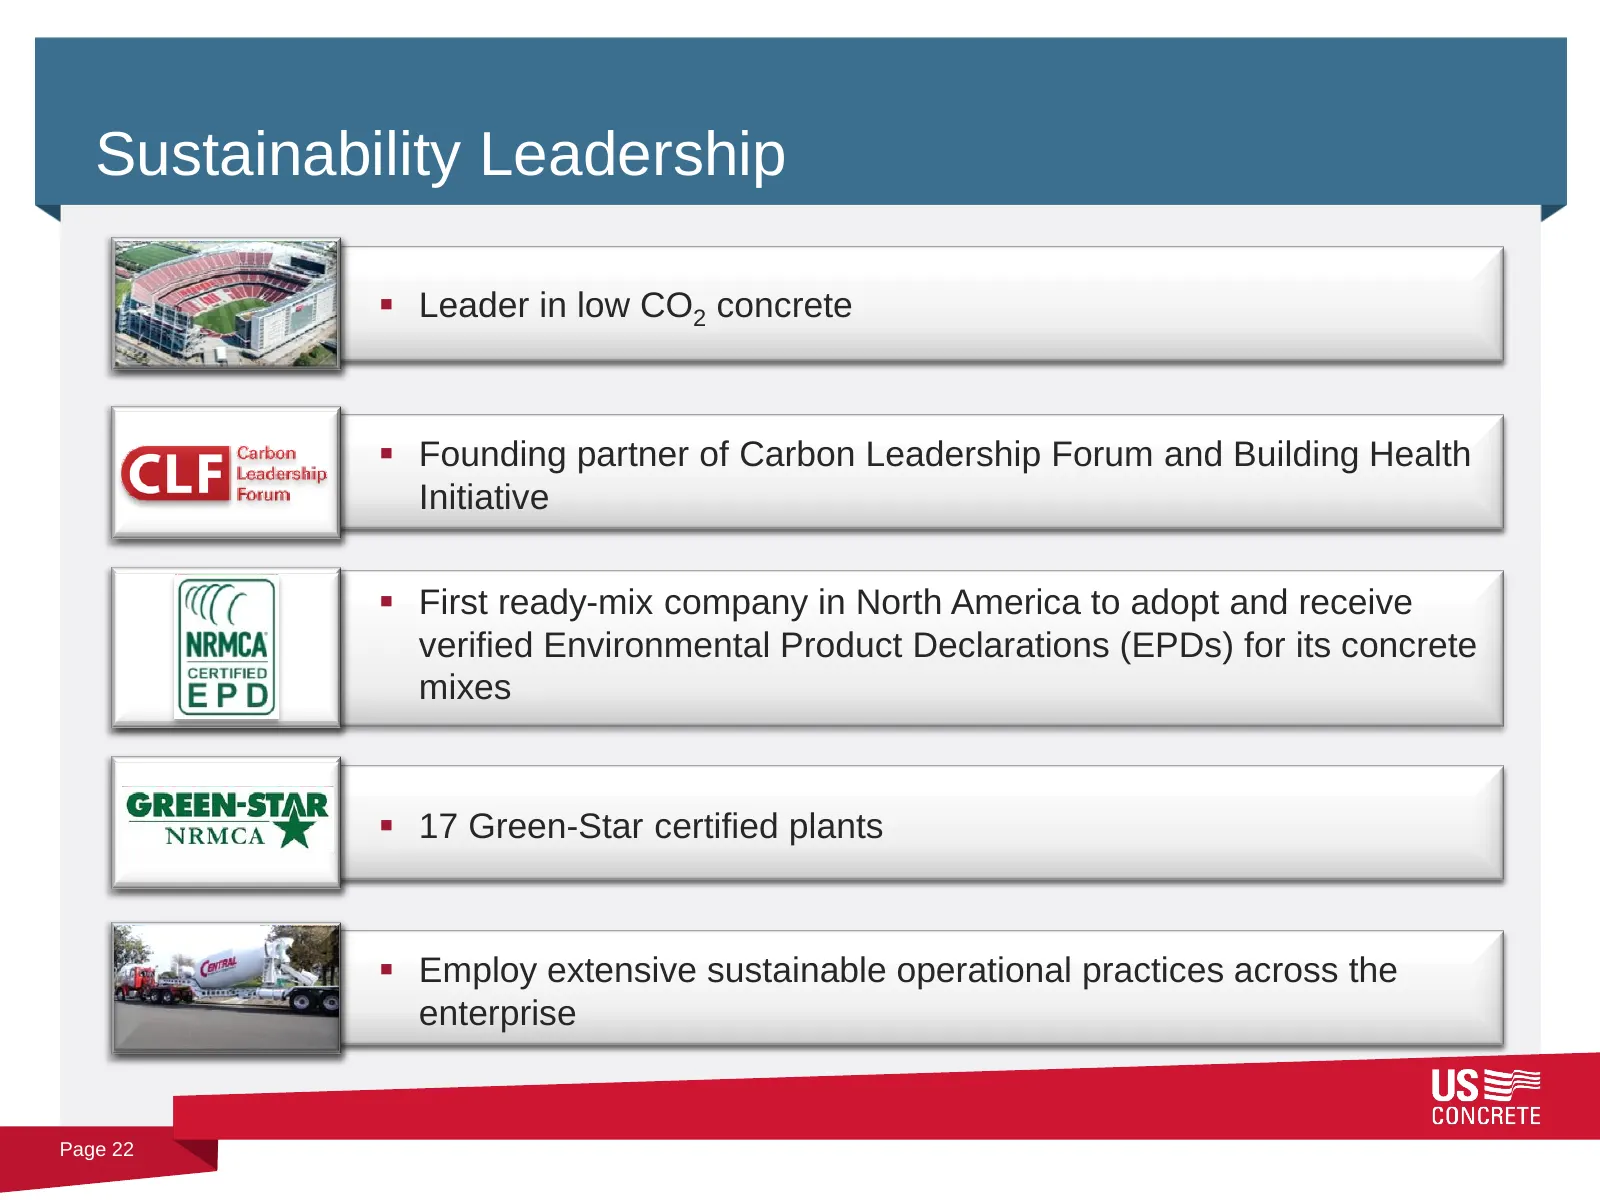
Sustainability Leadership Leader in low CO2 concrete Founding partner of Carbon Leadership Forum and Building Health Initiative First ready-mix company in North America to adopt and receive verified Environmental Product Declarations (EPDs) for its concrete mixes 17 Green-Star certified plan
Slide 23: Benefits of Our Sustainable Strategy
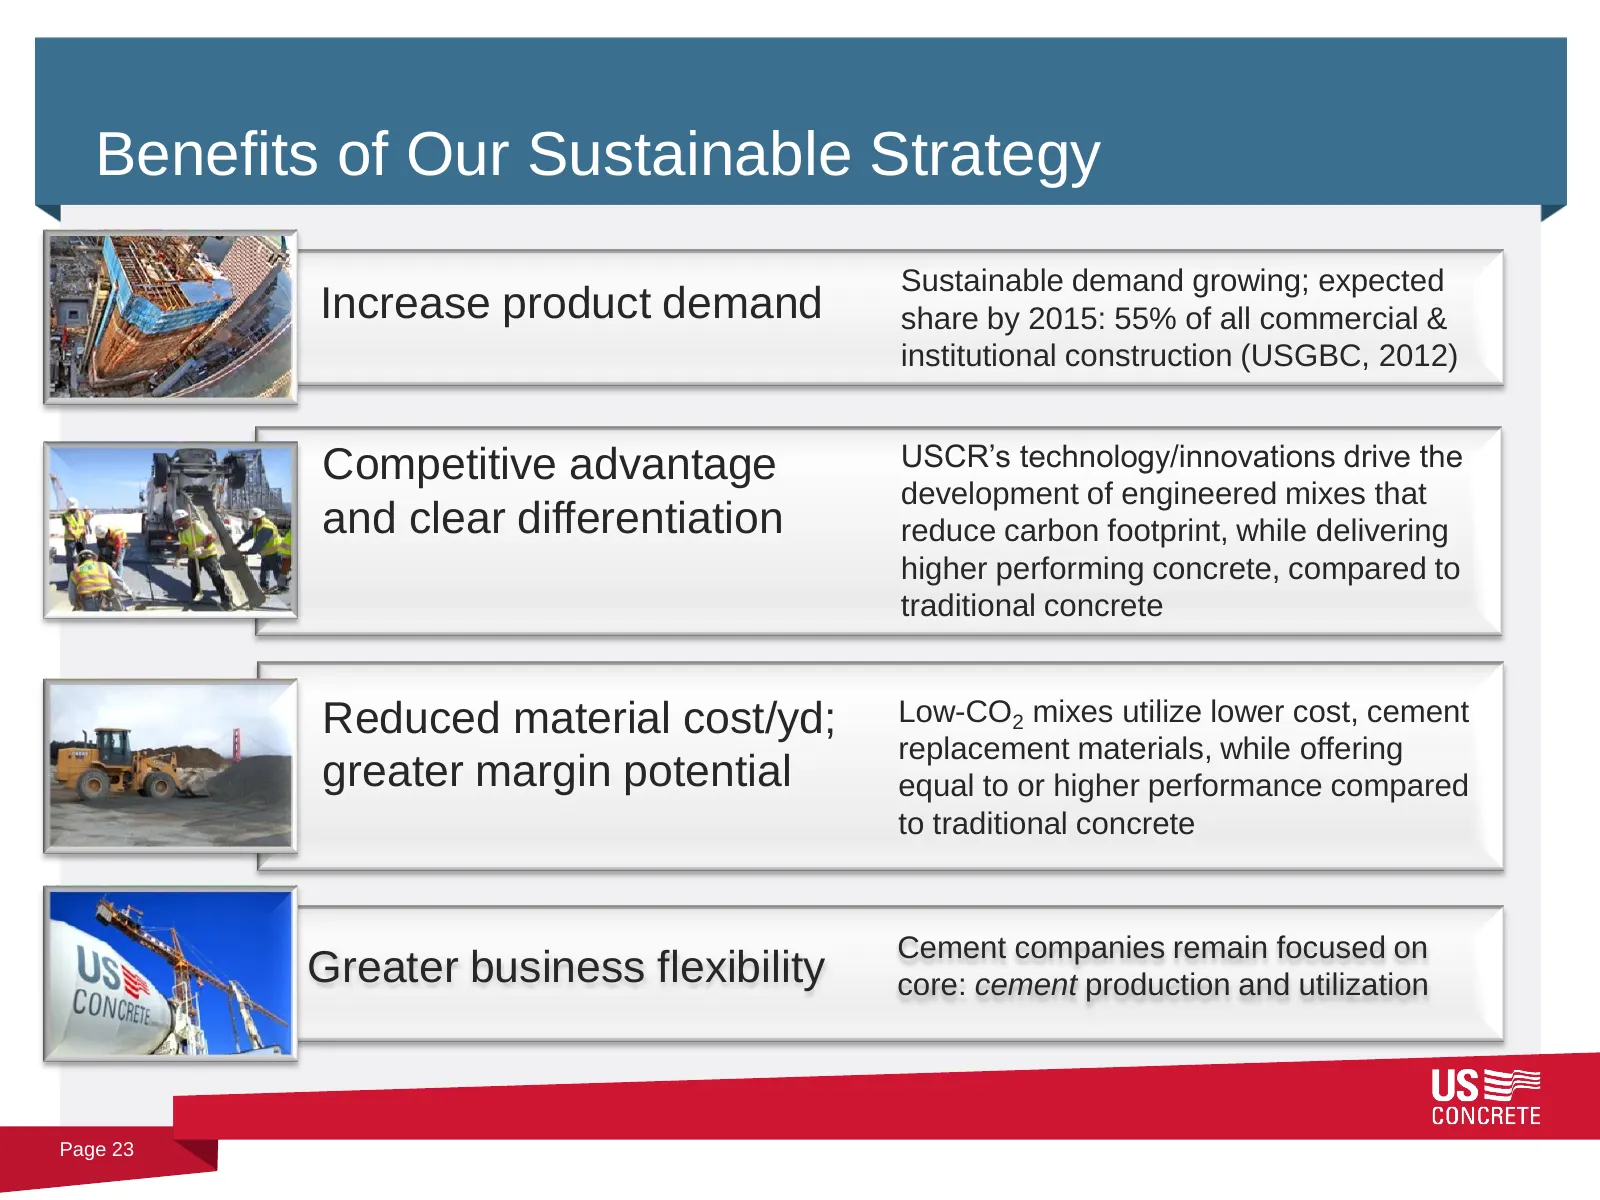
Benefits of Our Sustainable Strategy Sustainable demand growing; expected Increase product demand share by 2015: 55% of all commercial & institutional construction (USGBC, 2012) Competitive advantage USCR’s technology/innovations drive the development of engineered mixes that and clear differentiati
Slide 24: Investment Highlights
Investment Highlights Favorable exposure to commercial projects with higher margins and barriers to entry High quality asset base in attractive markets Well positioned to benefit from rebound in construction market Long-term diversified customer base Focus on sustainable leadership and str
Slide 25: Disclosure of Non-GAAP Financial Measures
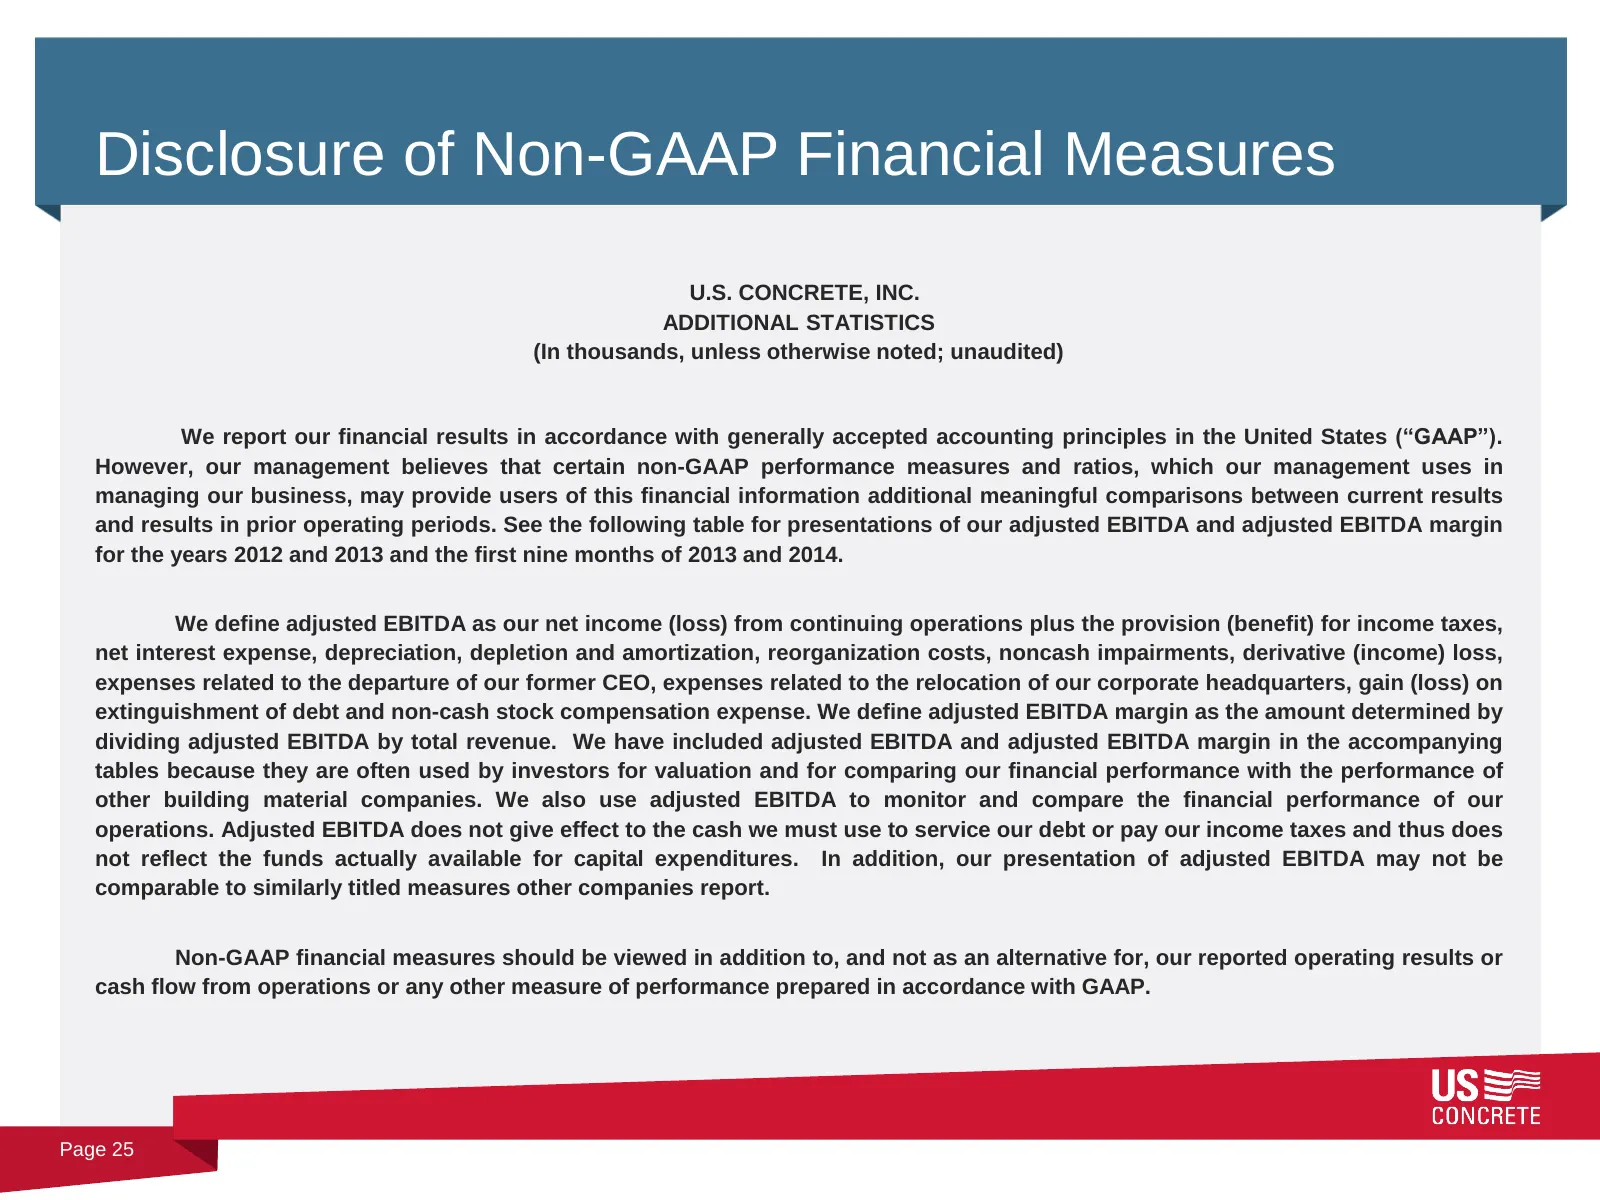
Disclosure of Non-GAAP Financial Measures U.S. CONCRETE, INC. ADDITIONAL STATISTICS (In thousands, unless otherwise noted; unaudited) We report our financial results in accordance with generally accepted accounting principles in the United States (“GAAP”). However, our management believes that certa
Slide 26: Reconciliation of Non-GAAP Financial Measures
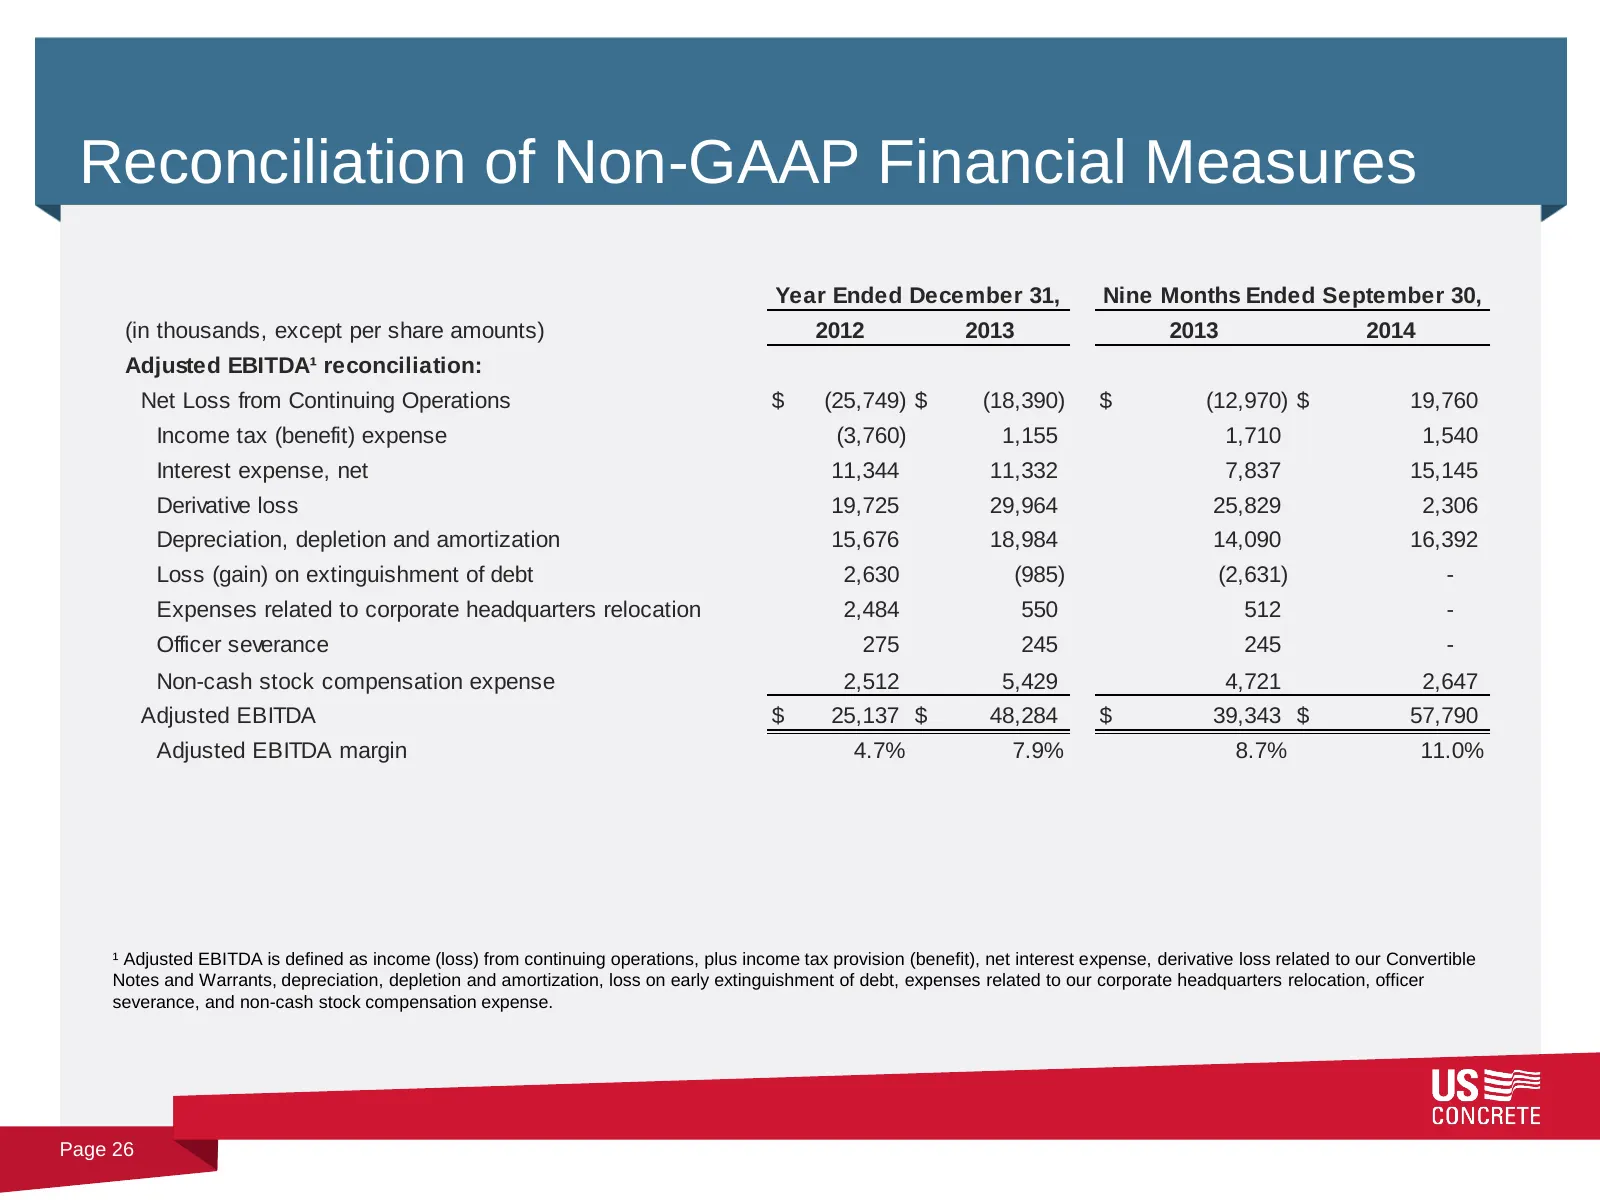
Reconciliation of Non-GAAP Financial Measures Year Ended December 31, Nine Months Ended September 30, (in thousands, except per share amounts) 2012 2013 2013 2014 Adjusted EBITDA¹ reconciliation: Net Loss from Continuing Operations $ (25,749) $ (18,390) $ (12,970) $ 19,760 Income tax (benefit) expen
Slide 27: Investor Presentation
Investor Presentation Three Part Advisors, LLC Southwest IDEAS Investor Conference Dallas, TX November 20, 2014
Source: SEC EDGAR · 8-K filed Nov 20, 2014
More decks from U.S. Concrete Inc
 ESG Presentation (April 2021)31 slides · Apr 1, 2021
 Investor Presentation (March 2021)36 slides · Mar 23, 2021
 Investor Presentation (November 2020)36 slides · Nov 12, 2020
 Investor Presentation (June 2020)22 slides · Jun 3, 2020
 Investor Presentation (March 2019)16 slides · Mar 22, 2019
 Investor Presentation (November 2018)17 slides · Nov 5, 2018