Flutter Entertainment plc · NYSE:FLUT
Flutter Entertainment — Paddy Power Betfair — H1 2017 Earnings Presentation
27 slides from Flutter Entertainment's earnings presentation, 2017

Slide 1: Paddy Power Betfair plc 2017 Interim Results
Paddy Power Betfair plc 2017 Interim Results
Slide 2: Financial & Operating Review
Financial & Operating Review
Slide 3: Financial highlights
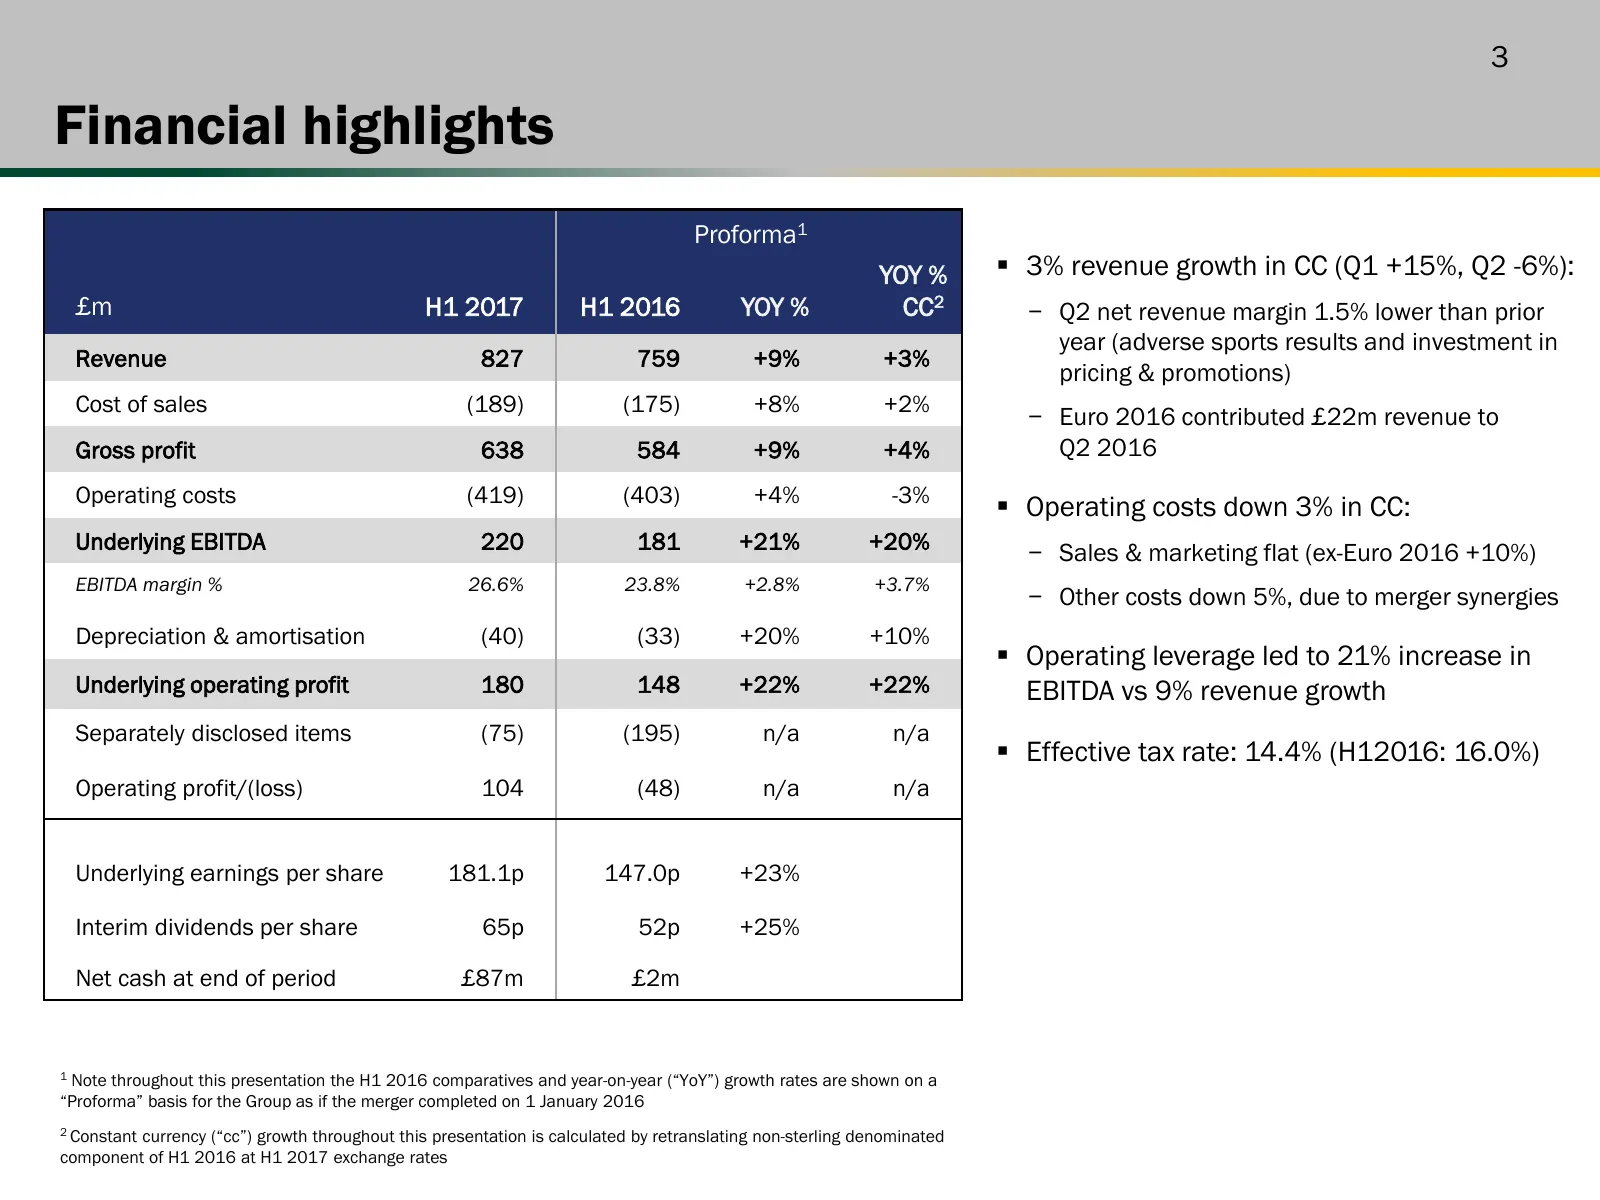
3 Financial highlights Proforma1 YOY % 3% revenue growth in CC (Q1 +15%, Q2 -6%): £m H1 2017 H1 2016 YOY % CC2 − Q2 net revenue margin 1.5% lower than prior year (adverse sports results and investment in Revenue 827 759 +9% +3% pricing & promotions) Cost of sales (189) (175) +8% +2% − Euro 2016 co
Slide 4: Group EBITDA bridge
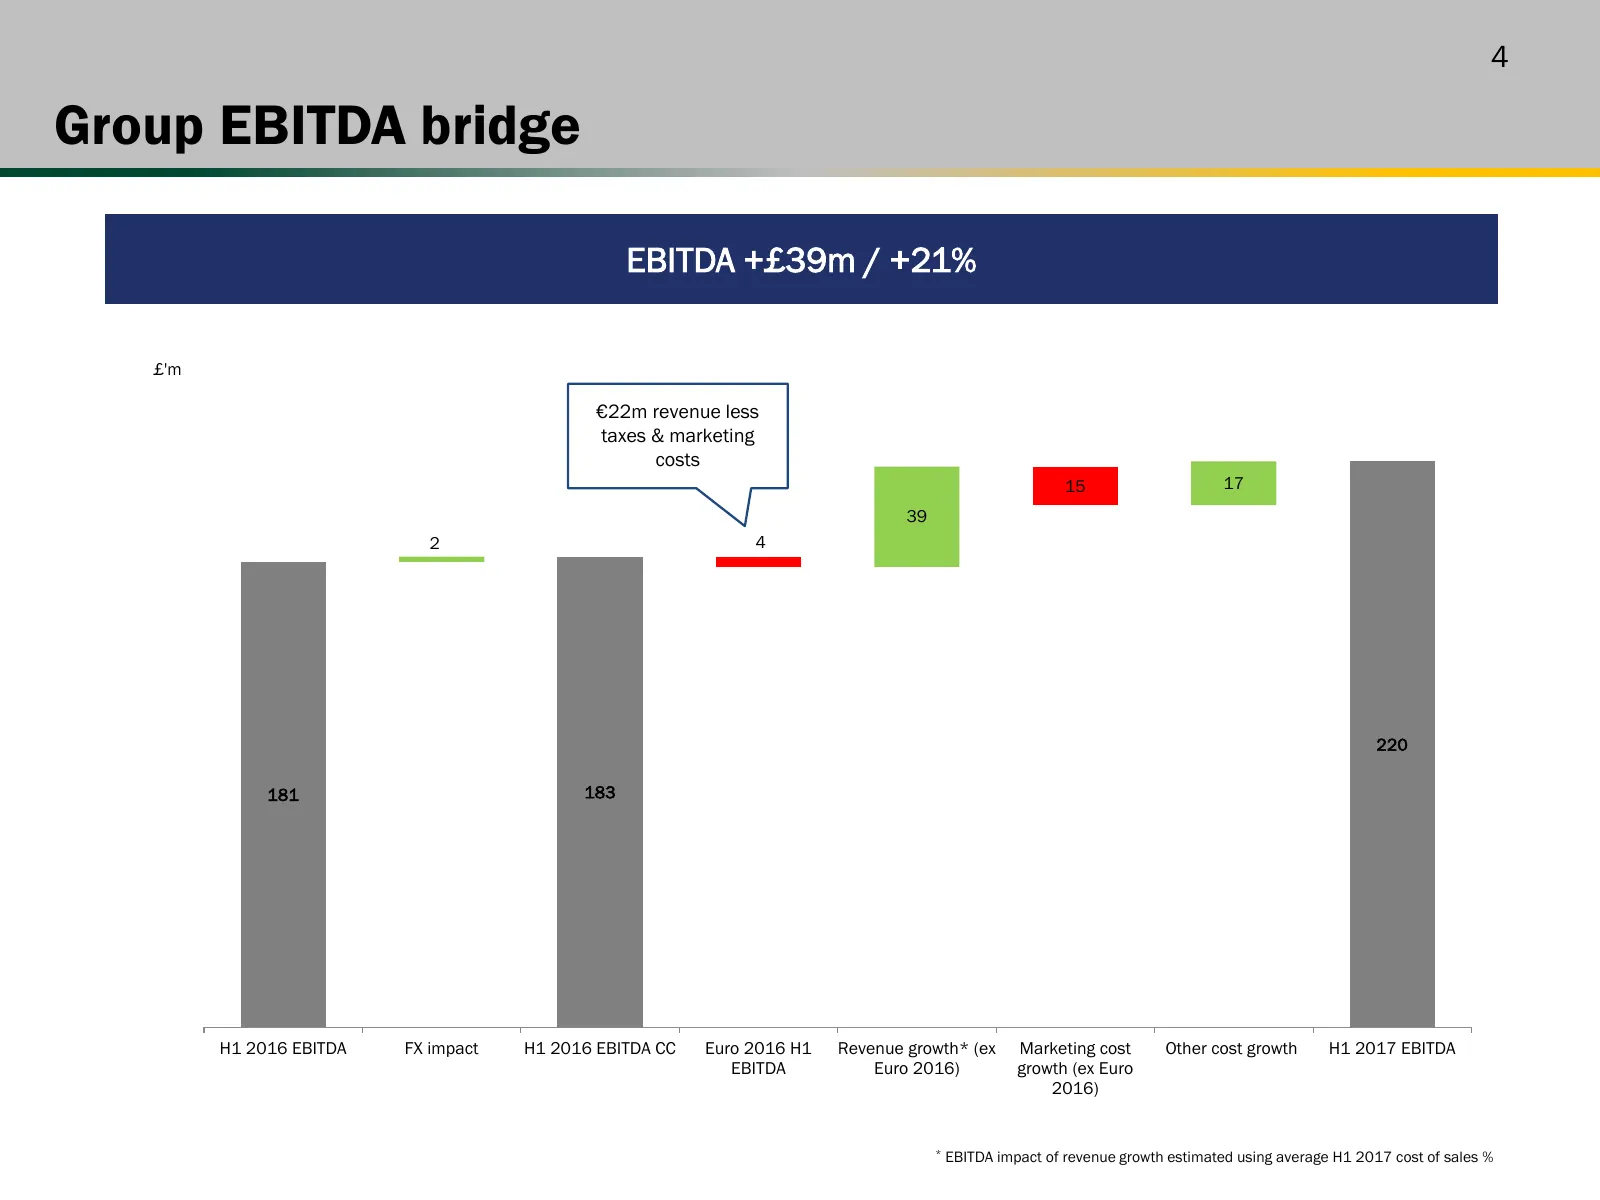
4 Group EBITDA bridge EBITDA +£39m / +21% £'m €22m revenue less taxes & marketing costs 15 17 39 2 4 220 181 183 H1 2016 EBITDA FX impact H1 2016 EBITDA CC Euro 2016 H1 Revenue growth* (ex Marketing cost Other cost growth H1 2017 EBITDA EBITDA Euro 2016) growth (ex Euro 2016) * EBITDA impact of reve
Slide 5: Online
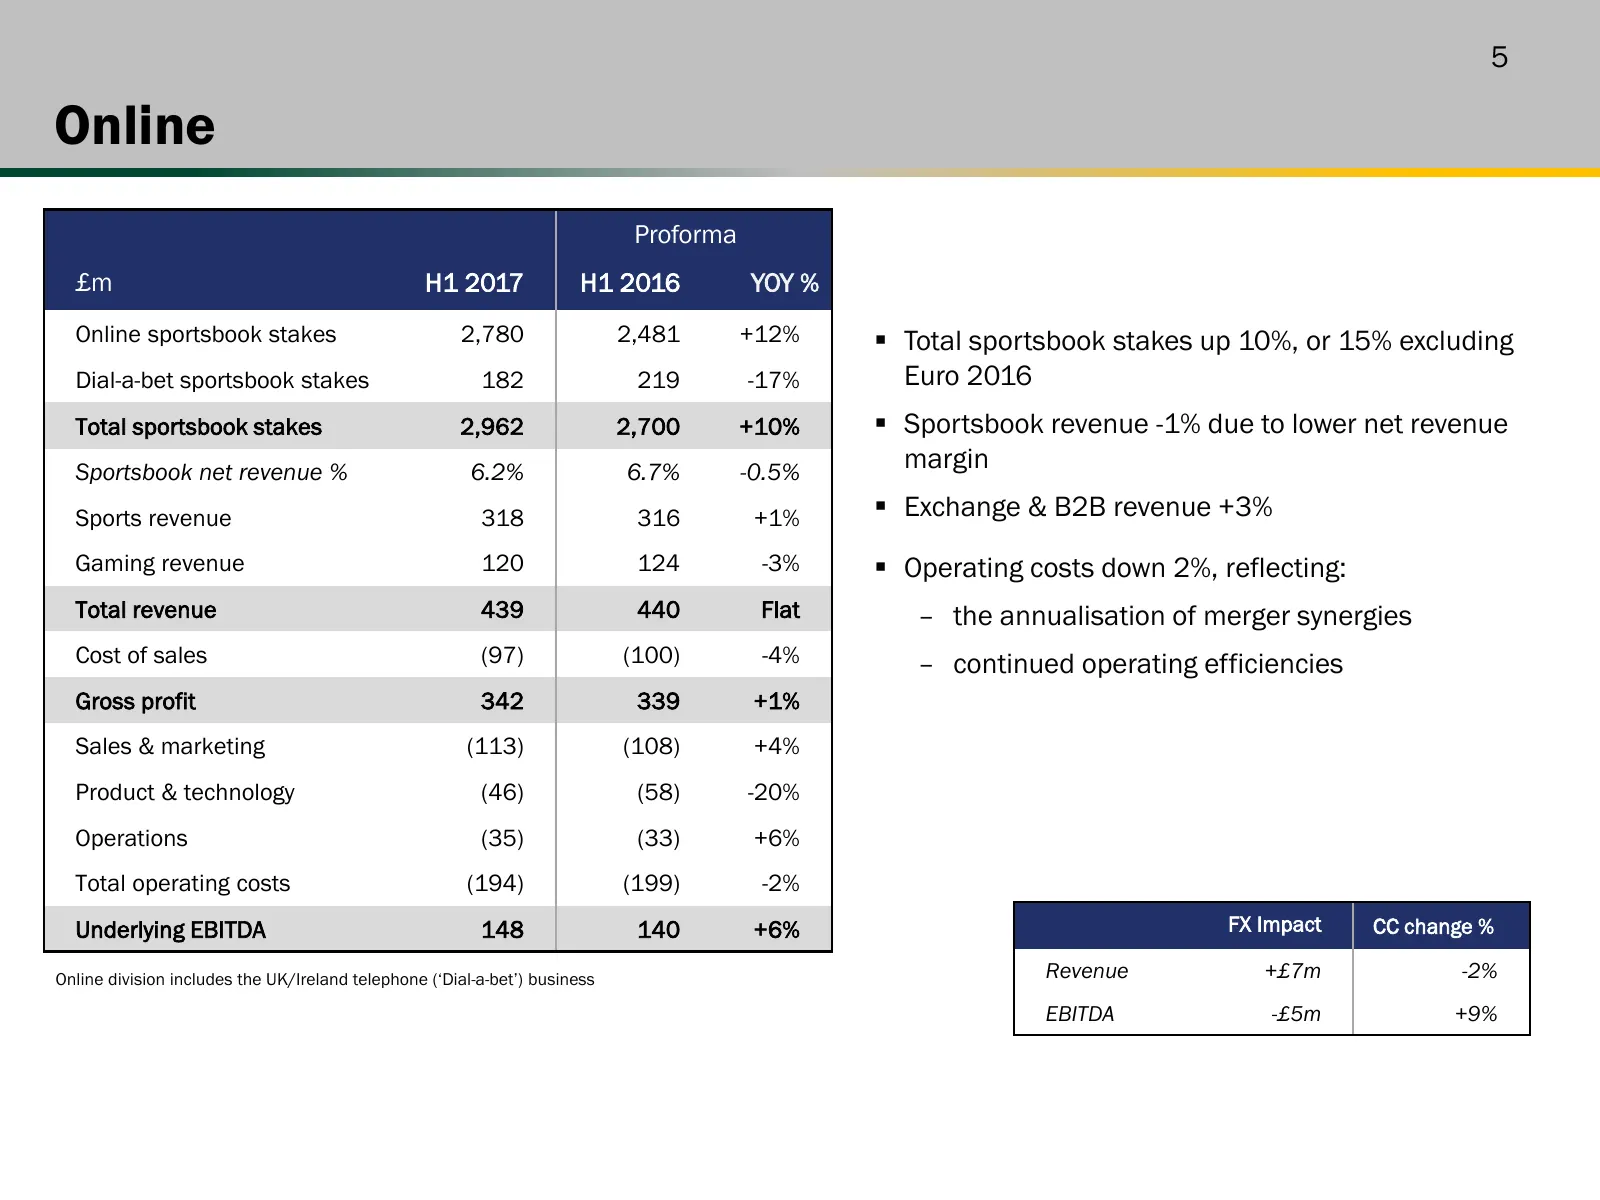
5 Online Proforma £m H1 2017 H1 2016 YOY % Online sportsbook stakes 2,780 2,481 +12% Total sportsbook stakes up 10%, or 15% excluding Dial-a-bet sportsbook stakes 182 219 -17% Euro 2016 Total sportsbook stakes 2,962 2,700 +10% Sportsbook revenue -1% due to lower net revenue Sportsbook net revenu
Slide 6: Australia
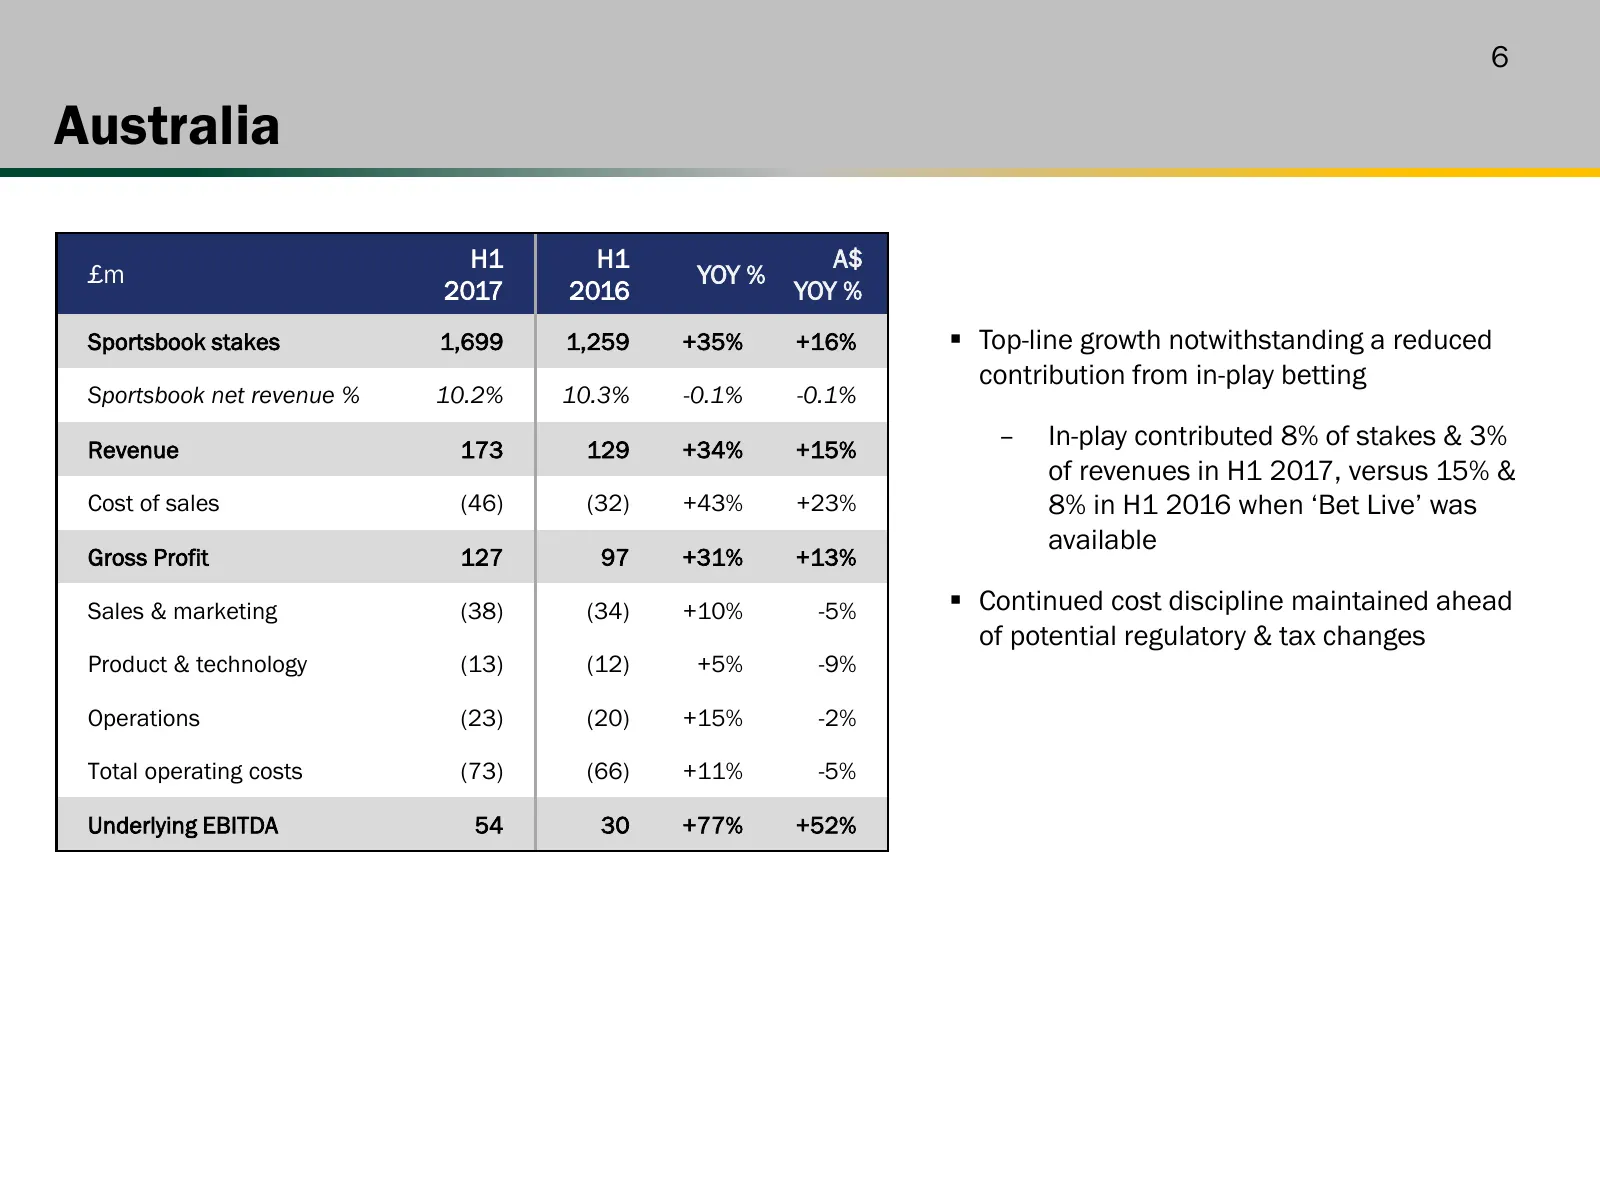
6 Australia H1 H1 A$ £m YOY % 2017 2016 YOY % Sportsbook stakes 1,699 1,259 +35% +16% Top-line growth notwithstanding a reduced contribution from in-play betting Sportsbook net revenue % 10.2% 10.3% -0.1% -0.1% Revenue 173 129 +34% +15% – In-play contributed 8% of stakes & 3% of revenues in H1 201
Slide 7: Retail
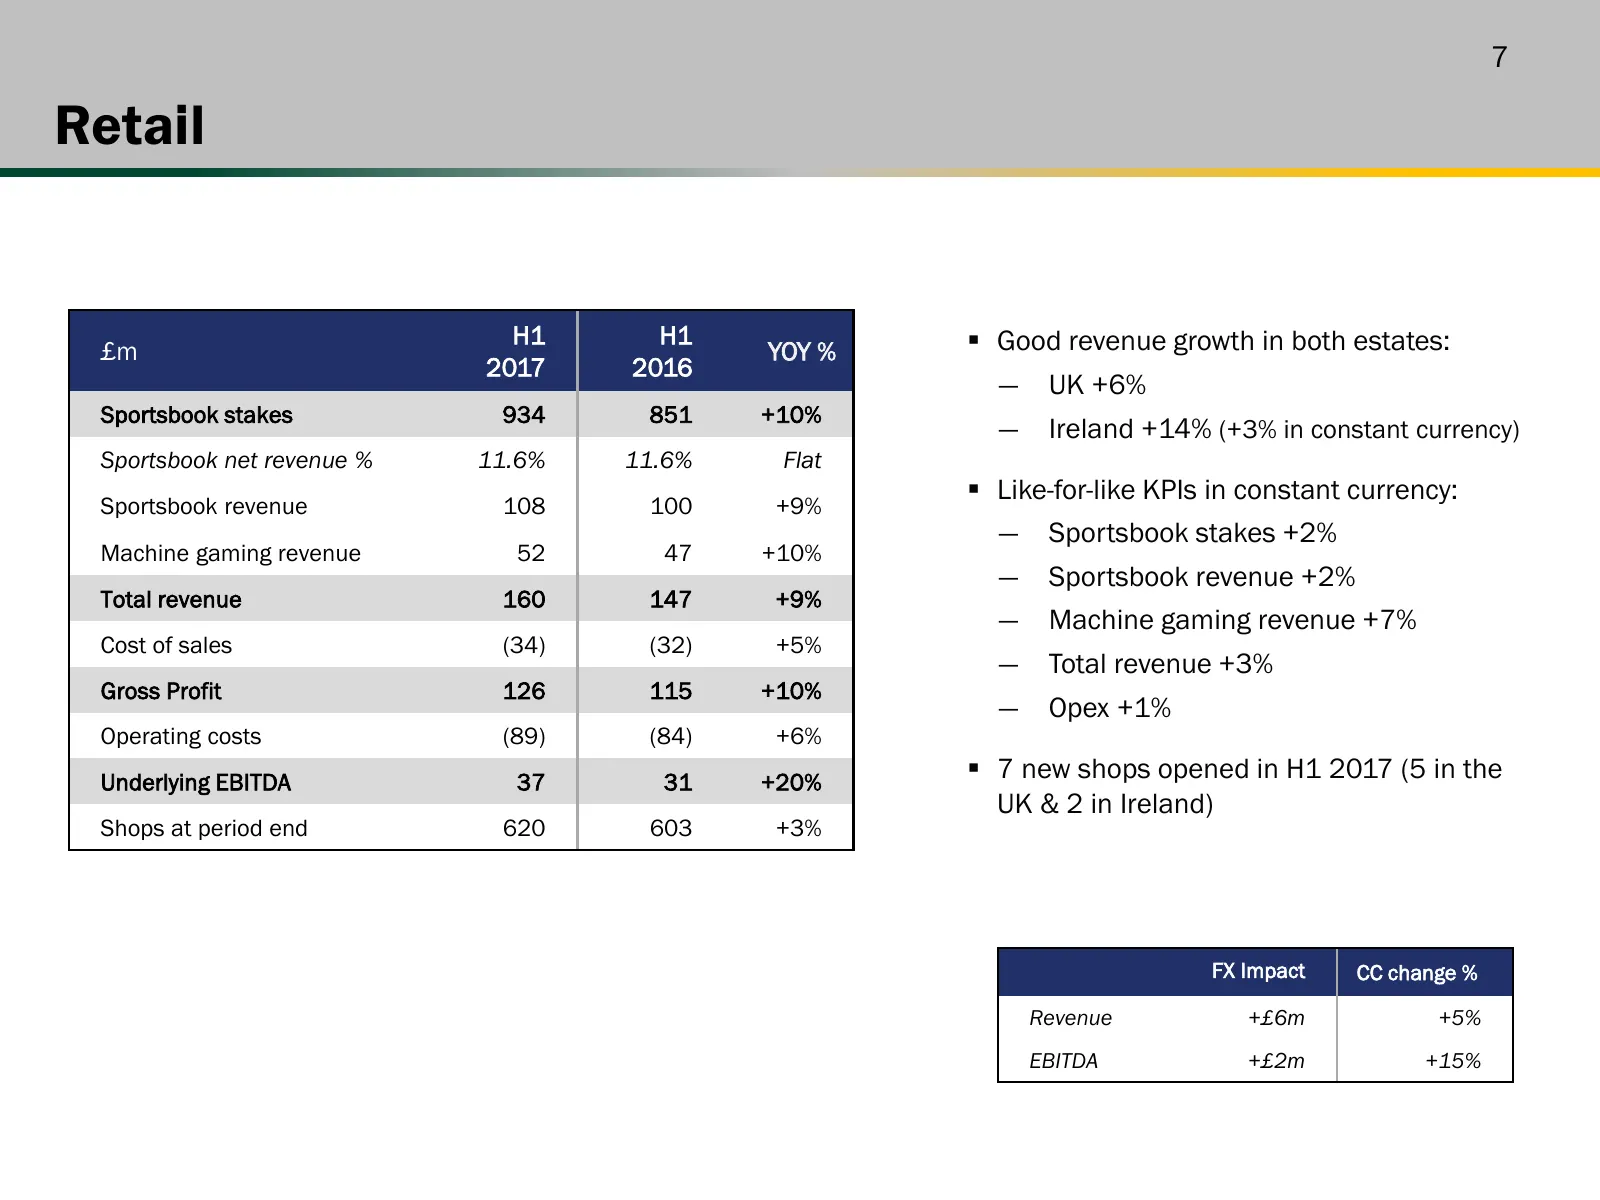
7 Retail H1 H1 Good revenue growth in both estates: £m YOY % 2017 2016 ― UK +6% Sportsbook stakes 934 851 +10% ― Ireland +14% (+3% in constant currency) Sportsbook net revenue % 11.6% 11.6% Flat Like-for-like KPIs in constant currency: Sportsbook revenue 108 100 +9% ― Sportsbook stakes +2% Machi
Slide 8: US
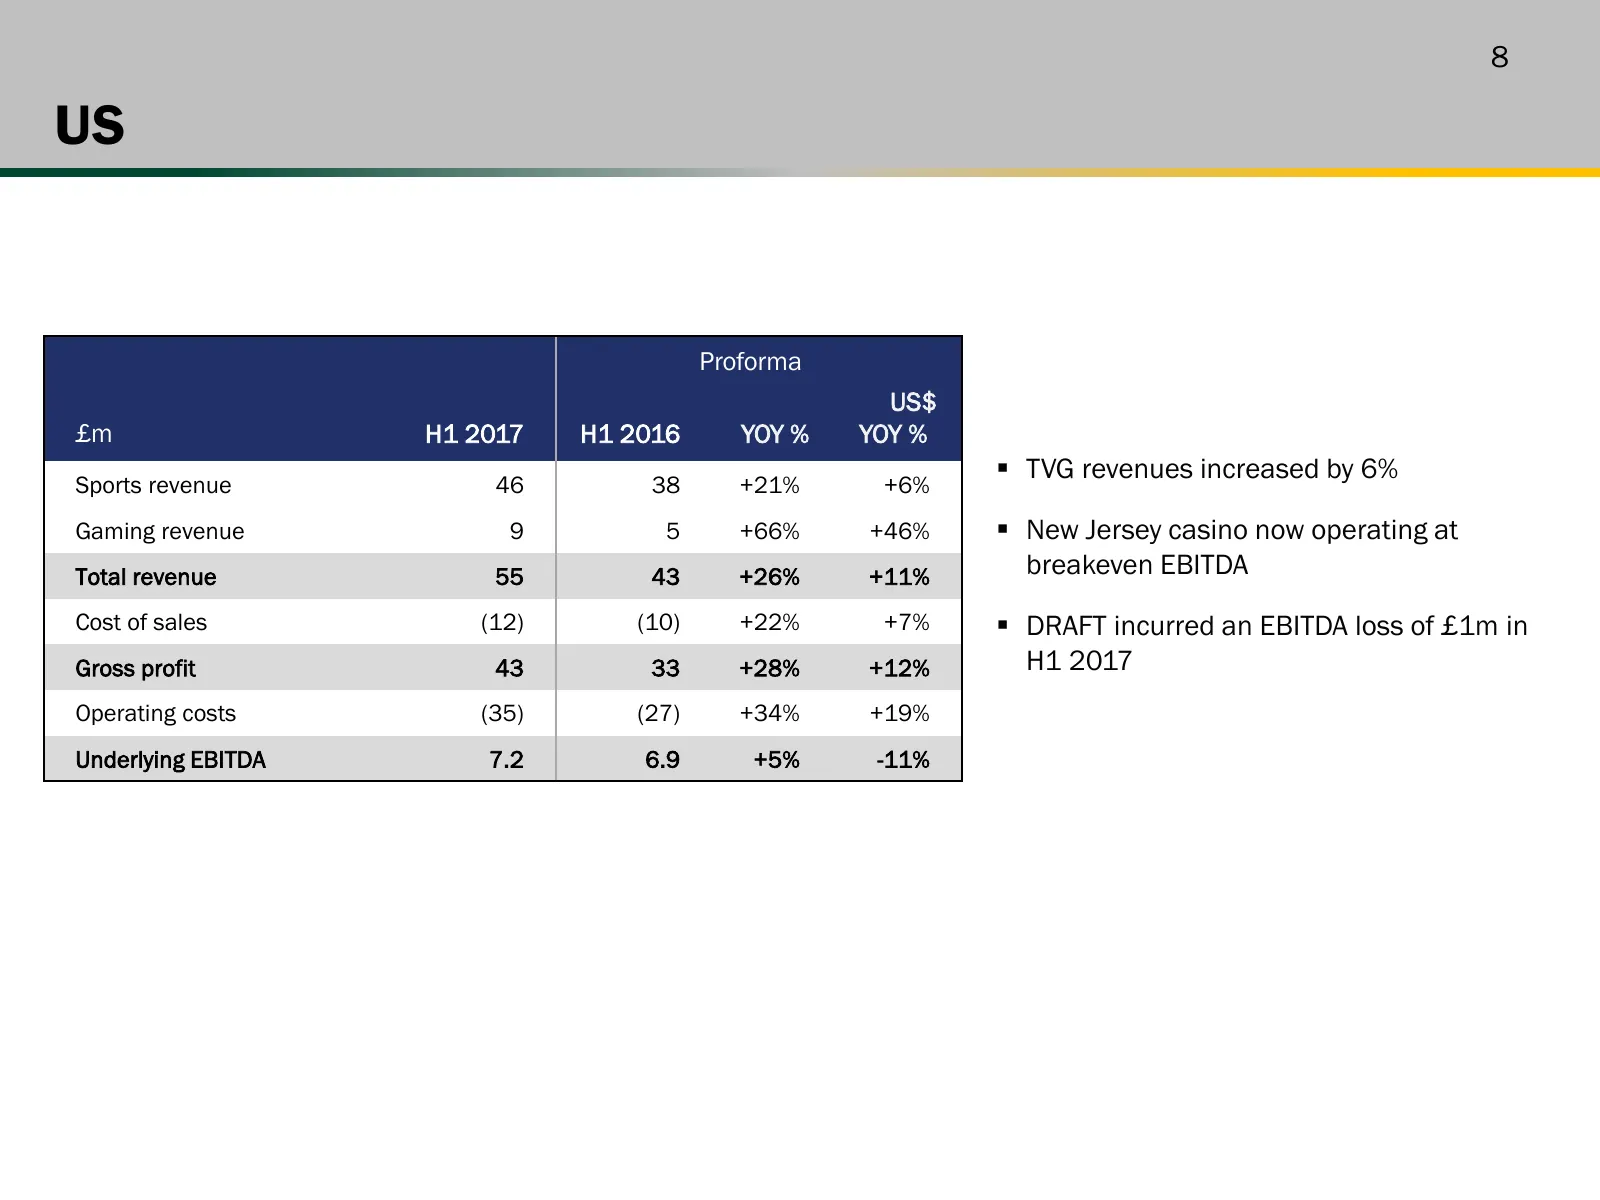
8 US Proforma US$ £m H1 2017 H1 2016 YOY % YOY % TVG revenues increased by 6% Sports revenue 46 38 +21% +6% Gaming revenue 9 5 +66% +46% New Jersey casino now operating at Total revenue 55 43 +26% +11% breakeven EBITDA Cost of sales (12) (10) +22% +7% DRAFT incurred an EBITDA loss of £1m in Gr
Slide 9: Cash flow
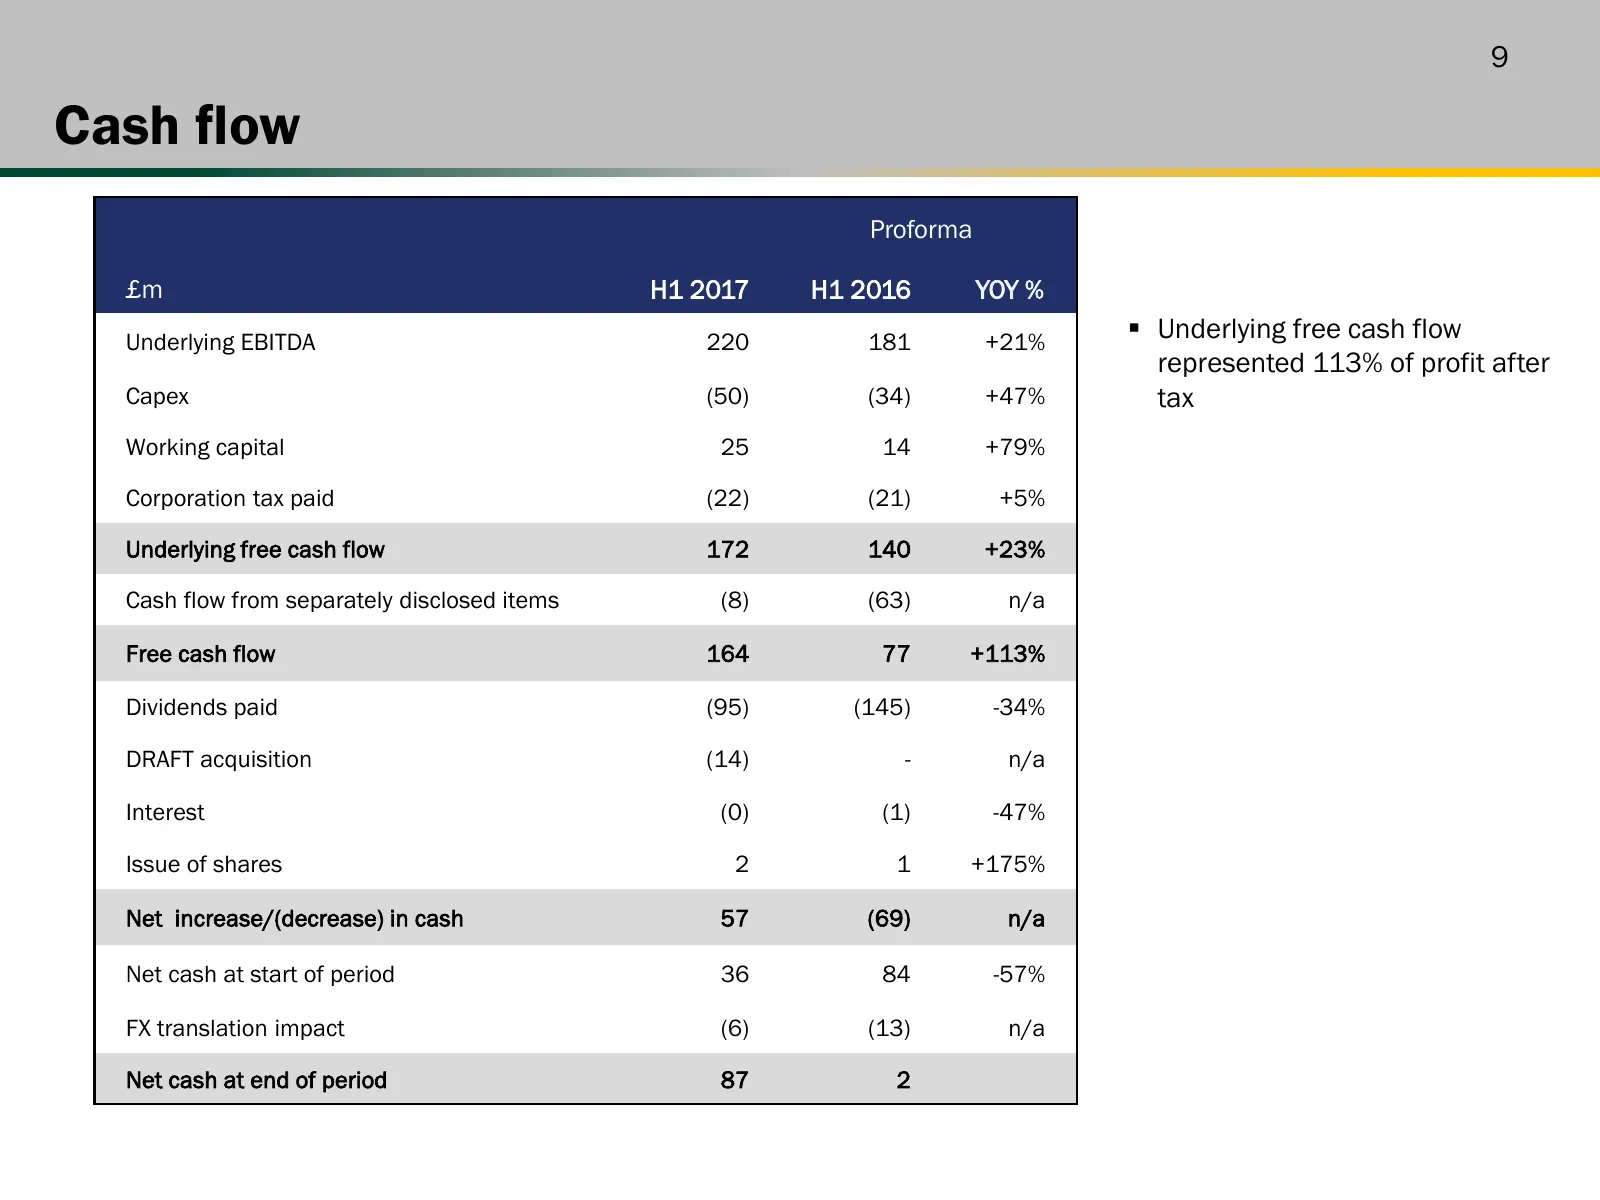
9 Cash flow Proforma £m H1 2017 H1 2016 YOY % Underlying EBITDA 220 181 +21% Underlying free cash flow represented 113% of profit after Capex (50) (34) +47% tax Working capital 25 14 +79% Corporation tax paid (22) (21) +5% Underlying free cash flow 172 140 +23% Cash flow from separately disclosed
Slide 10: Financial guidance & regulatory update
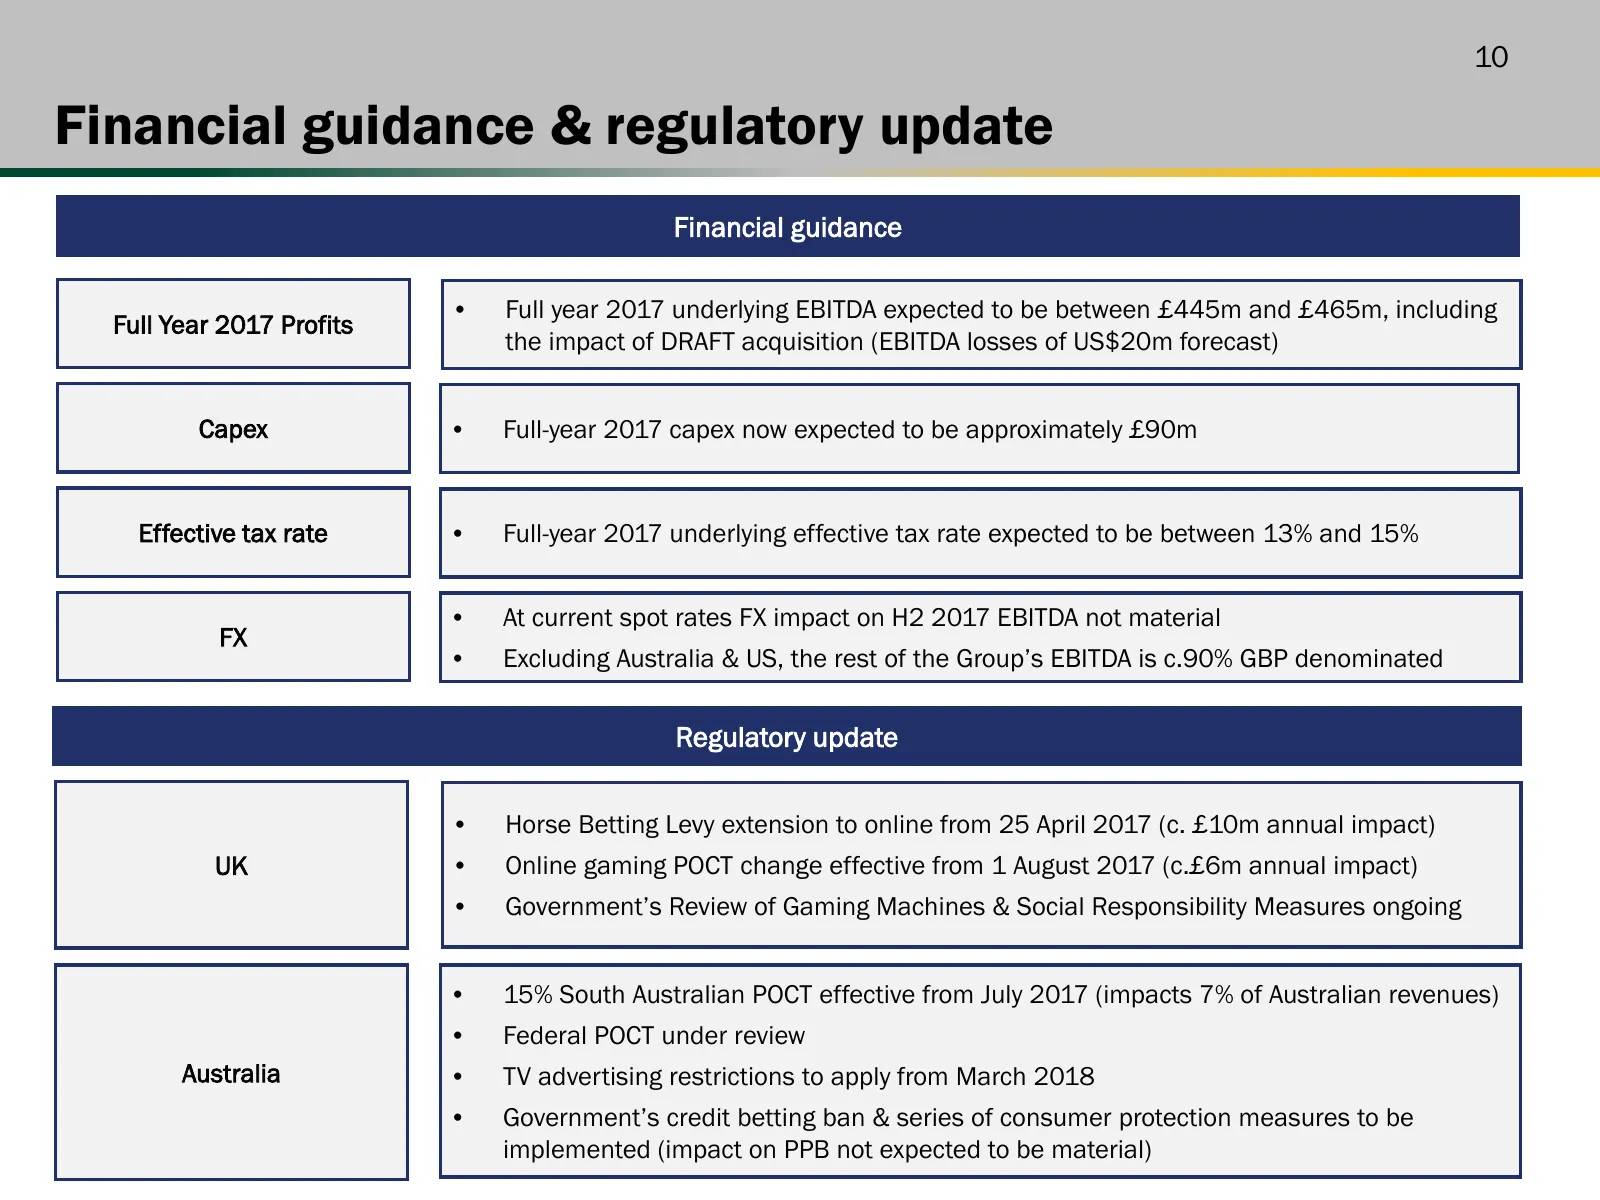
10 Financial guidance & regulatory update Financial guidance • Full year 2017 underlying EBITDA expected to be between £445m and £465m, including Full Year 2017 Profits the impact of DRAFT acquisition (EBITDA losses of US$20m forecast) Capex • Full-year 2017 capex now expected to be approximately £9

Slide 11: Business Review
Business Review
Slide 12: Strong foundations, compounded by investment, drives growth & returns
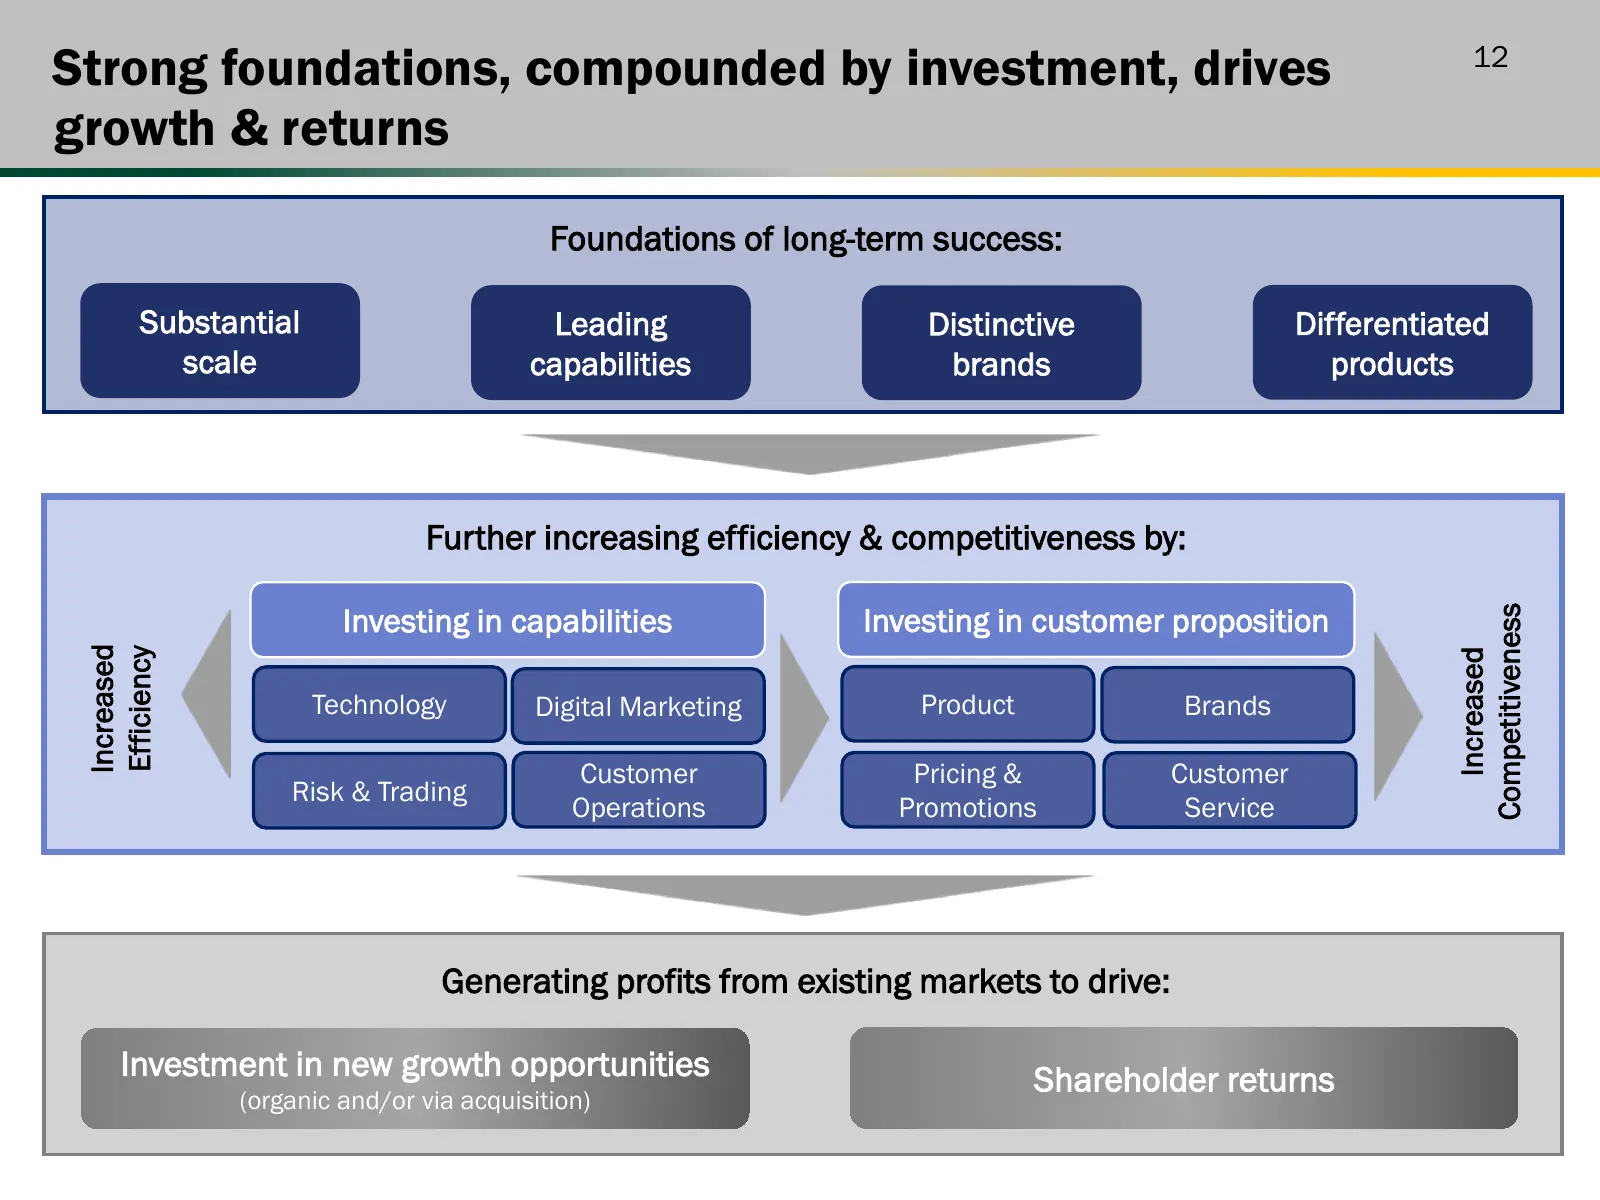
Strong foundations, compounded by investment, drives 12 growth & returns Foundations of long-term success: Substantial Leading Distinctive Differentiated scale capabilities brands products Further increasing efficiency & competitiveness by: Investing in capabilities Investing in customer proposition
Slide 13: Integrated European online platform on track for Q4 completion
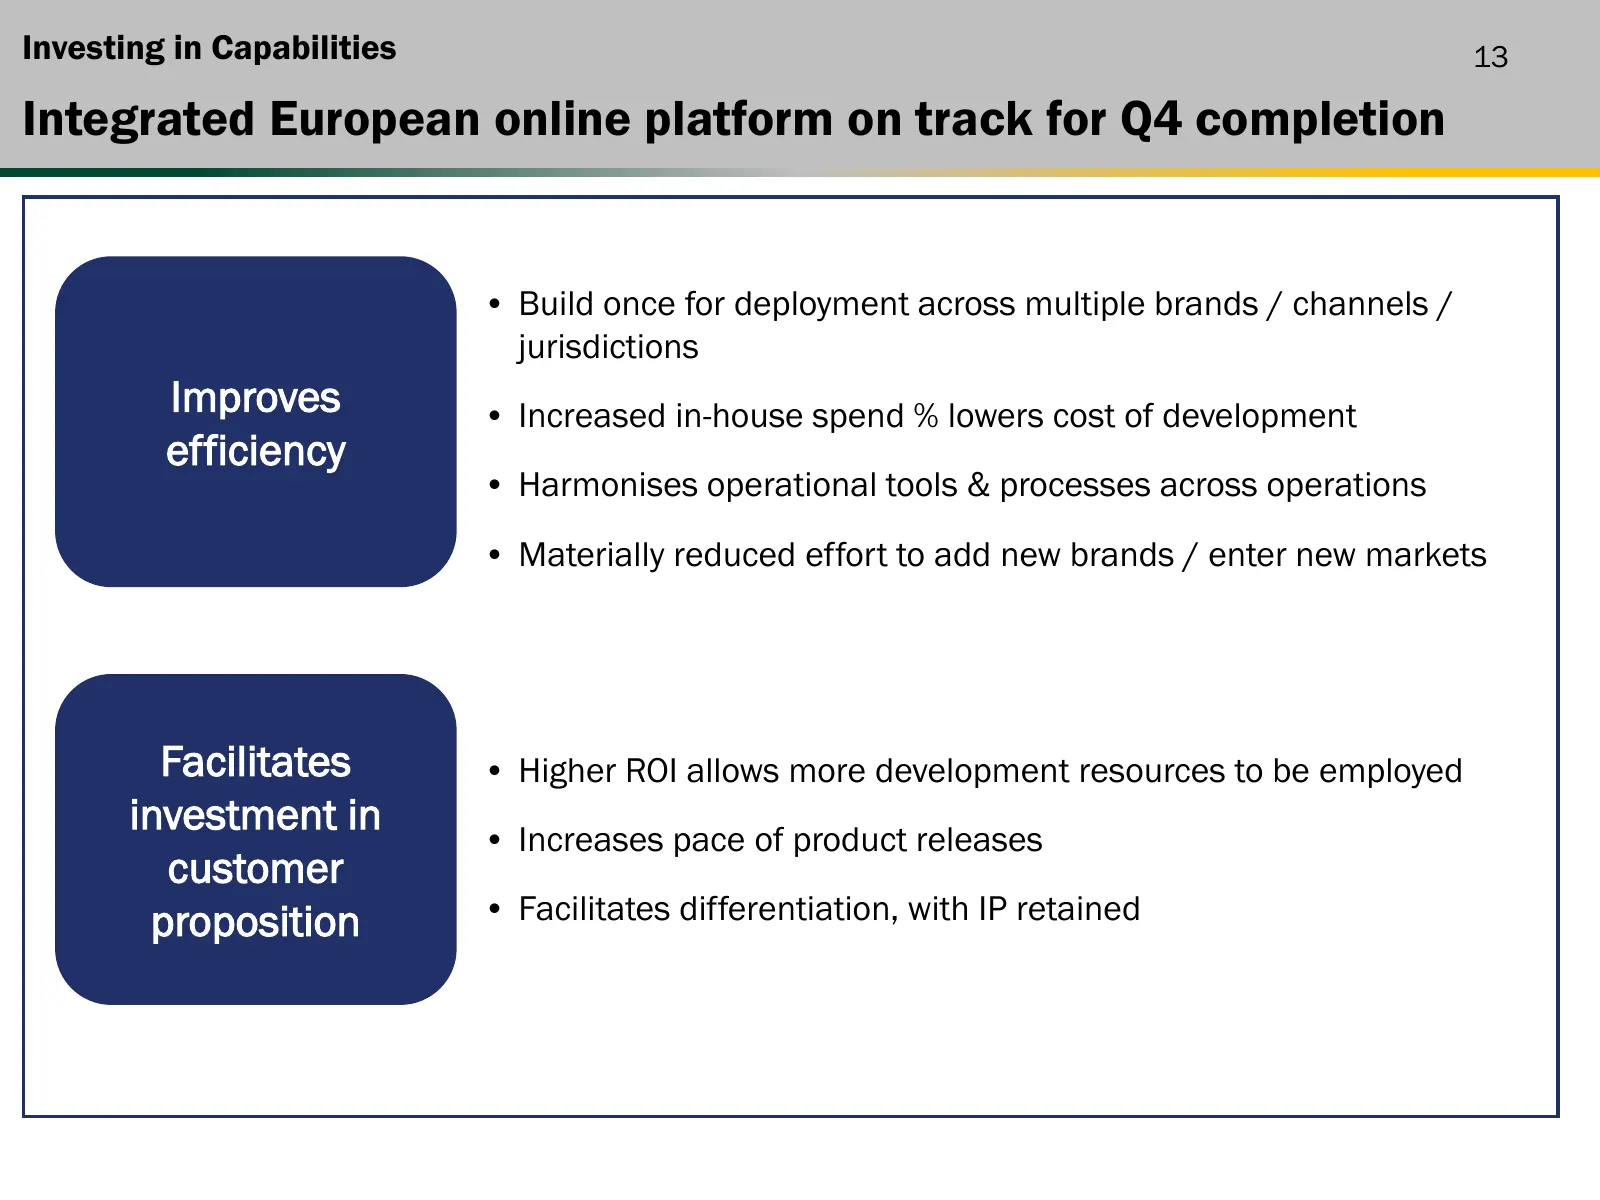
Investing in Capabilities 13 Integrated European online platform on track for Q4 completion • Build once for deployment across multiple brands / channels / jurisdictions Improves • Increased in-house spend % lowers cost of development efficiency • Harmonises operational tools & processes across oper
Slide 14: Digital Marketing: innovation delivering efficiency, reach & relevance
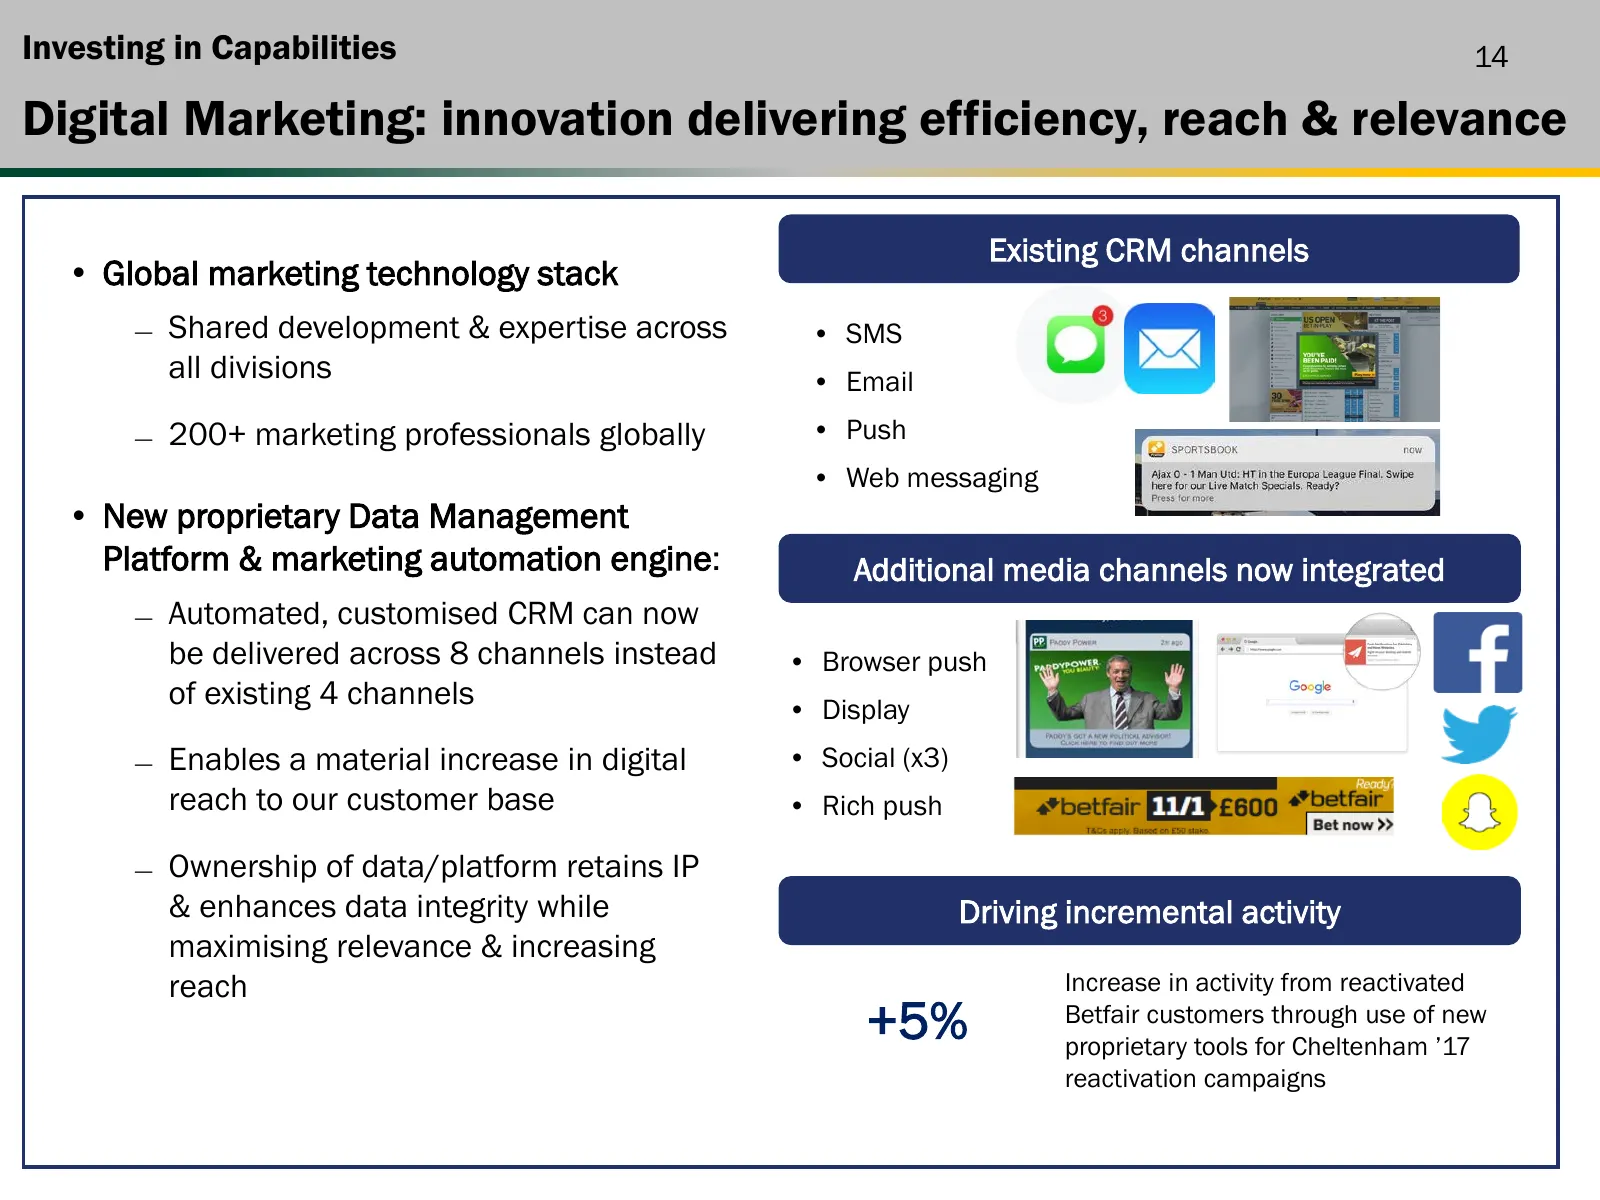
Investing in Capabilities 14 Digital Marketing: innovation delivering efficiency, reach & relevance Existing CRM channels • Global marketing technology stack ― Shared development & expertise across • SMS all divisions • Email ― 200+ marketing professionals globally • Push • Web messaging • New propr
Slide 15: Digital Marketing: innovation delivering efficiency, reach & relevance
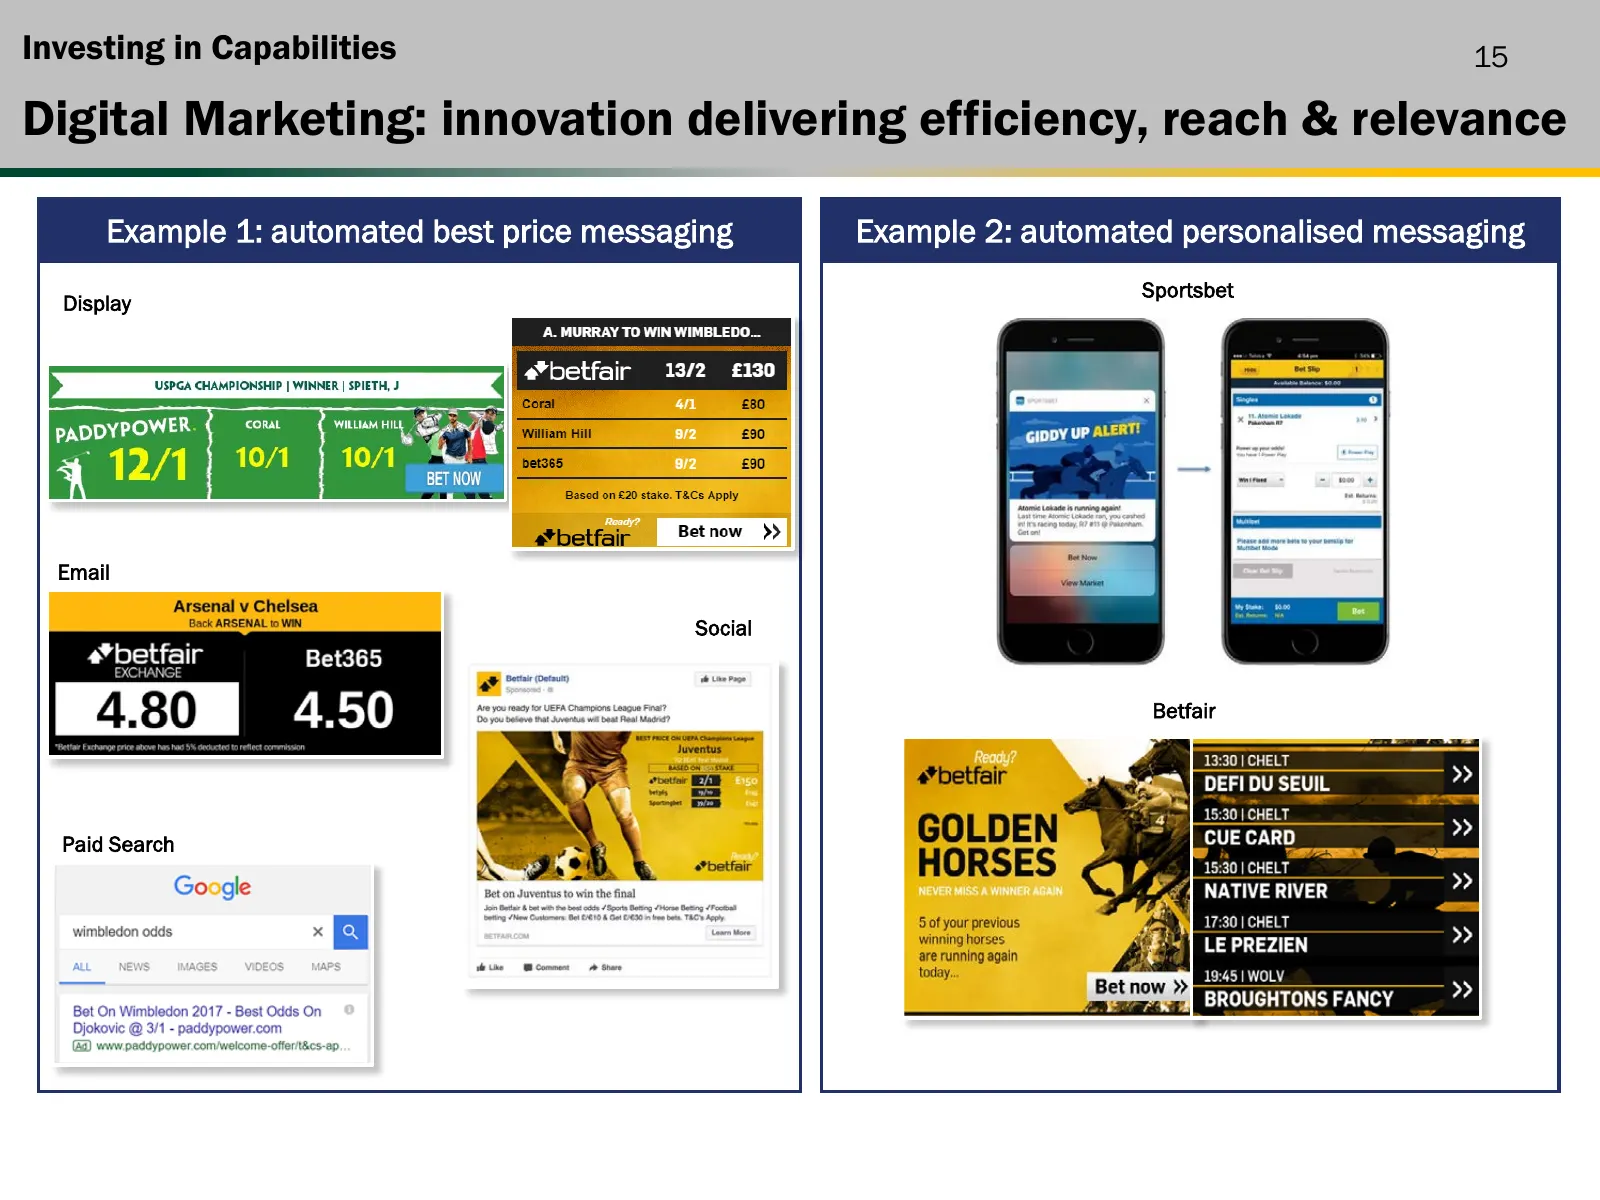
Investing in Capabilities 15 Digital Marketing: innovation delivering efficiency, reach & relevance Example 1: automated best price messaging Example 2: automated personalised messaging Sportsbet Display Email Social Betfair Paid Search
Slide 16: Risk & Trading: investment improving performance & efficiency
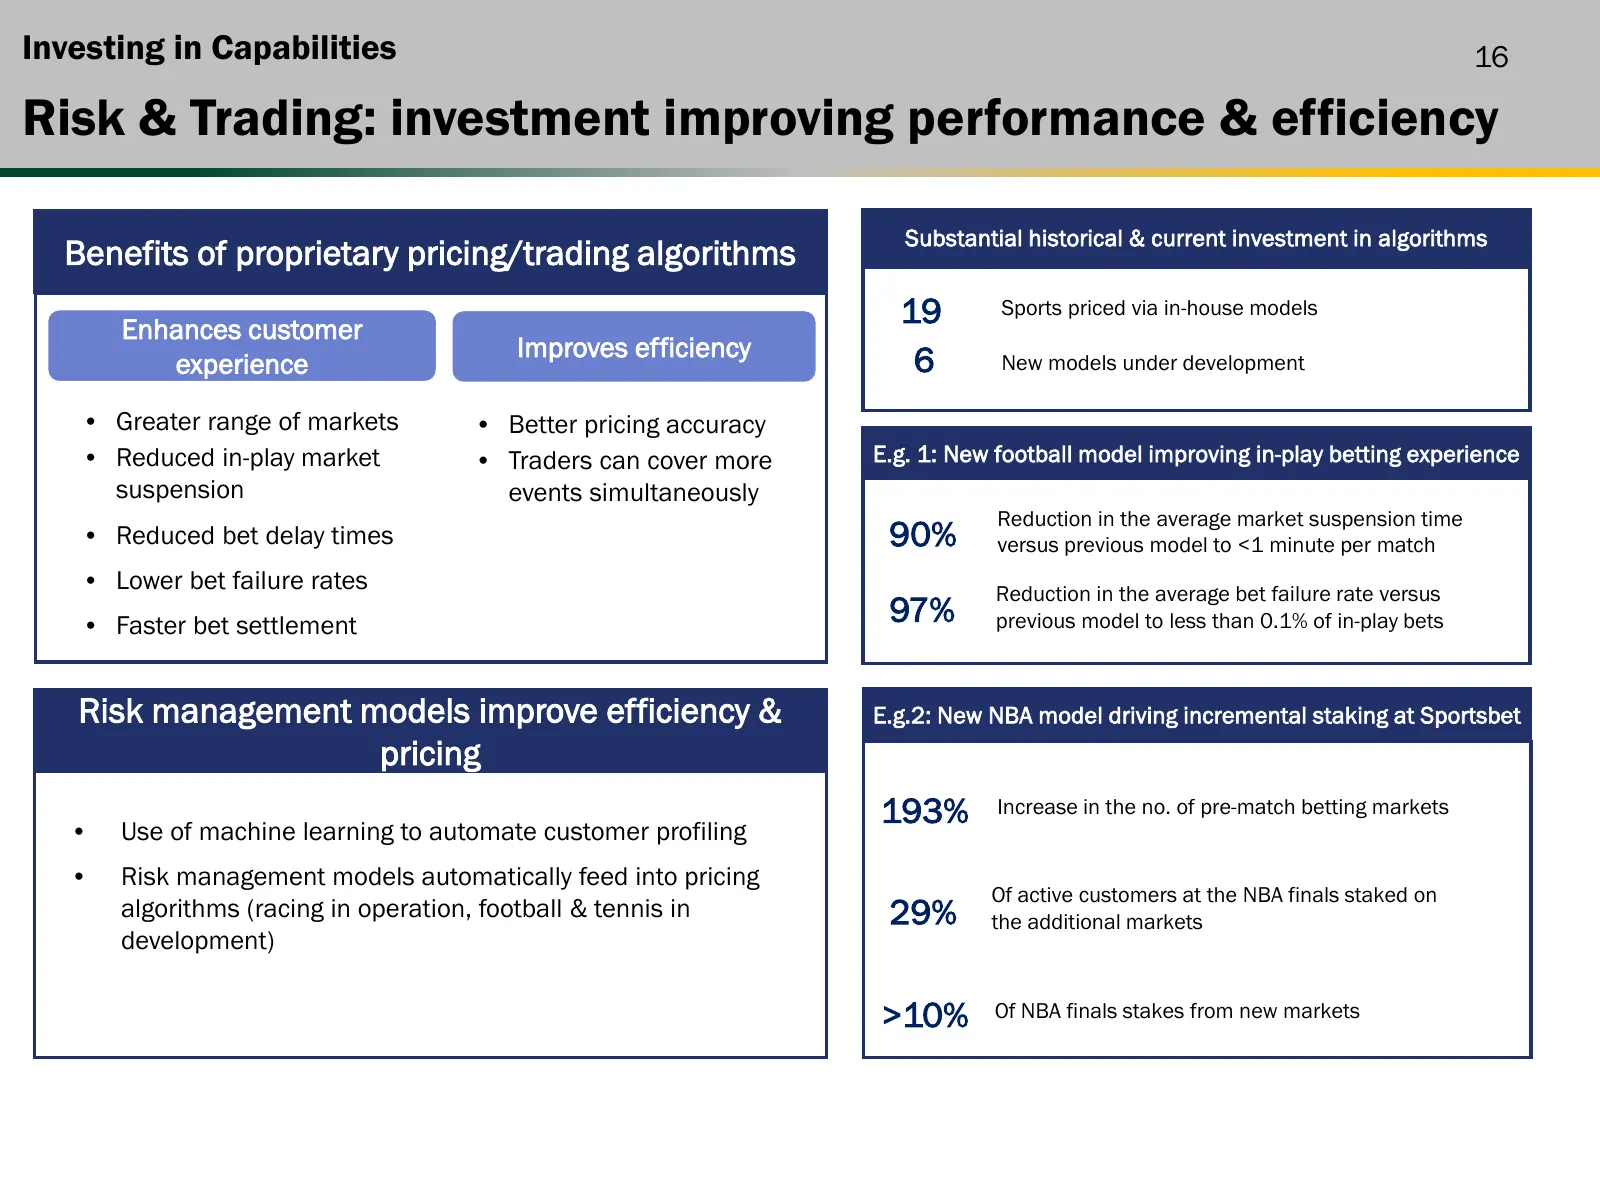
Investing in Capabilities 16 Risk & Trading: investment improving performance & efficiency Substantial historical & current investment in algorithms Benefits of proprietary pricing/trading algorithms Enhances customer 19 Sports priced via in-house models Improves efficiency experience 6 New models u
Slide 17: Risk & Trading: proprietary algorithms facilitating innovation
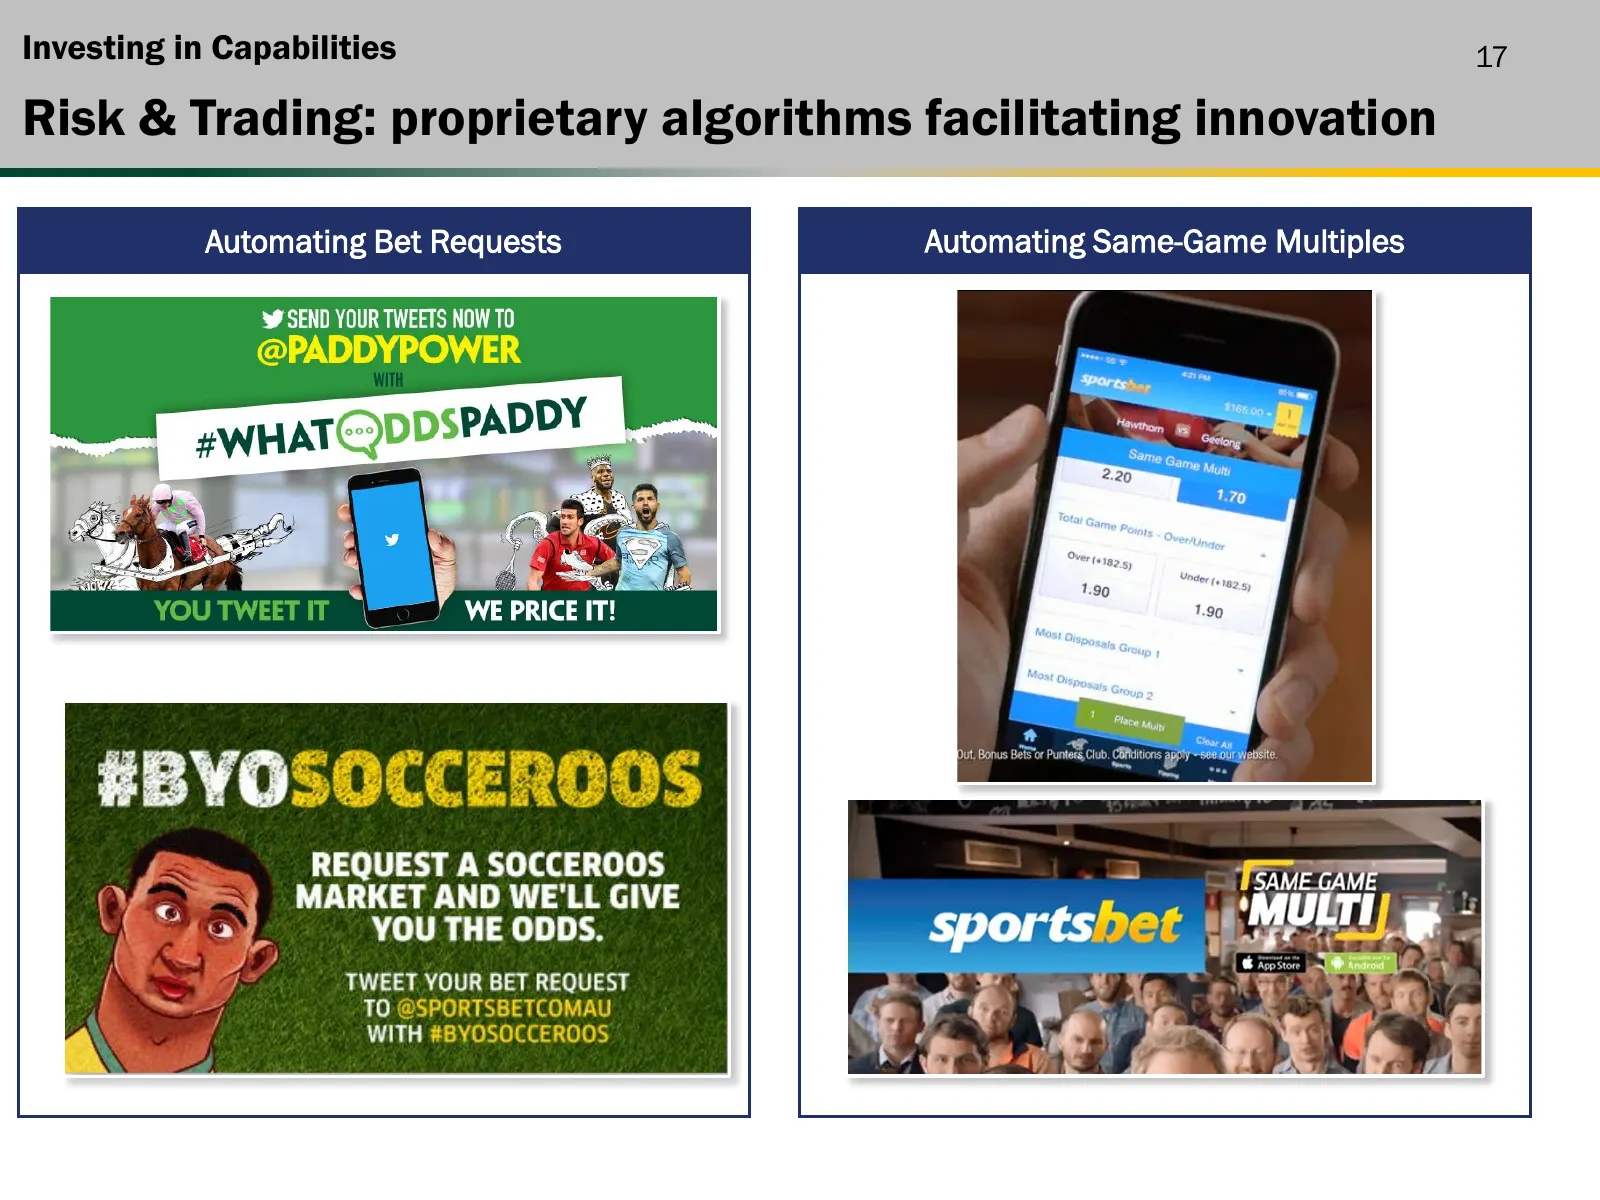
Investing in Capabilities 17 Risk & Trading: proprietary algorithms facilitating innovation Automating Bet Requests Automating Same-Game Multiples
Slide 18: Product: impact of technology integration
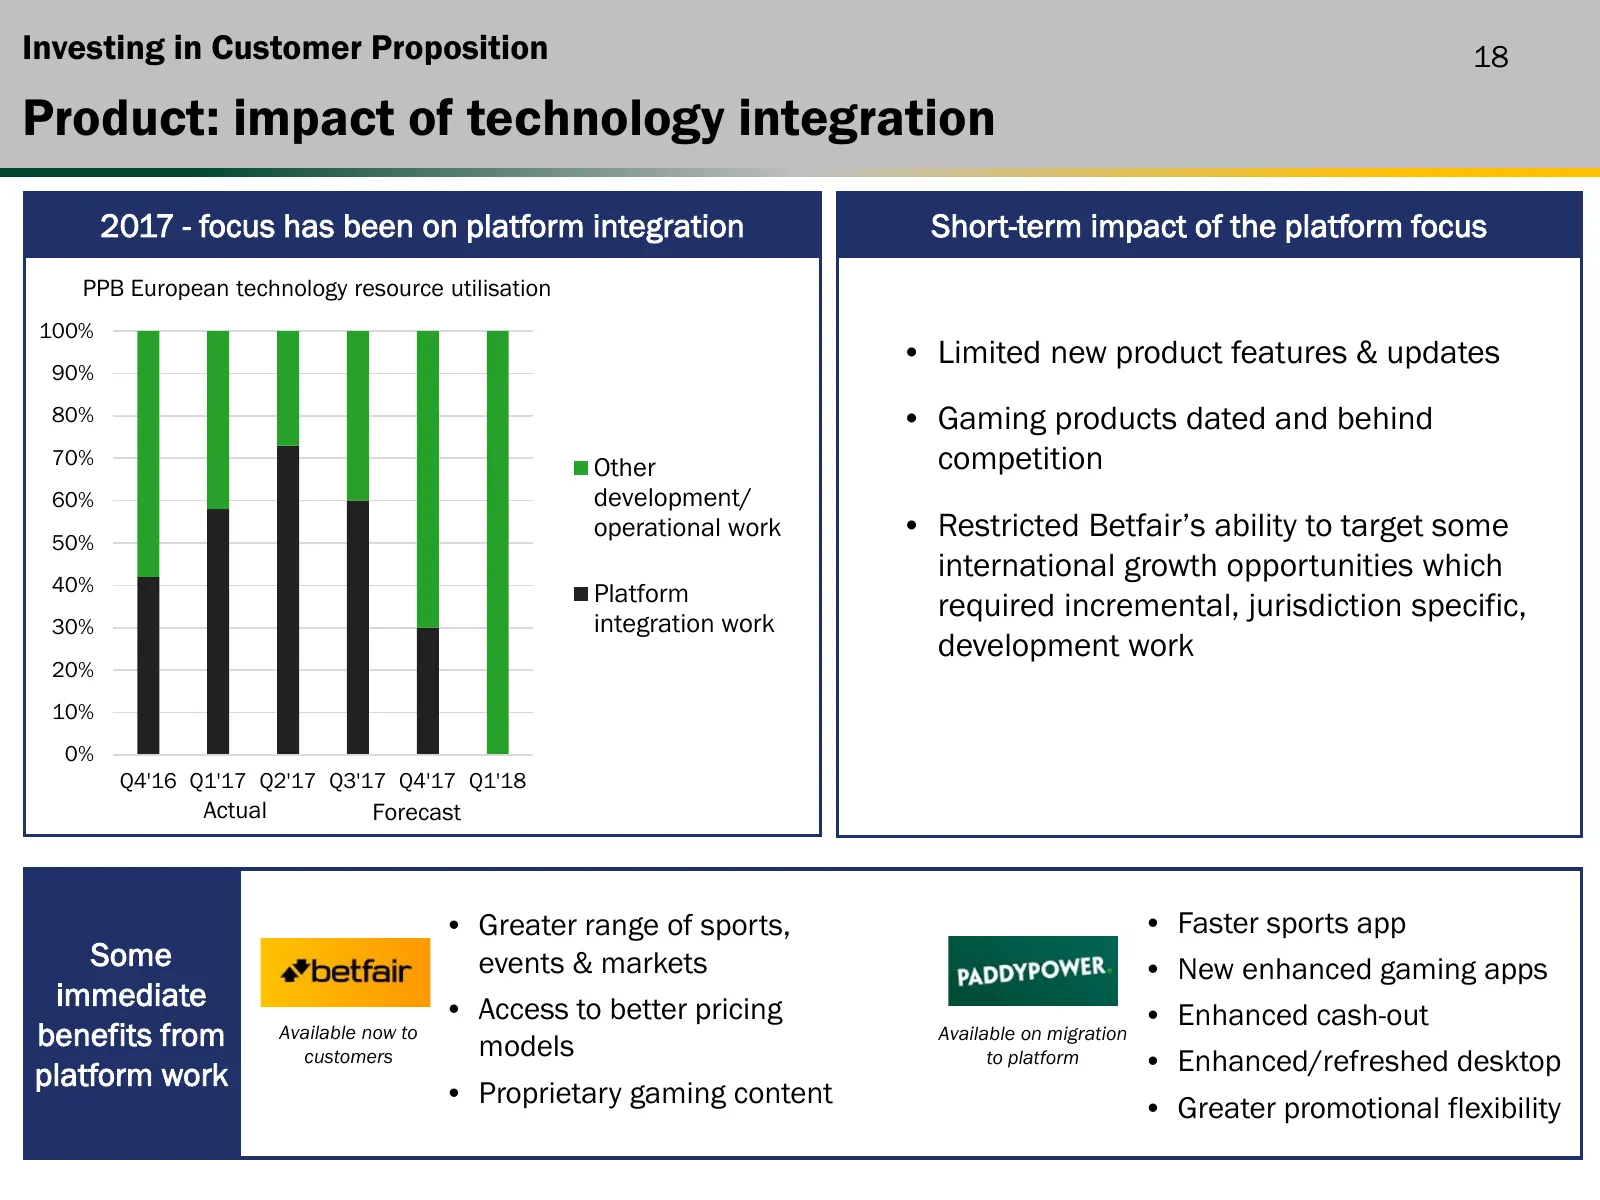
Investing in Customer Proposition 18 Product: impact of technology integration 2017 - focus has been on platform integration Short-term impact of the platform focus PPB European technology resource utilisation 100% • Limited new product features & updates 90% 80% • Gaming products dated and behind 7
Slide 19: Product: recent updates
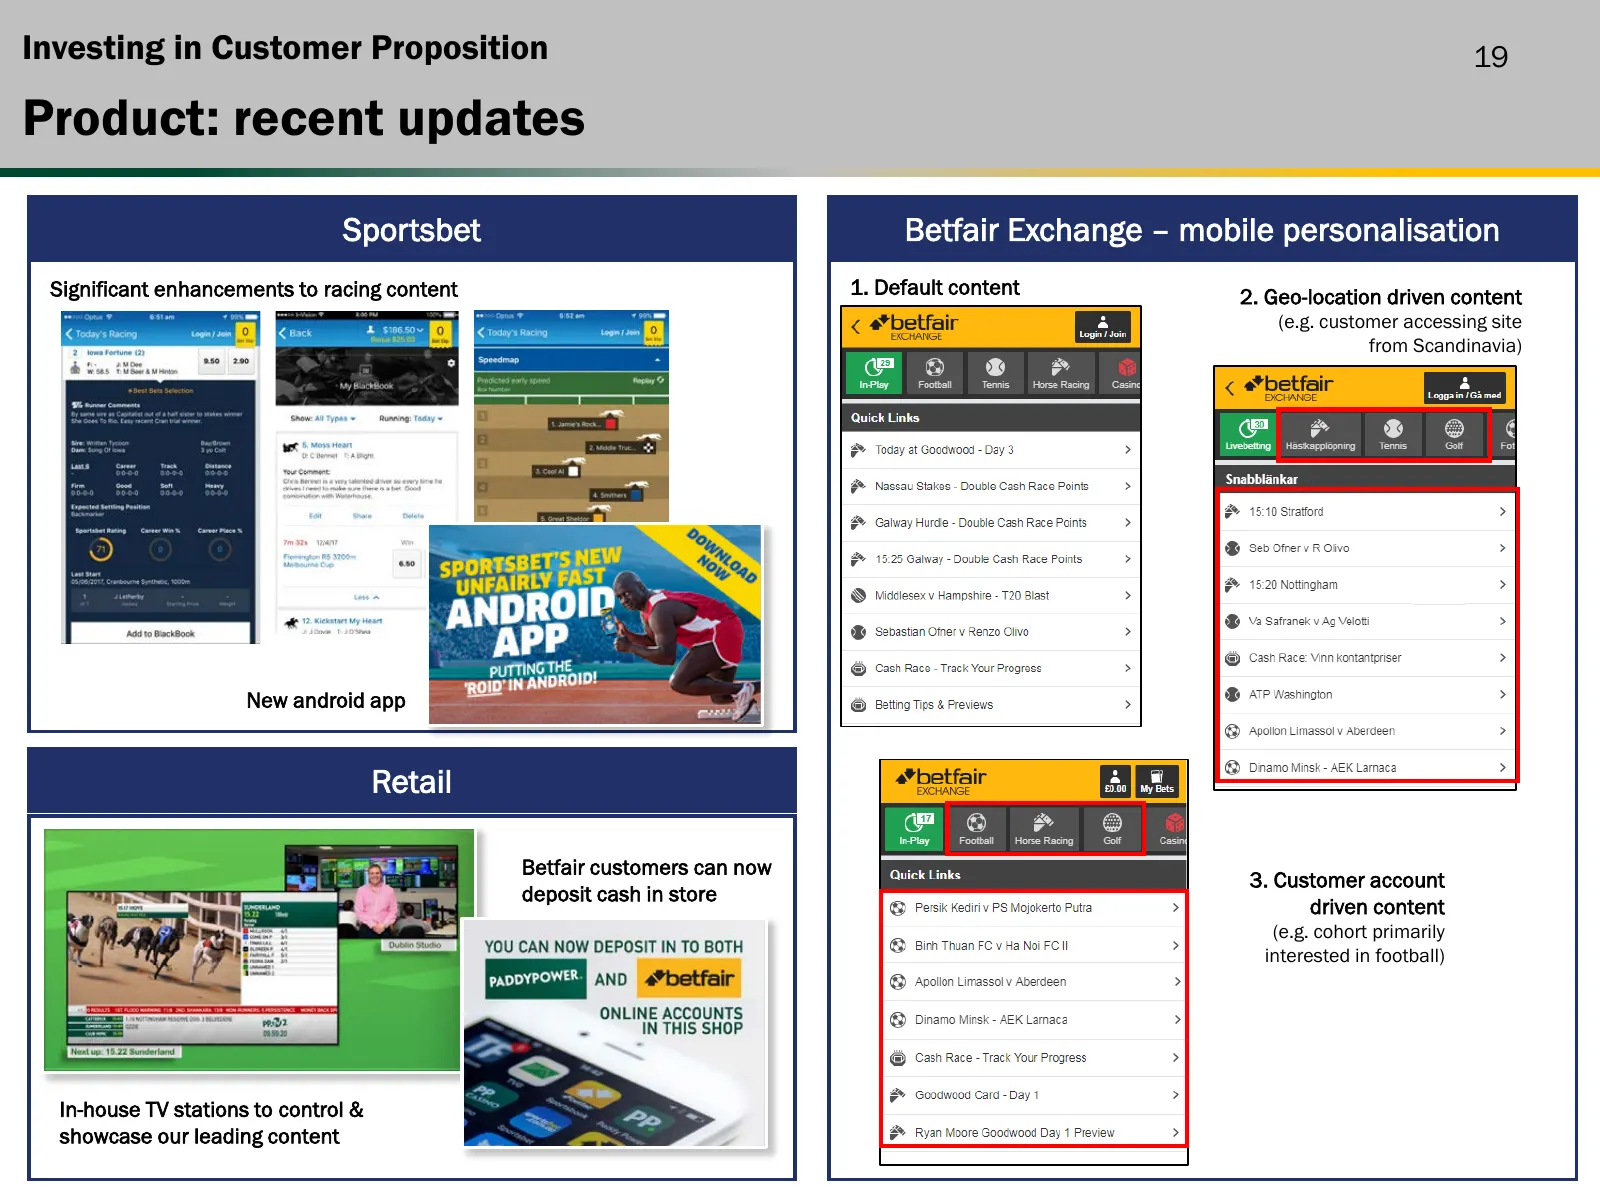
Investing in Customer Proposition 19 Product: recent updates Sportsbet Betfair Exchange – mobile personalisation Significant enhancements to racing content 1. Default content 2. Geo-location driven content (e.g. customer accessing site from Scandinavia) New android app Retail Betfair customers can n
Slide 20: Pricing & Promotions: c.£30m of extra value in H1
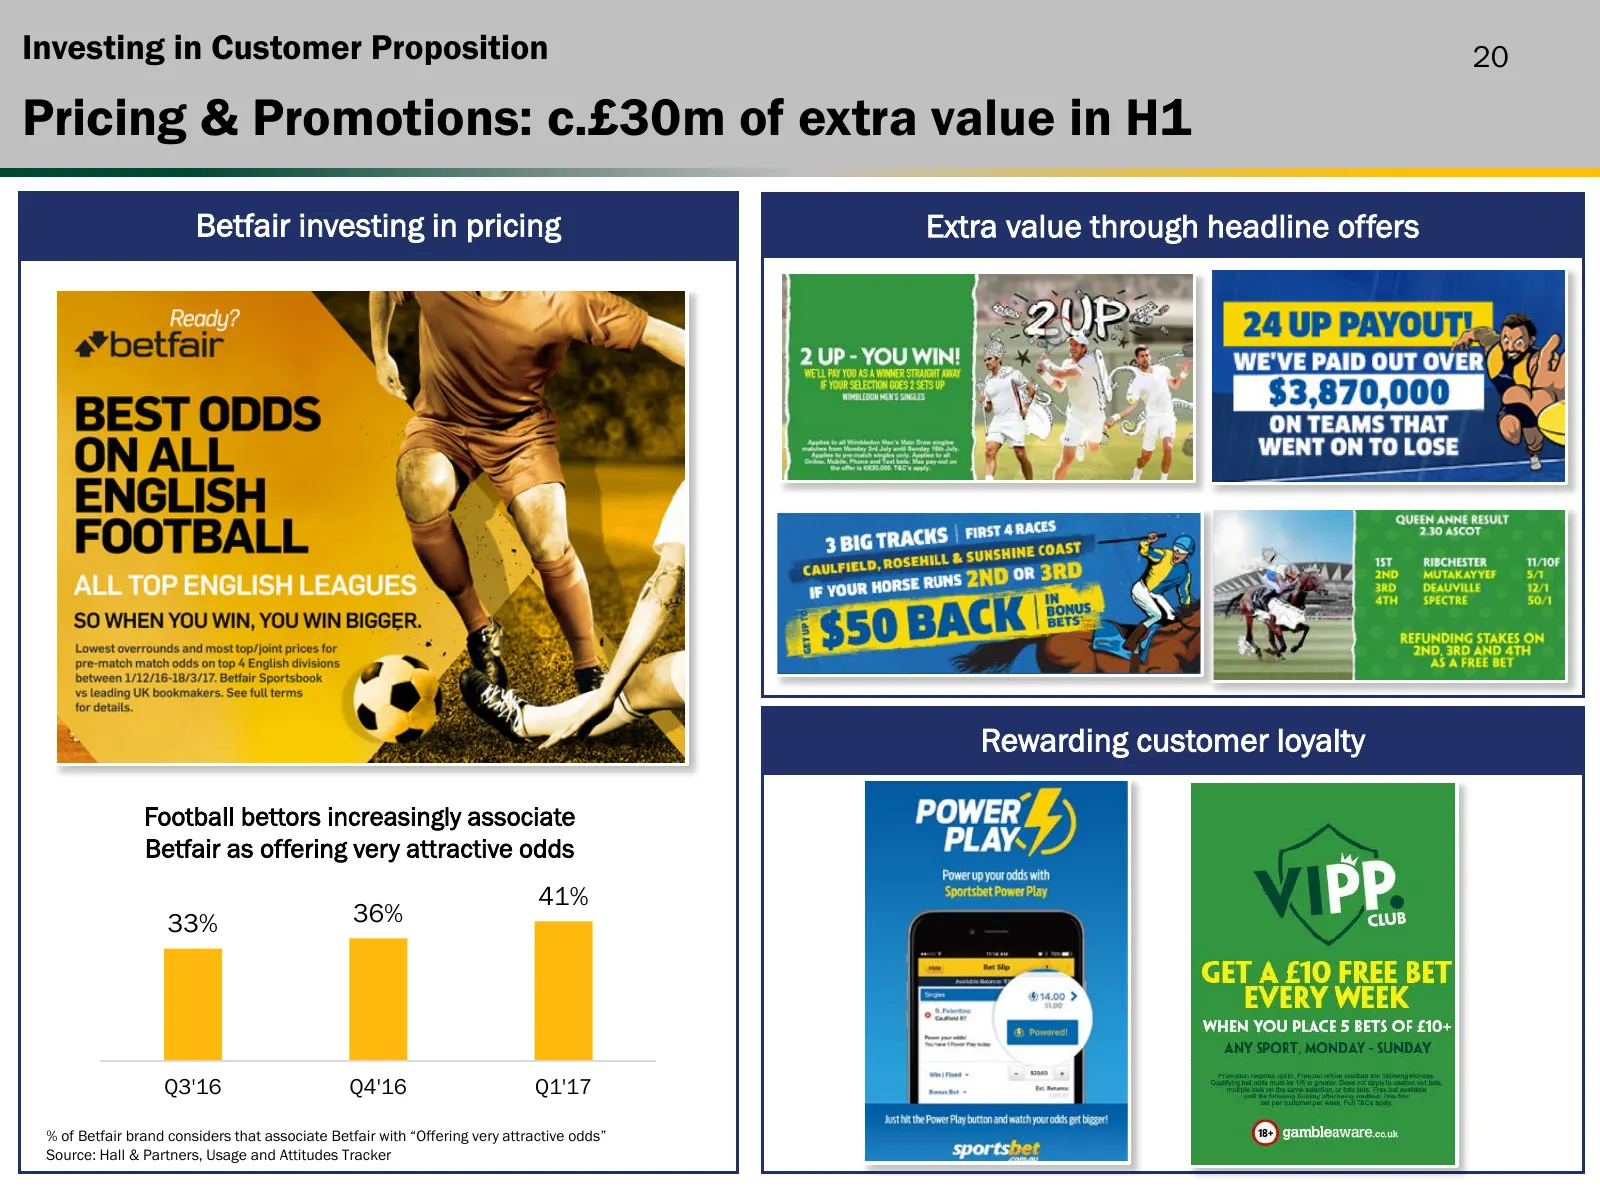
Investing in Customer Proposition 20 Pricing & Promotions: c.£30m of extra value in H1 Betfair investing in pricing Extra value through headline offers Rewarding customer loyalty Football bettors increasingly associate Betfair as offering very attractive odds 41% 33% 36% Q3'16 Q4'16 Q1'17 % of Betfa
Slide 21: Brand: investing in TV & digital channels
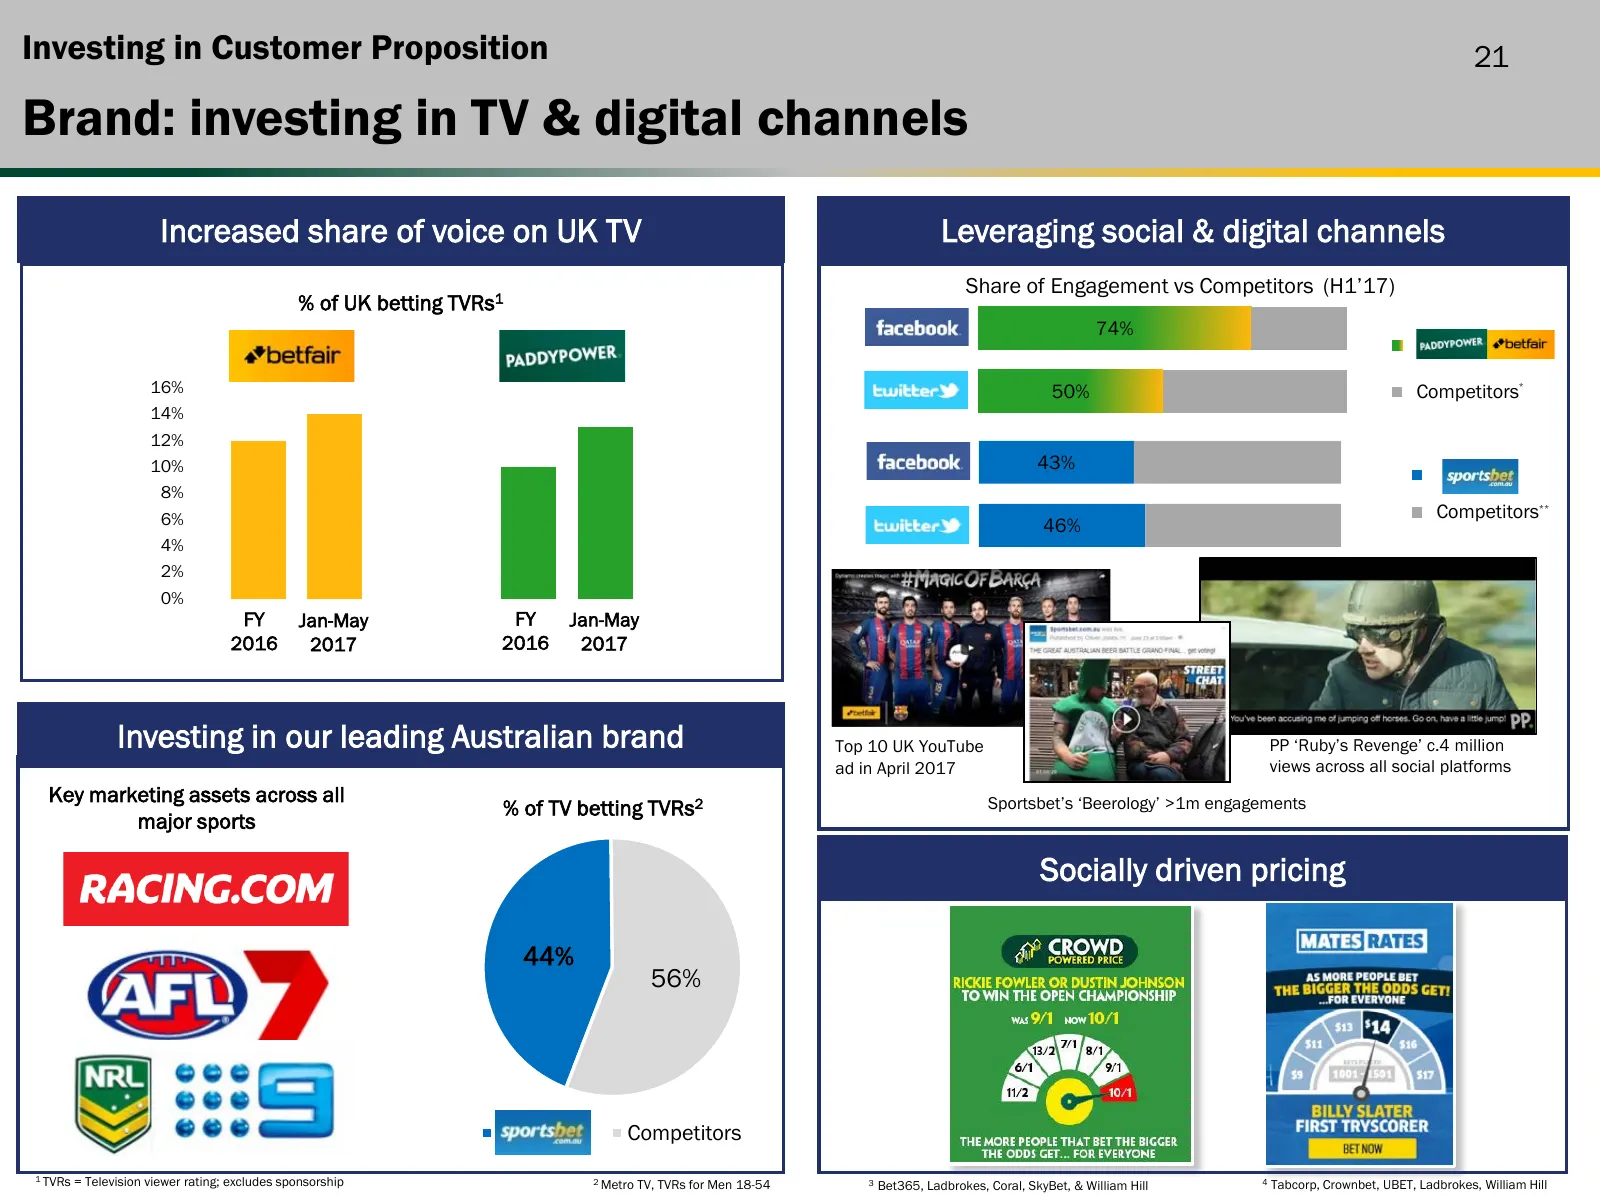
Investing in Customer Proposition 21 Brand: investing in TV & digital channels Increased share of voice on UK TV Leveraging social & digital channels Share of Engagement vs Competitors (H1’17) % of UK betting TVRs1 74% ' 16% 50% Competitors* 14% 12% 10% 43% ' 8% 6% Competitors** 46% 4% 2% 0% FY Jan-
Slide 22: New growth opportunities: DRAFT acquisition
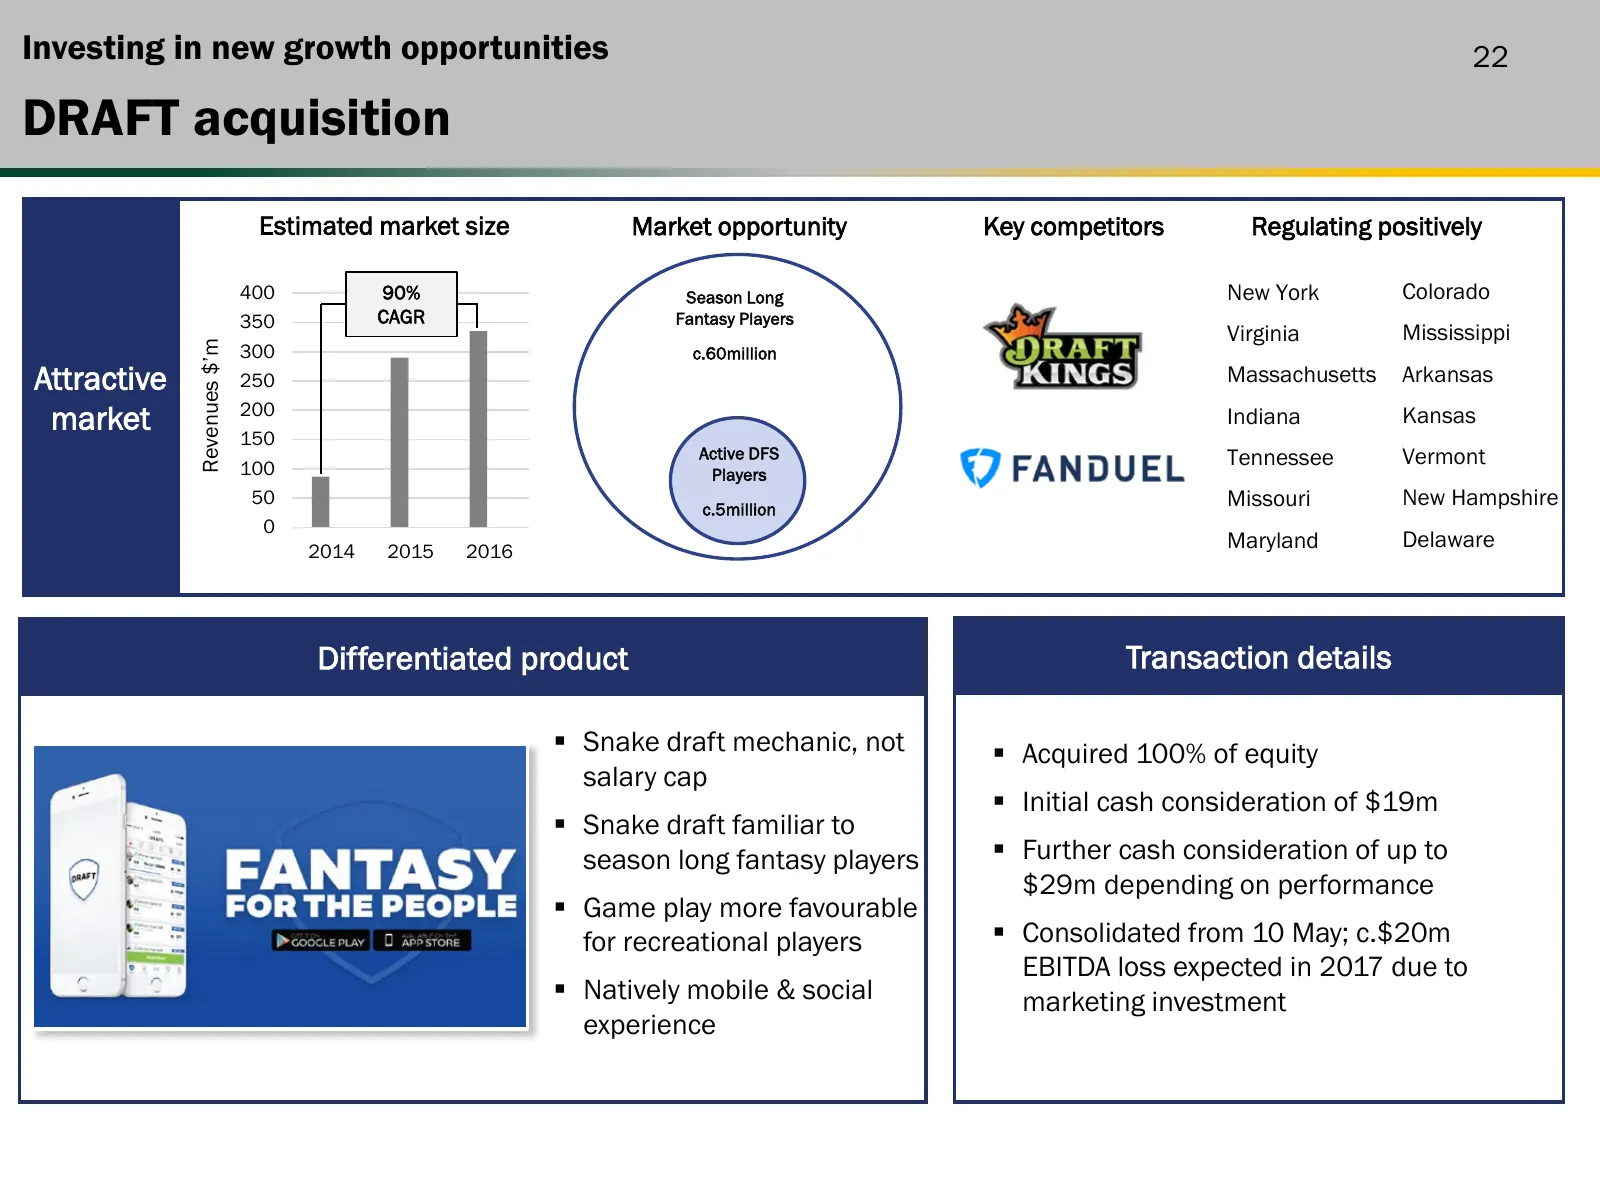
Investing in new growth opportunities 22 DRAFT acquisition Estimated market size Market opportunity Key competitors Regulating positively 400 90% Season Long New York Colorado 350 CAGR Fantasy Players Virginia Mississippi Revenues $’m 300 c.60million Attractive 250 Massachusetts Arkansas market 200
Slide 23: Well positioned for sustainable, profitable growth
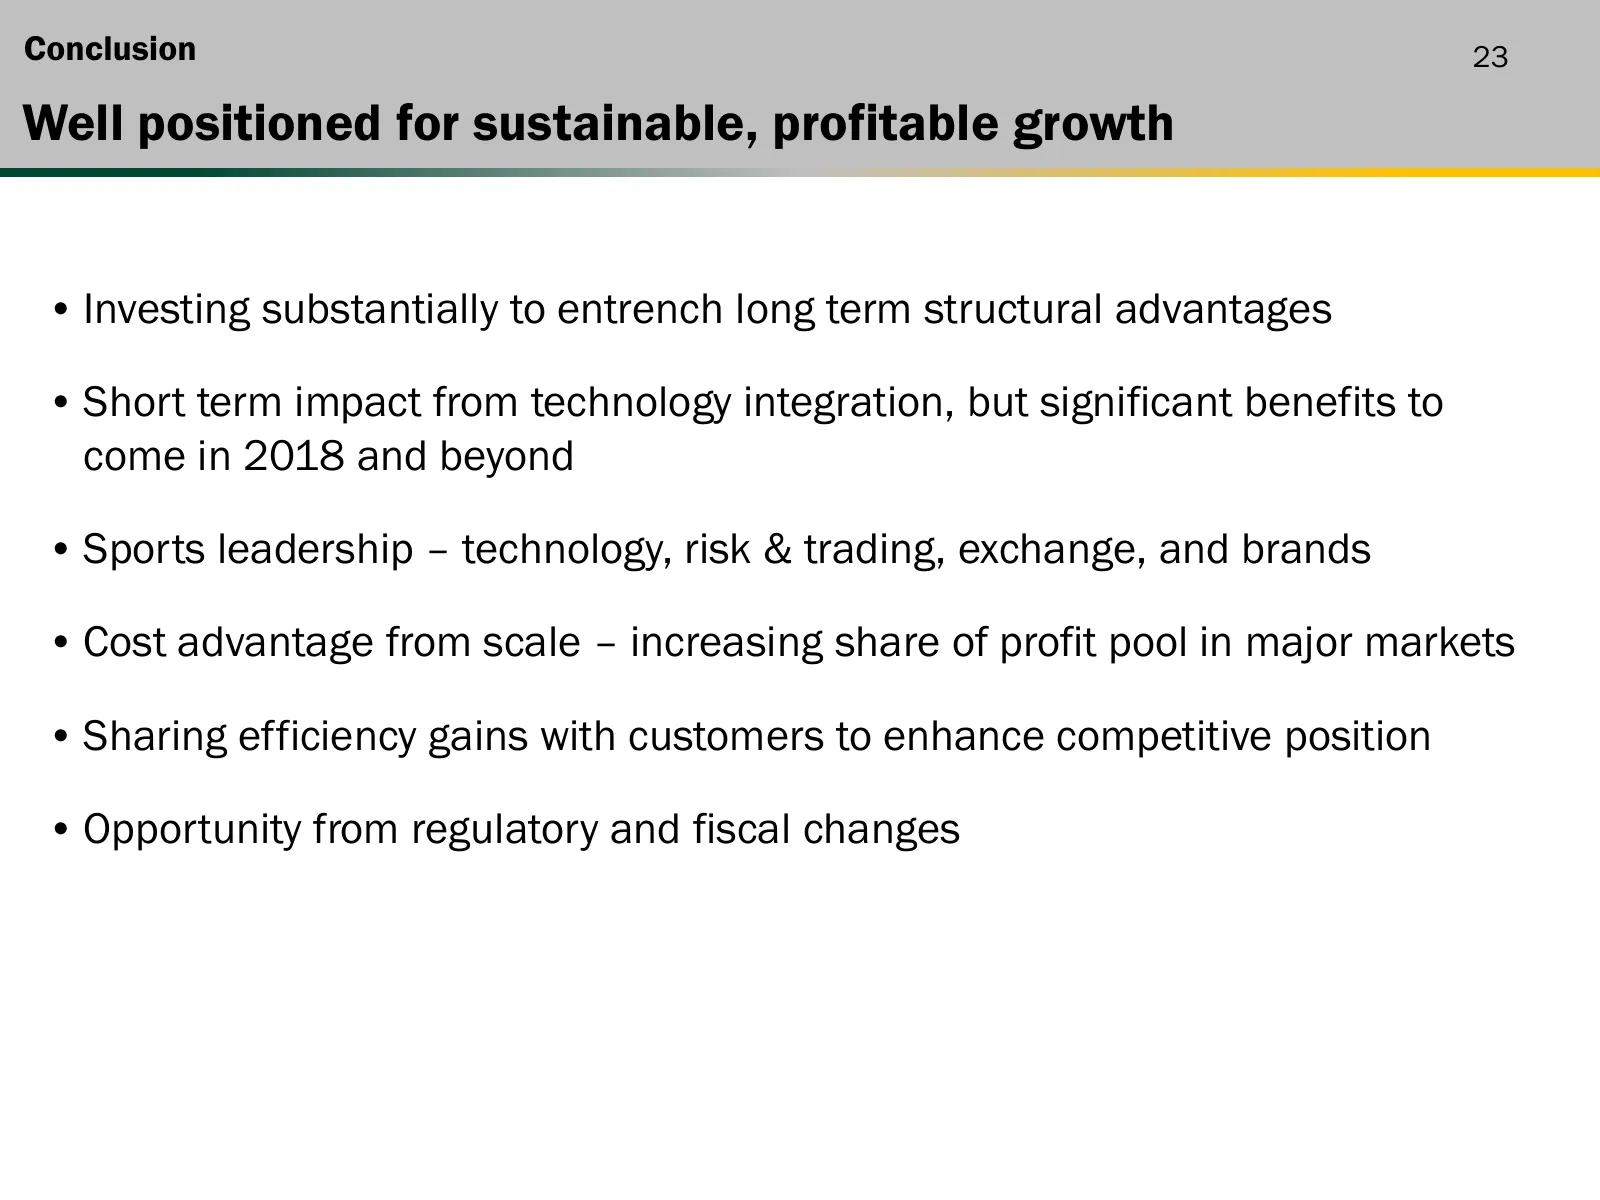
Conclusion 23 Well positioned for sustainable, profitable growth • Investing substantially to entrench long term structural advantages • Short term impact from technology integration, but significant benefits to come in 2018 and beyond • Sports leadership – technology, risk & trading, exchange, and

Slide 24: Q&A
Q&A

Slide 25: Appendix
Appendix
Slide 26: Divisional overview
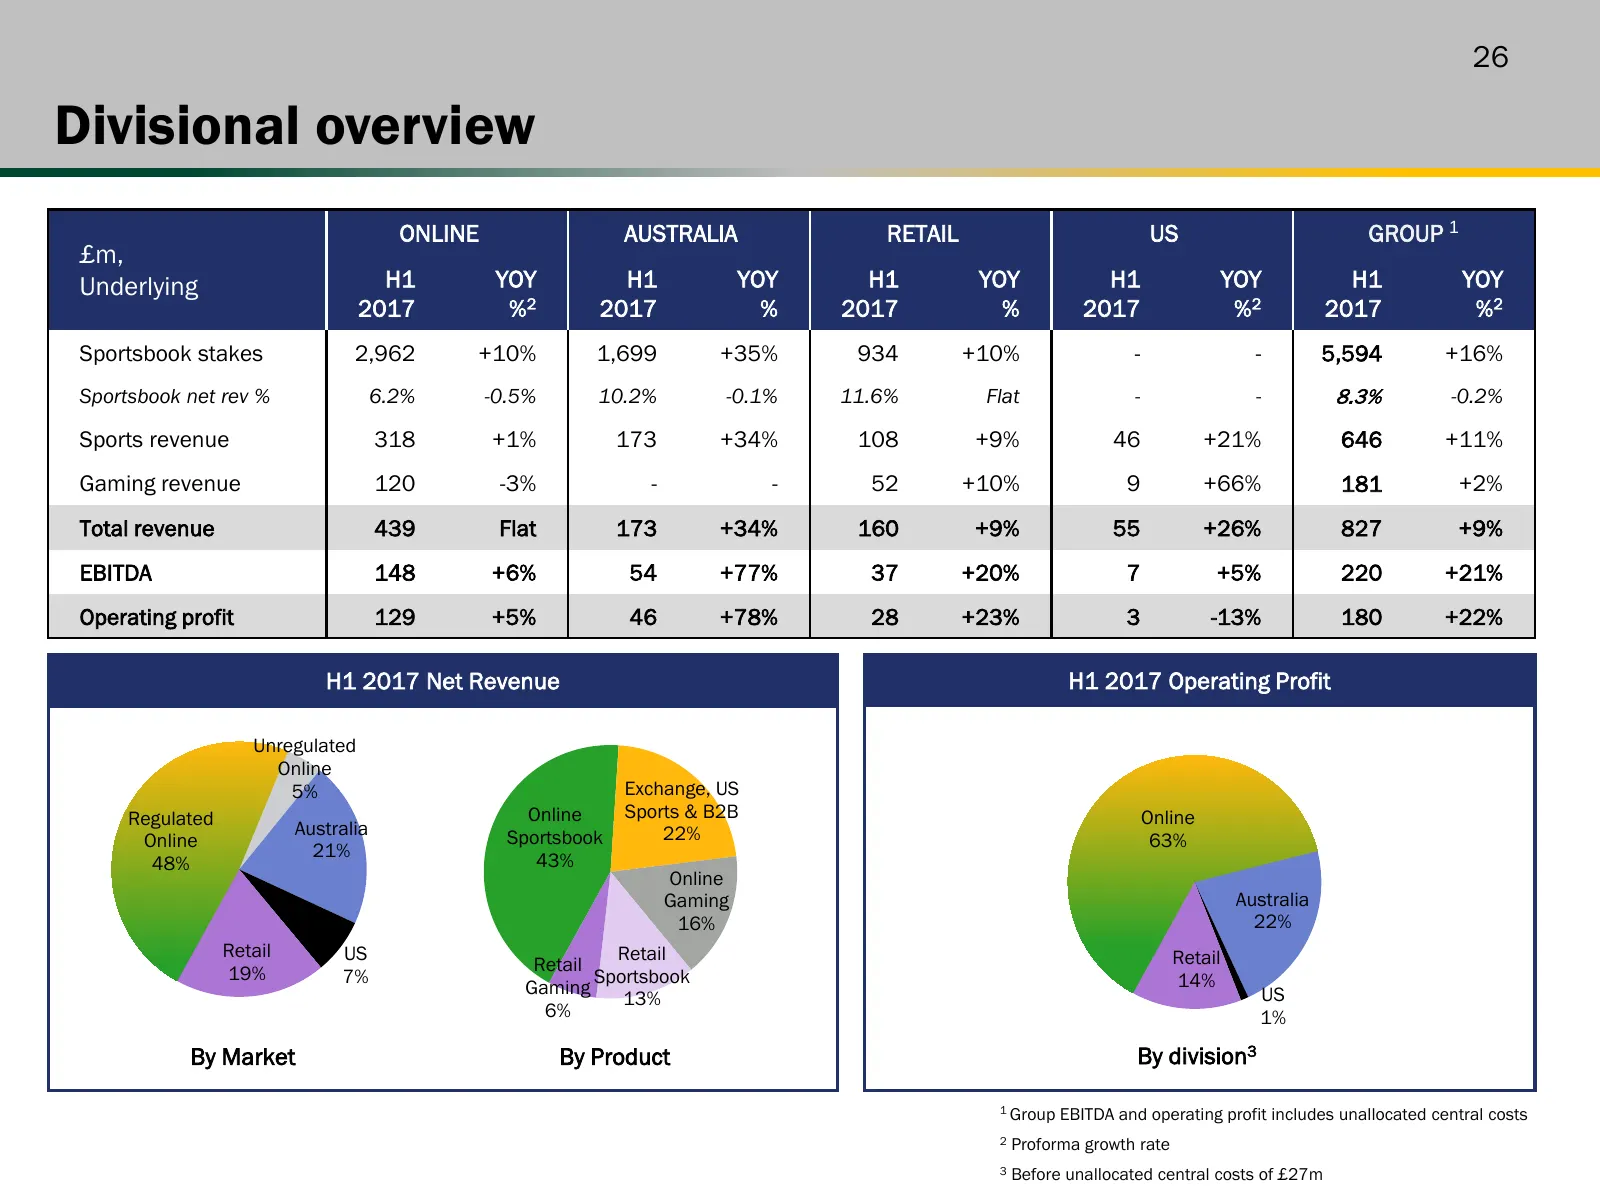
26 Divisional overview ONLINE AUSTRALIA RETAIL US GROUP 1 £m, Underlying H1 YOY H1 YOY H1 YOY H1 YOY H1 YOY 2017 %2 2017 % 2017 % 2017 %2 2017 %2 Sportsbook stakes 2,962 +10% 1,699 +35% 934 +10% - - 5,594 +16% Sportsbook net rev % 6.2% -0.5% 10.2% -0.1% 11.6% Flat - - 8.3% -0.2% Sports revenue 318 +
Slide 27: Separately disclosed items
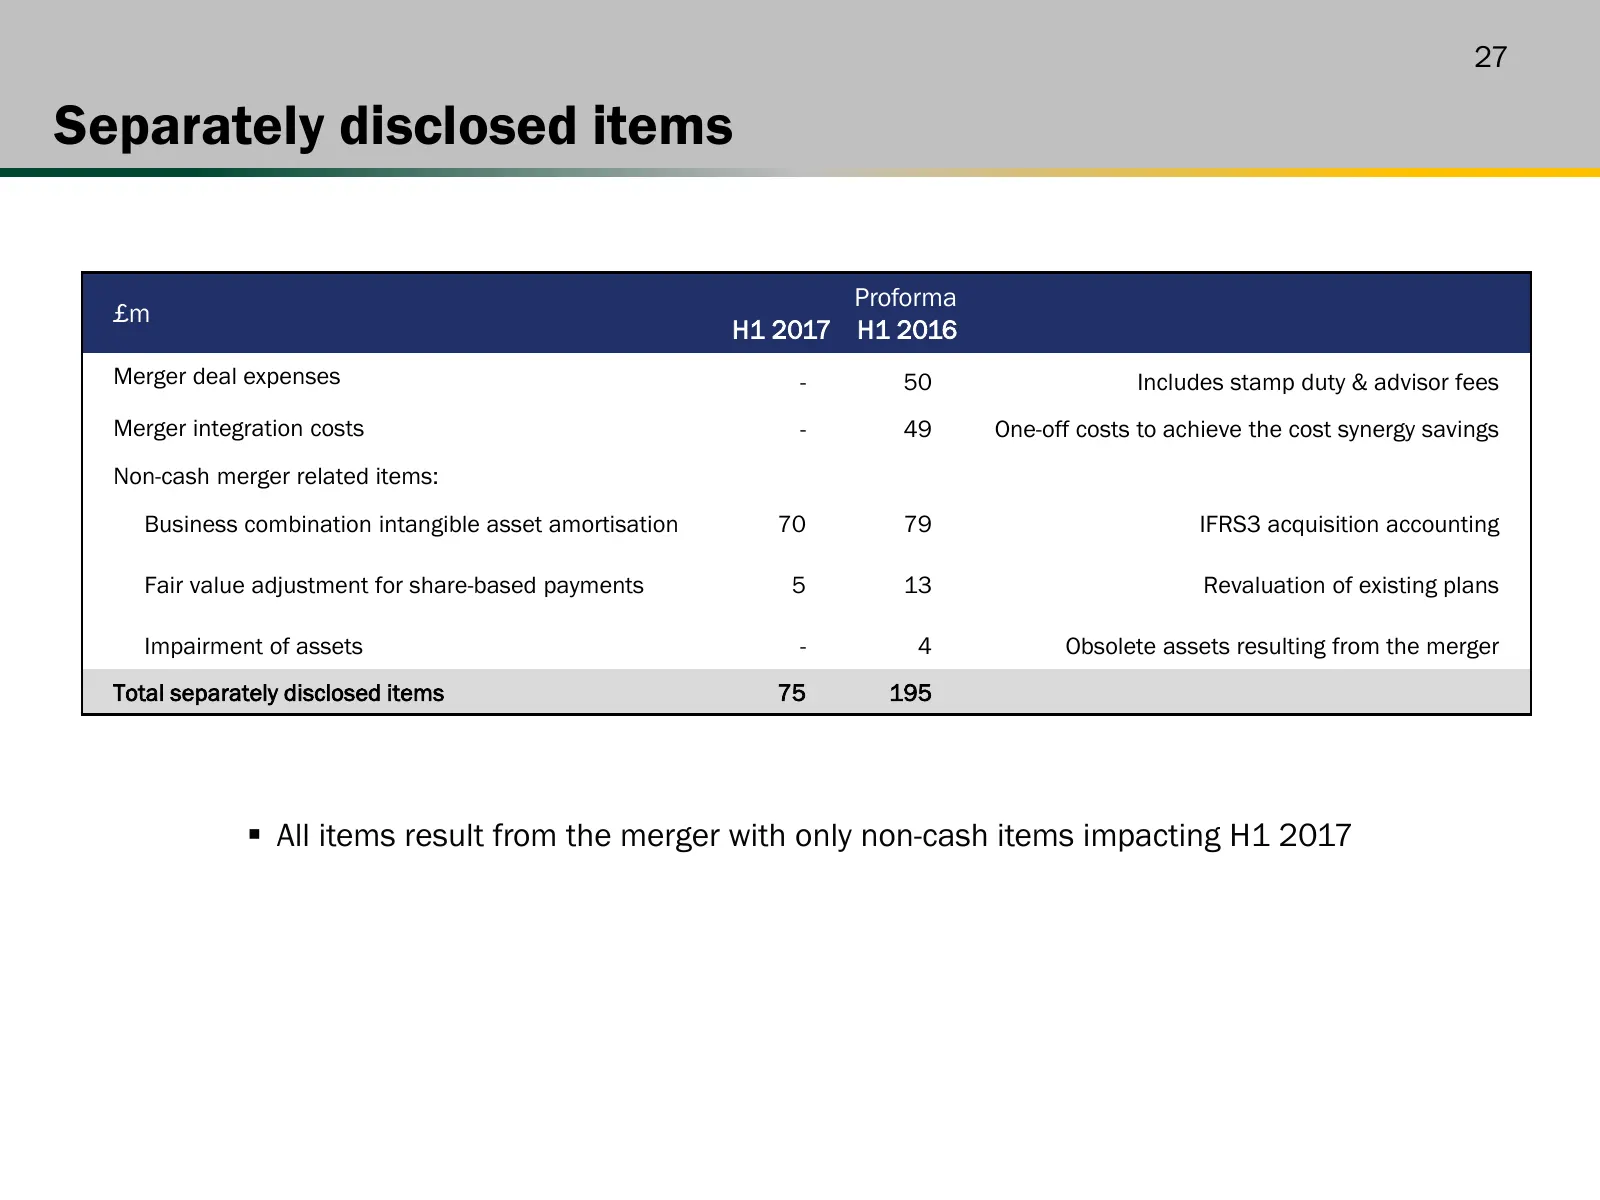
27 Separately disclosed items Proforma £m H1 2017 H1 2016 Merger deal expenses - 50 Includes stamp duty & advisor fees Merger integration costs - 49 One-off costs to achieve the cost synergy savings Non-cash merger related items: Business combination intangible asset amortisation 70 79 IFRS3 acquisi
Source: Internet Archive copy of flutter.com
More decks from Flutter Entertainment plc
 Q3 2026 Earnings Presentation15 slides · Nov 4, 2026
 Q2 2026 Earnings Presentation14 slides · Aug 5, 2026
 Investor Day (September 2024)152 slides · Sep 25, 2024
 Q2 2024 Earnings Presentation20 slides · Aug 13, 2024
 Q1 2024 Earnings Presentation20 slides · May 14, 2024
 FY2023 Earnings Presentation36 slides · Mar 26, 2024