GAIN Capital — Q1 2018 Earnings Presentation
27 slides from GAIN Capital's earnings presentation, Apr 26, 2018

Slide 1: Q1 2018 Results
GAIN | CAPITAL Q12018 Results April 2018
Slide 2: Safe Harbor Statement
2 SAFE HARBOR STATEMENT Forward Looking Statements In addition to historical information, this earnings presentation contains "forward-looking" statements that reflect management's expectations for the future. A variety of important factors could cause results to differ materially from such statemen
Slide 3: First Quarter Review
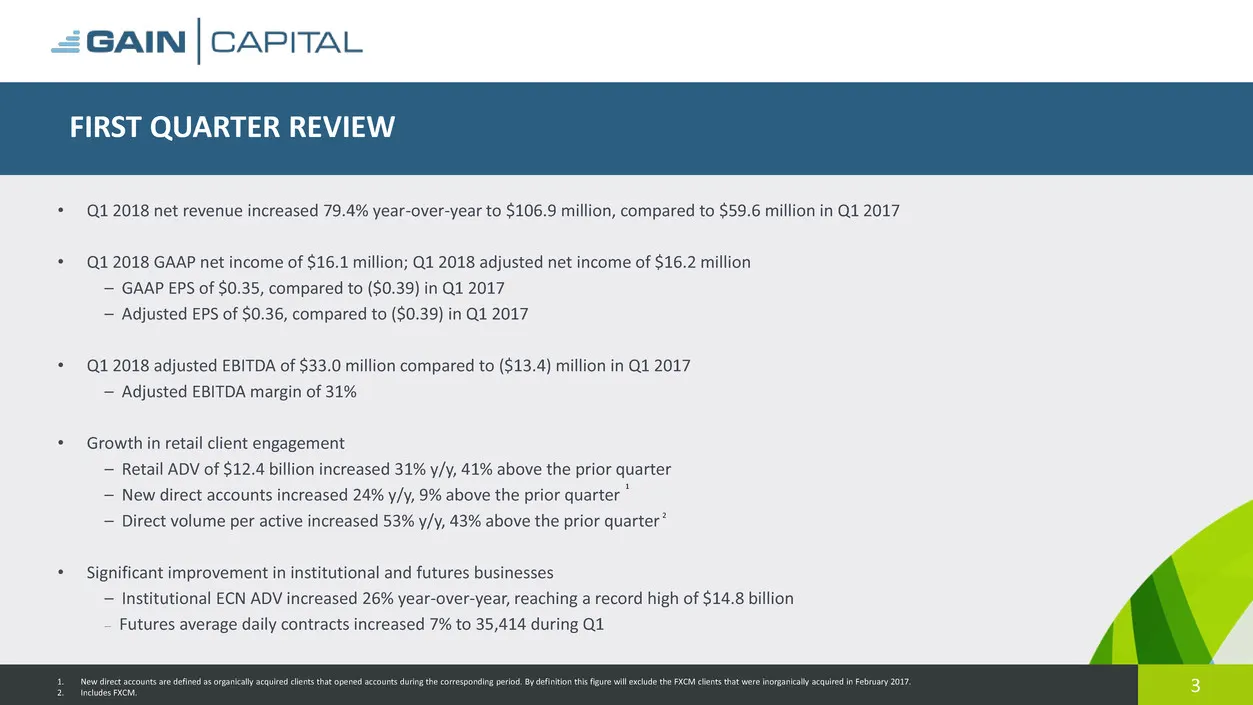
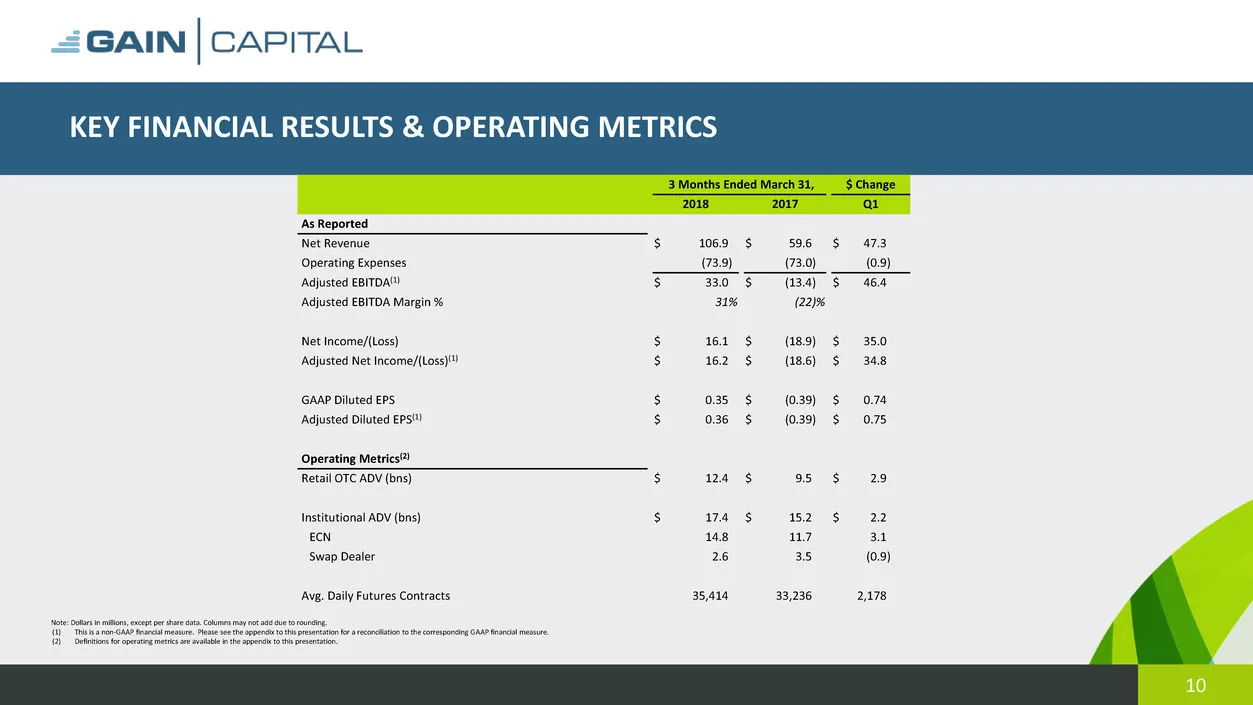
3 FIRST QUARTER REVIEW • Q1 2018 net revenue increased 79.4% year-over-year to $106.9 million, compared to $59.6 million in Q1 2017 • Q1 2018 GAAP net income of $16.1 million; Q1 2018 adjusted net income of $16.2 million – GAAP EPS of $0.35, compared to ($0.39) in Q1 2017 – Adjusted EPS of $0.36, co
Slide 4: 2018 and Beyond – Strategic Priorities
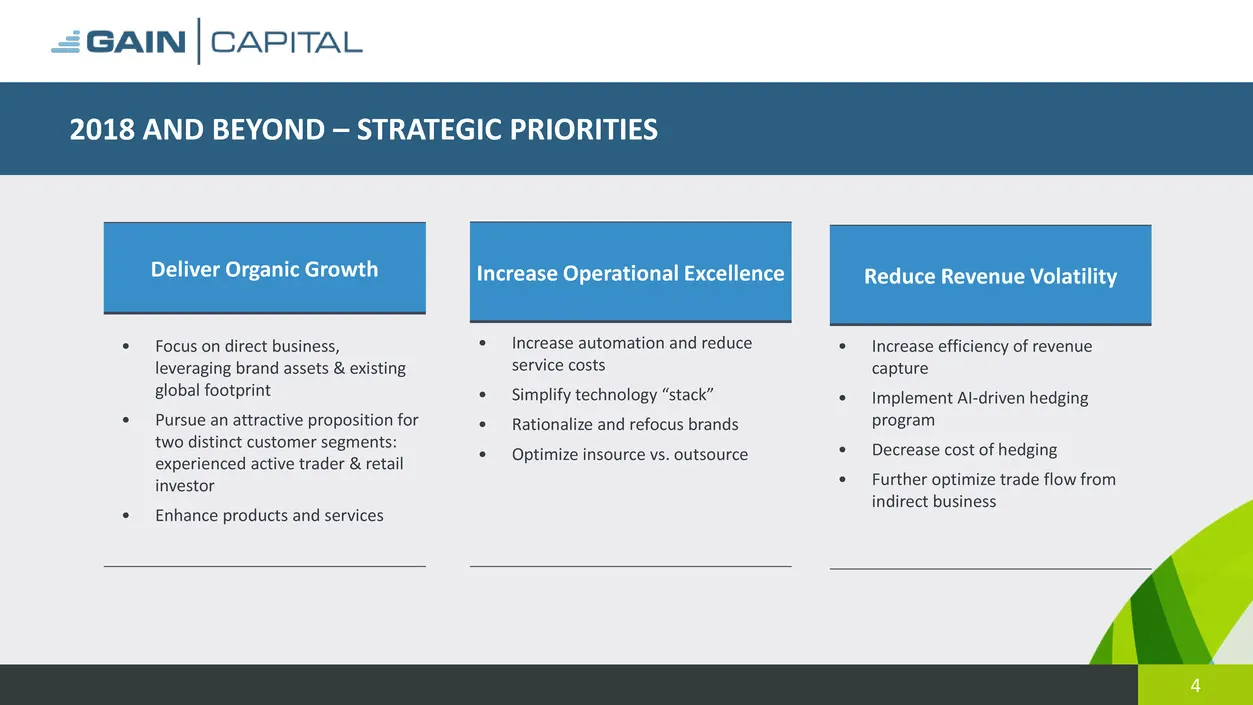
4 2018 AND BEYOND – STRATEGIC PRIORITIES Deliver Organic Growth Increase Operational Excellence • Focus on direct business, leveraging brand assets & existing global footprint • Pursue an attractive proposition for two distinct customer segments: experienced active trader & retail investor • Enhance
Slide 5: Delivering Organic Growth - Focus on Direct Business
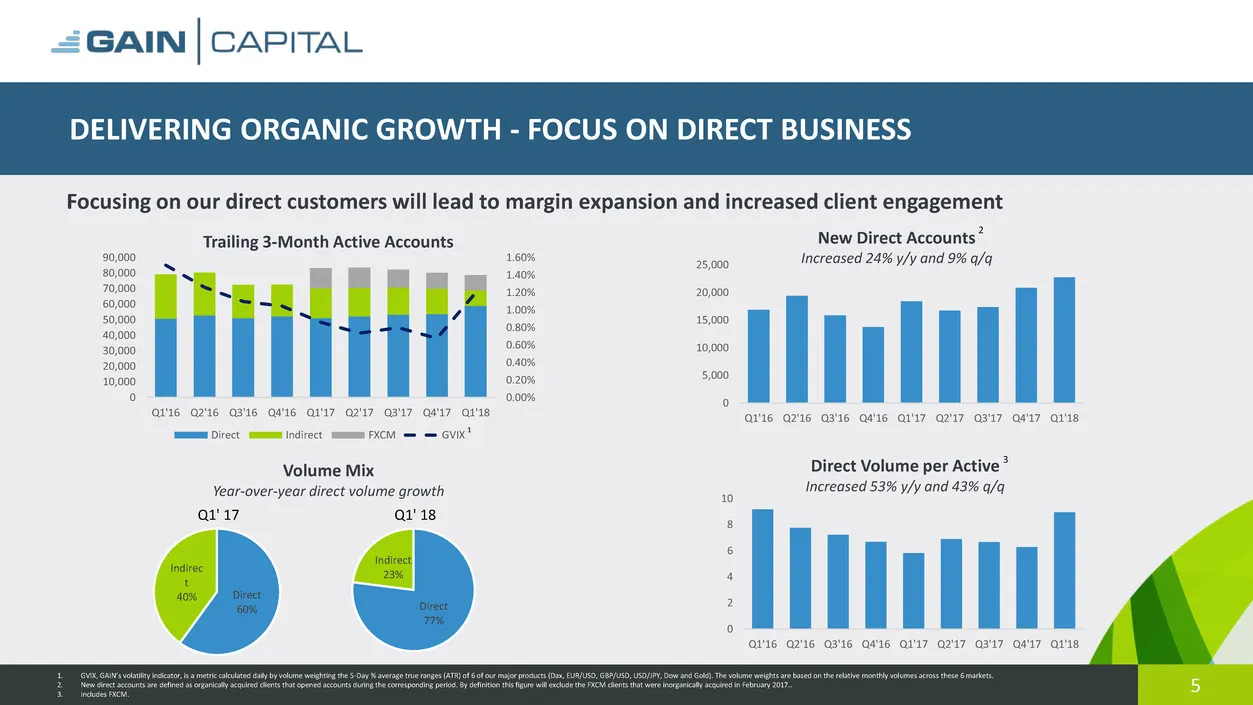
5 0.00% 0.20% 0.40% 0.60% 0.80% 1.00% 1.20% 1.40% 1.60% 0 10,000 20,000 30,000 40,000 50,000 60,000 70,000 80,000 90,000 Q1'16 Q2'16 Q3'16 Q4'16 Q1'17 Q2'17 Q3'17 Q4'17 Q1'18 Direct Indirect FXCM GVIX New Direct Accounts Increased 24% y/y and 9% q/q DELIVERING ORGANIC GROWTH - FOCUS ON DIRECT BUSINE
Slide 6: Delivering Organic Growth - Products and Innovation
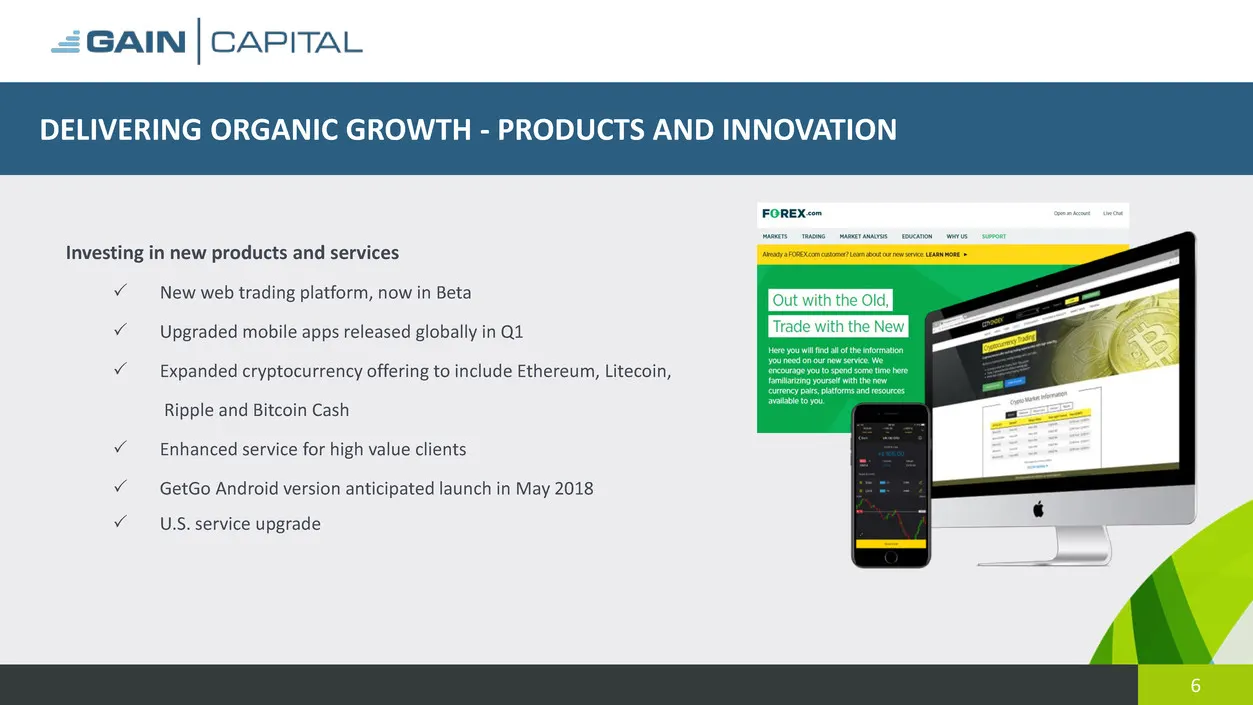
6 DELIVERING ORGANIC GROWTH - PRODUCTS AND INNOVATION Investing in new products and services P New web trading platform, now in Beta P Upgraded mobile apps released globally in Q1 P Expanded cryptocurrency offering to include Ethereum, Litecoin, Ripple and Bitcoin Cash P Enhanced service for high va
Slide 7: Reduce Revenue Volatility
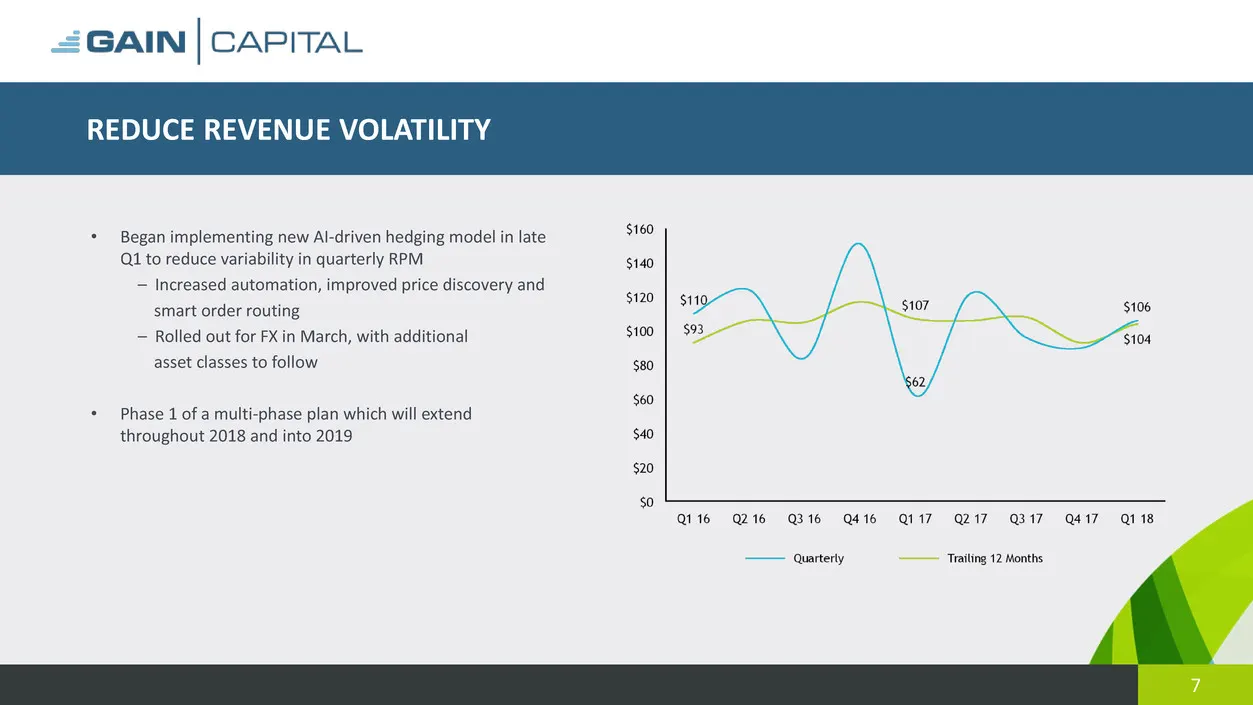
7 REDUCE REVENUE VOLATILITY • Began implementing new AI-driven hedging model in late Q1 to reduce variability in quarterly RPM – Increased automation, improved price discovery and smart order routing – Rolled out for FX in March, with additional asset classes to follow • Phase 1 of a multi-phase pla
Slide 8: Regulatory Update - ESMA
8 REGULTORY UPDATE - ESMA • On March 27th, ESMA and FCA announced regulatory changes in the provision of CFDs, which will apply to retail clients in the UK and EU • Final measures largely unchanged from December 2017 proposal, which include limits on leverage for retail clients • Clients classified
Slide 9: Financial Review
GAIN | CAPITAL Financial Review
Slide 10: Key Financial Results & Operating Metrics
10 KEY FINANCIAL RESULTS & OPERATING METRICS Note: Dollars in millions, except per share data. Columns may not add due to rounding. (1) This is a non-GAAP financial measure. Please see the appendix to this presentation for a reconciliation to the corresponding GAAP financial measure. (2) Definitions
Slide 11: Operating Segment Results: Retail
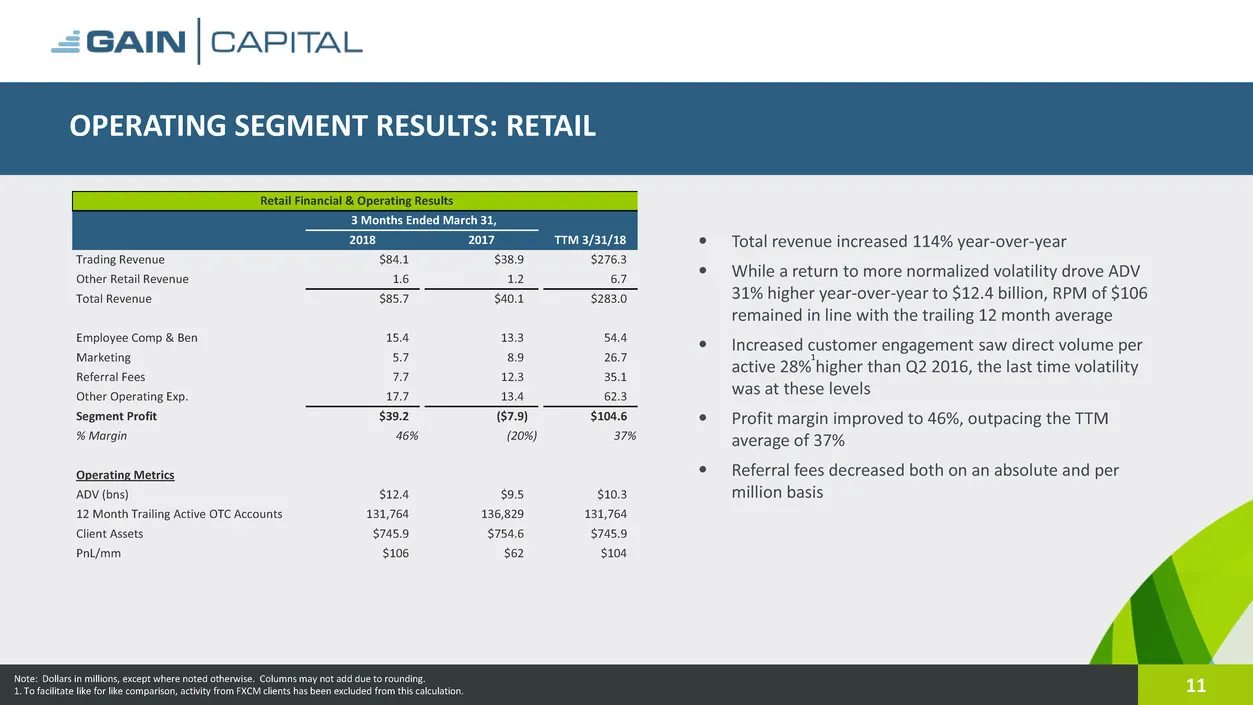
11 • Total revenue increased 114% year-over-year • While a return to more normalized volatility drove ADV 31% higher year-over-year to $12.4 billion, RPM of $106 remained in line with the trailing 12 month average • Increased customer engagement saw direct volume per active 28% higher than Q2 2016,
Slide 12: Operating Segment Results: Institutional & Futures
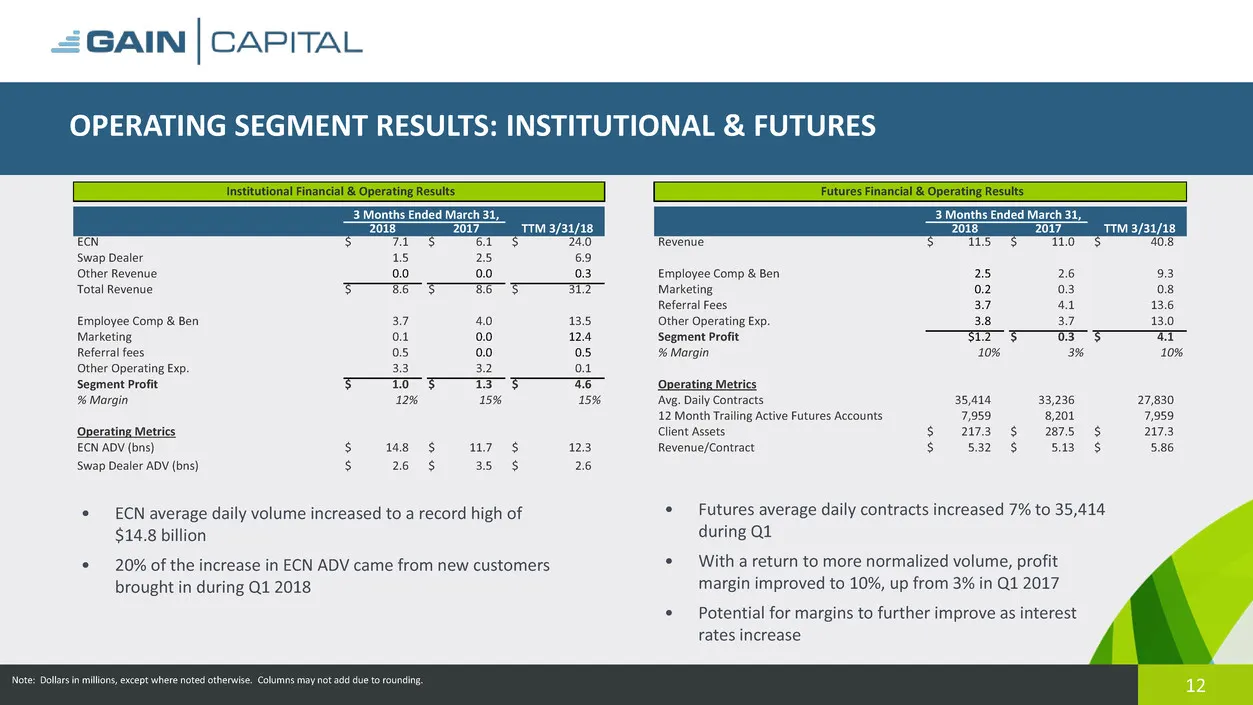
12 OPERATING SEGMENT RESULTS: INSTITUTIONAL & FUTURES Note: Dollars in millions, except where noted otherwise. Columns may not add due to rounding. • ECN average daily volume increased to a record high of $14.8 billion • 20% of the increase in ECN ADV came from new customers brought in during Q1 201
Slide 13: Strong Liquidity Position
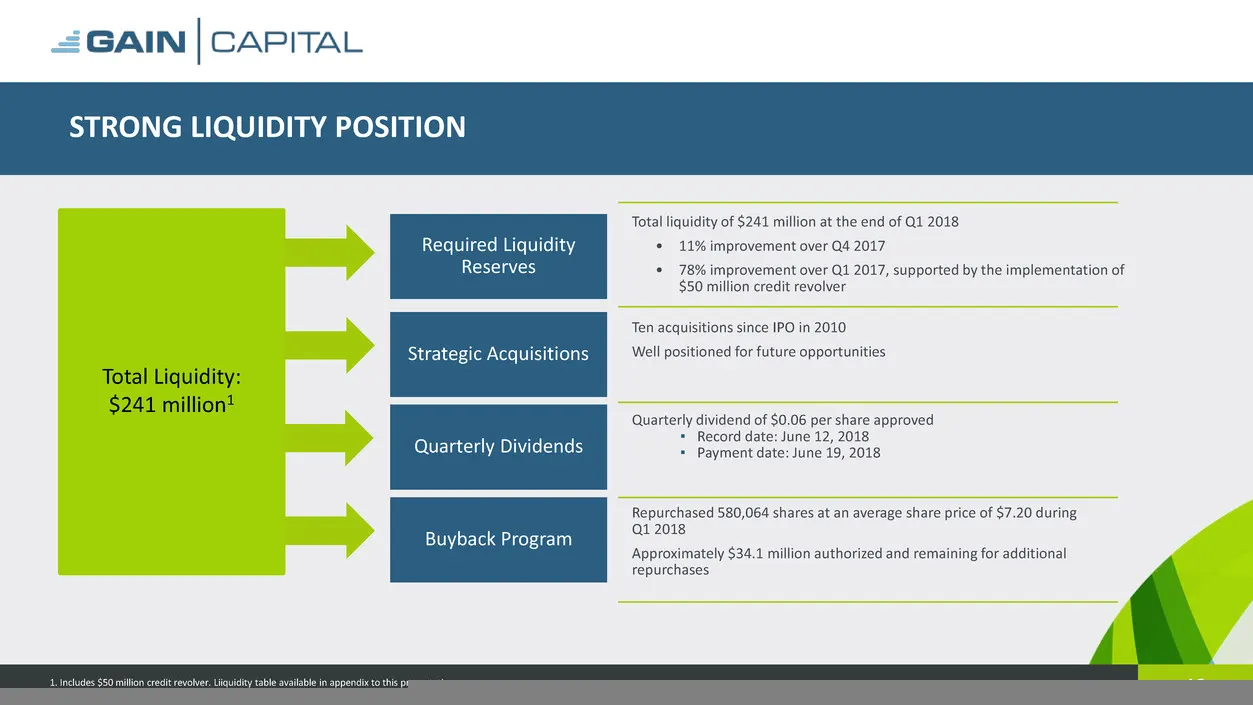
13 STRONG LIQUIDITY POSITION Total Liquidity: $241 million1 Required Liquidity Reserves Strategic Acquisitions Quarterly Dividends Buyback Program Total liquidity of $241 million at the end of Q1 2018 • 11% improvement over Q4 2017 • 78% improvement over Q1 2017, supported by the implementation of $
Slide 14: Positioned to Deliver Long-Term Value
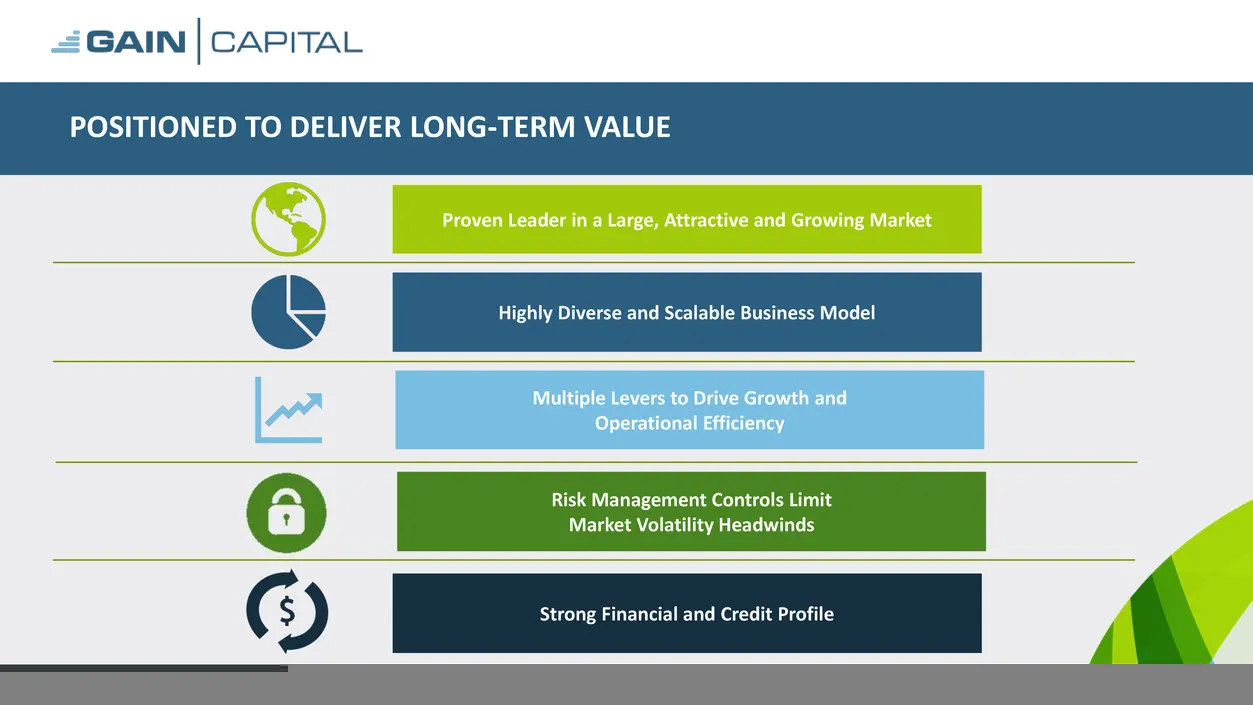
14 POSITIONED TO DELIVER LONG-TERM VALUE Proven Leader in a Large, Attractive and Growing Market Strong Financial and Credit Profile Multiple Levers to Drive Growth and Operational Efficiency Highly Diverse and Scalable Business Model Risk Management Controls Limit Market Volatility Headwinds
Slide 15: Appendix
GAIN | CAPITAL Appendix
Slide 16: Consolidated Statement of Operations
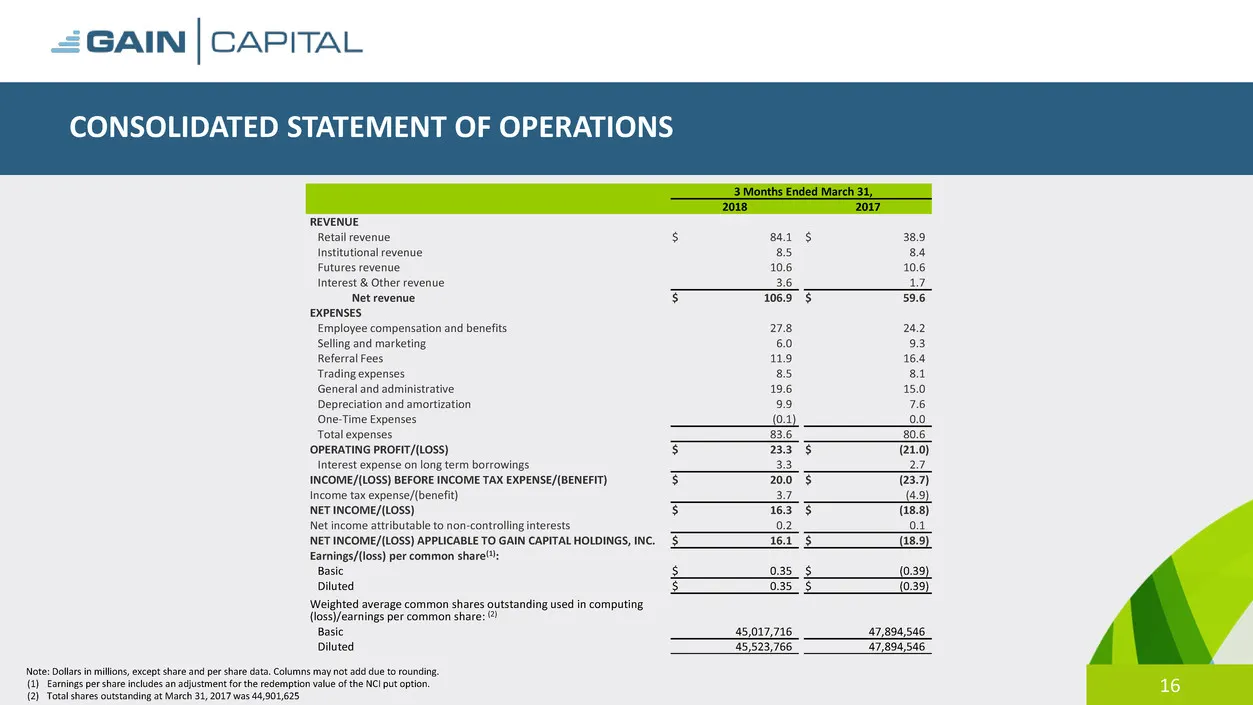
16 CONSOLIDATED STATEMENT OF OPERATIONS Note: Dollars in millions, except share and per share data. Columns may not add due to rounding. (1) Earnings per share includes an adjustment for the redemption value of the NCI put option. (2) Total shares outstanding at March 31, 2017 was 44,901,625 3 Month
Slide 17: Consolidated Balance Sheet
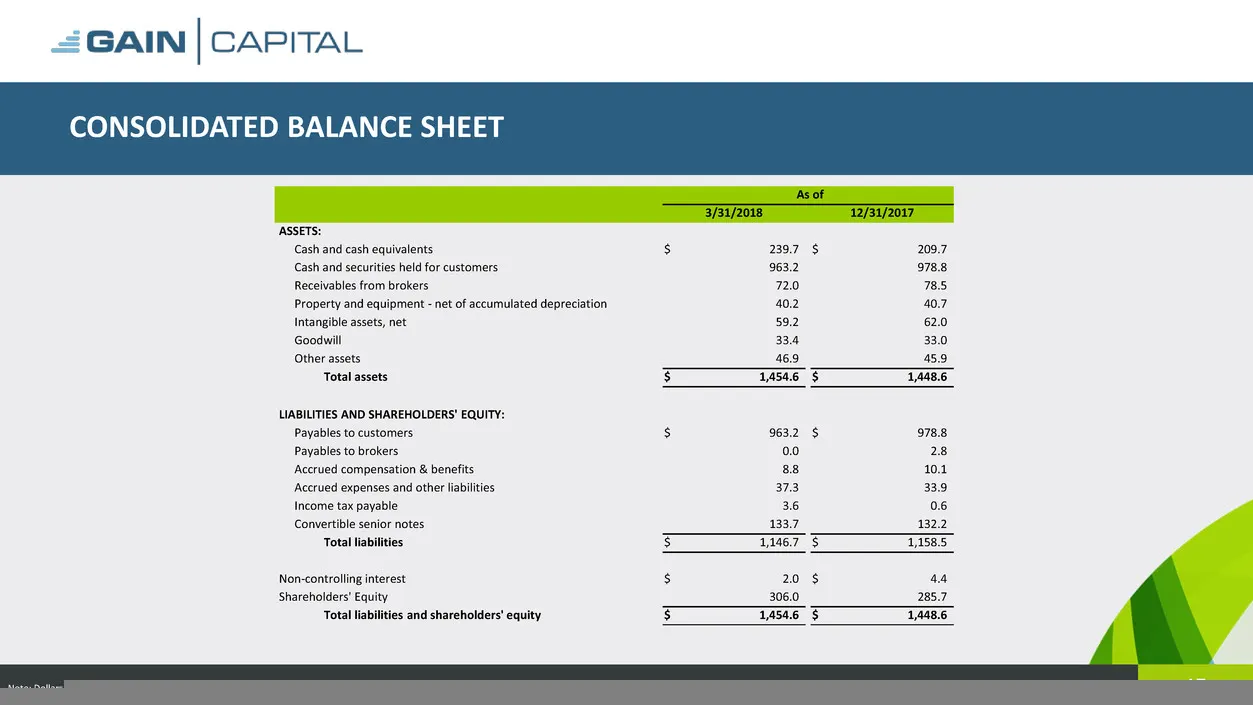
17 CONSOLIDATED BALANCE SHEET Note: Dollars in millions. Columns may not add due to rounding. As of 3/31/2018 12/31/2017 ASSETS: Cash and cash equivalents $ 239.7 $ 209.7 Cash and securities held for customers 963.2 978.8 Receivables from brokers 72.0 78.5 Property and equipment - net of accumulated
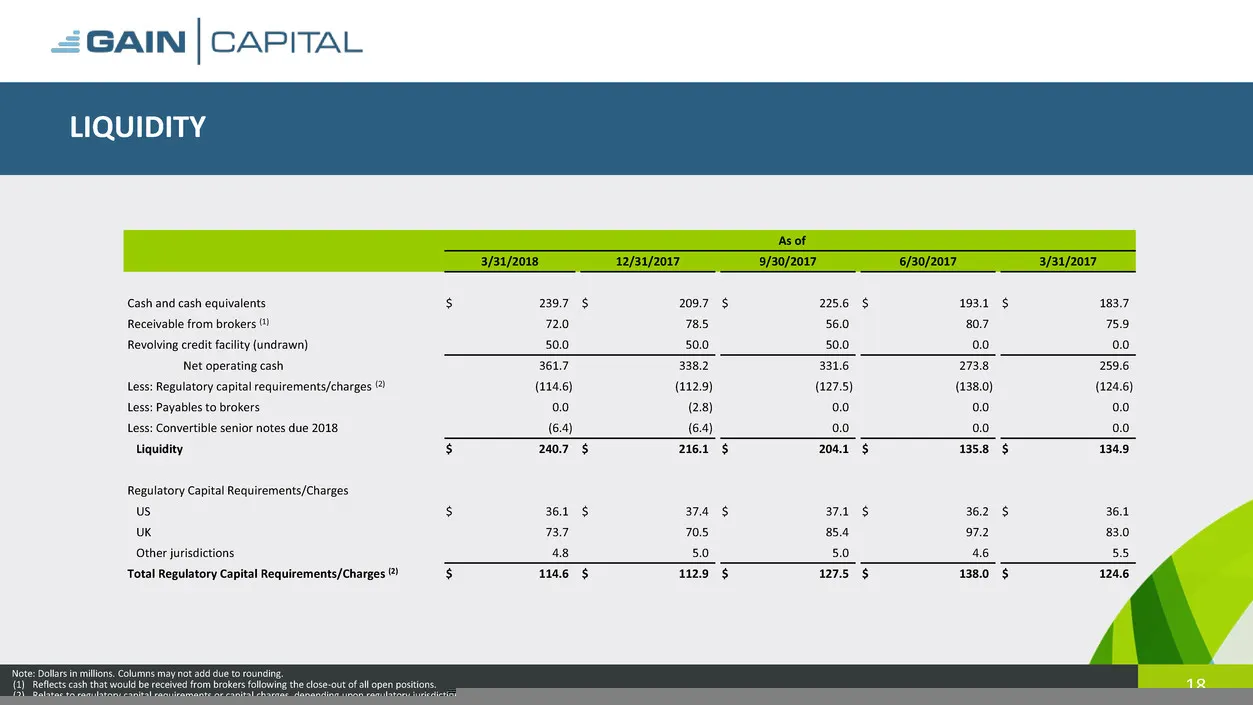
Slide 18: Liquidity
18 LIQUIDITY Note: Dollars in millions. Columns may not add due to rounding. (1) Reflects cash that would be received from brokers following the close-out of all open positions. (2) Relates to regulatory capital requirements or capital charges, depending upon regulatory jurisdiction. As of 3/31/2018
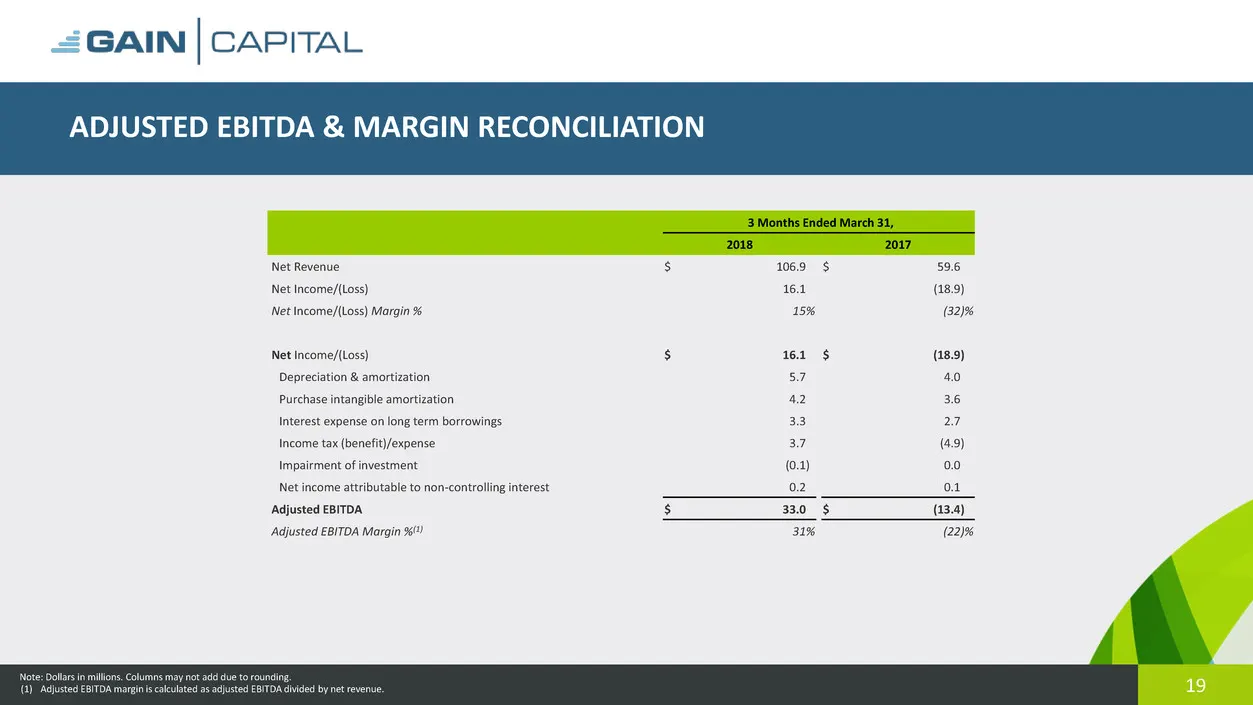
Slide 19: Adjusted EBITDA & Margin Reconciliation
19 ADJUSTED EBITDA & MARGIN RECONCILIATION Note: Dollars in millions. Columns may not add due to rounding. (1) Adjusted EBITDA margin is calculated as adjusted EBITDA divided by net revenue. 3 Months Ended March 31, 2018 2017 Net Revenue $ 106.9 $ 59.6 Net Income/(Loss) 16.1 (18.9) Net Income/(Loss)
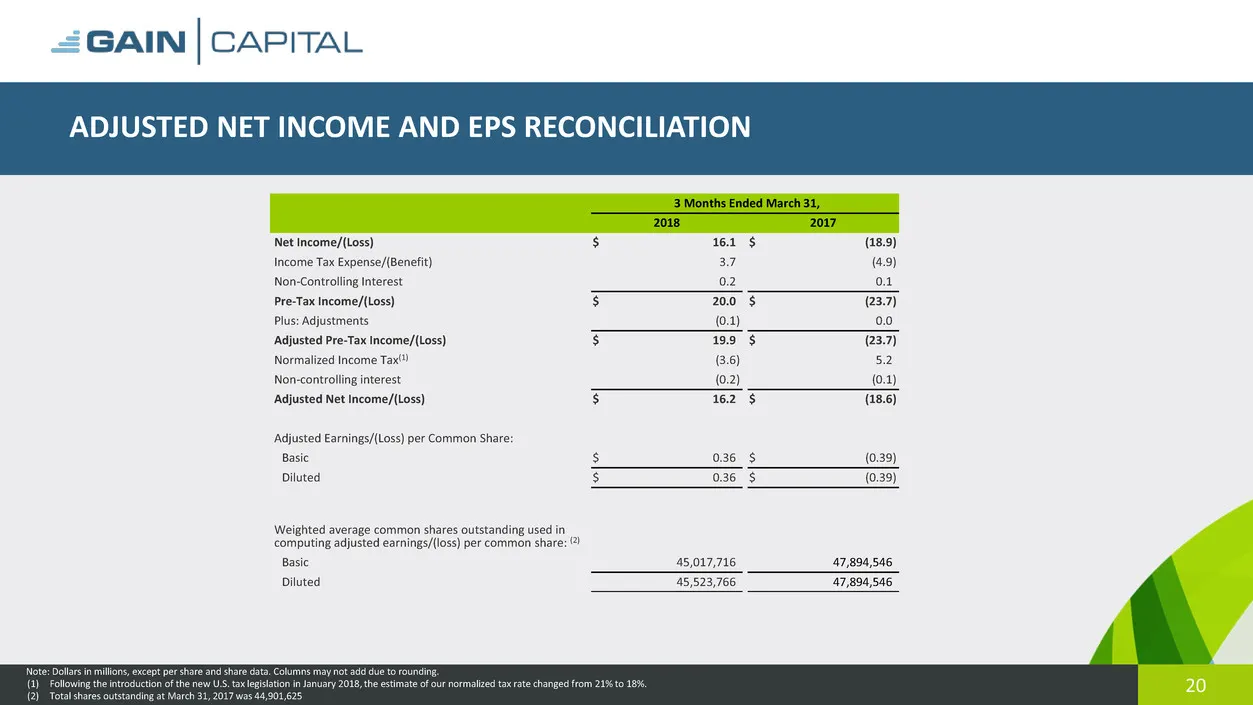
Slide 20: Adjusted Net Income and EPS Reconciliation
20 ADJUSTED NET INCOME AND EPS RECONCILIATION Note: Dollars in millions, except per share and share data. Columns may not add due to rounding. (1) Following the introduction of the new U.S. tax legislation in January 2018, the estimate of our normalized tax rate changed from 21% to 18%. (2) Total sh
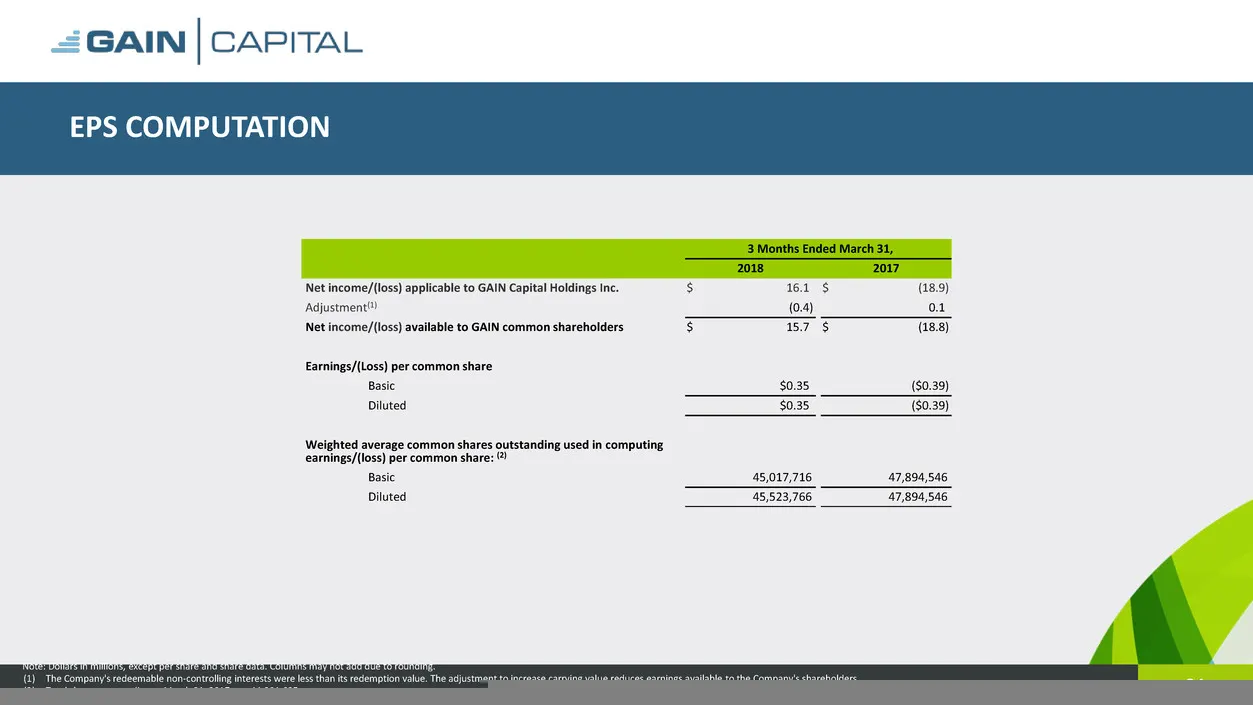
Slide 21: EPS Computation
21 EPS COMPUTATION Note: Dollars in millions, except per share and share data. Columns may not add due to rounding. (1) The Company's redeemable non-controlling interests were less than its redemption value. The adjustment to increase carrying value reduces earnings available to the Company's shareh
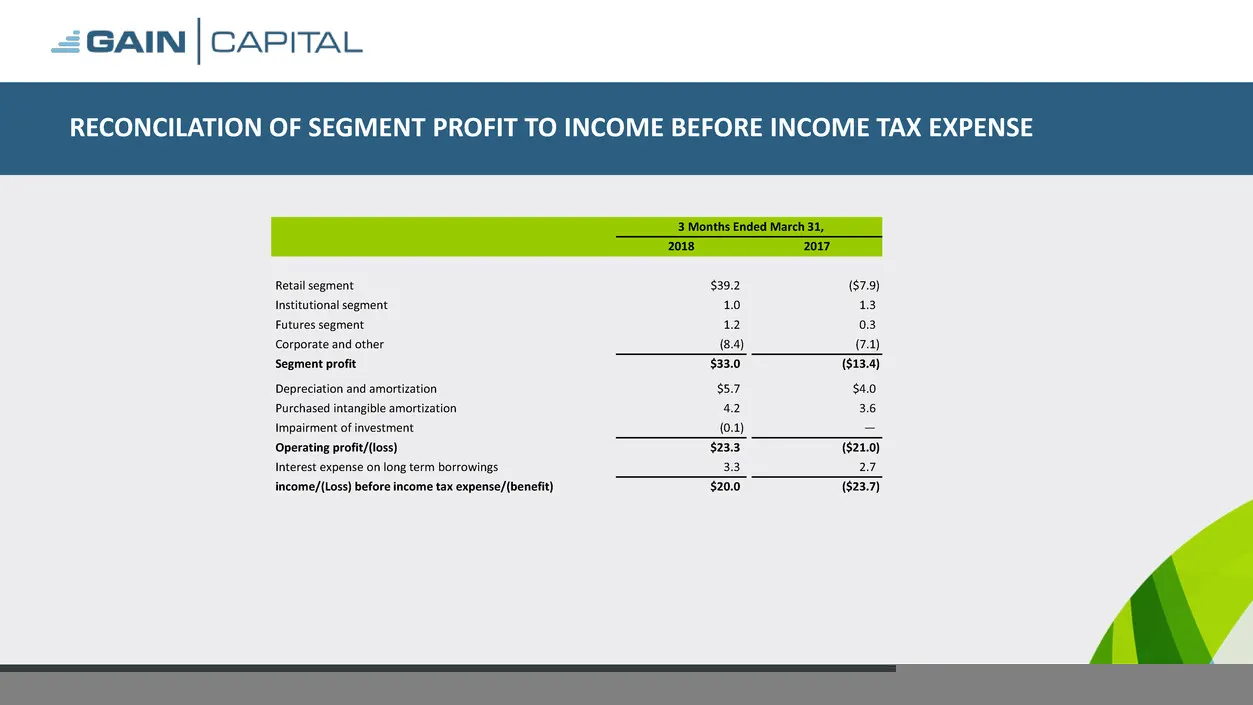
Slide 22: Reconciliation of Segment Profit to Income Before Income Tax Expense
22 RECONCILATION OF SEGMENT PROFIT TO INCOME BEFORE INCOME TAX EXPENSE Note: Dollars in millions. Columns may not add due to rounding. 3 Months Ended March 31, 2018 2017 Retail segment $39.2 ($7.9) Institutional segment 1.0 1.3 Futures segment 1.2 0.3 Corporate and other (8.4) (7.1) Segment profit $
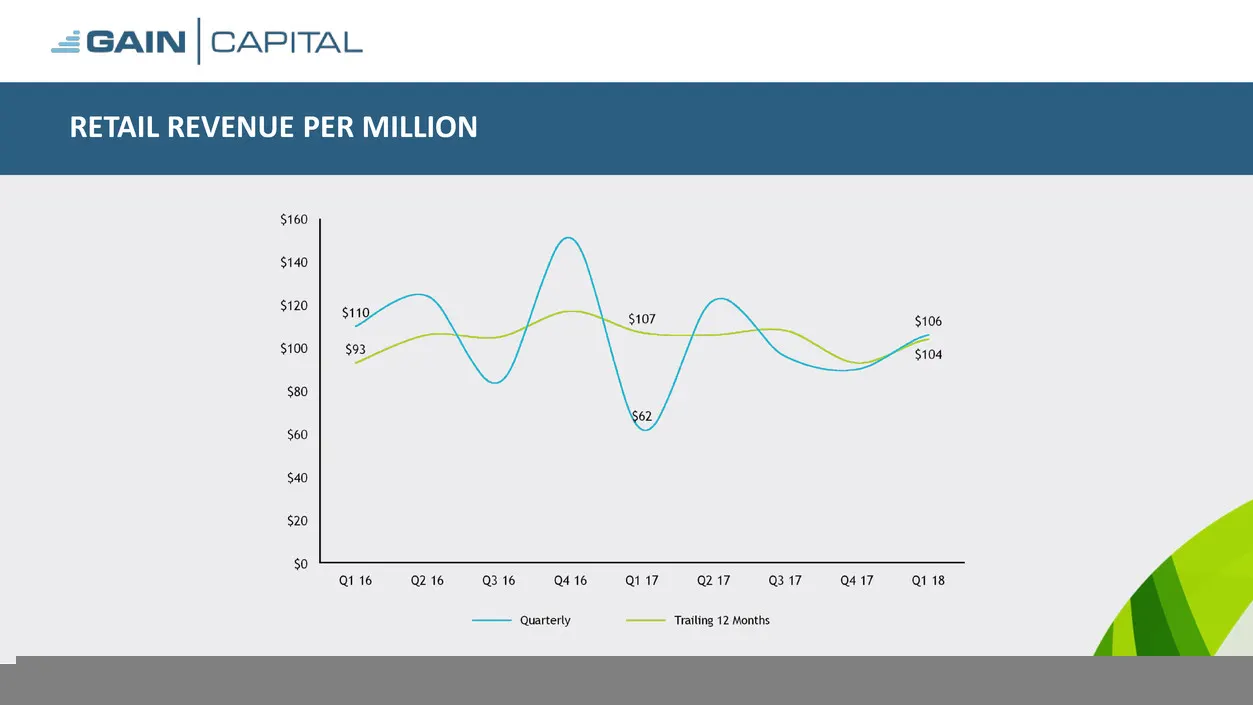
Slide 23: Retail Revenue Per Million
23 RETAIL REVENUE PER MILLION
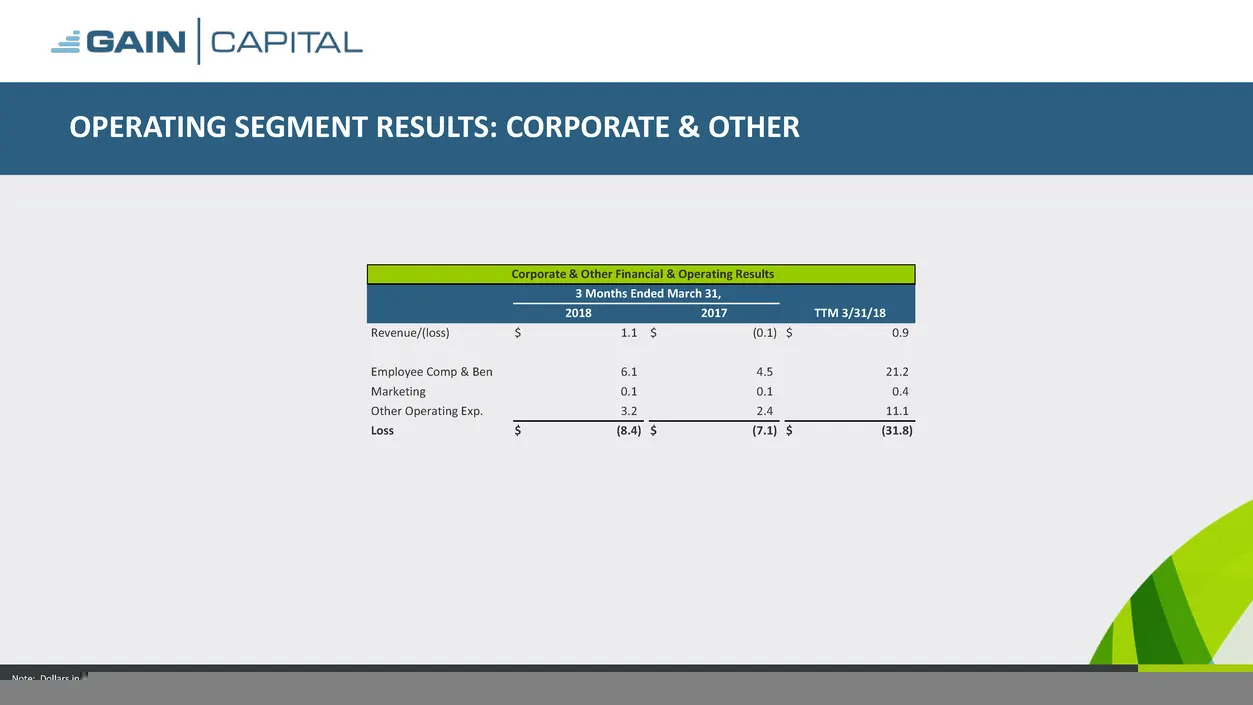
Slide 24: Operating Segment Results: Corporate & Other
24 OPERATING SEGMENT RESULTS: CORPORATE & OTHER Note: Dollars in millions, except where noted otherwise. Columns may not add due to rounding. Corporate & Other Financial & Operating Results 3 Months Ended March 31, 2018 2017 TTM 3/31/18 Revenue/(loss) $ 1.1 $ (0.1) $ 0.9 Employee Comp & Ben 6.1 4.5
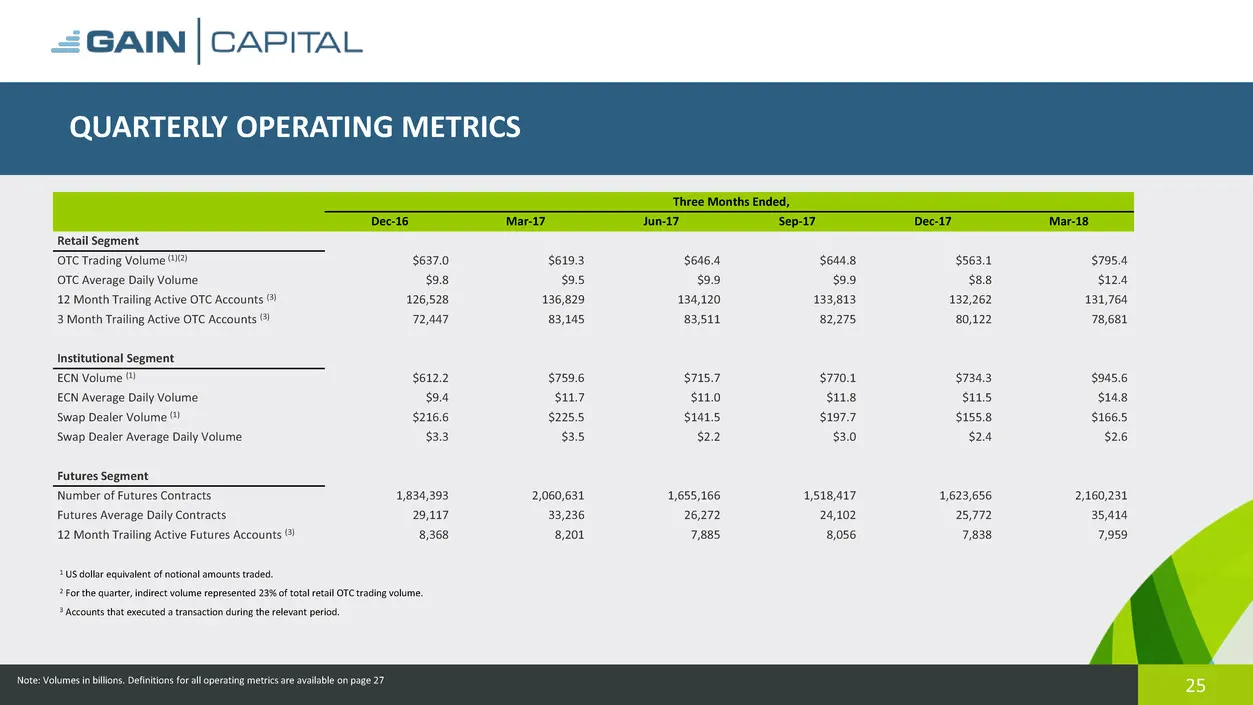
Slide 25: Quarterly Operating Metrics
25 QUARTERLY OPERATING METRICS Note: Volumes in billions. Definitions for all operating metrics are available on page 27 Three Months Ended, Dec-16 Mar-17 Jun-17 Sep-17 Dec-17 Mar-18 Retail Segment OTC Trading Volume (1)(2) $637.0 $619.3 $646.4 $644.8 $563.1 $795.4 OTC Average Daily Volume $9.8 $9.5
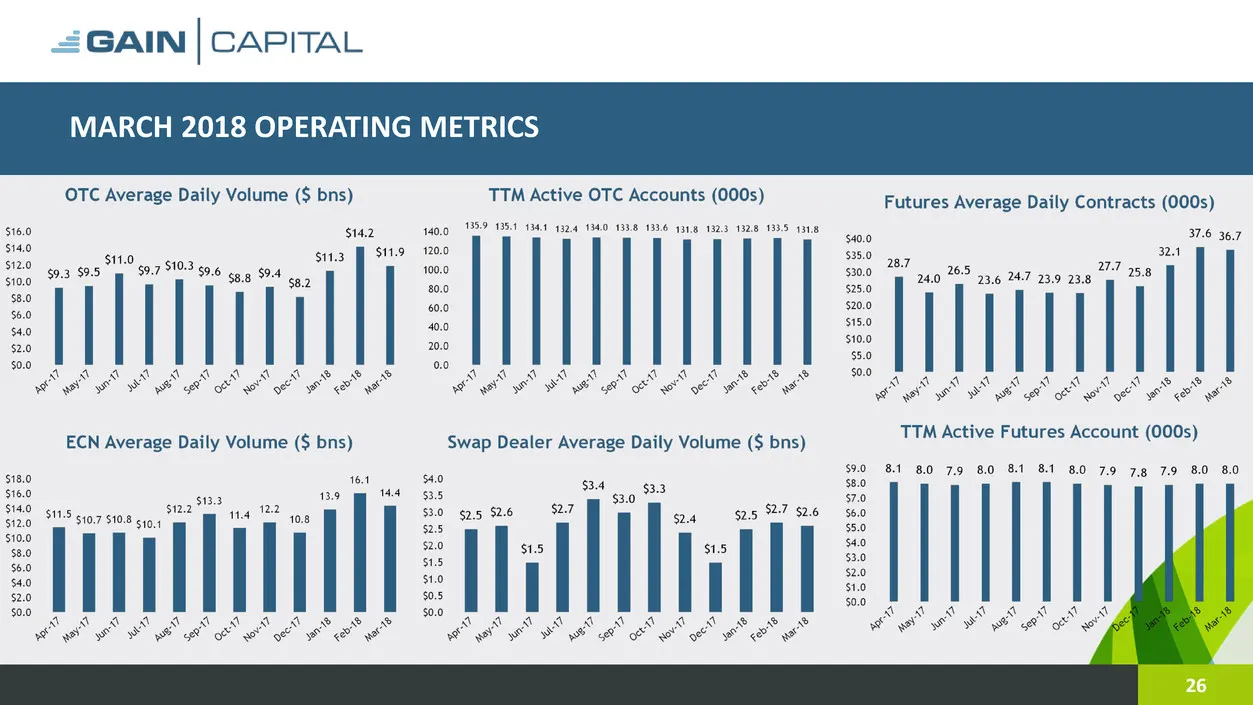
Slide 26: March 2018 Operating Metrics
26 MARCH 2018 OPERATING METRICS
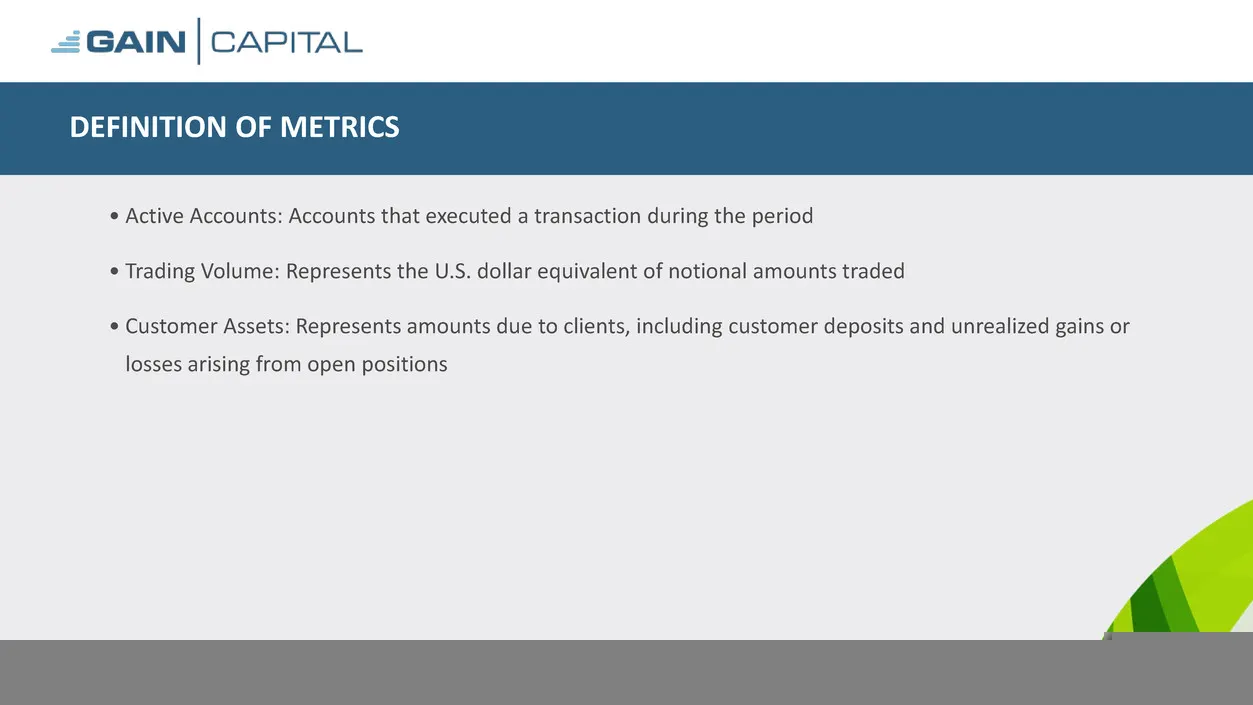
Slide 27: Definition of Metrics
27 DEFINITION OF METRICS • Active Accounts: Accounts that executed a transaction during the period • Trading Volume: Represents the U.S. dollar equivalent of notional amounts traded • Customer Assets: Represents amounts due to clients, including customer deposits and unrealized gains or losses arisi
Source: SEC EDGAR · 8-K filed Apr 26, 2018
More decks from GAIN Capital Holdings Inc
 Q2 2020 Earnings Presentation24 slides · Jul 23, 2020
 Merger or Acquisition (May 2020)10 slides · May 15, 2020
 Q1 2020 Earnings Presentation25 slides · Apr 23, 2020
 FY2019 Earnings Presentation35 slides · Feb 27, 2020
 Q3 2019 Earnings Presentation32 slides · Oct 25, 2019
 Q2 2019 Earnings Presentation33 slides · Jul 25, 2019