Old Mutual Ltd. · JSE:OMU
Old Mutual — FY2017 Earnings Presentation
31 slides from Old Mutual's earnings presentation, Mar 15, 2018
Slide 1: Appendices
APPENDICES 15 March 2018 INVESTMENT | SAVINGS | INSURANCE | BANKING
Slide 2: Index to Appendices
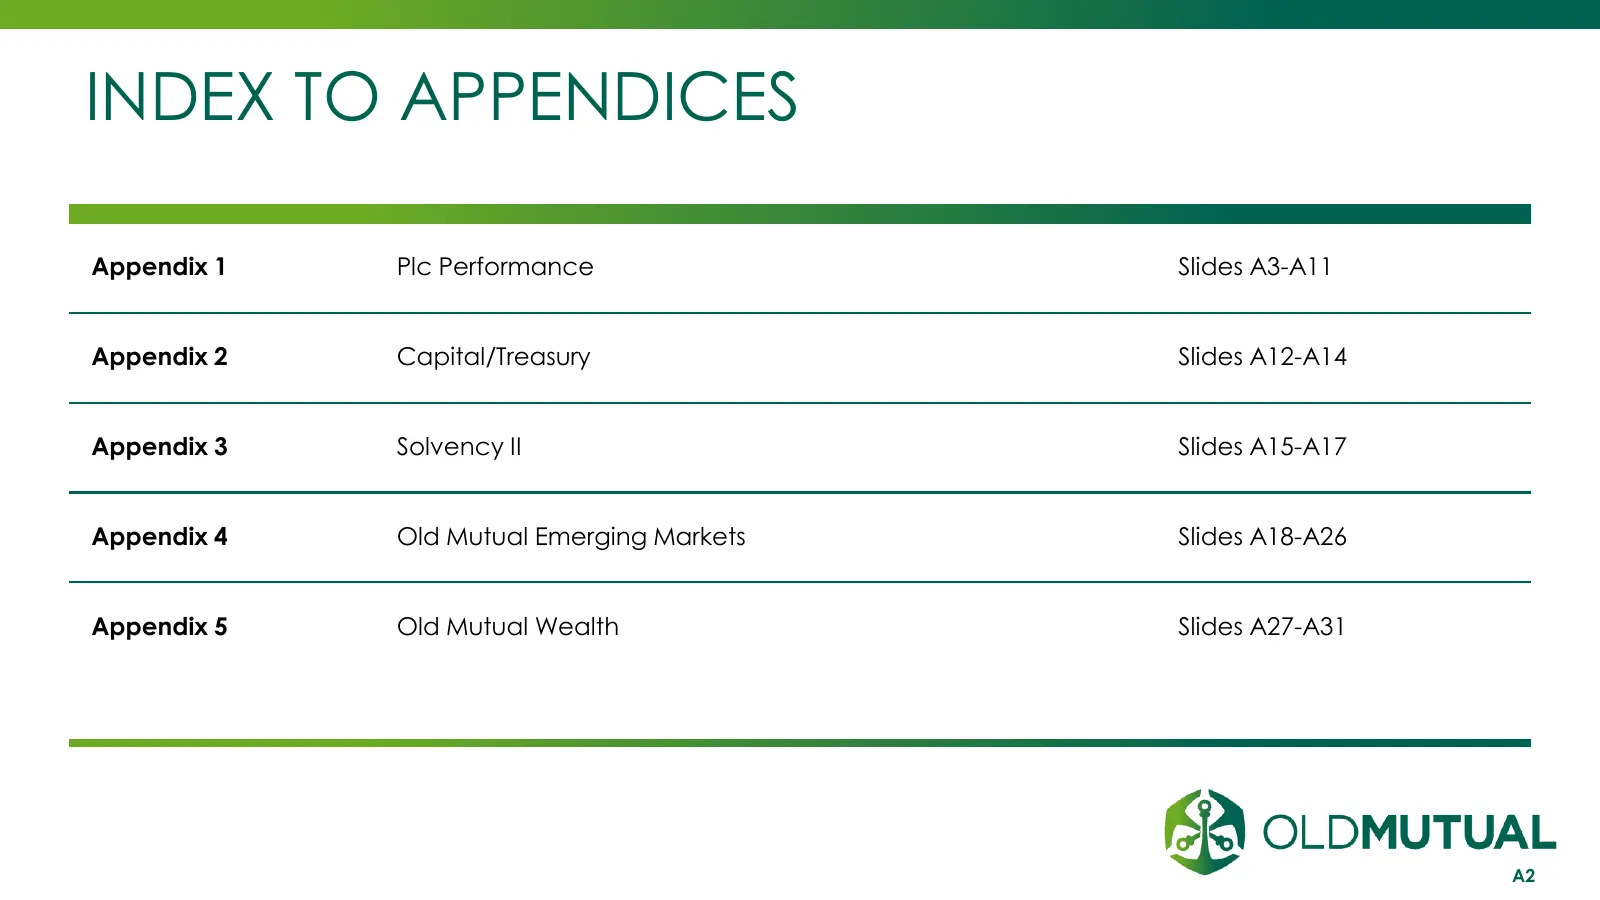
INDEX TO APPENDICES Appendix 1 Plc Performance Slides A3-A11 Appendix 2 Capital/Treasury Slides A12-A14 Appendix 3 Solvency II Slides A15-A17 Appendix 4 Old Mutual Emerging Markets Slides A18-A26 Appendix 5 Old Mutual Wealth Slides A27-A31 A2
Slide 3: Appendix 1: Plc Performance
APPENDIX 1 PLC PERFORMANCE INVESTMENT | SAVINGS | INSURANCE | BANKING
Slide 4: Adjusted NAV
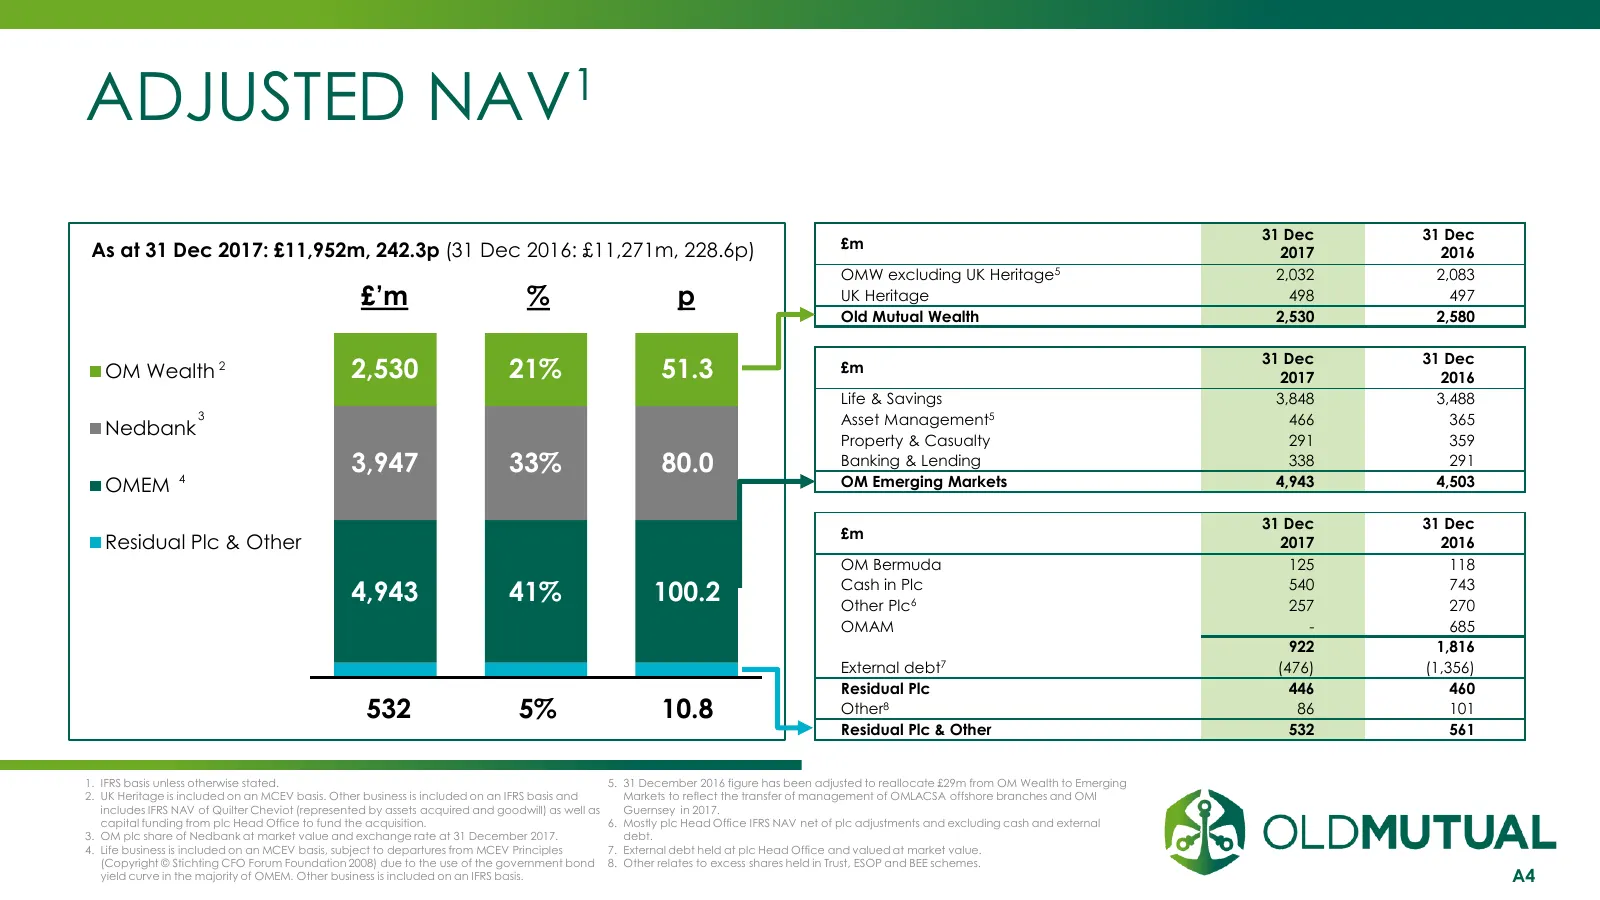
ADJUSTED NAV1 31 Dec 31 Dec As at 31 Dec 2017: £11,952m, 242.3p (31 Dec 2016: £11,271m, 228.6p) £m 2017 2016 OMW excluding UK Heritage5 2,032 2,083 £’m % p UK Heritage 498 497 Old Mutual Wealth 2,530 2,580 31 Dec 31 Dec OM Wealth 2 2,530 21% 51.3 £m 2017 2016 Life & Savings 3,848 3,488 3 Asset Manag
Slide 5: Reconciliation of IFRS NAV to Adjusted NAV: December 2017
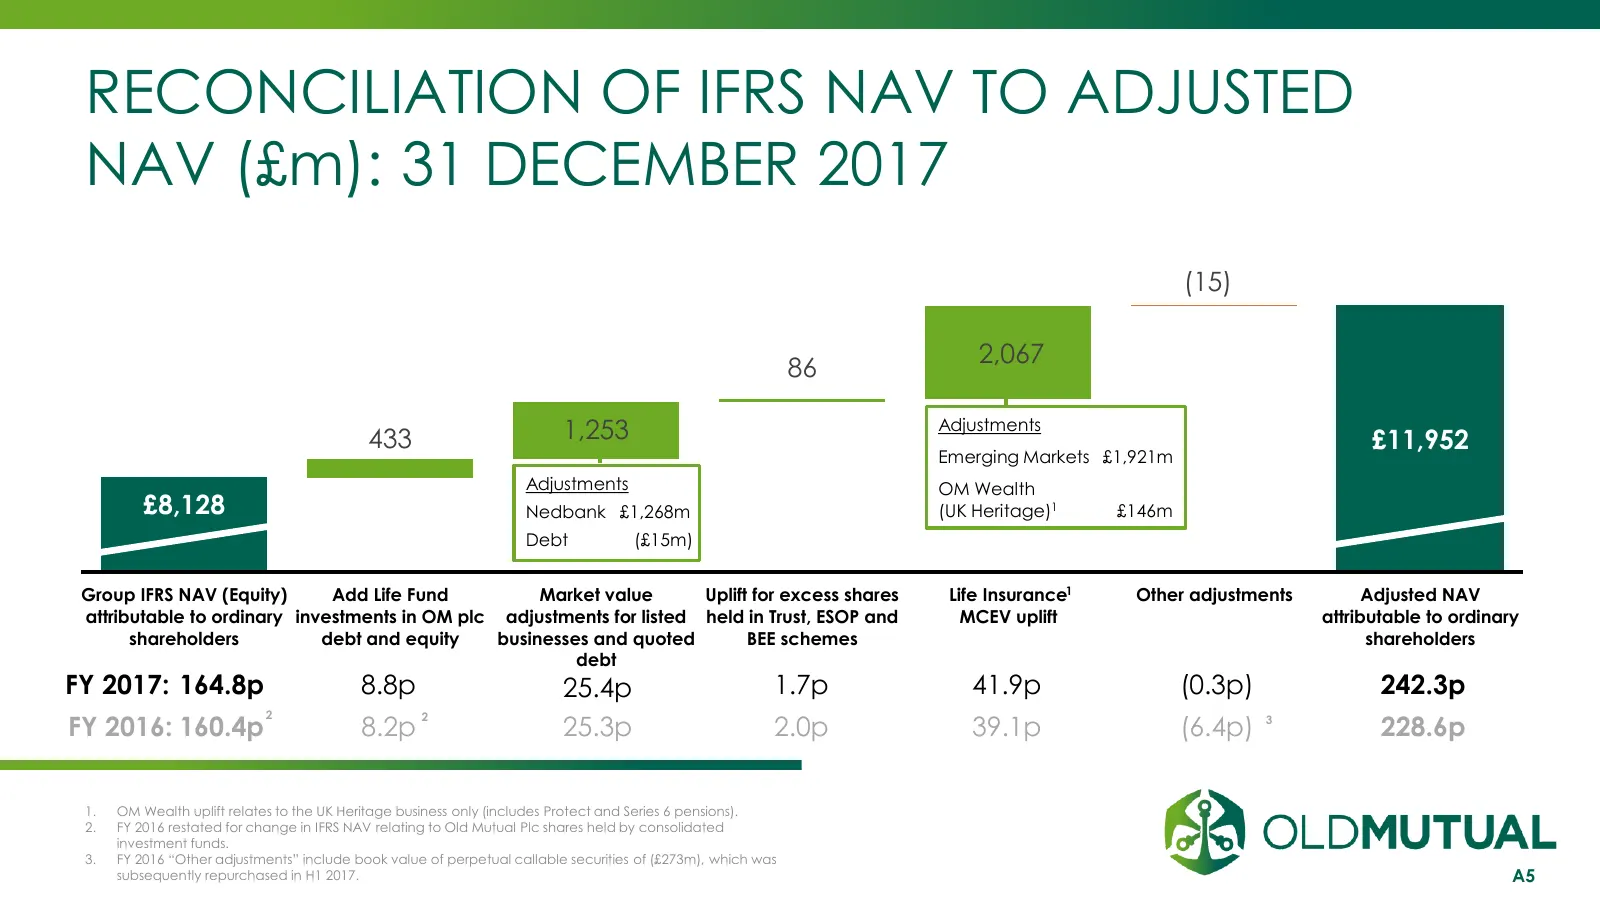
RECONCILIATION OF IFRS NAV TO ADJUSTED NAV (£m): 31 DECEMBER 2017 (15) 2,067 86 433 1,253 Adjustments £11,952 Emerging Markets £1,921m Adjustments OM Wealth £8,128 Nedbank £1,268m (UK Heritage)1 £146m Debt (£15m) Group IFRS NAV (Equity) Add Life Fund Market value Uplift for excess shares Life Insura
Slide 6: Movement in Adjusted NAV
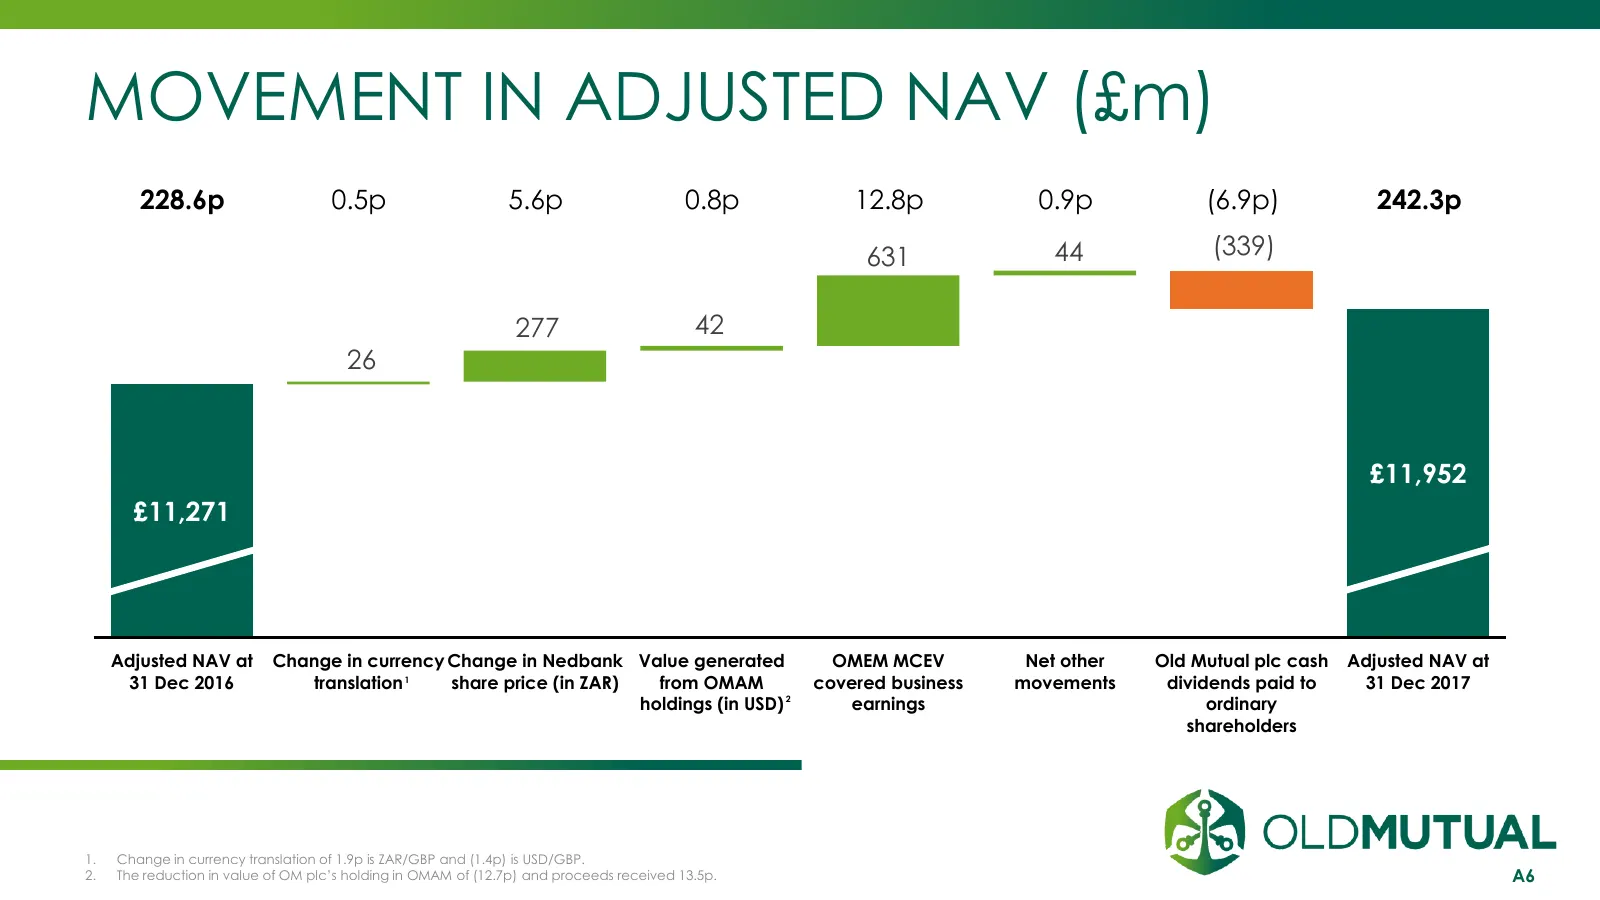
MOVEMENT IN ADJUSTED NAV (£m) 228.6p 0.5p 5.6p 0.8p 12.8p 0.9p (6.9p) 242.3p 631 44 (339) 277 42 26 £11,952 11,574 11,616 £11,271 11,297 Adjusted NAV at Change in currency Change in Nedbank Value generated OMEM MCEV Net other Old Mutual plc cash Adjusted NAV at 31 Dec 2016 translation 1 share price
Slide 7: Profile of IFRS Equity, Adjusted NAV and AOP
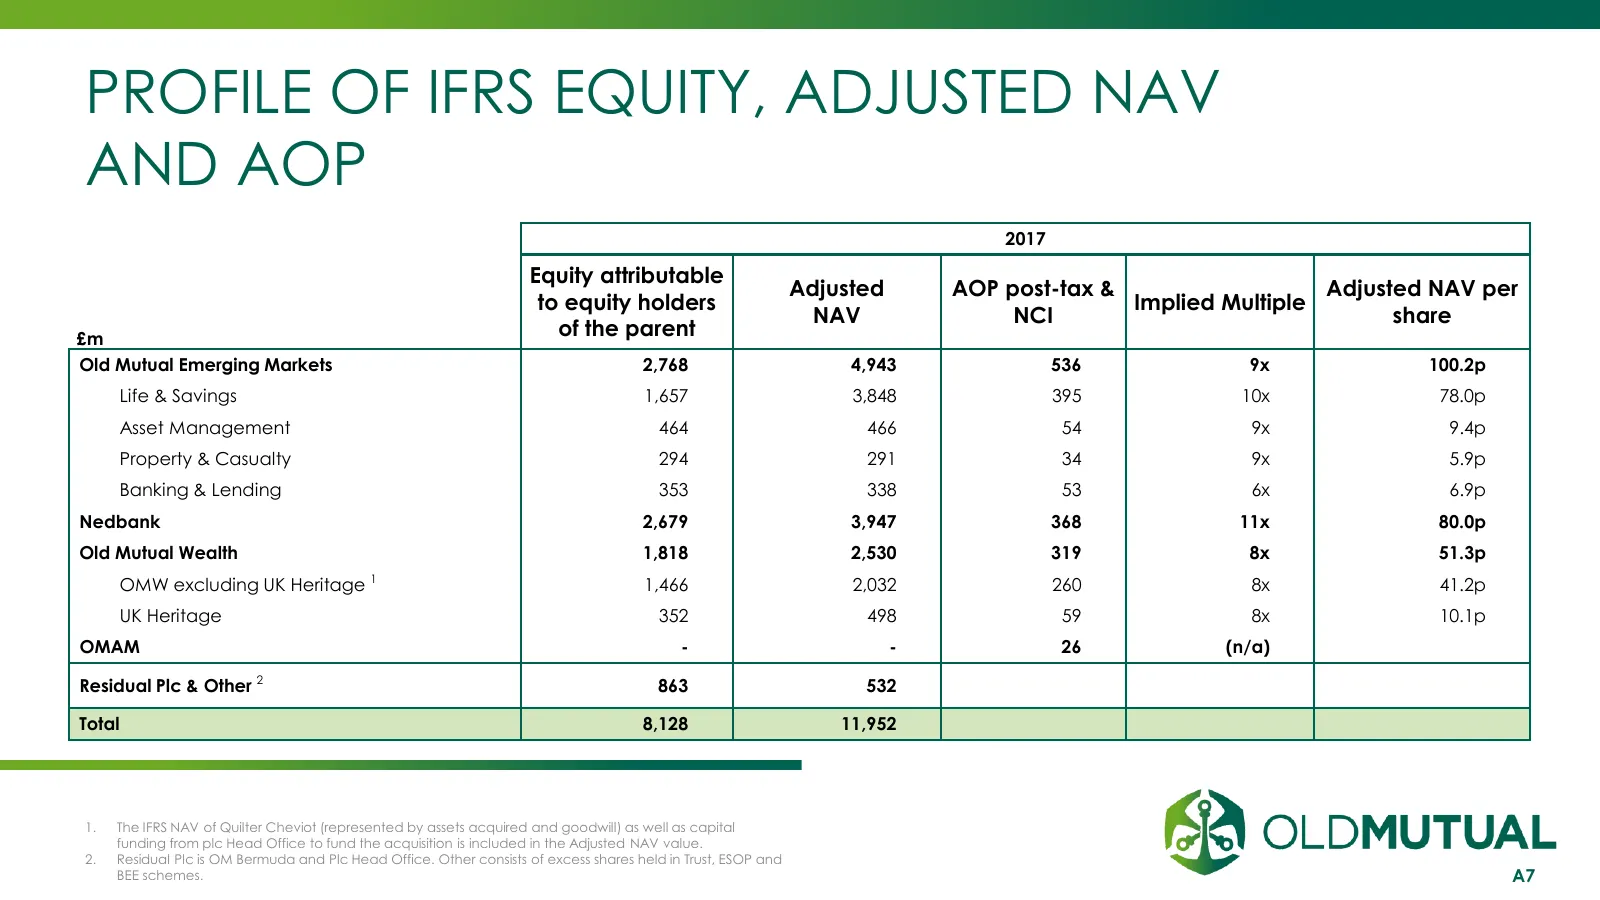
PROFILE OF IFRS EQUITY, ADJUSTED NAV AND AOP 2017 Equity attributable Adjusted AOP post-tax & Adjusted NAV per to equity holders Implied Multiple NAV NCI share £m of the parent Old Mutual Emerging Markets 2,768 4,943 536 9x 100.2p Life & Savings 1,657 3,848 395 10x 78.0p Asset Management 464 466 54
Slide 8: Delivering the Managed Separation in Line with Cost Estimates
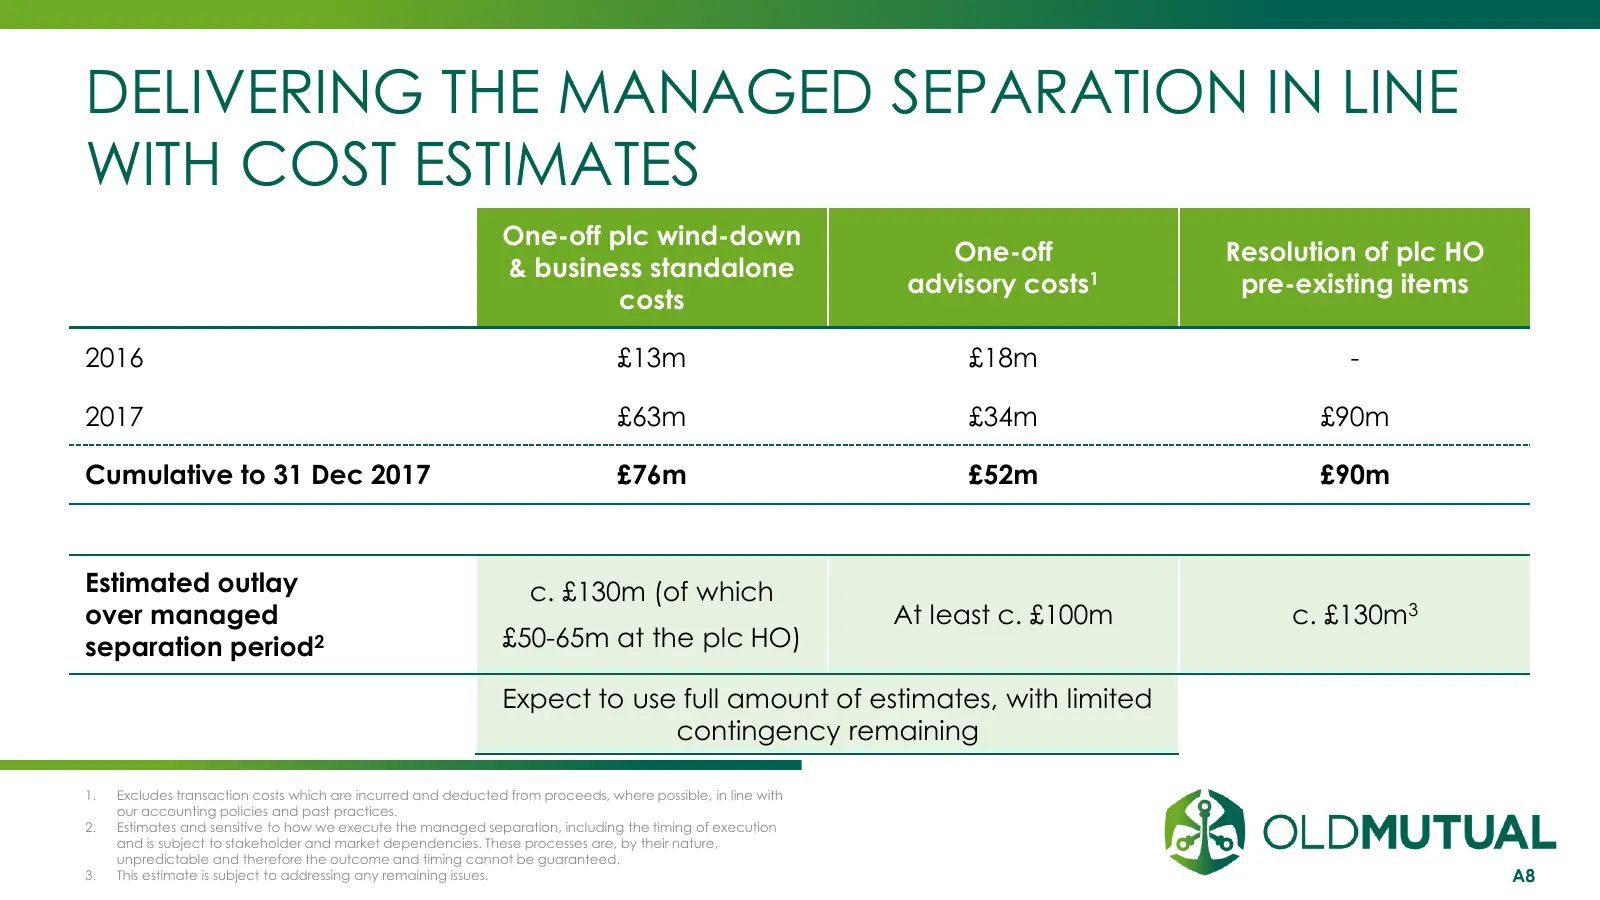
DELIVERING THE MANAGED SEPARATION IN LINE WITH COST ESTIMATES One-off plc wind-down One-off Resolution of plc HO & business standalone advisory costs1 pre-existing items costs 2016 £13m £18m - 2017 £63m £34m £90m Cumulative to 31 Dec 2017 £76m £52m £90m Estimated outlay c. £130m (of which over manag
Slide 9: Removing & Transitioning Plc Operational Costs
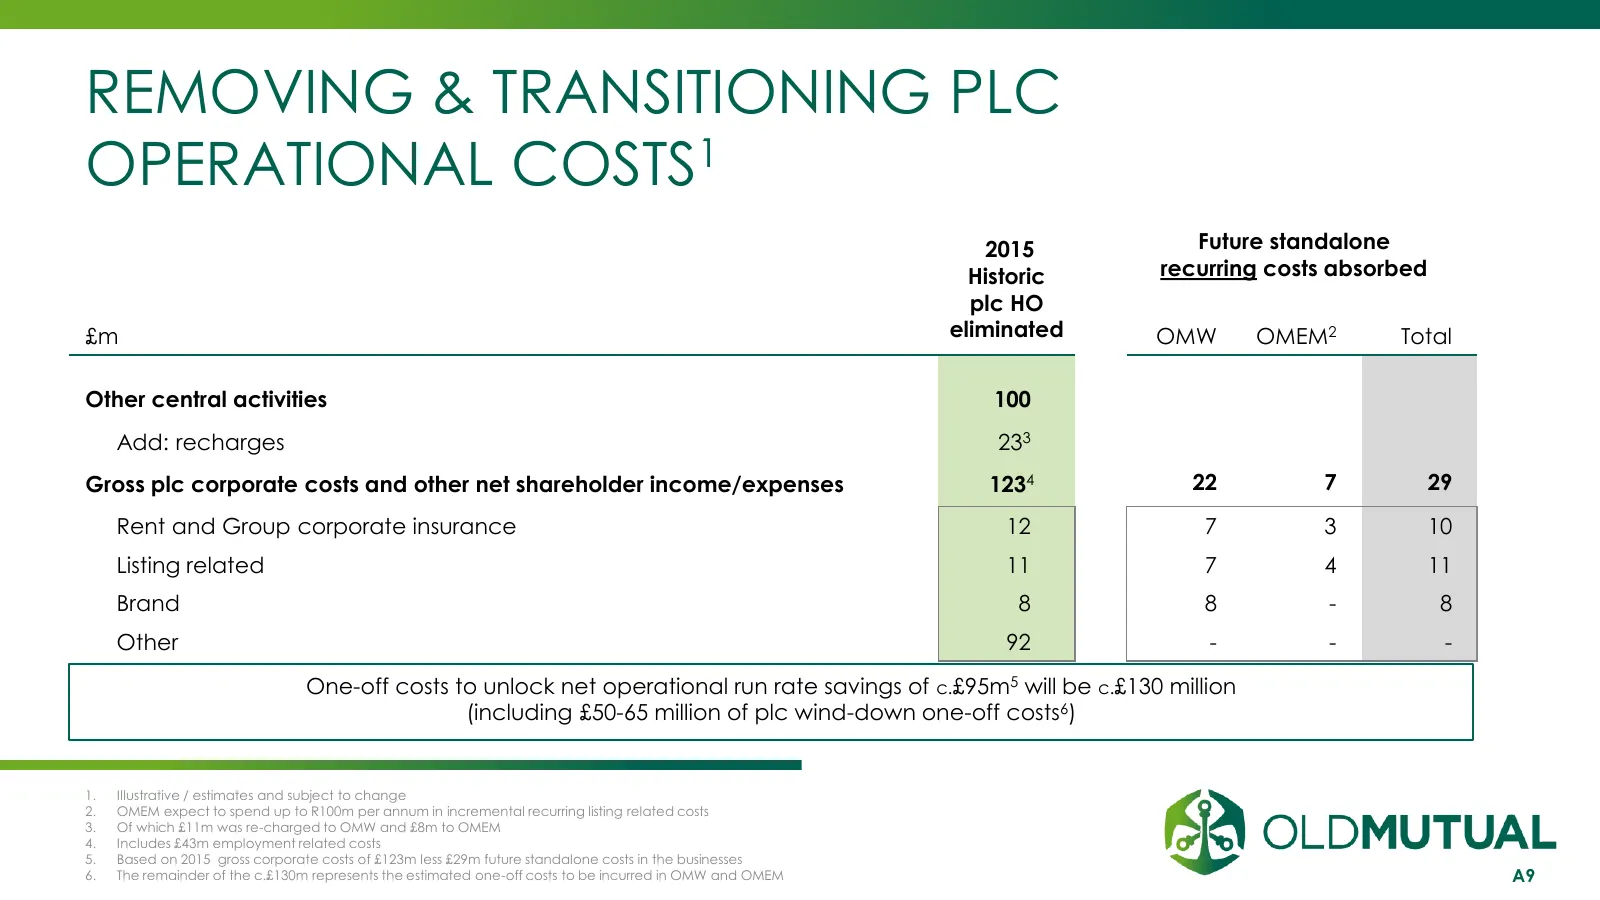
REMOVING & TRANSITIONING PLC OPERATIONAL COSTS1 2015 Future standalone Historic recurring costs absorbed plc HO £m eliminated OMW OMEM2 Total Other central activities 100 Add: recharges 233 Gross plc corporate costs and other net shareholder income/expenses 1234 . 22 7 29 Rent and Group corporate in
Slide 10: Illustrative Value Creation
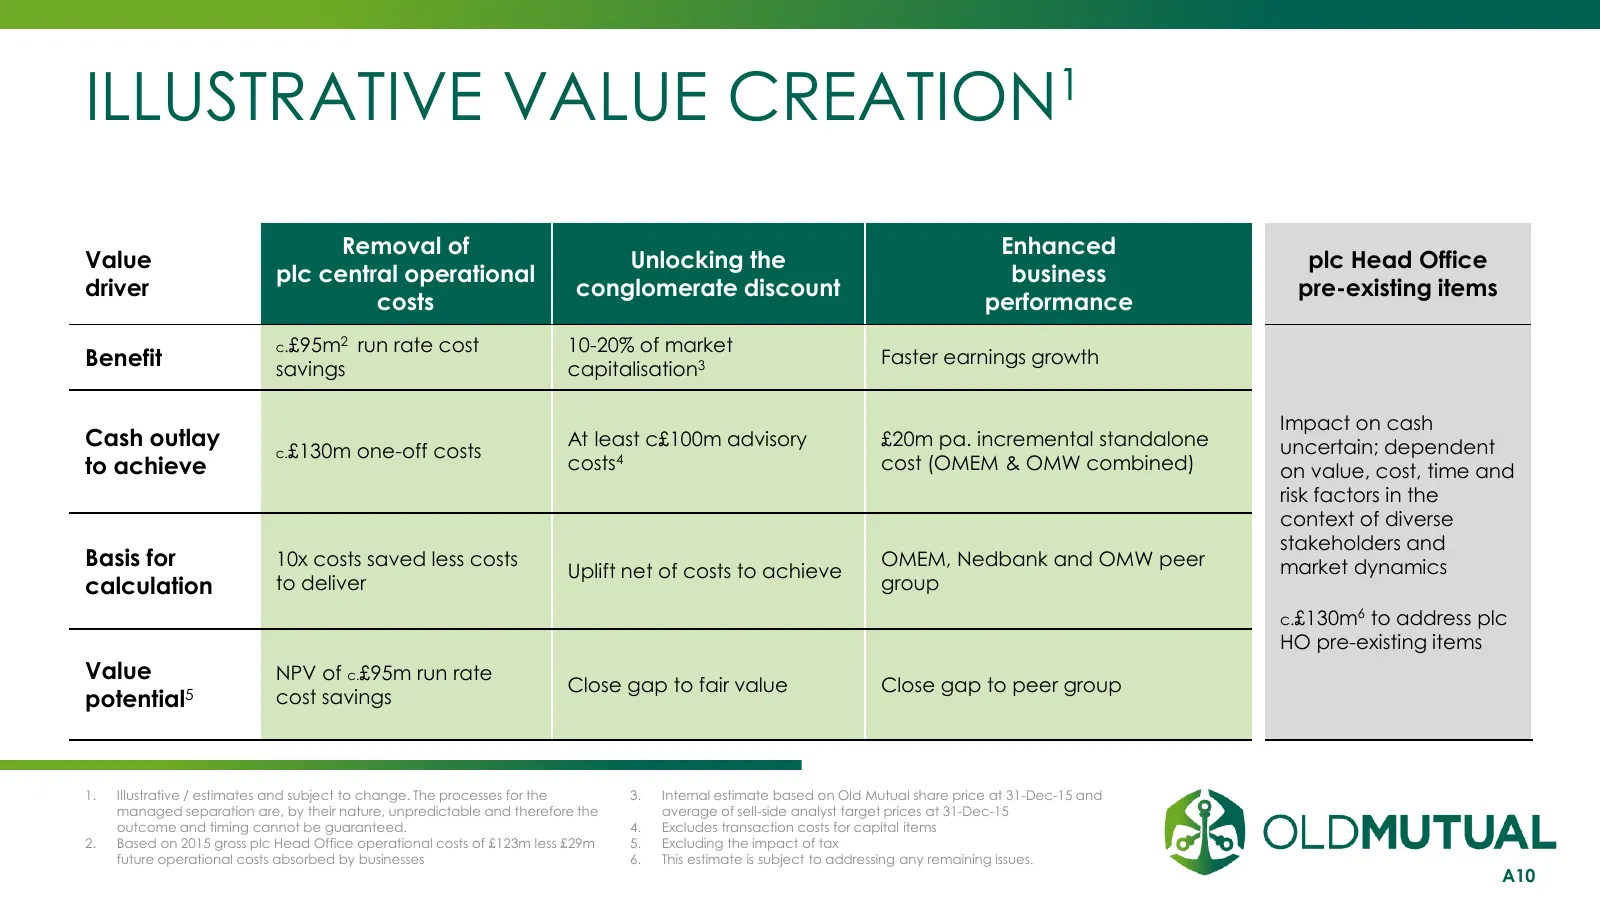
ILLUSTRATIVE VALUE CREATION1 Removal of Enhanced Value Unlocking the plc Head Office plc central operational business driver conglomerate discount pre-existing items costs performance c.£95m2 run rate cost 10-20% of market Benefit savings capitalisation3 Faster earnings growth Impact on cash Cash ou
Slide 11: Structure Pre and Post Managed Separation
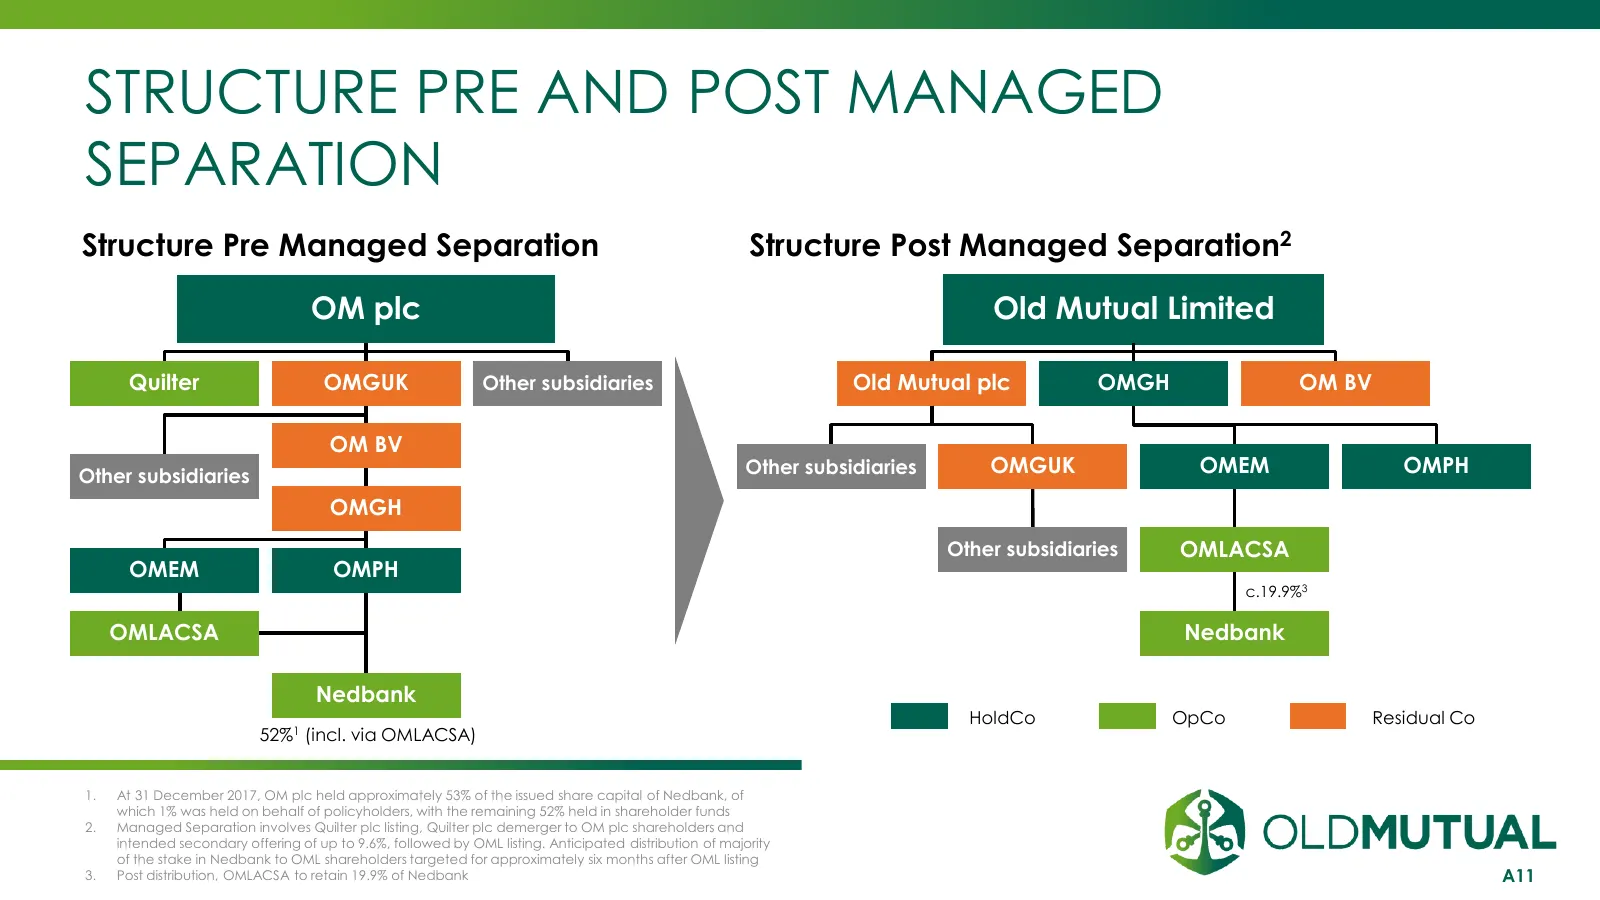
STRUCTURE PRE AND POST MANAGED SEPARATION Structure Pre Managed Separation Structure Post Managed Separation2 OM plc Old Mutual Limited Quilter OMGUK Other subsidiaries Old Mutual plc OMGH OM BV OM BV Other subsidiaries Other subsidiaries OMGUK OMEM OMPH OMGH Other subsidiaries OMLACSA OMEM OMPH c.1
Slide 12: Appendix 2: Capital / Treasury
APPENDIX 2 CAPITAL / TREASURY INVESTMENT | SAVINGS | INSURANCE | BANKING
Slide 13: Liquidity & Debt
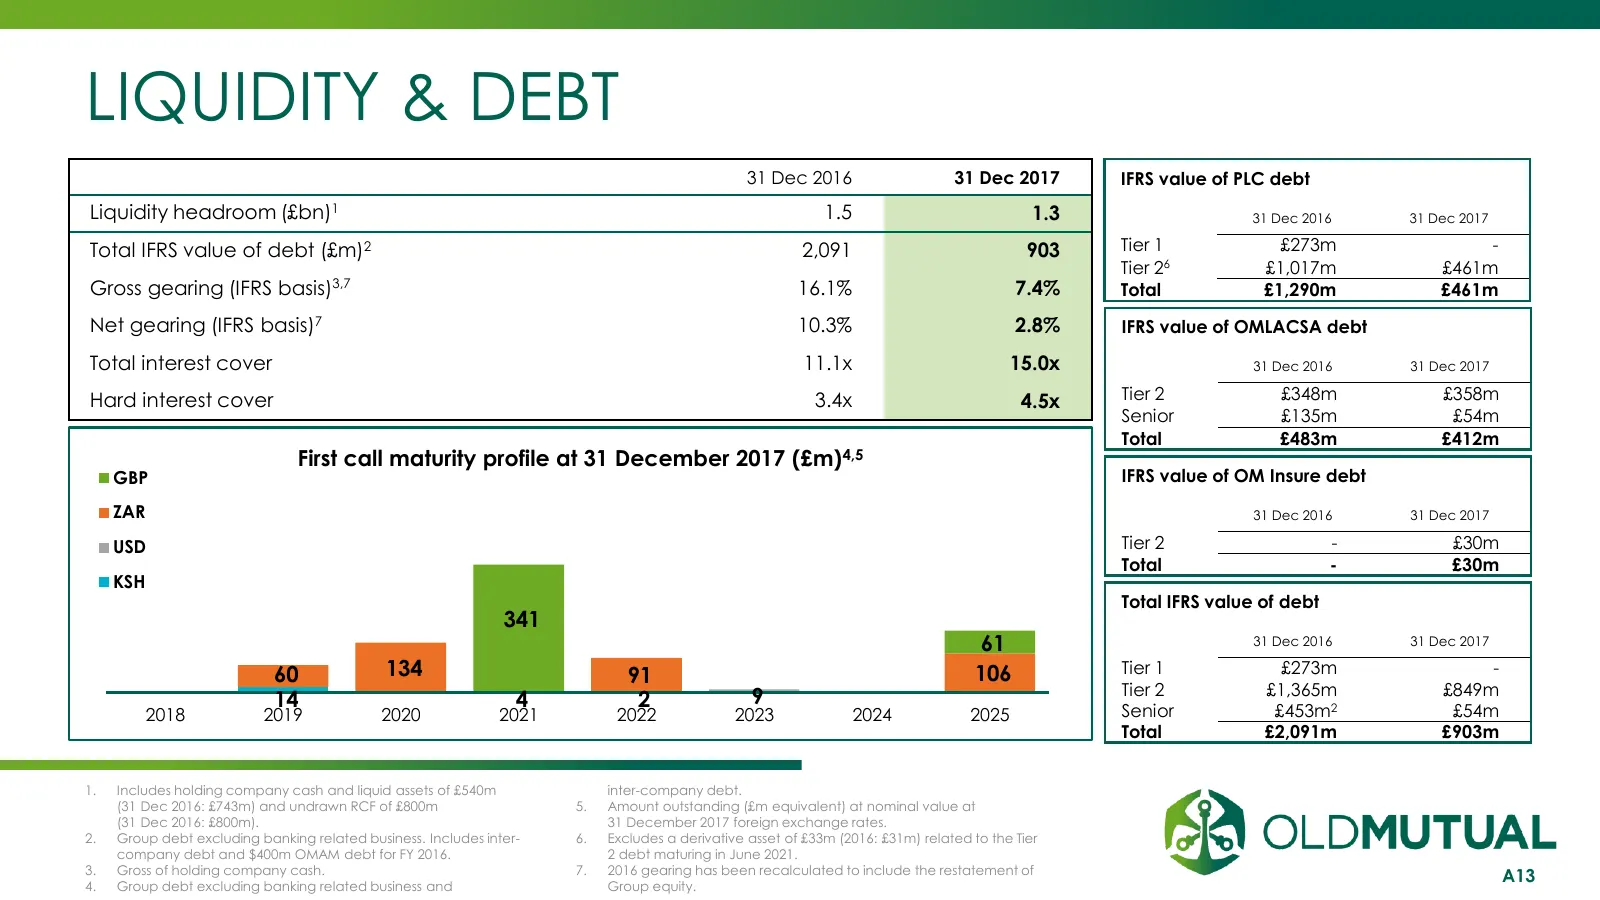
LIQUIDITY & DEBT 31 Dec 2016 31 Dec 2017 IFRS value of PLC debt Liquidity headroom (£bn)1 1.5 1.3 31 Dec 2016 31 Dec 2017 Total IFRS value of debt (£m)2 2,091 903 Tier 1 £273m - Tier 26 £1,017m £461m Gross gearing (IFRS basis)3,7 16.1% 7.4% Total £1,290m £461m Net gearing (IFRS basis)7 10.3% 2.8% IF
Slide 14: Old Mutual Group Company Ratings
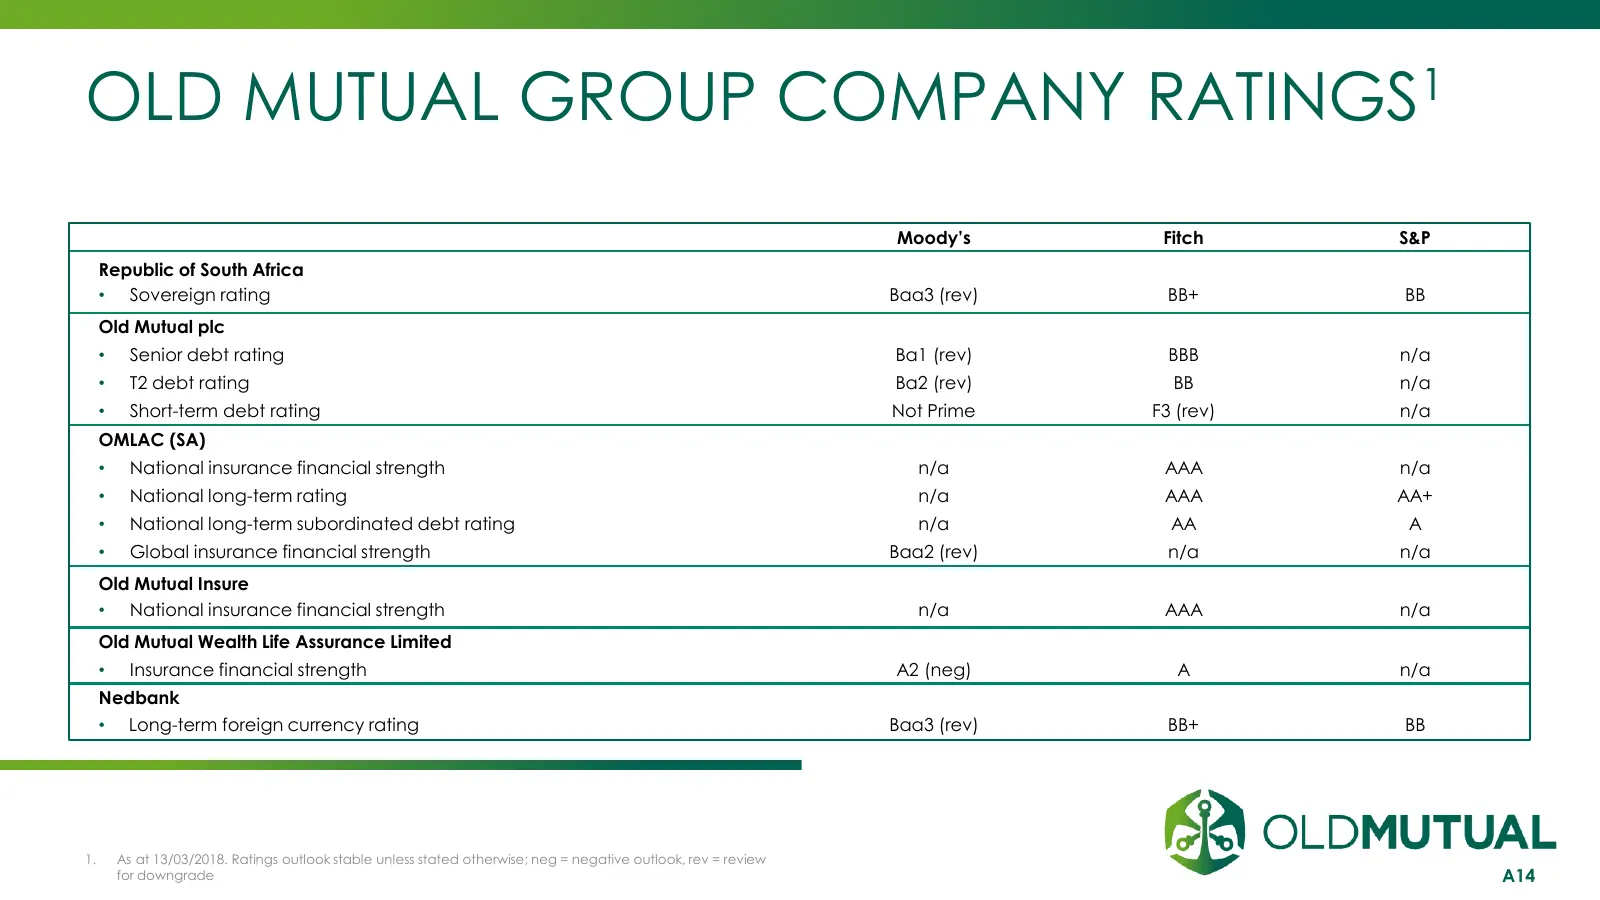
OLD MUTUAL GROUP COMPANY RATINGS1 Moody’s Fitch S&P Republic of South Africa • Sovereign rating Baa3 (rev) BB+ BB Old Mutual plc • Senior debt rating Ba1 (rev) BBB n/a • T2 debt rating Ba2 (rev) BB n/a • Short-term debt rating Not Prime F3 (rev) n/a OMLAC (SA) • National insurance financial strength
Slide 15: Appendix 3: Solvency II
APPENDIX 3 SOLVENCY II INVESTMENT | SAVINGS | INSURANCE | BANKING
Slide 16: Solvency II – Developments in 2017
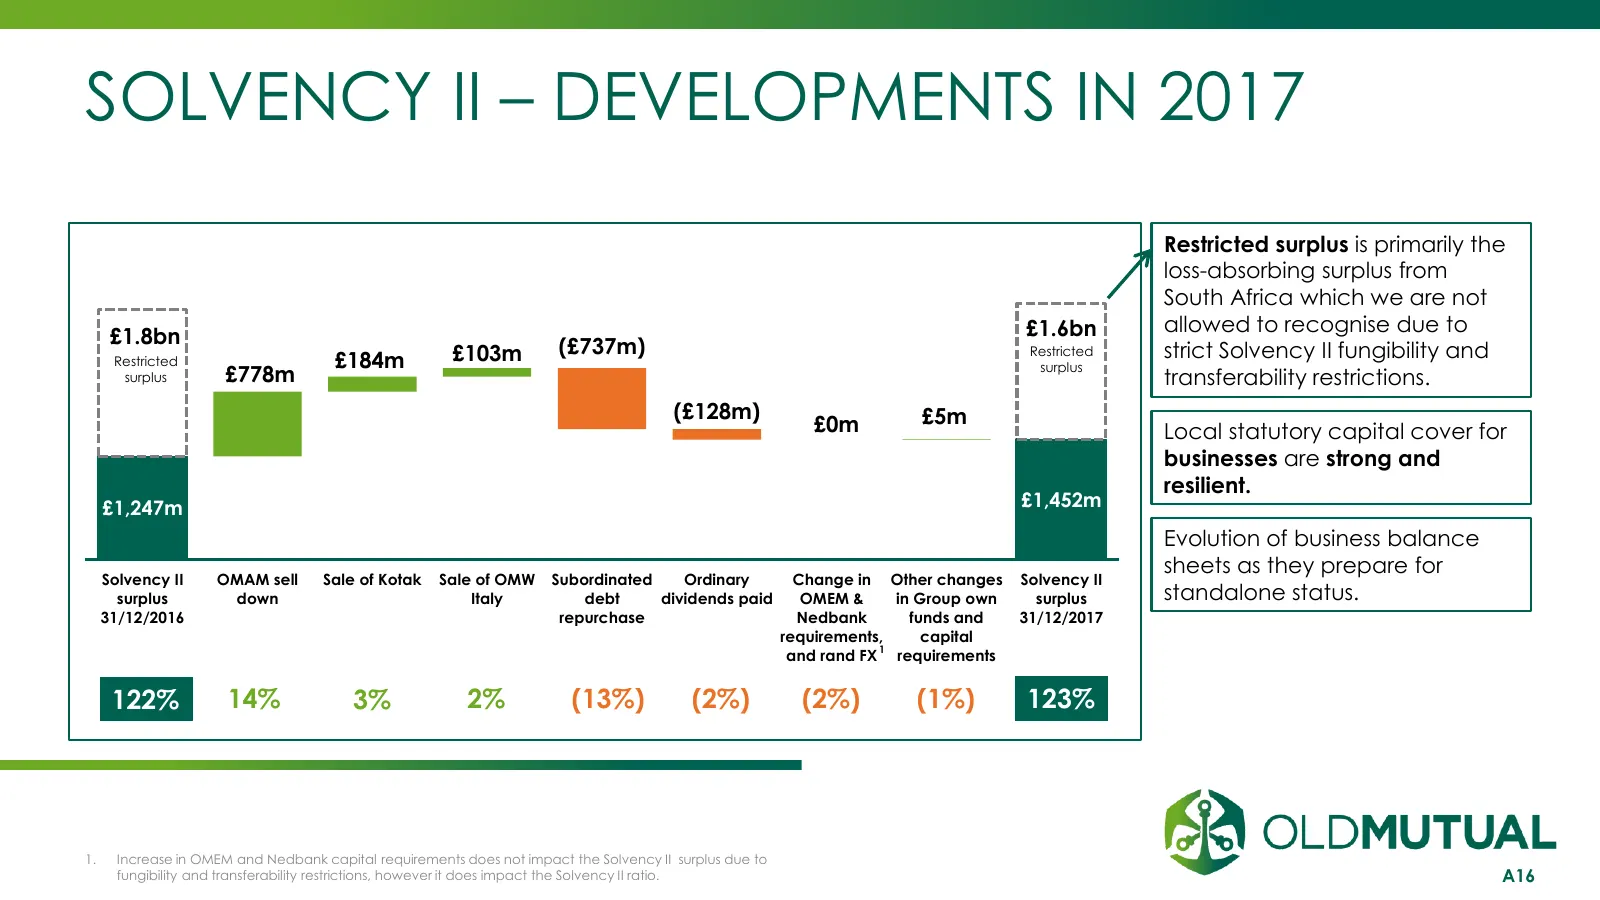
SOLVENCY II – DEVELOPMENTS IN 2017 Restricted surplus is primarily the loss-absorbing surplus from South Africa which we are not £1.6bn allowed to recognise due to £1.8bn (£737m) Restricted £184m £103m Restricted strict Solvency II fungibility and surplus surplus £778m transferability restrictions.
Slide 17: Composition of Solvency II Results
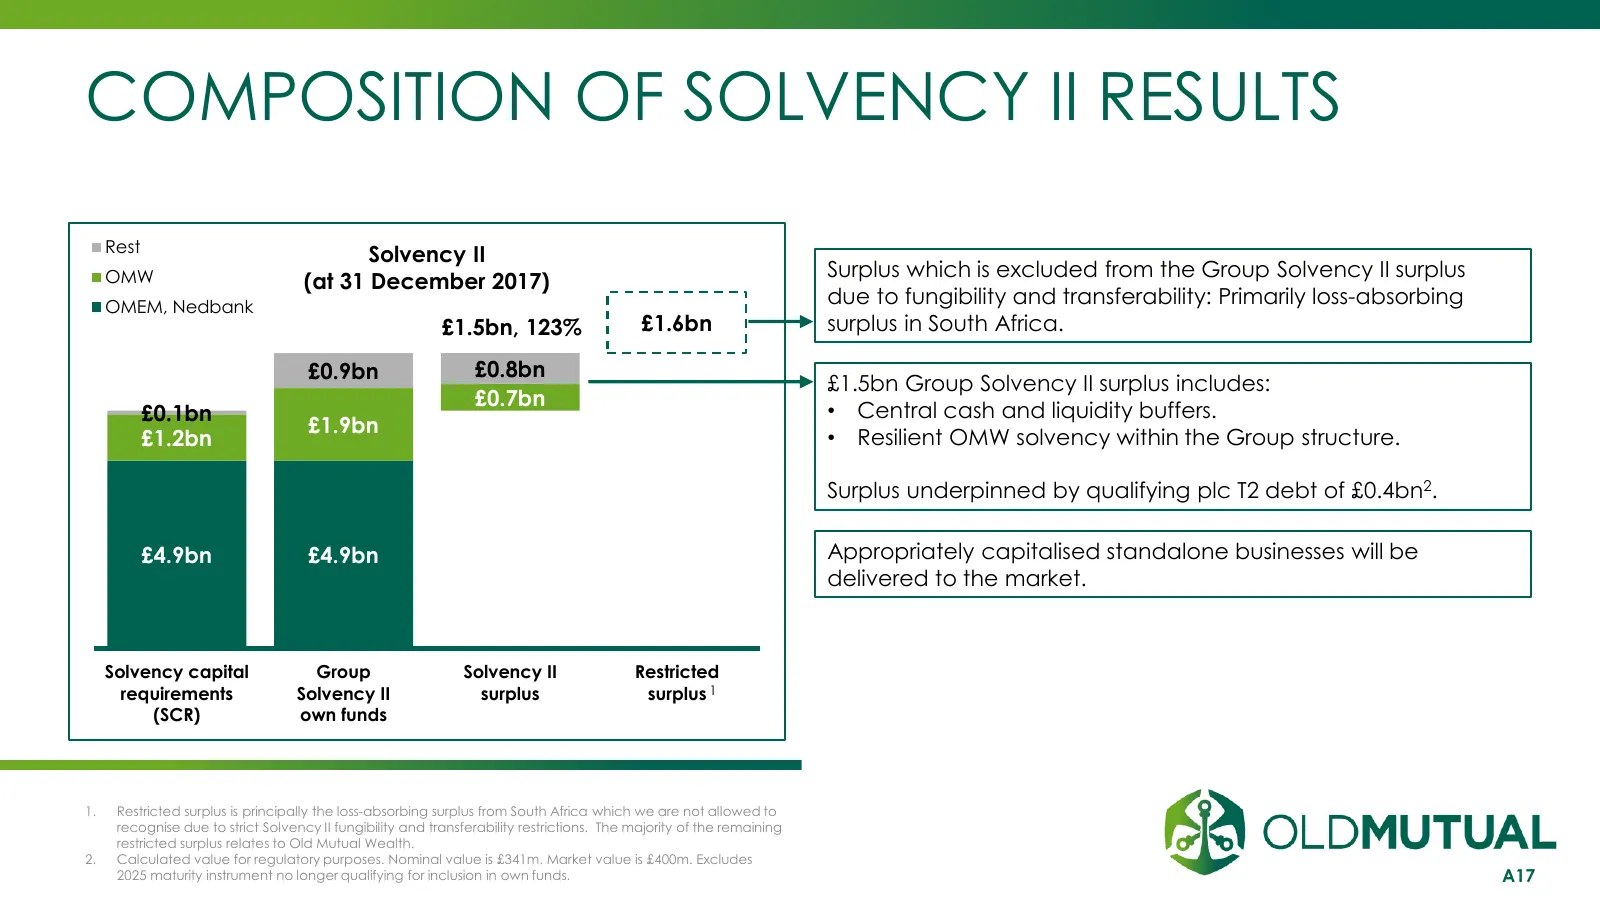
COMPOSITION OF SOLVENCY II RESULTS Rest Solvency II OMW Surplus which is excluded from the Group Solvency II surplus (at 31 December 2017) OMEM, Nedbank due to fungibility and transferability: Primarily loss-absorbing £1.5bn, 123% £1.6bn surplus in South Africa. £0.9bn £0.8bn £1.5bn Group Solvency I
Slide 18: Appendix 4: Old Mutual Emerging Markets
APPENDIX 4 OLD MUTUAL EMERGING MARKETS INVESTMENT | SAVINGS | INSURANCE | BANKING
Slide 19: Old Mutual Emerging Markets: Adjusted NAV
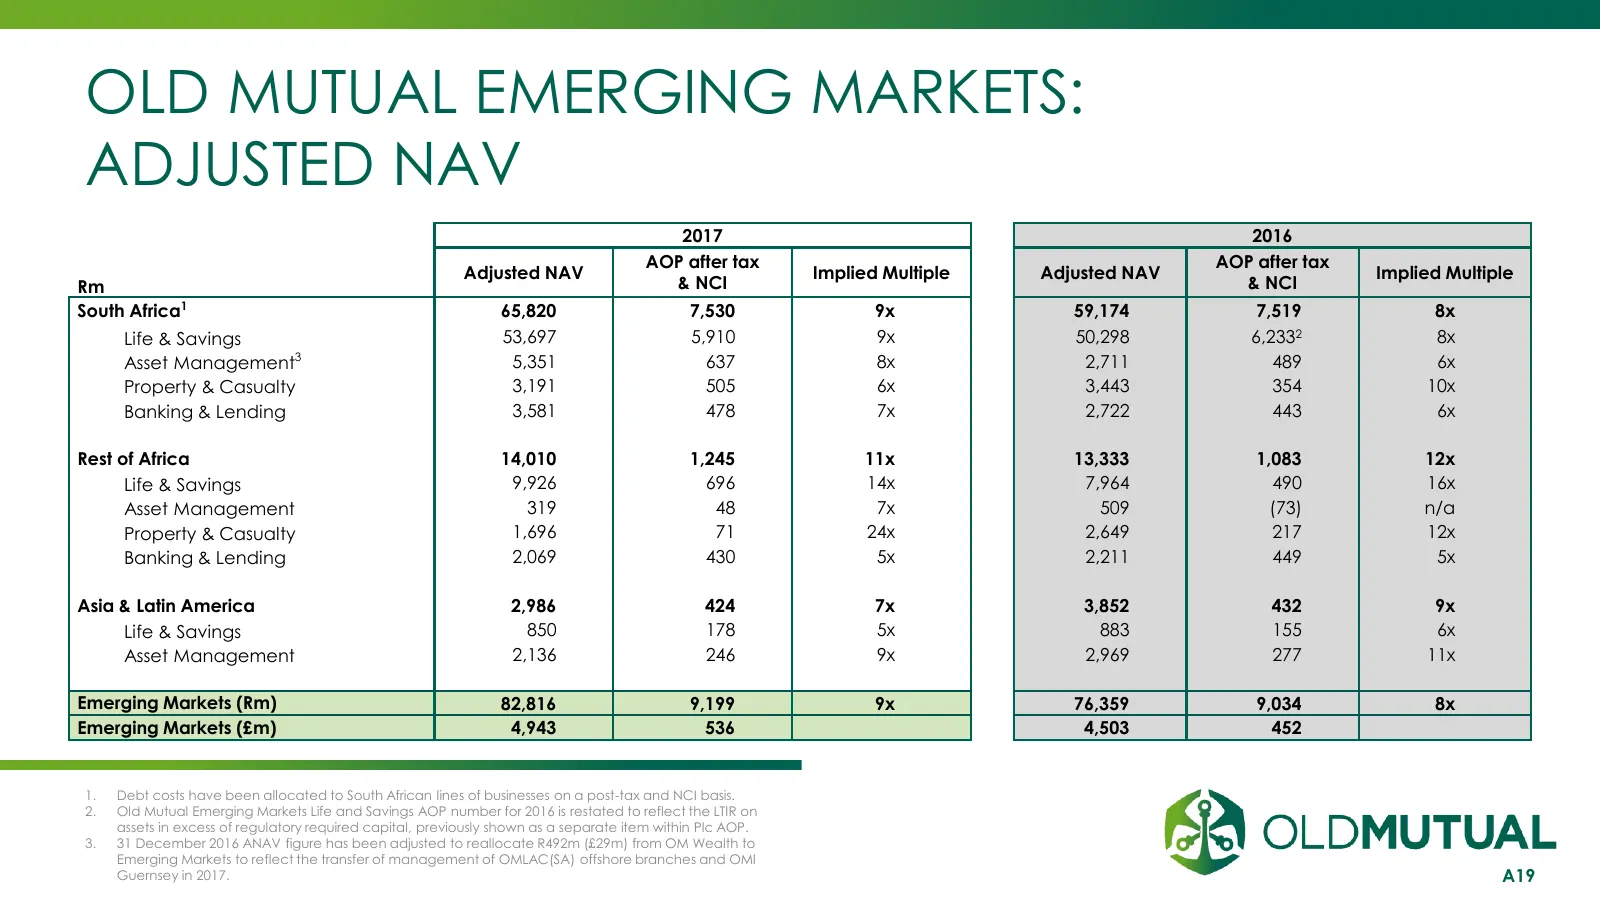
OLD MUTUAL EMERGING MARKETS: ADJUSTED NAV 2017 2016 AOP after tax AOP after tax Adjusted NAV Implied Multiple Adjusted NAV Implied Multiple Rm & NCI & NCI South Africa1 65,820 7,530 9x 59,174 7,519 8x Life & Savings 53,697 5,910 9x 50,298 6,2332 8x Asset Management3 5,351 637 8x 2,711 489 6x Propert
Slide 20: Segmental Performance on a Like-for-Like Basis (Old Basis)
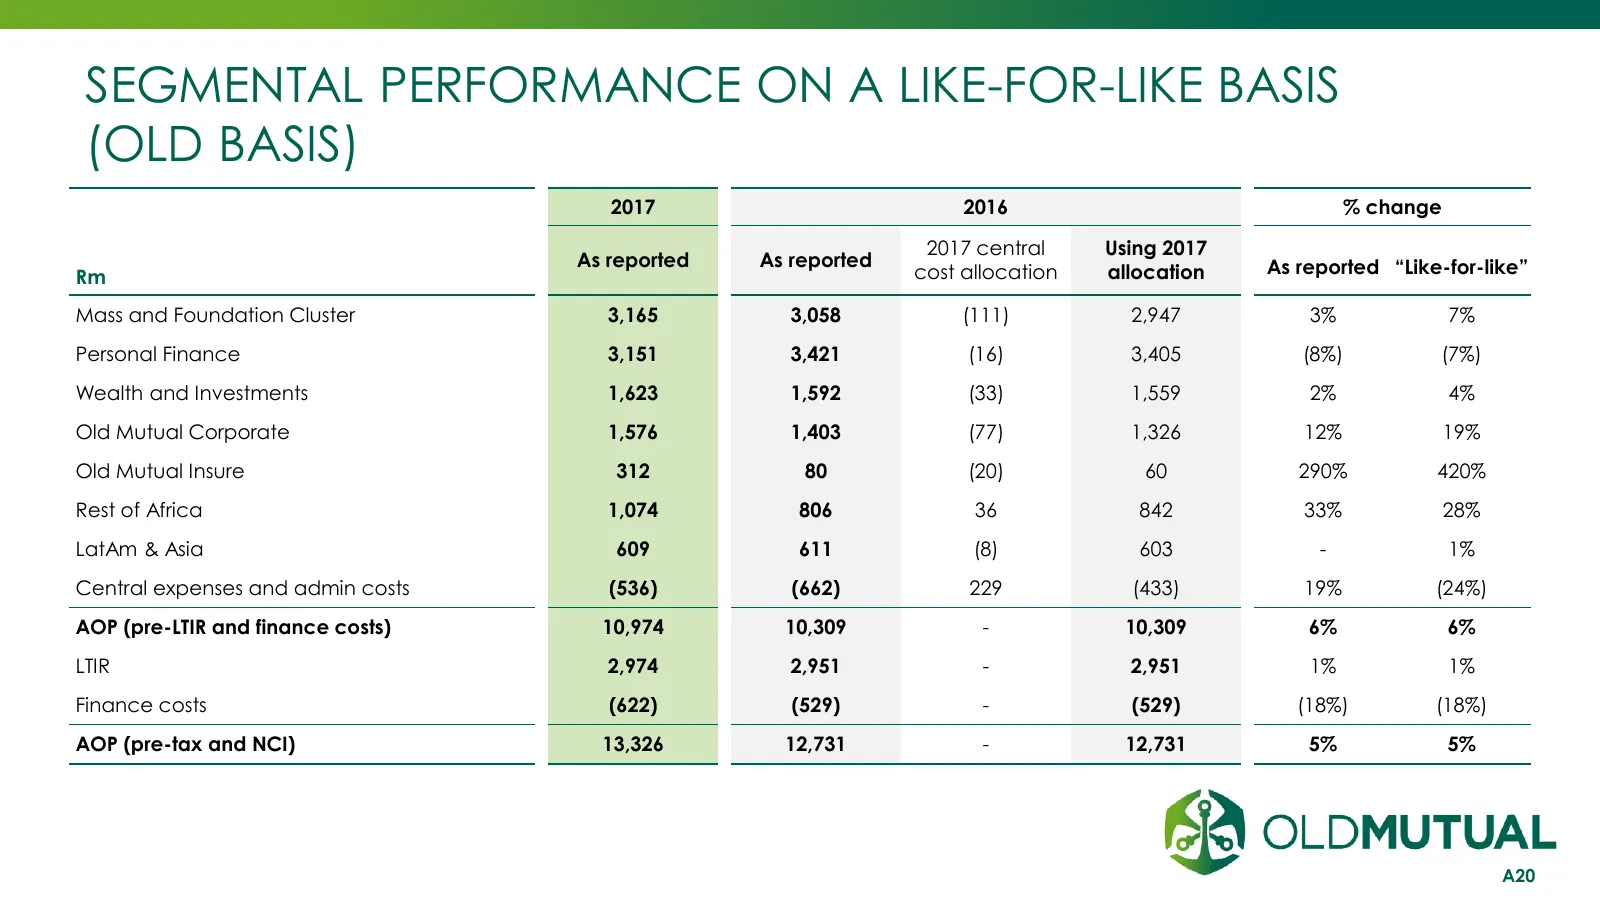
SEGMENTAL PERFORMANCE ON A LIKE-FOR-LIKE BASIS (OLD BASIS) 2017 2016 % change 2017 central Using 2017 As reported As reported As reported “Like-for-like” Rm cost allocation allocation Mass and Foundation Cluster 3,165 3,058 (111) 2,947 3% 7% Personal Finance 3,151 3,421 (16) 3,405 (8%) (7%) Wealth a
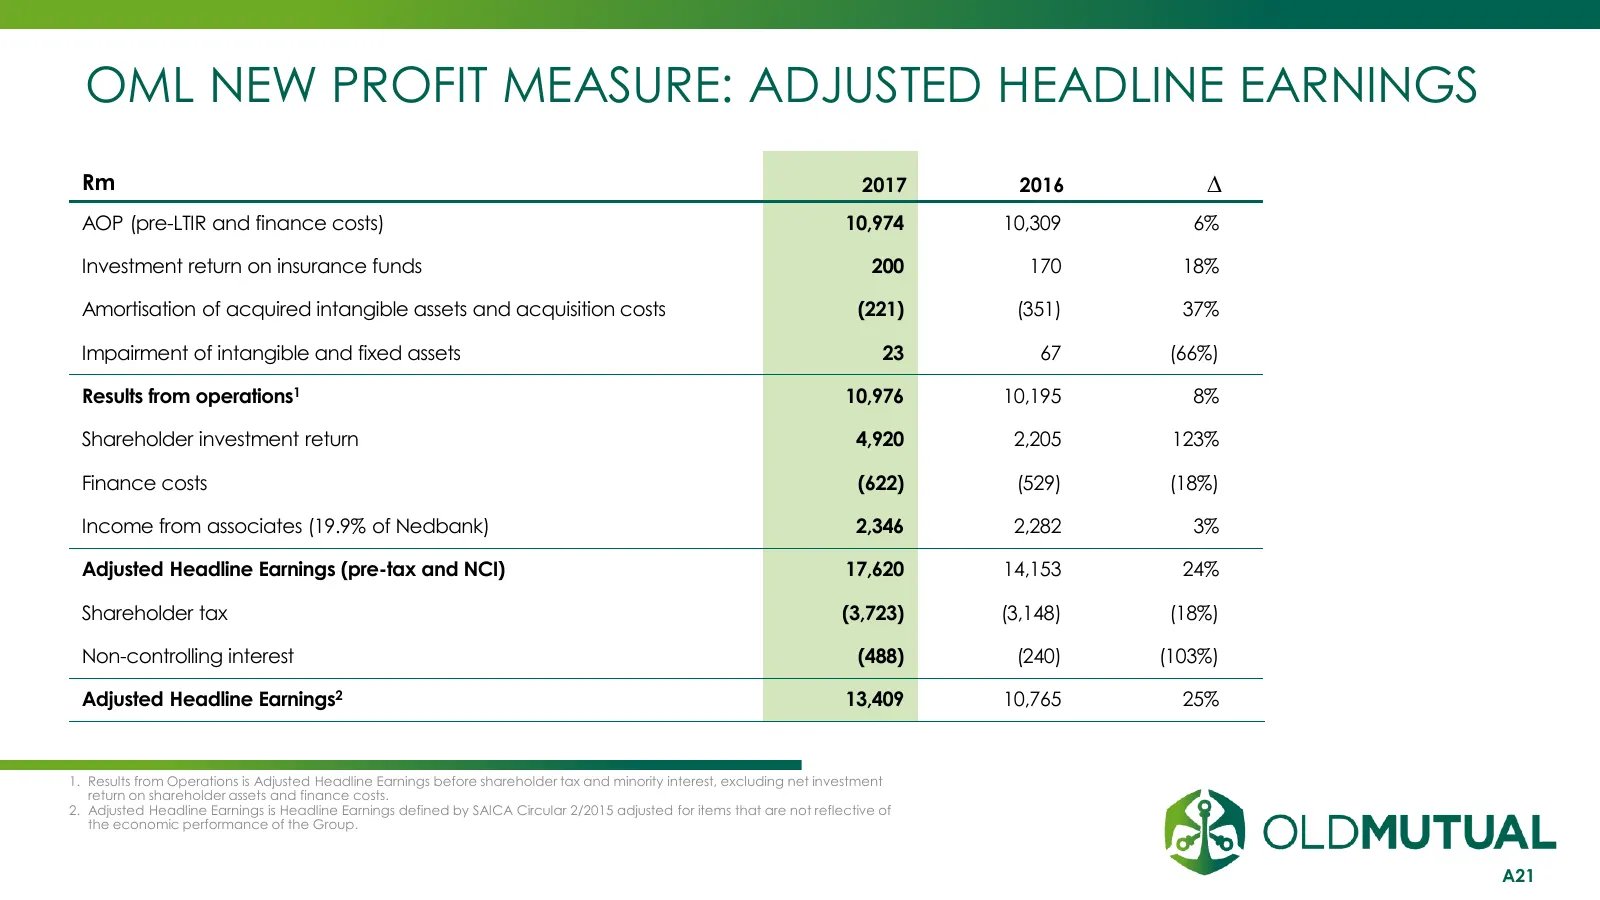
Slide 21: OML New Profit Measure: Adjusted Headline Earnings
OML NEW PROFIT MEASURE: ADJUSTED HEADLINE EARNINGS Rm 2017 2016 ∆ AOP (pre-LTIR and finance costs) 10,974 10,309 6% Investment return on insurance funds 200 170 18% Amortisation of acquired intangible assets and acquisition costs (221) (351) 37% Impairment of intangible and fixed assets 23 67 (66%)
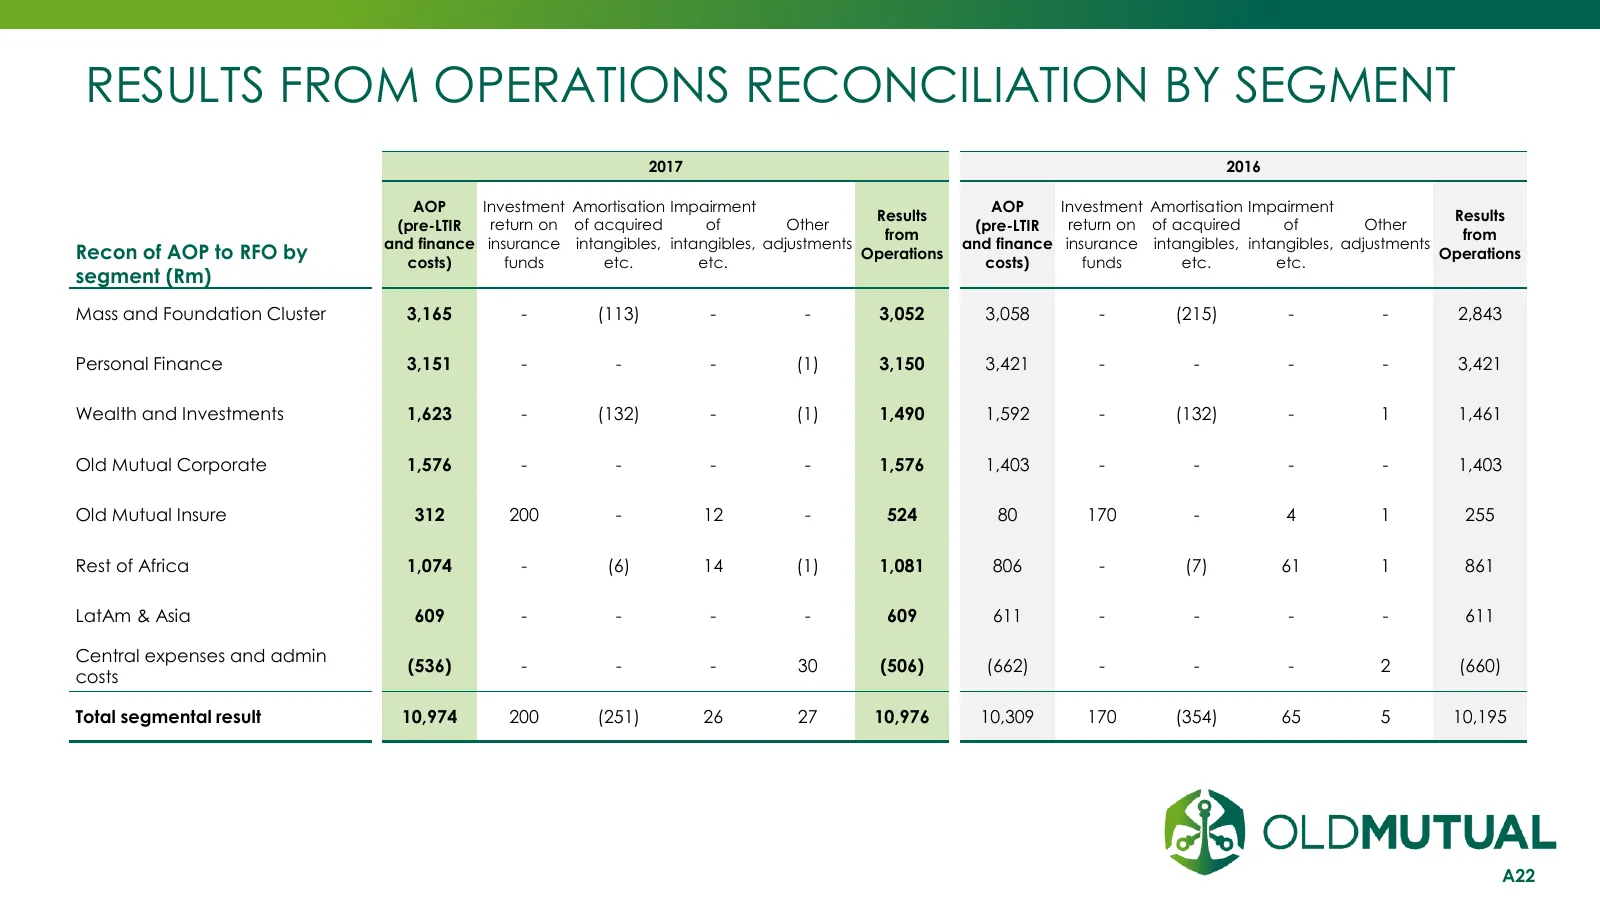
Slide 22: Results from Operations Reconciliation by Segment
RESULTS FROM OPERATIONS RECONCILIATION BY SEGMENT 2017 2016 AOP Investment Amortisation Impairment AOP Investment Amortisation Impairment Results Results (pre-LTIR return on of acquired of Other (pre-LTIR return on of acquired of Other from from and finance insurance intangibles, intangibles, adjust
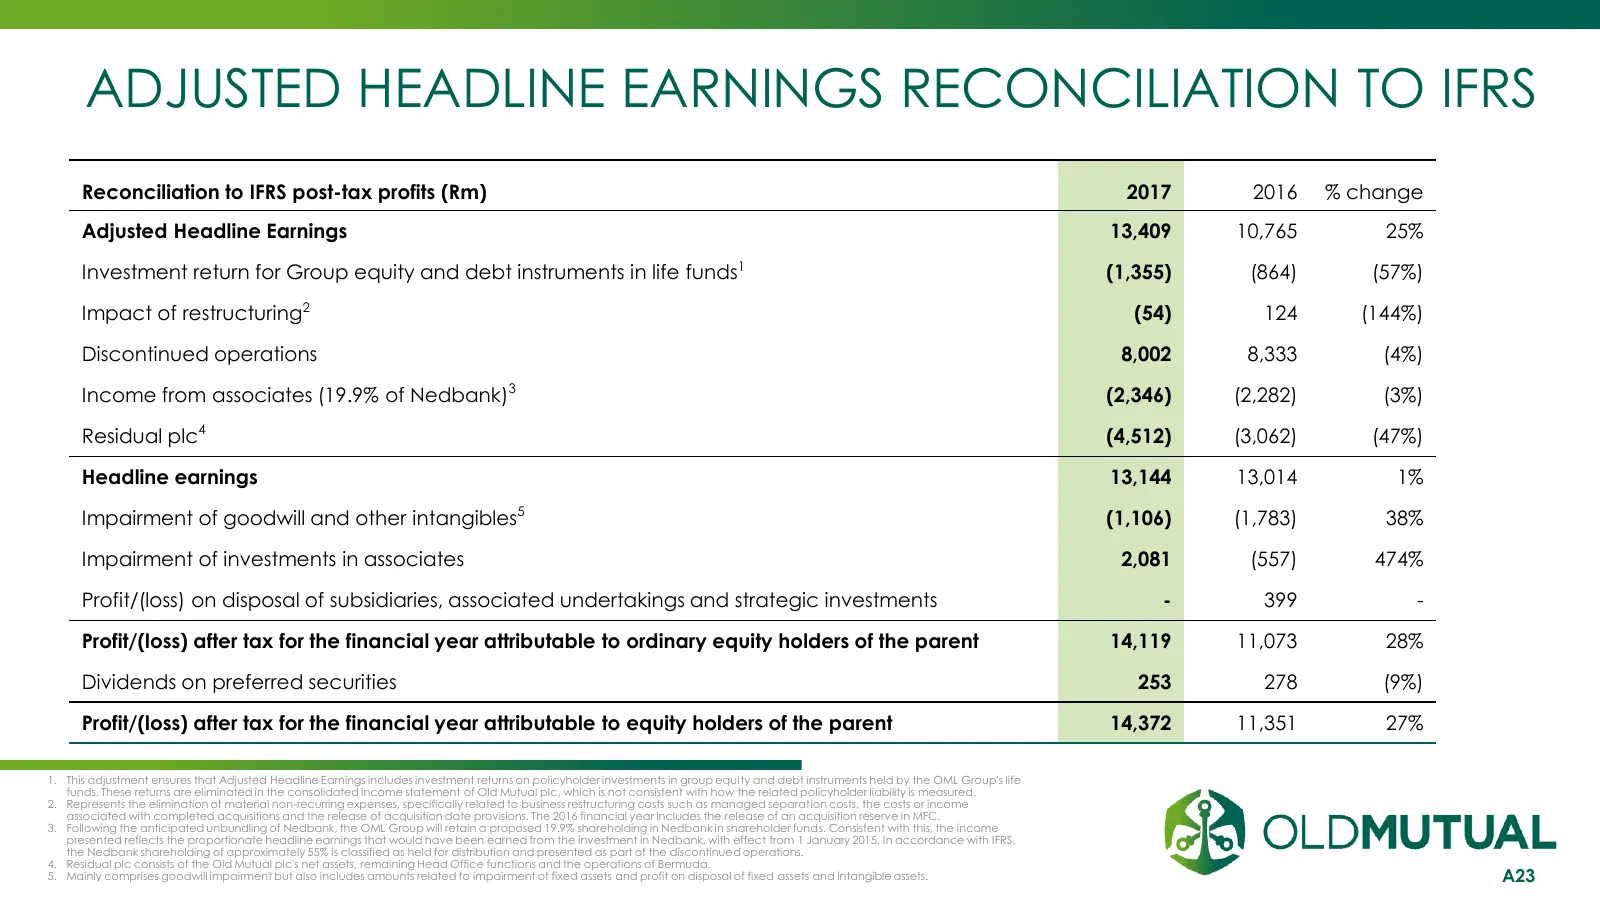
Slide 23: Adjusted Headline Earnings Reconciliation to IFRS
ADJUSTED HEADLINE EARNINGS RECONCILIATION TO IFRS Reconciliation to IFRS post-tax profits (Rm) 2017 2016 % change Adjusted Headline Earnings 13,409 10,765 25% Investment return for Group equity and debt instruments in life funds1 (1,355) (864) (57%) Impact of restructuring2 (54) 124 (144%) Discontin
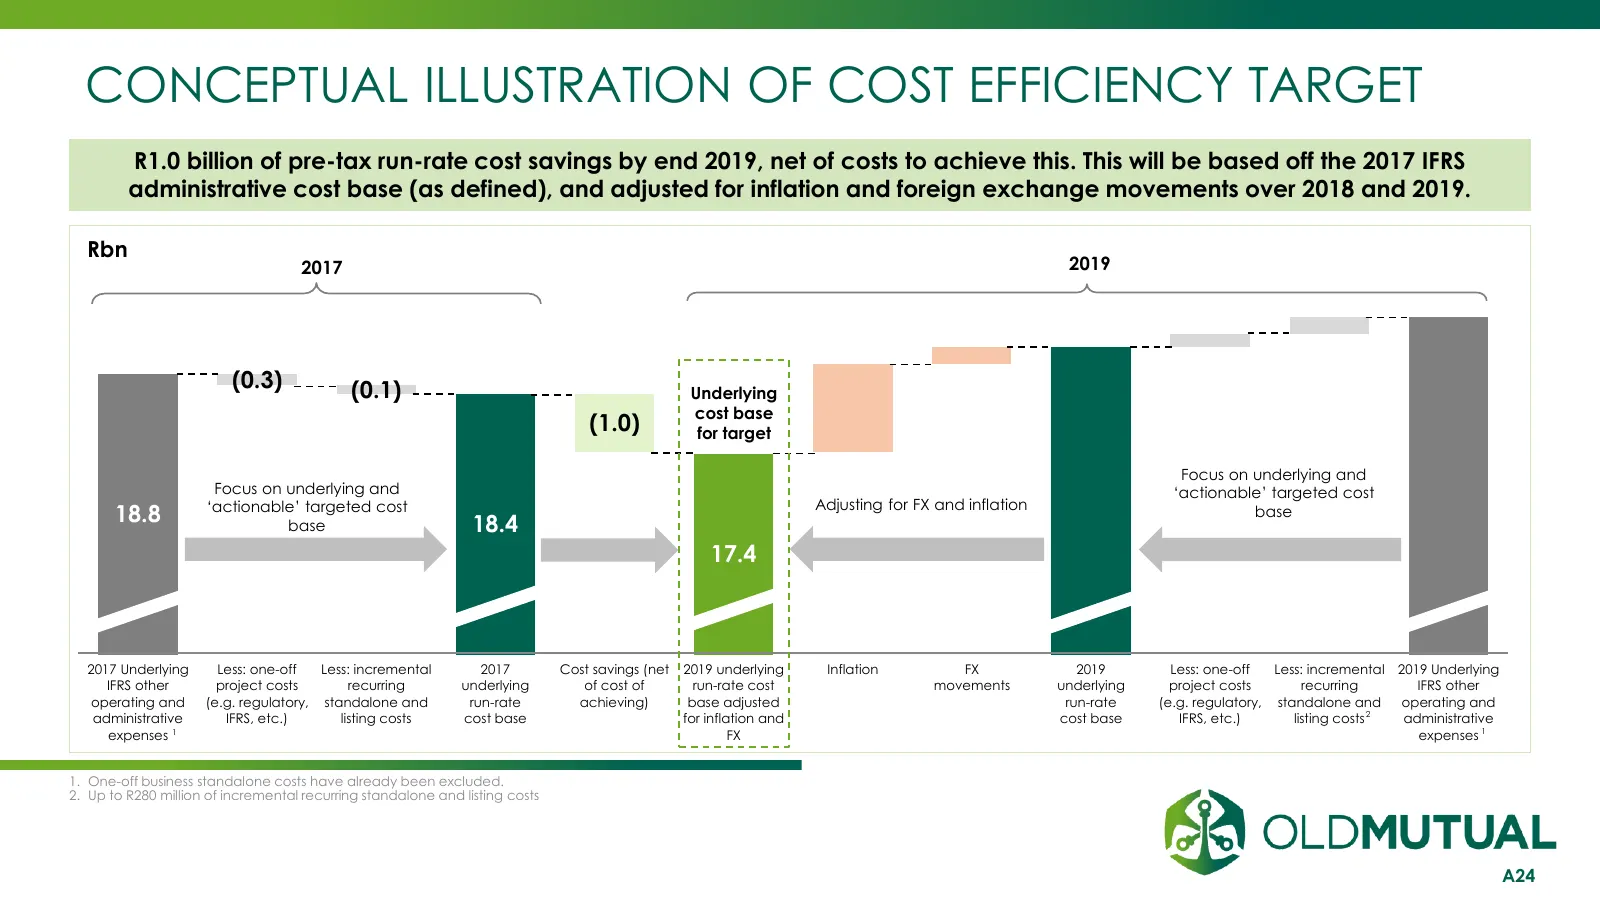
Slide 24: Conceptual Illustration of Cost Efficiency Target
CONCEPTUAL ILLUSTRATION OF COST EFFICIENCY TARGET R1.0 billion of pre-tax run-rate cost savings by end 2019, net of costs to achieve this. This will be based off the 2017 IFRS administrative cost base (as defined), and adjusted for inflation and foreign exchange movements over 2018 and 2019. Rbn 201
Slide 25: Solvency Assessment and Management Framework
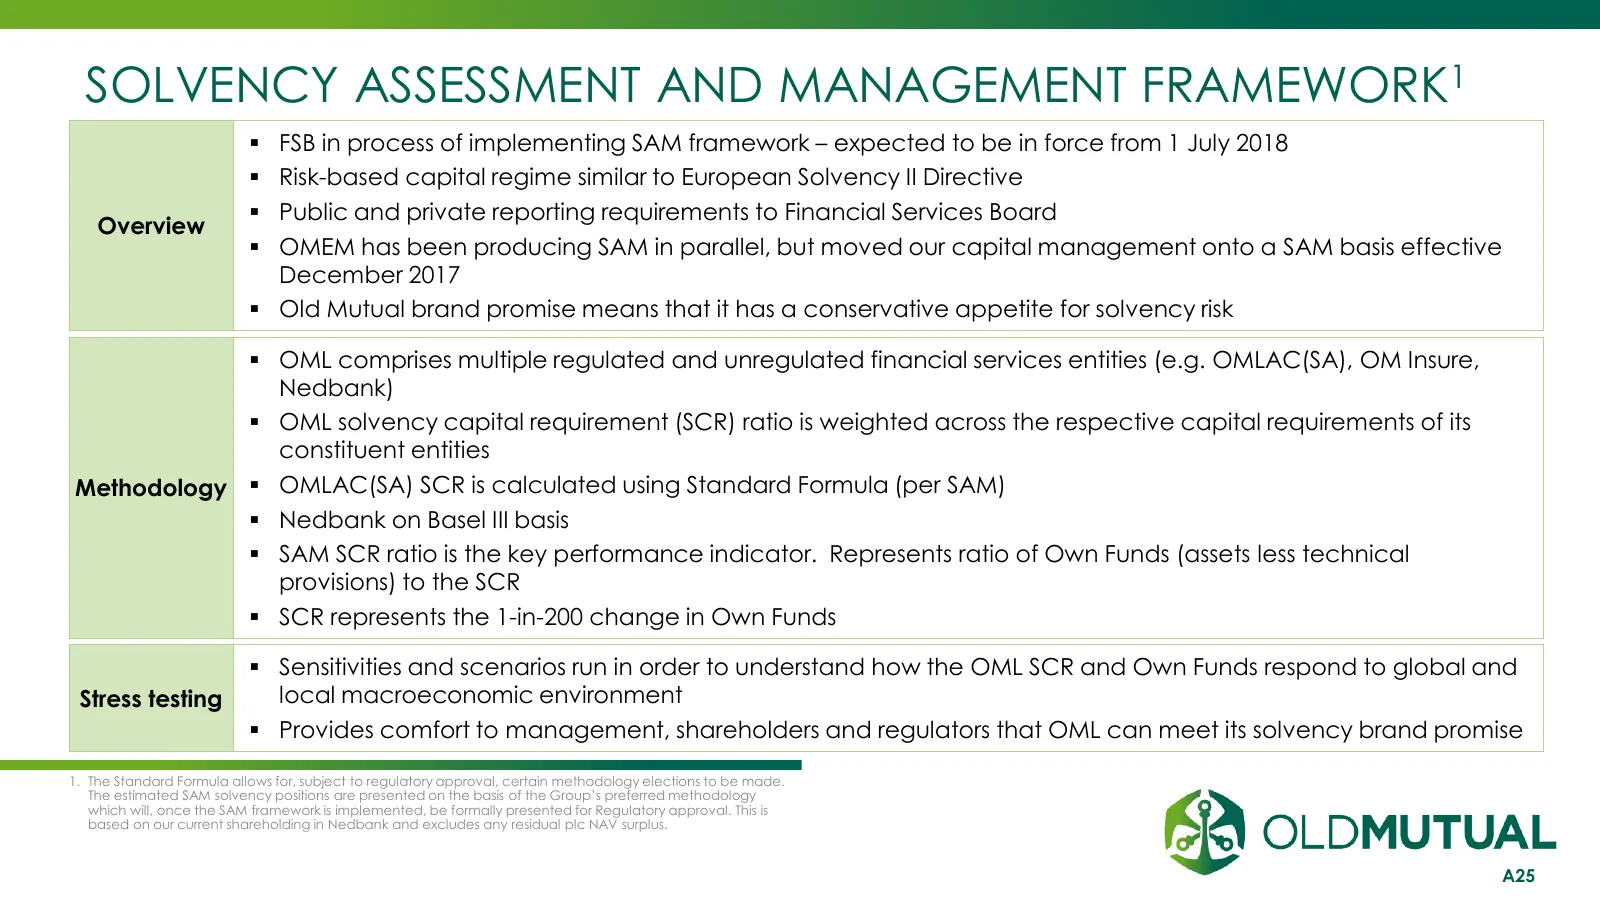
SOLVENCY ASSESSMENT AND MANAGEMENT FRAMEWORK1 FSB in process of implementing SAM framework – expected to be in force from 1 July 2018 Risk-based capital regime similar to European Solvency II Directive Public and private reporting requirements to Financial Services Board Overview OMEM has be
Slide 26: Future Balance Sheet and Capital Management
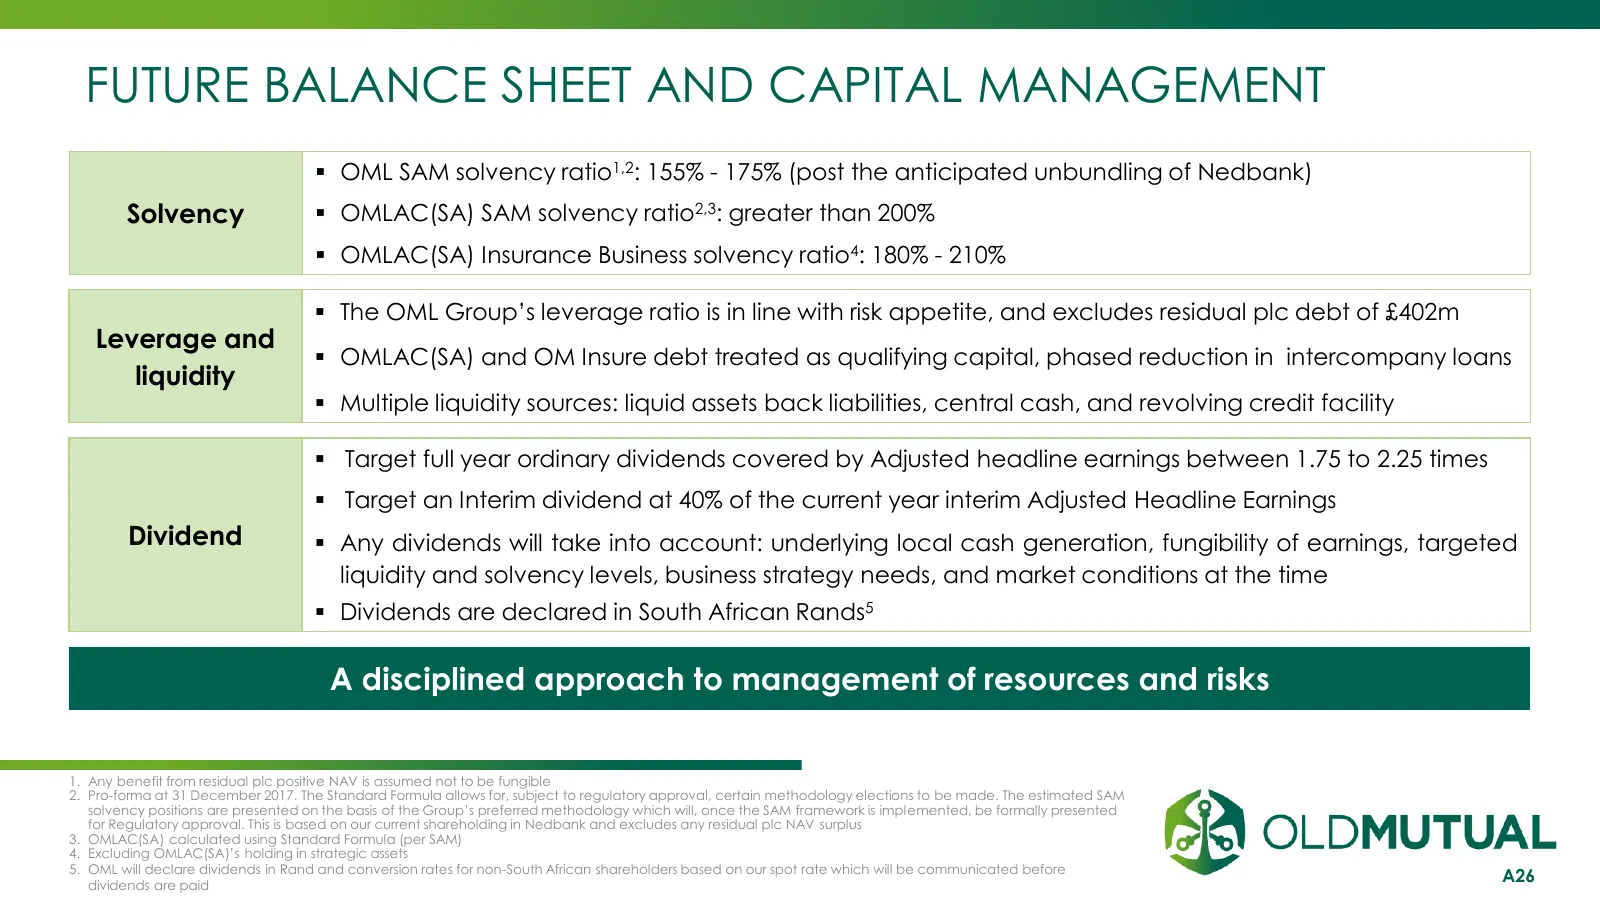
FUTURE BALANCE SHEET AND CAPITAL MANAGEMENT OML SAM solvency ratio1,2: 155% - 175% (post the anticipated unbundling of Nedbank) Solvency OMLAC(SA) SAM solvency ratio2,3: greater than 200% OMLAC(SA) Insurance Business solvency ratio4: 180% - 210% The OML Group’s leverage ratio is in line with

Slide 27: Appendix 5: Old Mutual Wealth
APPENDIX 5 OLD MUTUAL WEALTH INVESTMENT | SAVINGS | INSURANCE | BANKING
Slide 28: Reported AOP – Reconciliation to Standalone Basis
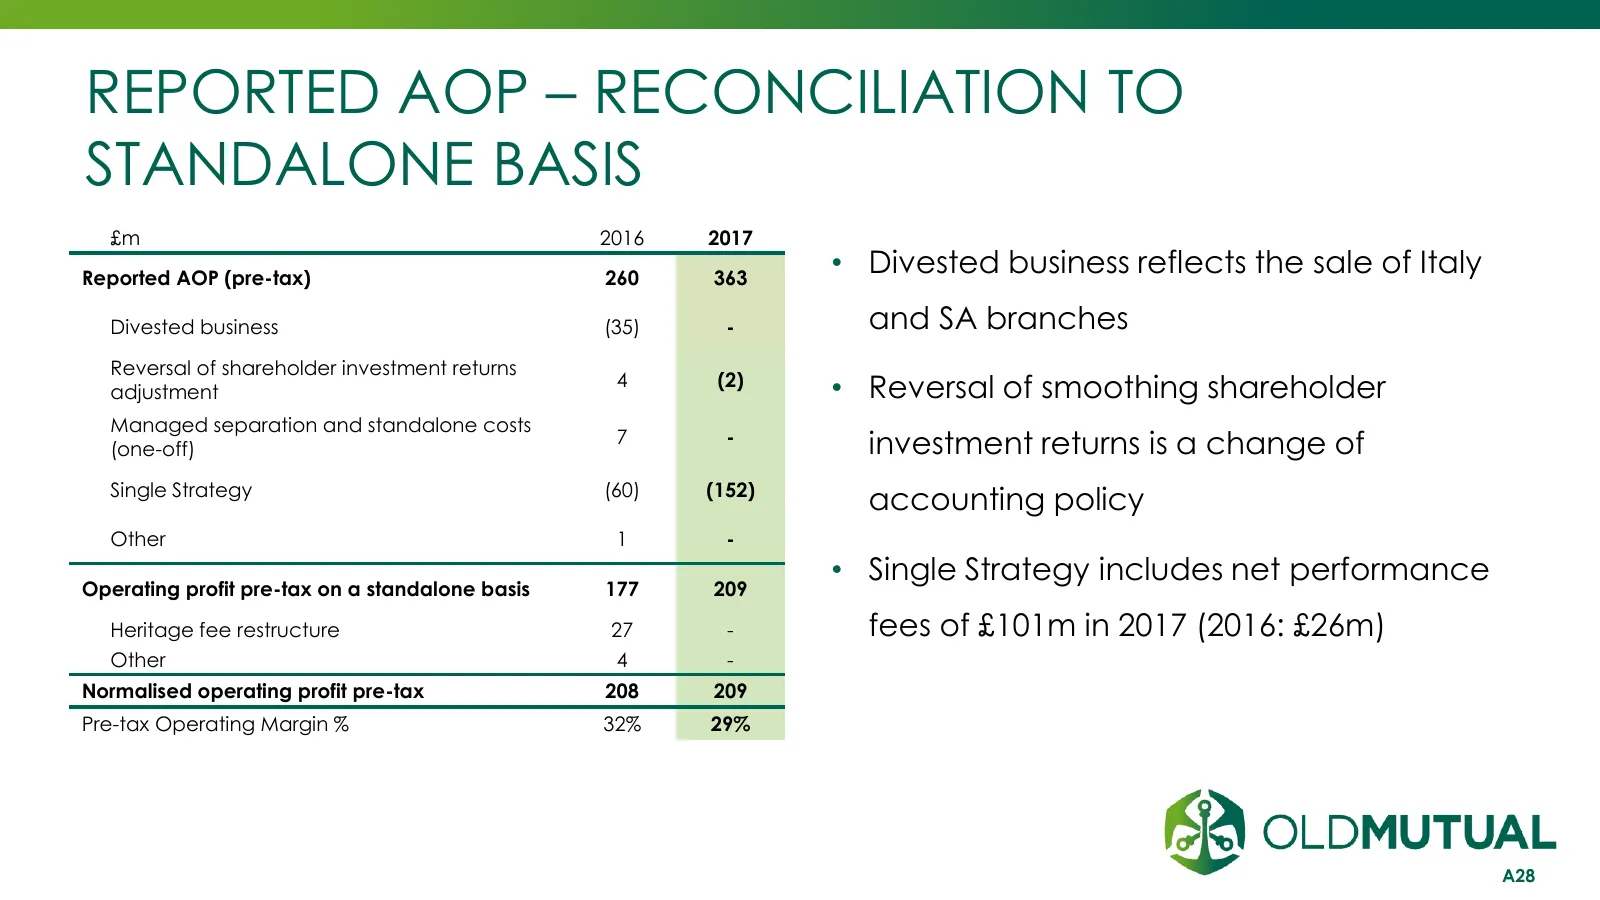
REPORTED AOP – RECONCILIATION TO STANDALONE BASIS £m 2016 2017 Reported AOP (pre-tax) 260 363 • Divested business reflects the sale of Italy Divested business (35) - and SA branches Reversal of shareholder investment returns 4 (2) adjustment • Reversal of smoothing shareholder Managed separation and
Slide 29: Reconciliation of AOP to IFRS
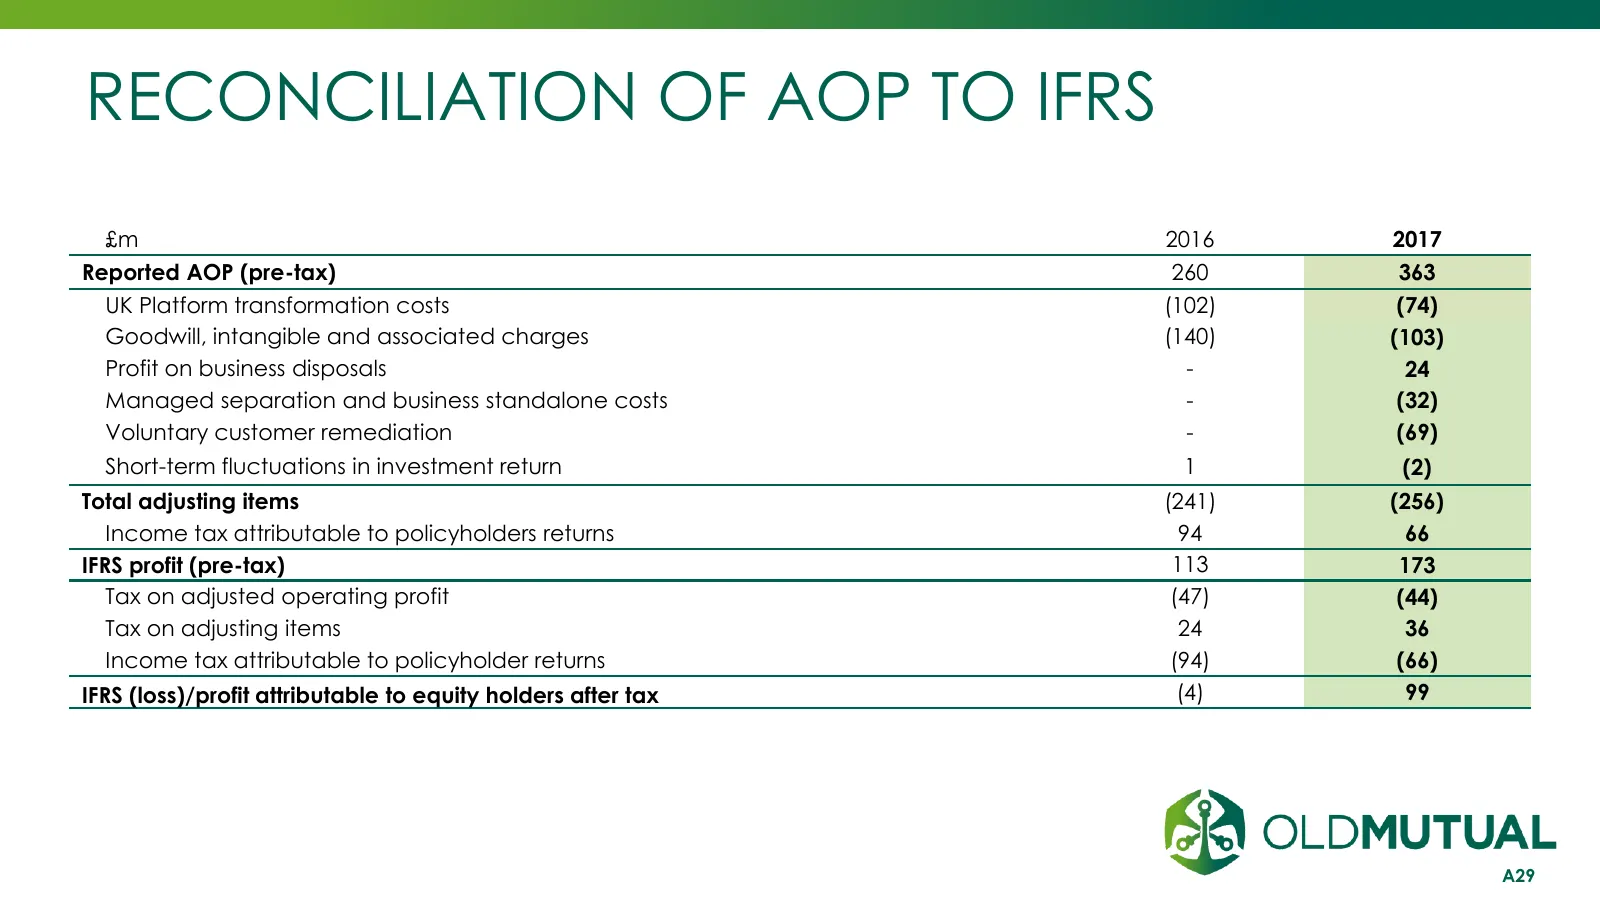
RECONCILIATION OF AOP TO IFRS £m 2016 2017 Reported AOP (pre-tax) 260 363 UK Platform transformation costs (102) (74) Goodwill, intangible and associated charges (140) (103) Profit on business disposals - 24 Managed separation and business standalone costs - (32) Voluntary customer remediation - (69
Slide 30: Voluntary Customer Remediation Provision - £69m
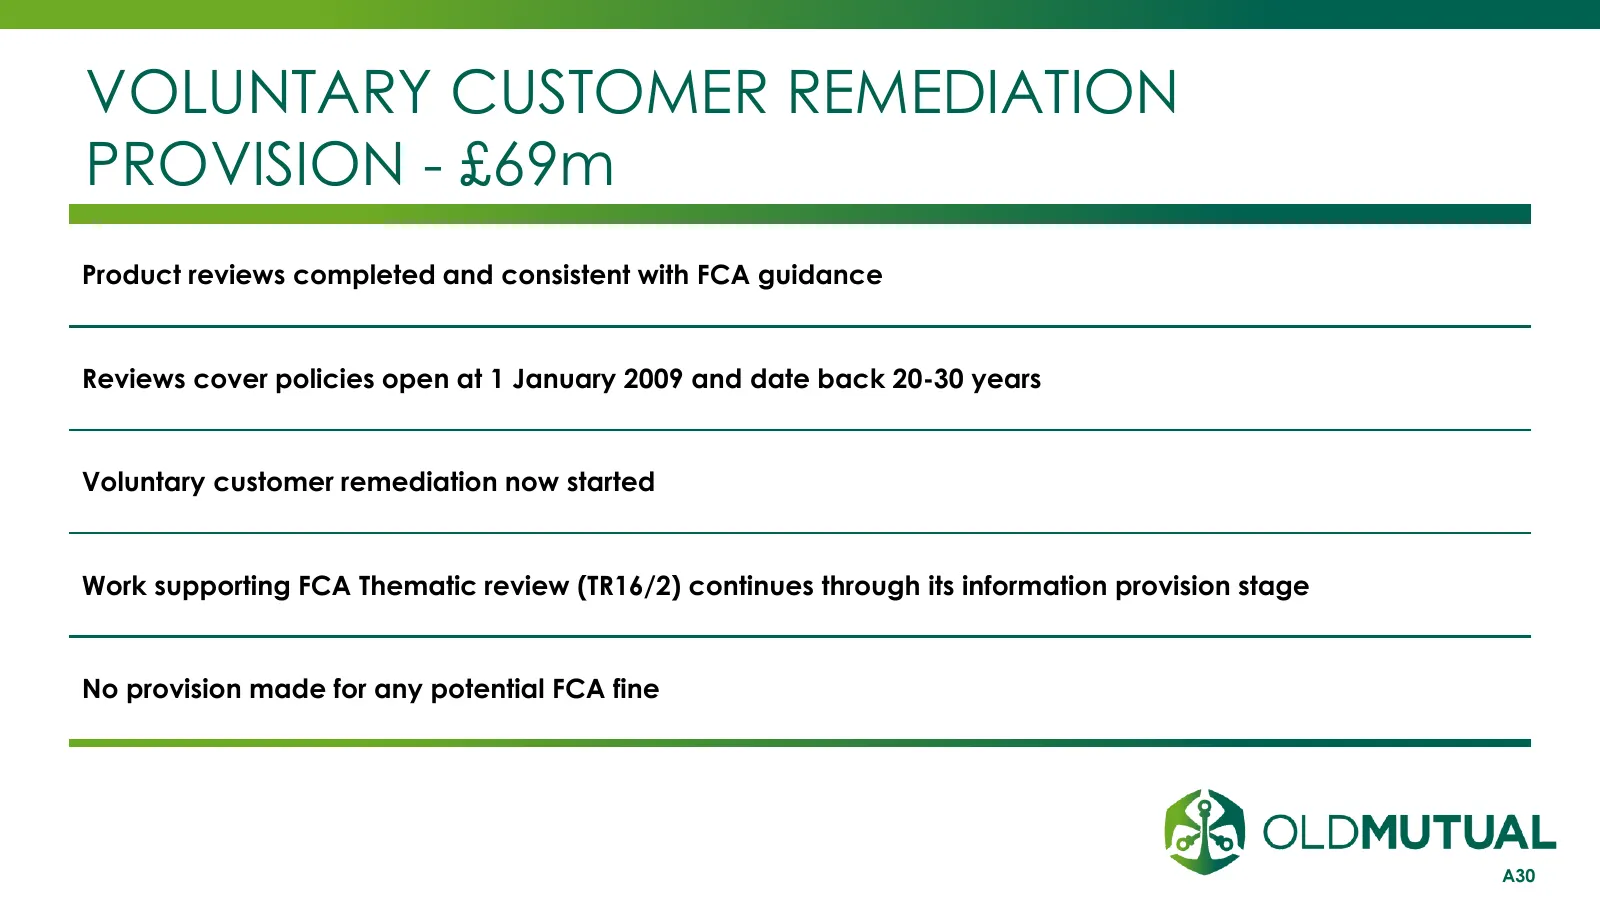
VOLUNTARY CUSTOMER REMEDIATION PROVISION - £69m Product reviews completed and consistent with FCA guidance Reviews cover policies open at 1 January 2009 and date back 20-30 years Voluntary customer remediation now started Work supporting FCA Thematic review (TR16/2) continues through its information
Slide 31: Quilter: Update on Sale of Single Strategy Business
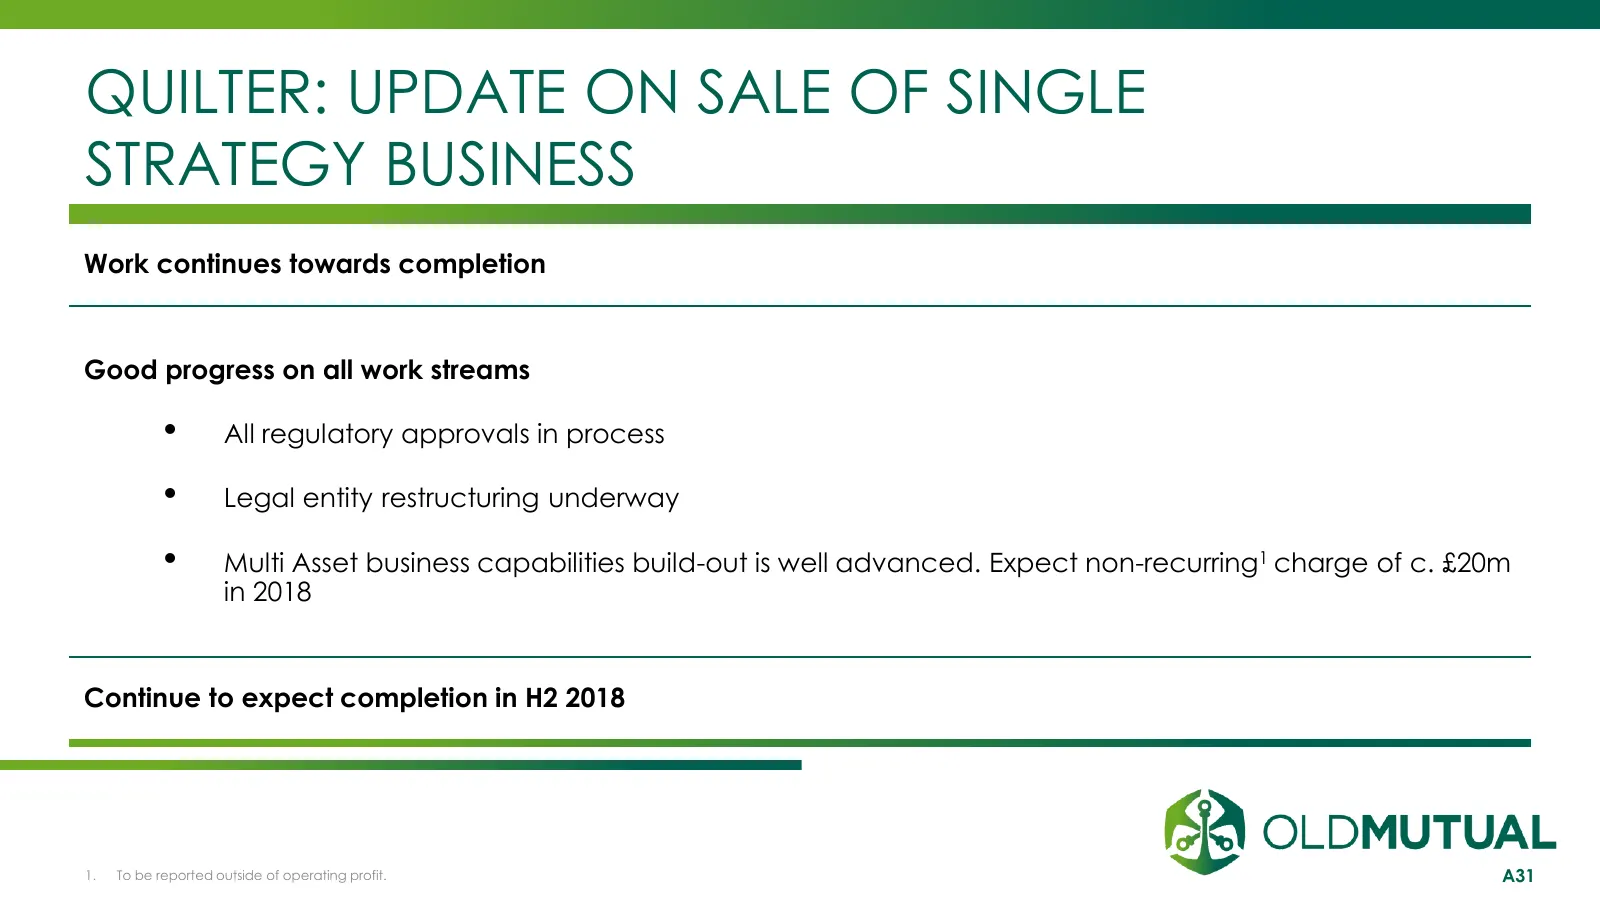
QUILTER: UPDATE ON SALE OF SINGLE STRATEGY BUSINESS Work continues towards completion Good progress on all work streams • All regulatory approvals in process • Legal entity restructuring underway • Multi Asset business capabilities build-out is well advanced. Expect non-recurring1 charge of c. £20m
Source: Internet Archive copy of oldmutual.com
More decks from Old Mutual Ltd.
 FY2025 Earnings Presentation46 slides · Oct 12, 2026
 Q2 2026 Earnings Presentation48 slides · Sep 8, 2026
 H1 2025 Earnings Presentation45 slides · Sep 10, 2025
 FY2024 Earnings Presentation40 slides · Mar 18, 2025
 FY2023 Earnings Presentation39 slides · Mar 27, 2024
 H1 2024 Earnings Presentation33 slides · 2024