Capital Bank Financial — Q3 2013 Earnings Presentation
22 slides from Capital Bank Financial's earnings presentation, Oct 17, 2013
Slide 1: 2013 Third Quarter Earnings
@® CAPITAL BANK FINANCIAL CORP 2013 Third Quarter Earnings October 17, 2013
Slide 2: Safe Harbor Statement
@© Safe Harbor Statement Forward-Looking Statements Information in this presentation contains forward-looking statements. Any statements about our expectations, beliefs, plans, predictions, forecasts, objectives, assumptions or future events or performance are not historical facts and may be forward
Slide 3: Our Path to Investor Returns
@© Our Path to Investor Returns = Improve ROAA from 0.69% (0.76% Core) to 1.0% = Generate organic loan and core deposit growth Deploy capital through acquisitions, in a thoughtful and disciplined manner Optimize capital structure and return excess capital to investors m Target low double-digit ROTCE
Slide 4: The Capital Bank Story
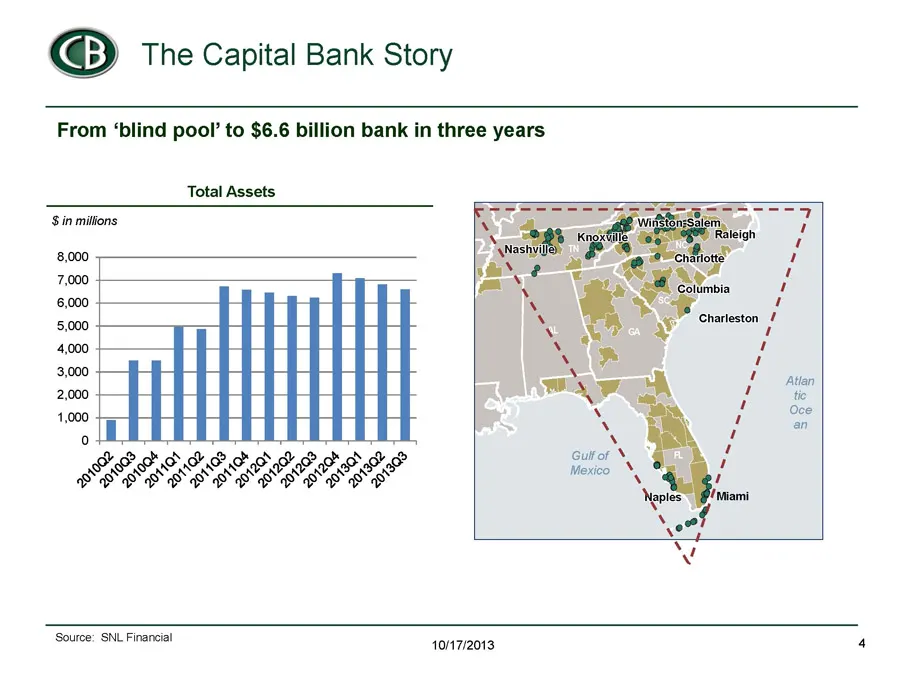
@© The Capital Bank Story From ‘blind pool’ to $6.6 billion bank in three years Total Assets ‘Source: SNL Financial 10/17/2013
Slide 5: We've Built One Bank out of Seven Acquisitions
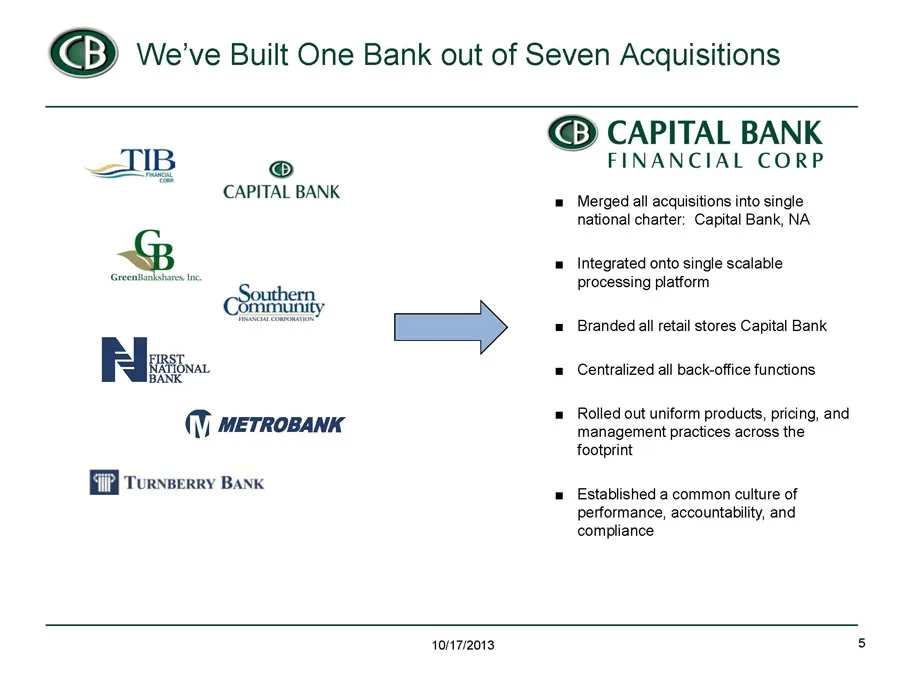
@© We've Built One Bank out of Seven Acquisitions @ CAPITAL BANK Rg. (Jj METROBANK TURNBERRY BANK @© CAPITAL BANK FINANCIAL CORP Merged all acquisitions into single national charter: Capital Bank, NA Integrated onto single scalable processing platform Branded all retail stores Capital Bank Centraliz
Slide 6: Third Quarter Highlights
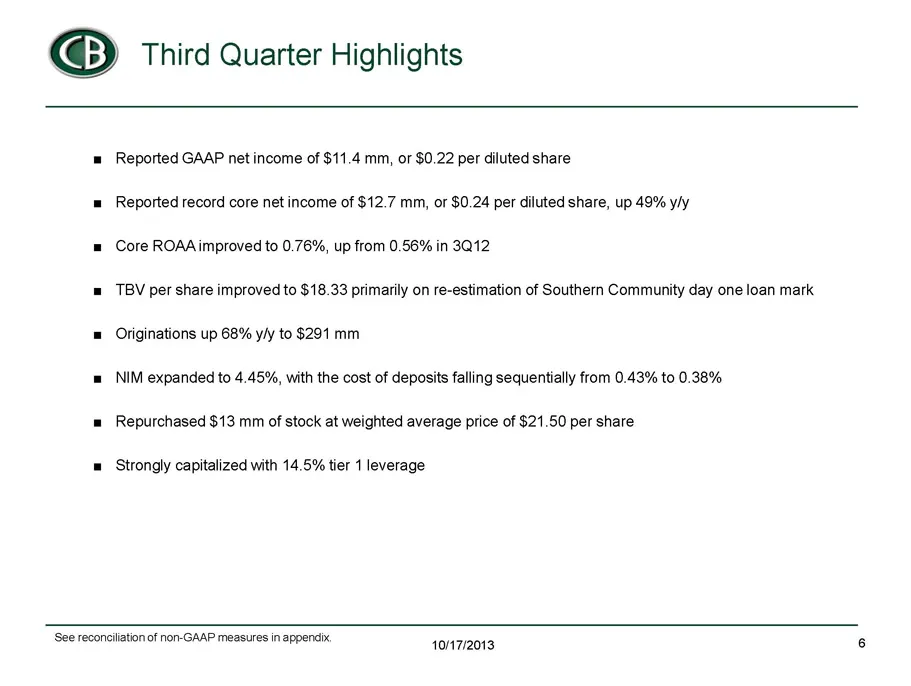
@©) third quarter Highlights m= Reported GAAP net income of $11.4 mm, or $0.22 per diluted share = Reported record core net income of $12.7 mm, or $0.24 per diluted share, up 49% y/y = Core ROAA improved to 0.76%, up from 0.56% in 3Q12 = TBV per share improved to $18.33 primarily on re-estimation of
Slide 7: Southern Community Day Adjustments
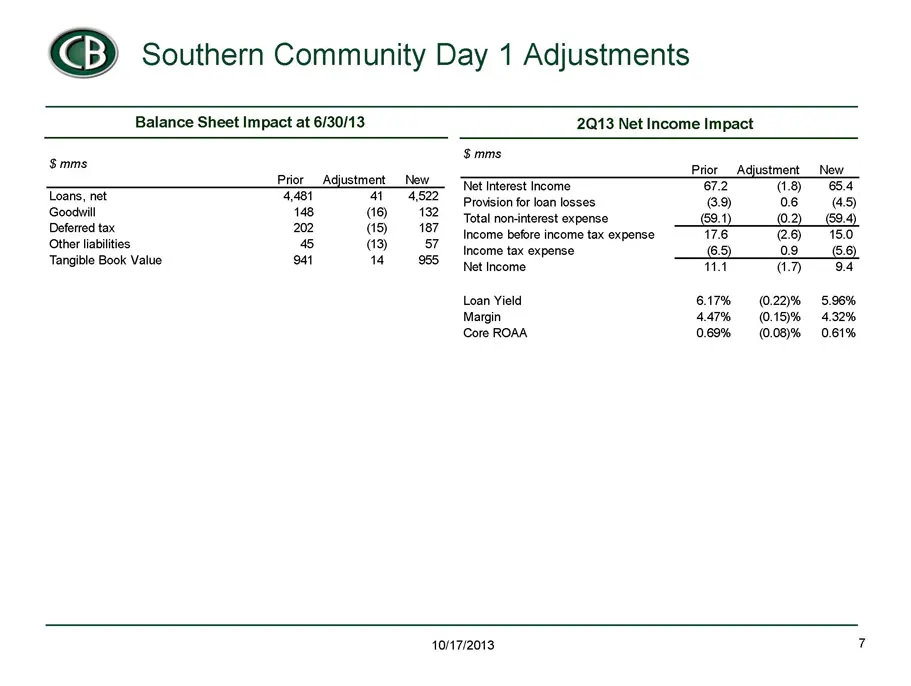
@© Southern Community Day 1 Adjustments Balance Sheet Impact at 6/30/13 2Q13 Net Income Impact $ mms Simms Prior New Prior_Adjustment_New Net Trterest Income 672 (18) 654 Loans; net: 4461 At 4522 Provision for loan losses 69) 06 45) ti. ie ie 13 Total noninterest expense 69.1) 02 694 Detored tax mm
Slide 8: Third Quarter Core Earnings Summary
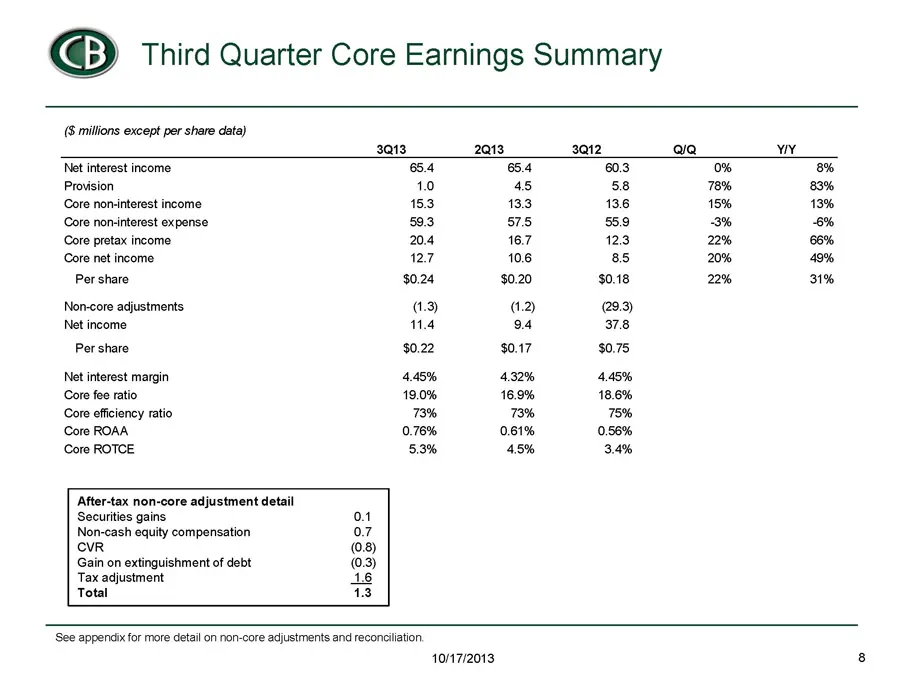
@© Third Quarter Core Earnings Summary ($ millions except per share data) 3013 2013 3Q12 aia wy Net interest income 654 654 603 0% 8% Provision 10 45 58 78% 83% Core non-interest income 163 133 13.6 15% 13% Core non-interest expense 59.3 875 55.9 3% 6% Core pretax income 20.4 167 123 22% 66% Core ne
Slide 9: New Loan Production up 68% Y/Y
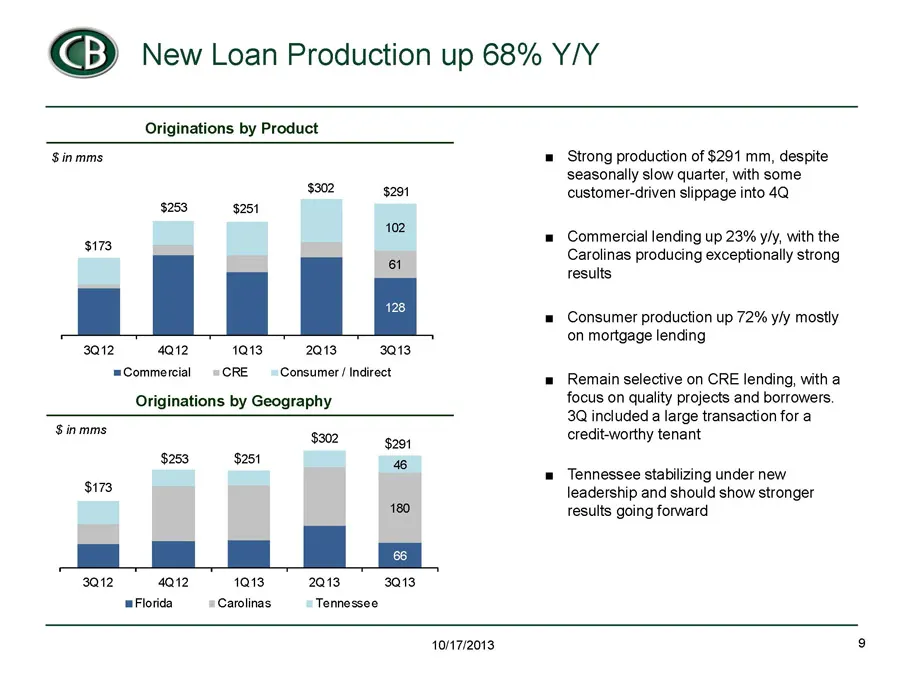
@© New Loan Production up 68% Y/Y Originations by Product $inmms $302 $291 $253 $251 102 $173 61 3012 4a12 1013 2013 3013 Commercial CRE Consumer / Indirect Originations by Geography $inmms $202 $201 $253 $251 ma $173 180 3012 4012 1013 2013 3013 ‘Florida Carolinas Tennessee Strong production of $29
Slide 10: Portfolio Growth Impacted by Paydowns
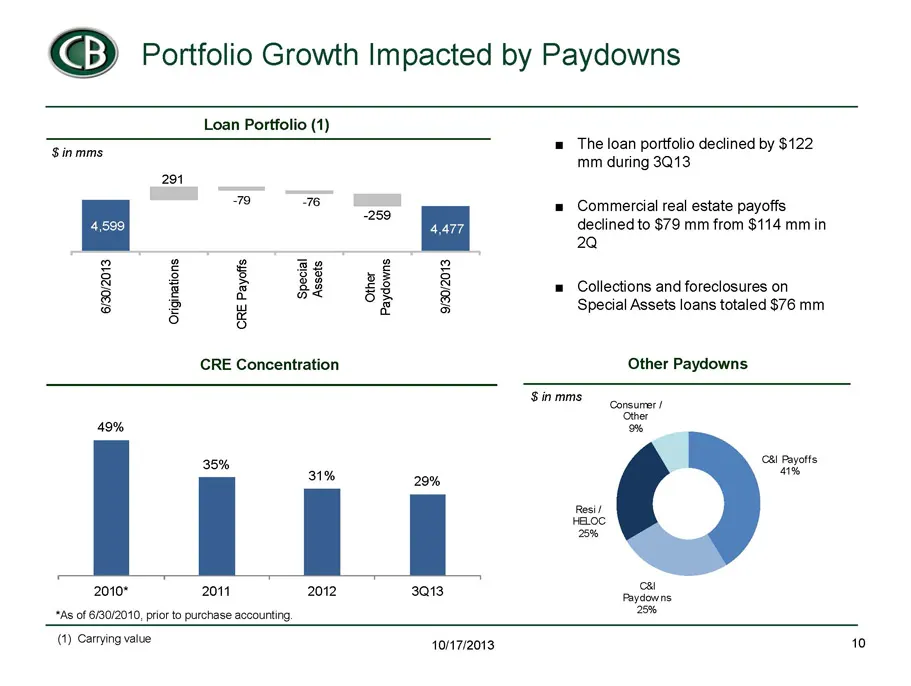
@© Portfolio Growth Impacted by Paydowns Loan Portfolio (1) = The loan portfolio declined by $122 Simms mm during 3Q13 291 78 76 = = Commercial real estate payoffs 4 declined to $79 mm from $114 mm in 2Q a g ¢g 3 g e 5 8 5 . 8 7 3 u 28 5 = Collections and foreclosures on 8 5 rm £ 8 Special Assets lo
Slide 11: Continued Improvement in Deposit Quality
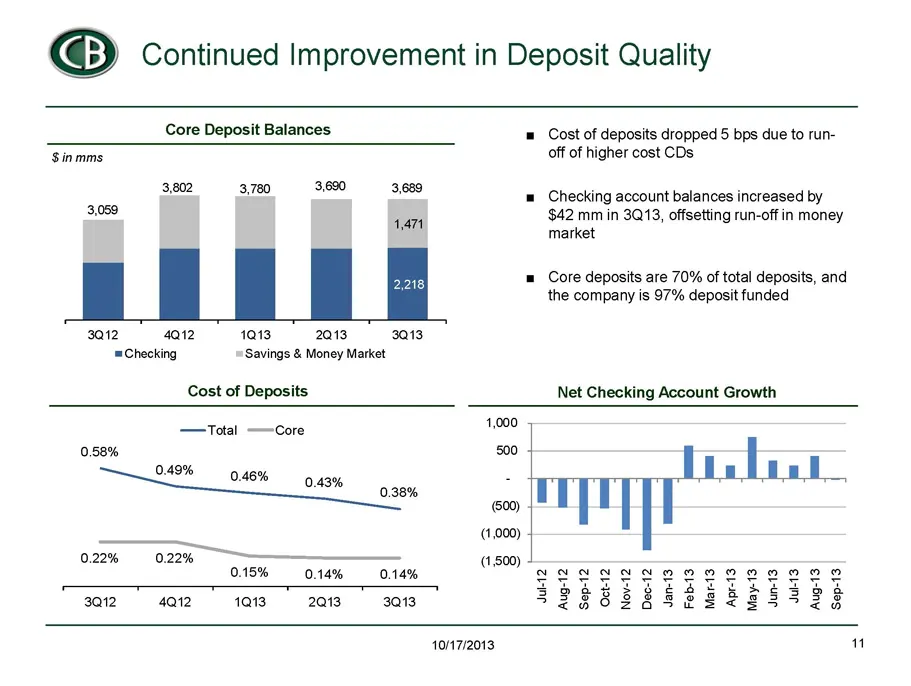
@© Continued Improvement in Deposit Quality = Cost of deposits dropped 5 bps due to run- off of higher cost CDs = Checking account balances increased by $42 mm in 3Q13, offsetting run-off in money market = Core deposits are 70% of total deposits, and the company is 97% deposit funded Net Checking Ac
Slide 12: NIM Improves Sequentially
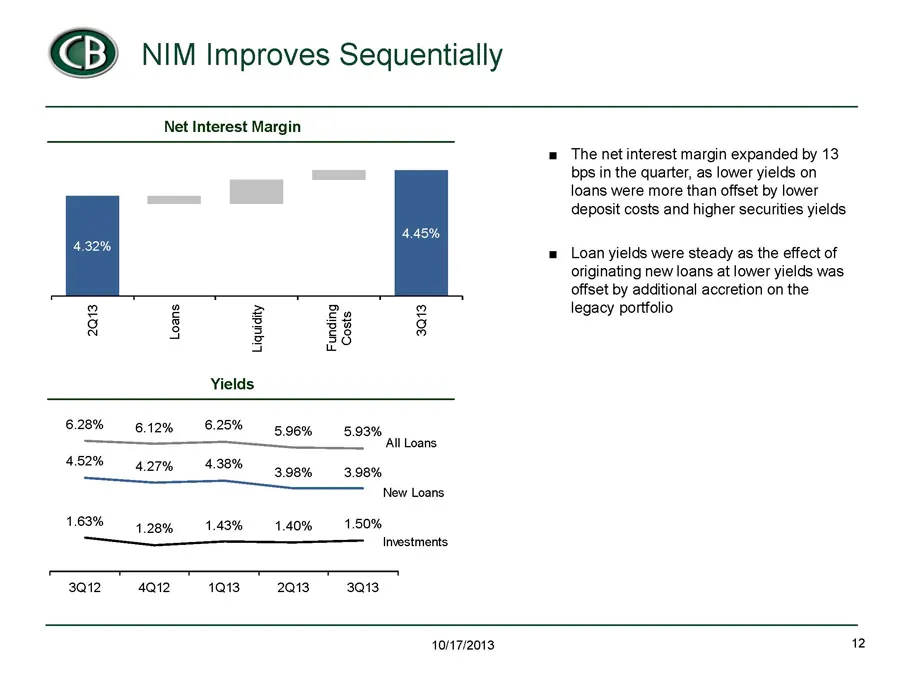
@© NIM Improves Sequentially Net Interest Margin = The net interest margin expanded by 13 bps in the quarter, as lower yields on loans were more than offset by lower deposit costs and higher securities yields = Loan yields were steady as the effect of originating new loans at lower yields was offset
Slide 13: Core Noninterest Income Rises Y/Y
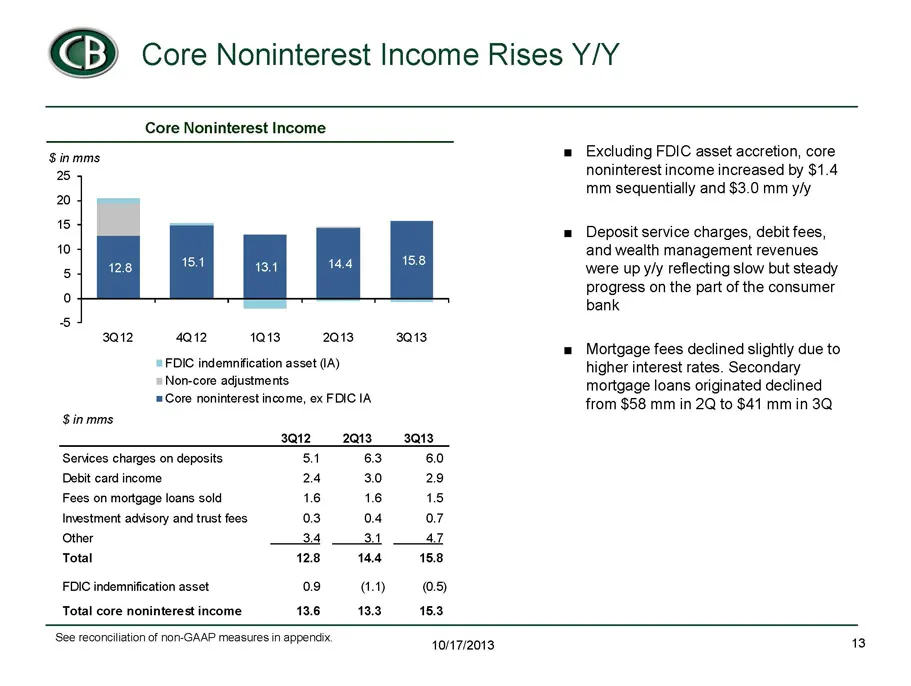
@© Core Noninterest Income Rises Y/Y Core Noninterest Income Sinmms 25 201 ee 18 10 5 ° 6 3012 4a12 1013 2013 3013 "FDIC indemnification asset (IA) Non-core adjustments. Core noninterest income, ex FDIC 1A Sinmms 301220133013 Senices charges on deposits 54 63 60 Debit card income 24 3.0 29 Fees on m
Slide 14: Noninterest Expense Down Year-to-Date
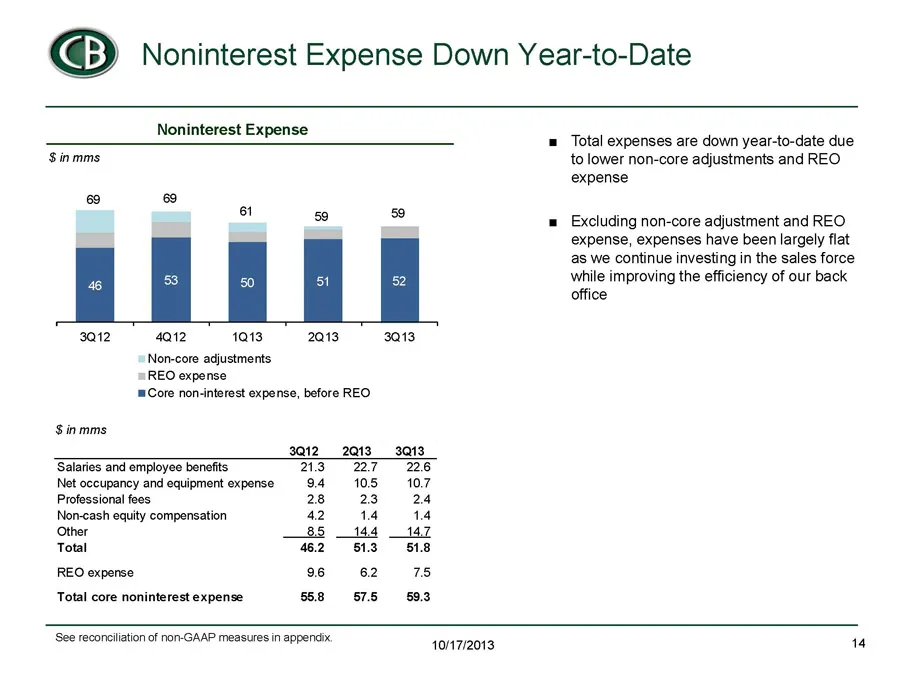
@© Noninterest Expense Down Year-to-Date Noninterest Expense $inmms 69 69 6 50 3012 are 1013 2013 Non-core adjustments REO expense Core non-interest expense, before REO Sinmms 3ar2__ 2013 ‘Salaries and employee benefits 23 227 Net occupancy and equipment expense 9.4. 10.5 Professional foes 28 © 23 N
Slide 15: Liquidity and Capital Ratios Remain Strong
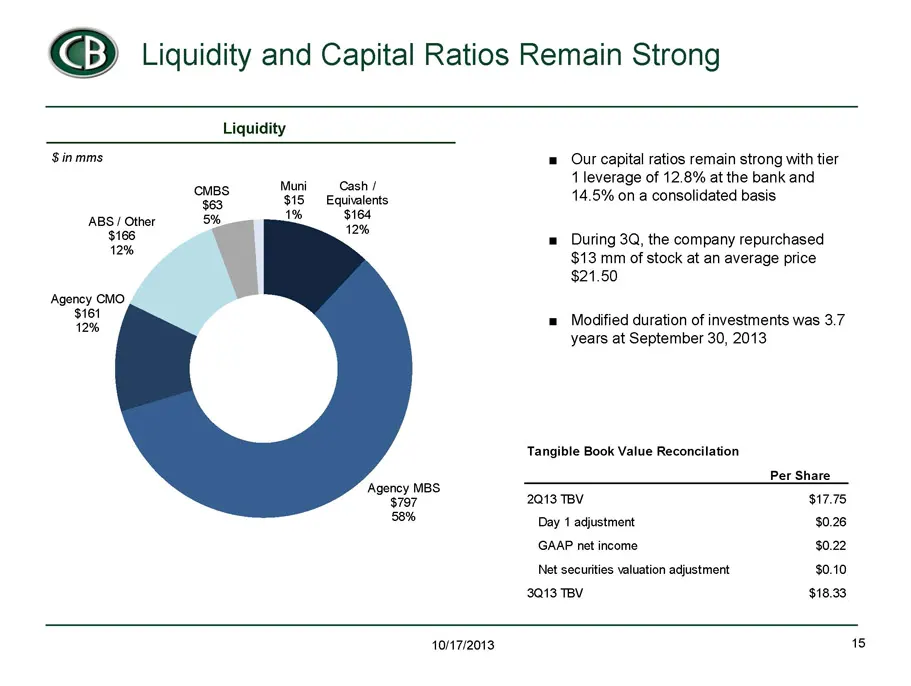
@© Liquidity and Capital Ratios Remain Strong Liquidity Sinmms ‘Agency MBS $797 58% = Our capital ratios remain strong with tier 1 leverage of 12.8% at the bank and 14.5% on a consolidated basis = During 3Q, the company repurchased $13 mm of stock at an average price $21.50 = Modified duration of in
Slide 16: Originated Loan Portfolio Performing Well
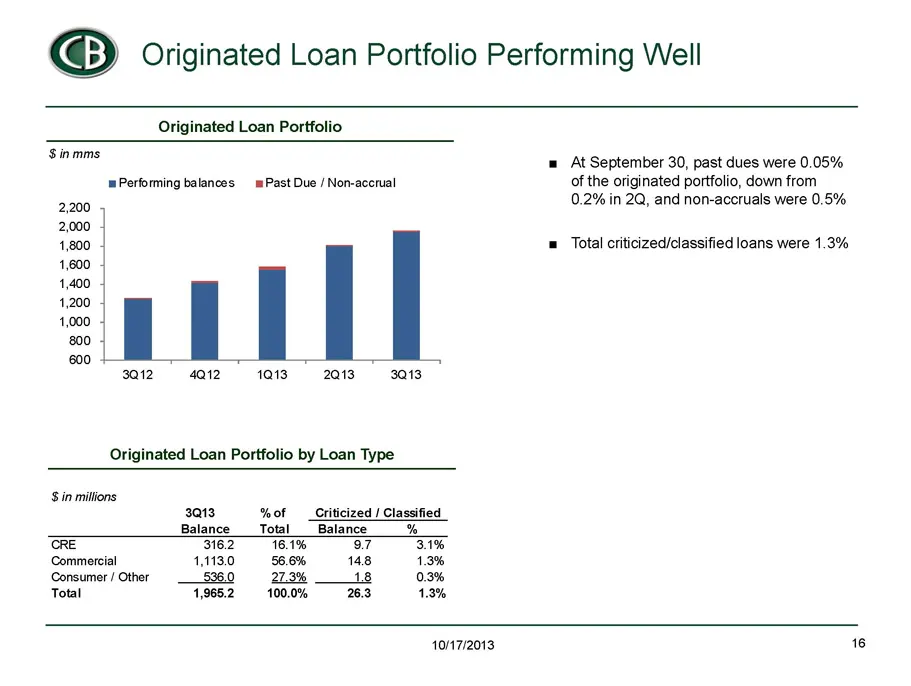
@© Originated Loan Portfolio Performing Well Originated Loan Portfolio Sinema = At September 30, past dues were 0.05% Performing balances = Past Due / Non-accrual of the originated portfolio, down from 2.200 0.2% in 2Q, and non-accruals were 0.5% 2,000 1,800 = Total criticized/classified loans were
Slide 17: Strong Resolution Activity in Third Quarter
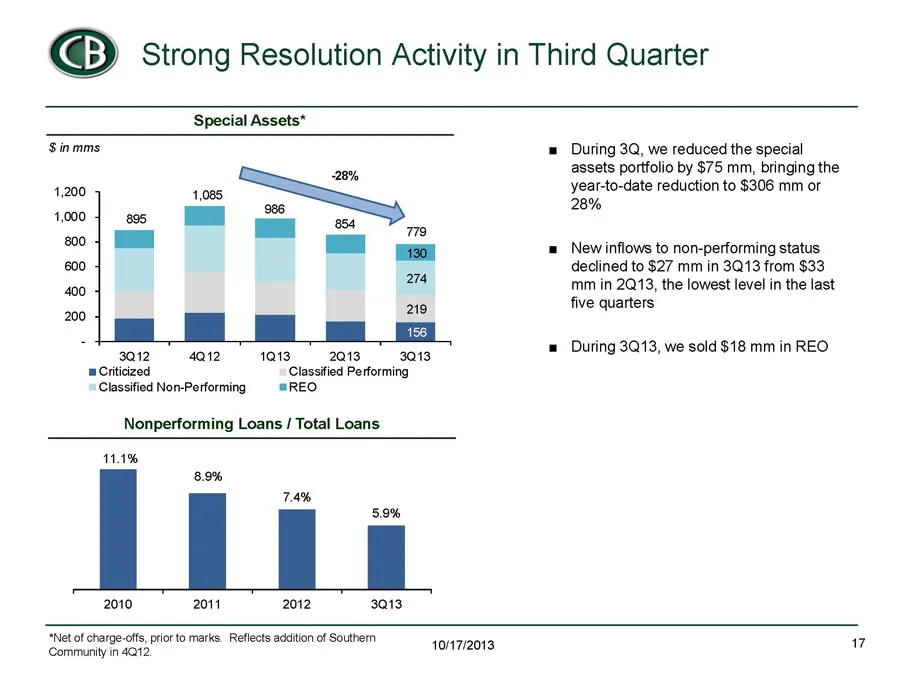
@© Strong Resolution Activity in Third Quarter ‘Special Assets* $inmms 28% 1200 ims io) os ey ao) 778 3012 4Q12 101320133013 Criticized Classified Performing Classified Non-Performing "REO. Nonperforming Loans / Total Loans 11.1% 8.9% 7.4% 2010 2011 2012 3013 = During 3, we reduced the special asset
Slide 18: Legacy Credit Expenses Declining
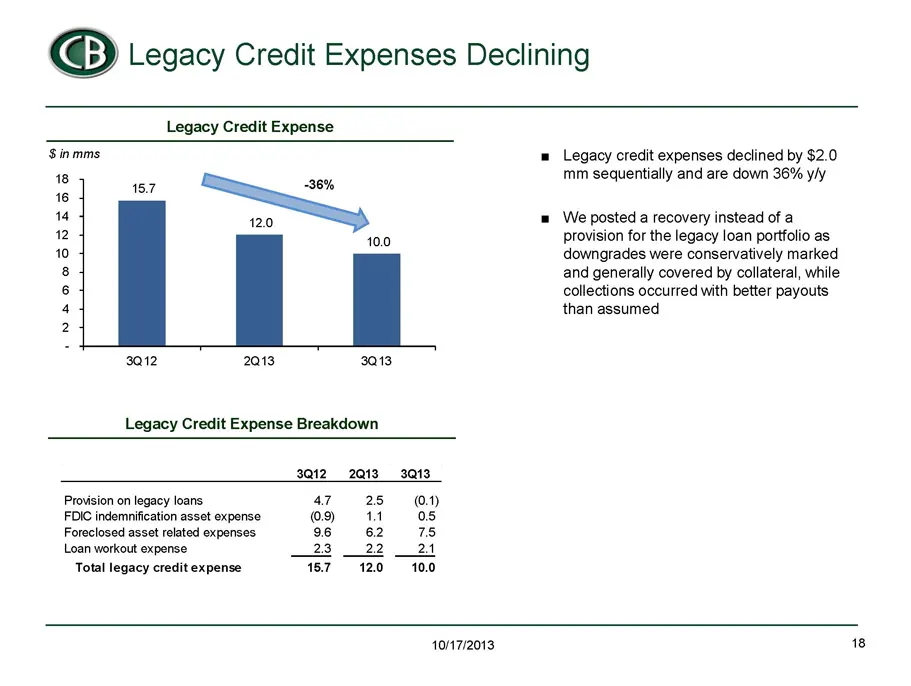
@© Legacy Credit Expenses Declining Legacy Credit Expense $inmms = Legacy credit expenses declined by $2.0 mm sequentially and are down 36% % 15.7 36% a ¥ sid 16 14 ‘0 = We posted a recovery instead of a R 4000 provision for the legacy loan portfolio as 10 downgrades were conservatively marked 8 and
Slide 19: Appendix
Appendix 10/17/2013
Slide 20: Reconciliation of Core Noninterest Income / Expense
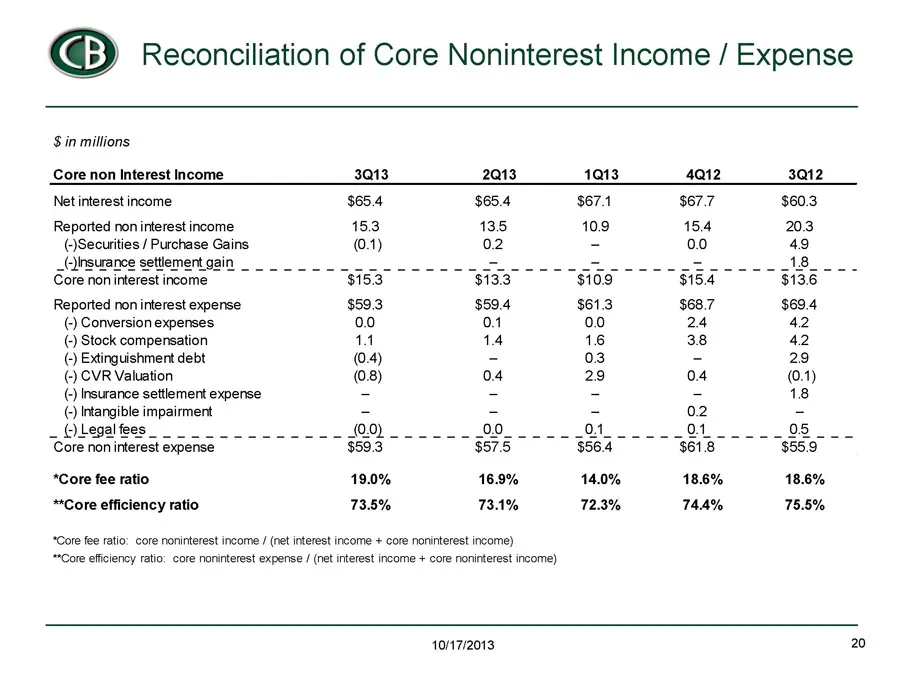
@© Reconciliation of Core Noninterest Income / Expense $ in millions Core non Interest Income. Net interest income Reported non interest income (Securities / Purchase Gains Core non interest income Reported non interest expense () Conversion expenses () Stock compensation () Extinguishment debt () C
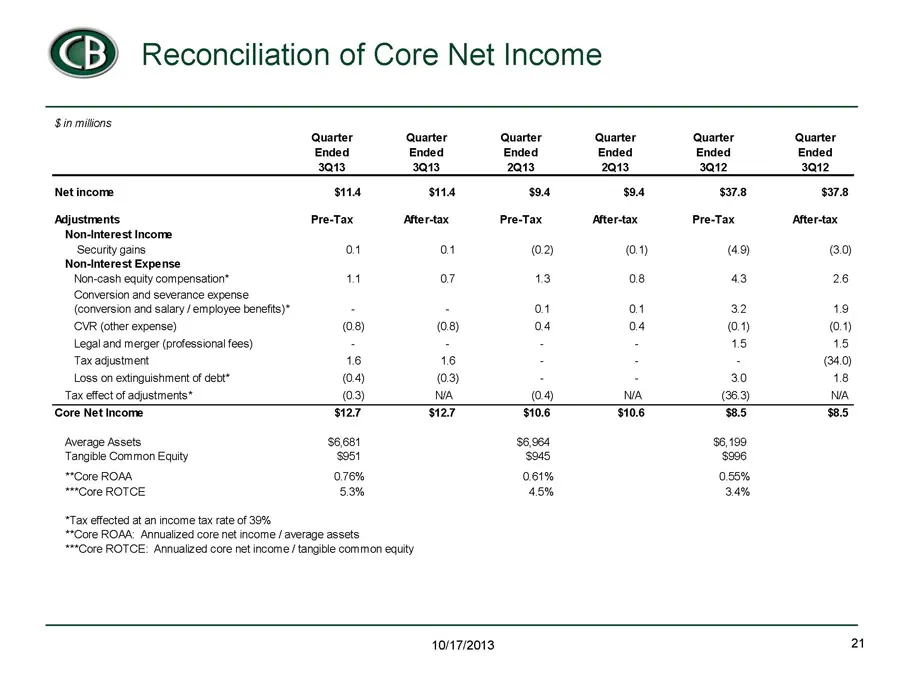
Slide 21: Reconciliation of Core Net Income
@© Reconciliation of Core Net Income $inmilions Quarter Quarter Quarter Quarter ‘Quarter Quarter Ended Ended Ended Ended Ended Ended 3013 3013 2013 2013 3012 3012 Net income sta S114 $94 $9.4 $7 $378 Adjustments Pre-Tax Alter-tax Pre-Tax after-tax Pre-Tax after-tax Non-Interest Income ‘Security gain
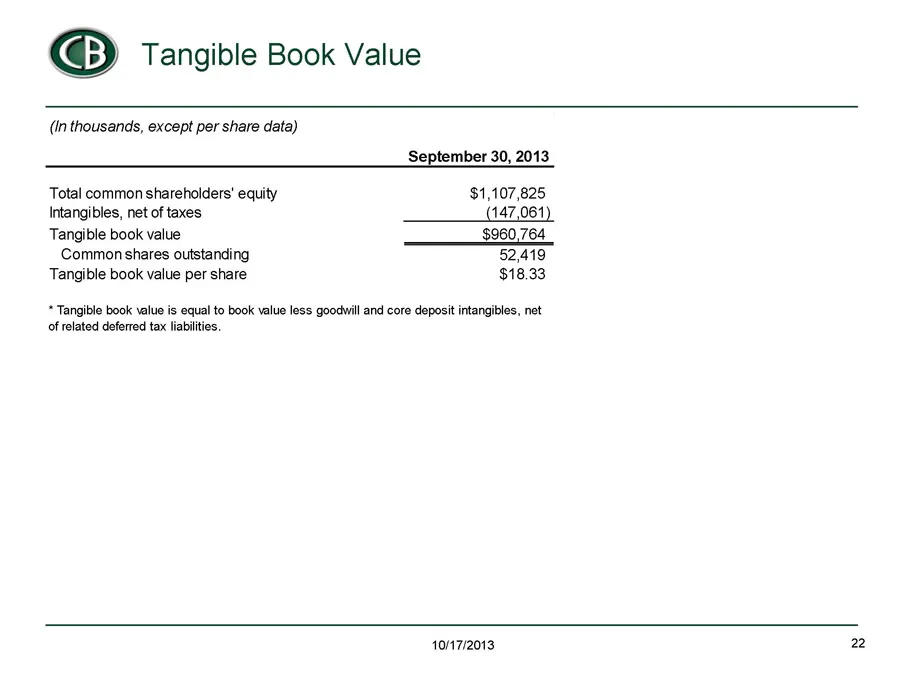
Slide 22: Tangible Book Value
@© Tangible Book Value (in thousands, except per share data) September 30, 2013 Total common shareholders equity $1,107,825 Intangibles, net of taxes 147,061 Tangible book value $960,764 ‘Common shares outstanding 52,419 Tangible book value per share $18.33 * Tangible book value is equal to book val
Source: SEC EDGAR · 8-K filed Oct 17, 2013
More decks from Capital Bank Financial Corp
 Q2 2017 Earnings Presentation22 slides · Jul 14, 2017
 Morgan Stanley Financial Services Conference 201715 slides · Jun 13, 2017
 Merger or Acquisition (June 2017)27 slides · Jun 6, 2017
 Merger or Acquisition (May 2017)17 slides · May 4, 2017
 Q1 2017 Earnings Presentation21 slides · Apr 21, 2017
 Q4 2016 Earnings Presentation25 slides · Jan 26, 2017