Triton International Ltd. · NYSE:TRTN/PA
Triton International — Investor Day (November 2020)
64 slides from Triton International's investor day presentation, Nov 9, 2020
Slide 1: Investor Day 2020
INVESTOR DAY 2020 November 9, 2020 1
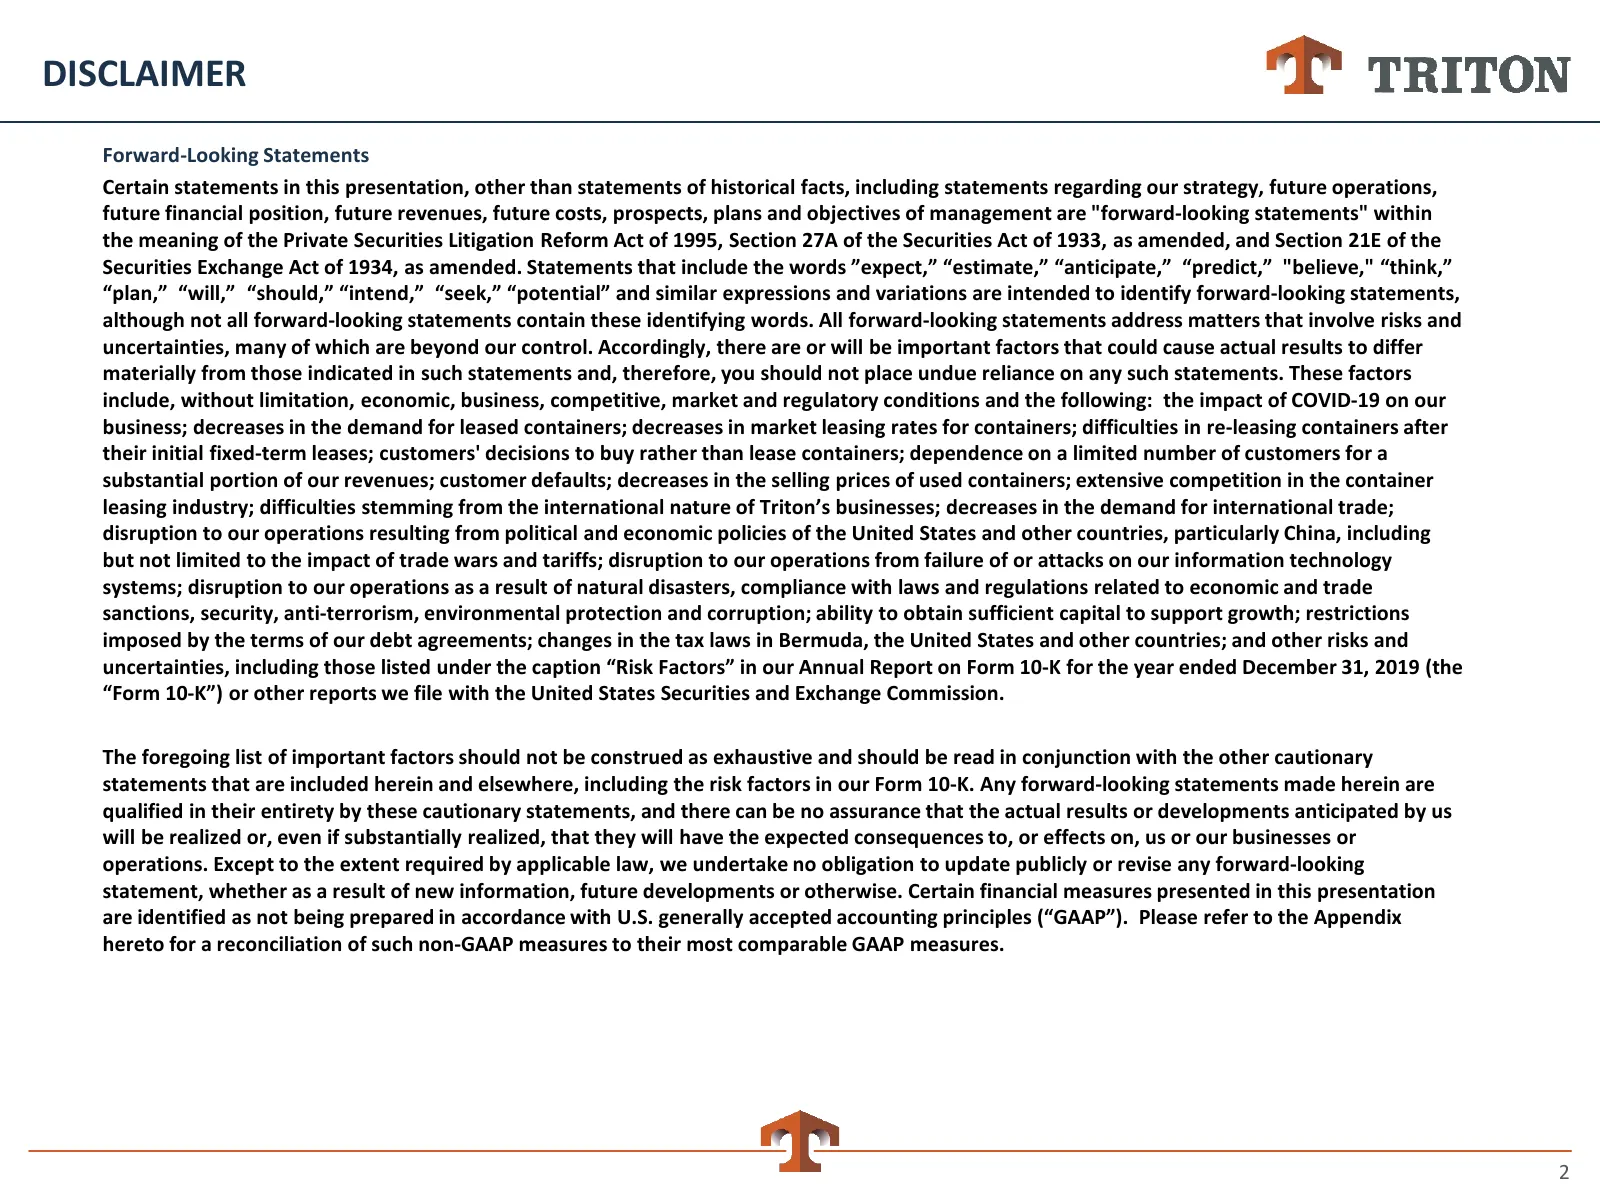
Slide 2: Disclaimer
DISCLAIMER Forward-Looking Statements Certain statements in this presentation, other than statements of historical facts, including statements regarding our strategy, future operations, future financial position, future revenues, future costs, prospects, plans and objectives of management are "forwa
Slide 3: Introduction
Introduction 3
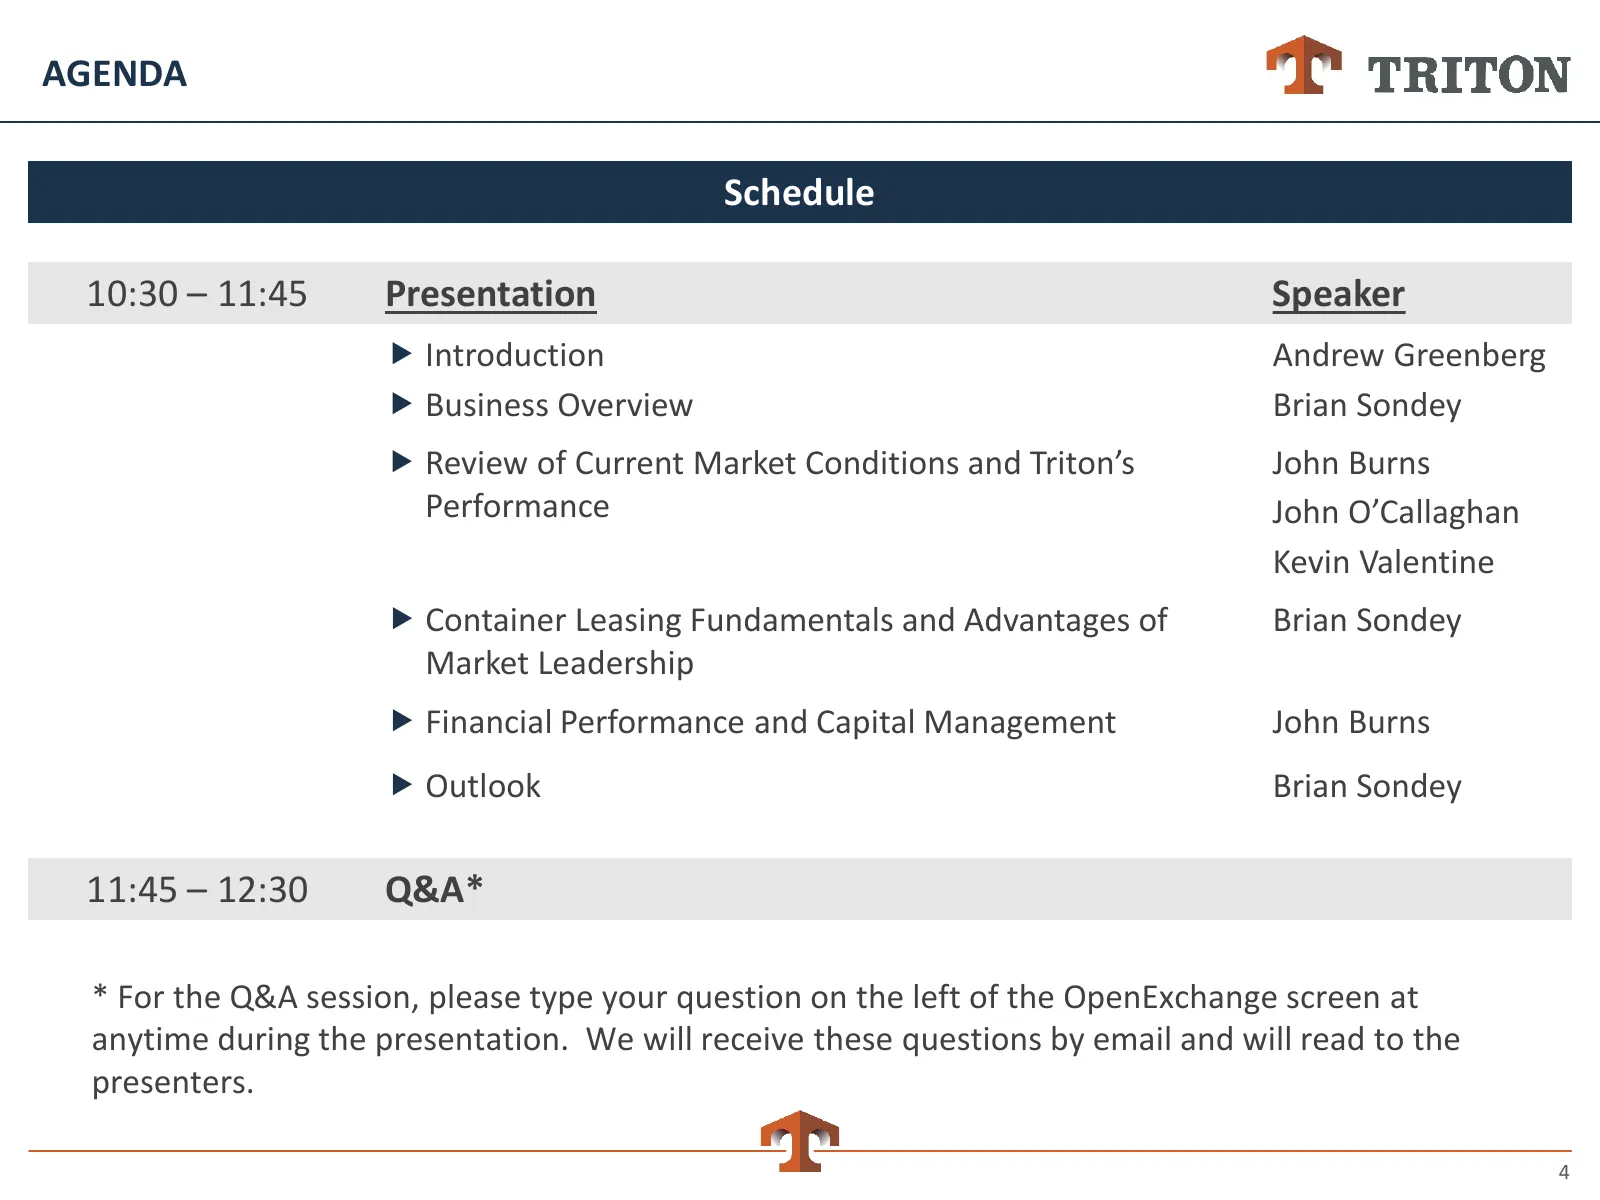
Slide 4: Agenda
AGENDA Schedule 10:30 – 11:45 Presentation Speaker Introduction Andrew Greenberg Business Overview Brian Sondey Review of Current Market Conditions and Triton’s John Burns Performance John O’Callaghan Kevin Valentine Container Leasing Fundamentals and Advantages of Brian Sondey Market Leader

Slide 5: Today's Speakers
TODAY’S SPEAKERS Brian Sondey John Burns Chairman and Chief Executive Officer Chief Financial Officer 23 years of industry experience 23 years of industry experience Chief Executive Officer since 1999 Chief Financial Officer since 2009 John O’Callaghan Kevin Valentine EVP, Global Head of Fie
Slide 6: Key Themes
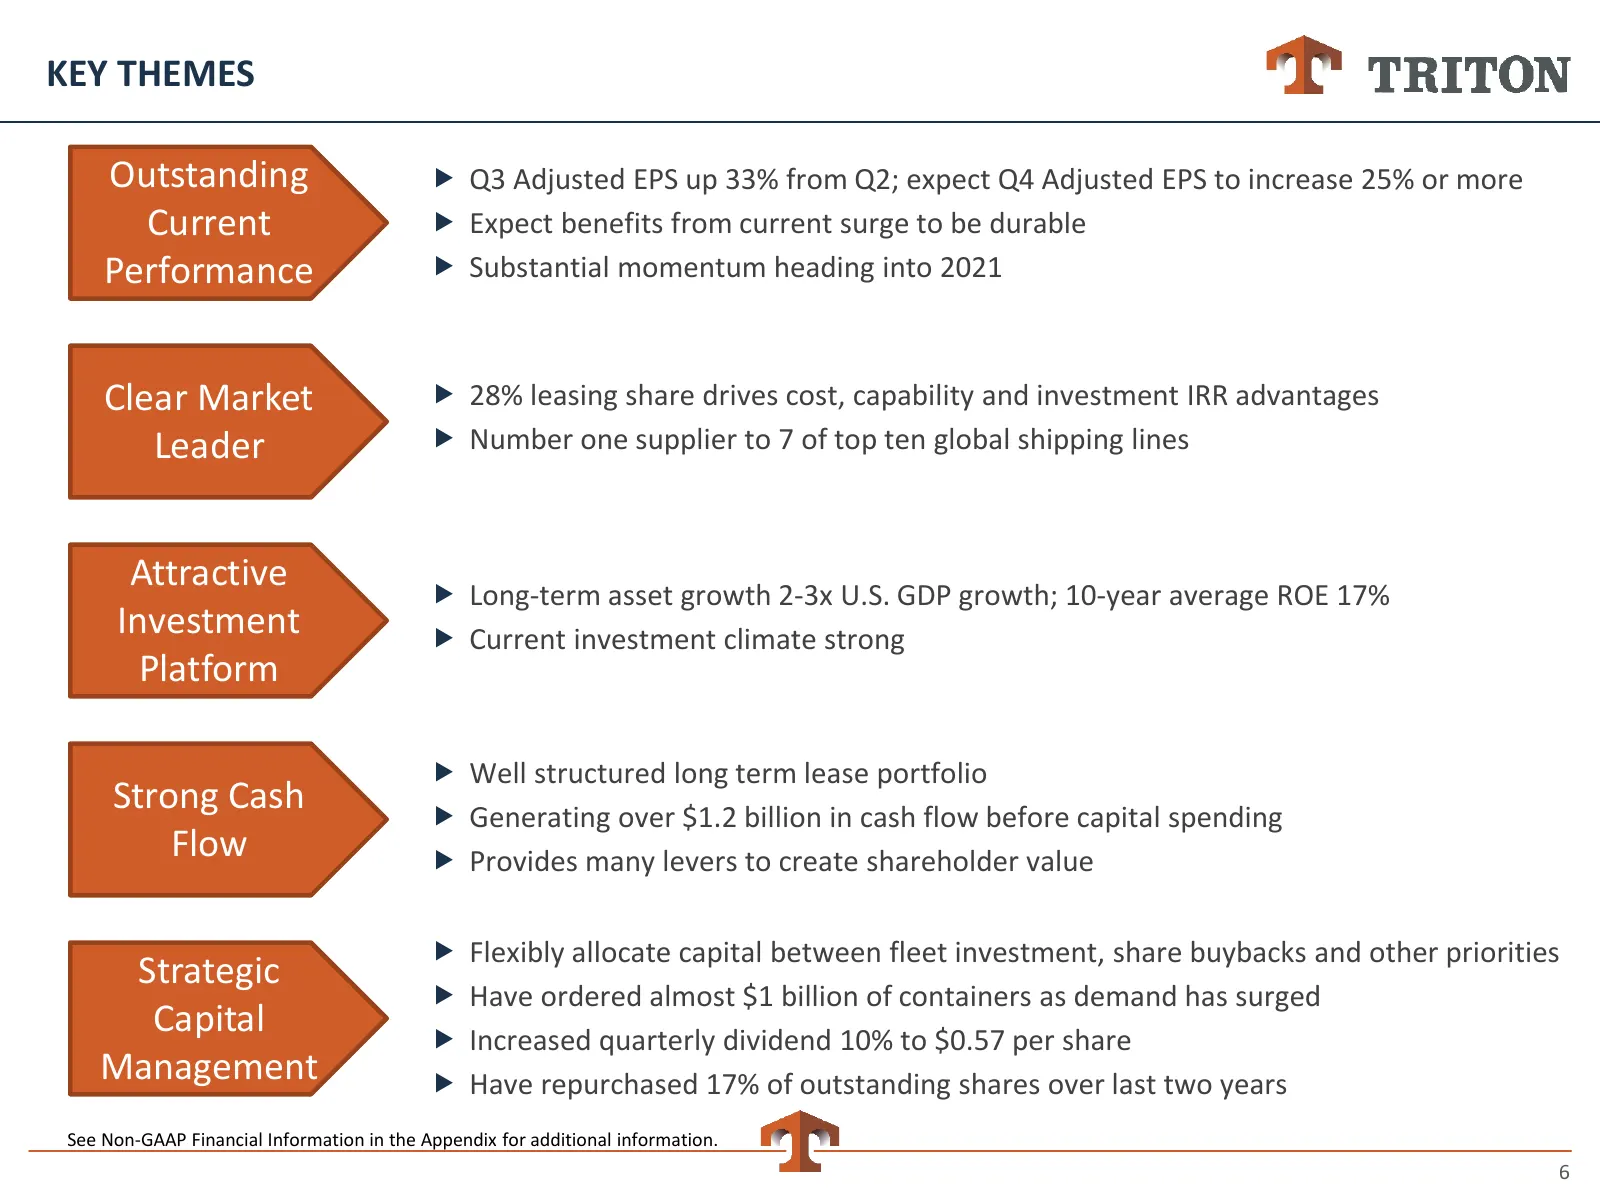
KEY THEMES Outstanding Q3 Adjusted EPS up 33% from Q2; expect Q4 Adjusted EPS to increase 25% or more Current Expect benefits from current surge to be durable Performance Substantial momentum heading into 2021 Clear Market 28% leasing share drives cost, capability and investment IRR advantag
Slide 7: Triton Overview
Triton Overview 7
Slide 8: Overview
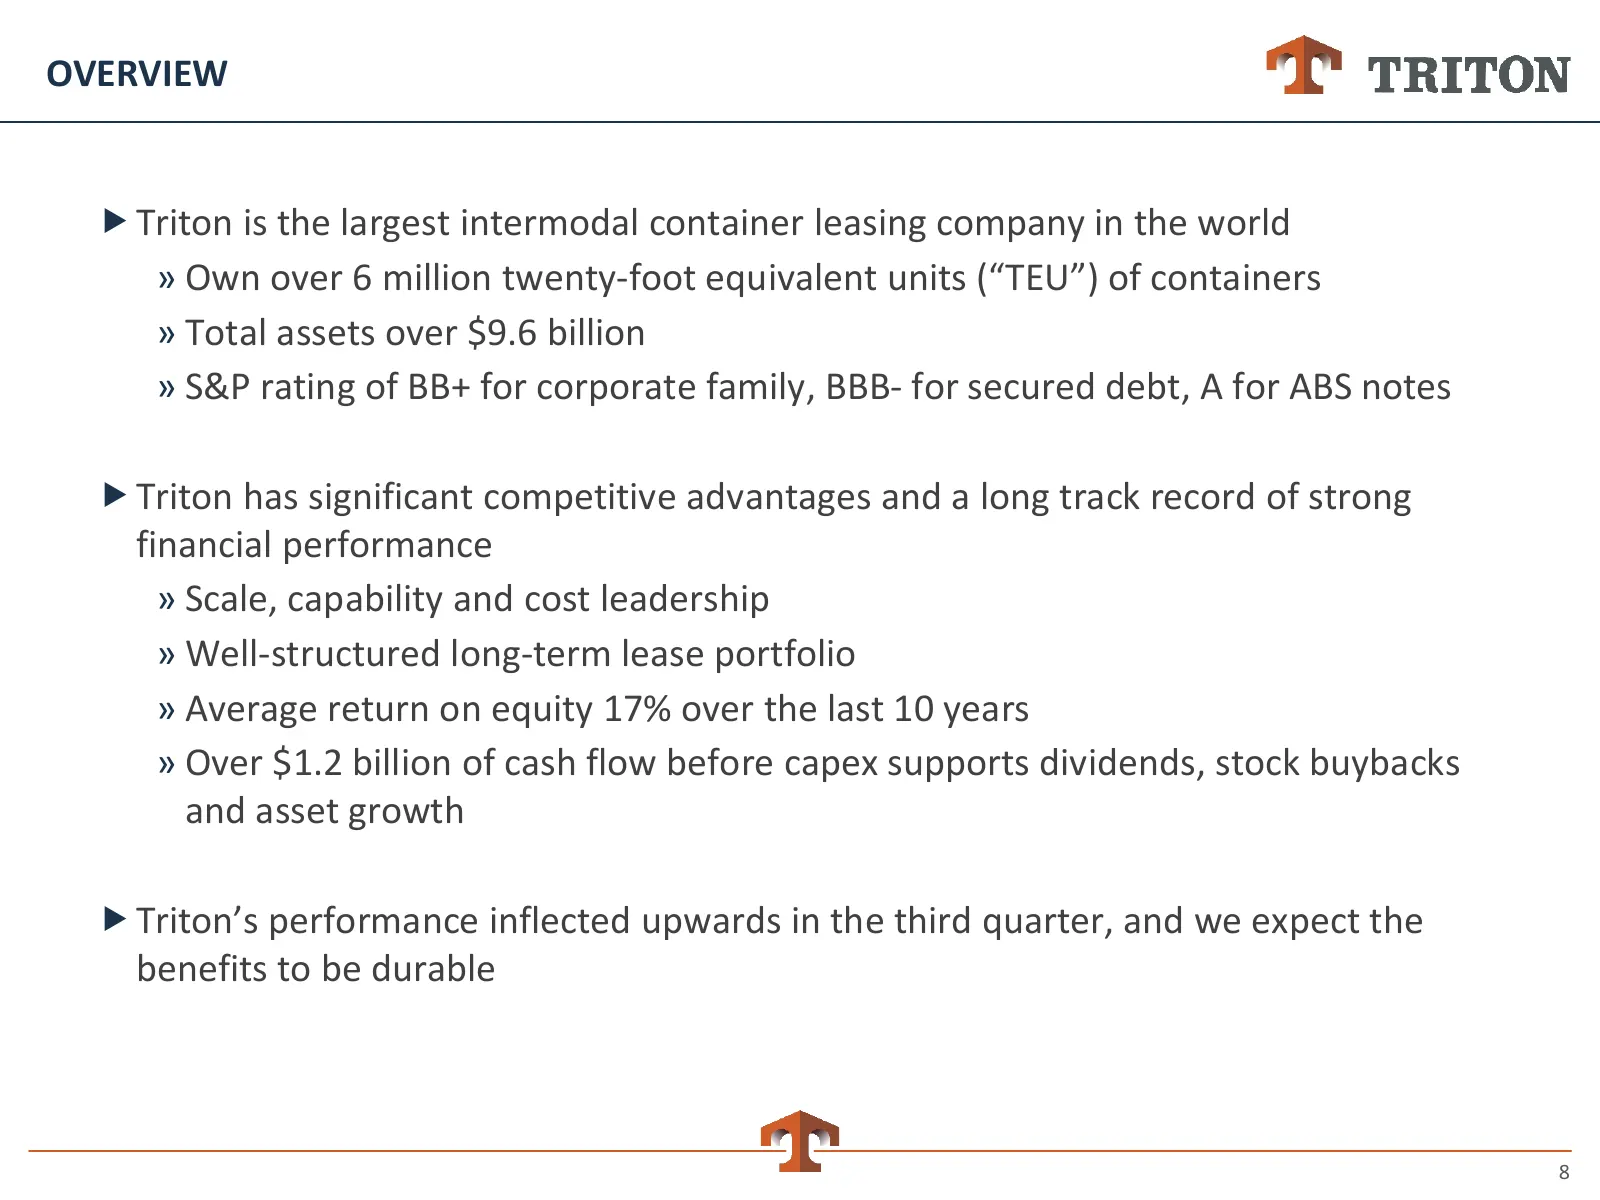
OVERVIEW Triton is the largest intermodal container leasing company in the world » Own over 6 million twenty-foot equivalent units (“TEU”) of containers » Total assets over $9.6 billion » S&P rating of BB+ for corporate family, BBB- for secured debt, A for ABS notes Triton has significant compet
Slide 9: Strong Position in Growing Market
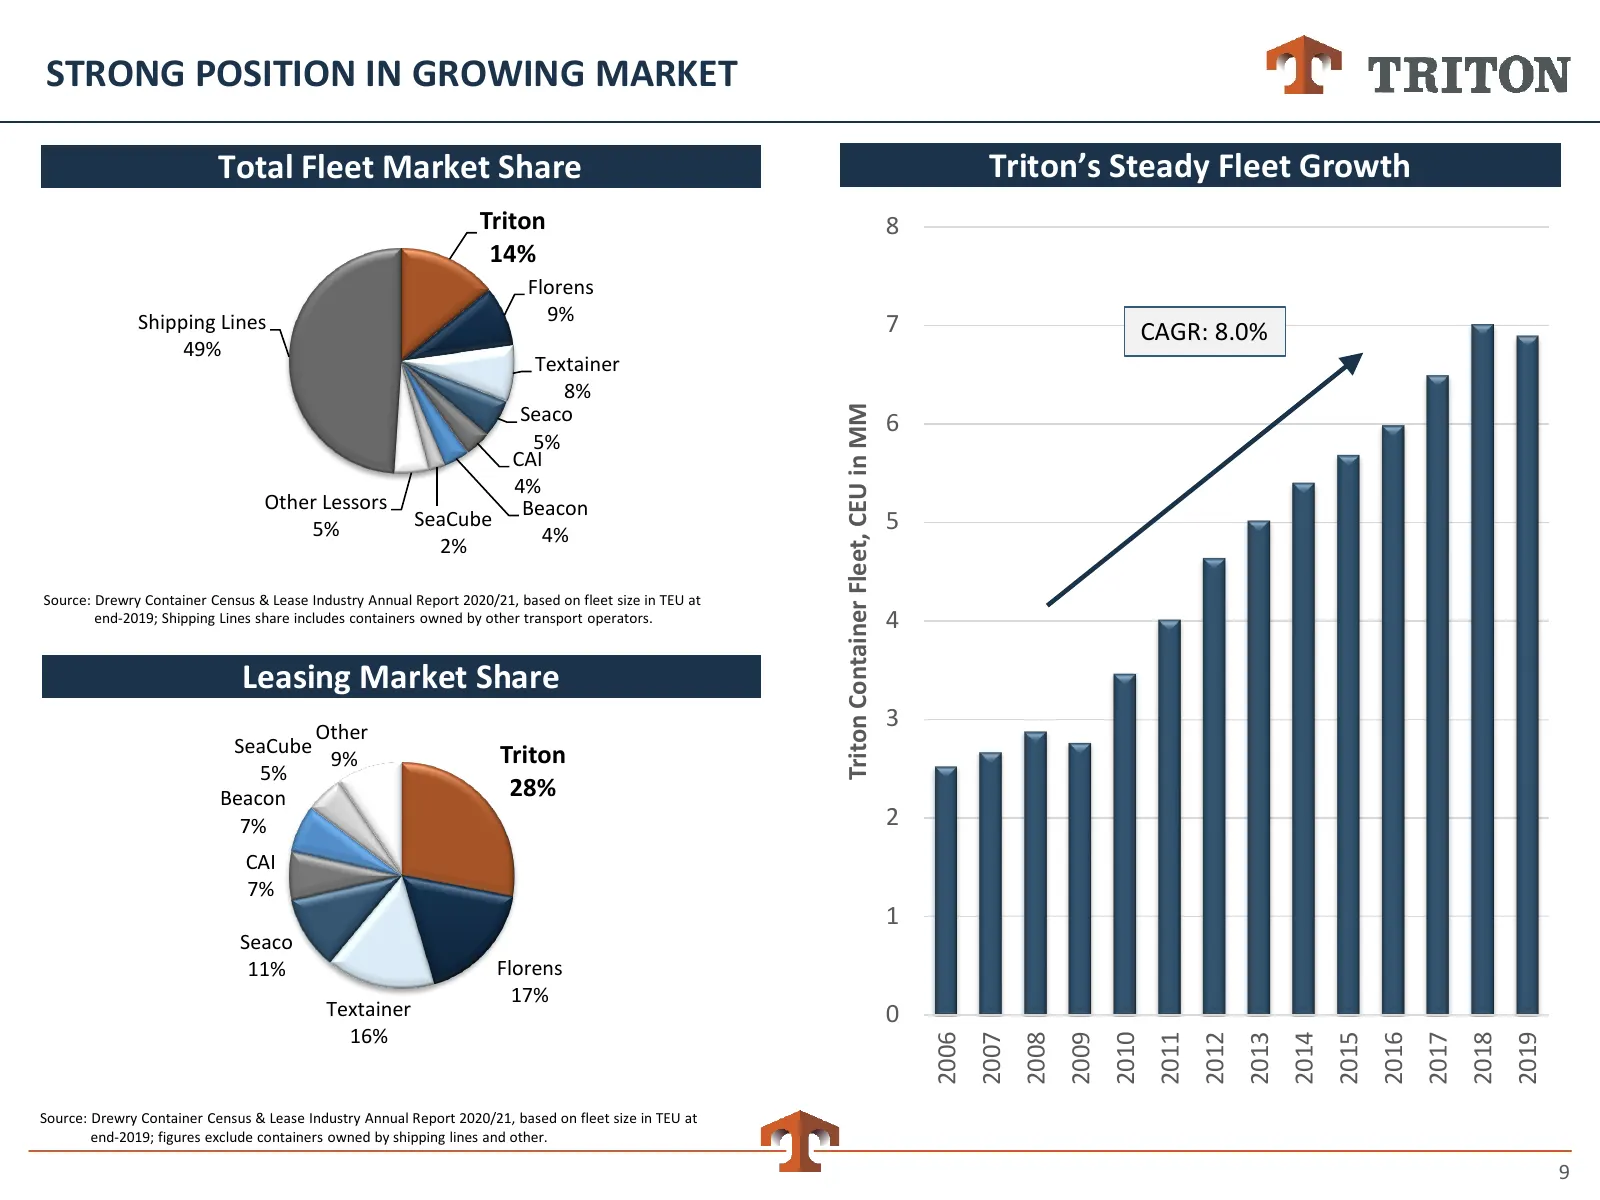
STRONG POSITION IN GROWING MARKET Total Fleet Market Share Triton’s Steady Fleet Growth Triton 8 14% Florens 9% Shipping Lines 7 CAGR: 8.0% 49% Textainer 8% Seaco Triton Container Fleet, CEU in MM 6 5% CAI 4% Other Lessors Beacon 5% SeaCube 4% 5 2% Source: Drewry Container Census & Lease Industry An
Slide 10: #1 in All Major Product Lines and Strong Lease Portfolio
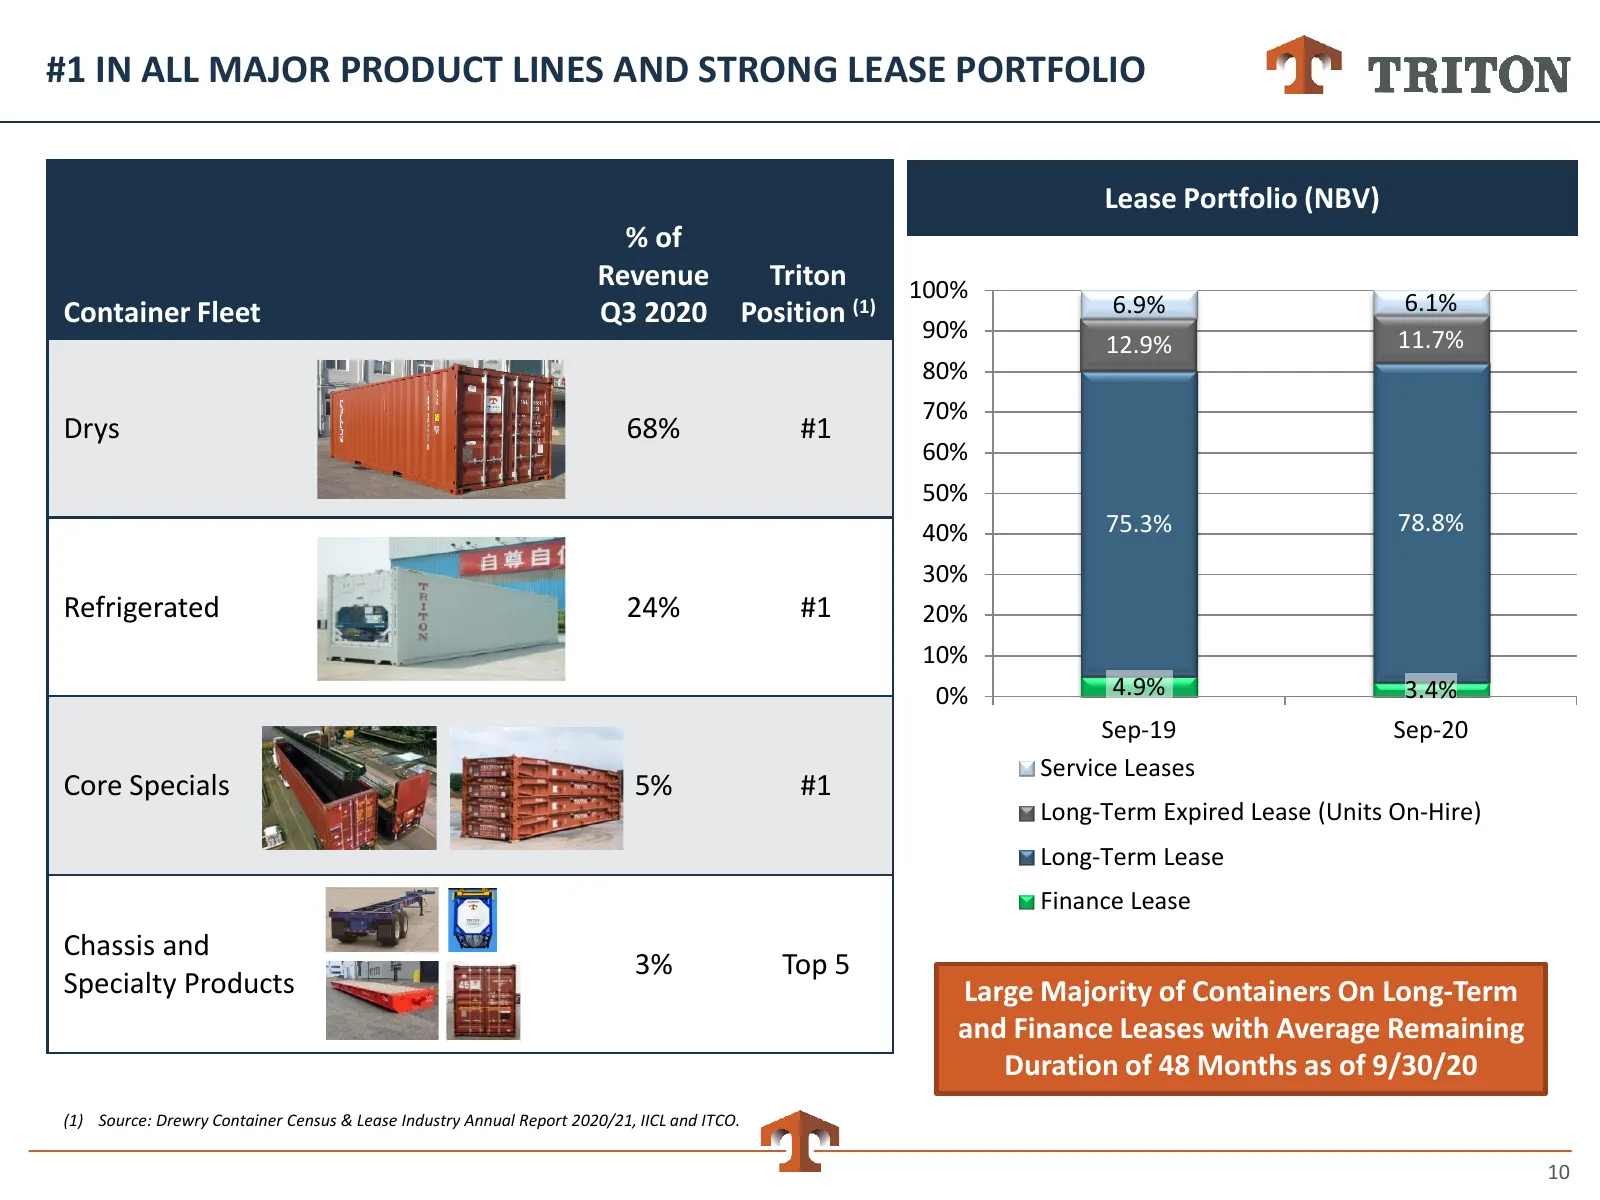
#1 IN ALL MAJOR PRODUCT LINES AND STRONG LEASE PORTFOLIO Lease Portfolio (NBV) % of Revenue Triton 100% Container Fleet Q3 2020 Position (1) 6.9% 6.1% 90% 11.7% 12.9% 80% 70% Drys 68% #1 60% 50% 40% 75.3% 78.8% 30% Refrigerated 24% #1 20% 10% 0% 4.9% 3.4% Sep-19 Sep-20 Service Leases Core Specials 5
Slide 11: Container Lifecycle
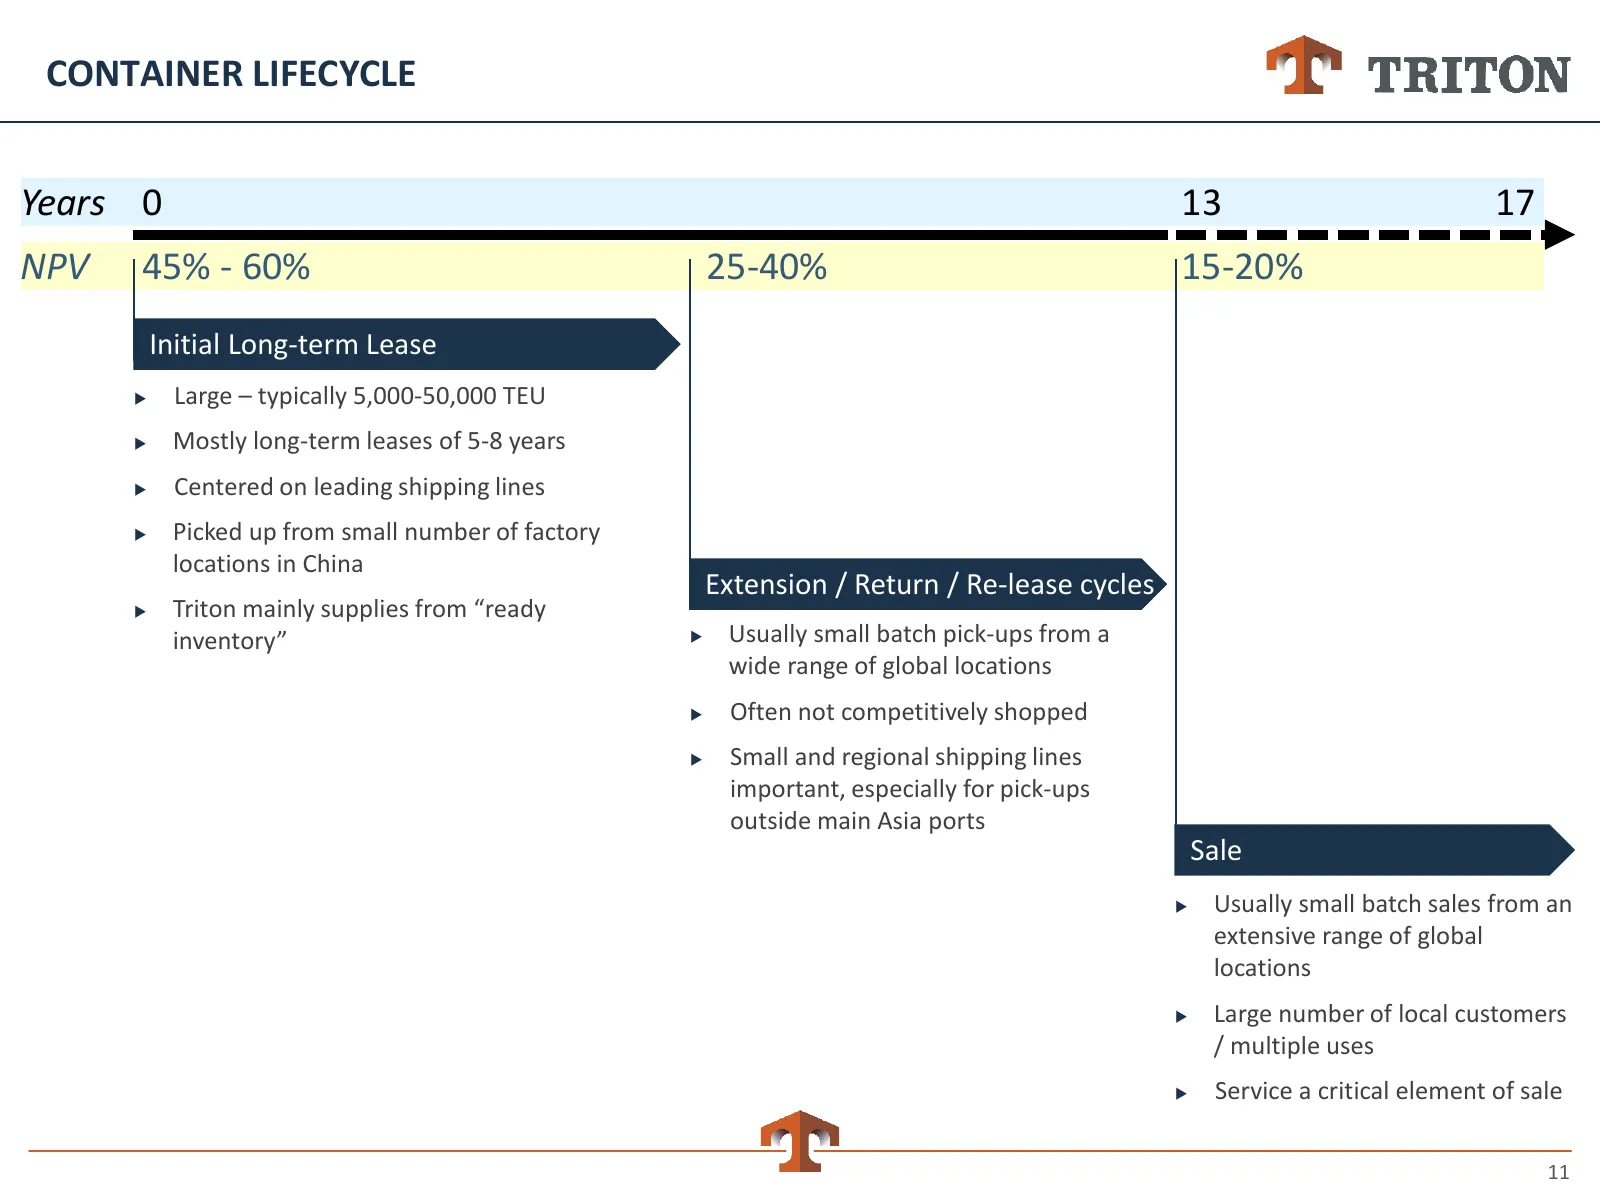
CONTAINER LIFECYCLE Years 0 13 17 NPV 45% - 60% 25-40% 15-20% Initial Long-term Lease Large – typically 5,000-50,000 TEU Mostly long-term leases of 5-8 years Centered on leading shipping lines Picked up from small number of factory locations in China Extension / Return / Re-lease cycles Tr
Slide 12: Global Trade Underpins Container Leasing Market Growth
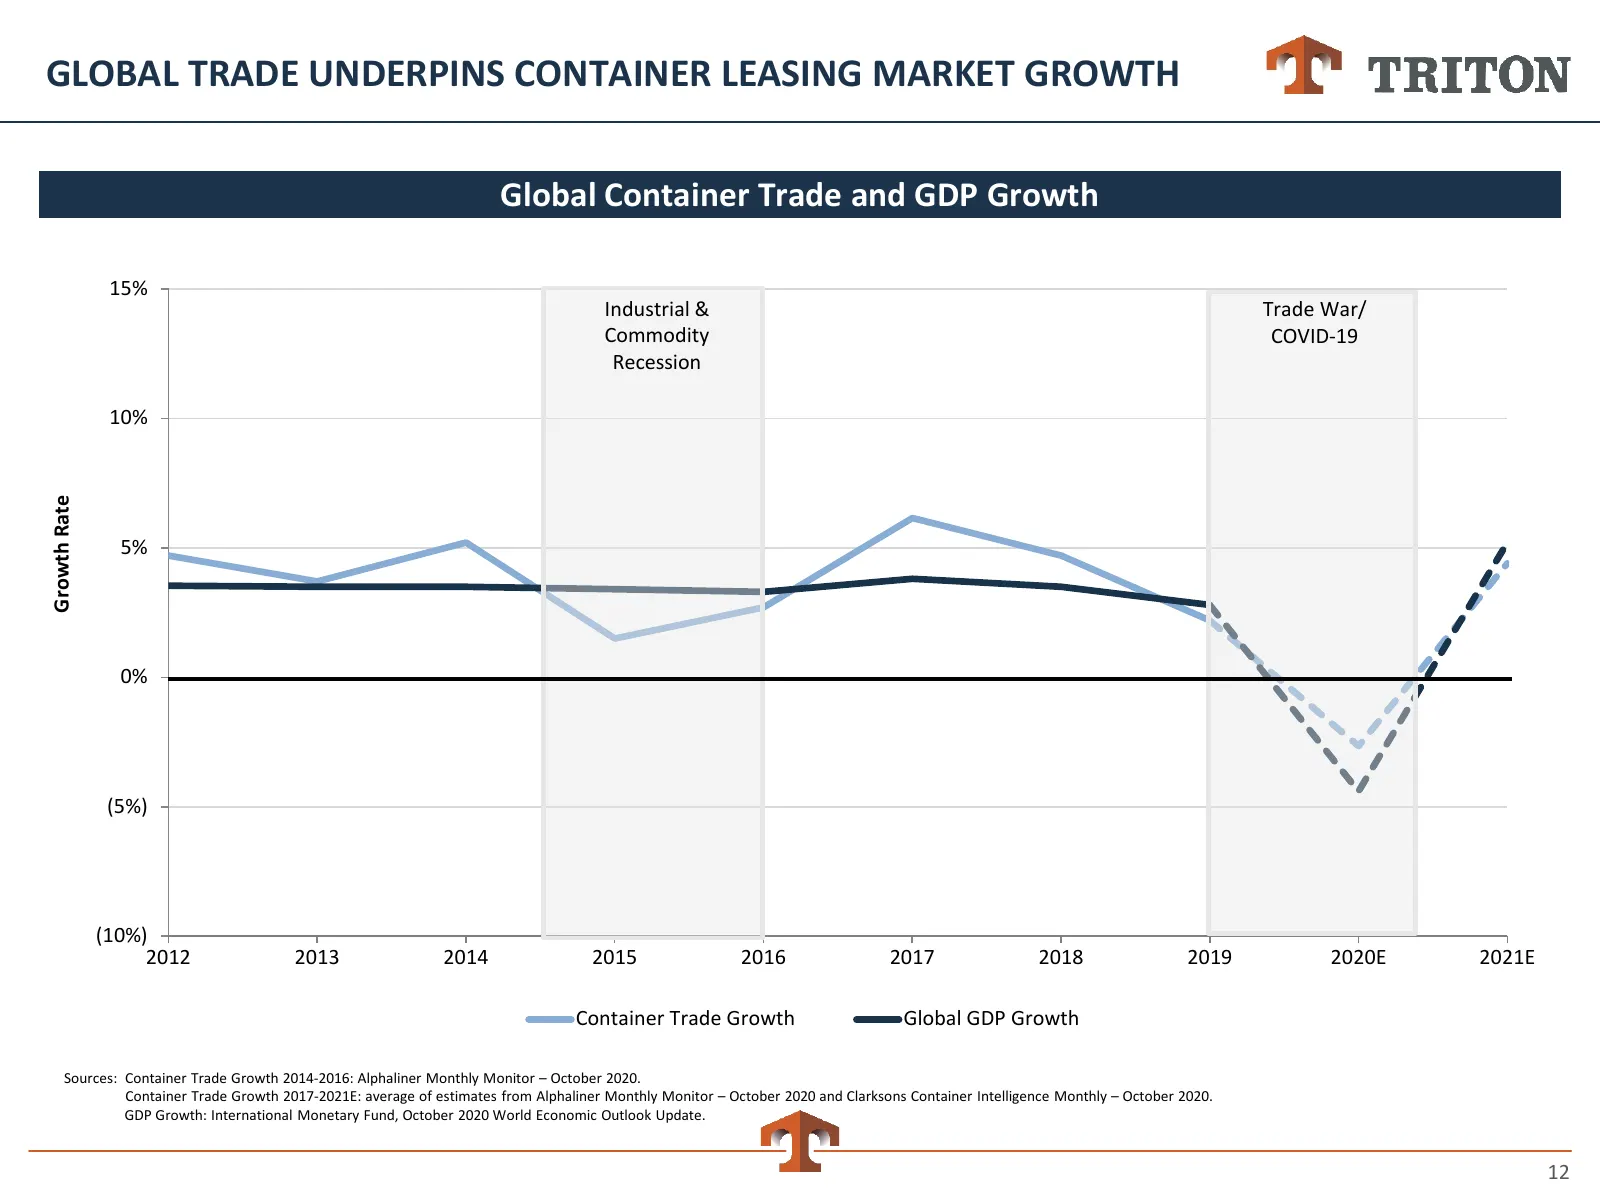
GLOBAL TRADE UNDERPINS CONTAINER LEASING MARKET GROWTH Global Container Trade and GDP Growth 15% Industrial & Trade War/ Commodity COVID-19 Recession 10% Growth Rate 5% 0% (5%) (10%) 2012 2013 2014 2015 2016 2017 2018 2019 2020E 2021E Container Trade Growth Global GDP Growth Sources: Container Trade
Slide 13: Increasing Share for Leasing
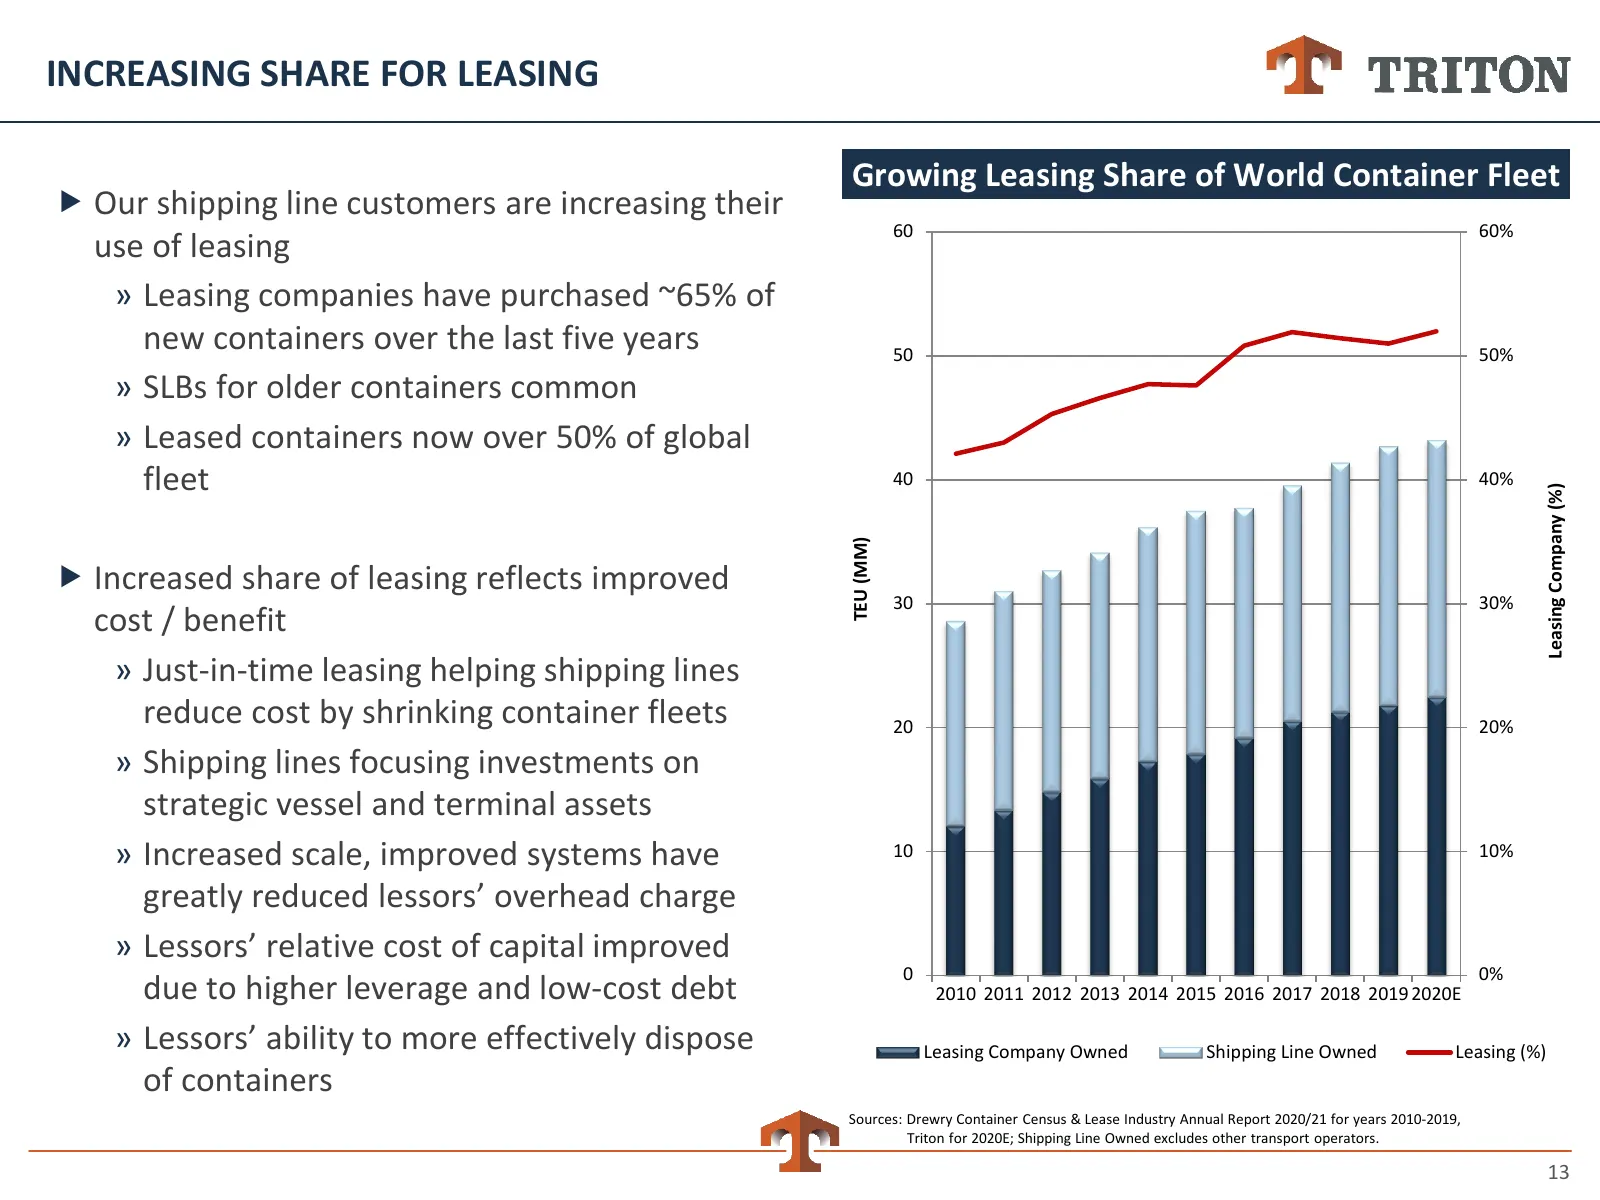
INCREASING SHARE FOR LEASING Growing Leasing Share of World Container Fleet Our shipping line customers are increasing their 60 60% use of leasing » Leasing companies have purchased ~65% of new containers over the last five years 50 50% » SLBs for older containers common » Leased containers now ov
Slide 14: Triton's Scale Provides Cost and Capability Advantages
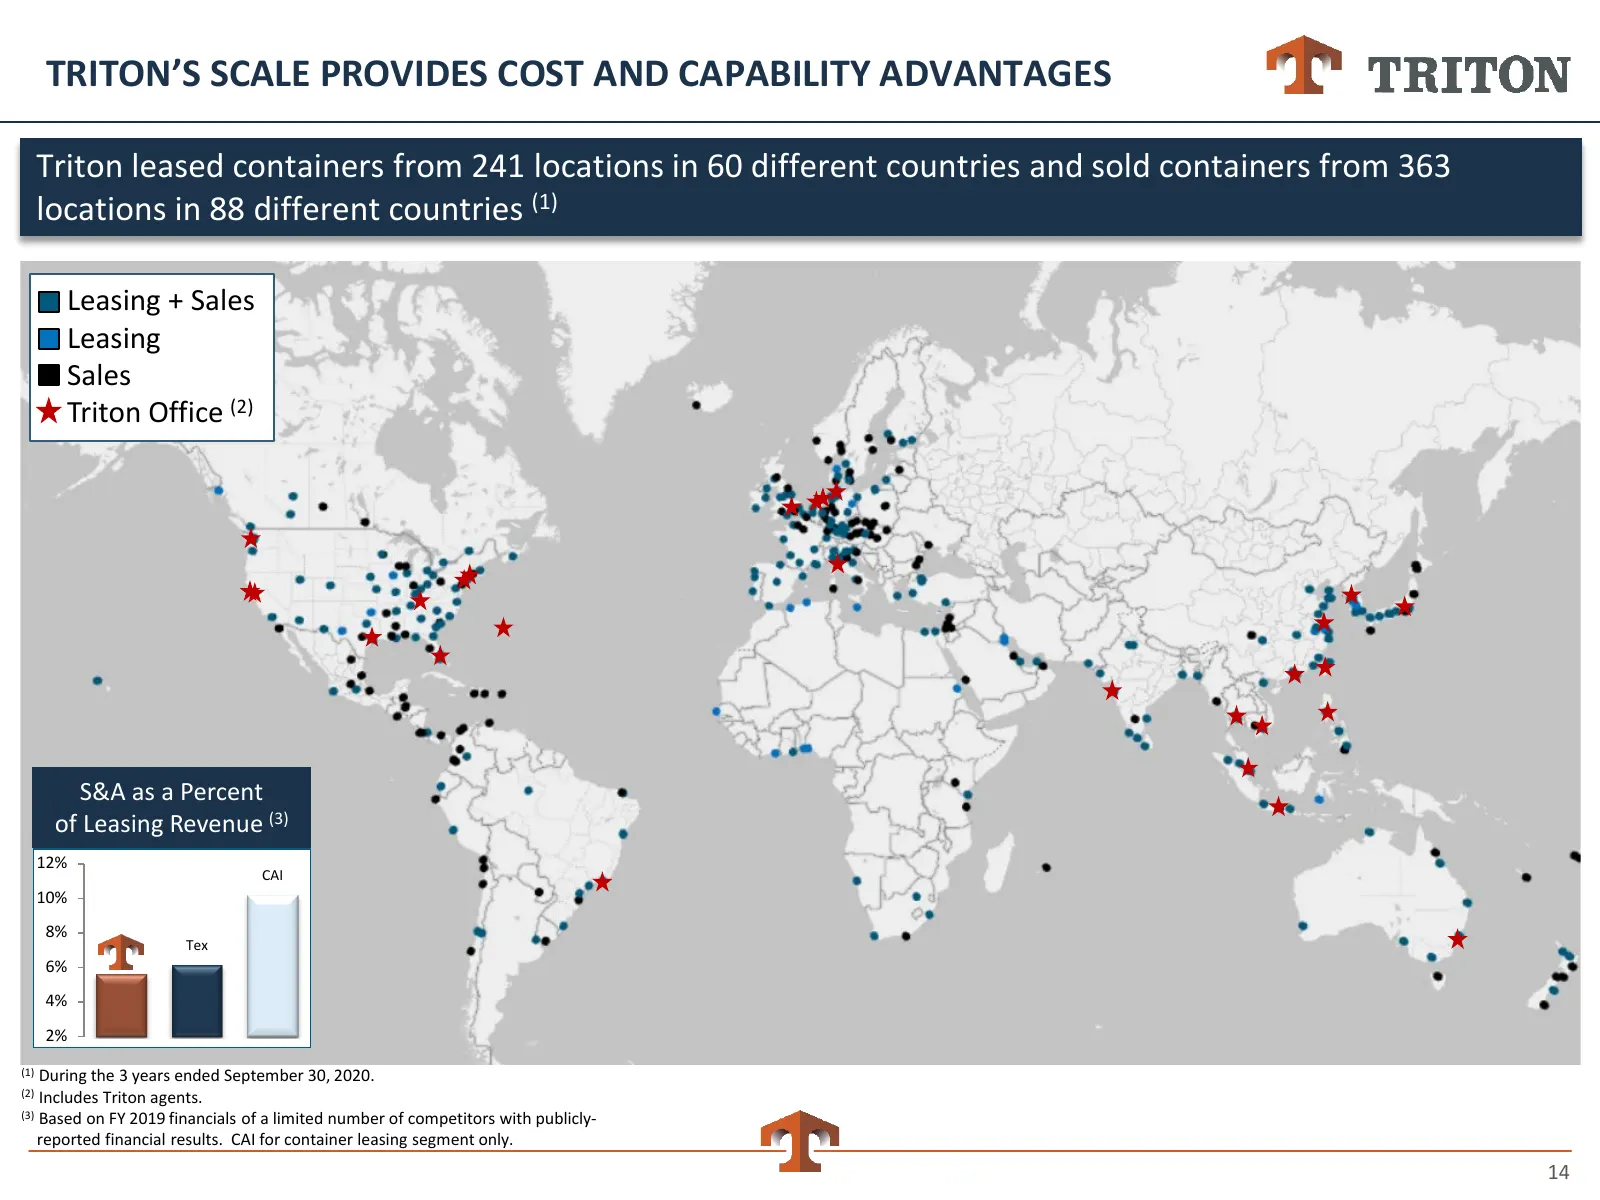
TRITON’S SCALE PROVIDES COST AND CAPABILITY ADVANTAGES Triton leased containers from 241 locations in 60 different countries and sold containers from 363 locations in 88 different countries (1) Leasing + Sales Leasing Sales Triton Office (2) S&A as a Percent of Leasing Revenue (3) 12% CAI 10% 8% Tex
Slide 15: Customer Consolidation Favors Largest Suppliers
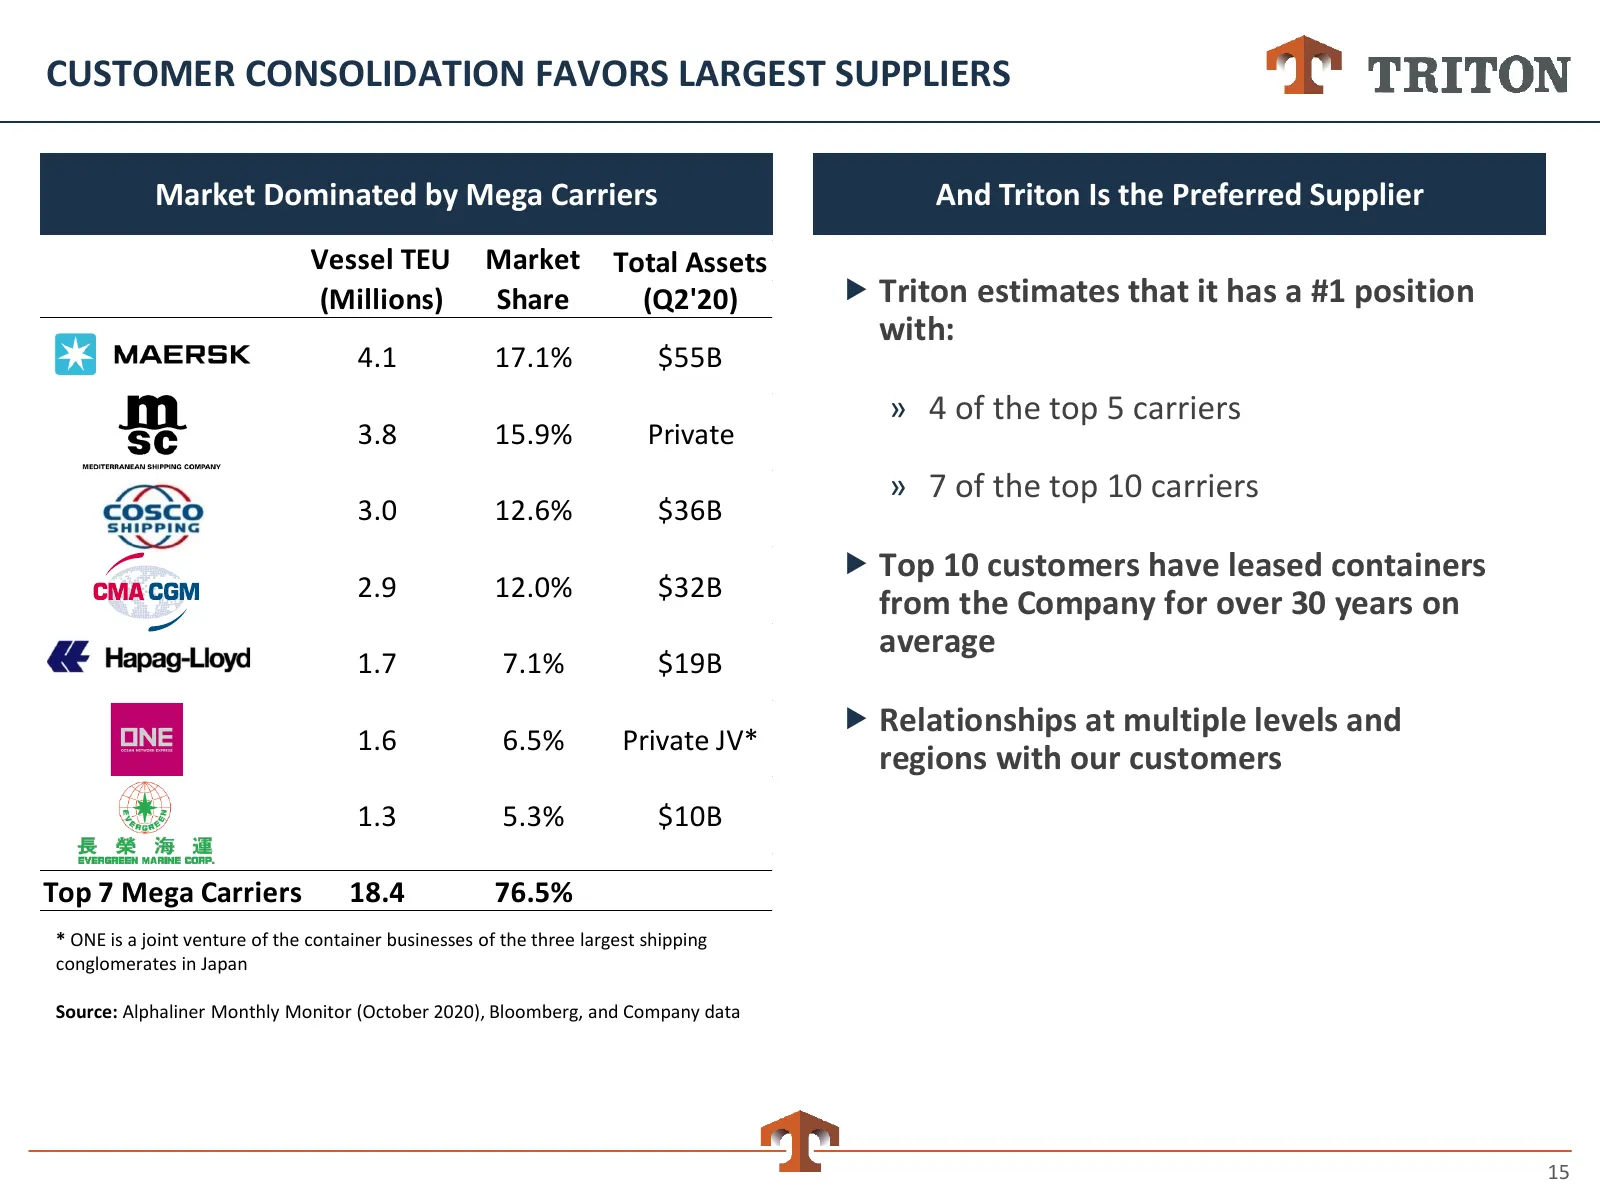
CUSTOMER CONSOLIDATION FAVORS LARGEST SUPPLIERS Market Dominated by Mega Carriers And Triton Is the Preferred Supplier Vessel TEU Market Total Assets (Millions) Share (Q2'20) Triton estimates that it has a #1 position with: 4.1 17.1% $55B » 4 of the top 5 carriers 3.8 15.9% Private » 7 of the top
Slide 16: Strong Long-Term Growth in EPS
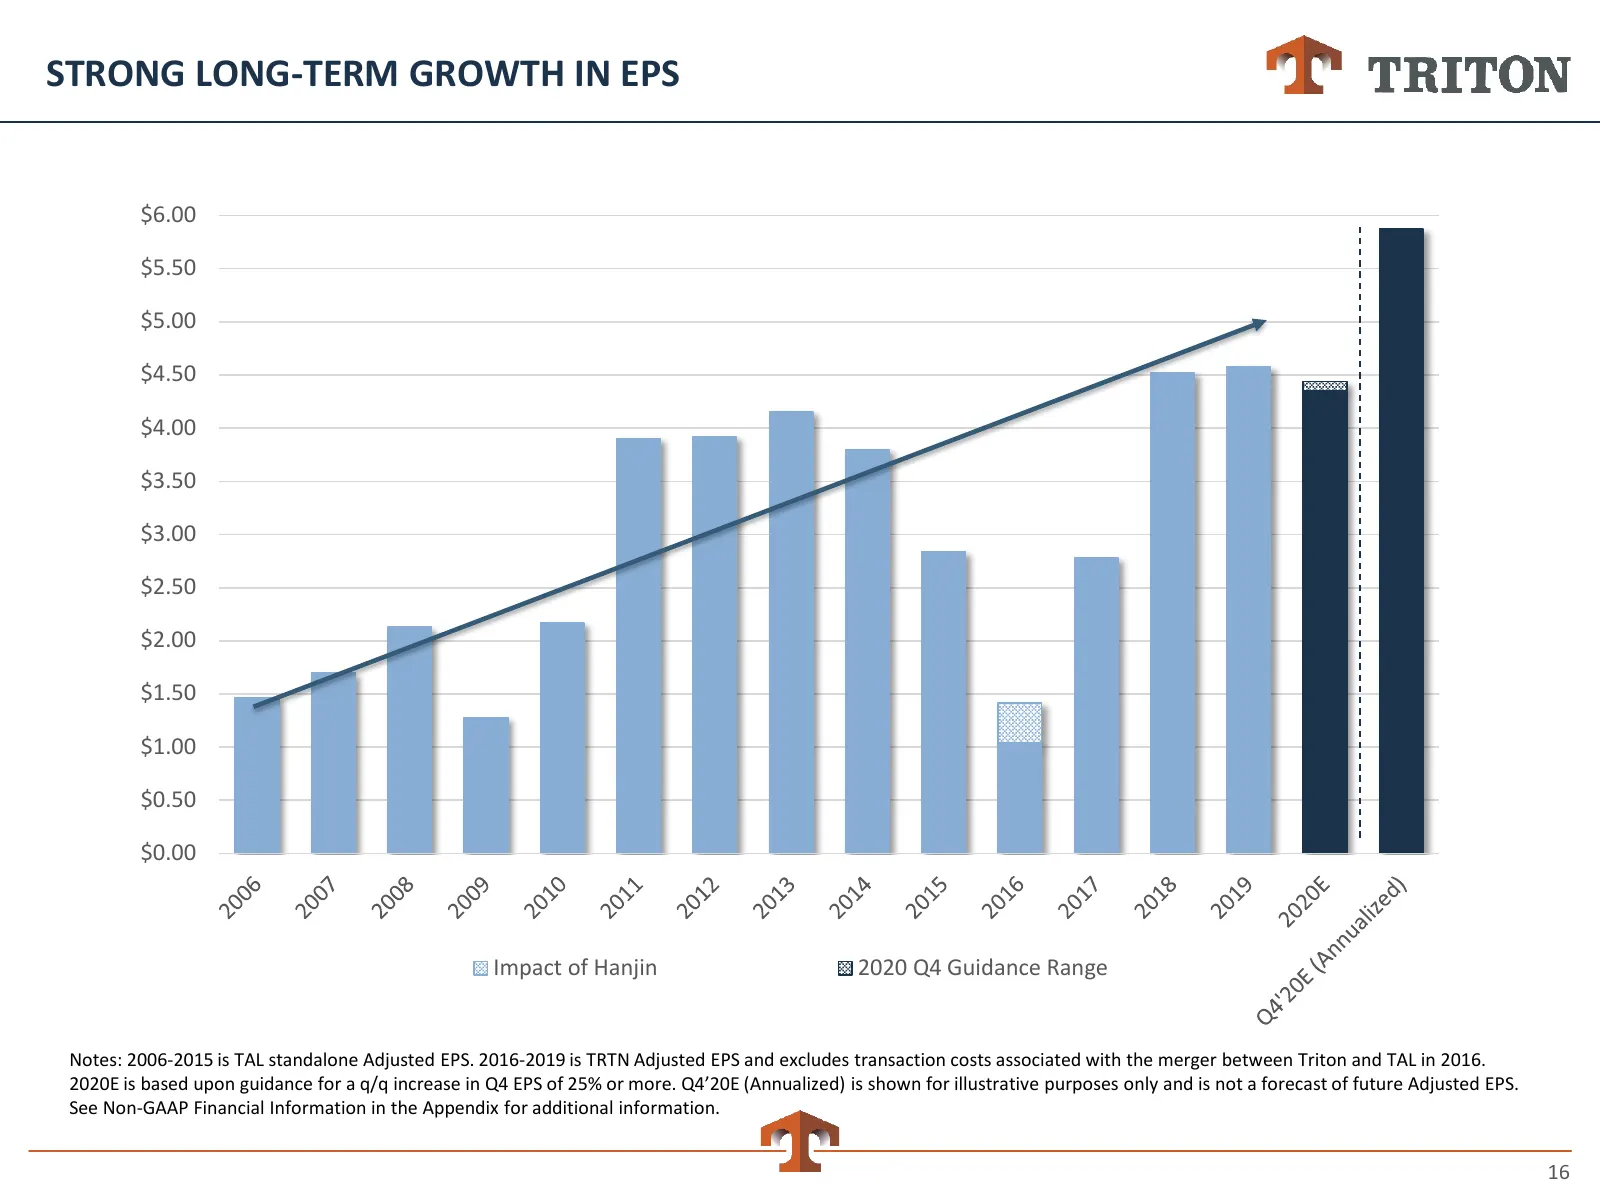
STRONG LONG-TERM GROWTH IN EPS $6.00 $5.50 $5.00 $4.50 $4.00 $3.50 $3.00 $2.50 $2.00 $1.50 $1.00 $0.50 $0.00 Impact of Hanjin 2020 Q4 Guidance Range Notes: 2006-2015 is TAL standalone Adjusted EPS. 2016-2019 is TRTN Adjusted EPS and excludes transaction costs associated with the merger between Trito
Slide 17: Attractive Investment Returns
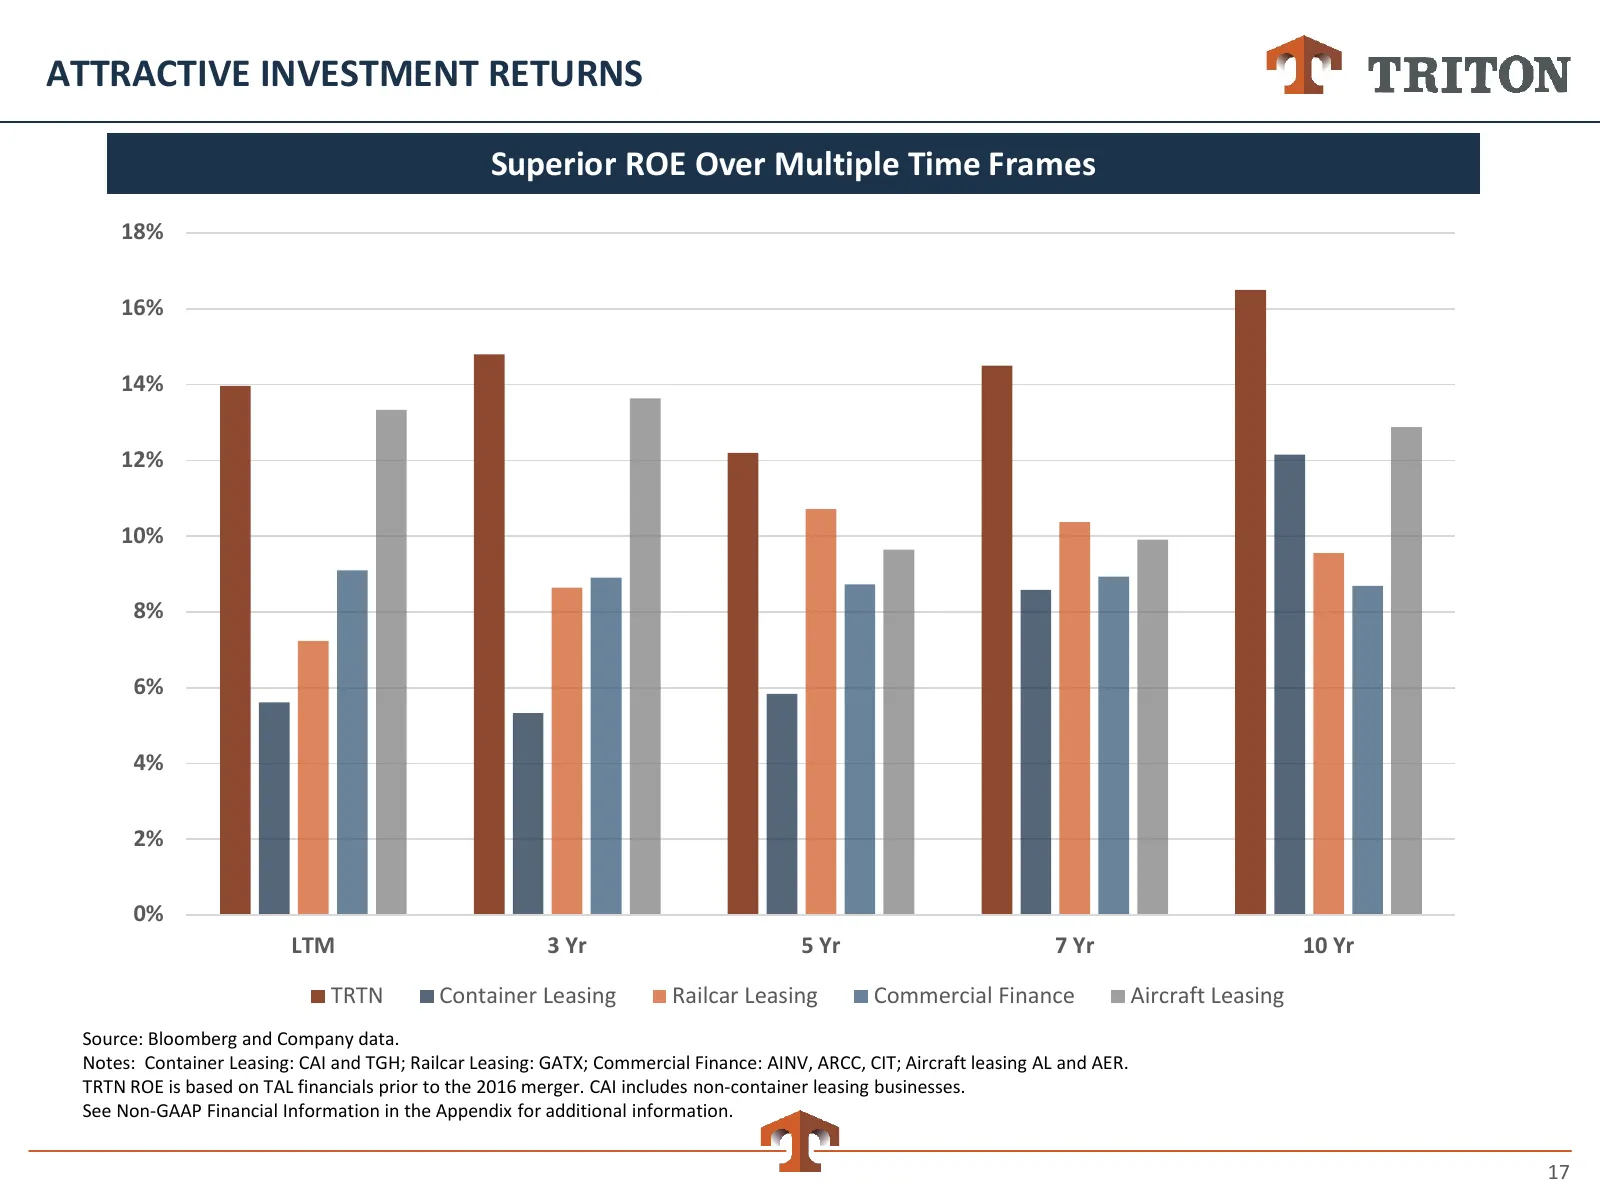
ATTRACTIVE INVESTMENT RETURNS Superior ROE Over Multiple Time Frames 18% 16% 14% 12% 10% 8% 6% 4% 2% 0% LTM 3 Yr 5 Yr 7 Yr 10 Yr TRTN Container Leasing Railcar Leasing Commercial Finance Aircraft Leasing Source: Bloomberg and Company data. Notes: Container Leasing: CAI and TGH; Railcar Leasing: GATX
Slide 18: Long-Term Value Creation
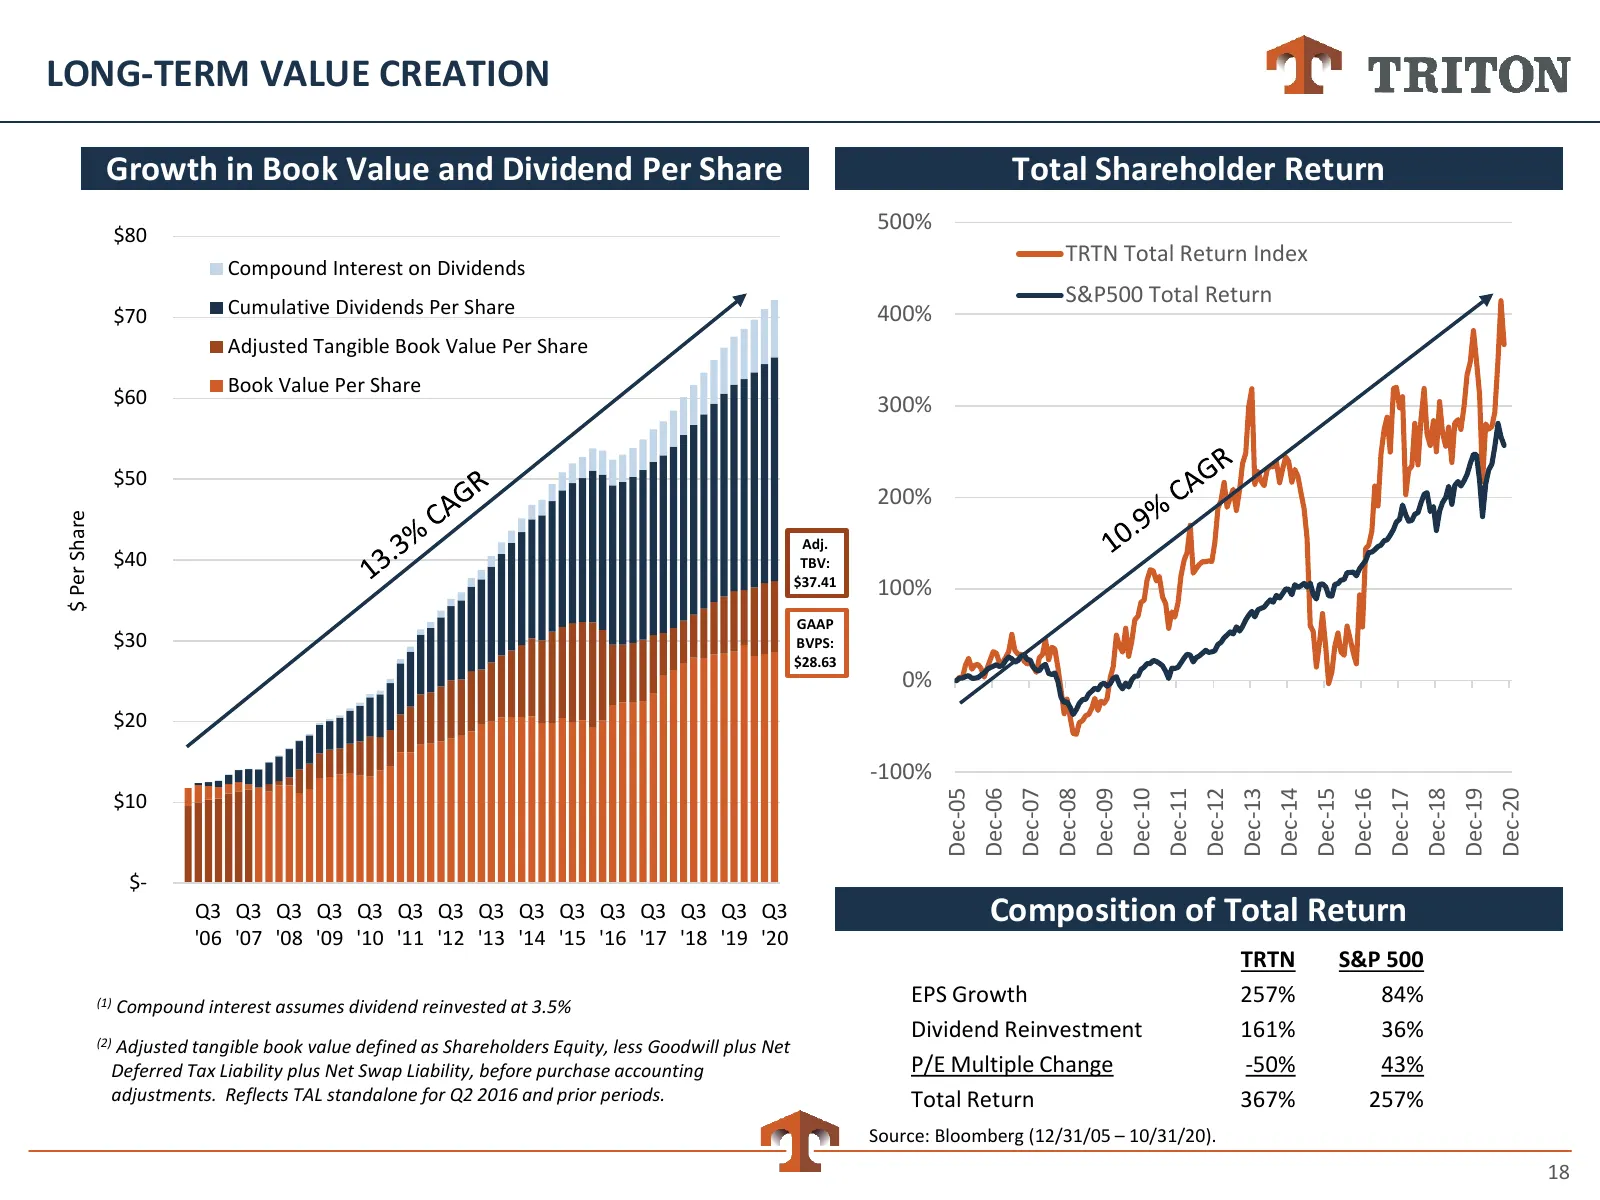
LONG-TERM VALUE CREATION Growth in Book Value and Dividend Per Share Total Shareholder Return 500% $80 TRTN Total Return Index Compound Interest on Dividends Cumulative Dividends Per Share S&P500 Total Return $70 400% Adjusted Tangible Book Value Per Share Book Value Per Share $60 300% $50 200% $ Pe
Slide 19: Outstanding Current Performance
Outstanding Current Performance 19
Slide 20: Current Performance Overview
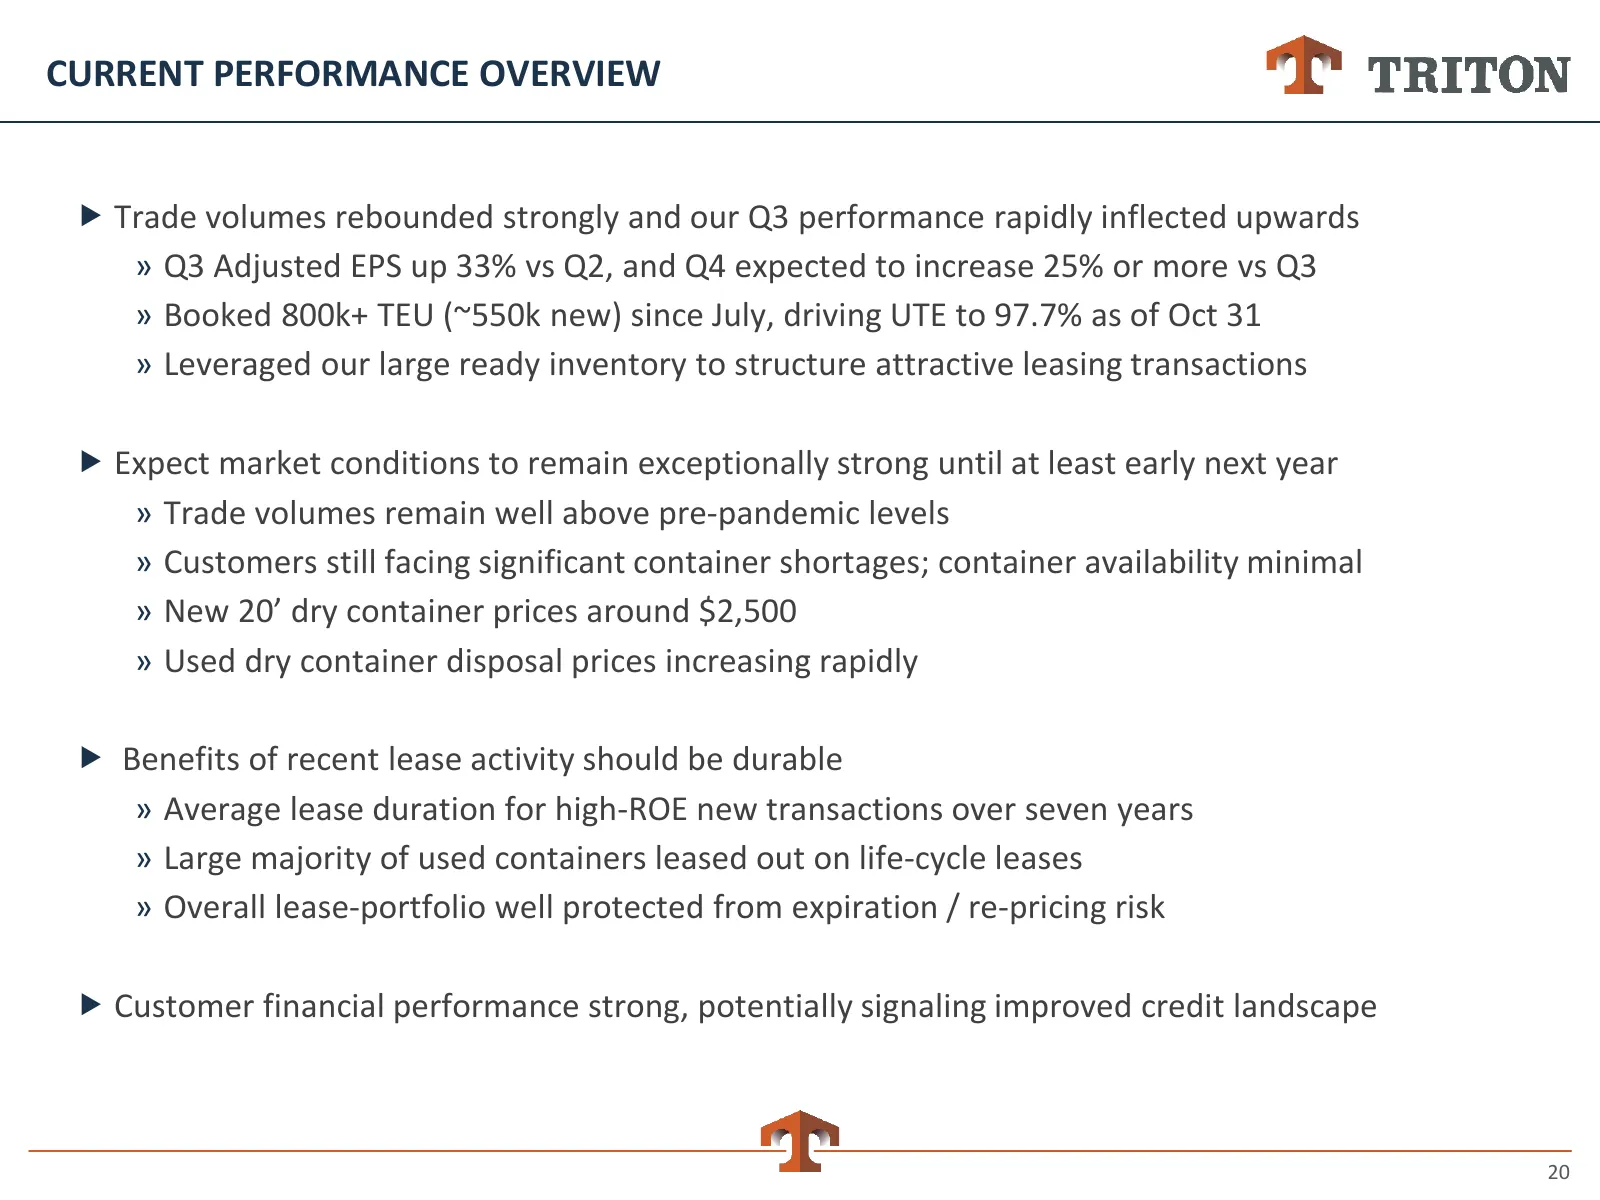
CURRENT PERFORMANCE OVERVIEW Trade volumes rebounded strongly and our Q3 performance rapidly inflected upwards » Q3 Adjusted EPS up 33% vs Q2, and Q4 expected to increase 25% or more vs Q3 » Booked 800k+ TEU (~550k new) since July, driving UTE to 97.7% as of Oct 31 » Leveraged our large ready inve
Slide 21: Financial Performance Inflected Upwards in Q3; Expect Increase in Q4
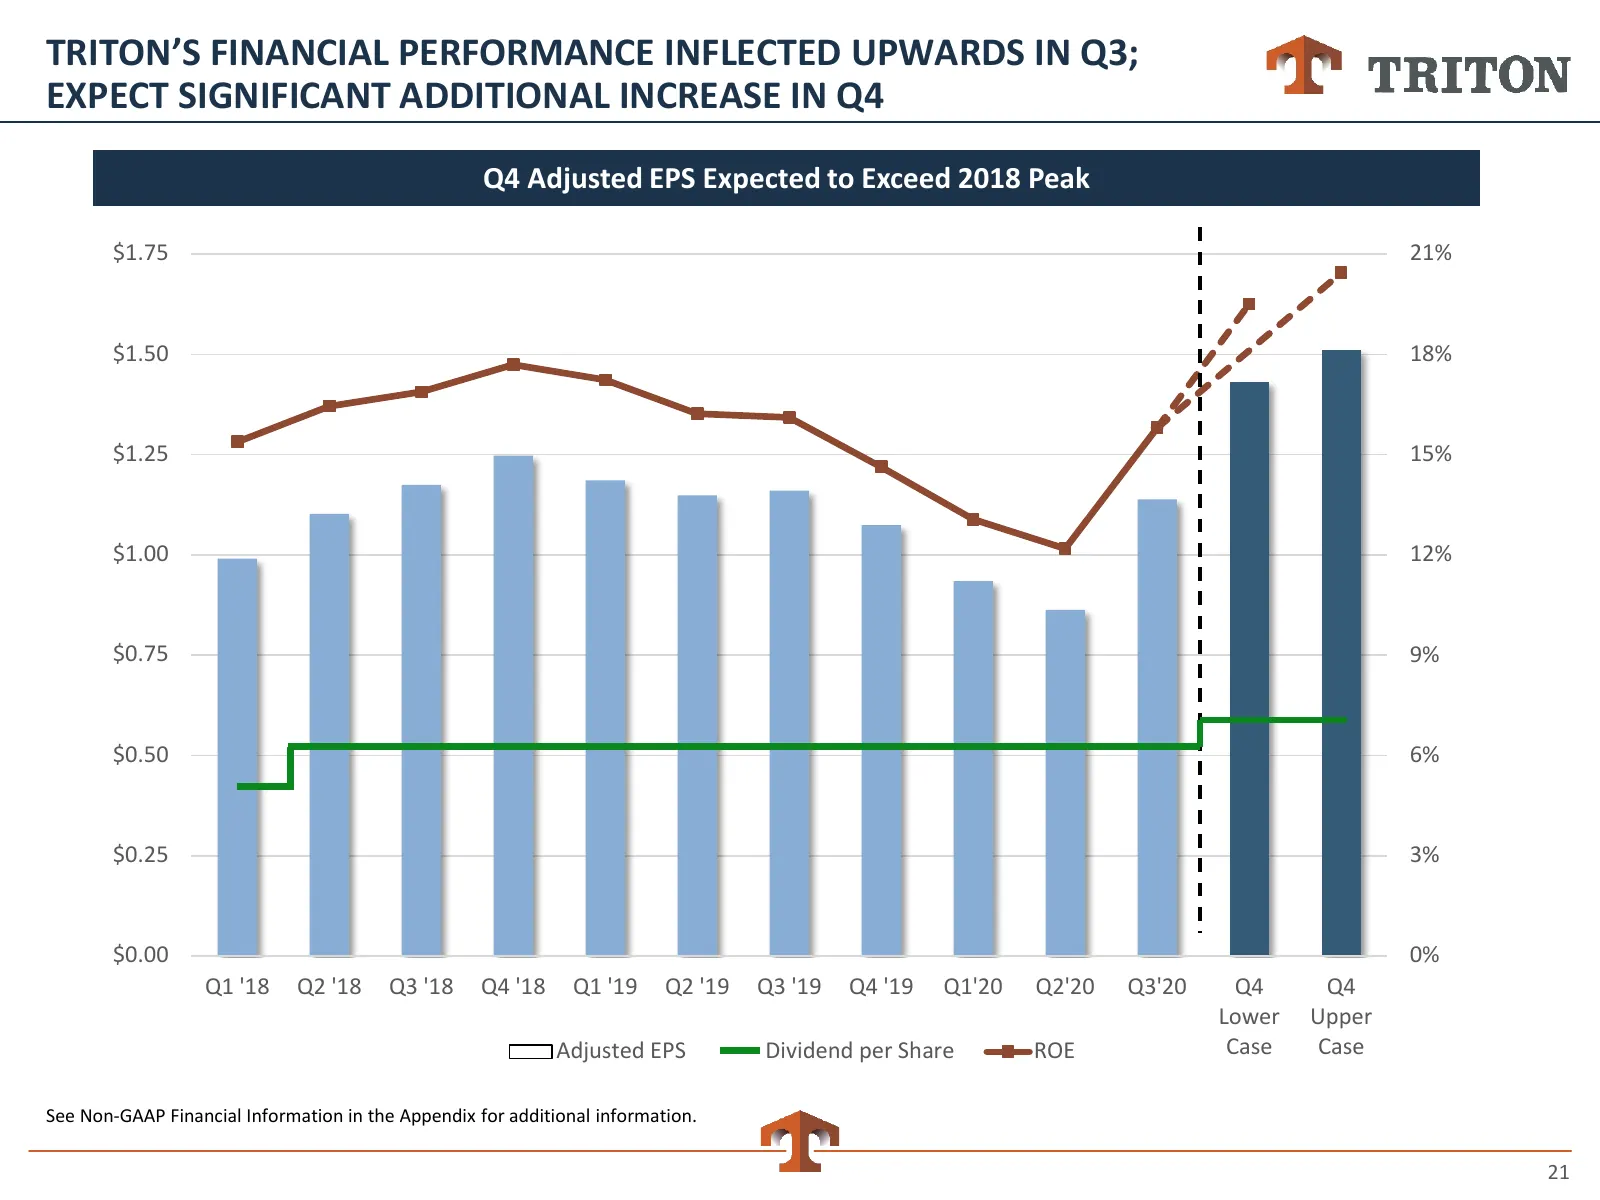
TRITON’S FINANCIAL PERFORMANCE INFLECTED UPWARDS IN Q3; EXPECT SIGNIFICANT ADDITIONAL INCREASE IN Q4 Q4 Adjusted EPS Expected to Exceed 2018 Peak $1.75 21% $1.50 18% $1.25 15% $1.00 12% $0.75 9% $0.50 6% $0.25 3% $0.00 0% Q1 '18 Q2 '18 Q3 '18 Q4 '18 Q1 '19 Q2 '19 Q3 '19 Q4 '19 Q1'20 Q2'20 Q3'20 Q4 Q
Slide 22: Much of Expected Q4 Increase Already Locked-In
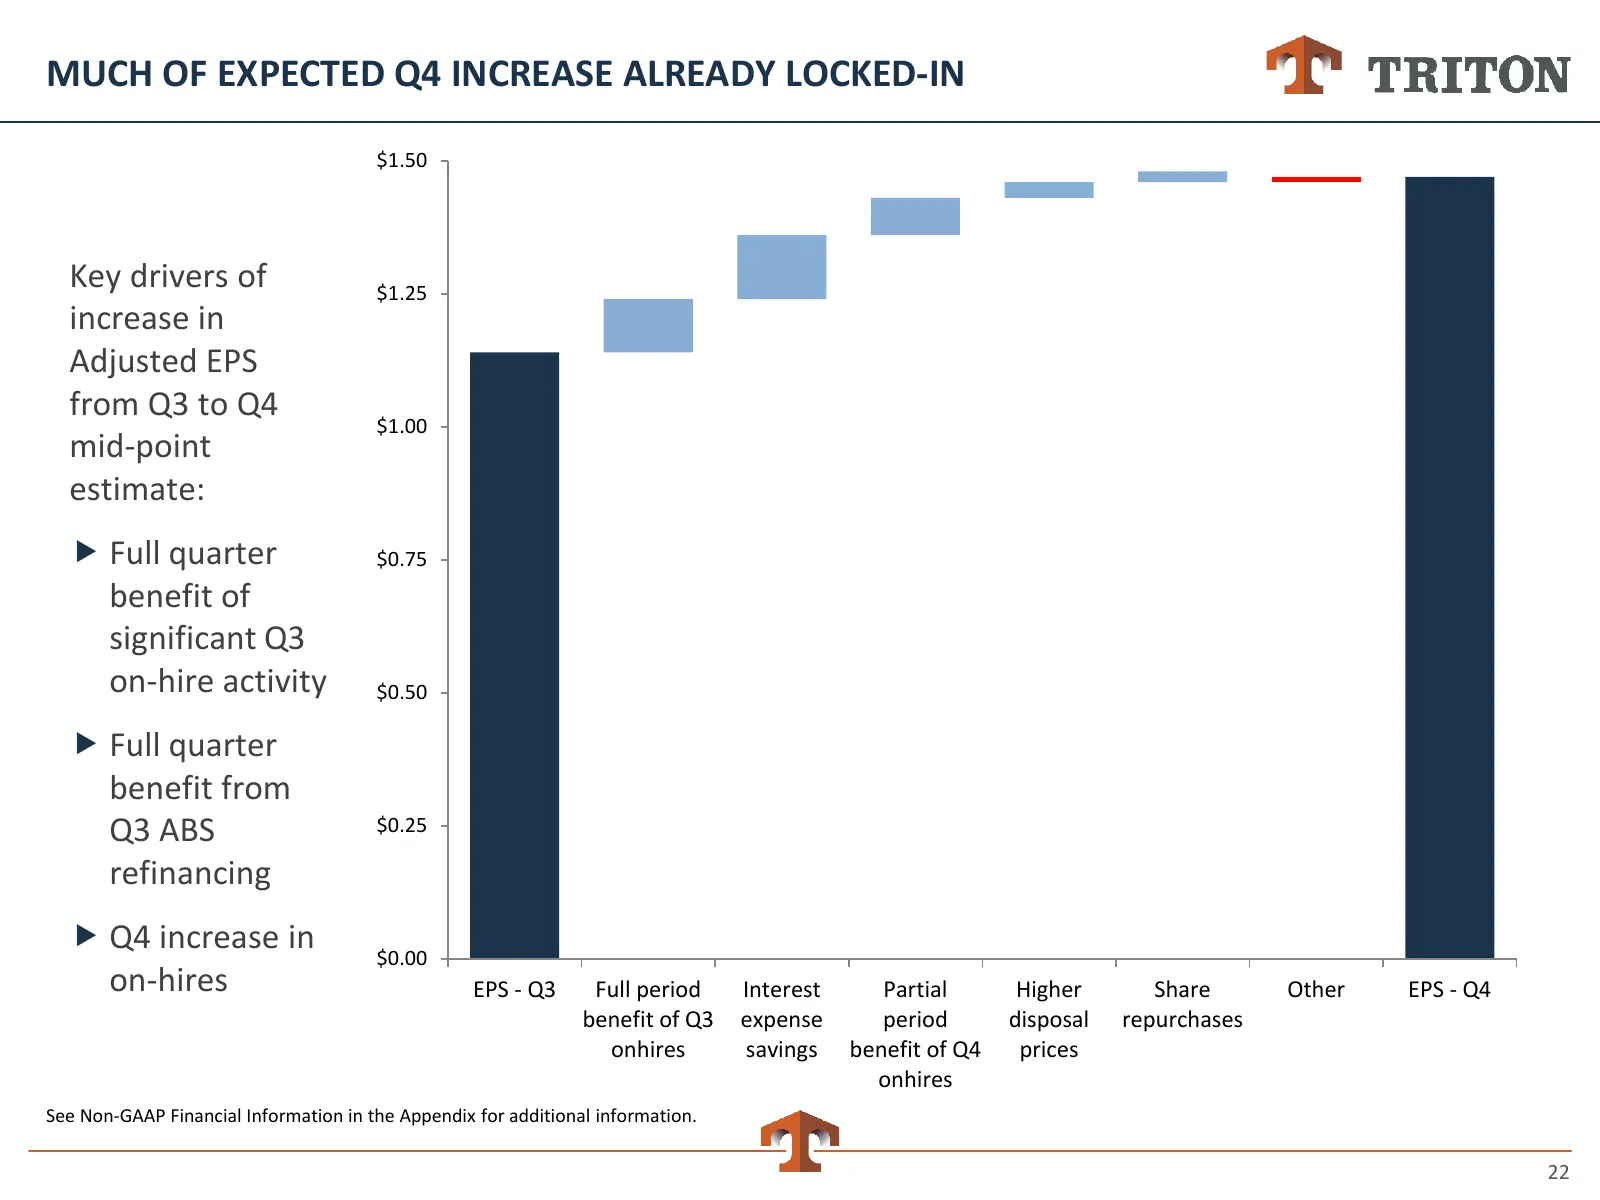
MUCH OF EXPECTED Q4 INCREASE ALREADY LOCKED-IN $1.50 Key drivers of $1.25 increase in Adjusted EPS from Q3 to Q4 $1.00 mid-point estimate: Full quarter $0.75 benefit of significant Q3 on-hire activity $0.50 Full quarter benefit from Q3 ABS $0.25 refinancing Q4 increase in $0.00 on-hires EPS -
Slide 23: Global Trade in Goods Rebounded Sharply
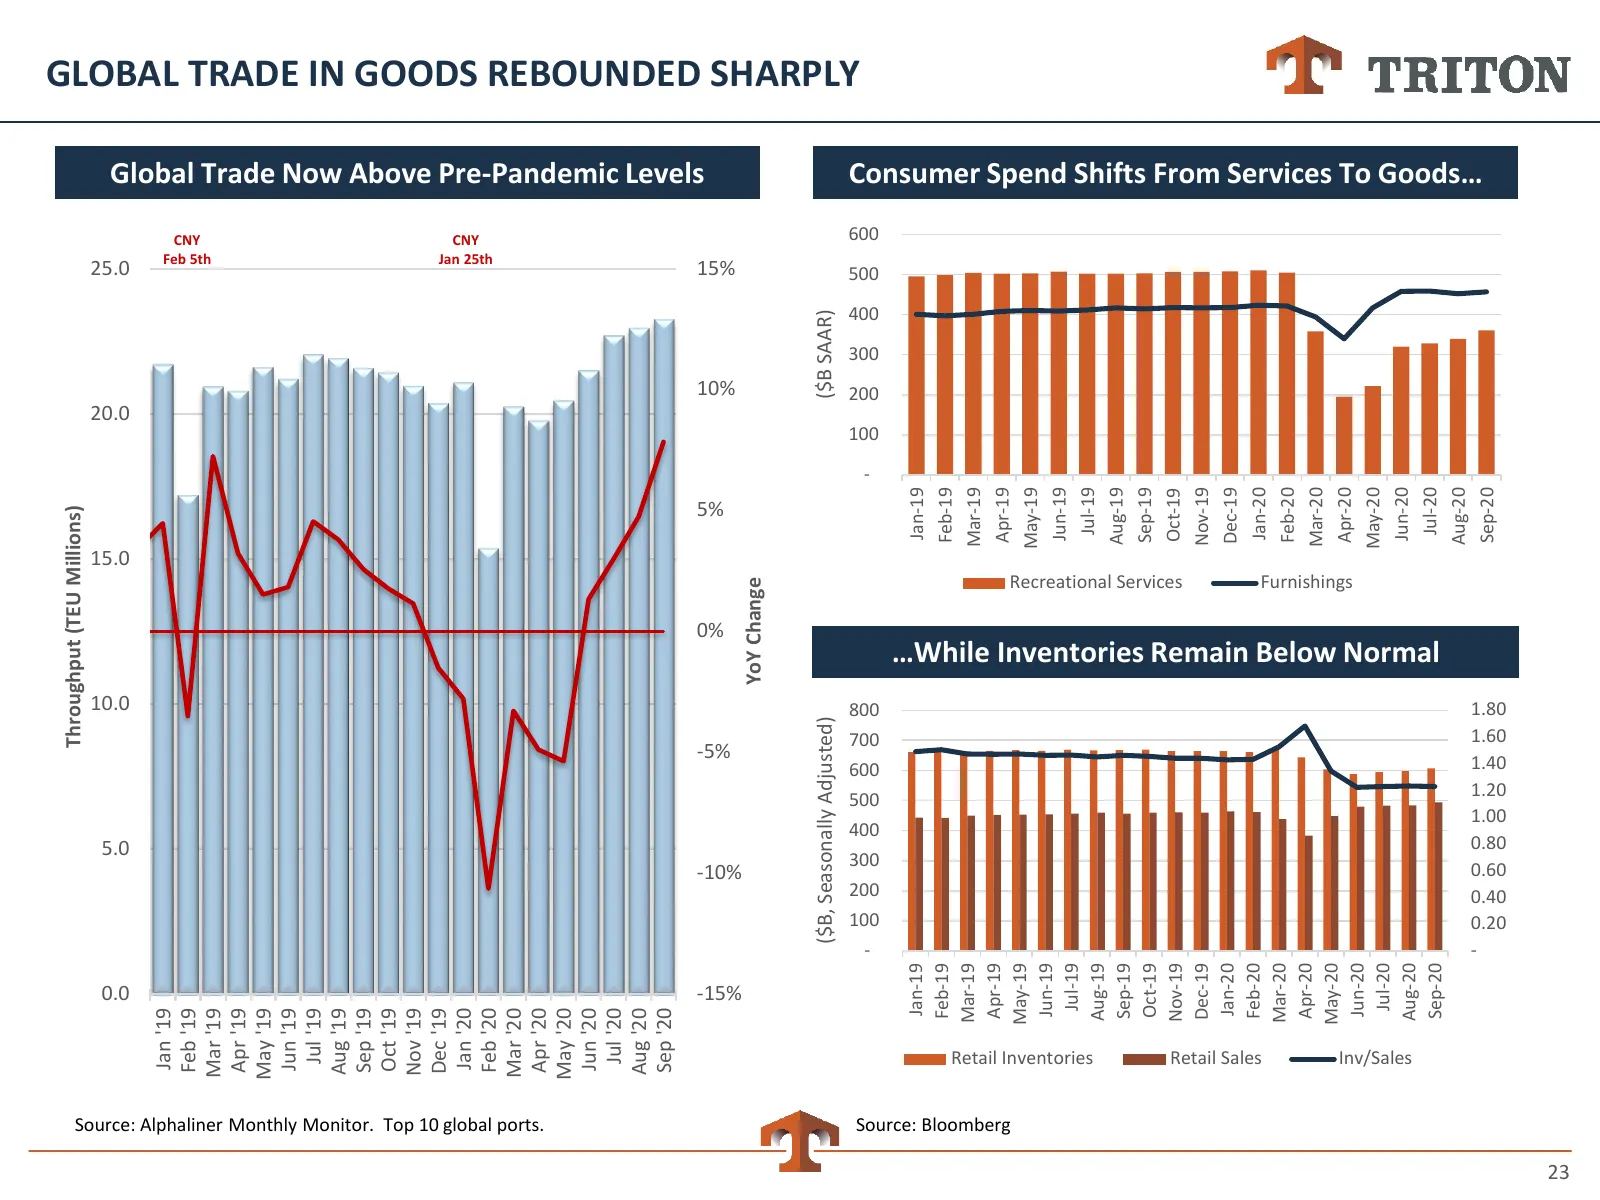
Throughput (TEU Millions) 0.0 5.0 10.0 15.0 20.0 25.0 Jan '19 CNY Feb '19 Feb 5th Mar '19 Apr '19 May '19 Jun '19 Jul '19 Aug '19 Sep '19 Oct '19 Nov '19 Dec '19 Jan '20 CNY Jan 25th Feb '20 Mar '20 Source: Alphaliner Monthly Monitor. Top 10 global ports. Apr '20 May '20 Jun '20 Jul '20 Aug '20 Sep
Slide 24: Key Operating Metrics Inflected Upwards in Q3
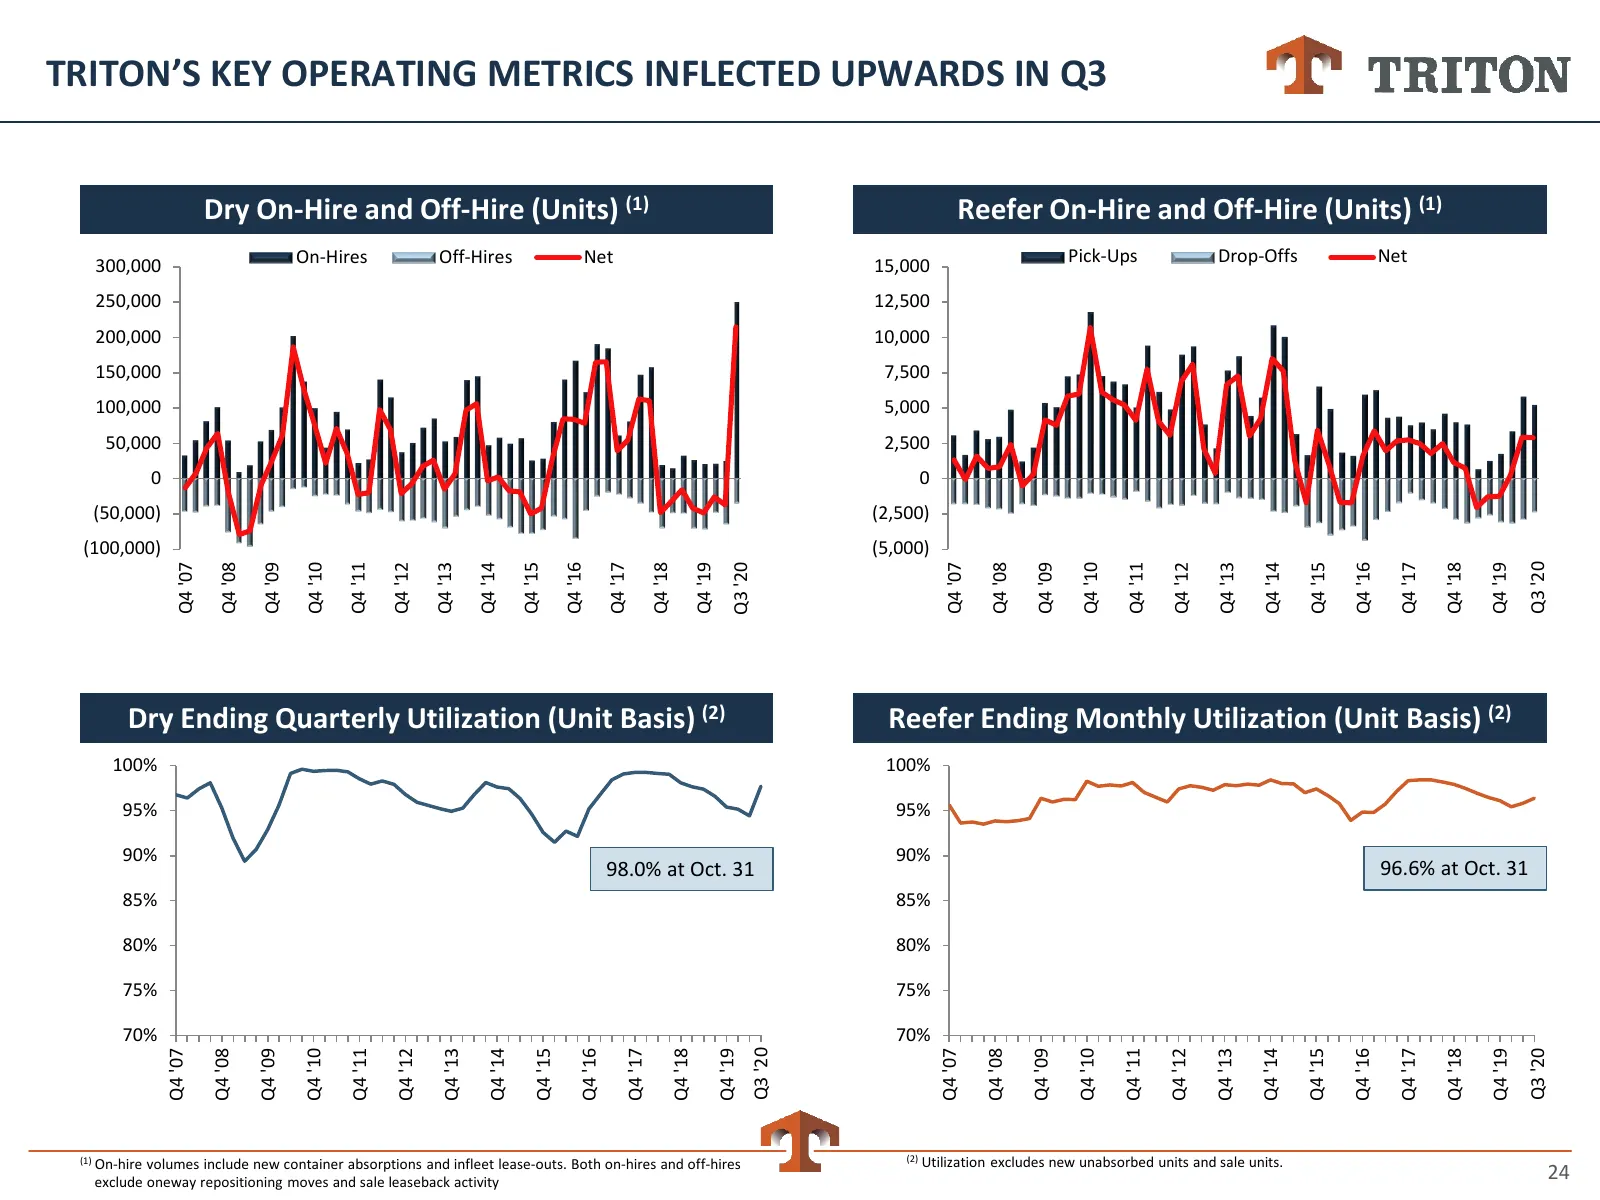
TRITON’S KEY OPERATING METRICS INFLECTED UPWARDS IN Q3 Dry On-Hire and Off-Hire (Units) (1) Reefer On-Hire and Off-Hire (Units) (1) 300,000 On-Hires Off-Hires Net 15,000 Pick-Ups Drop-Offs Net 250,000 12,500 200,000 10,000 150,000 7,500 100,000 5,000 50,000 2,500 0 0 (50,000) (2,500) (100,000) (5,00
Slide 25: New Dry Production and Factory Inventory
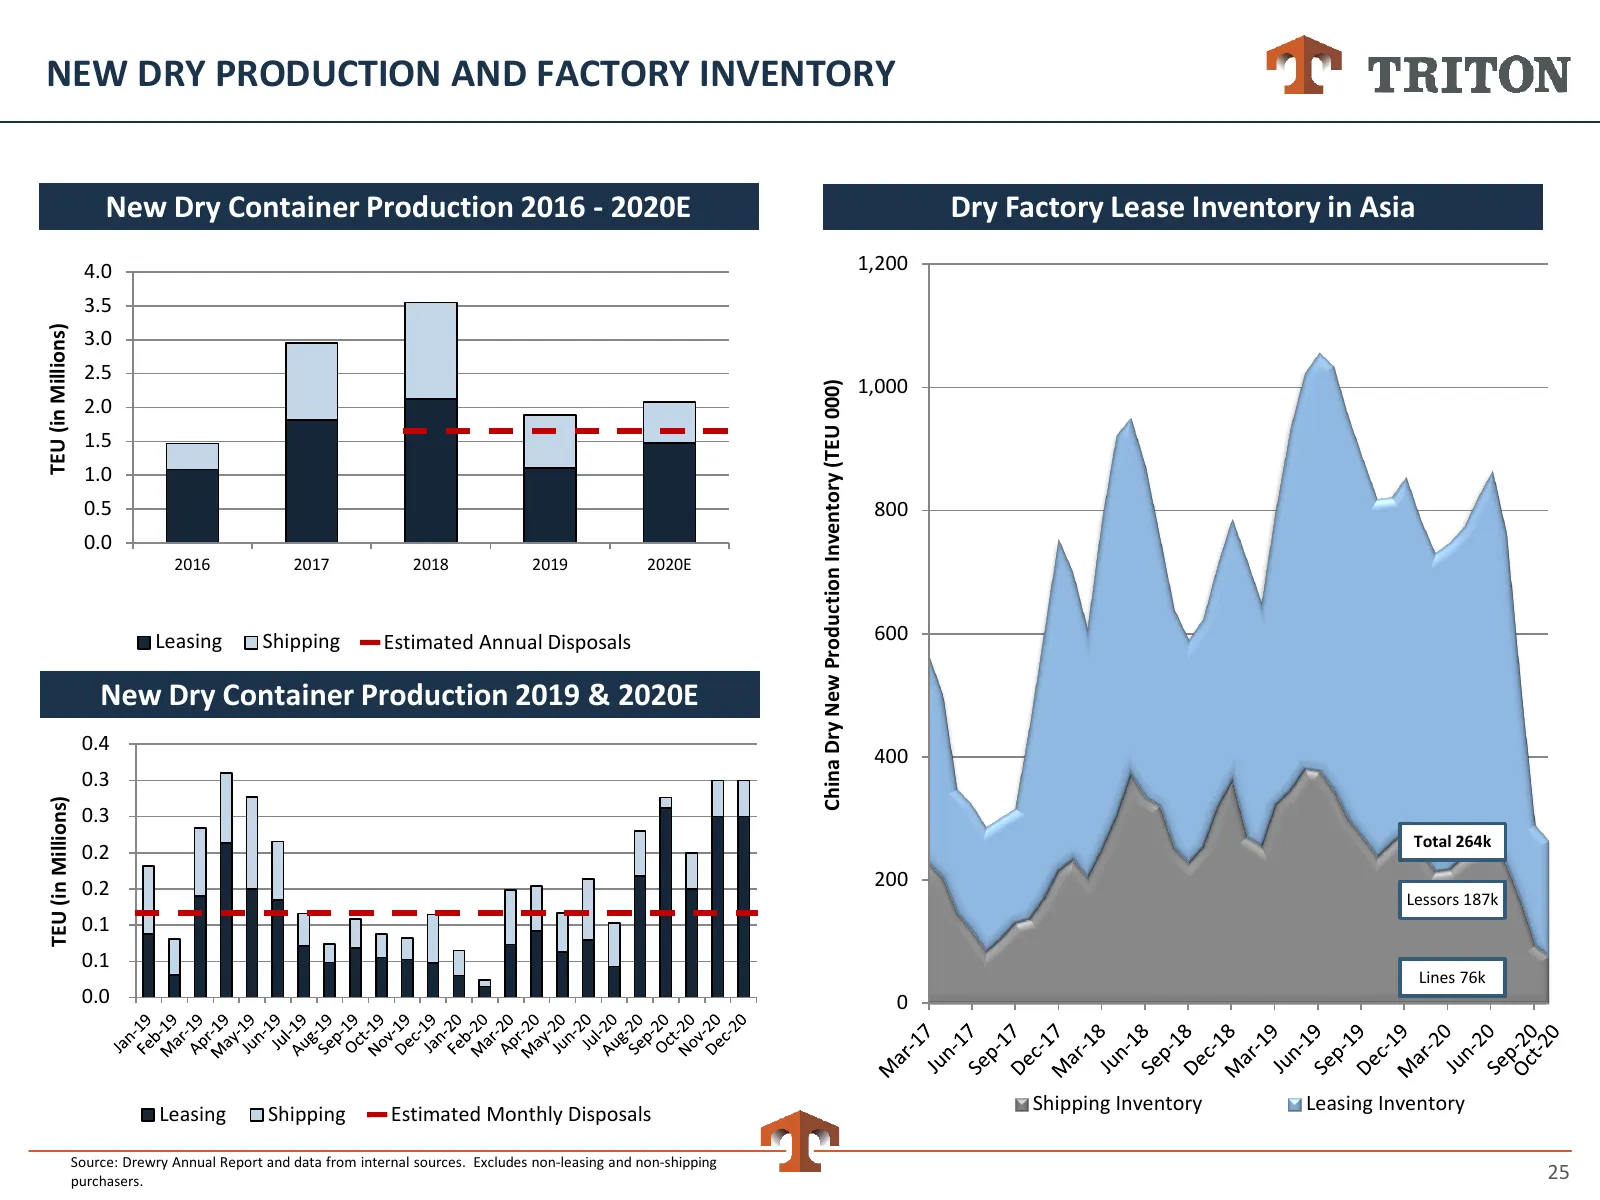
NEW DRY PRODUCTION AND FACTORY INVENTORY New Dry Container Production 2016 - 2020E Dry Factory Lease Inventory in Asia 4.0 1,200 3.5 3.0 TEU (in Millions) 2.5 1,000 China Dry New Production Inventory (TEU 000) 2.0 1.5 1.0 0.5 800 0.0 2016 2017 2018 2019 2020E Leasing Shipping Estimated Annual Dispos
Slide 26: Exceptionally Strong Lease Out Activity
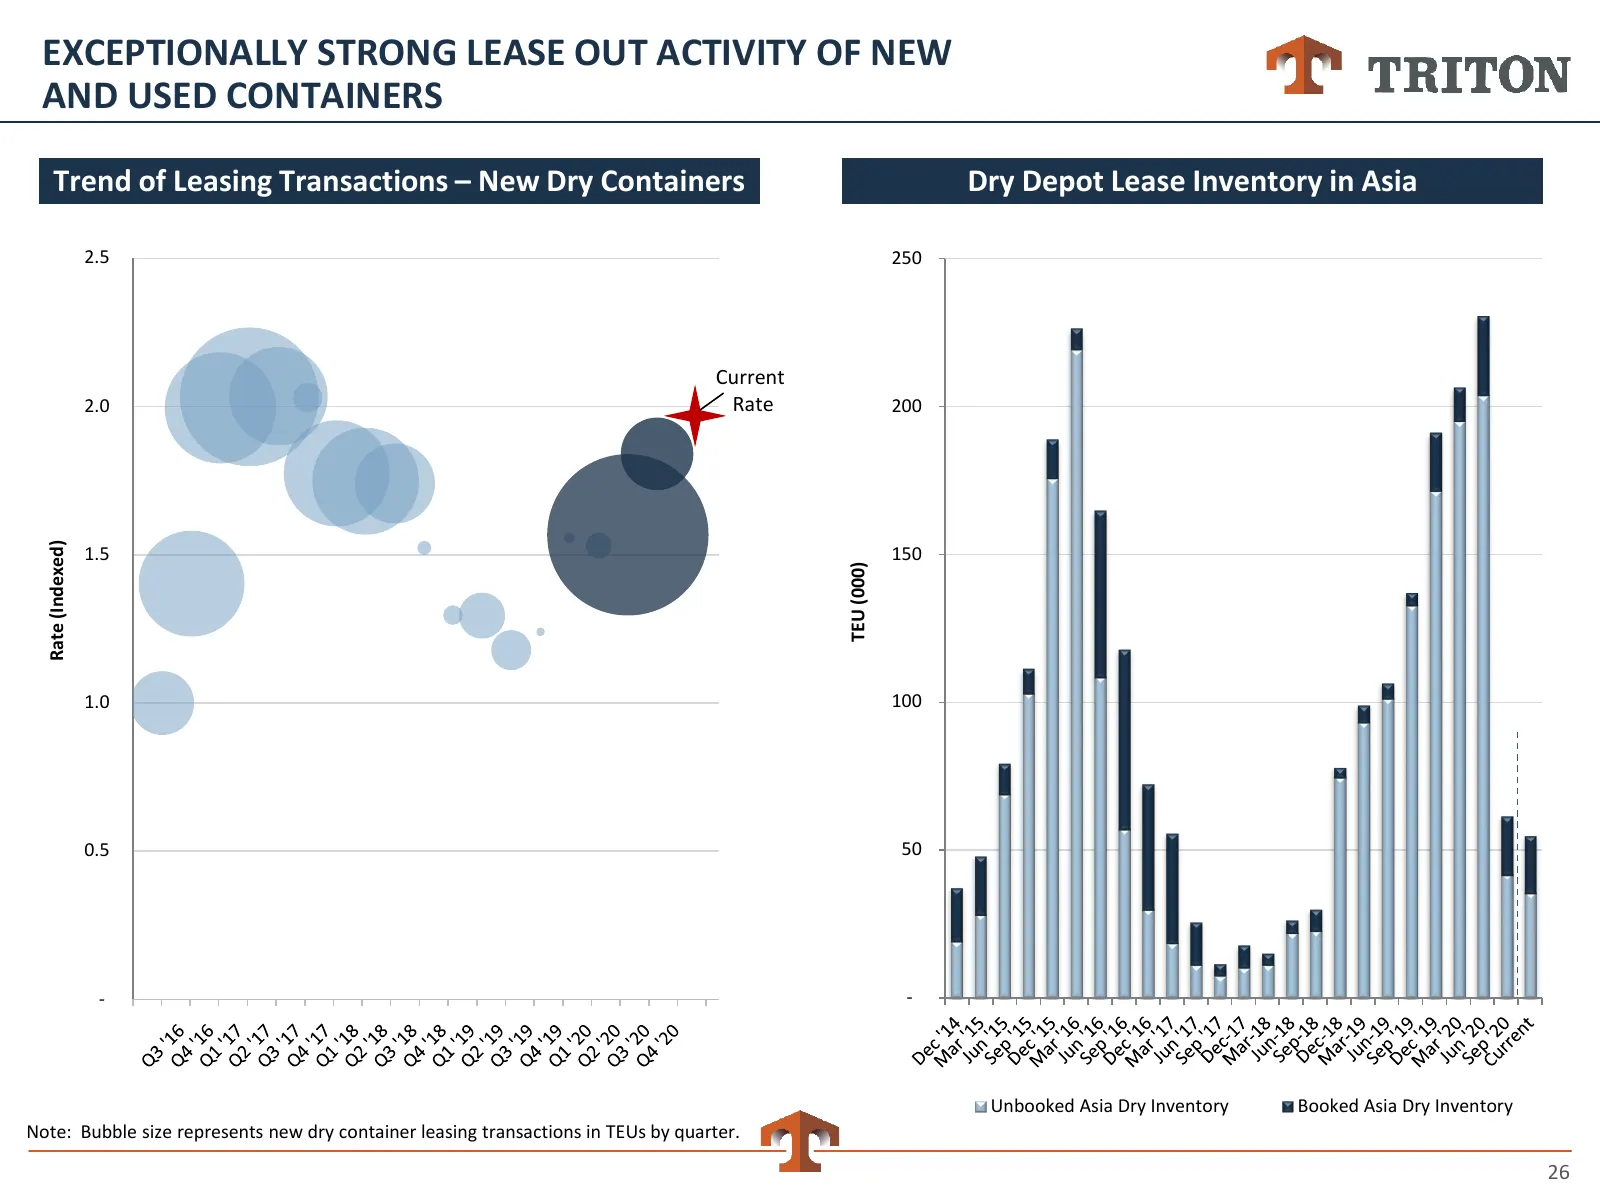
EXCEPTIONALLY STRONG LEASE OUT ACTIVITY OF NEW AND USED CONTAINERS Trend of Leasing Transactions – New Dry Containers Dry Depot Lease Inventory in Asia 2.5 250 Current 2.0 Rate 200 1.5 150 Rate (Indexed) TEU (000) 1.0 100 0.5 50 - - Unbooked Asia Dry Inventory Booked Asia Dry Inventory Note: Bubble
Slide 27: Attractive Returns on New Container Investments
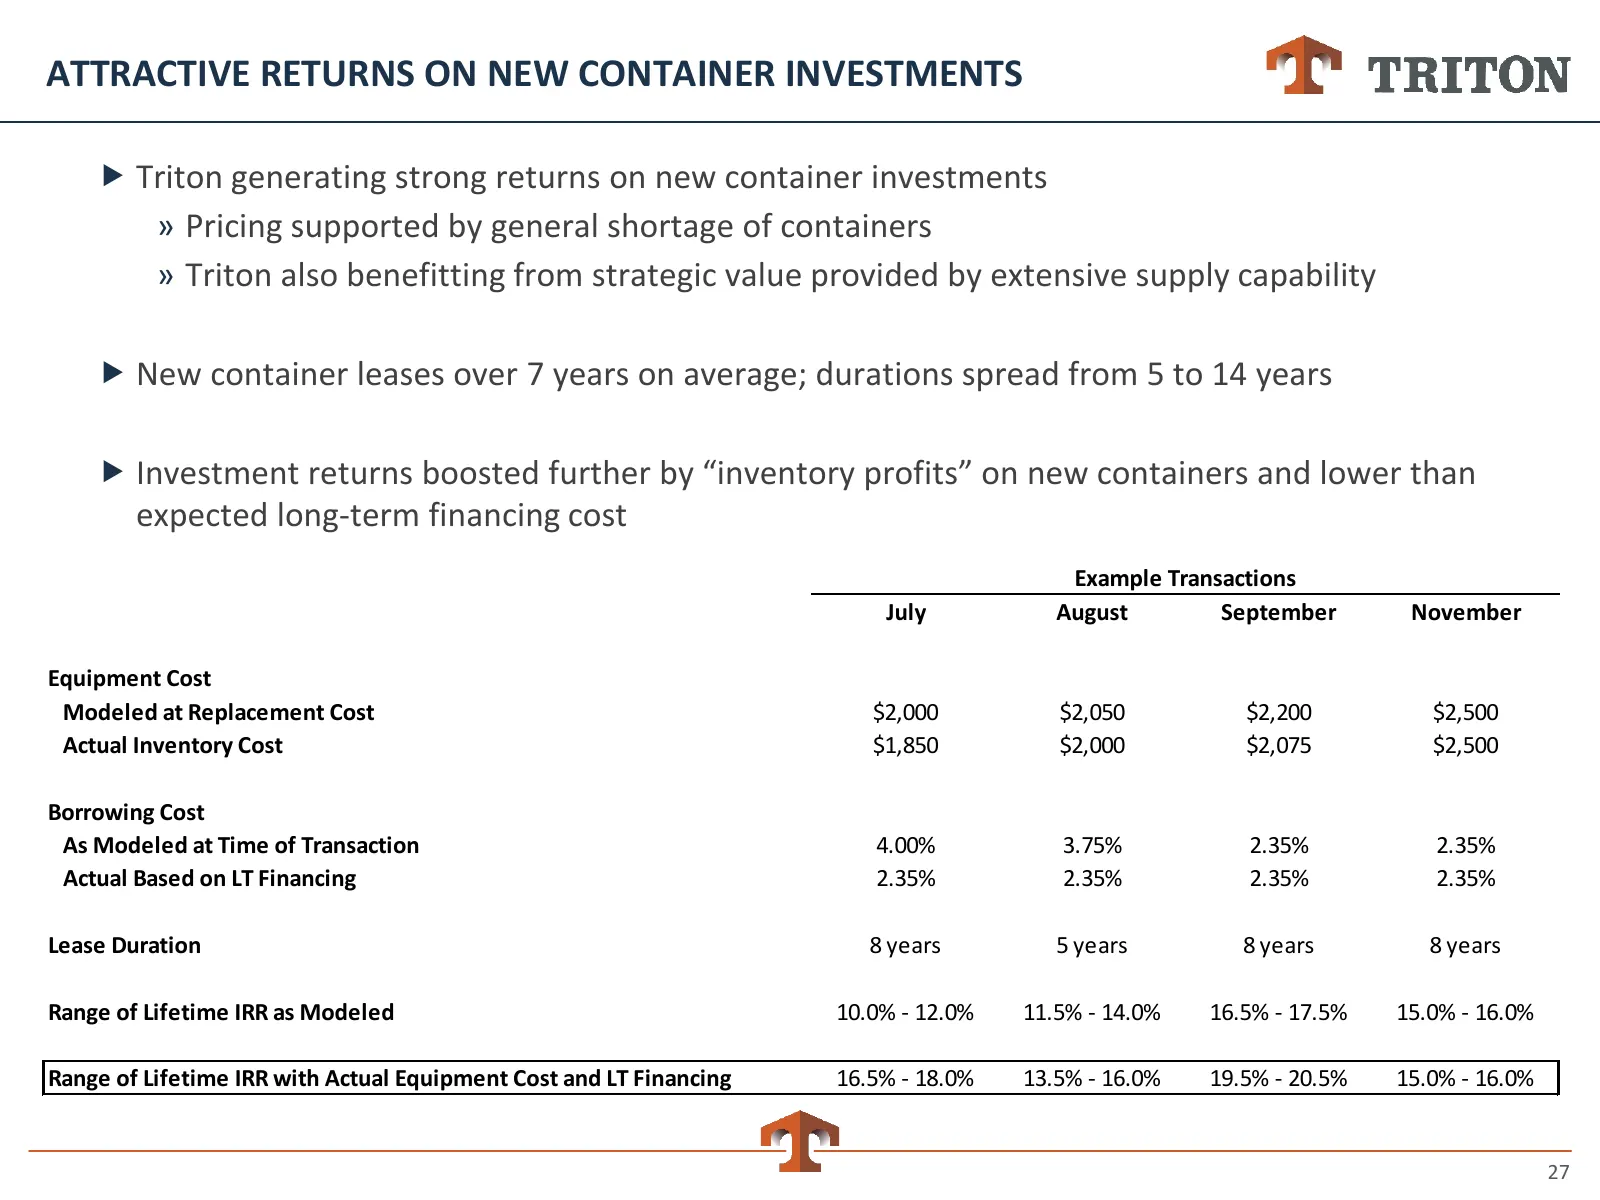
ATTRACTIVE RETURNS ON NEW CONTAINER INVESTMENTS Triton generating strong returns on new container investments » Pricing supported by general shortage of containers » Triton also benefitting from strategic value provided by extensive supply capability New container leases over 7 years on average;
Slide 28: Triton Concentrating Investment When Conditions Favorable
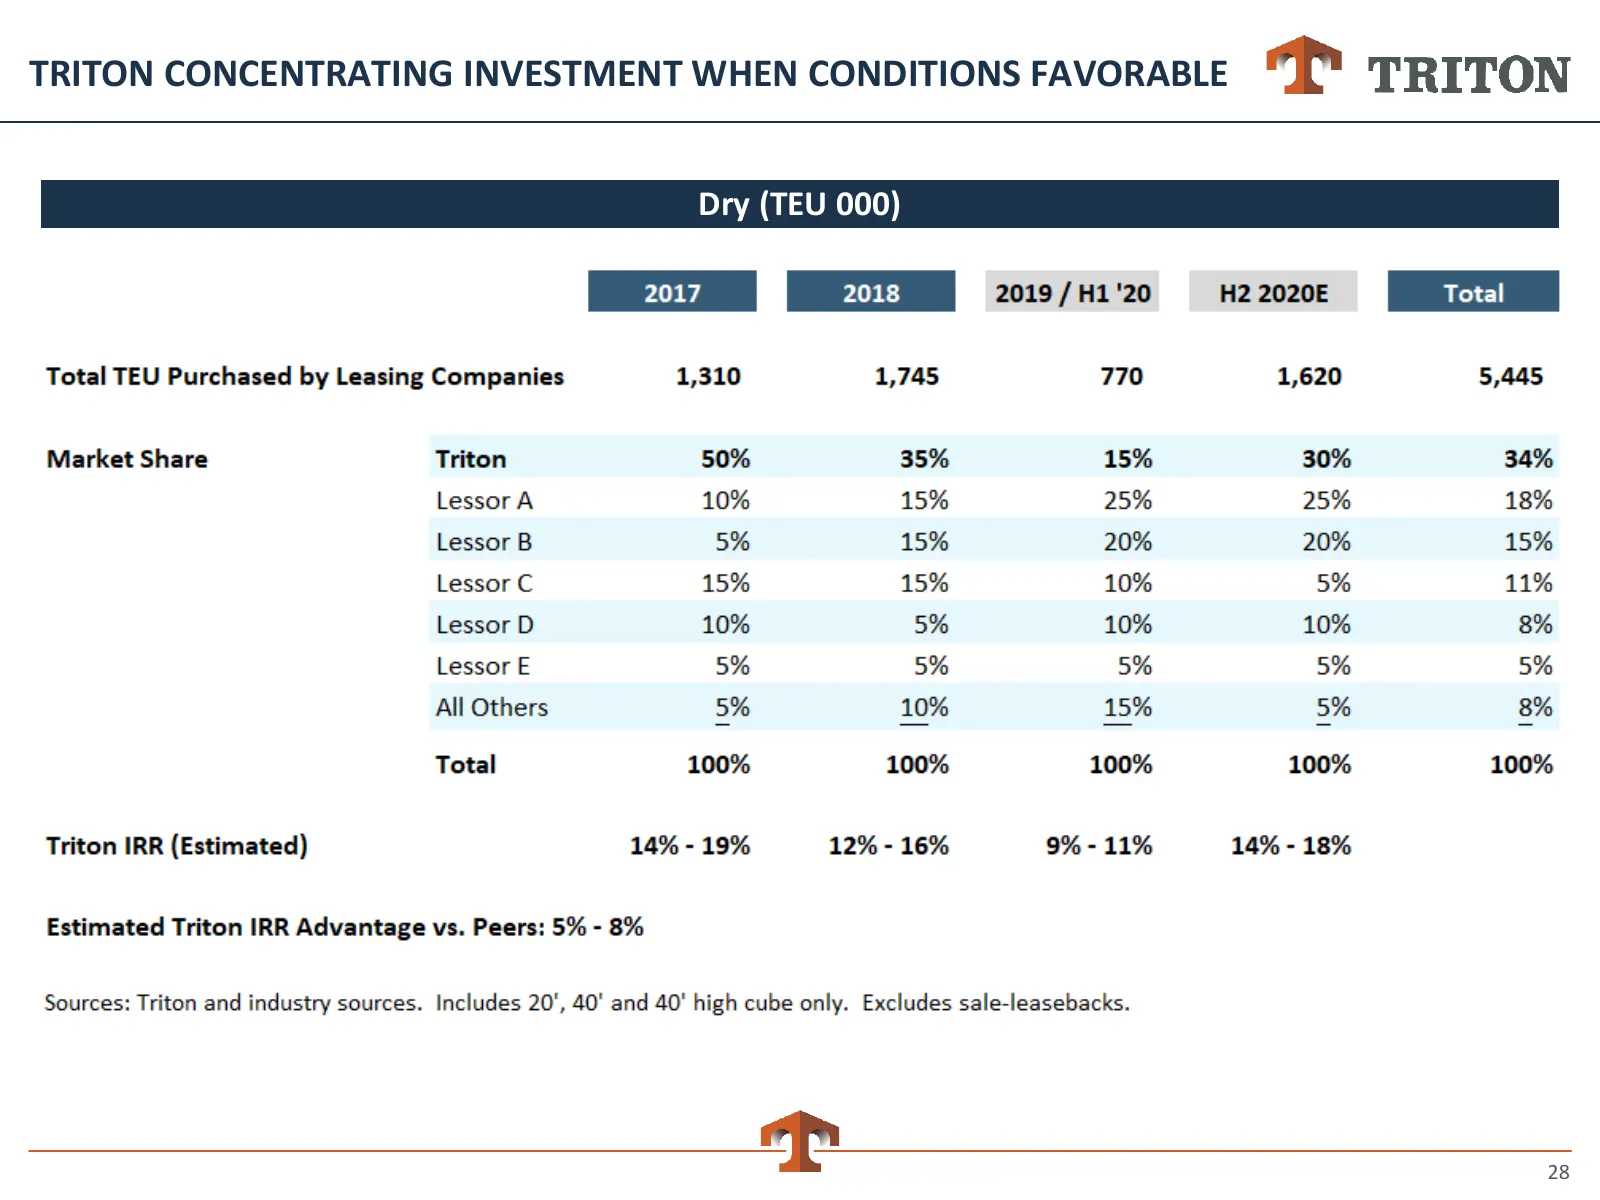
TRITON CONCENTRATING INVESTMENT WHEN CONDITIONS FAVORABLE Dry (TEU 000) 28
Slide 29: Long-Term Lease Portfolio Well Protected
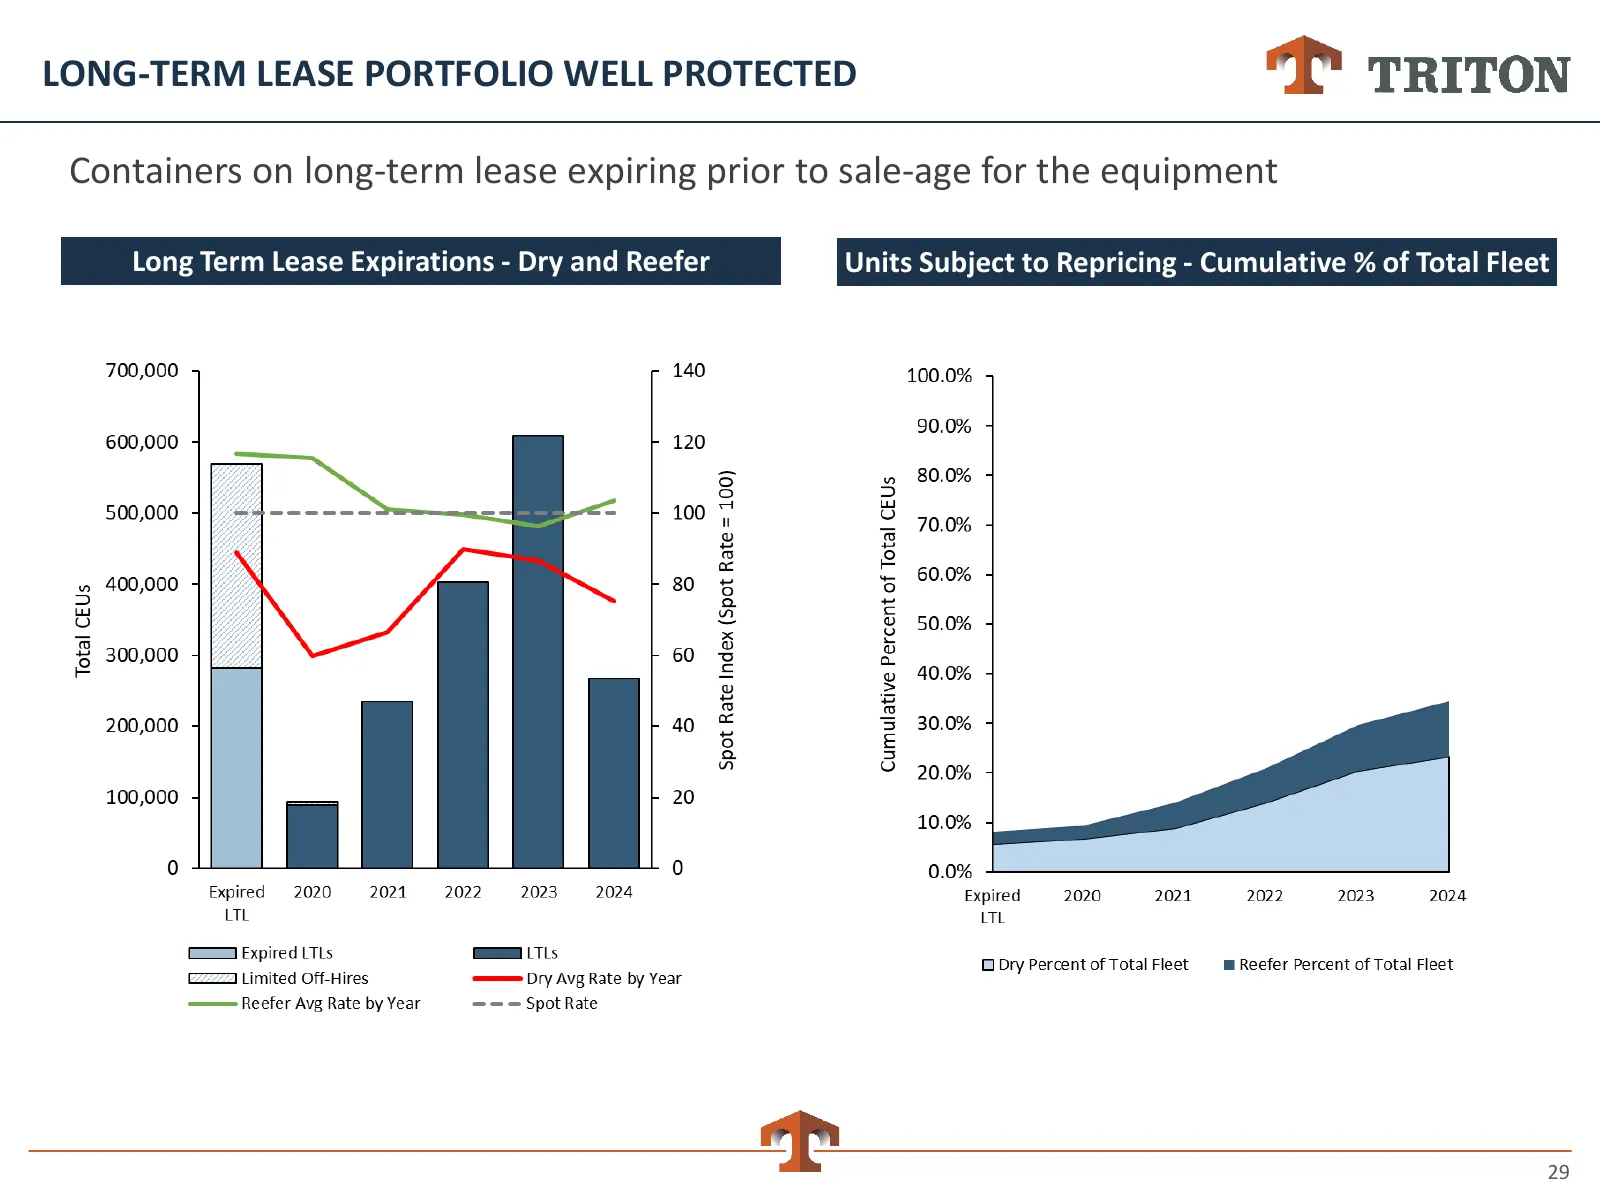
LONG-TERM LEASE PORTFOLIO WELL PROTECTED Containers on long-term lease expiring prior to sale-age for the equipment Long Term Lease Expirations - Dry and Reefer Units Subject to Repricing - Cumulative % of Total Fleet 29
Slide 30: Lease Re-Pricing Risk Well-Controlled
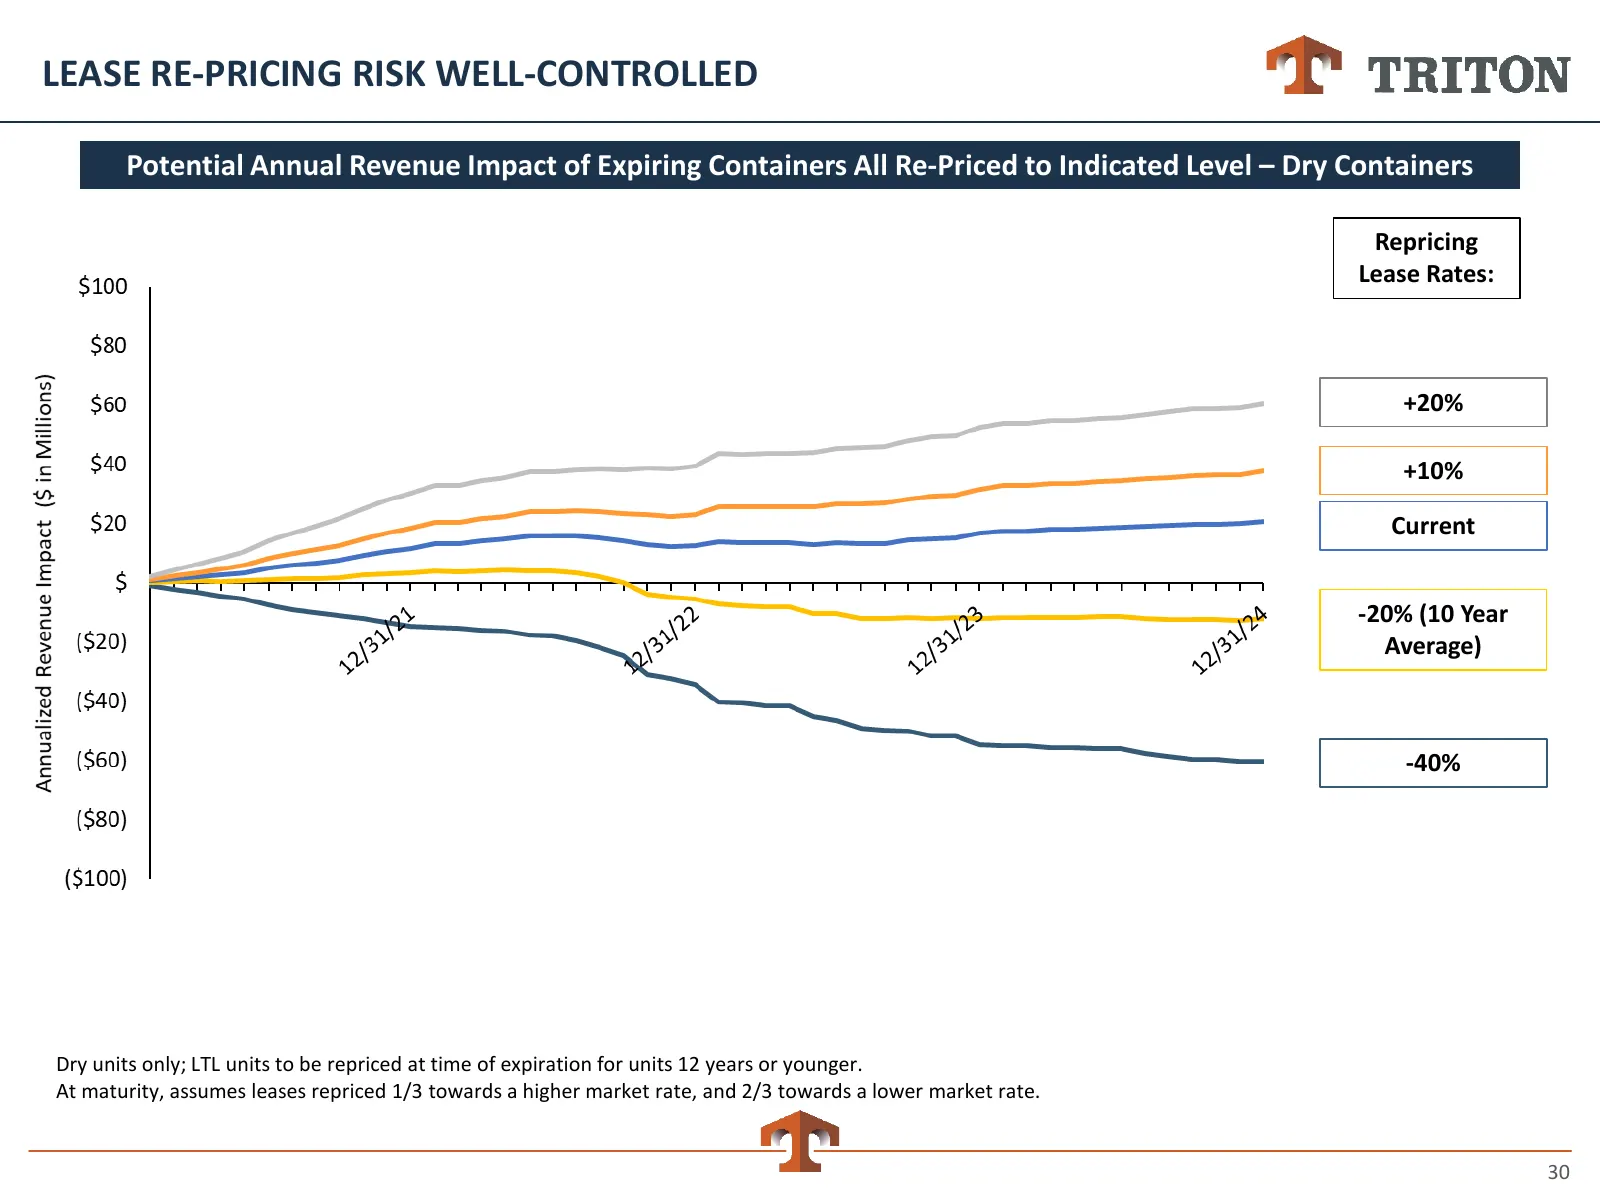
LEASE RE-PRICING RISK WELL-CONTROLLED Potential Annual Revenue Impact of Expiring Containers All Re-Priced to Indicated Level – Dry Containers Repricing Lease Rates: +20% +10% Current -20% (10 Year Average) -40% Dry units only; LTL units to be repriced at time of expiration for units 12 years or you
Slide 31: Customer Credit Improving – Shipping Line Consolidation
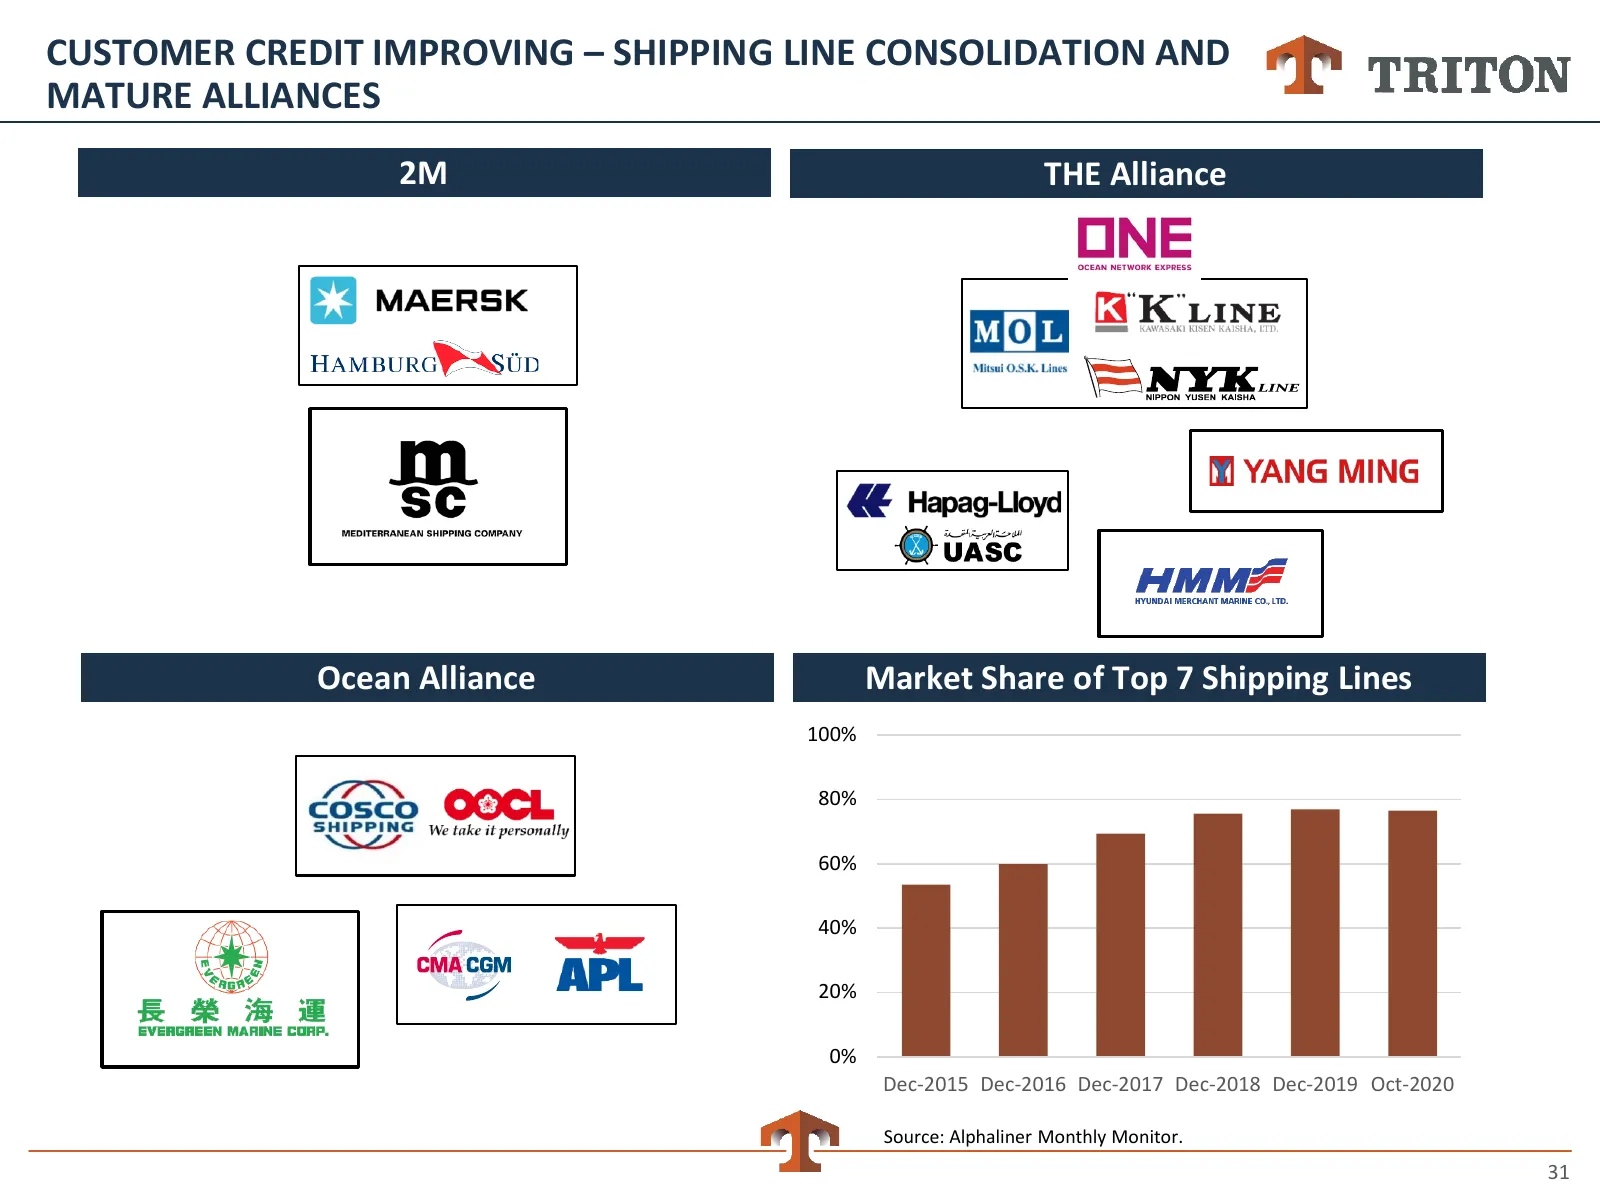
CUSTOMER CREDIT IMPROVING – SHIPPING LINE CONSOLIDATION AND MATURE ALLIANCES 2M THE Alliance Ocean Alliance Market Share of Top 7 Shipping Lines 100% 80% 60% 40% 20% 0% Dec-2015 Dec-2016 Dec-2017 Dec-2018 Dec-2019 Oct-2020 Source: Alphaliner Monthly Monitor. 31
Slide 32: Customer Credit Improving – High Freight Rates and Low Fuel Costs
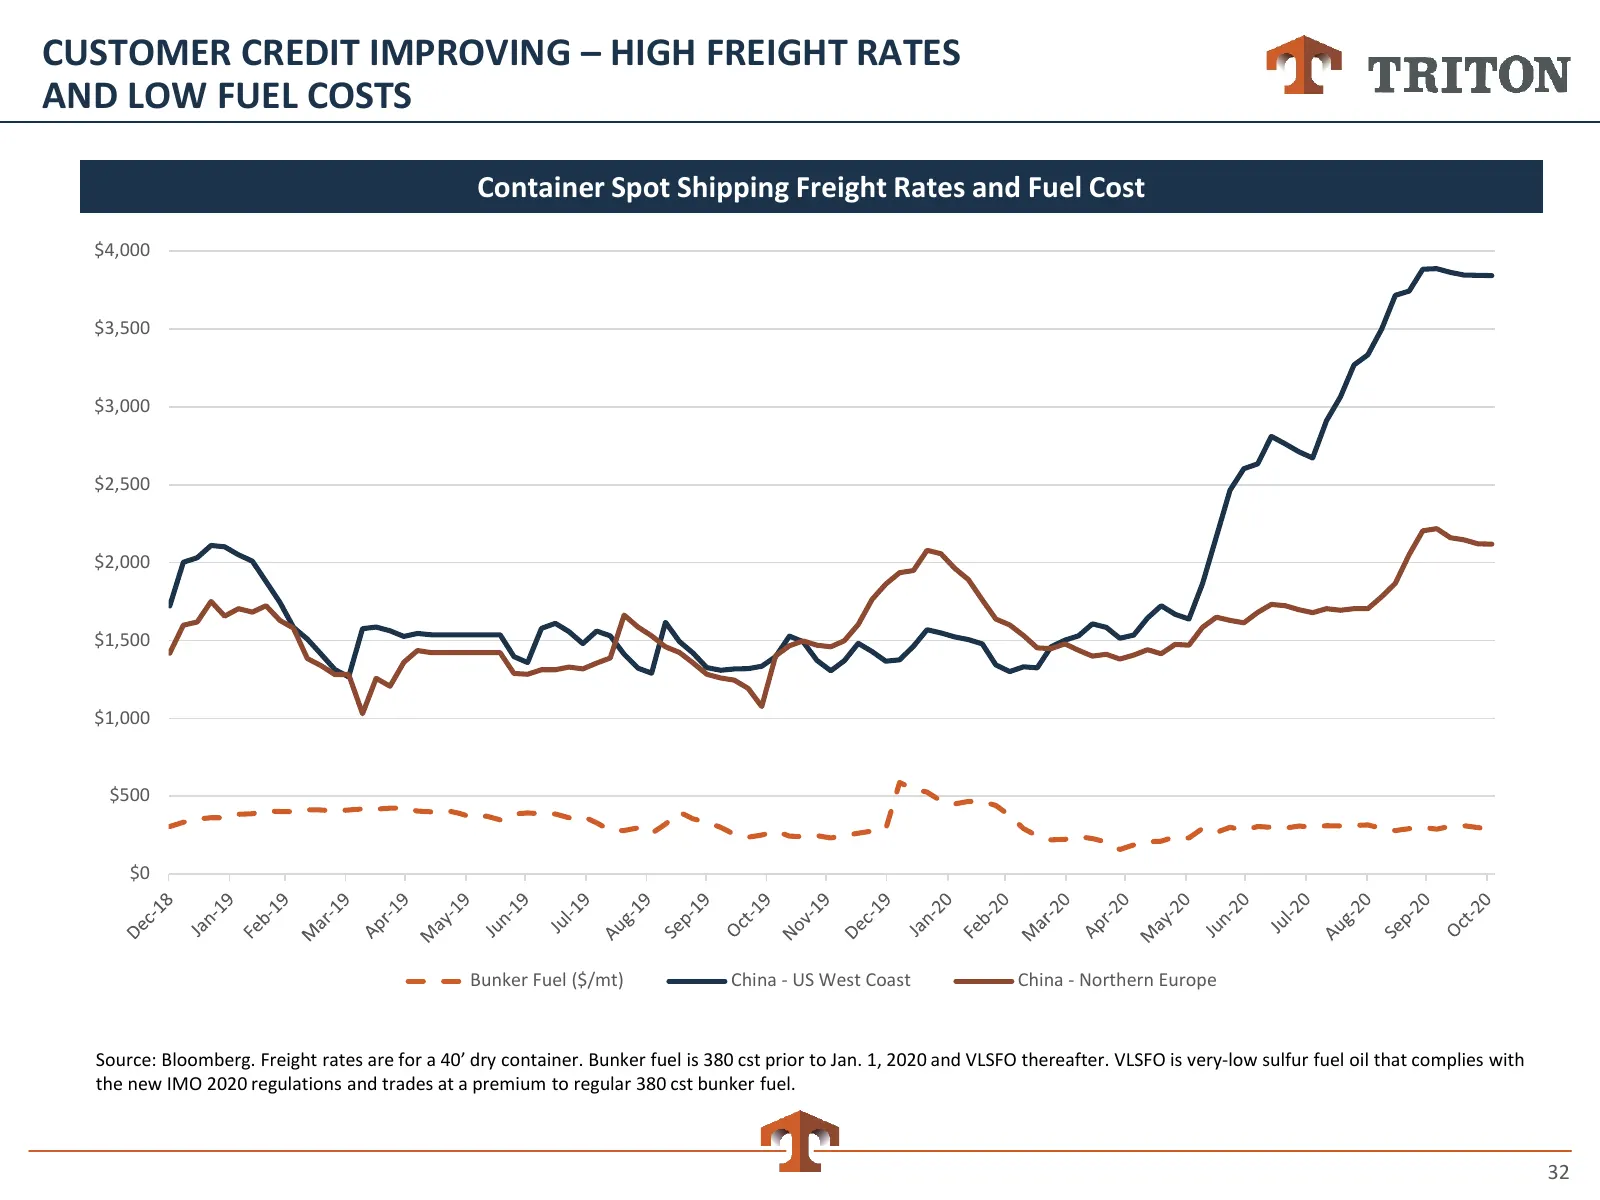
CUSTOMER CREDIT IMPROVING – HIGH FREIGHT RATES AND LOW FUEL COSTS Container Spot Shipping Freight Rates and Fuel Cost $4,000 $3,500 $3,000 $2,500 $2,000 $1,500 $1,000 $500 $0 Bunker Fuel ($/mt) China - US West Coast China - Northern Europe Source: Bloomberg. Freight rates are for a 40’ dry container
Slide 33: Triton Container Sales
TRITON CONTAINER SALES Market leading sale capability drives superior disposal gains, boosts lifecycle returns and brings additional sources of profitability and growth » Selling older containers at premium prices relative to market » Supports longer lease life and superior investment returns » St
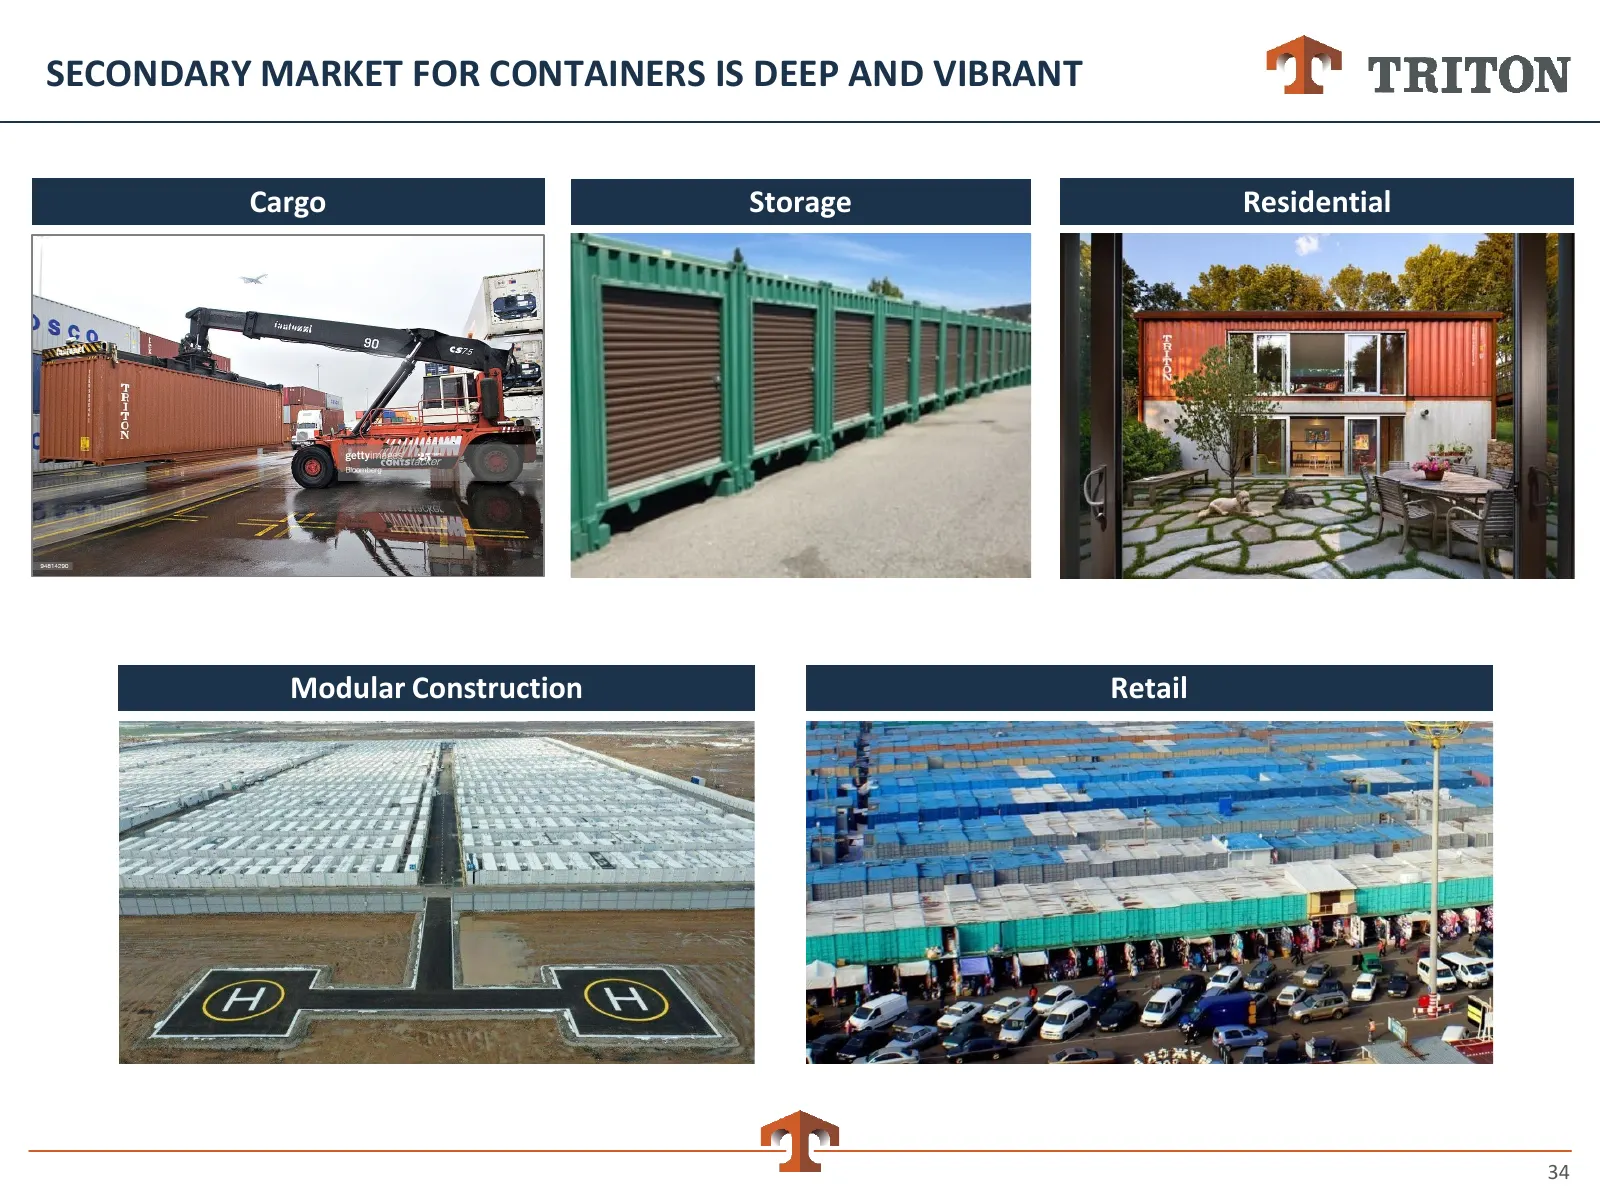
Slide 34: Secondary Market for Containers Is Deep and Vibrant
SECONDARY MARKET FOR CONTAINERS IS DEEP AND VIBRANT Cargo Storage Residential Modular Construction Retail 34
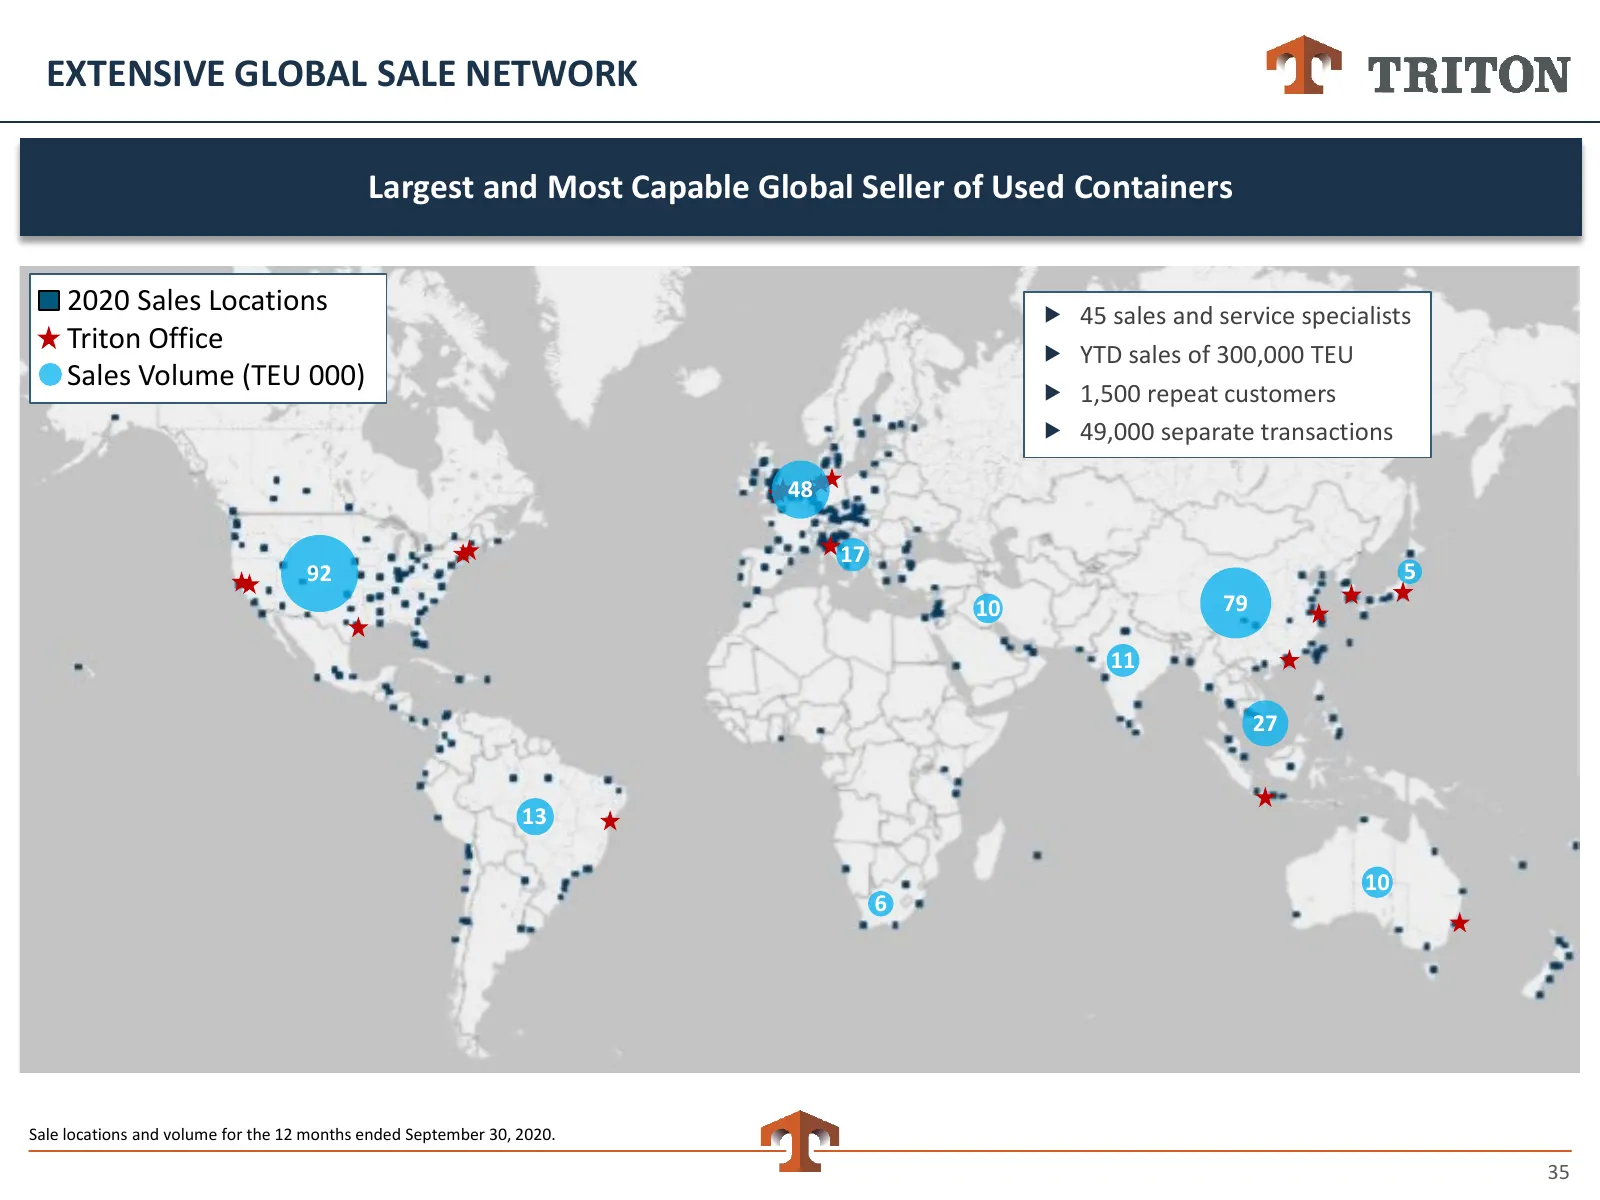
Slide 35: Extensive Global Sale Network
EXTENSIVE GLOBAL SALE NETWORK Largest and Most Capable Global Seller of Used Containers 2020 Sales Locations 45 sales and service specialists Triton Office YTD sales of 300,000 TEU Sales Volume (TEU 000) 1,500 repeat customers 49,000 separate transactions 48 17 92 5 10 79 11 27 13 10 6 Sale
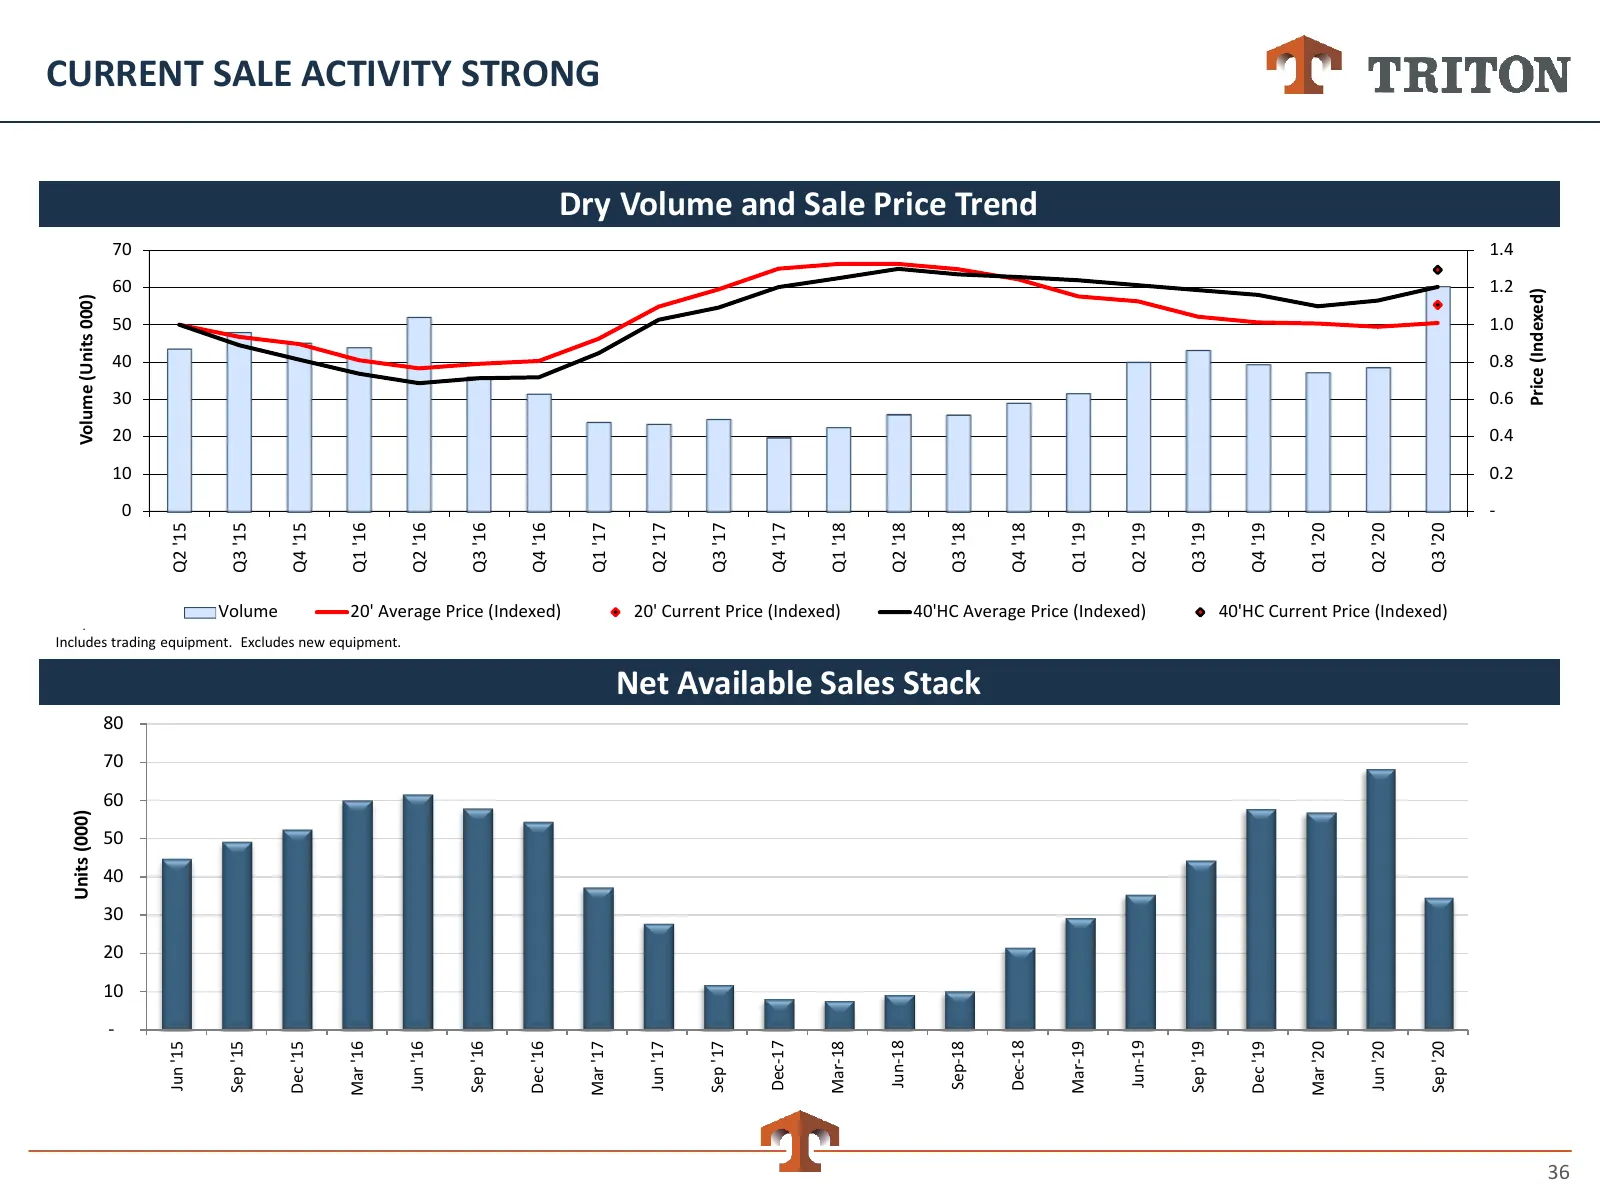
Slide 36: Current Sale Activity Strong
. Units (000) Volume (Units 000) - 10 20 30 40 50 60 70 80 0 10 20 30 40 50 60 70 Jun '15 Q2 '15 Sep '15 Q3 '15 Volume Dec '15 Q4 '15 Mar '16 Q1 '16 Includes trading equipment. Excludes new equipment. Jun '16 Q2 '16 Sep '16 Q3 '16 Dec '16 Q4 '16 20' Average Price (Indexed) CURRENT SALE ACTIVITY STRO
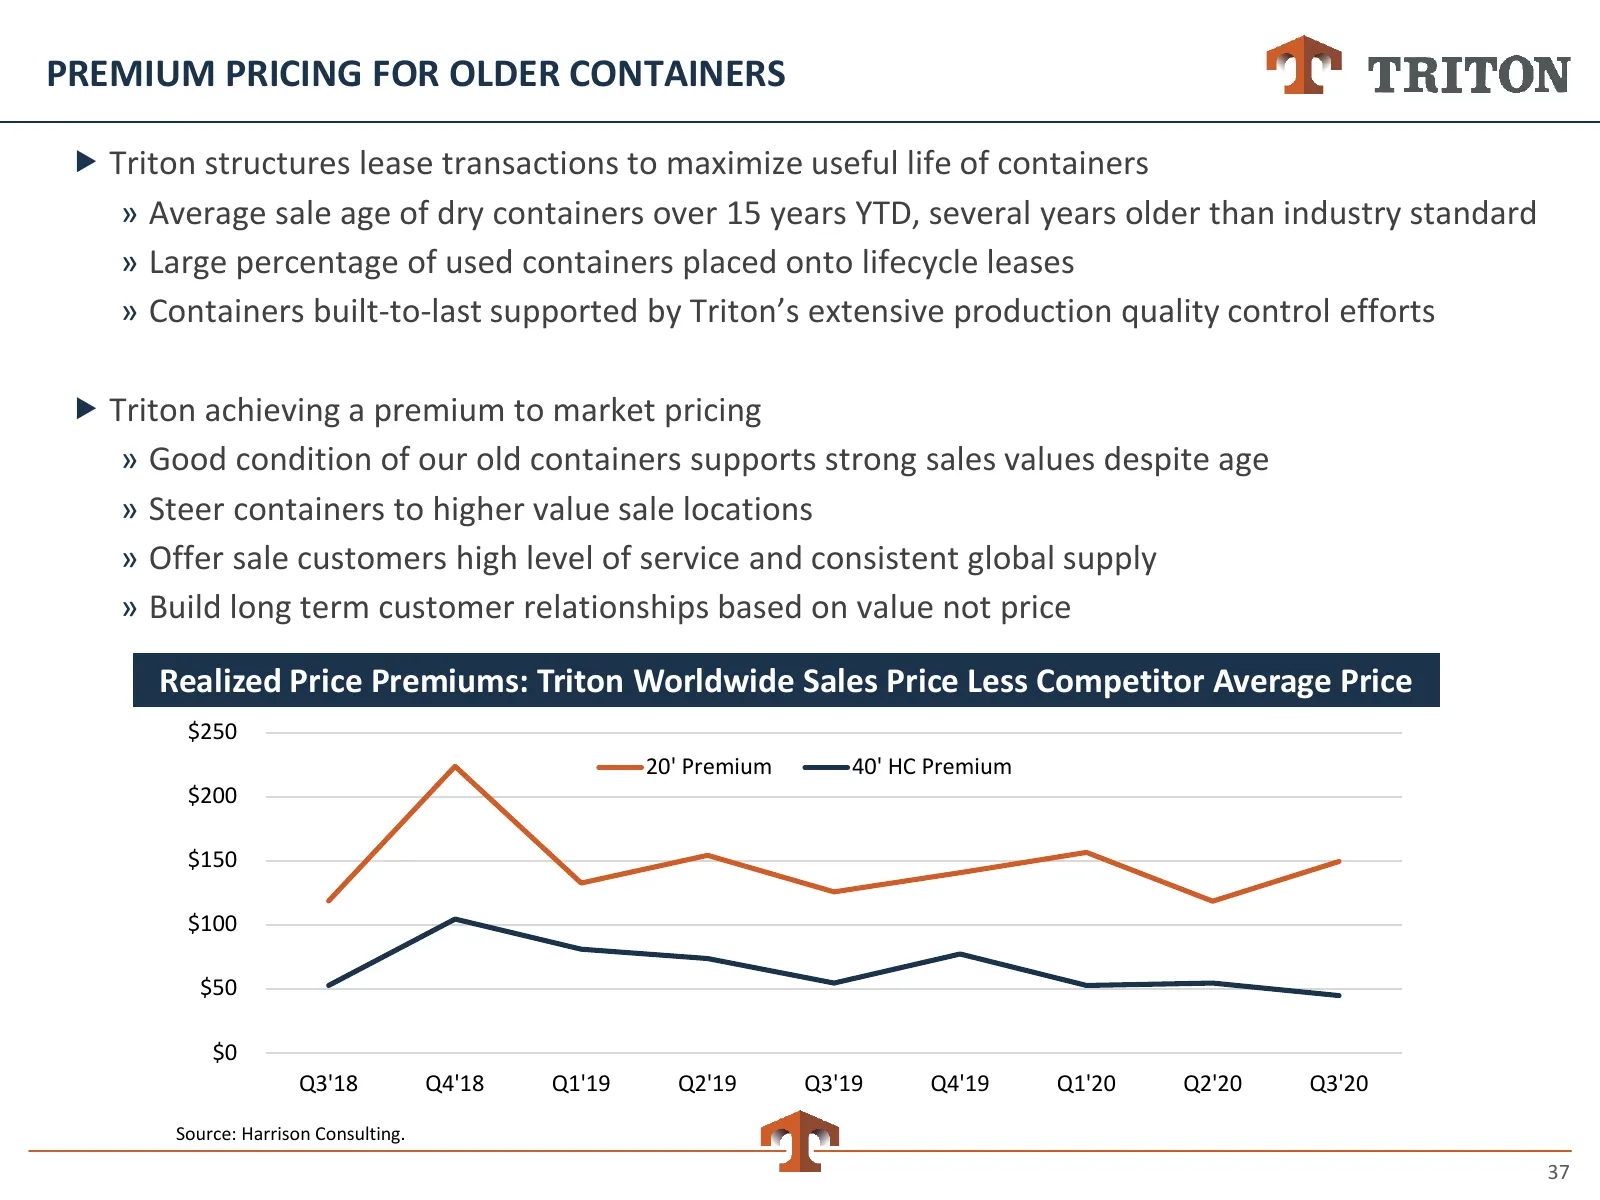
Slide 37: Premium Pricing for Older Containers
PREMIUM PRICING FOR OLDER CONTAINERS Triton structures lease transactions to maximize useful life of containers » Average sale age of dry containers over 15 years YTD, several years older than industry standard » Large percentage of used containers placed onto lifecycle leases » Containers built-t
Slide 38: Container Sale Capabilities Provide Additional Sources of Profitability
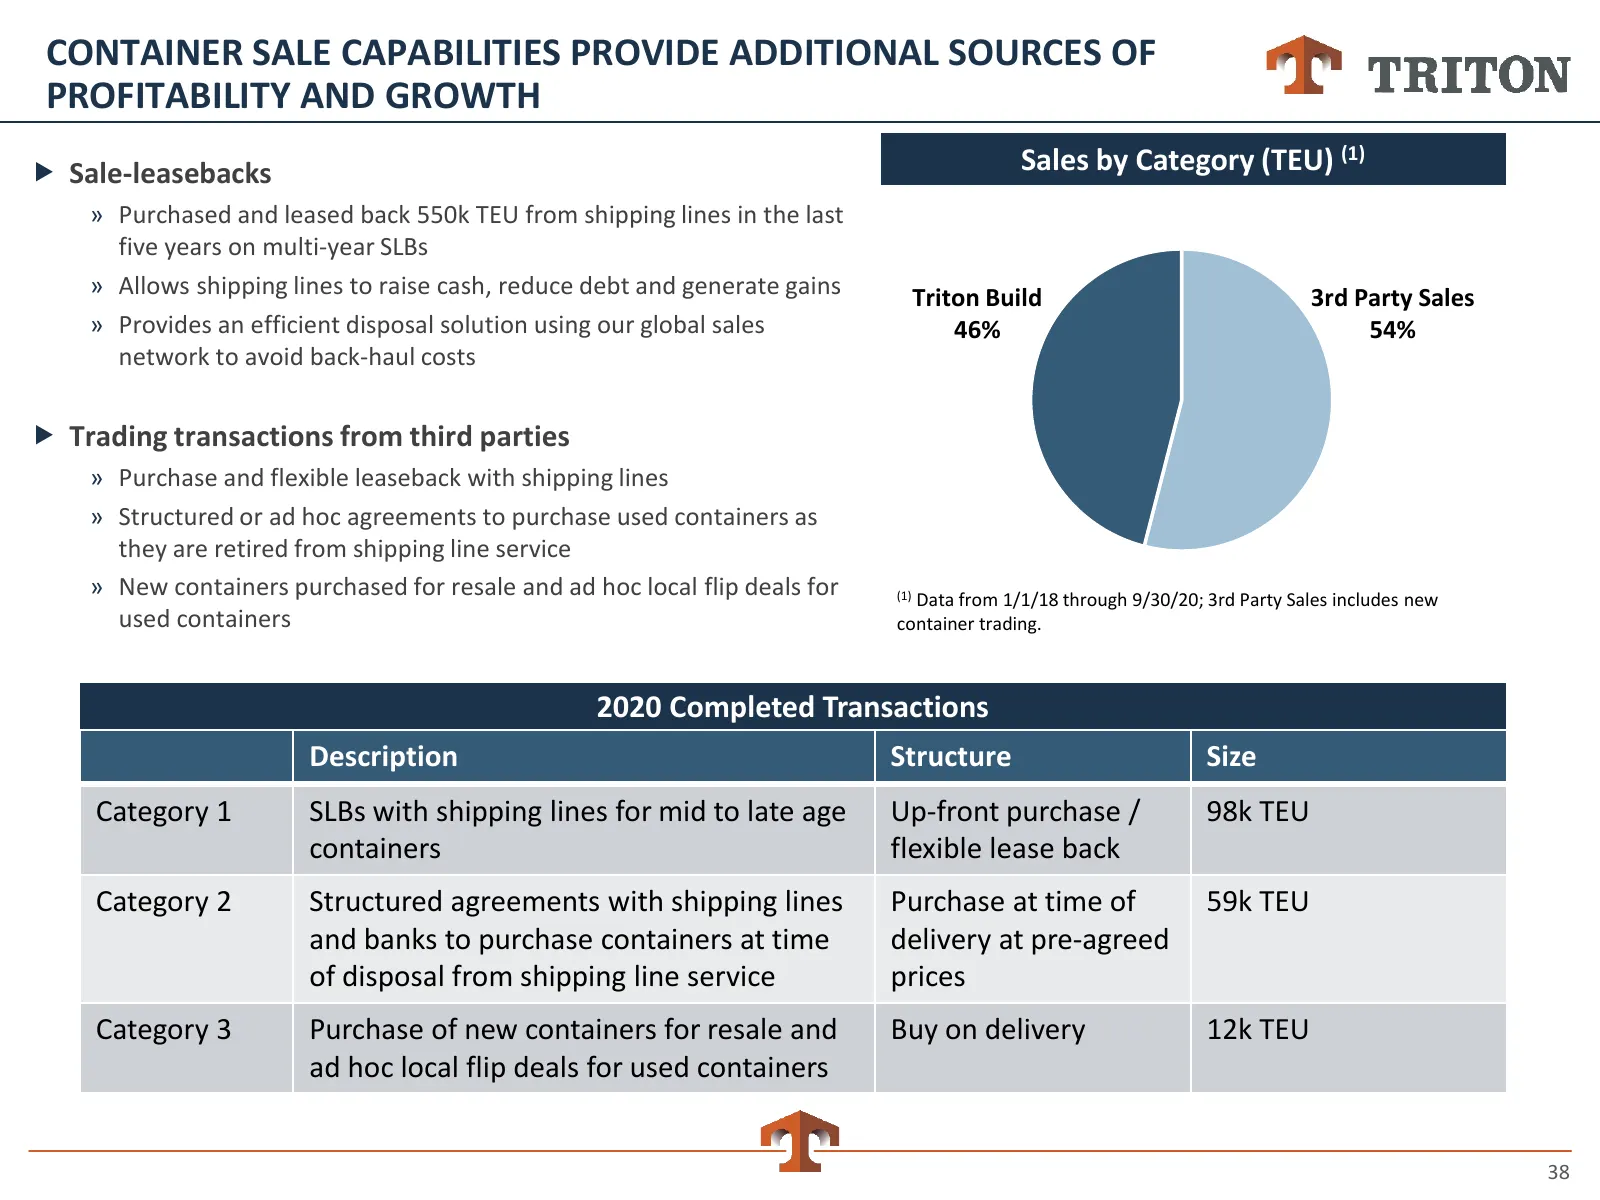
CONTAINER SALE CAPABILITIES PROVIDE ADDITIONAL SOURCES OF PROFITABILITY AND GROWTH Sale-leasebacks Sales by Category (TEU) (1) » Purchased and leased back 550k TEU from shipping lines in the last five years on multi-year SLBs » Allows shipping lines to raise cash, reduce debt and generate gains Tr
Slide 39: Container Leasing Fundamentals and Advantages of Market Leadership
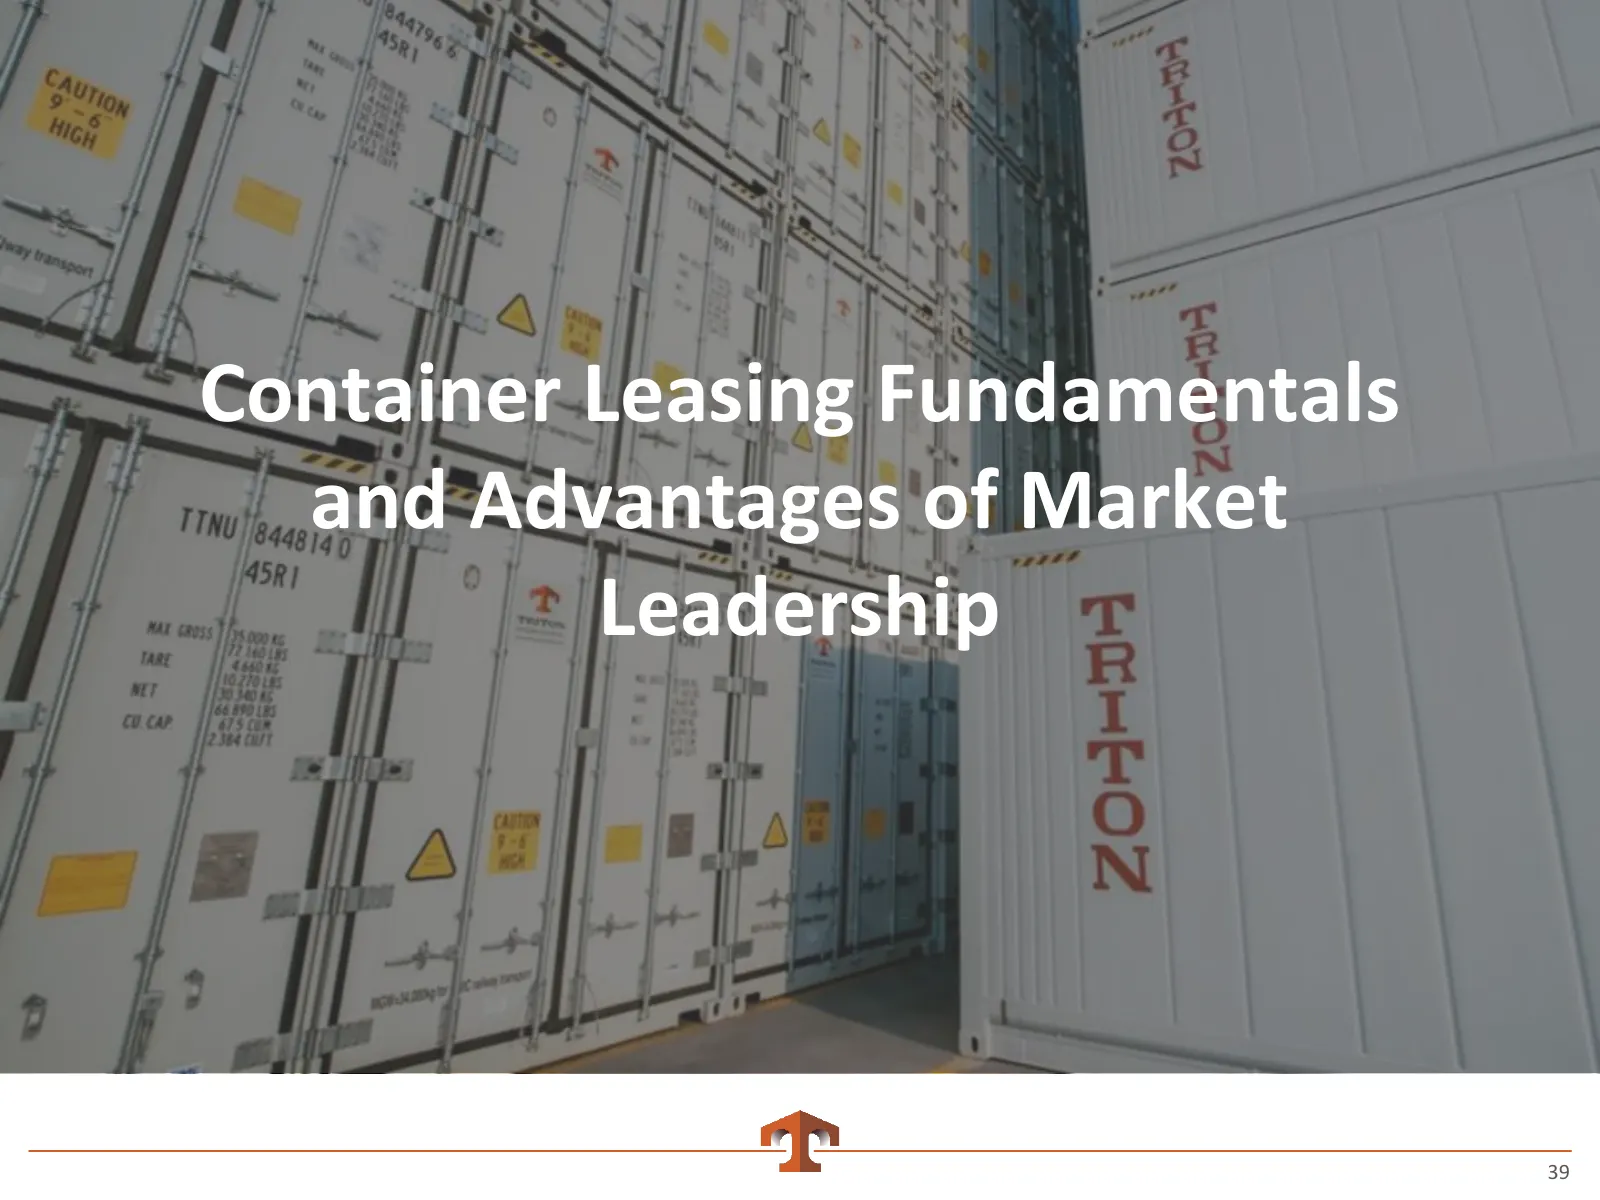
Container Leasing Fundamentals and Advantages of Market Leadership 39
Slide 40: Attractive Industry Fundamentals
ATTRACTIVE INDUSTRY FUNDAMENTALS Triton’s strong long-term financial performance supported by attractive industry fundamentals and Triton’s leadership advantages Attractive fundamentals: » Long-term growth rate boosted by multiple drivers » Short-order cycle for containers + long-term lease cont
Slide 41: Multiple Growth Drivers Support Long-Term Value Creation
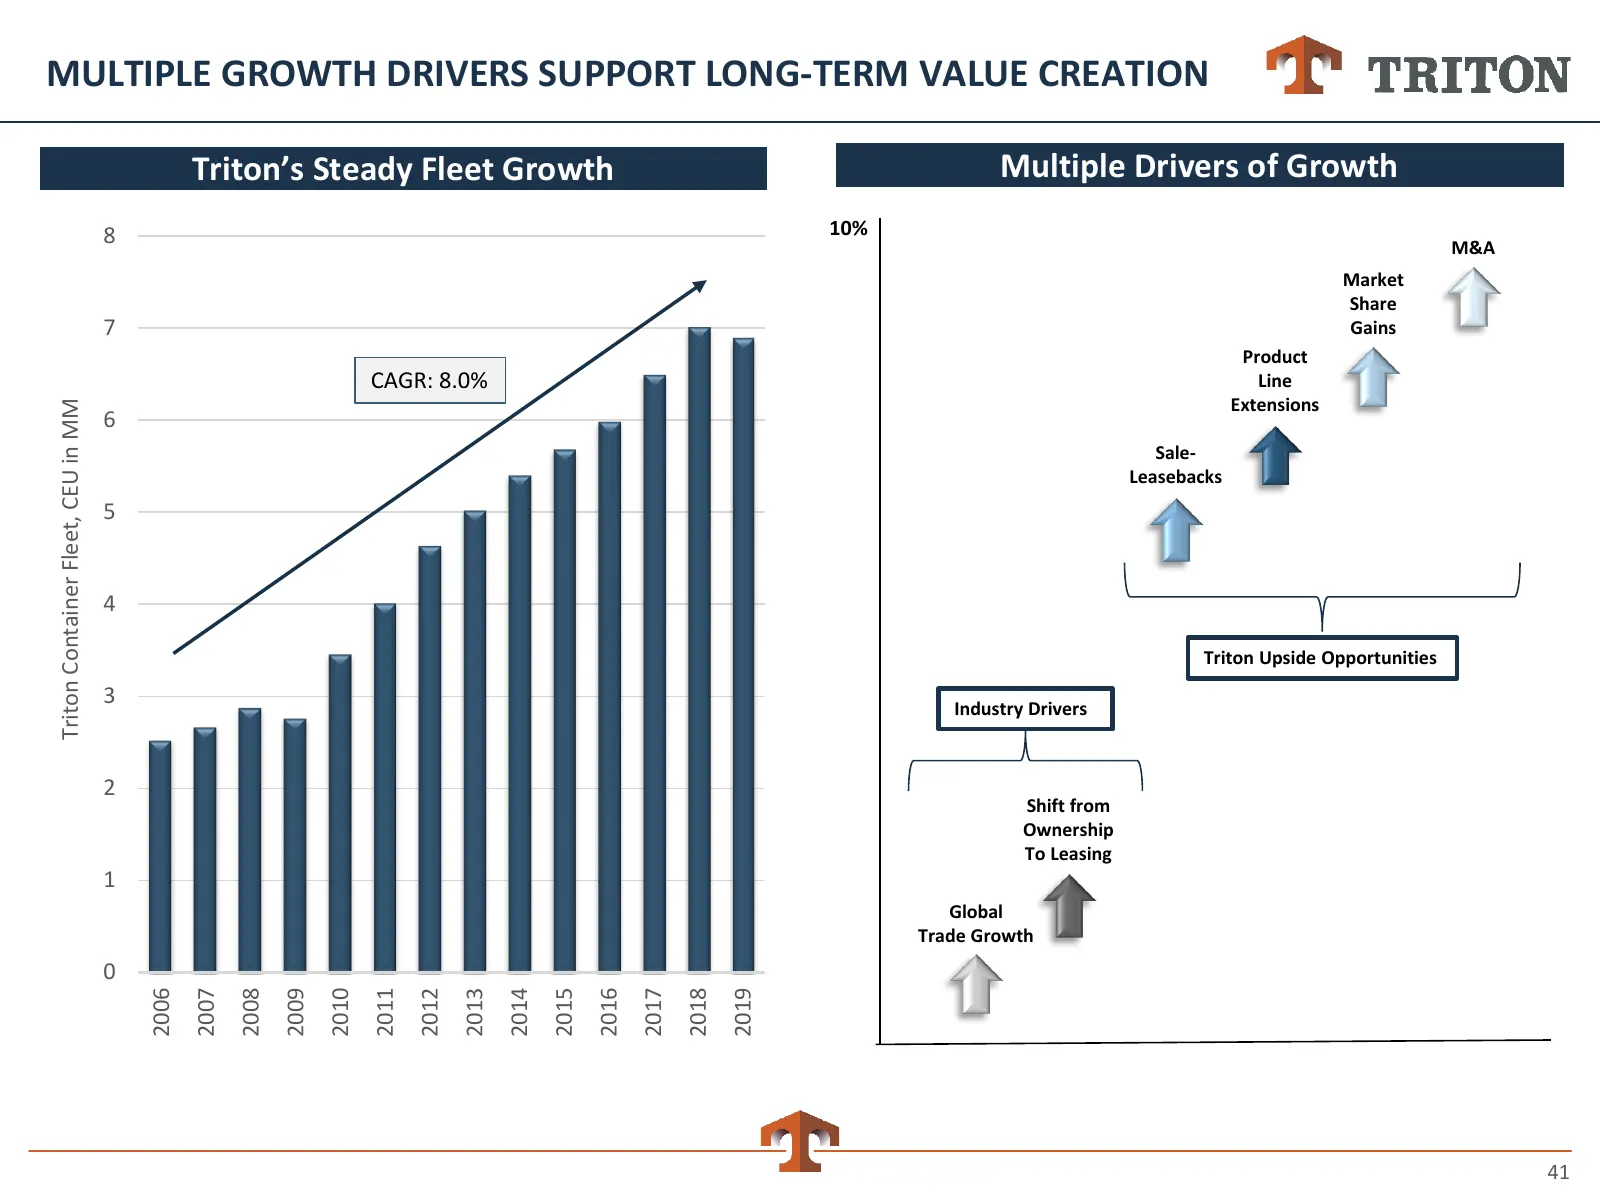
MULTIPLE GROWTH DRIVERS SUPPORT LONG-TERM VALUE CREATION Triton’s Steady Fleet Growth Multiple Drivers of Growth 8 10% M&A Market Share 7 Gains Product CAGR: 8.0% Line Extensions Triton Container Fleet, CEU in MM 6 Sale- Leasebacks 5 4 Triton Upside Opportunities 3 Industry Drivers 2 Shift from Owne
Slide 42: Short Order Cycle Plus Long Lease Duration Protect Results
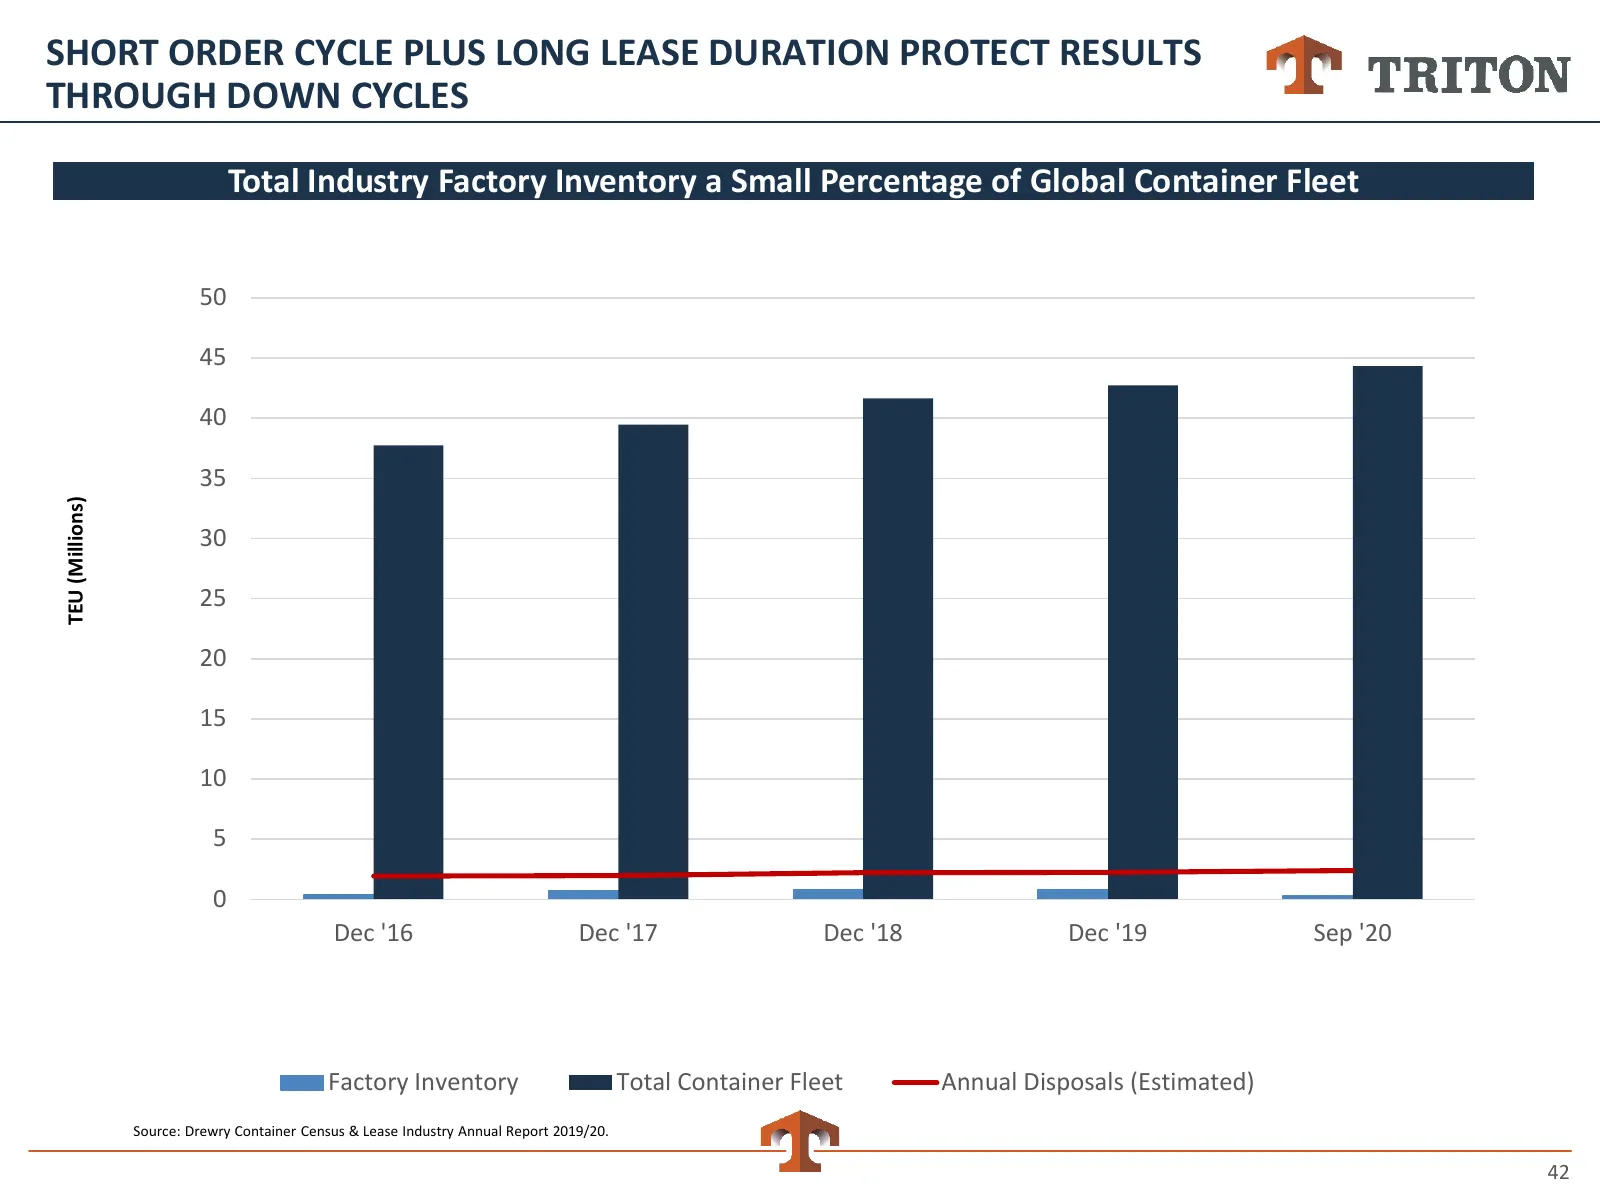
SHORT ORDER CYCLE PLUS LONG LEASE DURATION PROTECT RESULTS THROUGH DOWN CYCLES Total Industry Factory Inventory a Small Percentage of Global Container Fleet 50 45 40 35 TEU (Millions) 30 25 20 15 10 5 0 Dec '16 Dec '17 Dec '18 Dec '19 Sep '20 Factory Inventory Total Container Fleet Annual Disposals
Slide 43: Containers Maintain Utility and Preserve Value as They Age
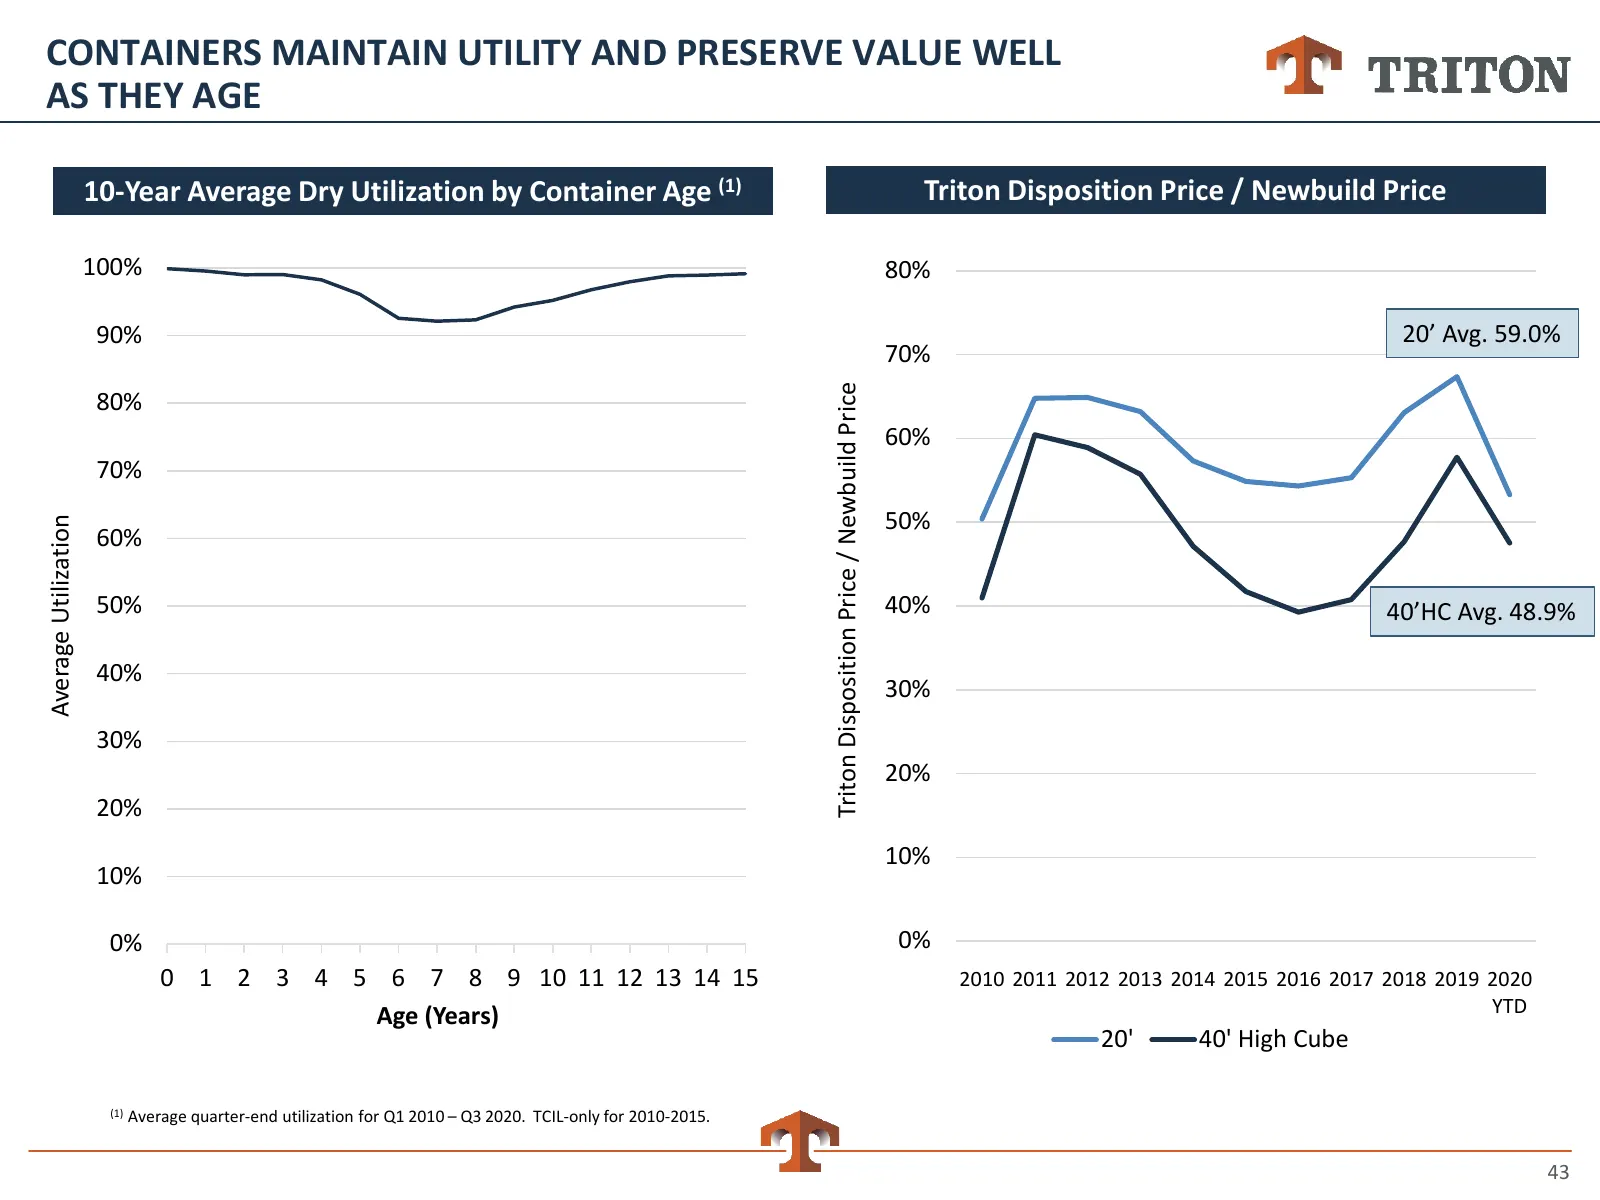
CONTAINERS MAINTAIN UTILITY AND PRESERVE VALUE WELL AS THEY AGE 10-Year Average Dry Utilization by Container Age (1) Triton Disposition Price / Newbuild Price 100% 80% 90% 20’ Avg. 59.0% 70% Triton Disposition Price / Newbuild Price 80% 60% 70% 50% Average Utilization 60% 50% 40% 40’HC Avg. 48.9% 40
Slide 44: Limited Threat from New Entrants
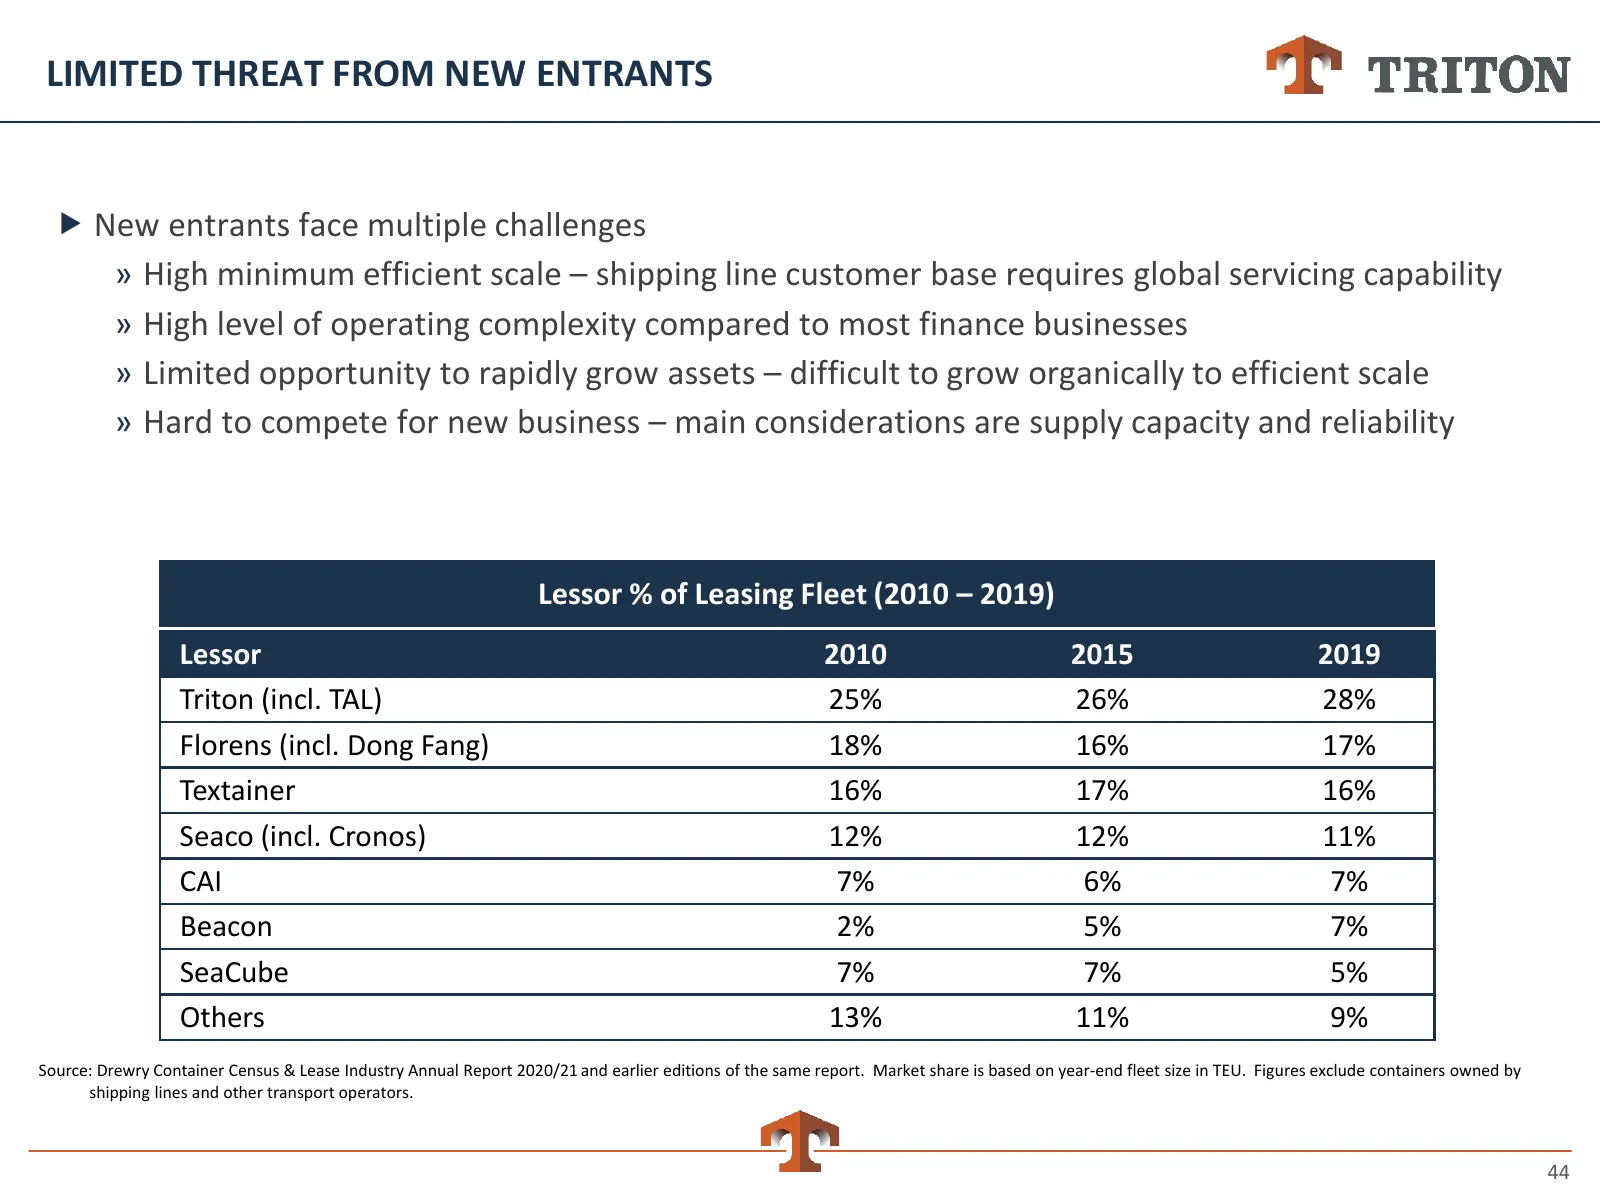
LIMITED THREAT FROM NEW ENTRANTS New entrants face multiple challenges » High minimum efficient scale – shipping line customer base requires global servicing capability » High level of operating complexity compared to most finance businesses » Limited opportunity to rapidly grow assets – difficult
Slide 45: Triton Enjoys Significant Advantages Through the Container Lifecycle
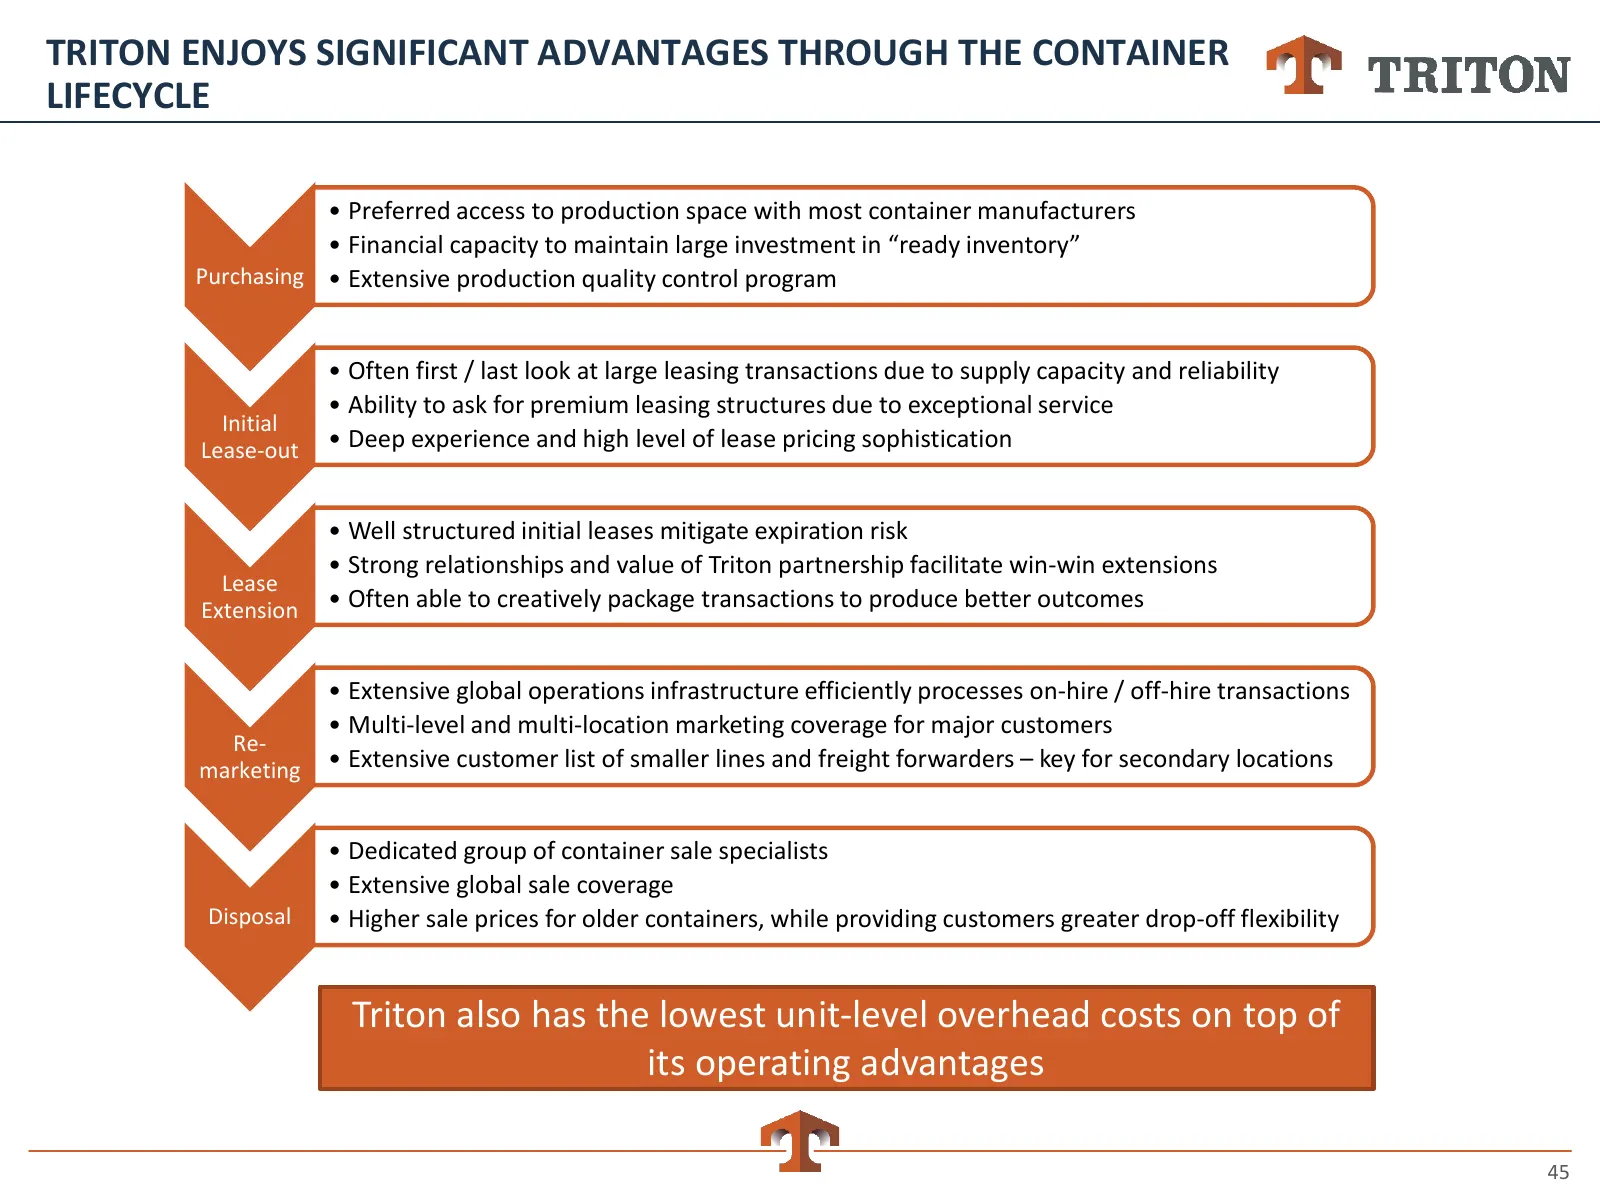
TRITON ENJOYS SIGNIFICANT ADVANTAGES THROUGH THE CONTAINER LIFECYCLE • Preferred access to production space with most container manufacturers • Financial capacity to maintain large investment in “ready inventory” Purchasing • Extensive production quality control program • Often first / last look at
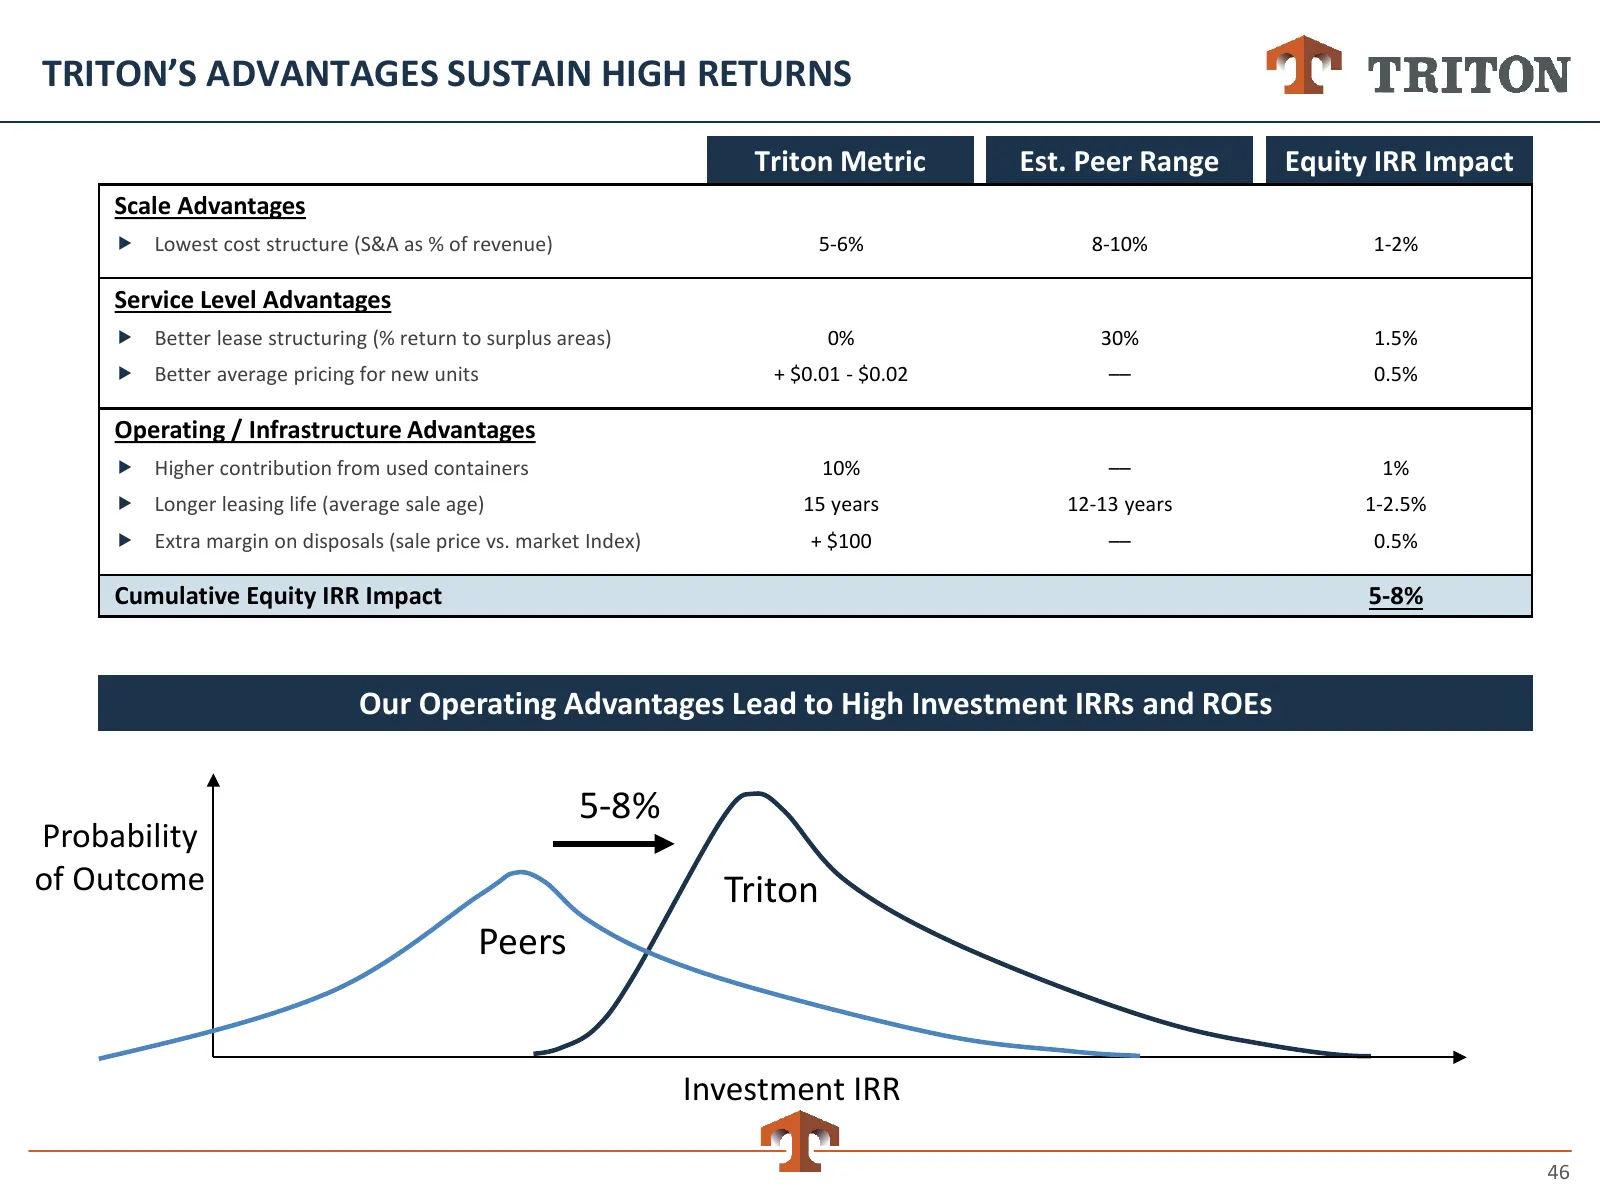
Slide 46: Triton's Advantages Sustain High Returns
TRITON’S ADVANTAGES SUSTAIN HIGH RETURNS Triton Metric Est. Peer Range Equity IRR Impact Scale Advantages Lowest cost structure (S&A as % of revenue) 5-6% 8-10% 1-2% Service Level Advantages Better lease structuring (% return to surplus areas) 0% 30% 1.5% Better average pricing for new units +
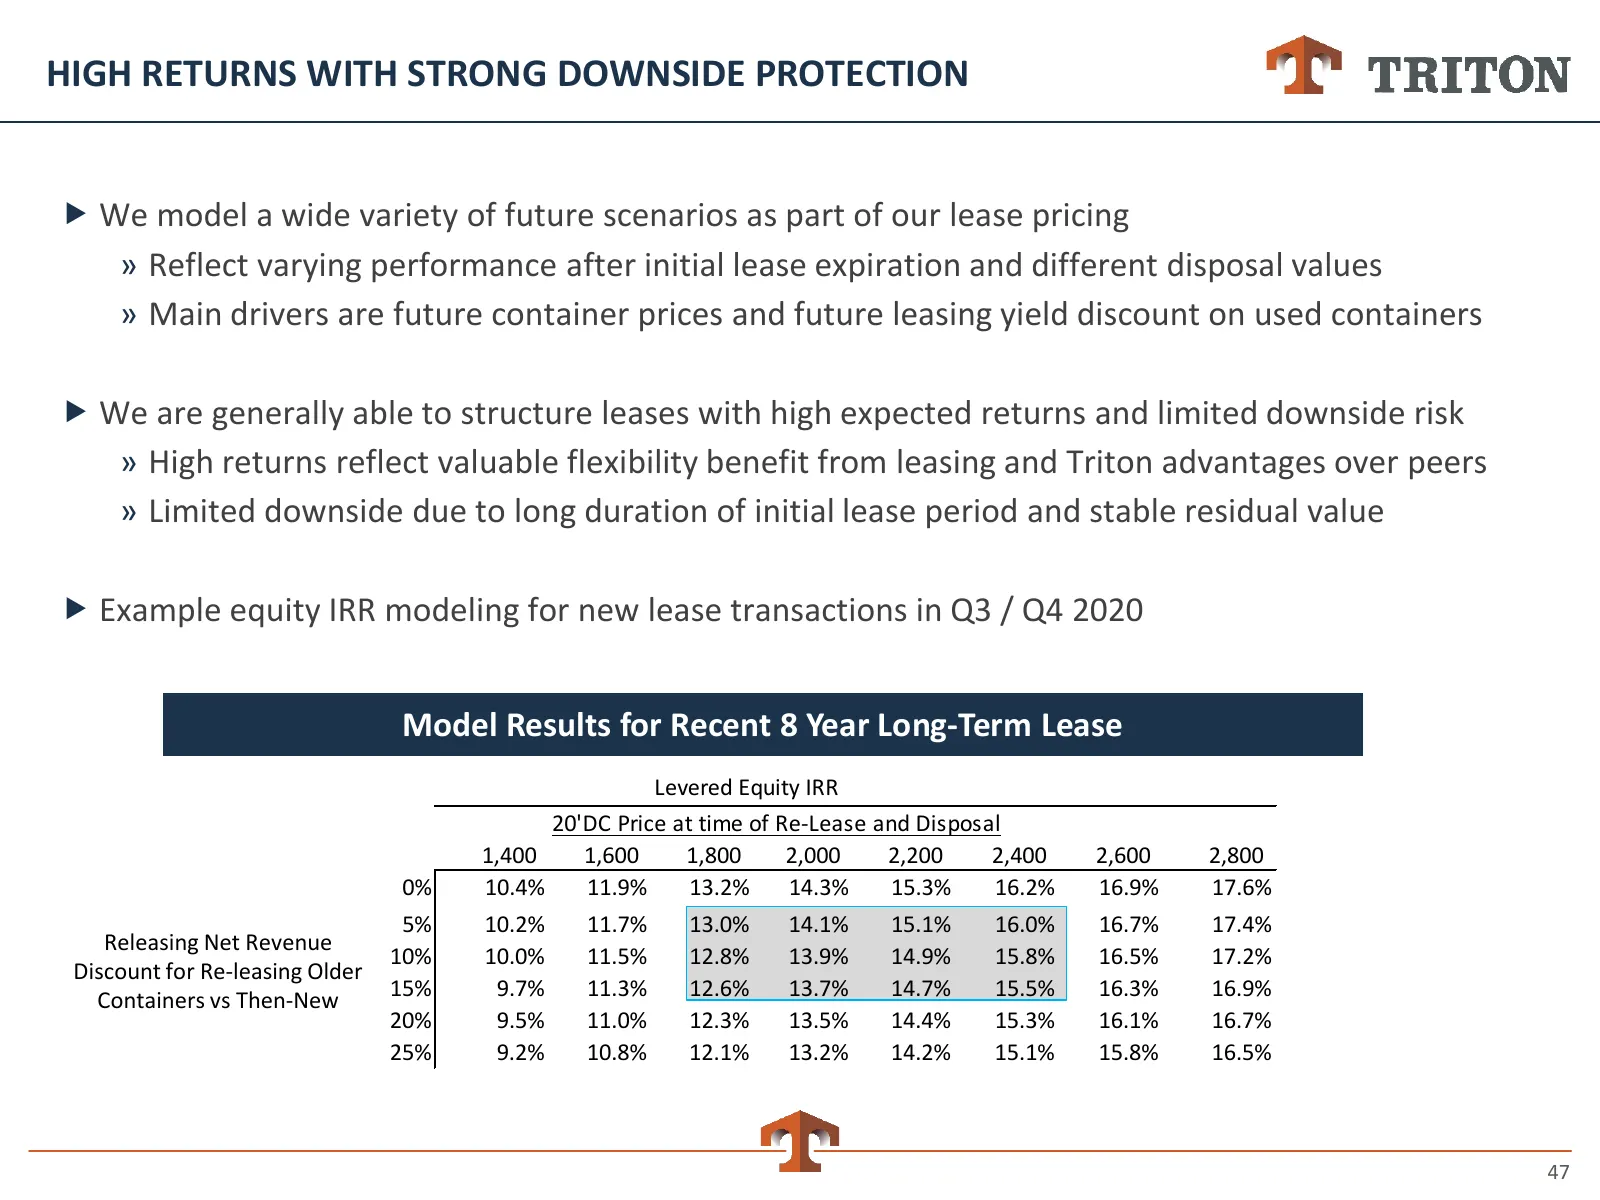
Slide 47: High Returns with Strong Downside Protection
HIGH RETURNS WITH STRONG DOWNSIDE PROTECTION We model a wide variety of future scenarios as part of our lease pricing » Reflect varying performance after initial lease expiration and different disposal values » Main drivers are future container prices and future leasing yield discount on used cont
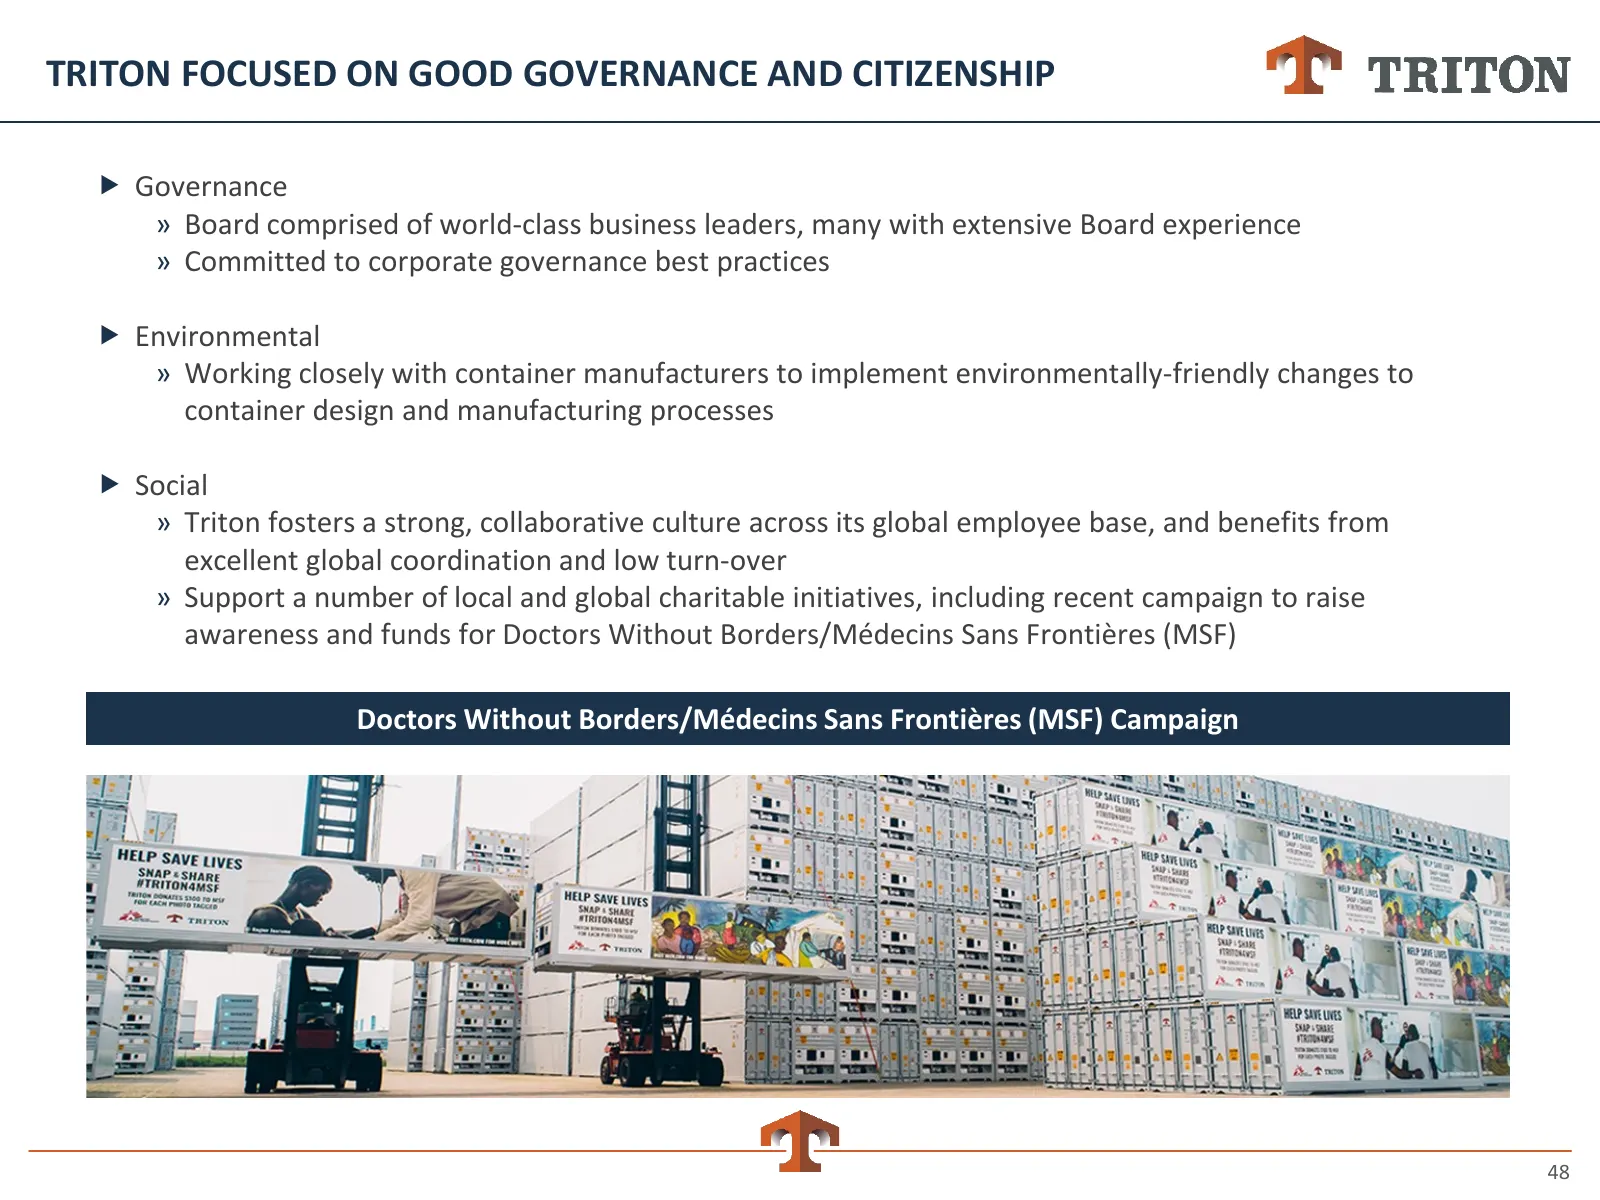
Slide 48: Triton Focused on Good Governance and Citizenship
TRITON FOCUSED ON GOOD GOVERNANCE AND CITIZENSHIP Governance » Board comprised of world-class business leaders, many with extensive Board experience » Committed to corporate governance best practices Environmental » Working closely with container manufacturers to implement environmentally-friend
Slide 49: Strong Cash Flows and Strategic Capital Allocation
Strong Cash Flows and Strategic Capital Allocation 49
Slide 50: Financial Overview
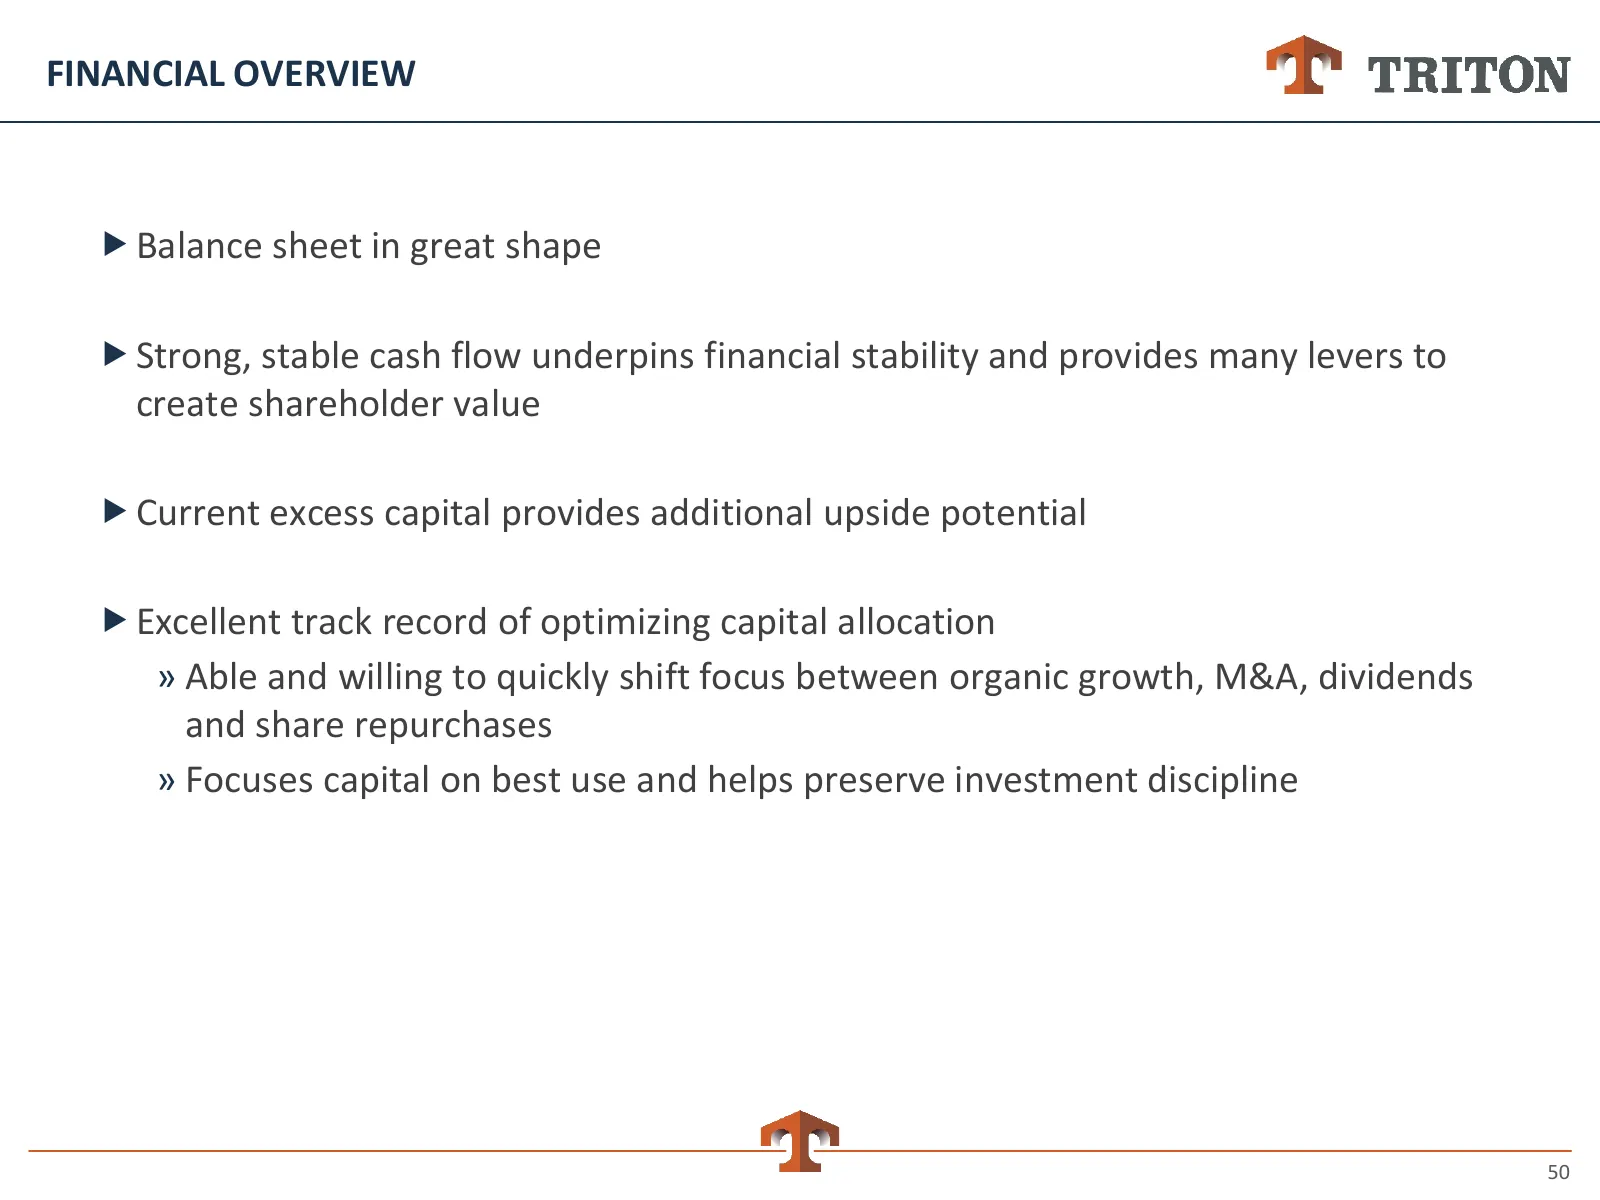
FINANCIAL OVERVIEW Balance sheet in great shape Strong, stable cash flow underpins financial stability and provides many levers to create shareholder value Current excess capital provides additional upside potential Excellent track record of optimizing capital allocation » Able and willing t
Slide 51: Strong Balance Sheet
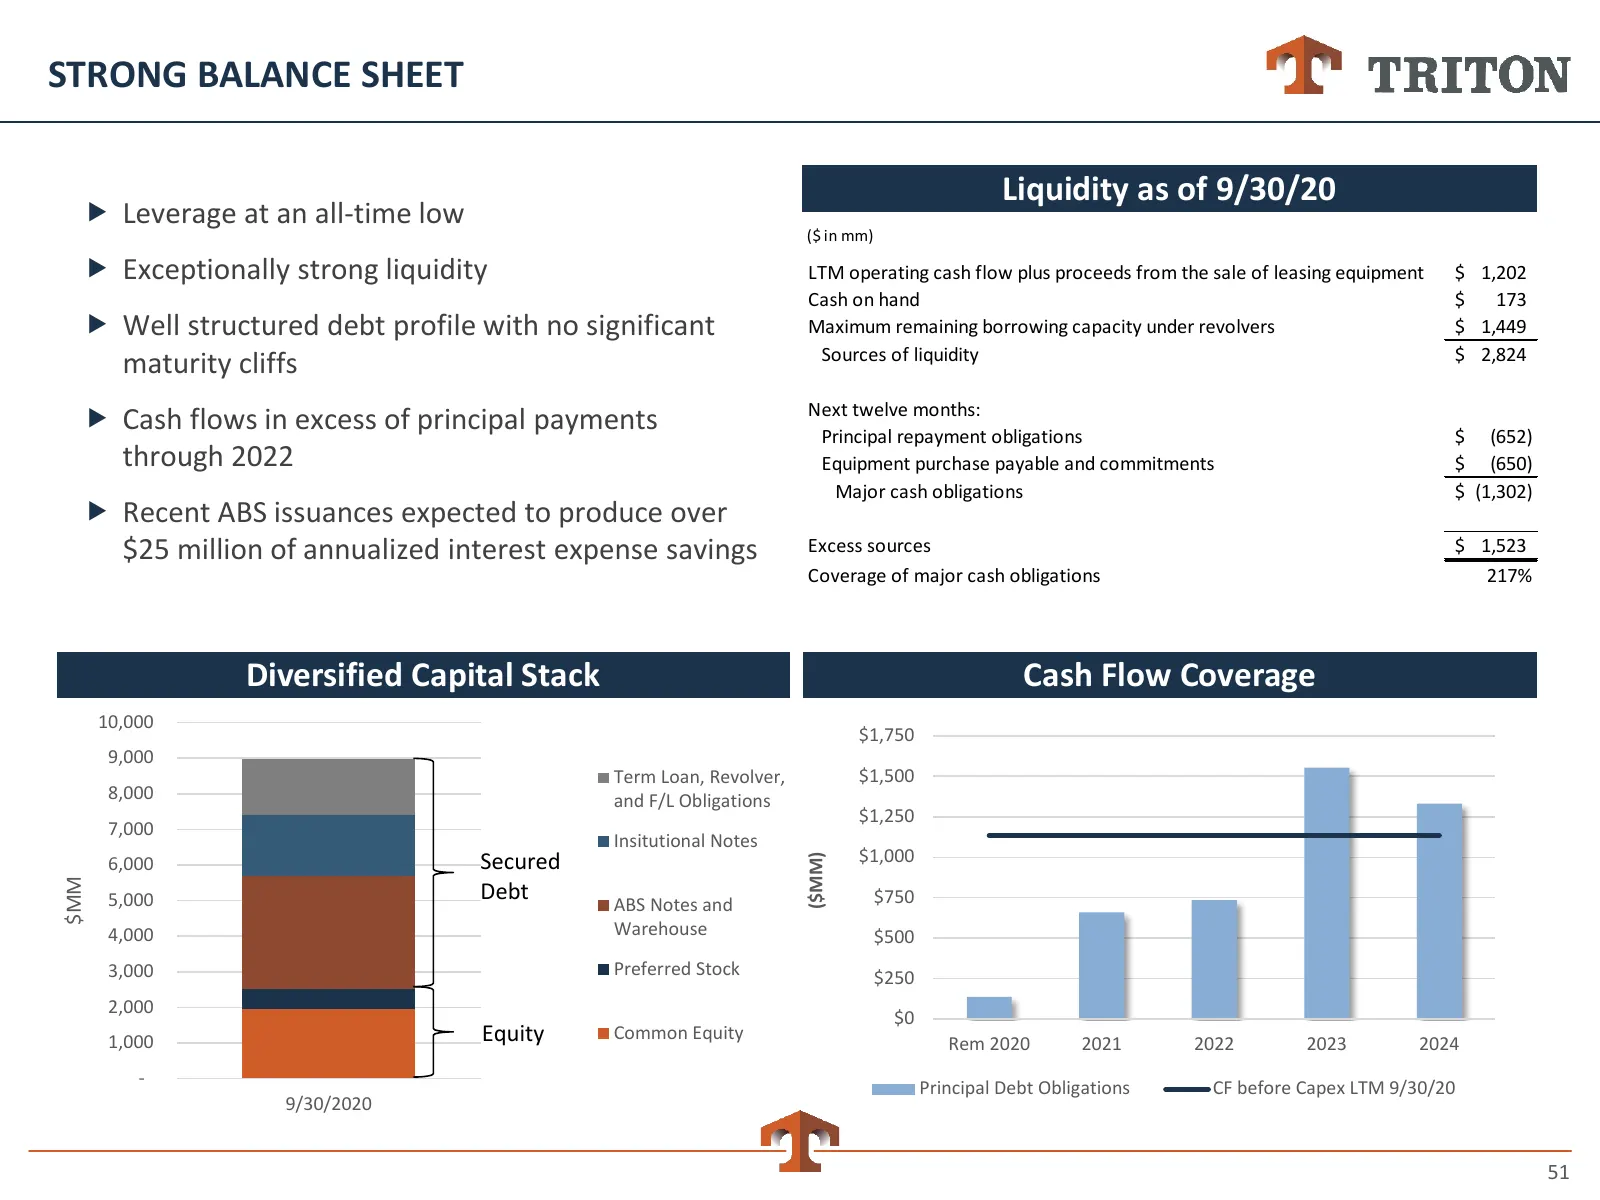
STRONG BALANCE SHEET Liquidity as of 9/30/20 Leverage at an all-time low ($ in mm) Exceptionally strong liquidity LTM operating cash flow plus proceeds from the sale of leasing equipment $ 1,202 Cash on hand $ 173 Well structured debt profile with no significant Maximum remaining borrowing cap
Slide 52: Generating Substantial Excess Cash Flow
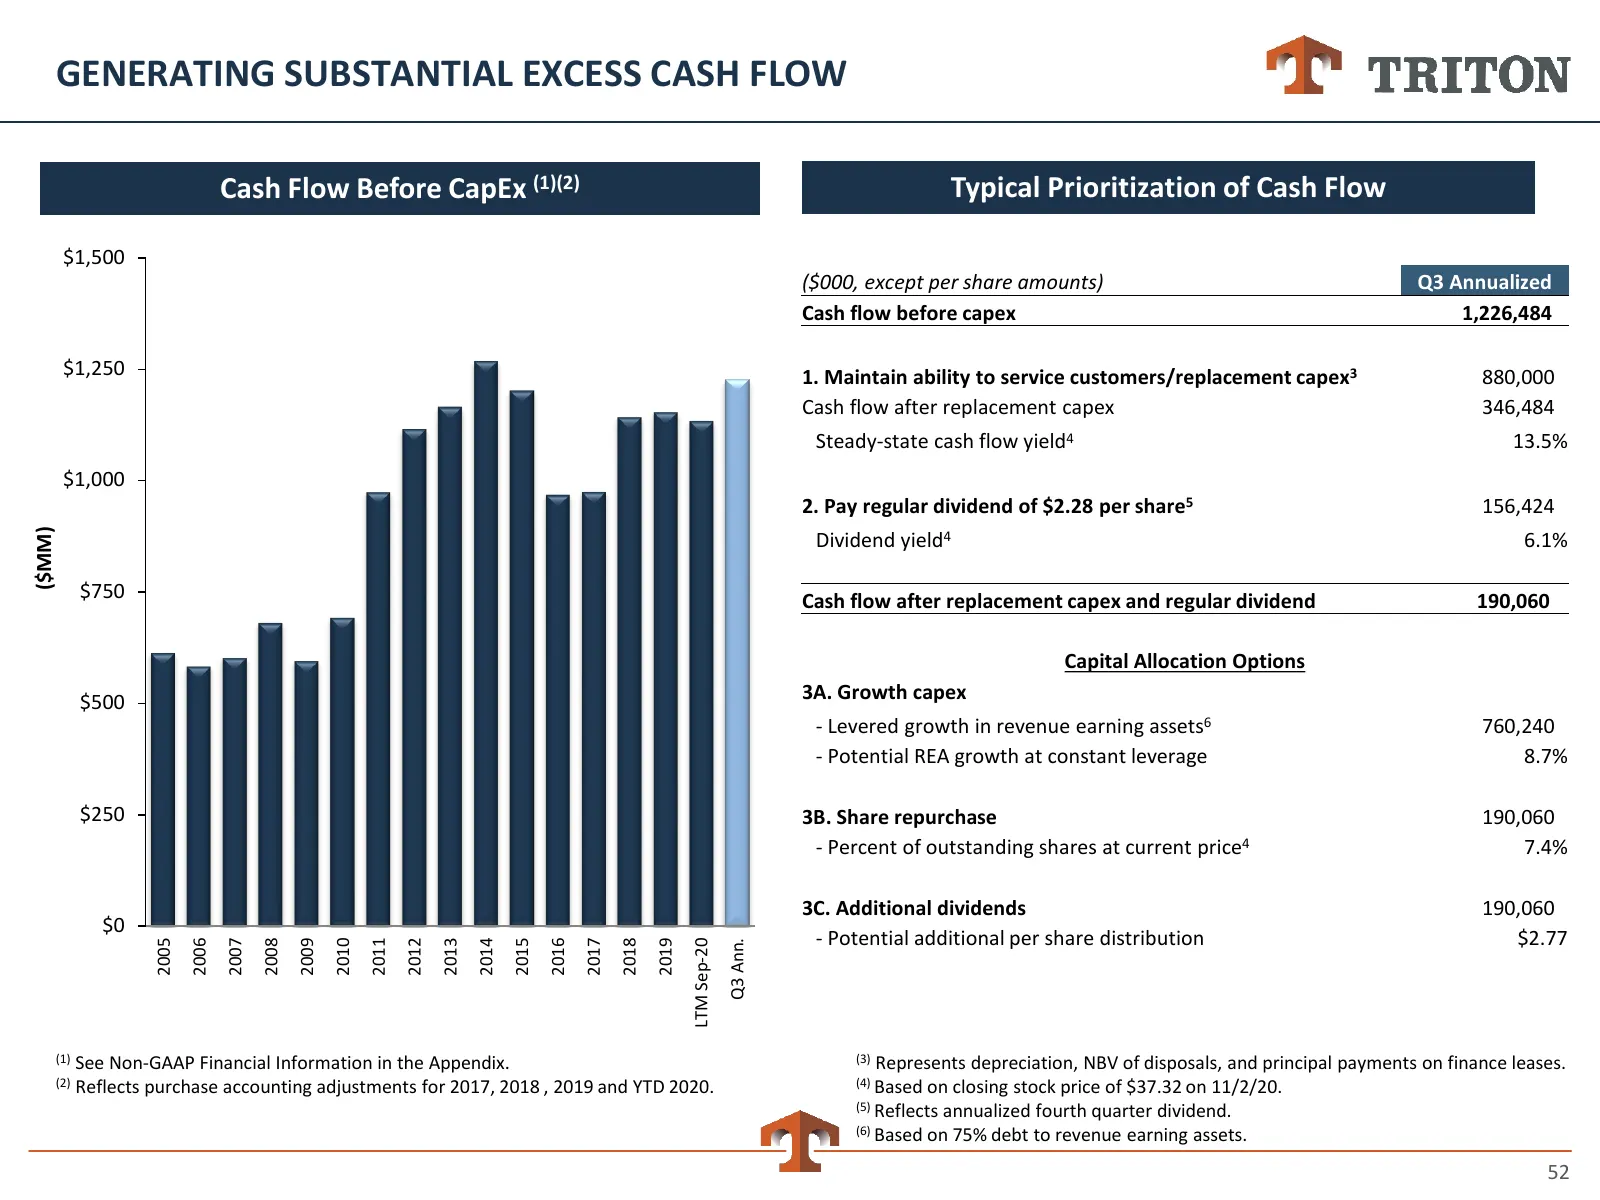
GENERATING SUBSTANTIAL EXCESS CASH FLOW Cash Flow Before CapEx (1)(2) Typical Prioritization of Cash Flow $1,500 ($000, except per share amounts) Q3 Annualized Cash flow before capex 1,226,484 $1,250 1. Maintain ability to service customers/replacement capex3 880,000 Cash flow after replacement cape
Slide 53: Historically Low Leverage Provides Additional Value Lever
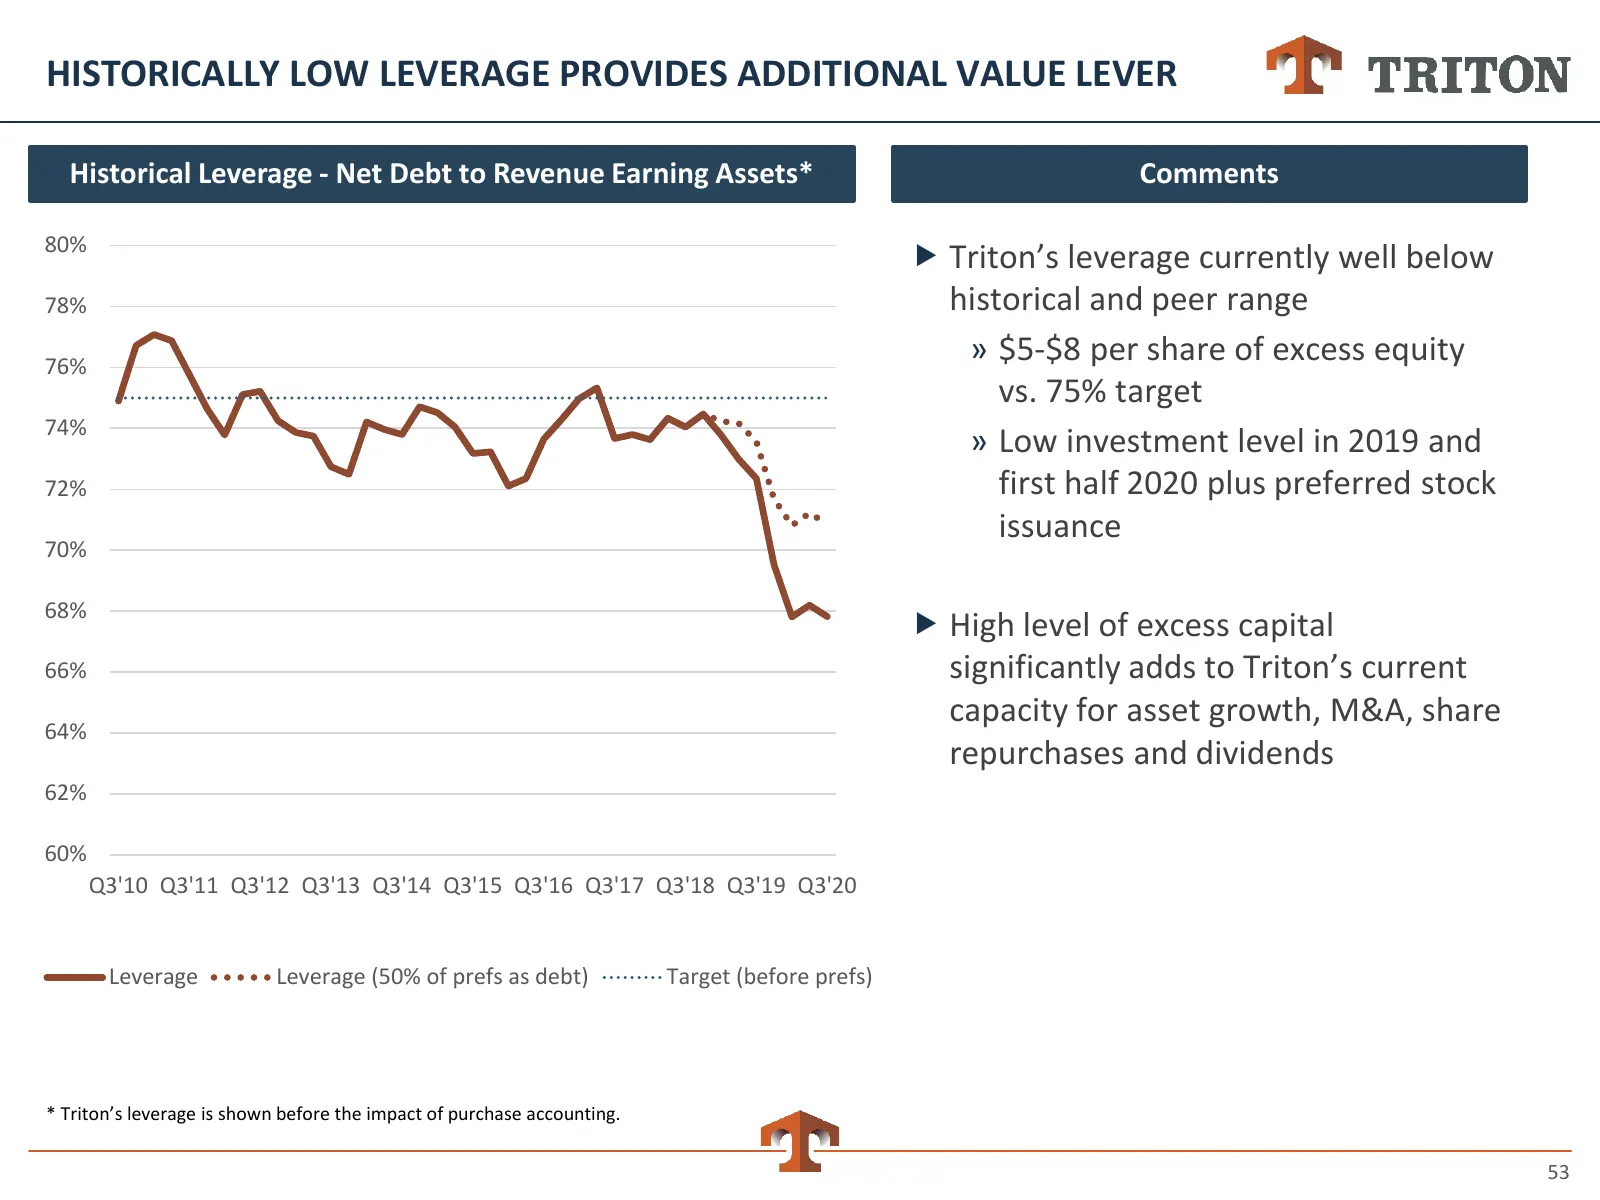
HISTORICALLY LOW LEVERAGE PROVIDES ADDITIONAL VALUE LEVER Historical Leverage - Net Debt to Revenue Earning Assets* Comments 80% Triton’s leverage currently well below 78% historical and peer range 76% » $5-$8 per share of excess equity vs. 75% target 74% » Low investment level in 2019 and 72% fir
Slide 54: Flexible and Strategic Approach to Capital Allocation
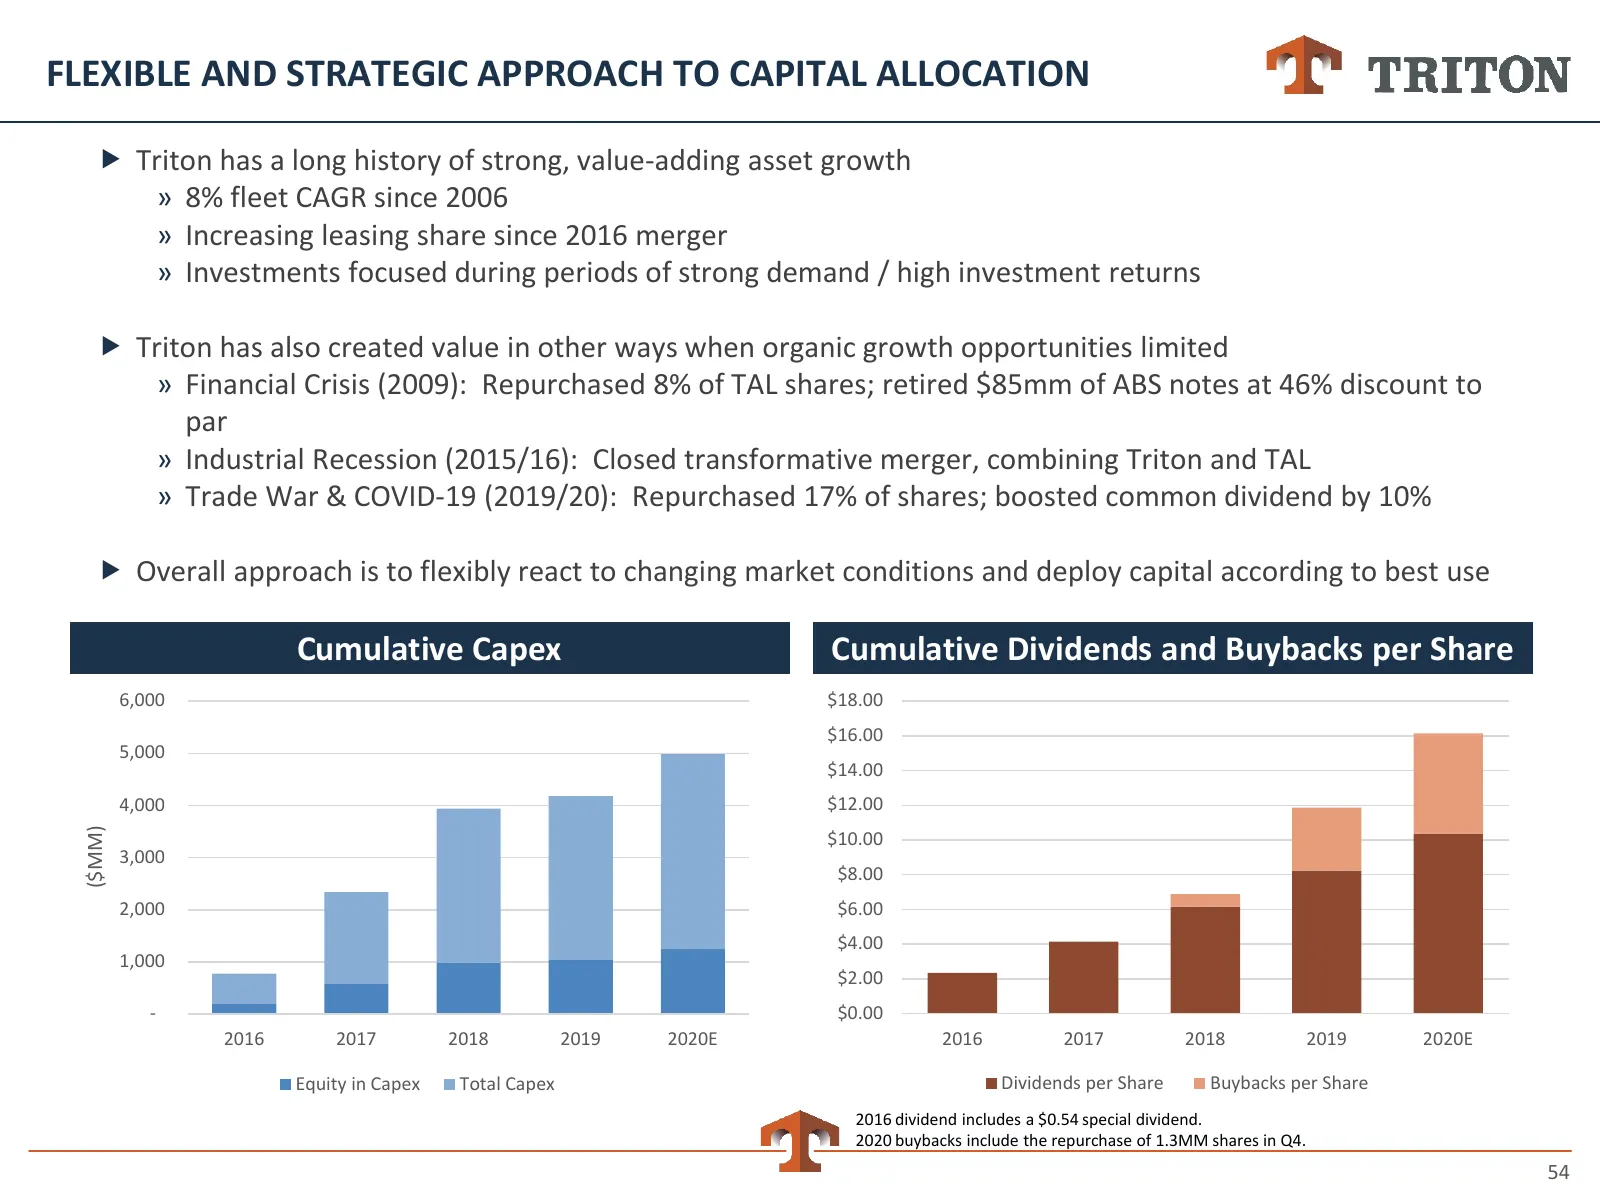
FLEXIBLE AND STRATEGIC APPROACH TO CAPITAL ALLOCATION Triton has a long history of strong, value-adding asset growth » 8% fleet CAGR since 2006 » Increasing leasing share since 2016 merger » Investments focused during periods of strong demand / high investment returns Triton has also created val
Slide 55: Outlook and Conclusions
Outlook and Conclusions 55
Slide 56: Business and Financial Momentum
BUSINESS AND FINANCIAL MOMENTUM Expect market conditions to remain exceptionally strong until at least early next year » Trade volumes remain well above pre-pandemic levels » Customers still facing significant container shortages Benefits of recent lease activity should be durable » Placed 800,0
Slide 57: Conclusions
CONCLUSIONS Sharp rebound in global trade is driving outstanding current performance Current resilience part of a long track record of strong results. Reasons include: » Attractive business fundamentals » Triton’s advantages as market leader » Favorable industry trends Strong cash flow and str
Slide 58: Q&A
Q&A 58
Slide 59: Appendix
Appendix 59
Slide 60: Non-GAAP Financial Information
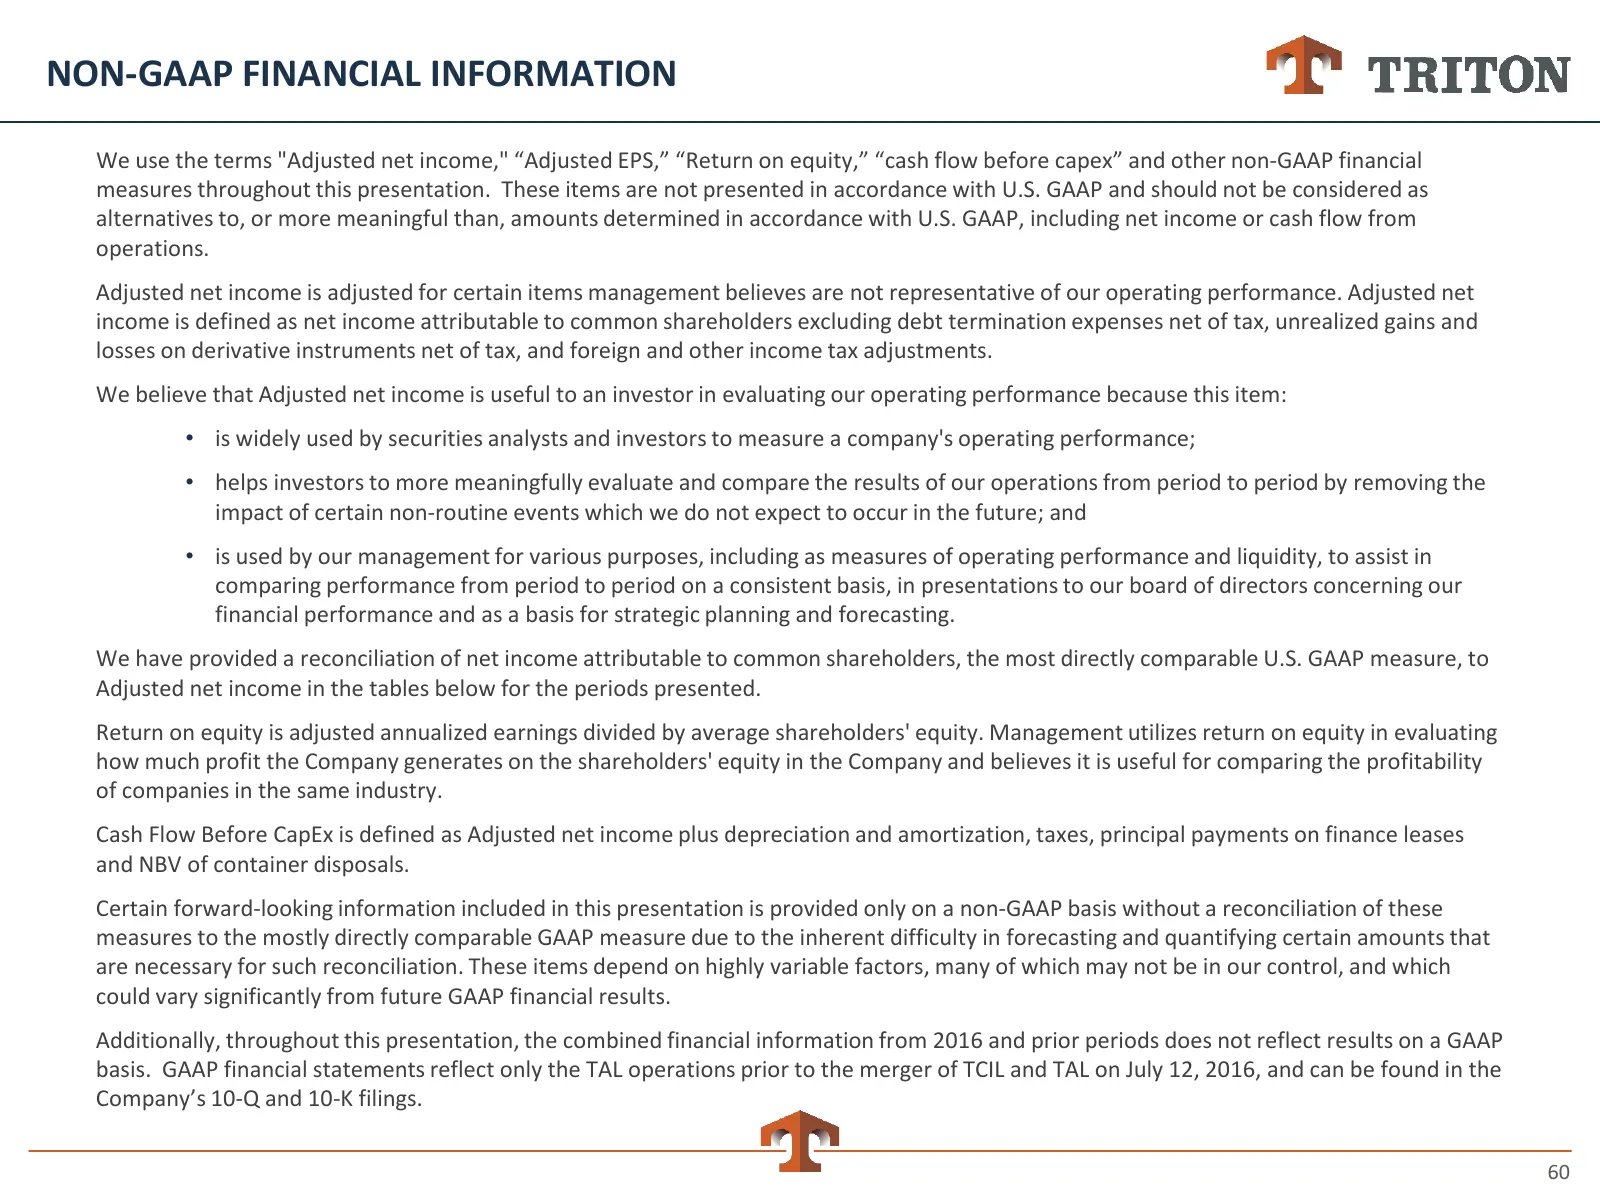
NON-GAAP FINANCIAL INFORMATION We use the terms "Adjusted net income," “Adjusted EPS,” “Return on equity,” “cash flow before capex” and other non-GAAP financial measures throughout this presentation. These items are not presented in accordance with U.S. GAAP and should not be considered as alternati
Slide 61: Reconciliation of Non-GAAP Financial Information
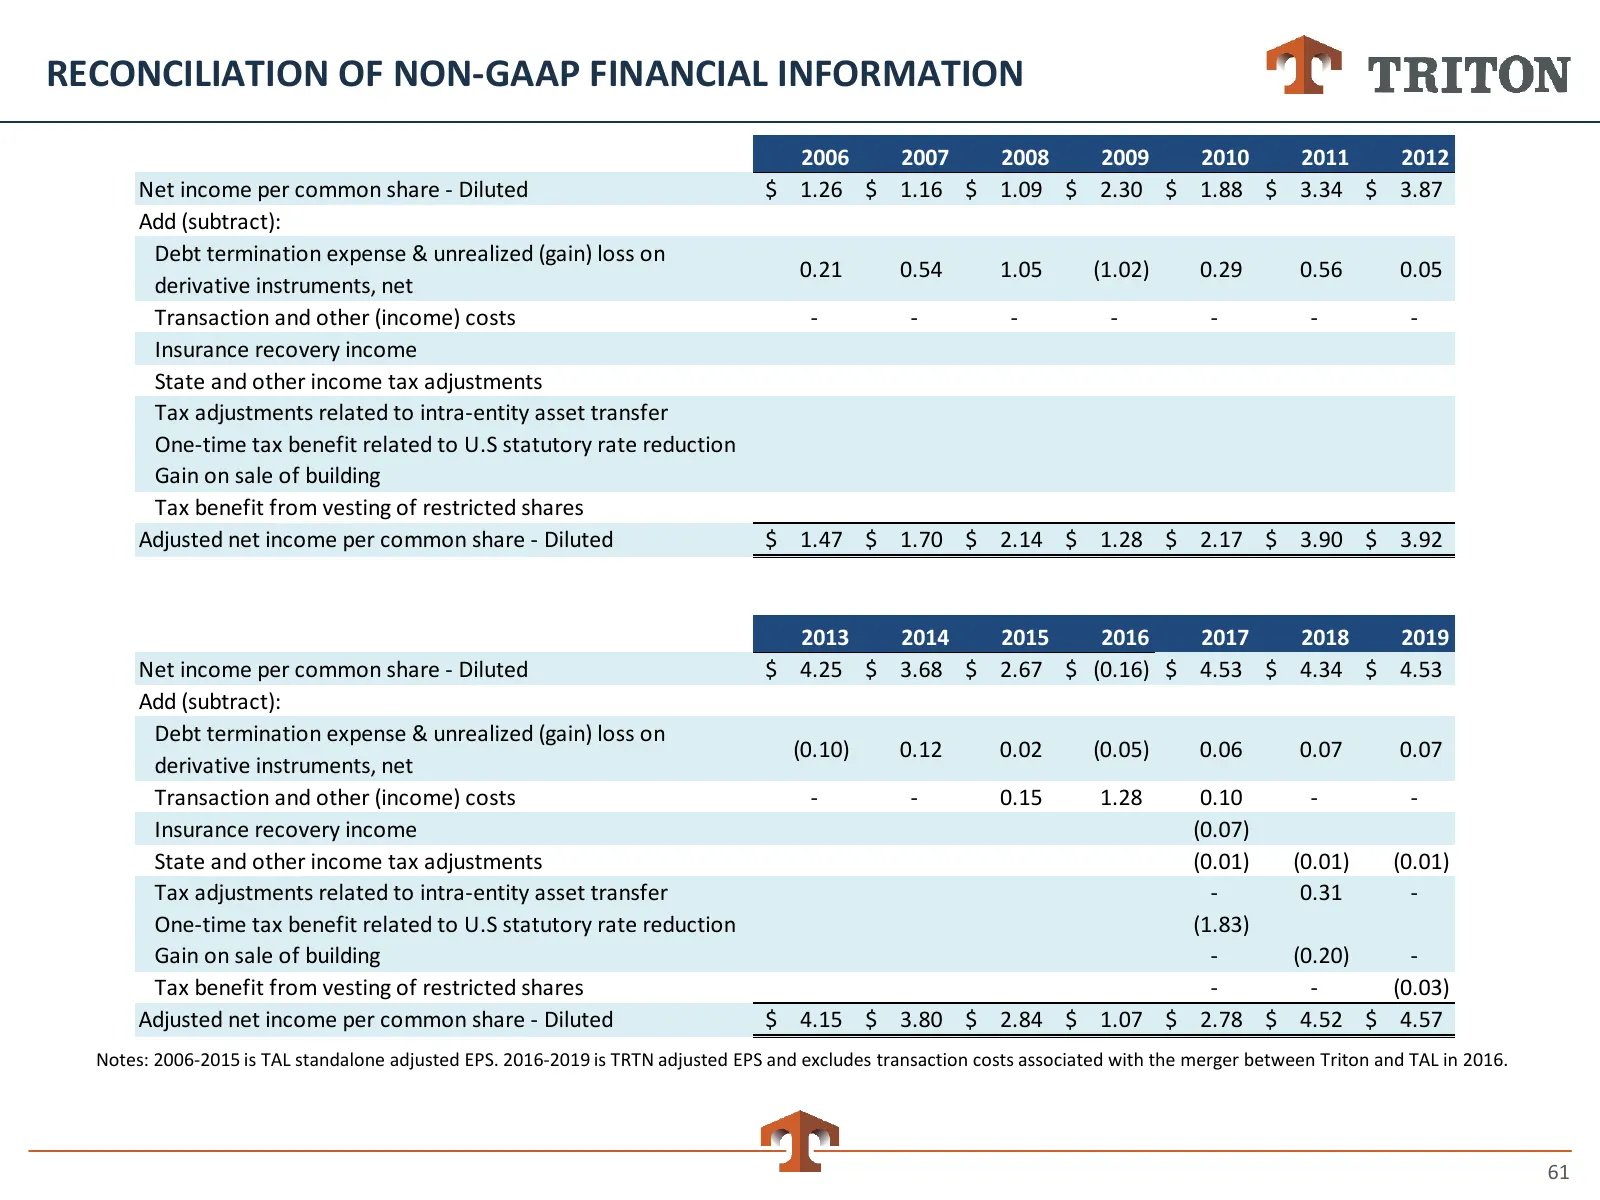
RECONCILIATION OF NON-GAAP FINANCIAL INFORMATION 2006 2007 2008 2009 2010 2011 2012 Net income per common share - Diluted $ 1.26 $ 1.16 $ 1.09 $ 2.30 $ 1.88 $ 3.34 $ 3.87 Add (subtract): Debt termination expense & unrealized (gain) loss on 0.21 0.54 1.05 (1.02) 0.29 0.56 0.05 derivative instruments,
Slide 62: Reconciliation of Non-GAAP Financial Information
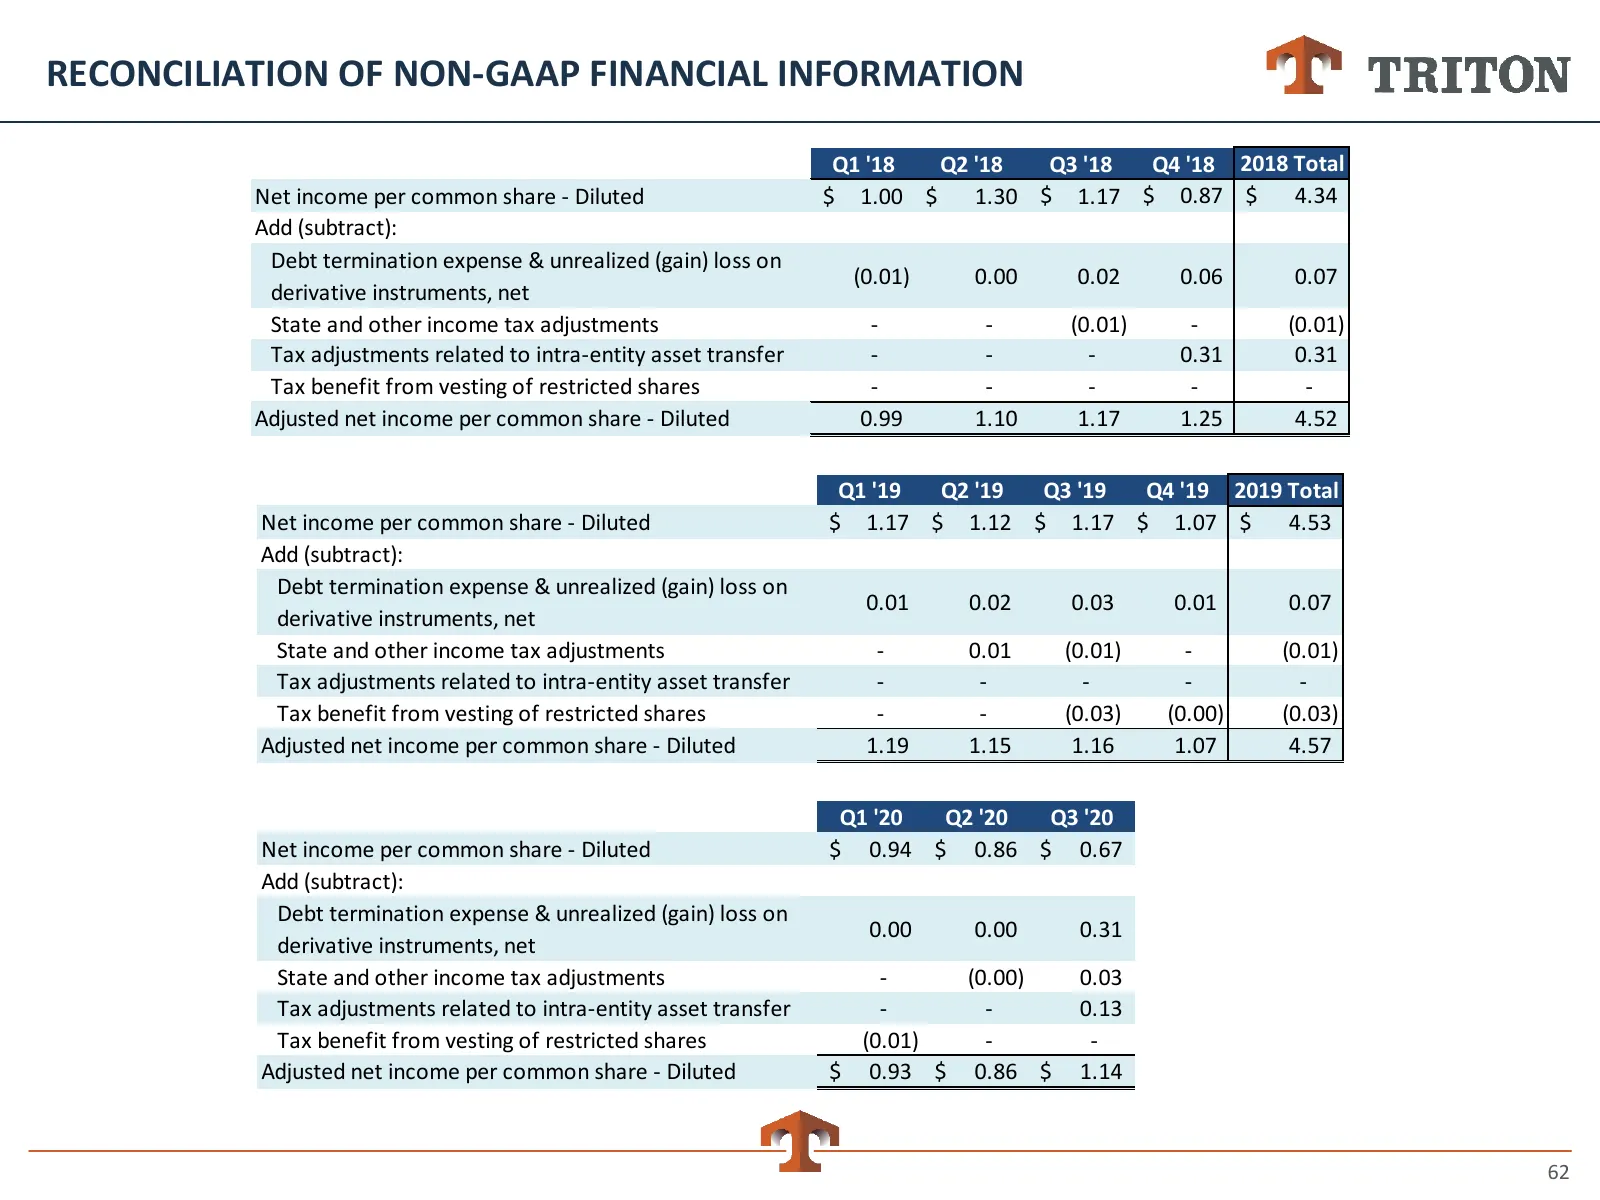
RECONCILIATION OF NON-GAAP FINANCIAL INFORMATION Q1 '18 Q2 '18 Q3 '18 Q4 '18 2018 Total Net income per common share - Diluted $ 1.00 $ 1.30 $ 1.17 $ 0.87 $ 4.34 Add (subtract): Debt termination expense & unrealized (gain) loss on (0.01) 0.00 0.02 0.06 0.07 derivative instruments, net State and other
Slide 63: Vintage Analysis - Drys
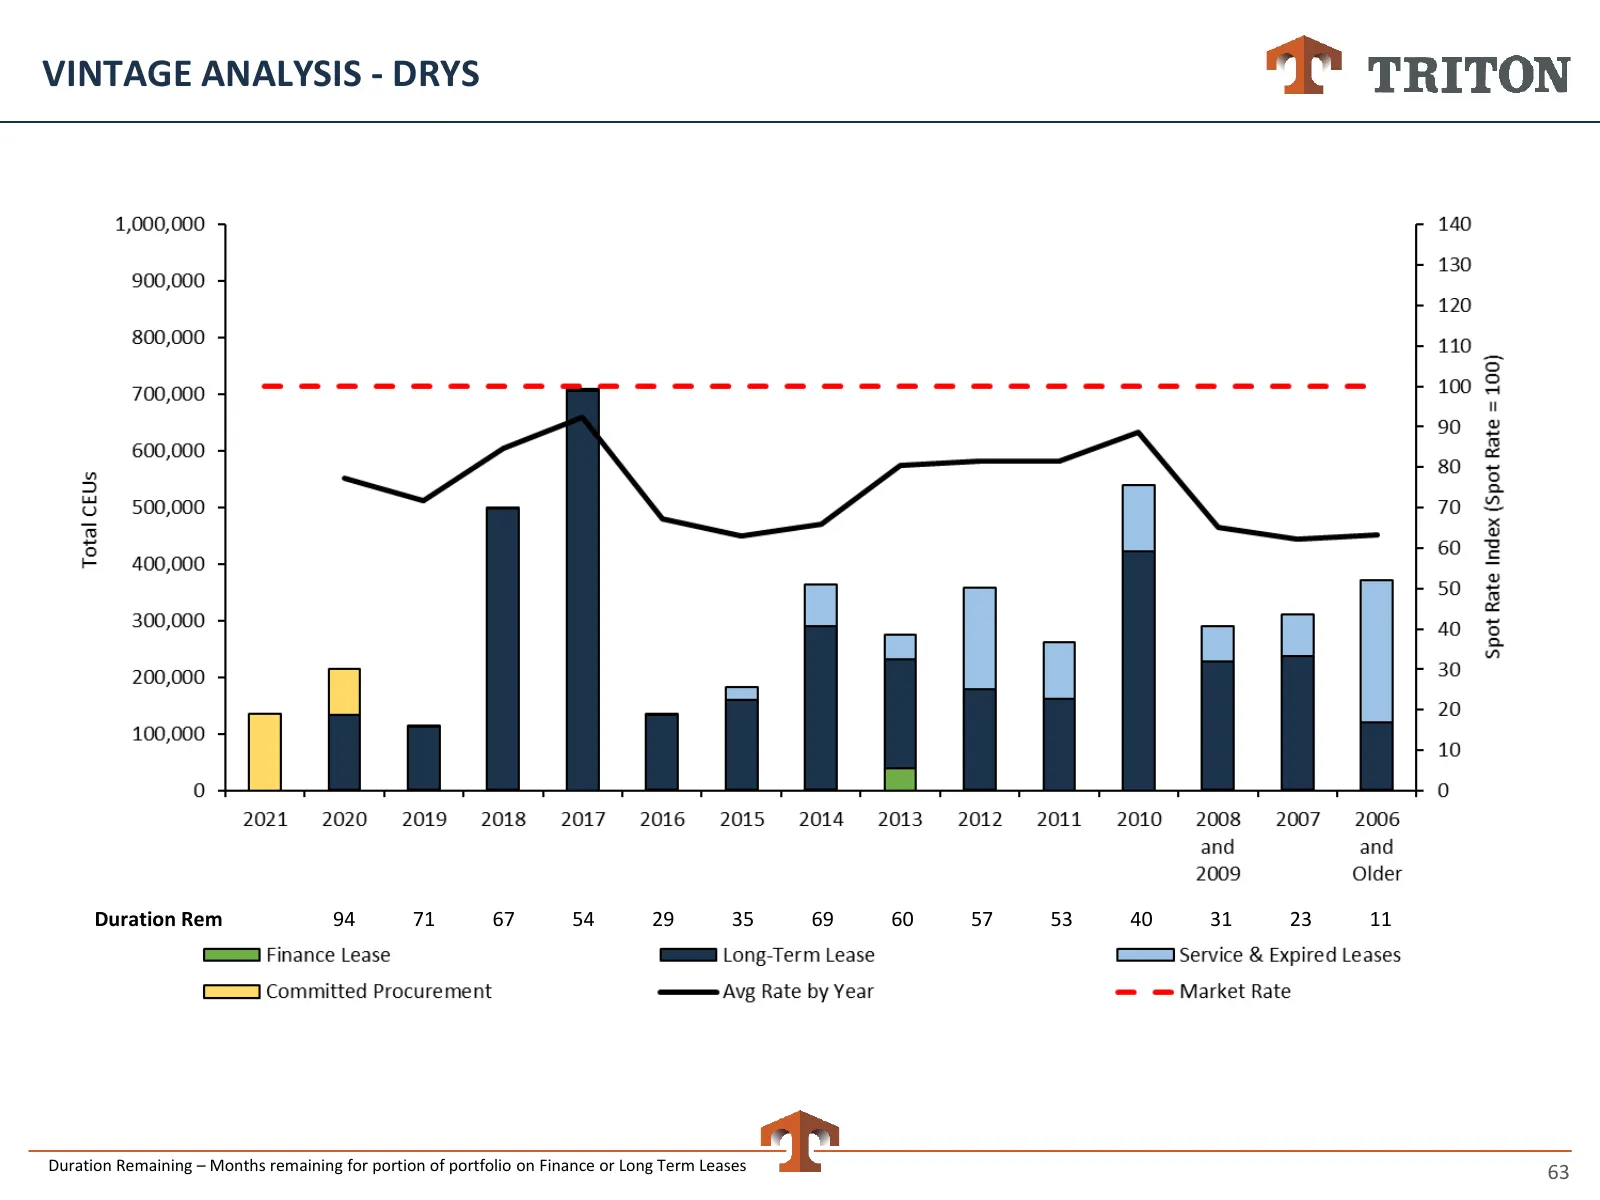
VINTAGE ANALYSIS - DRYS Duration Rem 94 71 67 54 29 35 69 60 57 53 40 31 23 11 Duration Remaining – Months remaining for portion of portfolio on Finance or Long Term Leases 63
Slide 64: Vintage Analysis - Reefers
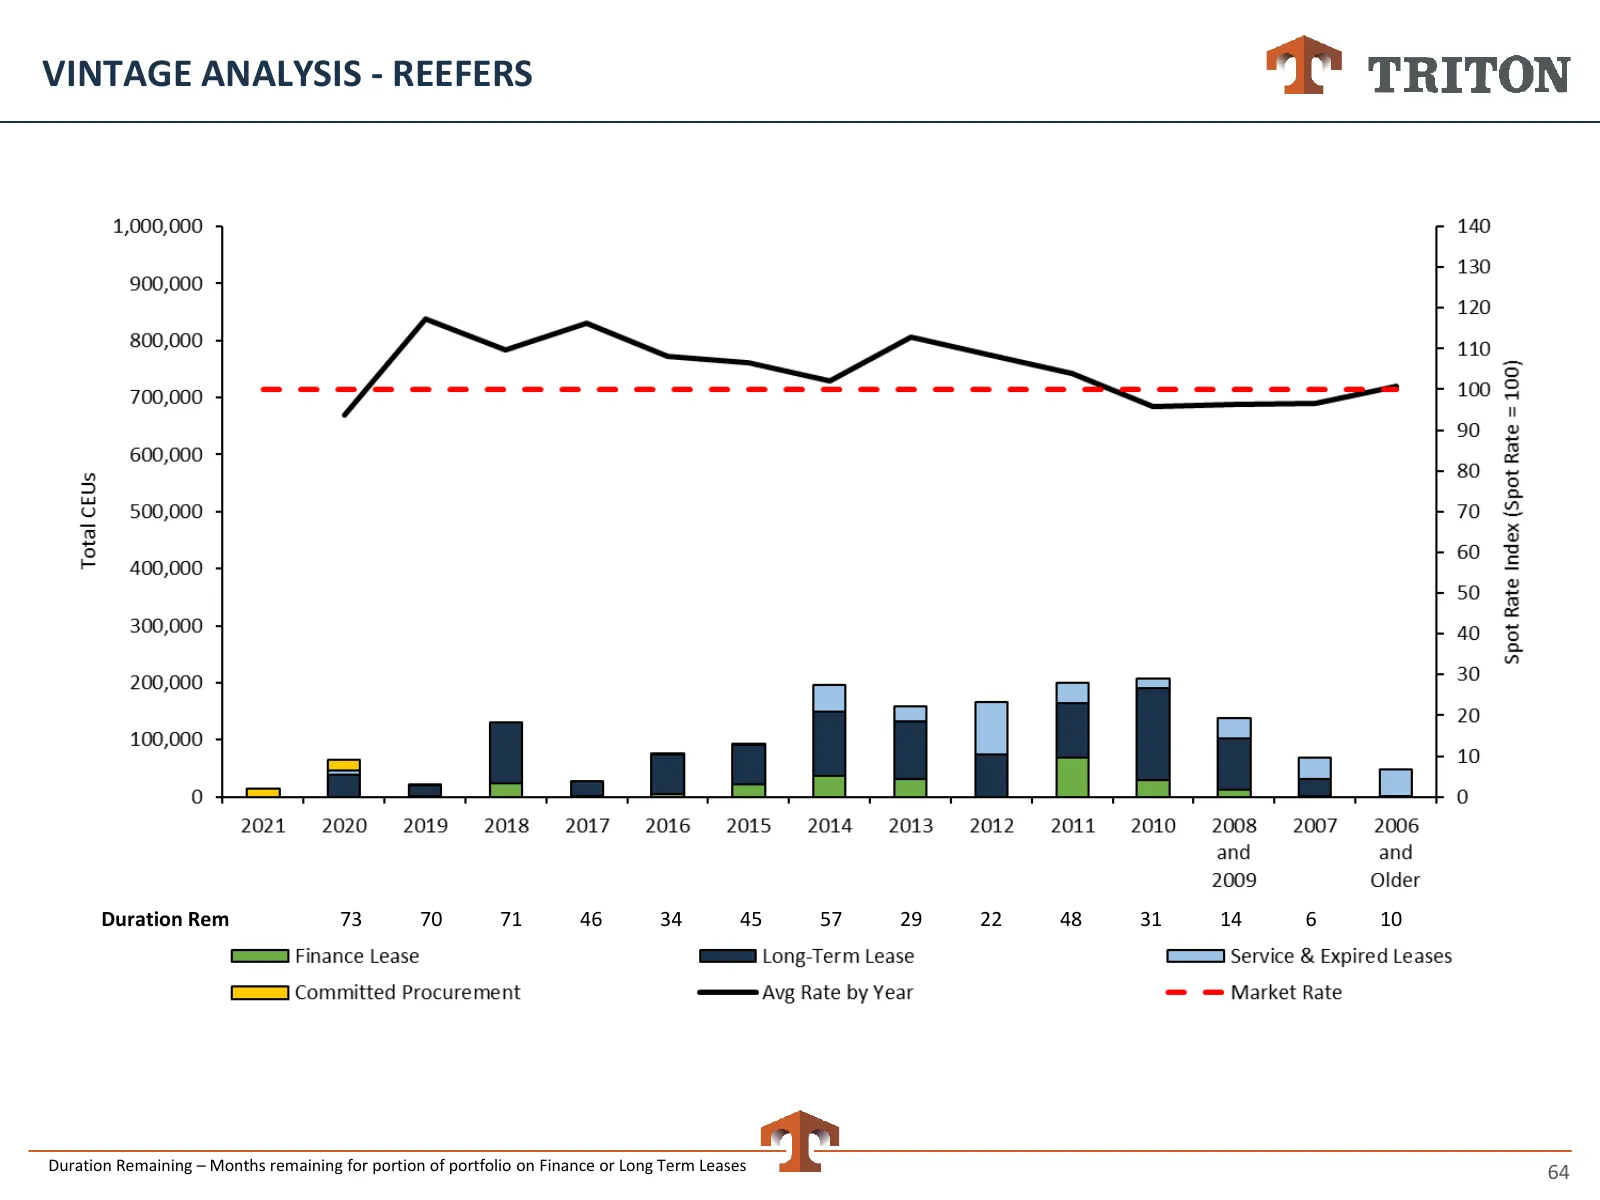
VINTAGE ANALYSIS - REEFERS Duration Rem 73 70 71 46 34 45 57 29 22 48 31 14 6 10 Duration Remaining – Months remaining for portion of portfolio on Finance or Long Term Leases 64
Source: Internet Archive copy of tritoninternational.com
More decks from Triton International Ltd.
 Q3 2026 Earnings Presentation14 slides · November 2026
 Q2 2026 Earnings Presentation14 slides · August 2026
 Q1 2026 Earnings Presentation14 slides · May 2026
 Q4 2025 Earnings Presentation12 slides · February 2026
 Investor Presentation (January 2026)12 slides · January 2026
 Q2 2025 Earnings Presentation13 slides · September 2025