Ayala Land Inc. · PSE:ALI
Ayala Land — 9M 2005 Earnings Presentation
29 slides from Ayala Land's earnings presentation, Nov 11, 2005
Slide 1: Ayala Land, Inc. 9M 2005 Unaudited Results Analysts' Briefing
Ayala Land, Inc. 9M 2005 Unaudited Results Analysts' Briefing November 11, 2005
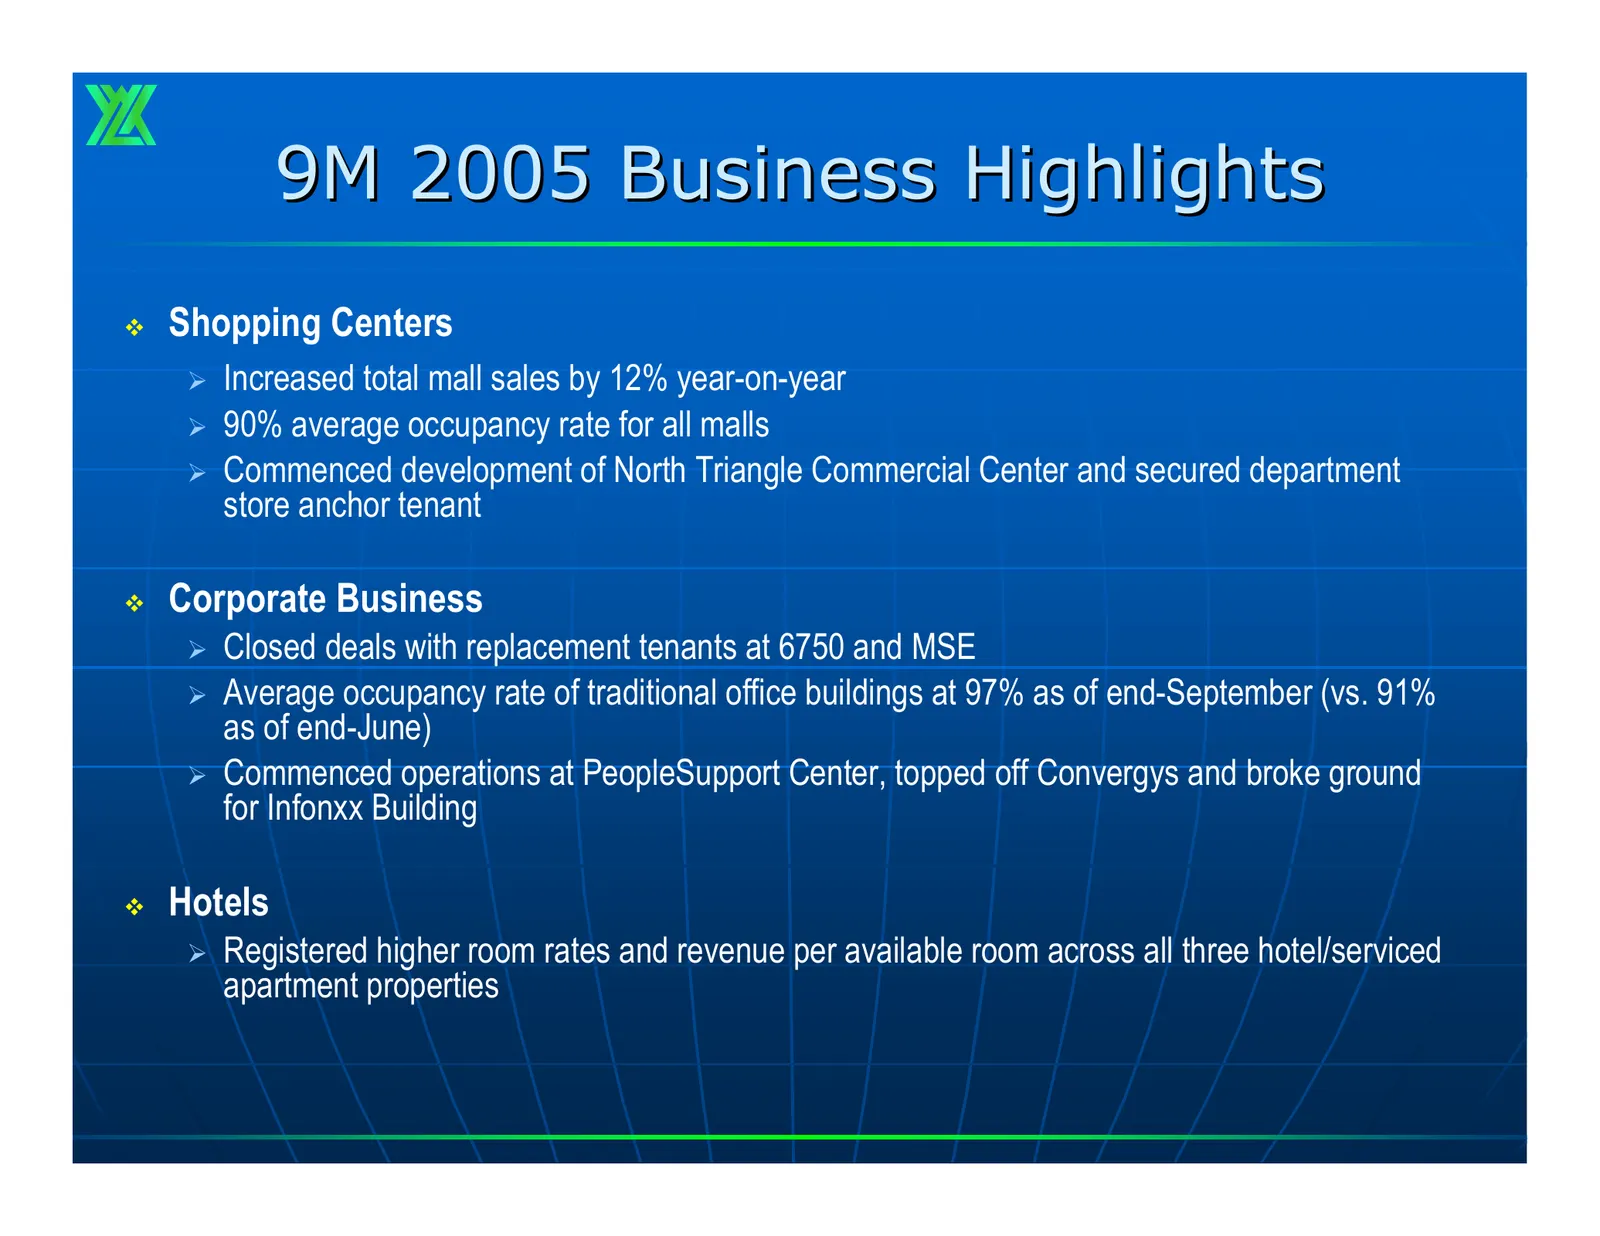
Slide 2: 9M 2005 Business Highlights
9M 2005 Business Highlights Shopping Centers ¾ Increased total mall sales by 12% year-on-year ¾ 90% average occupancy rate for all malls ¾ Commenced development of North Triangle Commercial Center and secured department store anchor tenant Corporate Business ¾ Closed deals with replacement tenan
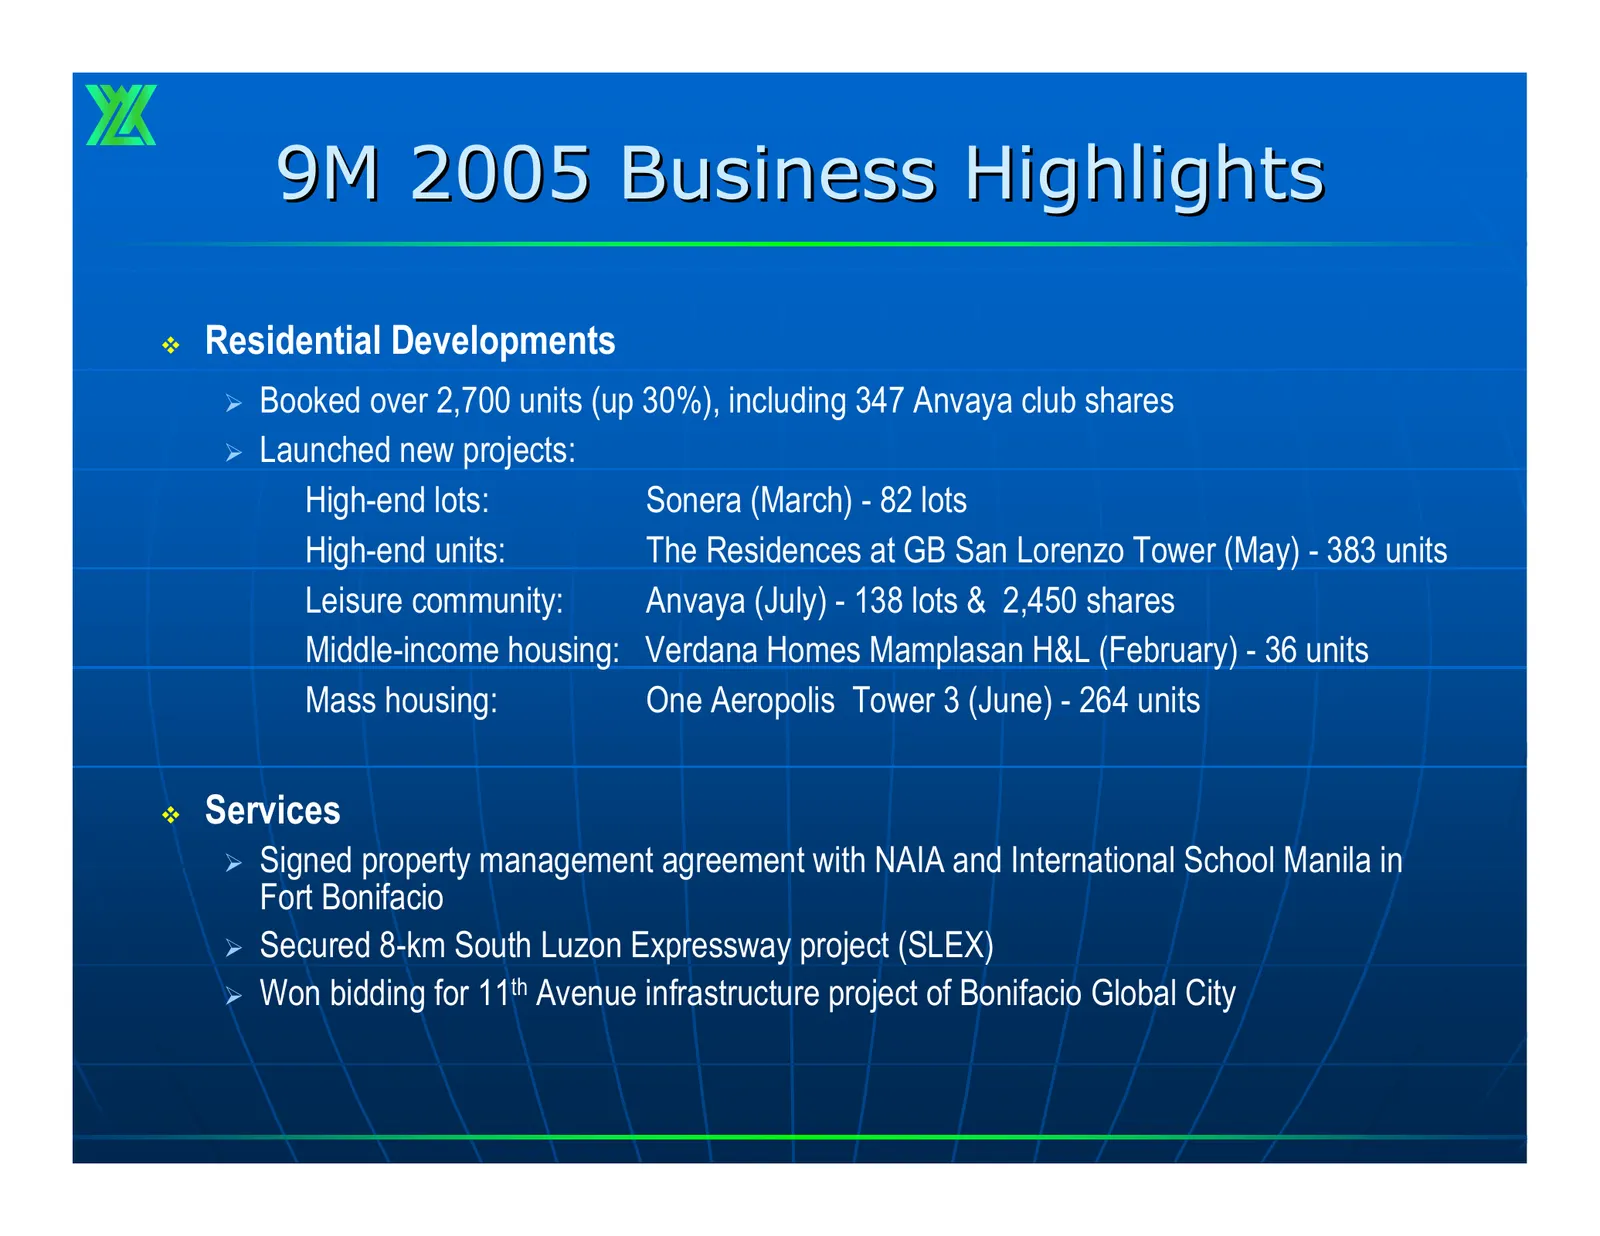
Slide 3: 9M 2005 Business Highlights
9M 2005 Business Highlights Residential Developments ¾ Booked over 2,700 units (up 30%), including 347 Anvaya club shares ¾ Launched new projects: High-end lots: Sonera (March) - 82 lots High-end units: The Residences at GB San Lorenzo Tower (May) - 383 units Leisure community: Anvaya (July) - 138
Slide 4: 9M 2005 Business Highlights
9M 2005 Business Highlights Landbanking ¾ Now reported separately as a business line ¾ Consists of ALI’s (parent company) share of sales in properties made available to LPHI and CII for development, gas station rentals and car park revenues outside Ayala Center Others ¾ Sold preferred shares of
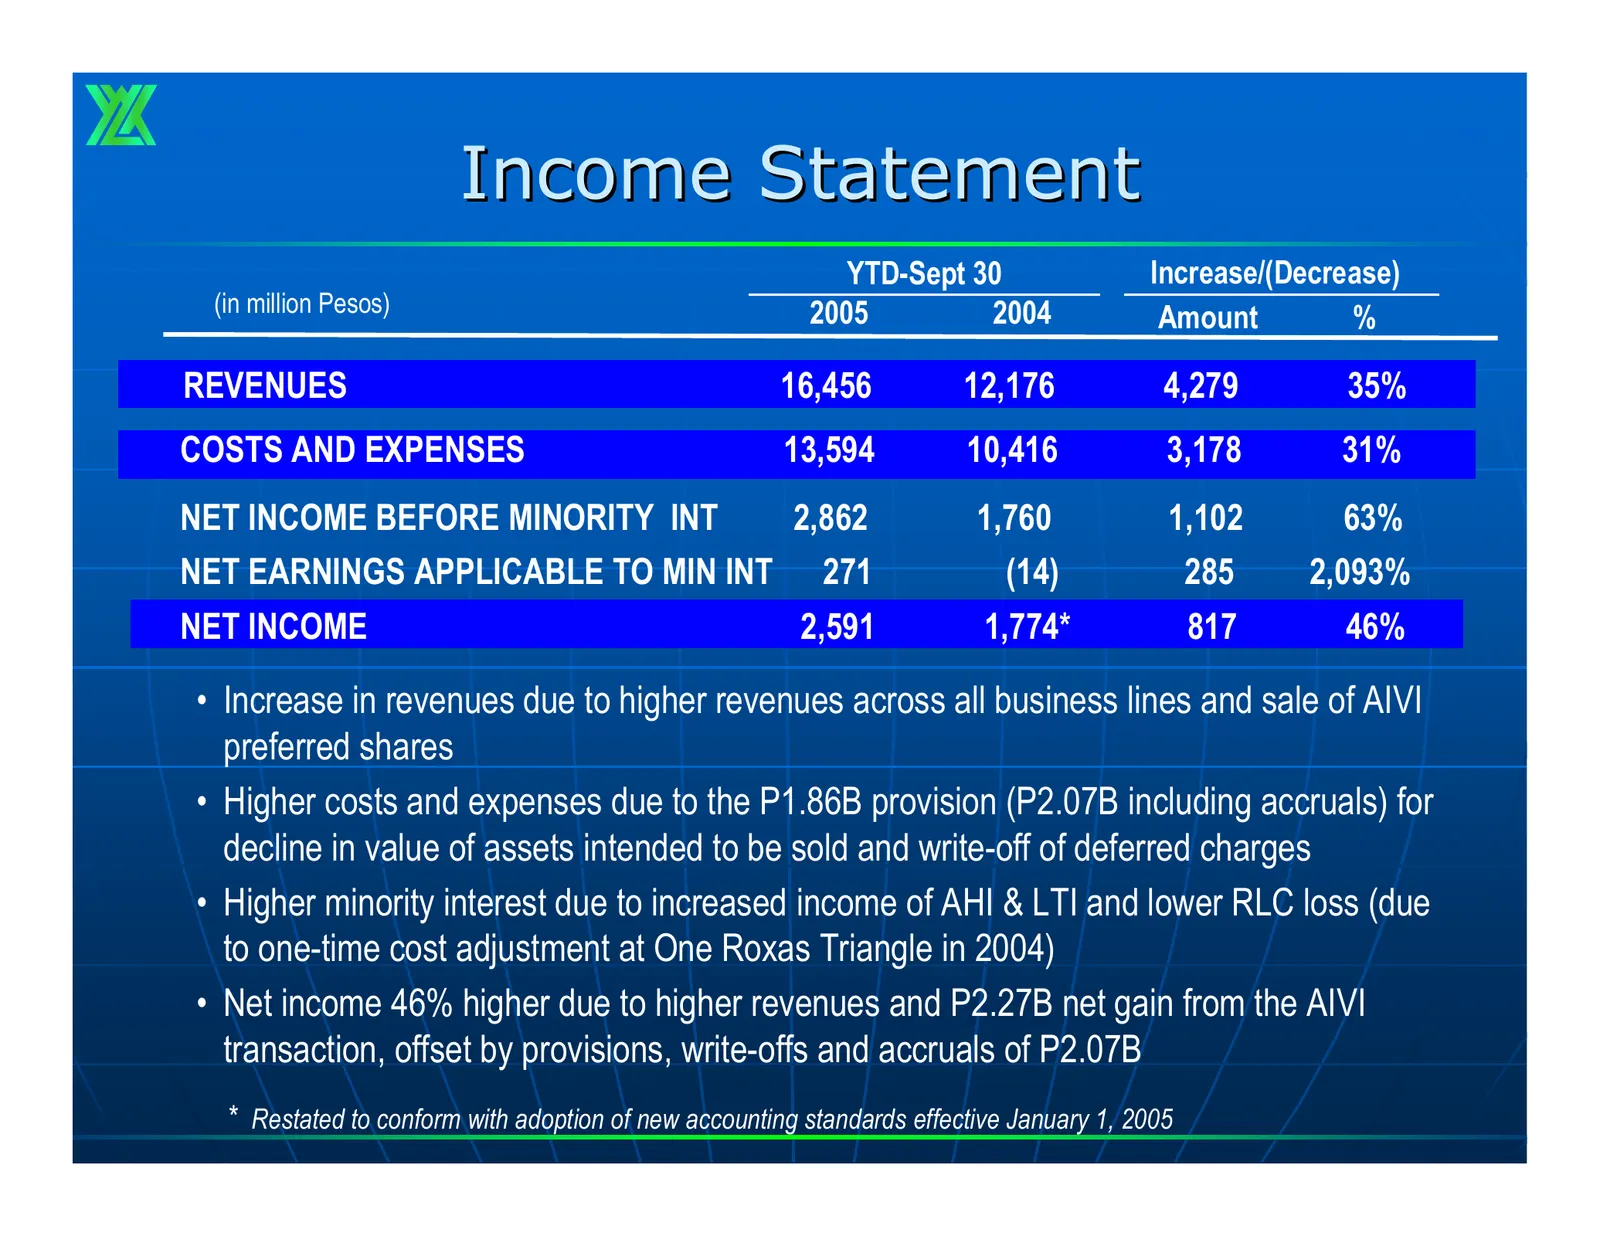
Slide 5: Income Statement
Income Statement YTD-Sept 30 Increase/(Decrease) (in million Pesos) 2005 2004 Amount % REVENUES 16,456 12,176 4,279 35% COSTS AND EXPENSES 13,594 10,416 3,178 31% NET INCOME BEFORE MINORITY INT 2,862 1,760 1,102 63% NET EARNINGS APPLICABLE TO MIN INT 271 (14) 285 2,093% NET INCOME 2,591 1,774* 817 4
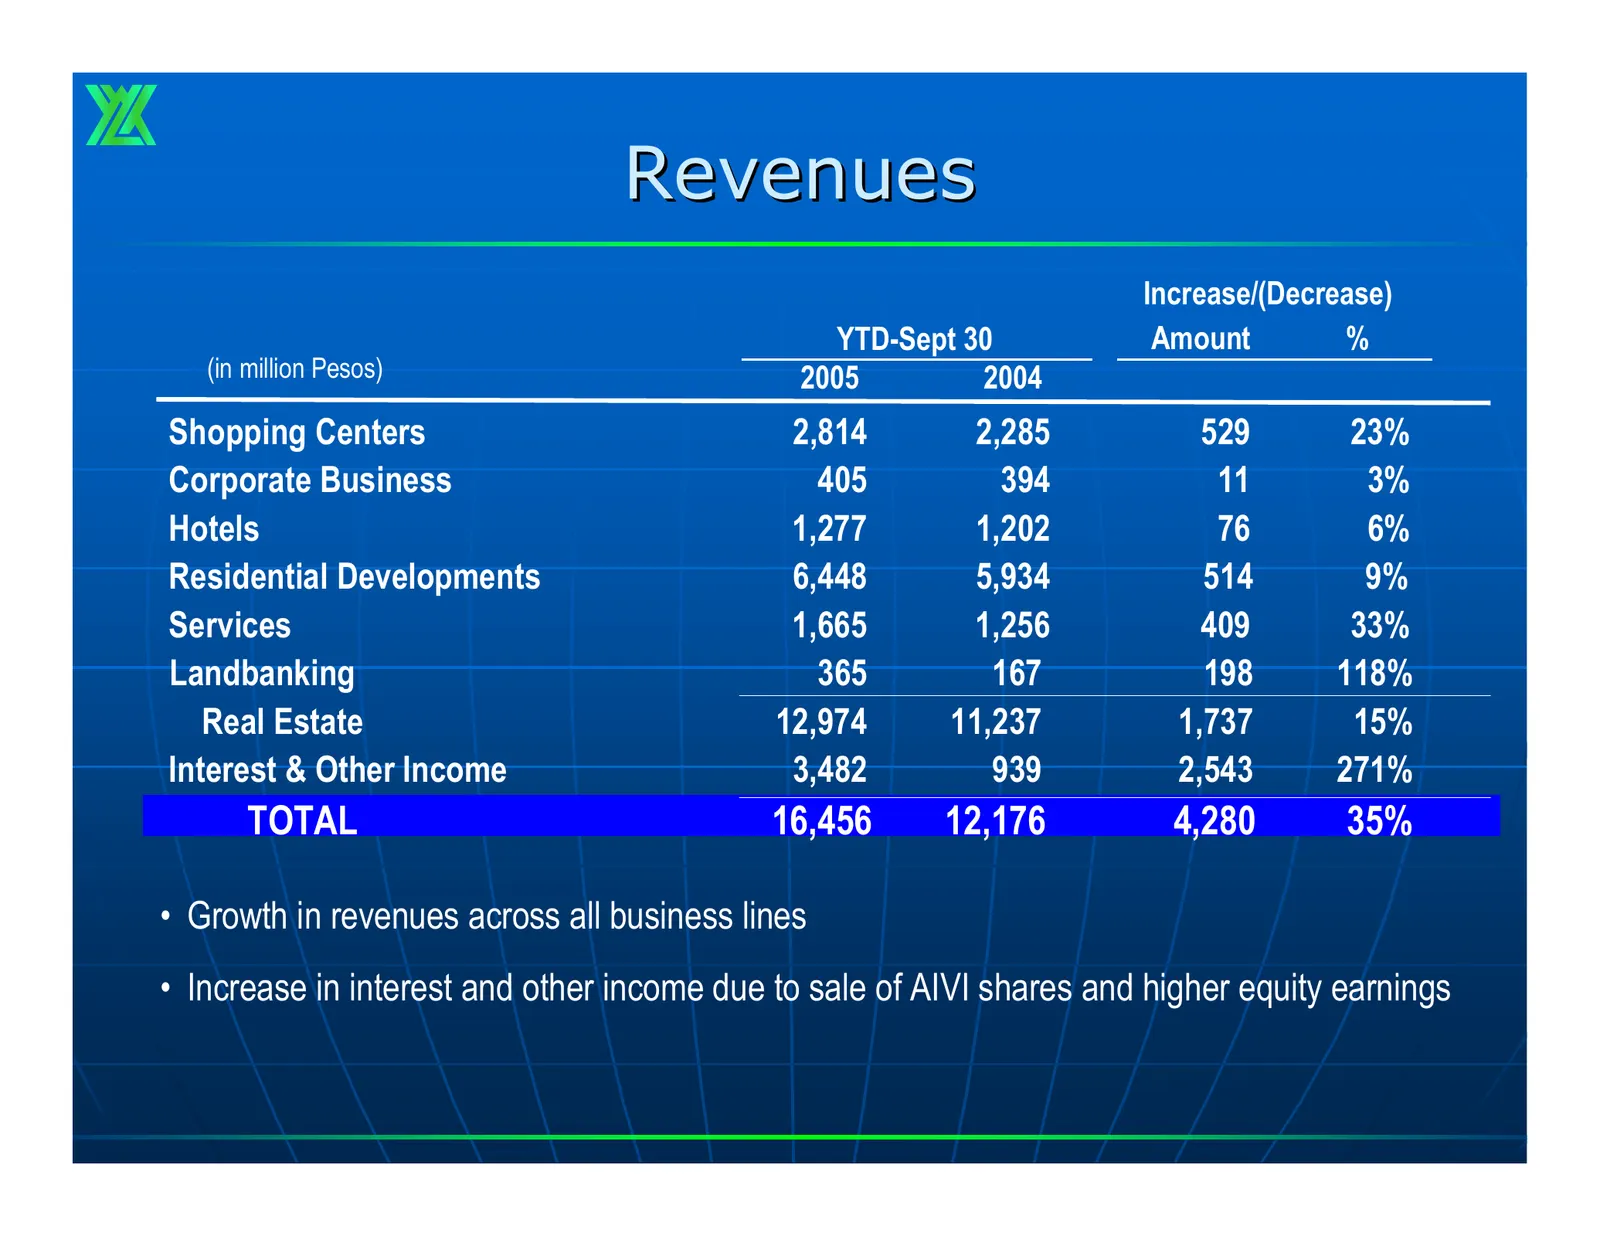
Slide 6: Revenues
Revenues Increase/(Decrease) YTD-Sept 30 Amount % (in million Pesos) 2005 2004 Shopping Centers 2,814 2,285 529 23% Corporate Business 405 394 11 3% Hotels 1,277 1,202 76 6% Residential Developments 6,448 5,934 514 9% Services 1,665 1,256 409 33% Landbanking 365 167 198 118% Real Estate 12,974 11,23
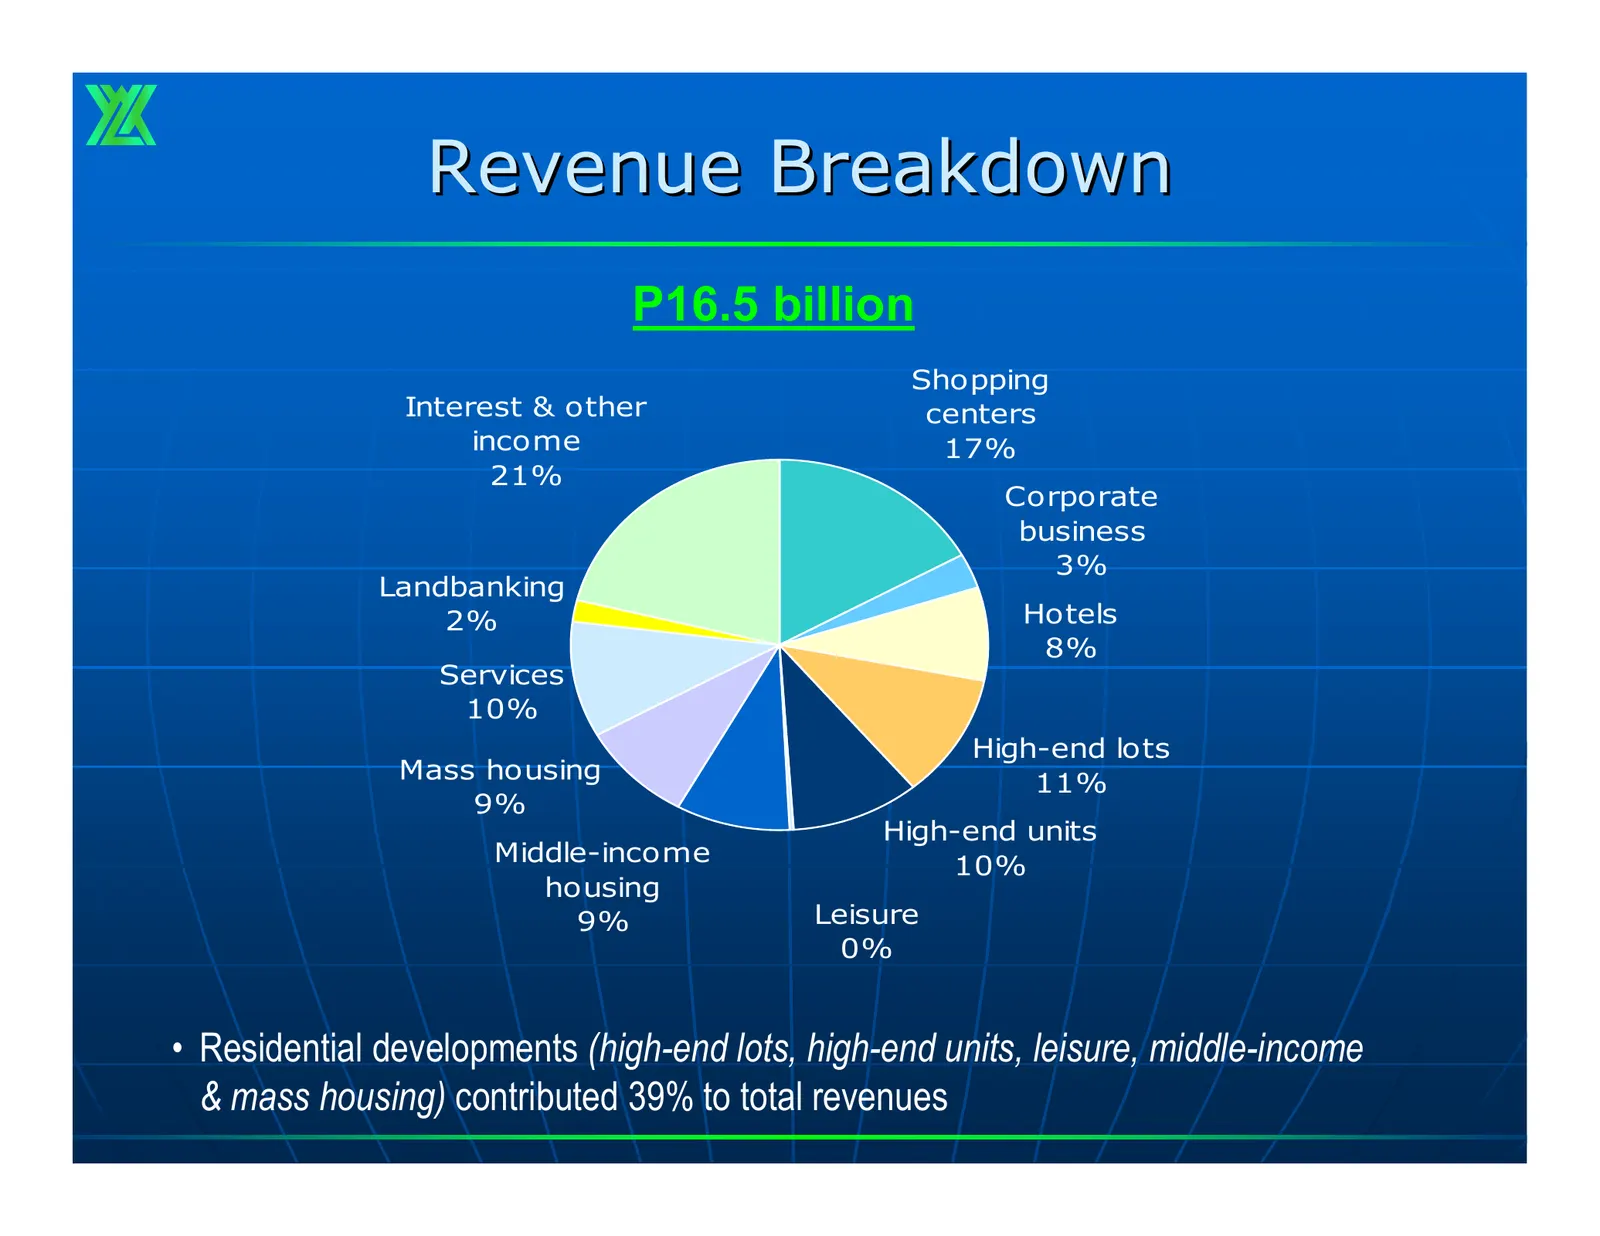
Slide 7: Revenue Breakdown
Revenue Breakdown P16.5 billion Shopping Interest & other centers income 17% 21% Corporate business 3% Landbanking 2% Hotels 8% Services 10% High-end lots Mass housing 11% 9% High-end units Middle-income 10% housing 9% Leisure 0% • Residential developments (high-end lots, high-end units, leisure, mi
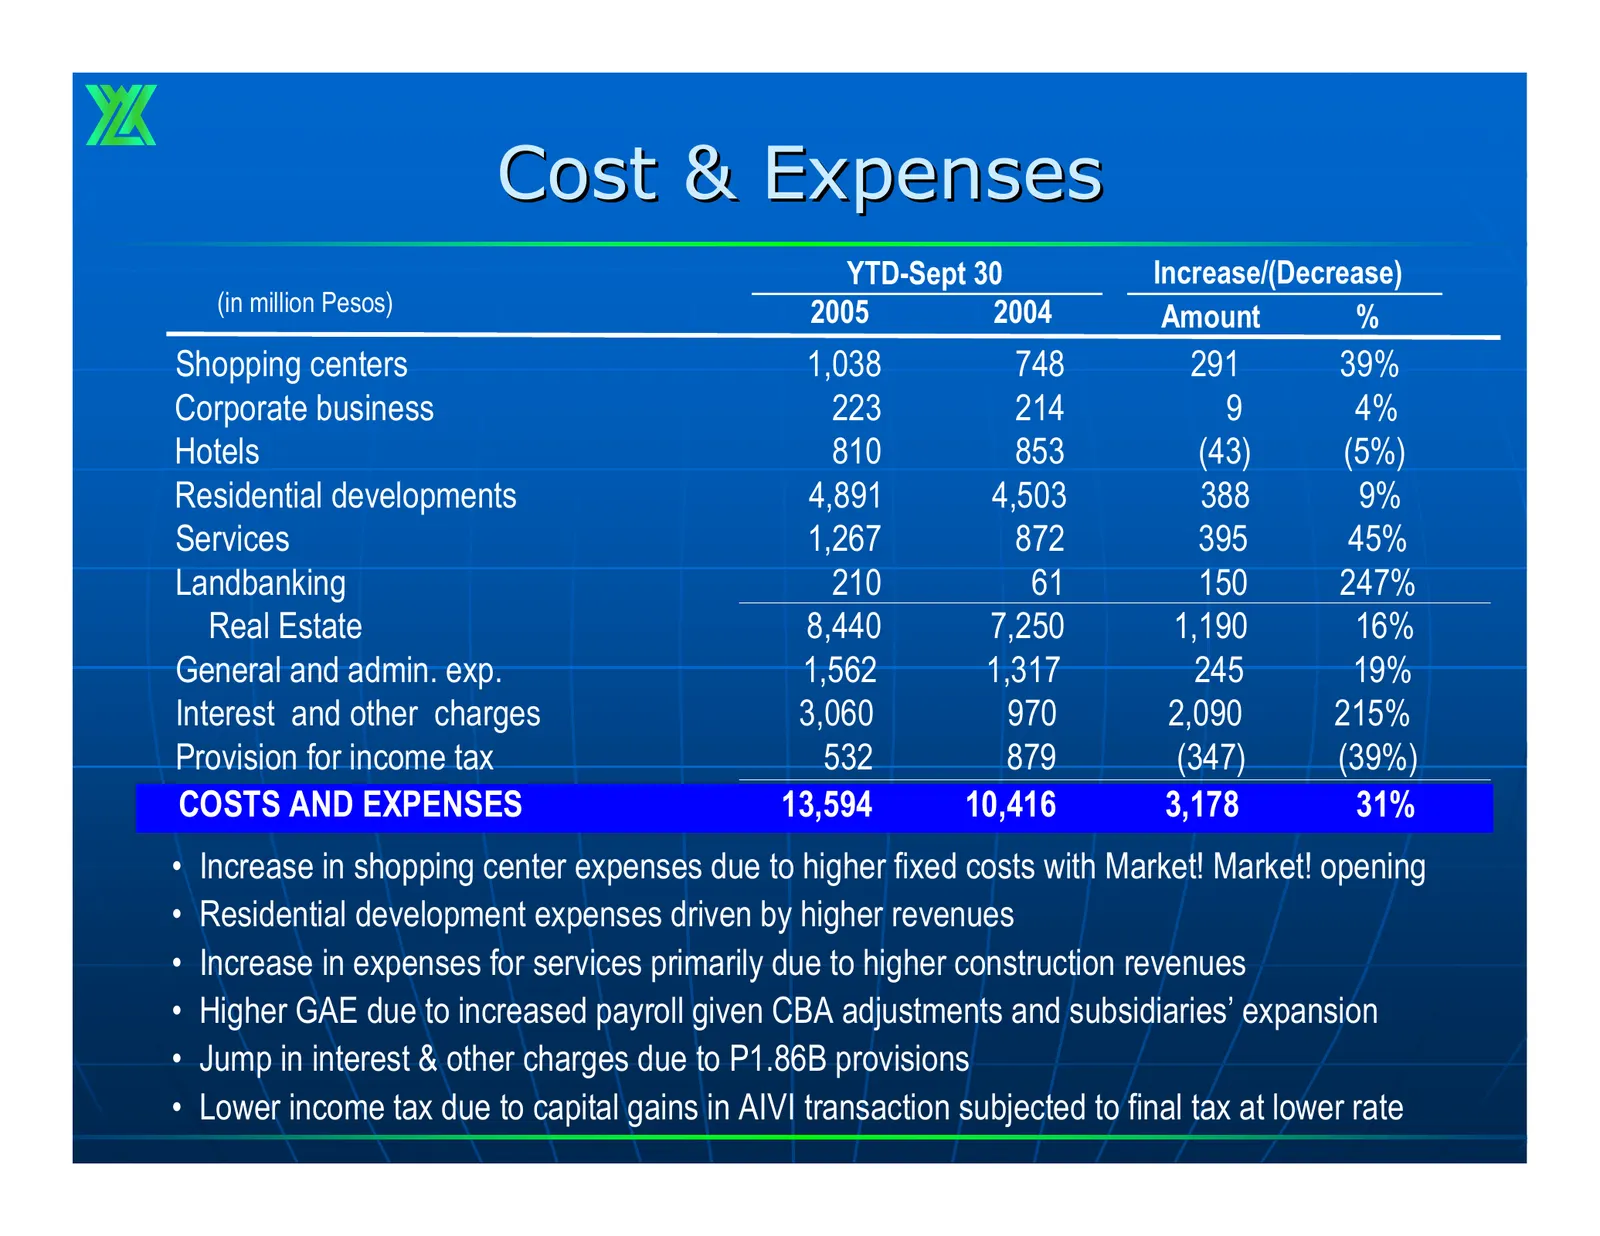
Slide 8: Cost & Expenses
Cost & Expenses YTD-Sept 30 Increase/(Decrease) (in million Pesos) 2005 2004 Amount % Shopping centers 1,038 748 291 39% Corporate business 223 214 9 4% Hotels 810 853 (43) (5%) Residential developments 4,891 4,503 388 9% Services 1,267 872 395 45% Landbanking 210 61 150 247% Real Estate 8,440 7,250
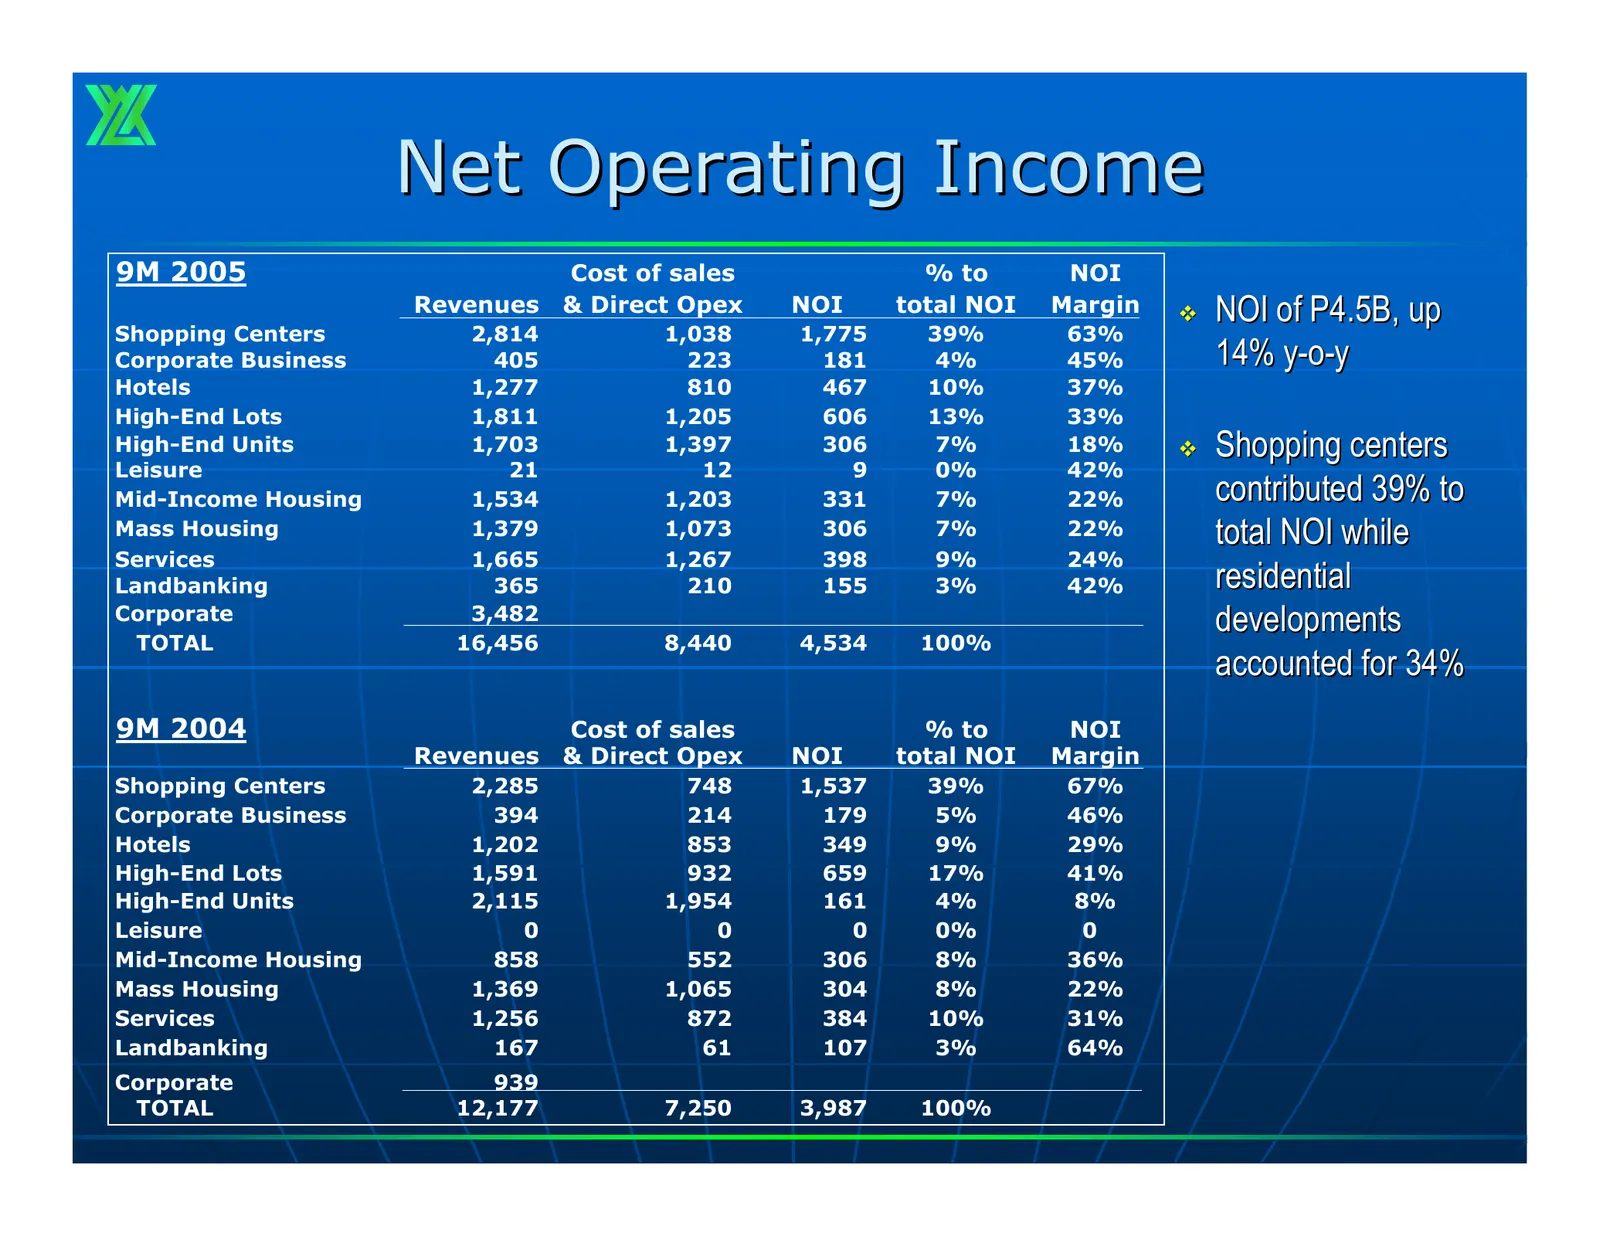
Slide 9: Net Operating Income
Net Operating Income 9M 2005 Cost of sales % to NOI Revenues & Direct Opex NOI total NOI Margin NOI of P4.5B, up Shopping Centers 2,814 1,038 1,775 39% 63% Corporate Business 405 223 181 4% 45% 14% y-o-y Hotels 1,277 810 467 10% 37% High-End Lots 1,811 1,205 606 13% 33% High-End Units 1,703 1,397
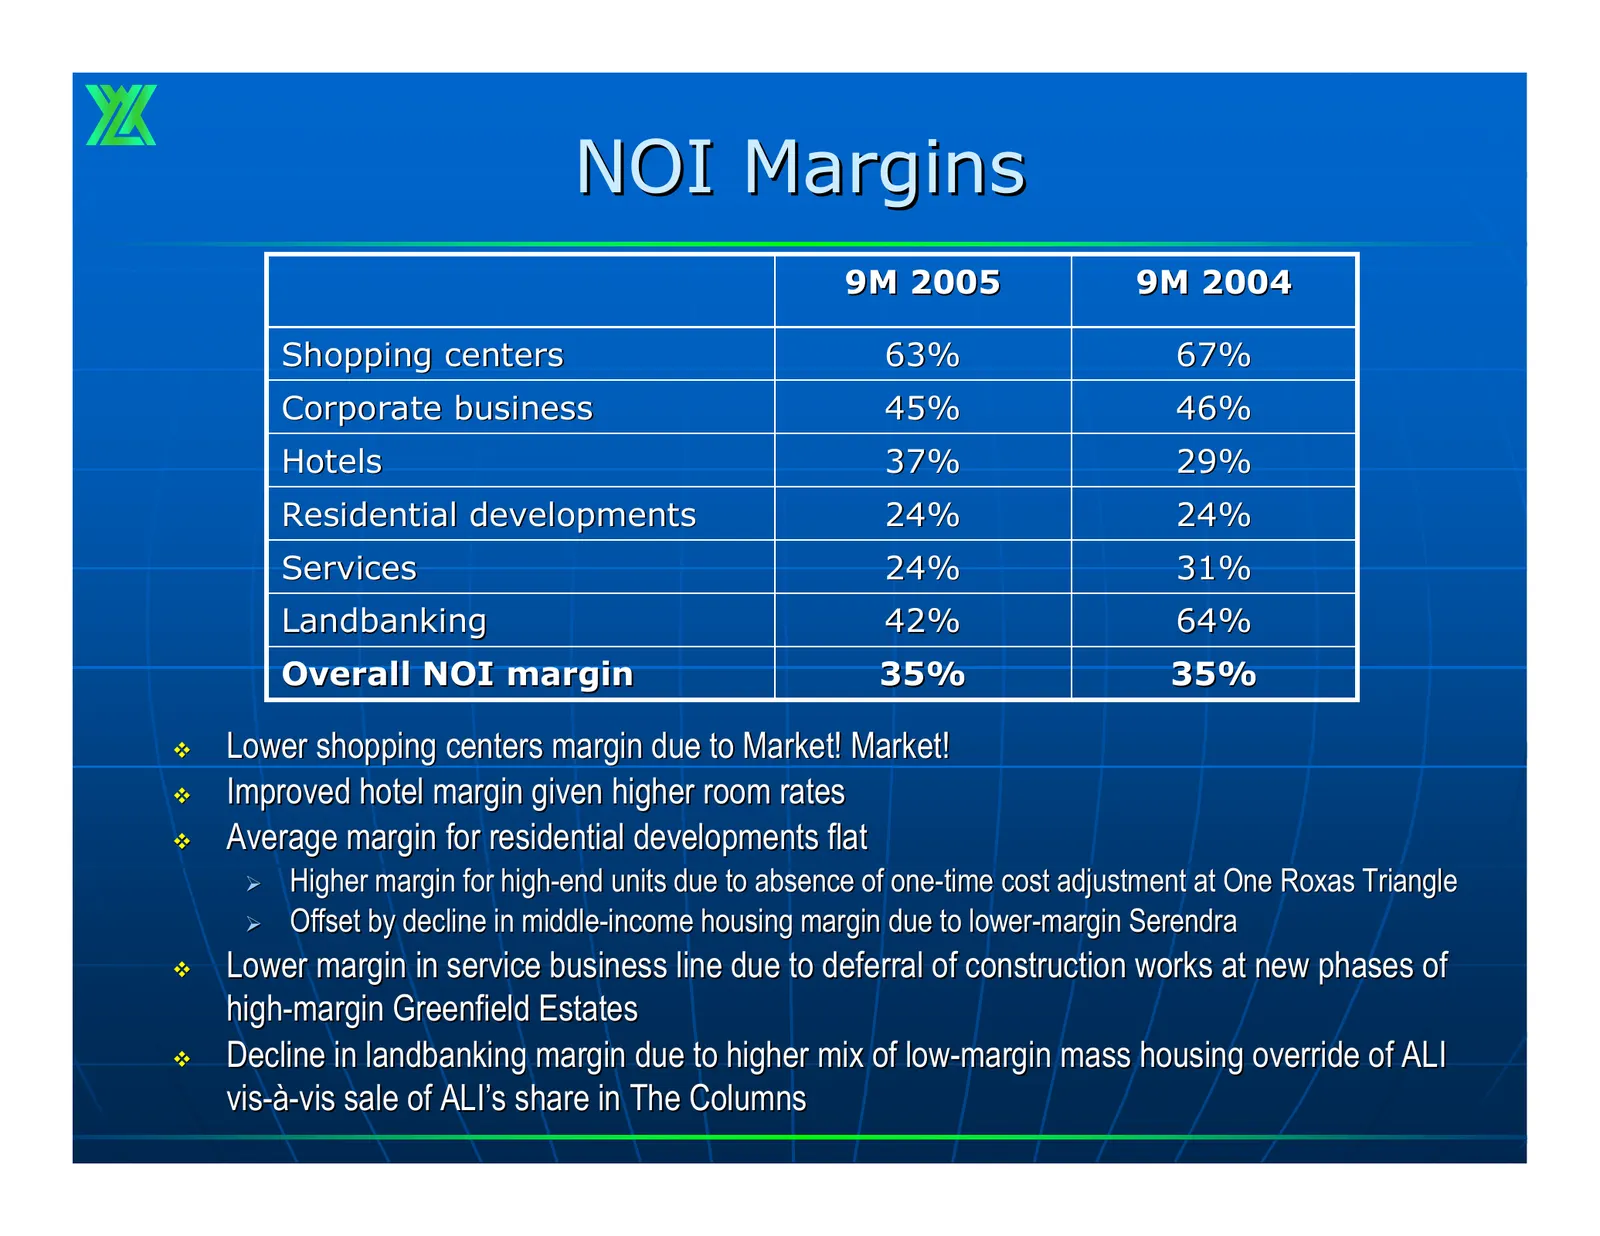
Slide 10: NOI Margins
NOI Margins 9M 2005 9M 2004 Shopping centers 63% 67% Corporate business 45% 46% Hotels 37% 29% Residential developments 24% 24% Services 24% 31% Landbanking 42% 64% Overall NOI margin 35% 35% Lower shopping centers margin due to Market! Market! Improved hotel margin given higher room rates Ave
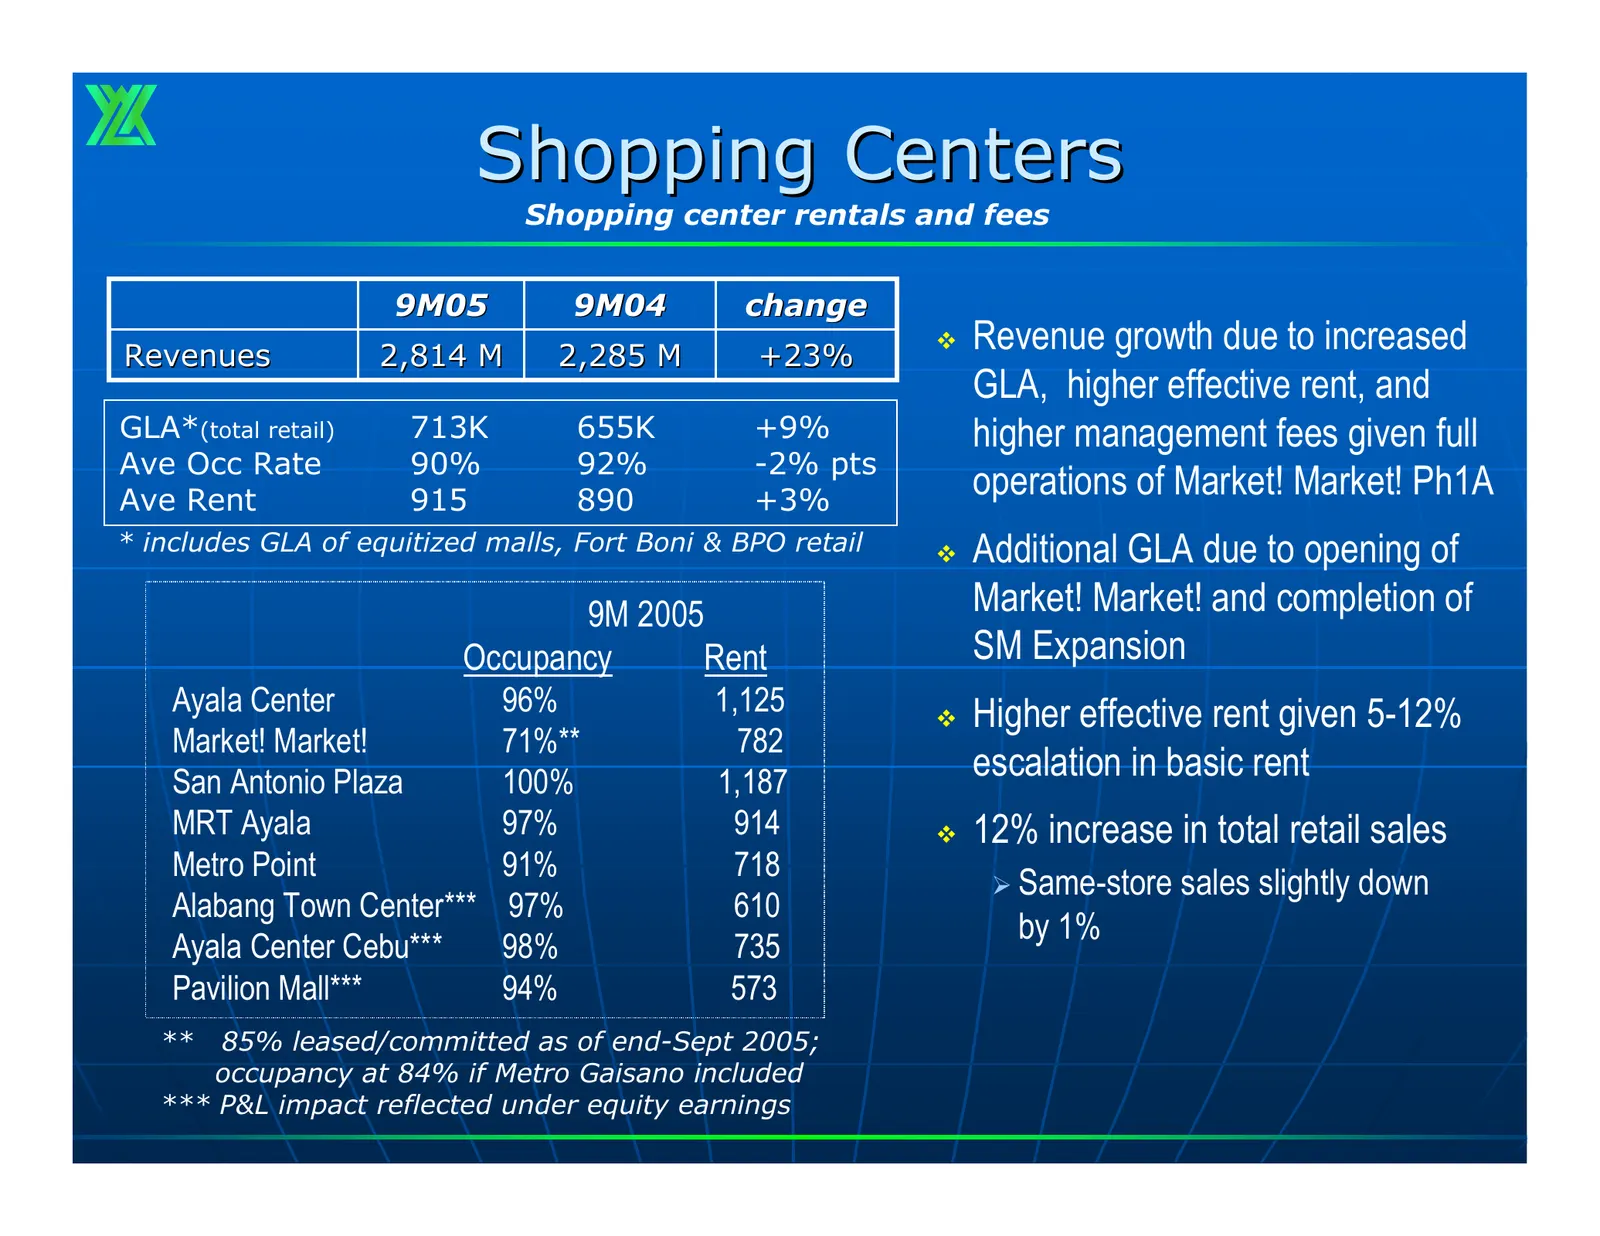
Slide 11: Shopping Centers
Shopping Centers Shopping center rentals and fees 9M05 9M04 change Revenues 2,814 M 2,285 M +23% Revenue growth due to increased GLA, higher effective rent, and GLA*(total retail) 713K 655K +9% higher management fees given full Ave Occ Rate 90% 92% -2% pts Ave Rent 915 890 +3% operations of Market
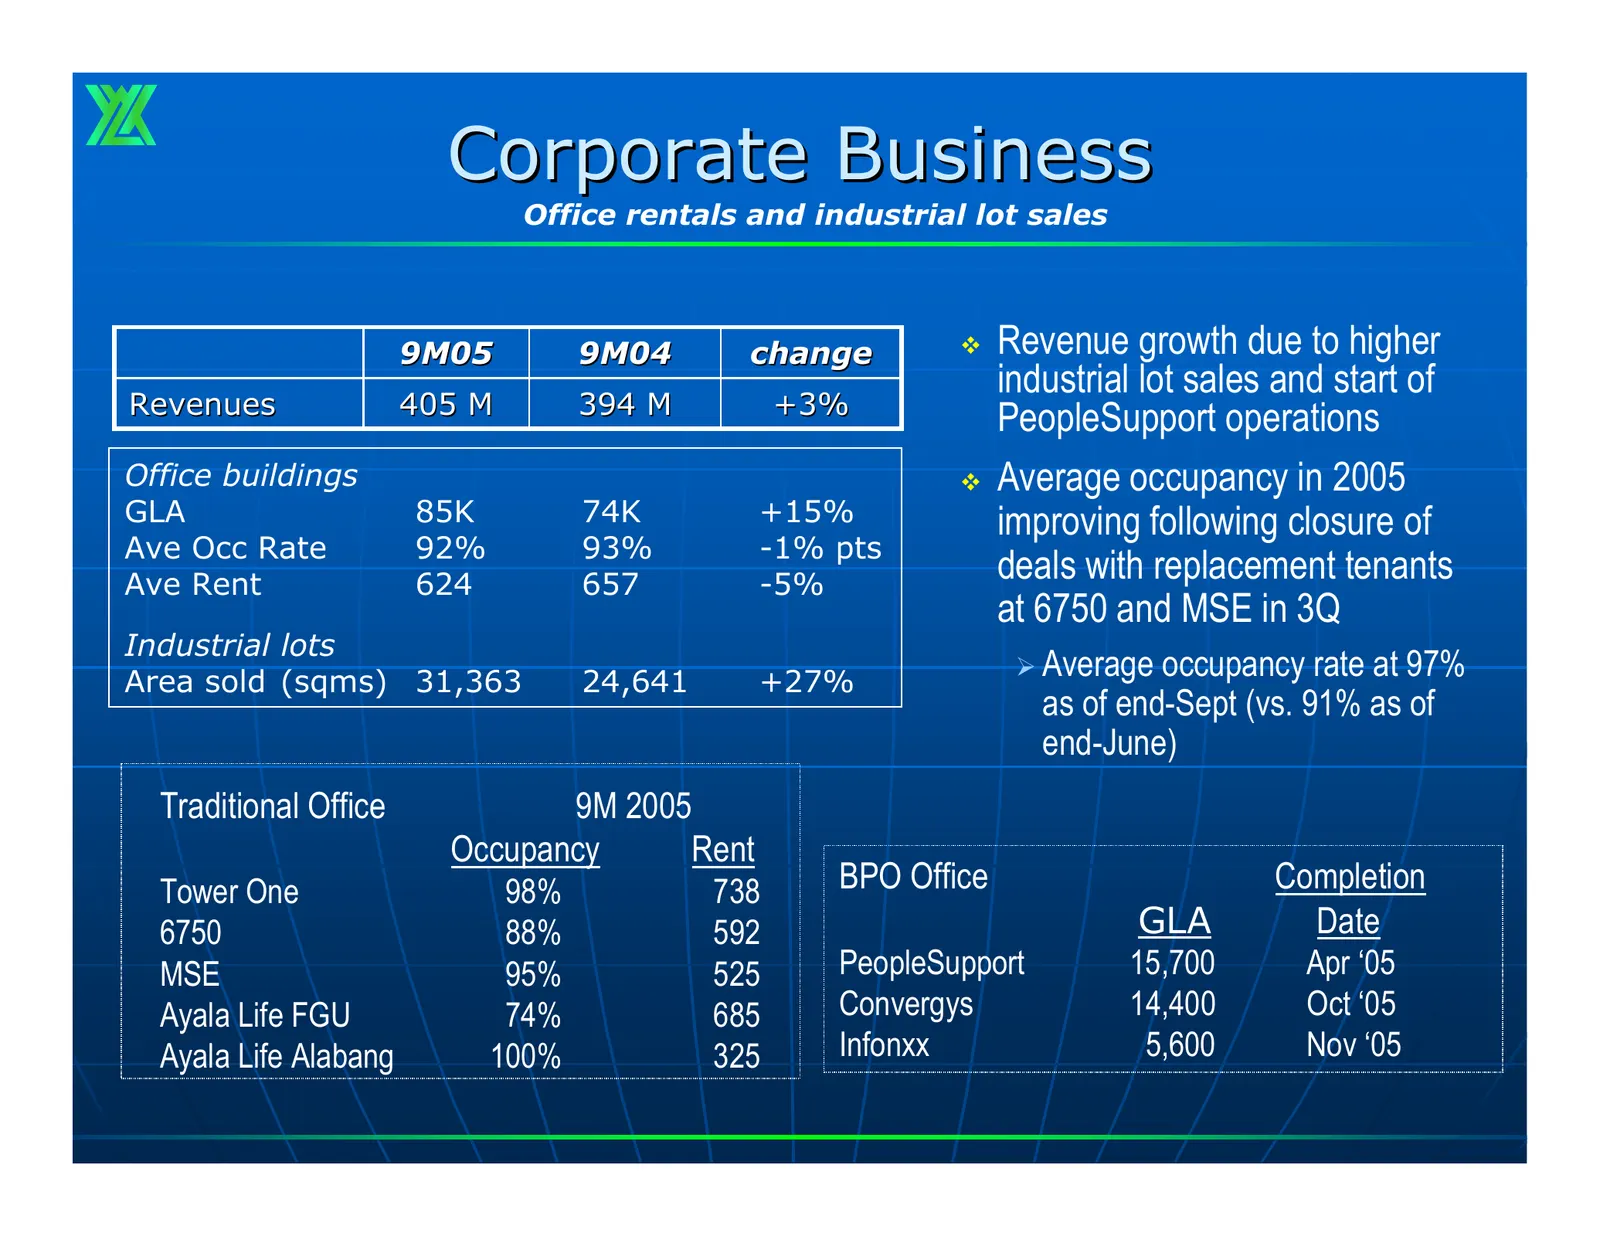
Slide 12: Corporate Business
Corporate Business Office rentals and industrial lot sales 9M05 9M04 change Revenue growth due to higher industrial lot sales and start of Revenues 405 M 394 M +3% PeopleSupport operations Office buildings Average occupancy in 2005 GLA 85K 74K +15% improving following closure of Ave Occ Rate 92%
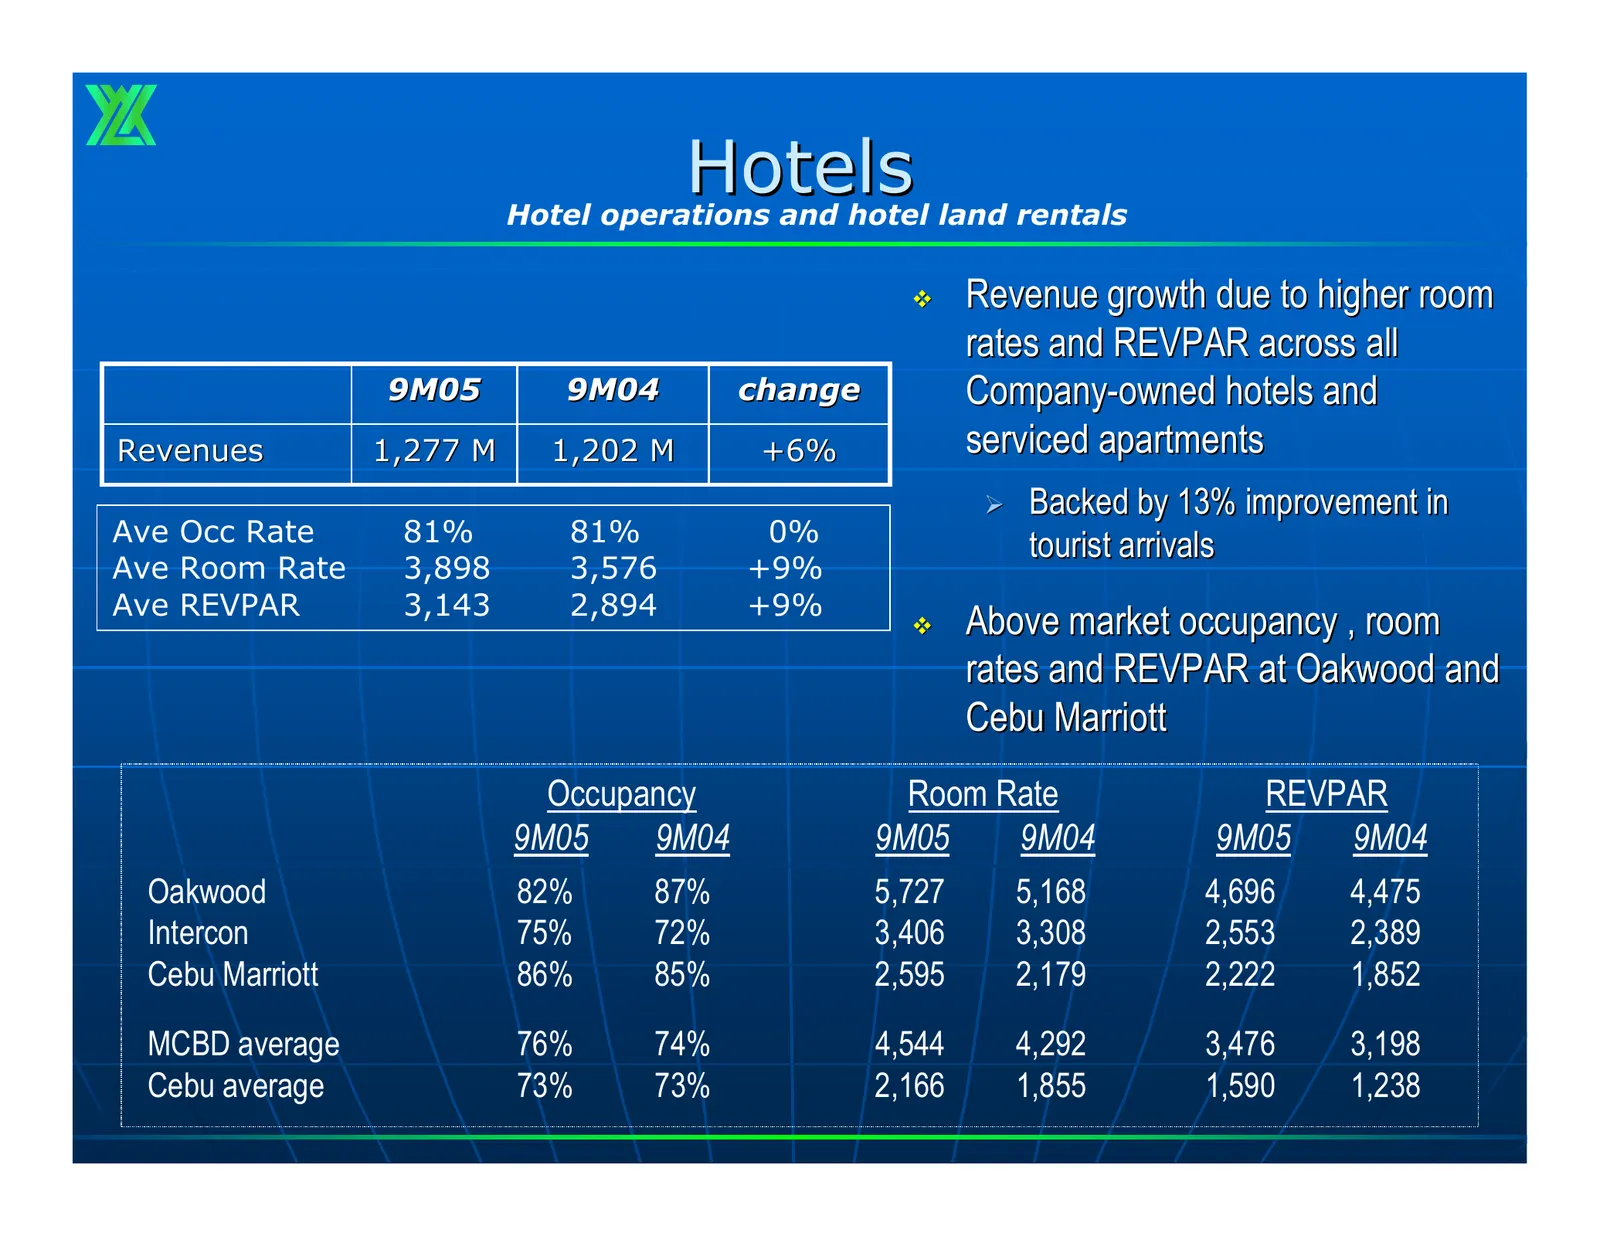
Slide 13: Hotels
Hotels Hotel operations and hotel land rentals Revenue growth due to higher room rates and REVPAR across all 9M05 9M04 change Company-owned hotels and Revenues 1,277 M 1,202 M +6% serviced apartments ¾ Backed by 13% improvement in Ave Occ Rate 81% 81% 0% tourist arrivals Ave Room Rate 3,898 3,576
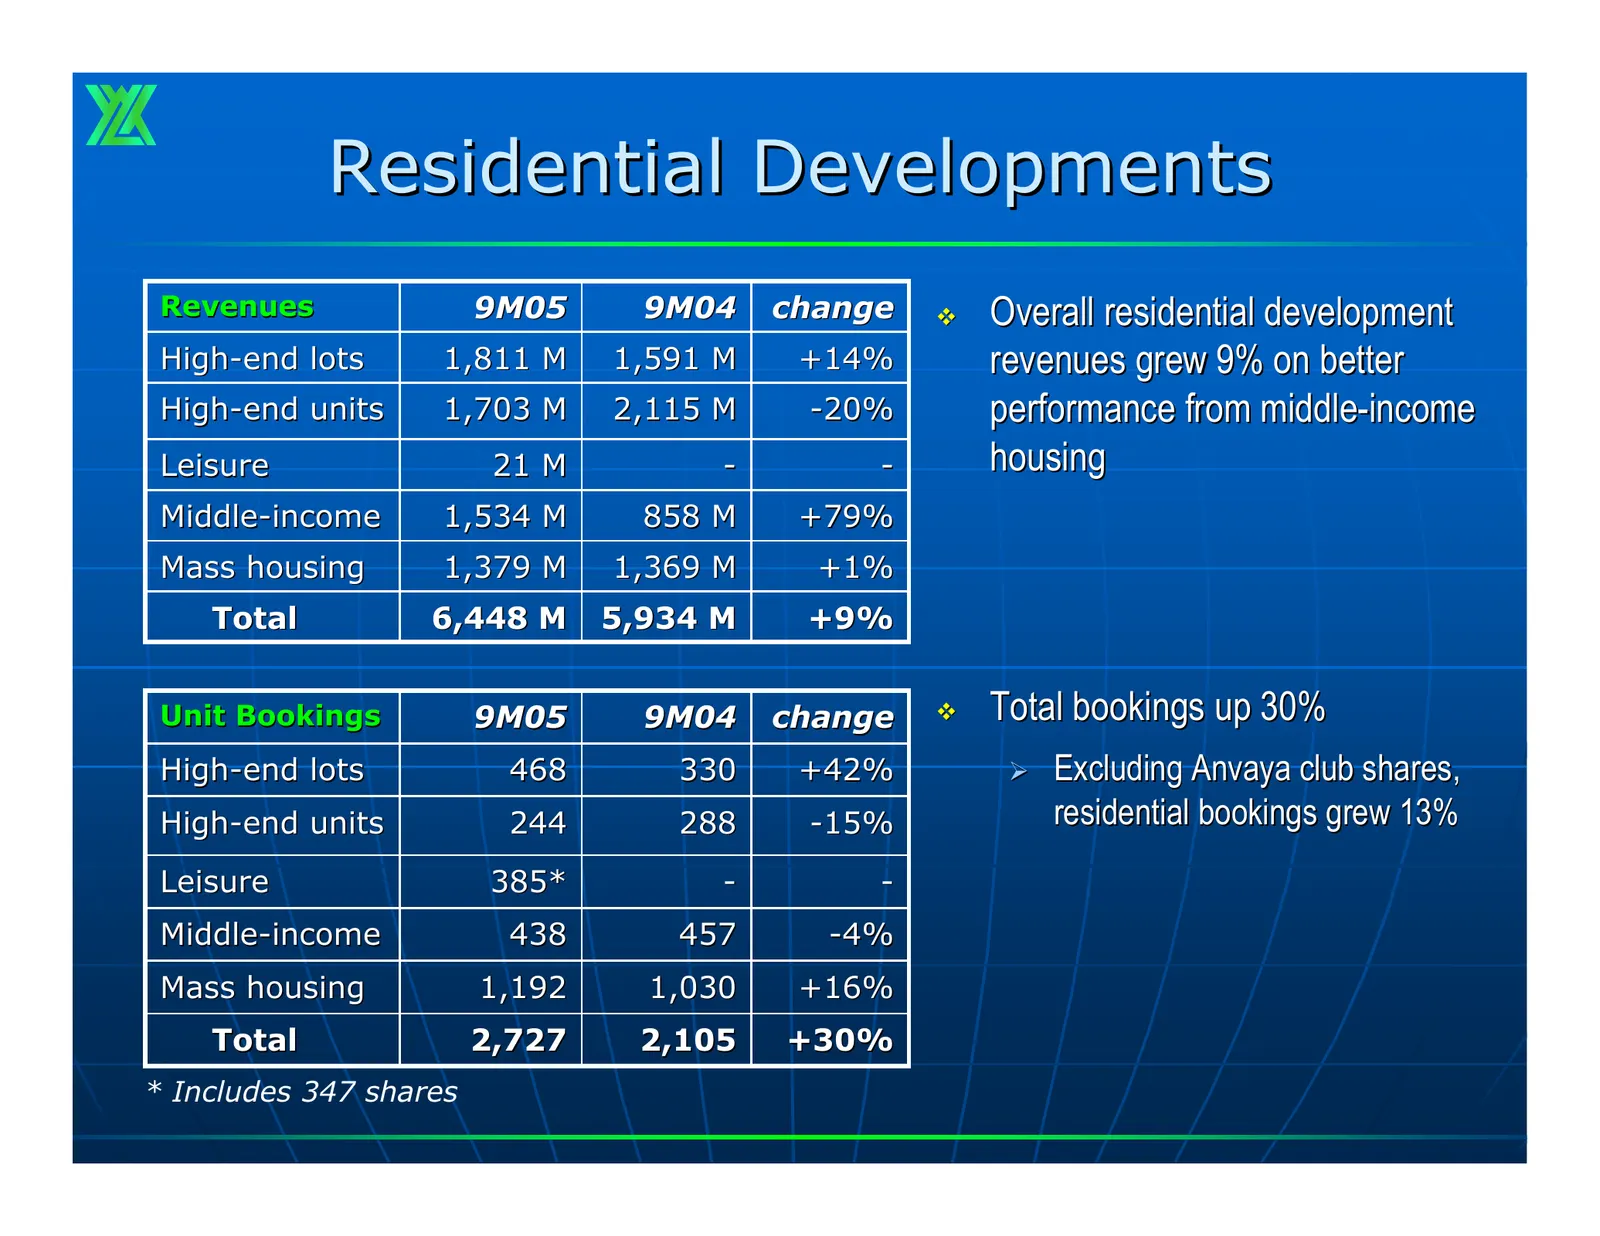
Slide 14: Residential Developments
Residential Developments Revenues 9M05 9M04 change Overall residential development High-end lots 1,811 M 1,591 M +14% revenues grew 9% on better High-end units 1,703 M 2,115 M -20% performance from middle-income Leisure 21 M - - housing Middle-income 1,534 M 858 M +79% Mass housing 1,379 M 1,369 M
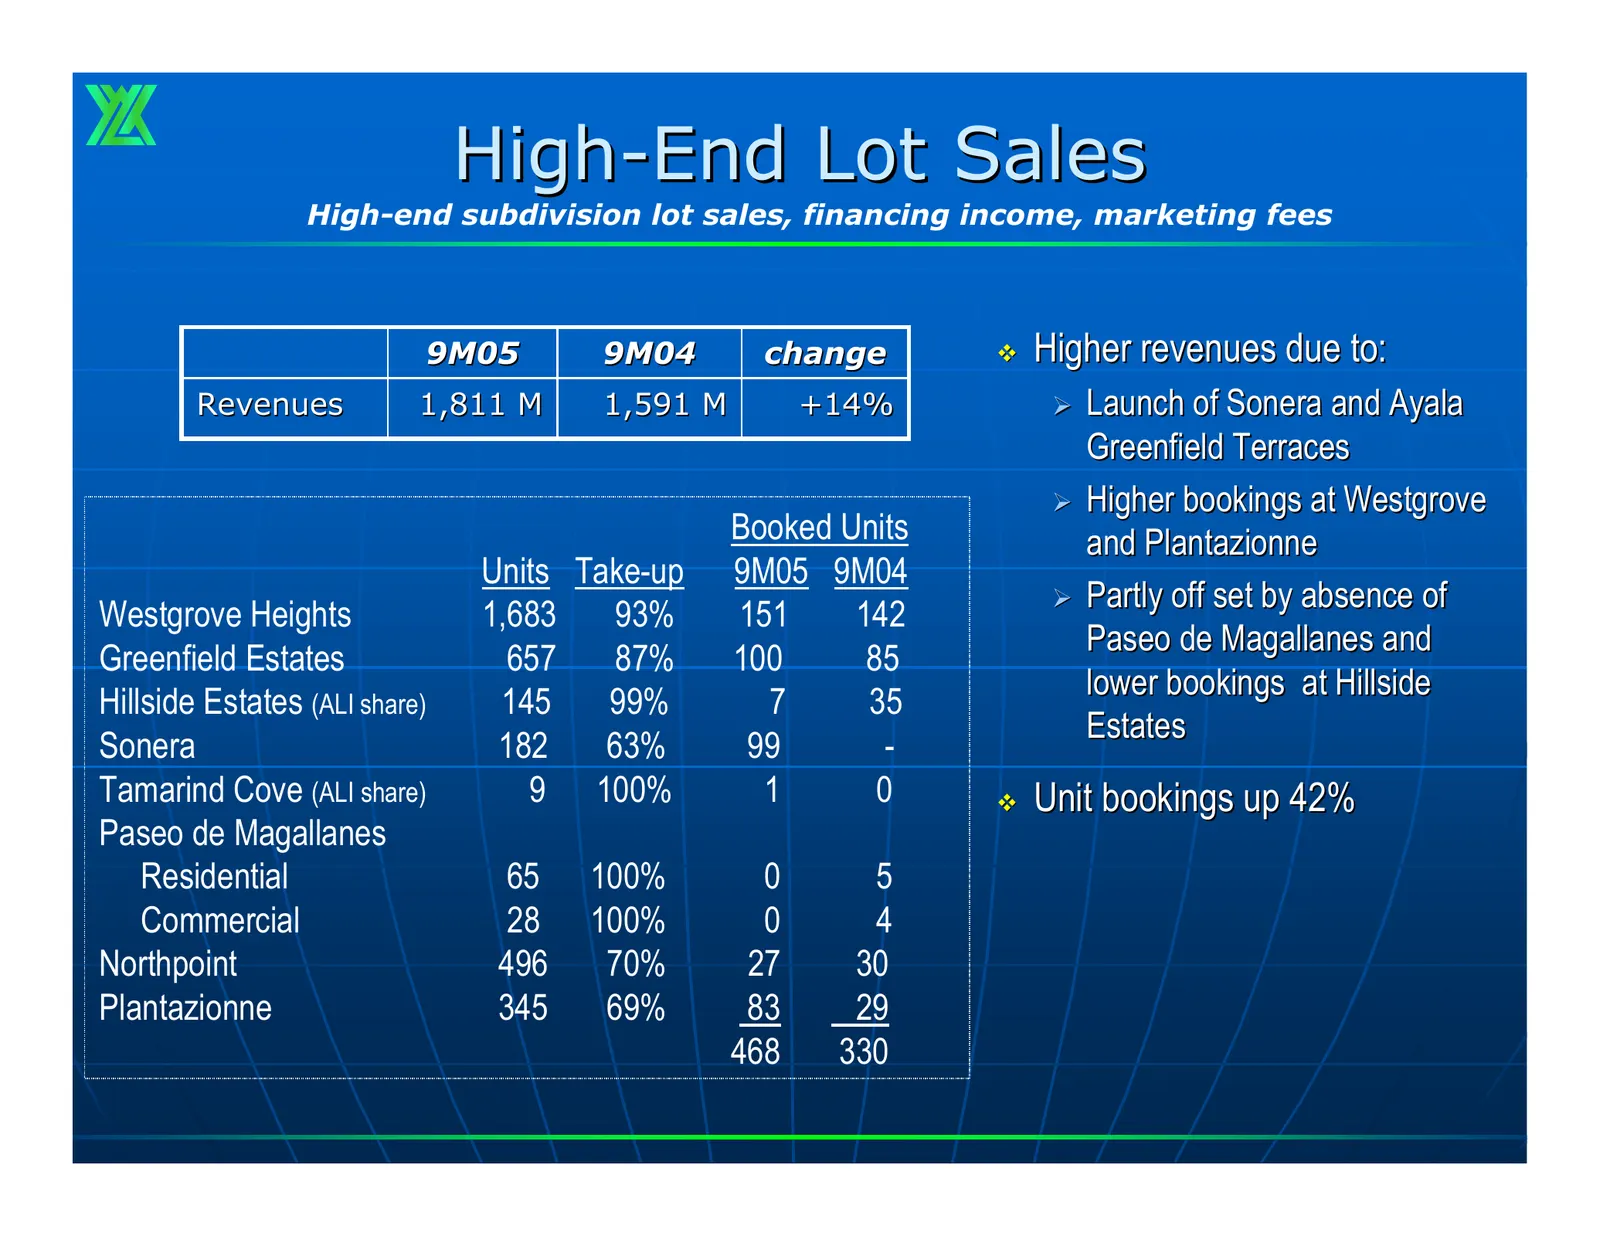
Slide 15: High-End Lot Sales
High-End Lot Sales High-end subdivision lot sales, financing income, marketing fees 9M05 9M04 change Higher revenues due to: Revenues 1,811 M 1,591 M +14% ¾ Launch of Sonera and Ayala Greenfield Terraces ¾ Higher bookings at Westgrove Booked Units and Plantazionne Units Take-up 9M05 9M04 ¾ Partly
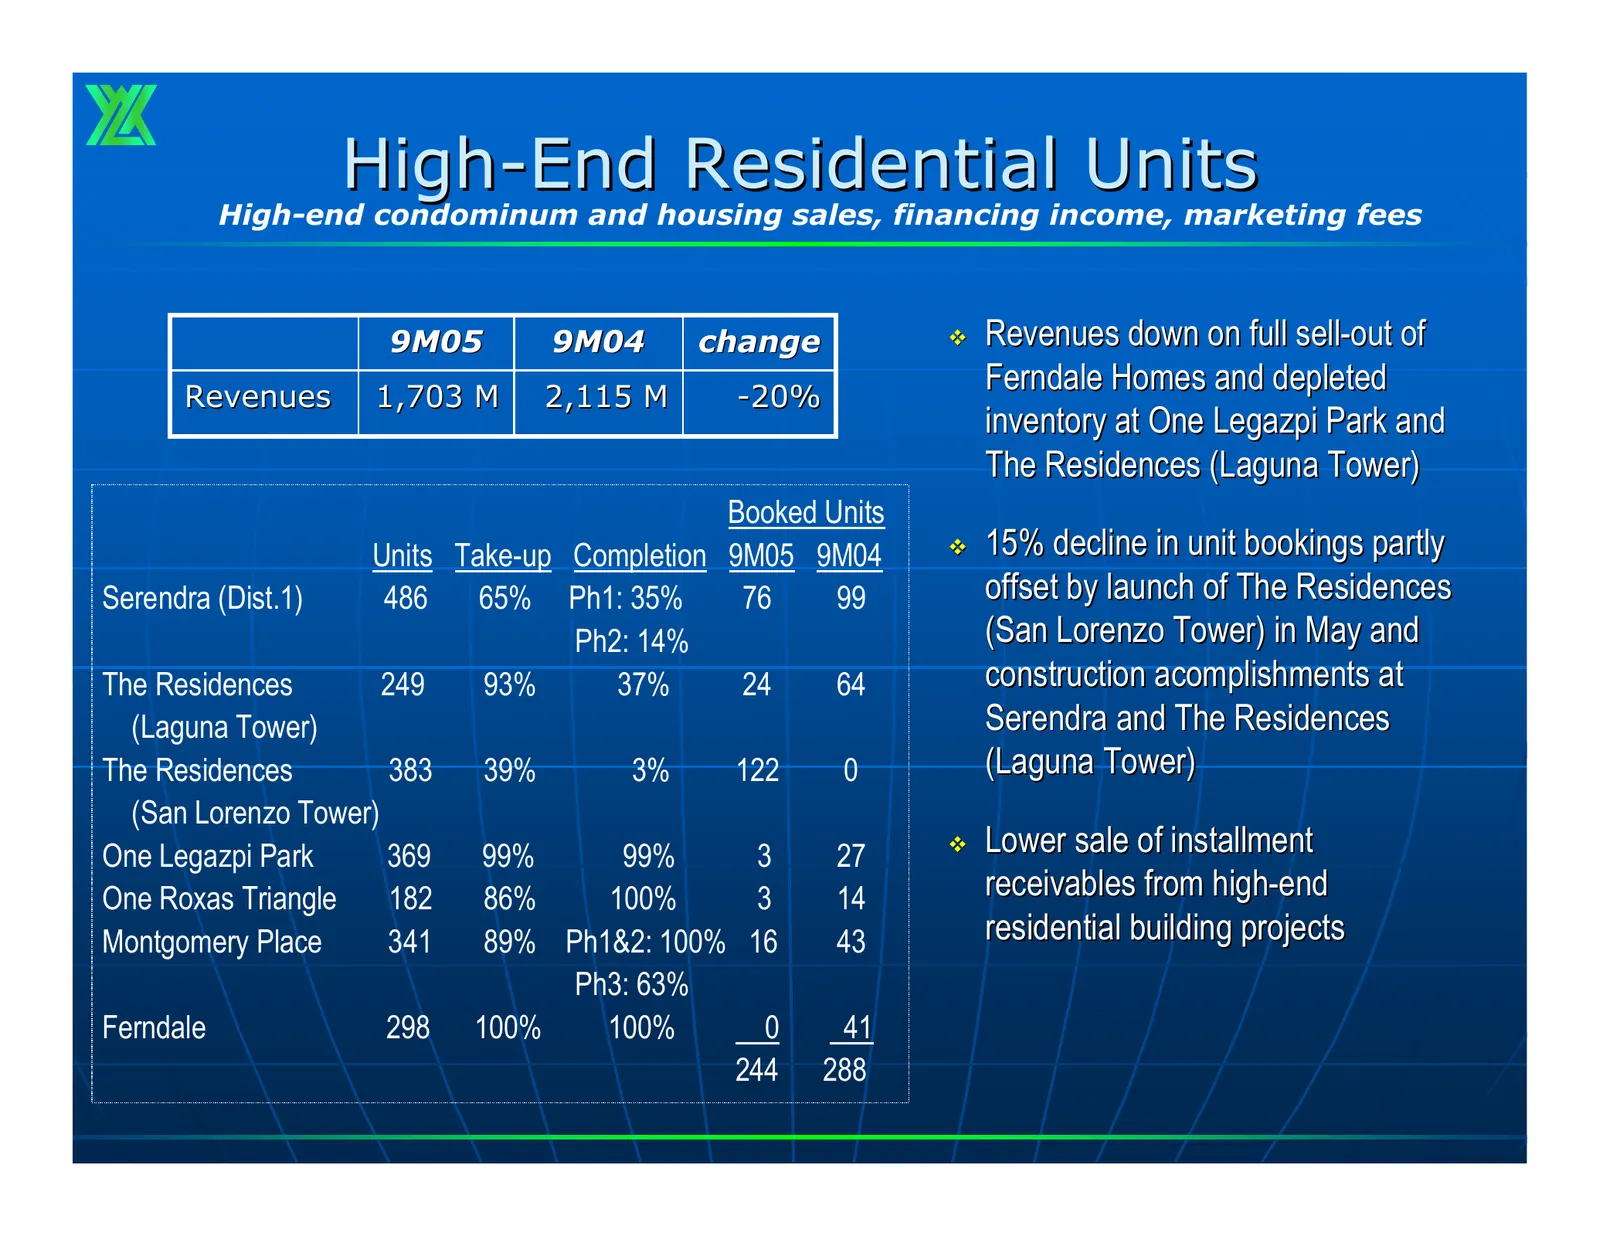
Slide 16: High-End Residential Units
High-End Residential Units High-end condominum and housing sales, financing income, marketing fees 9M05 9M04 change Revenues down on full sell-out of Ferndale Homes and depleted Revenues 1,703 M 2,115 M -20% inventory at One Legazpi Park and The Residences (Laguna Tower) Booked Units Units Take-up
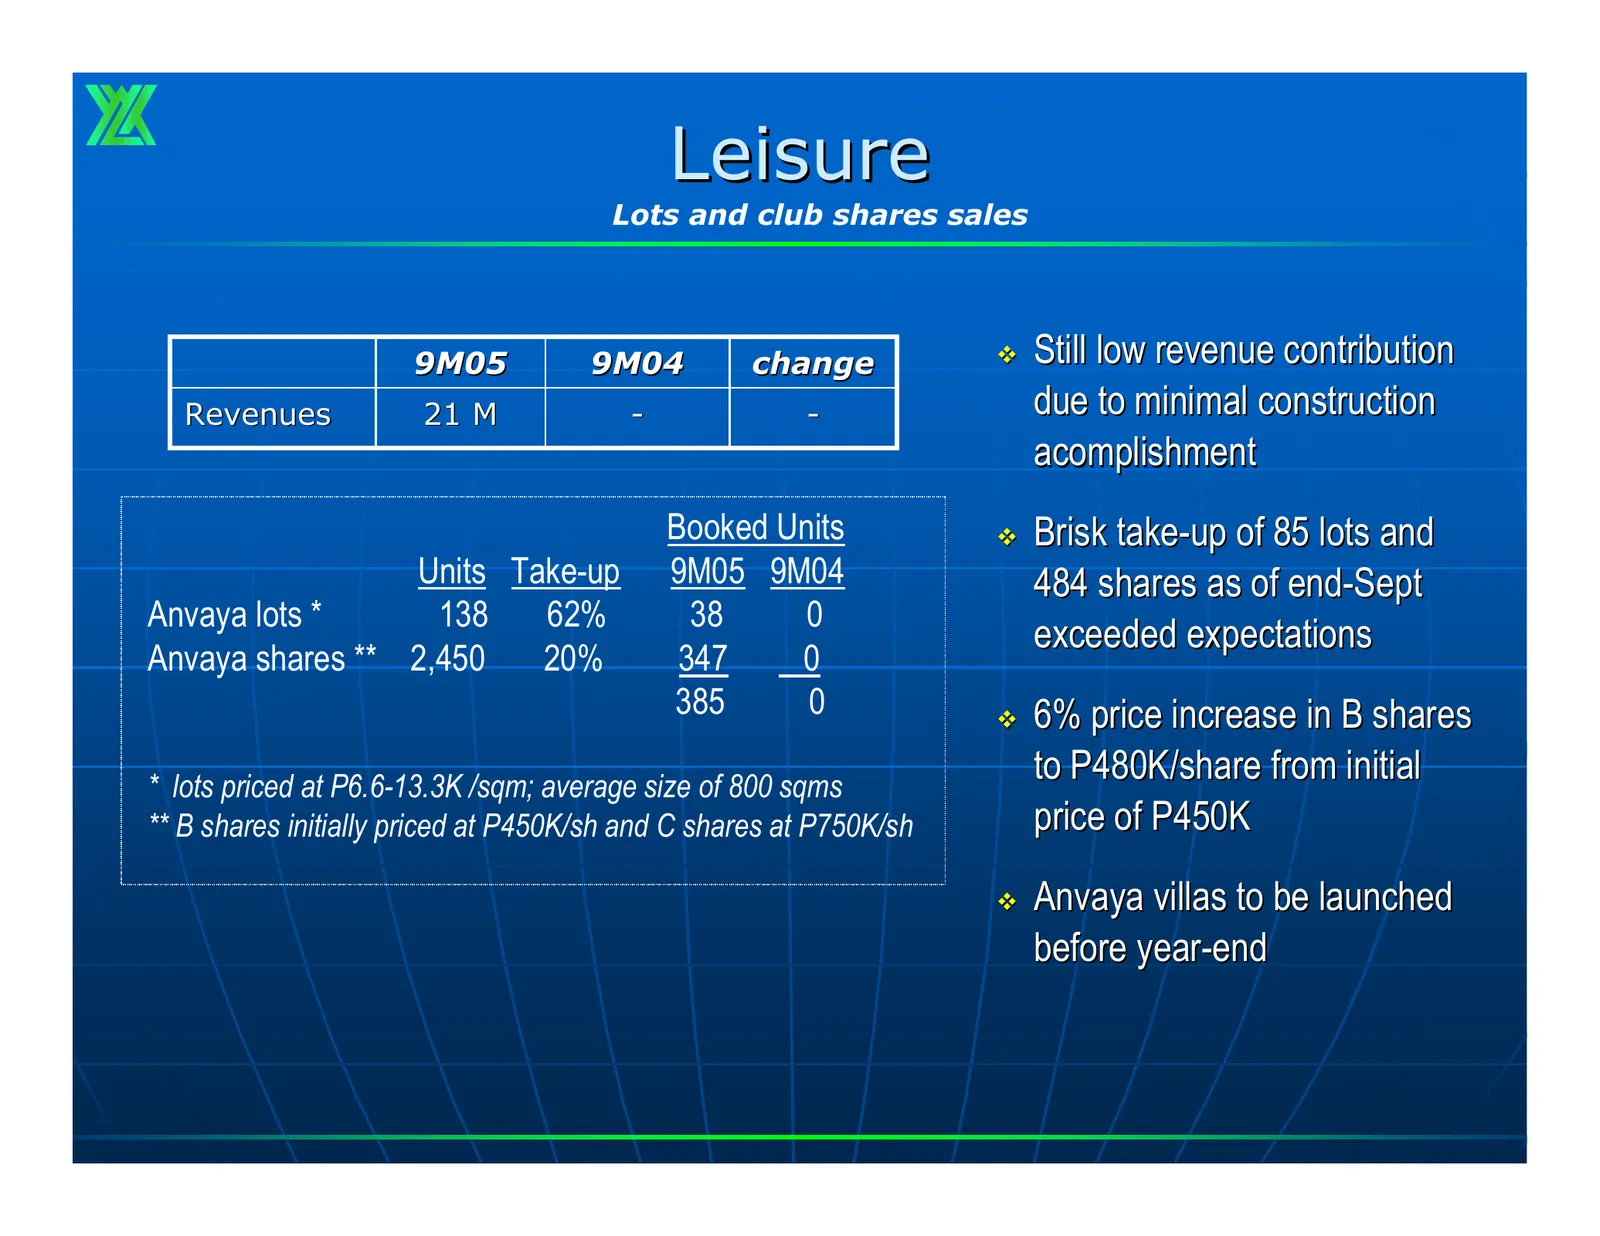
Slide 17: Leisure
Leisure Lots and club shares sales 9M05 9M04 change Still low revenue contribution Revenues 21 M - - due to minimal construction acomplishment Booked Units Brisk take-up of 85 lots and Units Take-up 9M05 9M04 484 shares as of end-Sept Anvaya lots * 138 62% 38 0 exceeded expectations Anvaya share
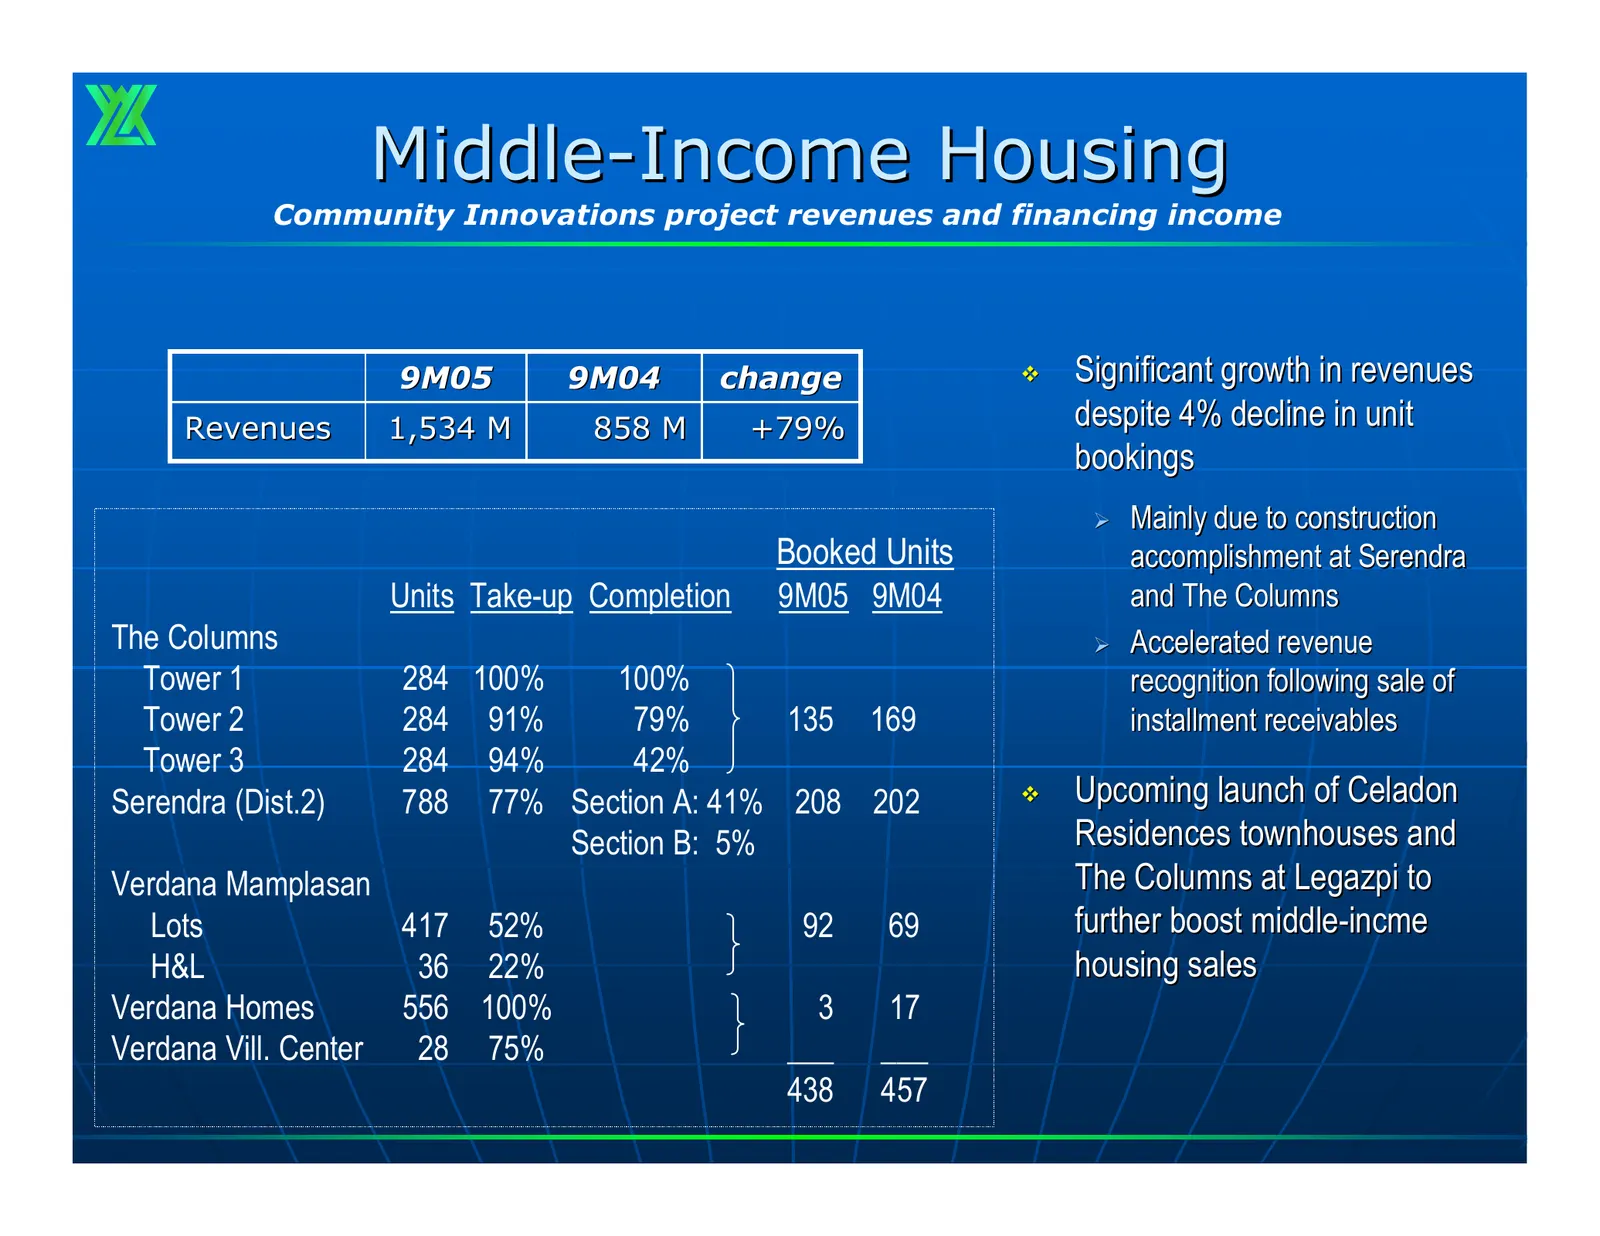
Slide 18: Middle-Income Housing
Middle-Income Housing Community Innovations project revenues and financing income 9M05 9M04 change Significant growth in revenues Revenues 1,534 M 858 M +79% despite 4% decline in unit bookings ¾ Mainly due to construction Booked Units accomplishment at Serendra Units Take-up Completion 9M05 9M04
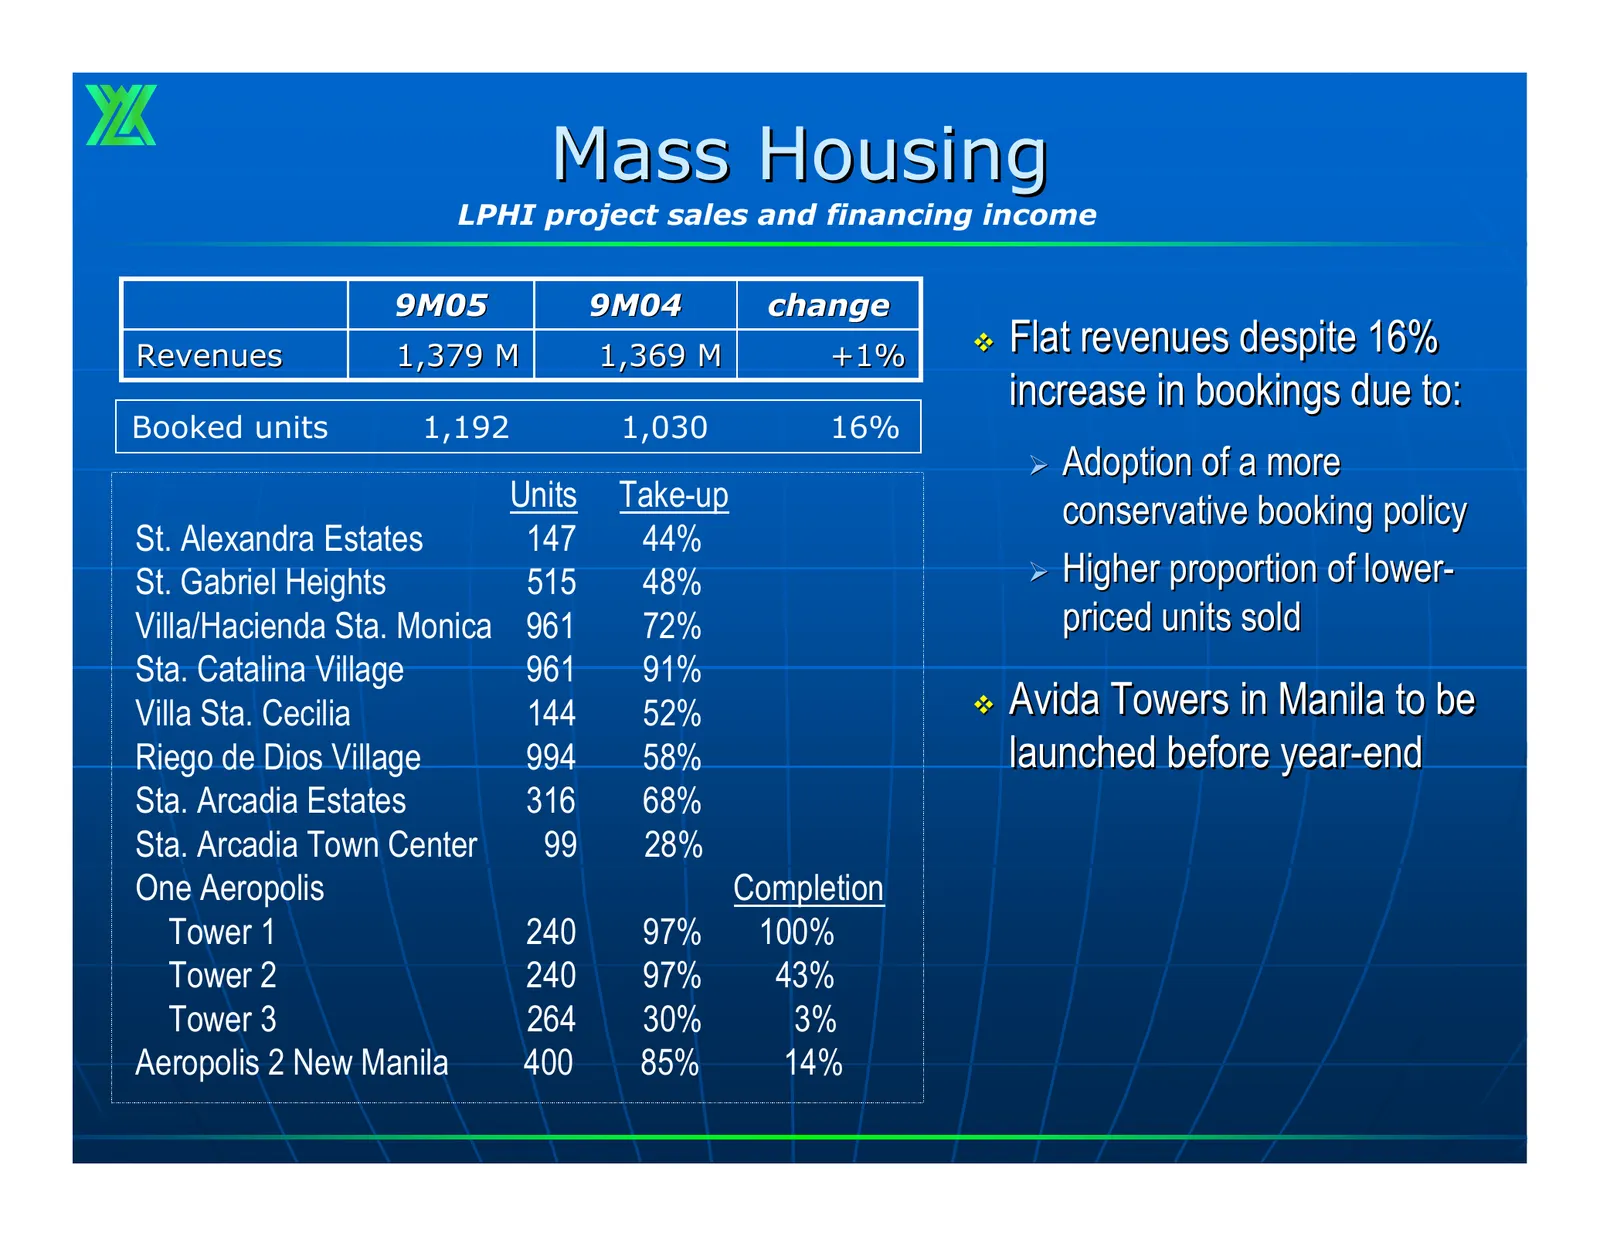
Slide 19: Mass Housing
Mass Housing LPHI project sales and financing income 9M05 9M04 change Revenues 1,379 M 1,369 M +1% Flat revenues despite 16% increase in bookings due to: Booked units 1,192 1,030 16% ¾ Adoption of a more Units Take-up conservative booking policy St. Alexandra Estates 147 44% St. Gabriel Heights 51
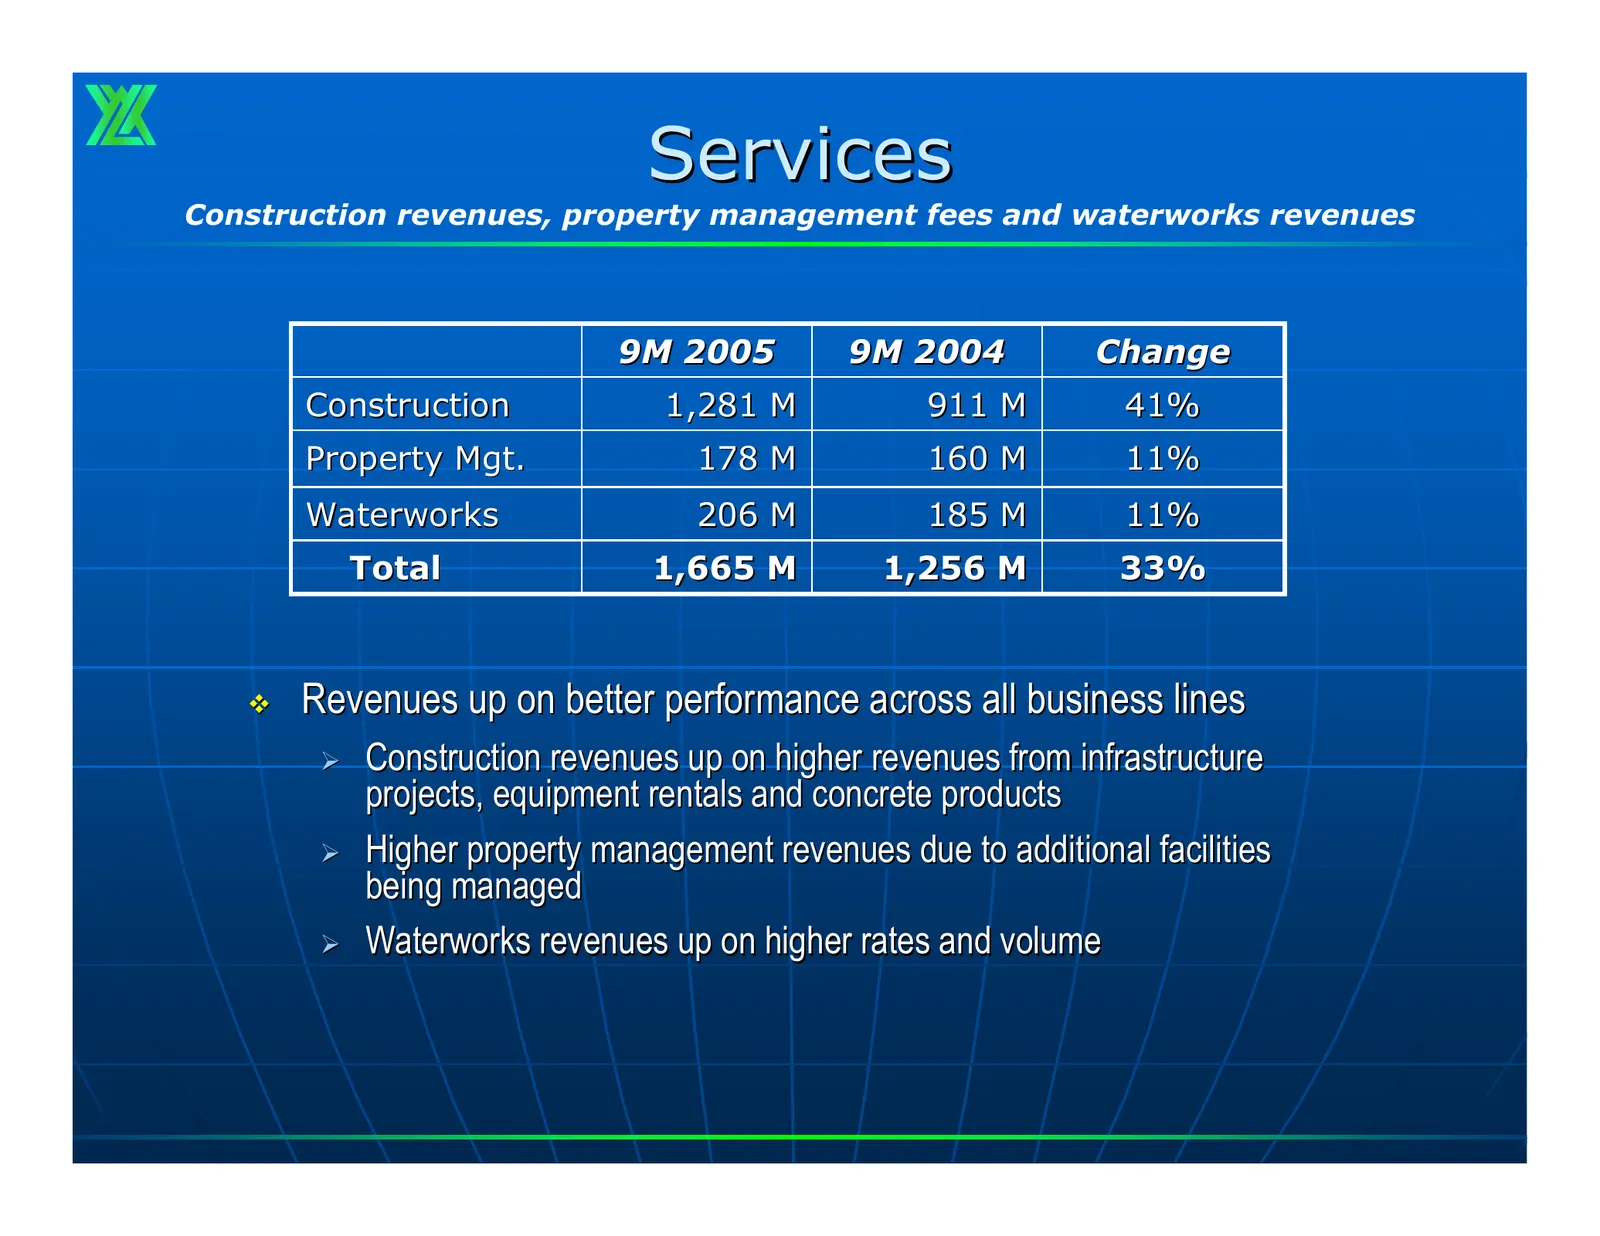
Slide 20: Services
Services Construction revenues, property management fees and waterworks revenues 9M 2005 9M 2004 Change Construction 1,281 M 911 M 41% Property Mgt. 178 M 160 M 11% Waterworks 206 M 185 M 11% Total 1,665 M 1,256 M 33% Revenues up on better performance across all business lines ¾ Construction reven
Slide 21: Landbanking
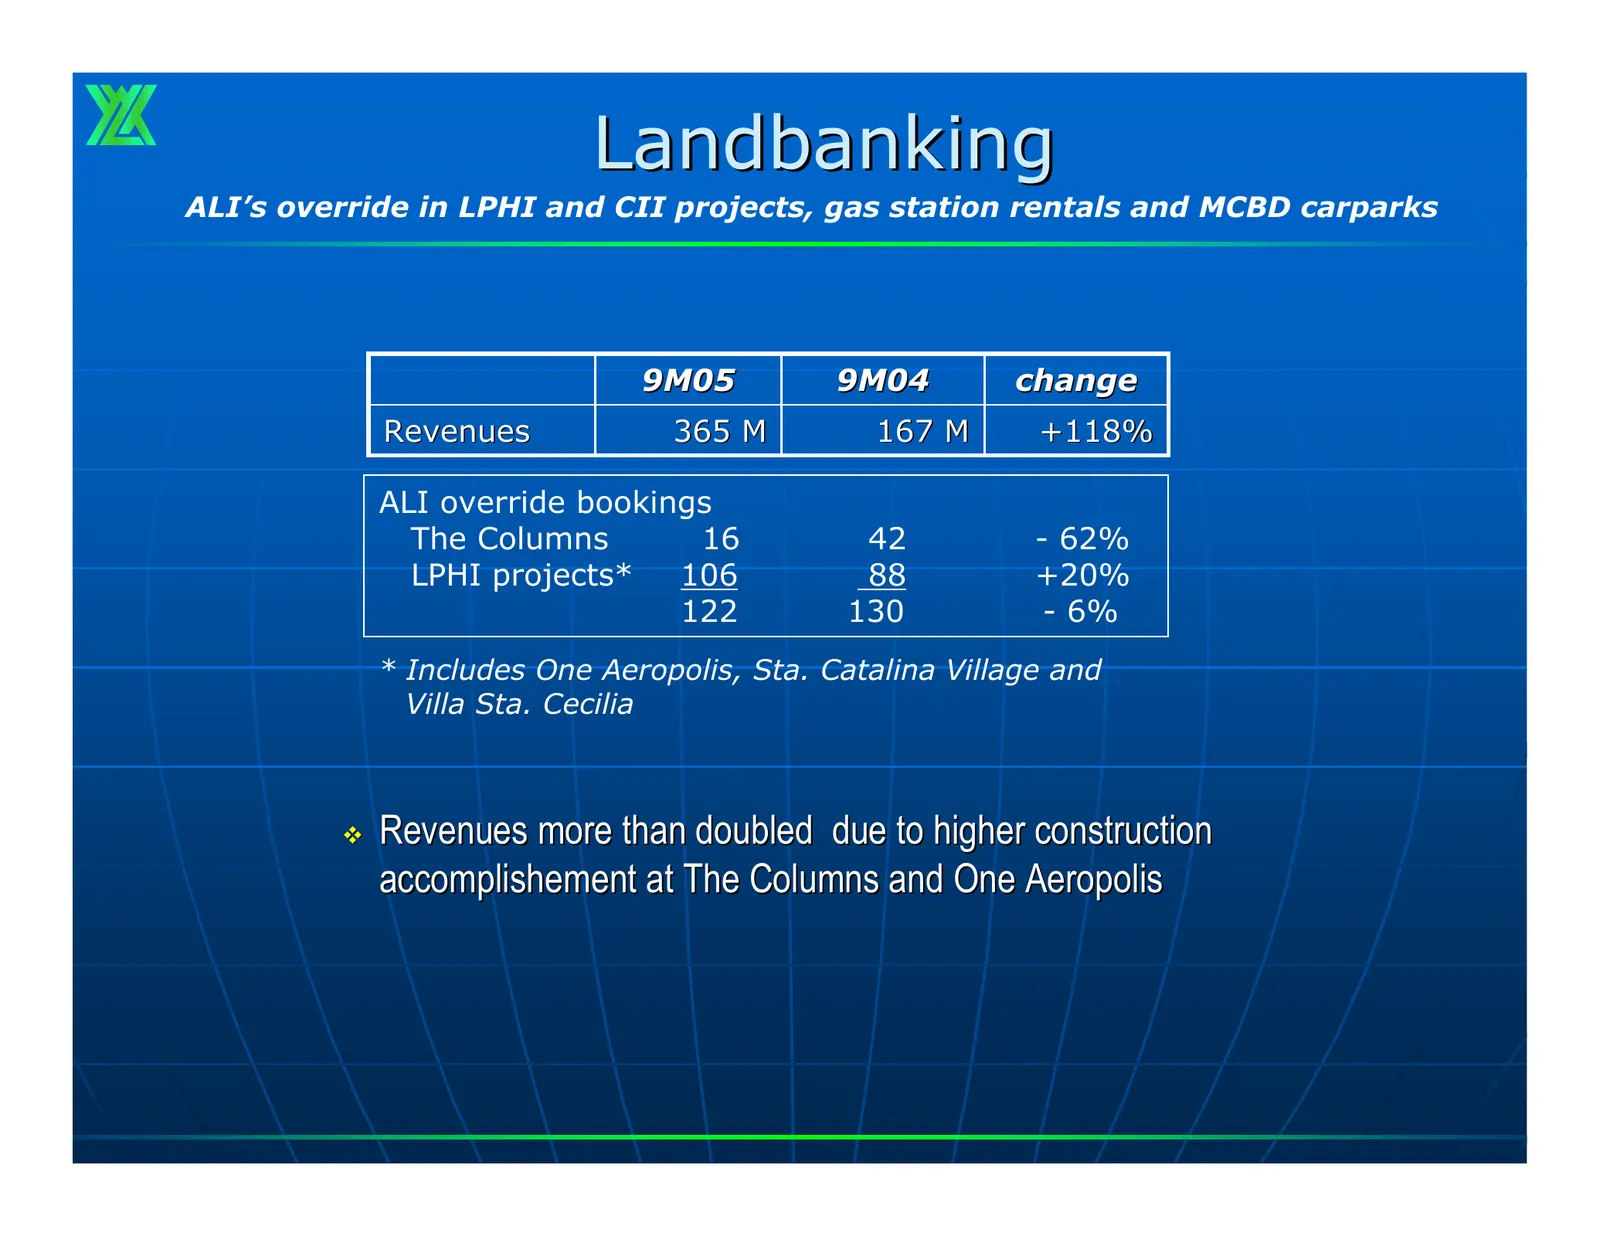
Landbanking ALI’s override in LPHI and CII projects, gas station rentals and MCBD carparks 9M05 9M04 change Revenues 365 M 167 M +118% ALI override bookings The Columns 16 42 - 62% LPHI projects* 106 88 +20% 122 130 - 6% * Includes One Aeropolis, Sta. Catalina Village and Villa Sta. Cecilia Revenu
Slide 22: Interest & Other Income
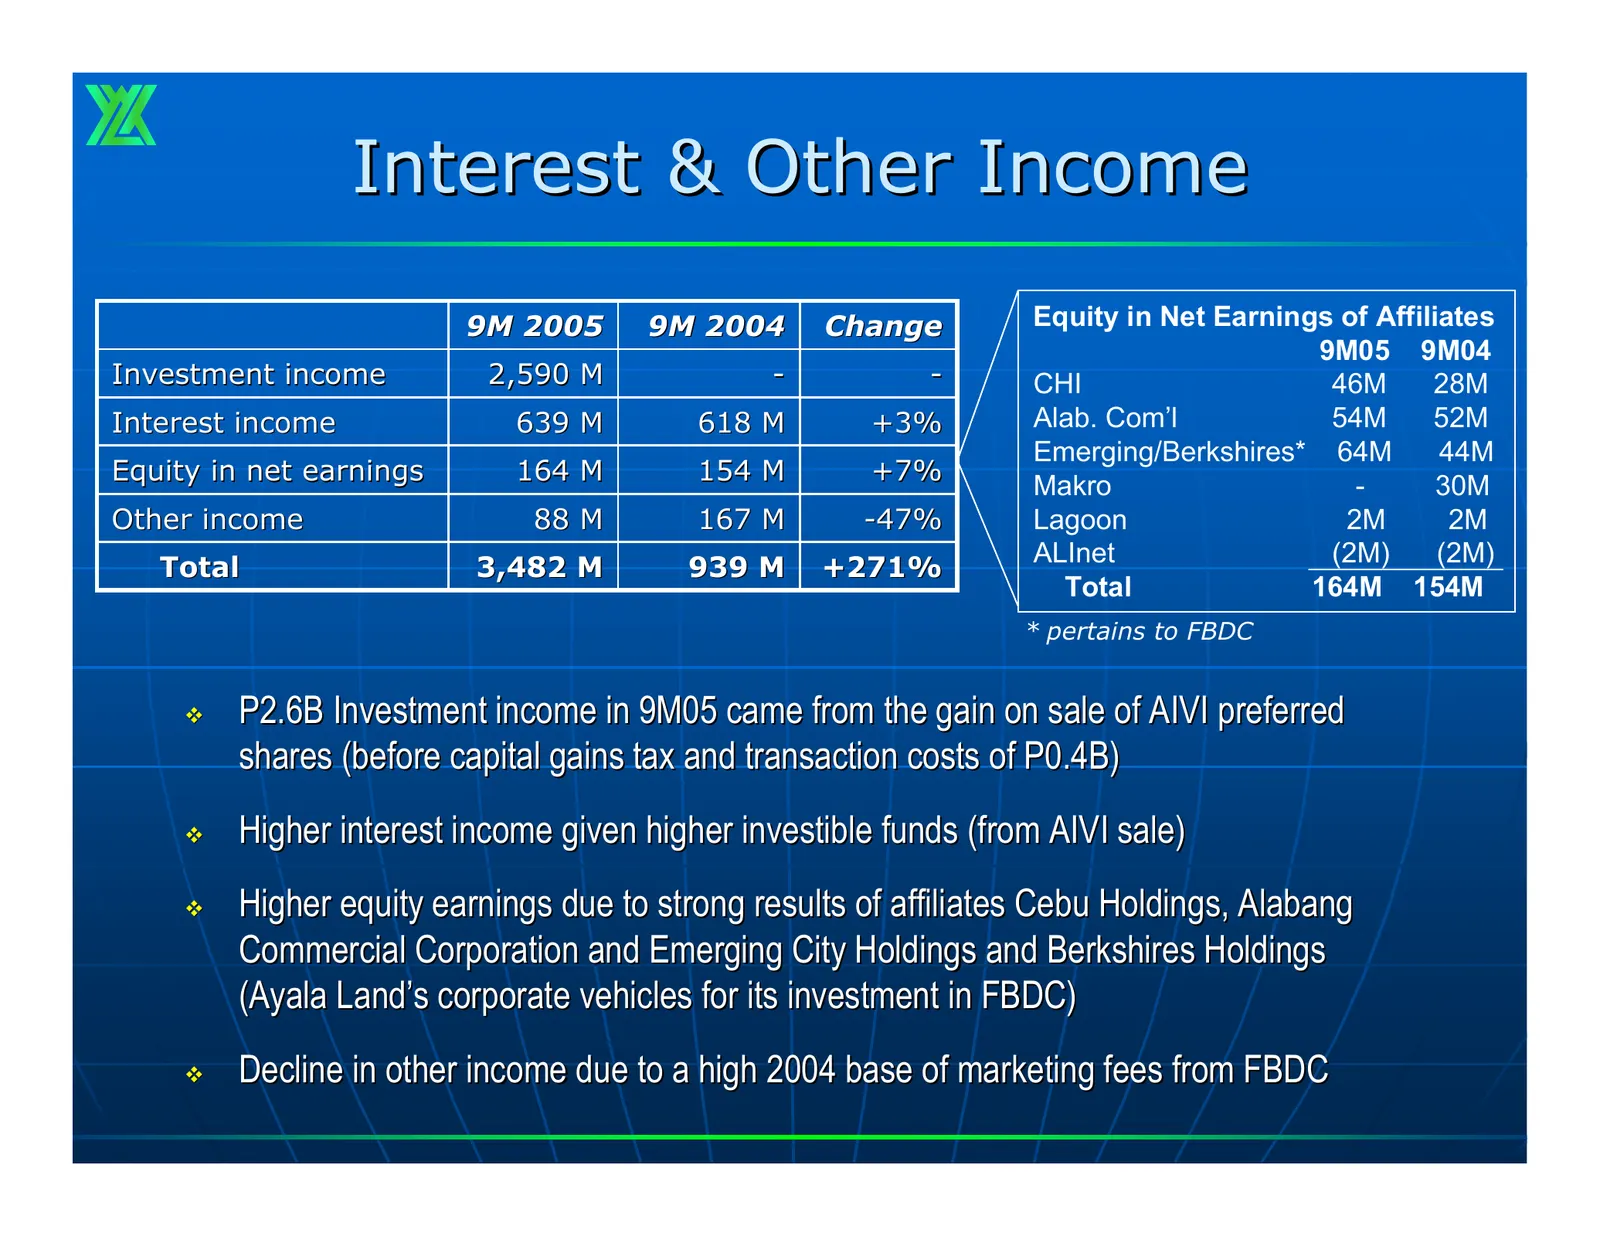
Interest & Other Income 9M 2005 9M 2004 Change Equity in Net Earnings of Affiliates 9M05 9M04 Investment income 2,590 M - - CHI 46M 28M Interest income 639 M 618 M +3% Alab. Com’l 54M 52M Emerging/Berkshires* 64M 44M Equity in net earnings 164 M 154 M +7% Makro - 30M Other income 88 M 167 M -47% Lag
Slide 23: Key Affiliates
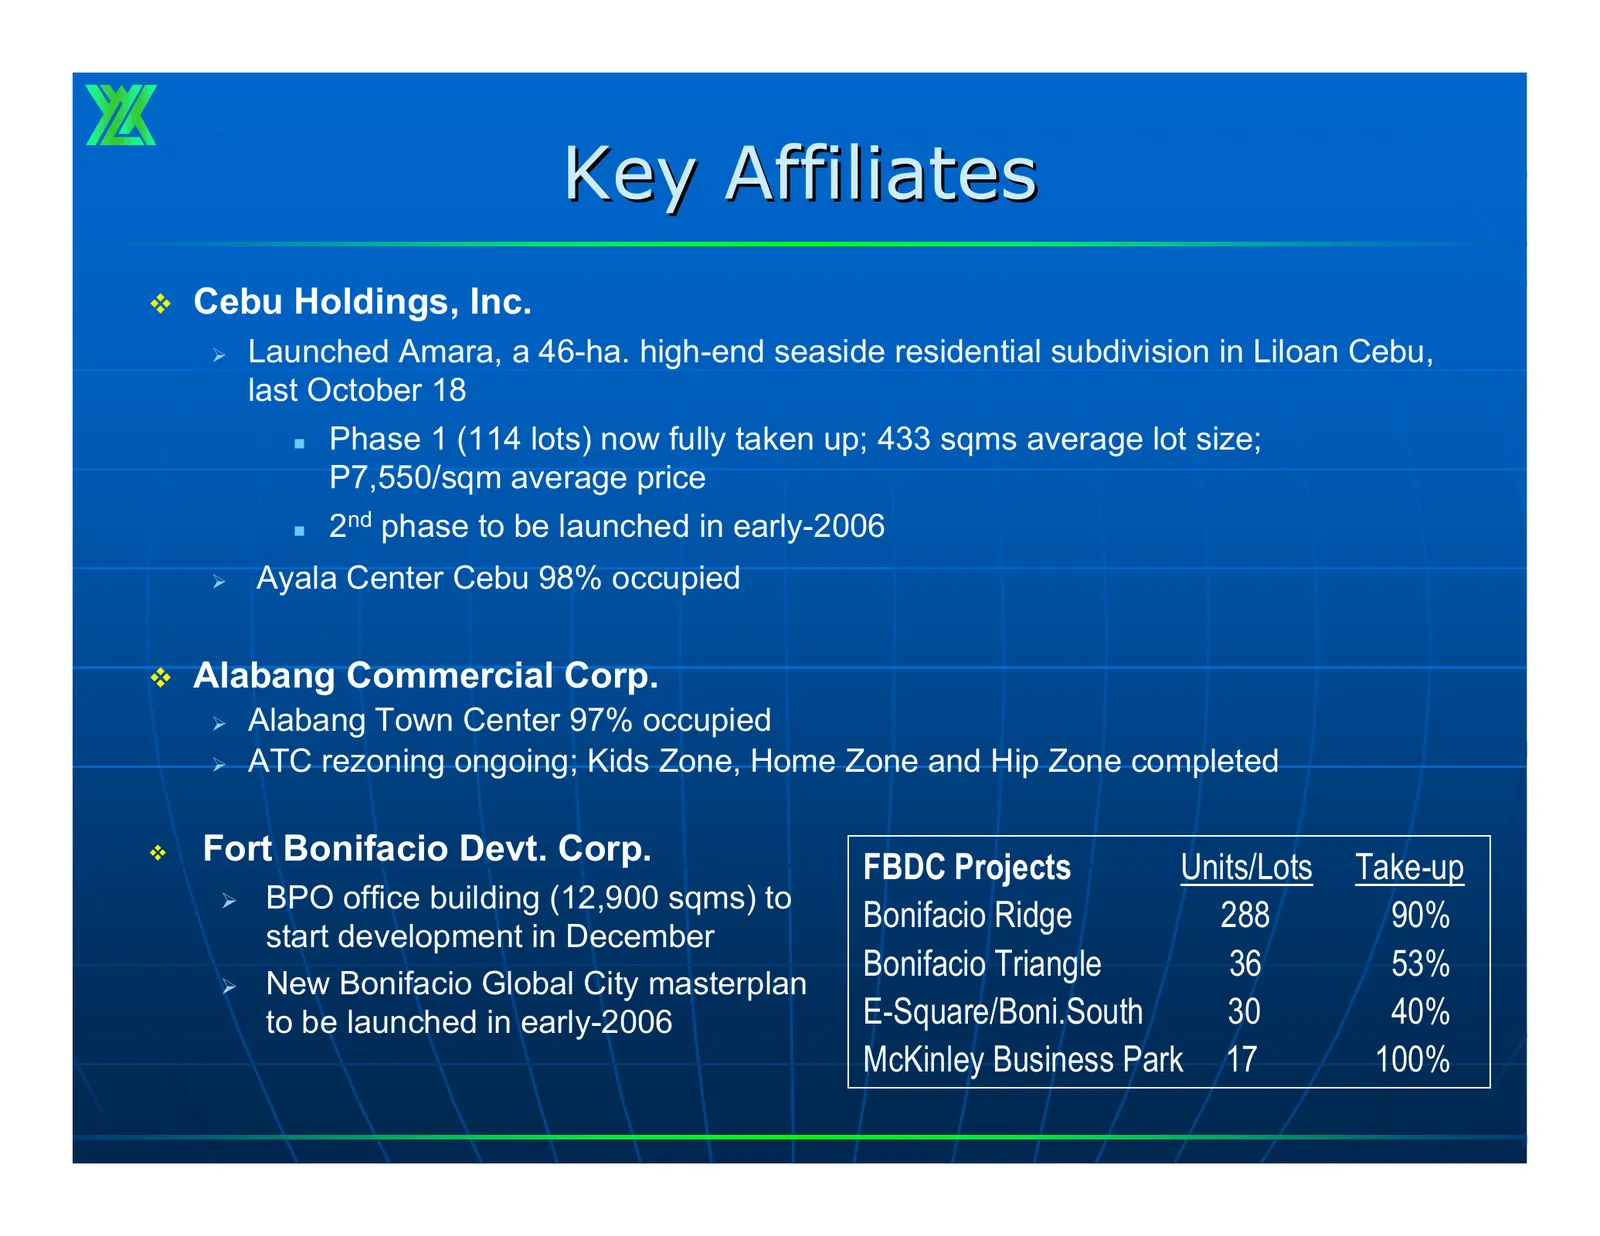
Key Affiliates Cebu Holdings, Inc. ¾ Launched Amara, a 46-ha. high-end seaside residential subdivision in Liloan Cebu, last October 18 Phase 1 (114 lots) now fully taken up; 433 sqms average lot size; P7,550/sqm average price 2nd phase to be launched in early-2006 ¾ Ayala Center Cebu 98% occup
Slide 24: Bonifacio Global City Masterplan
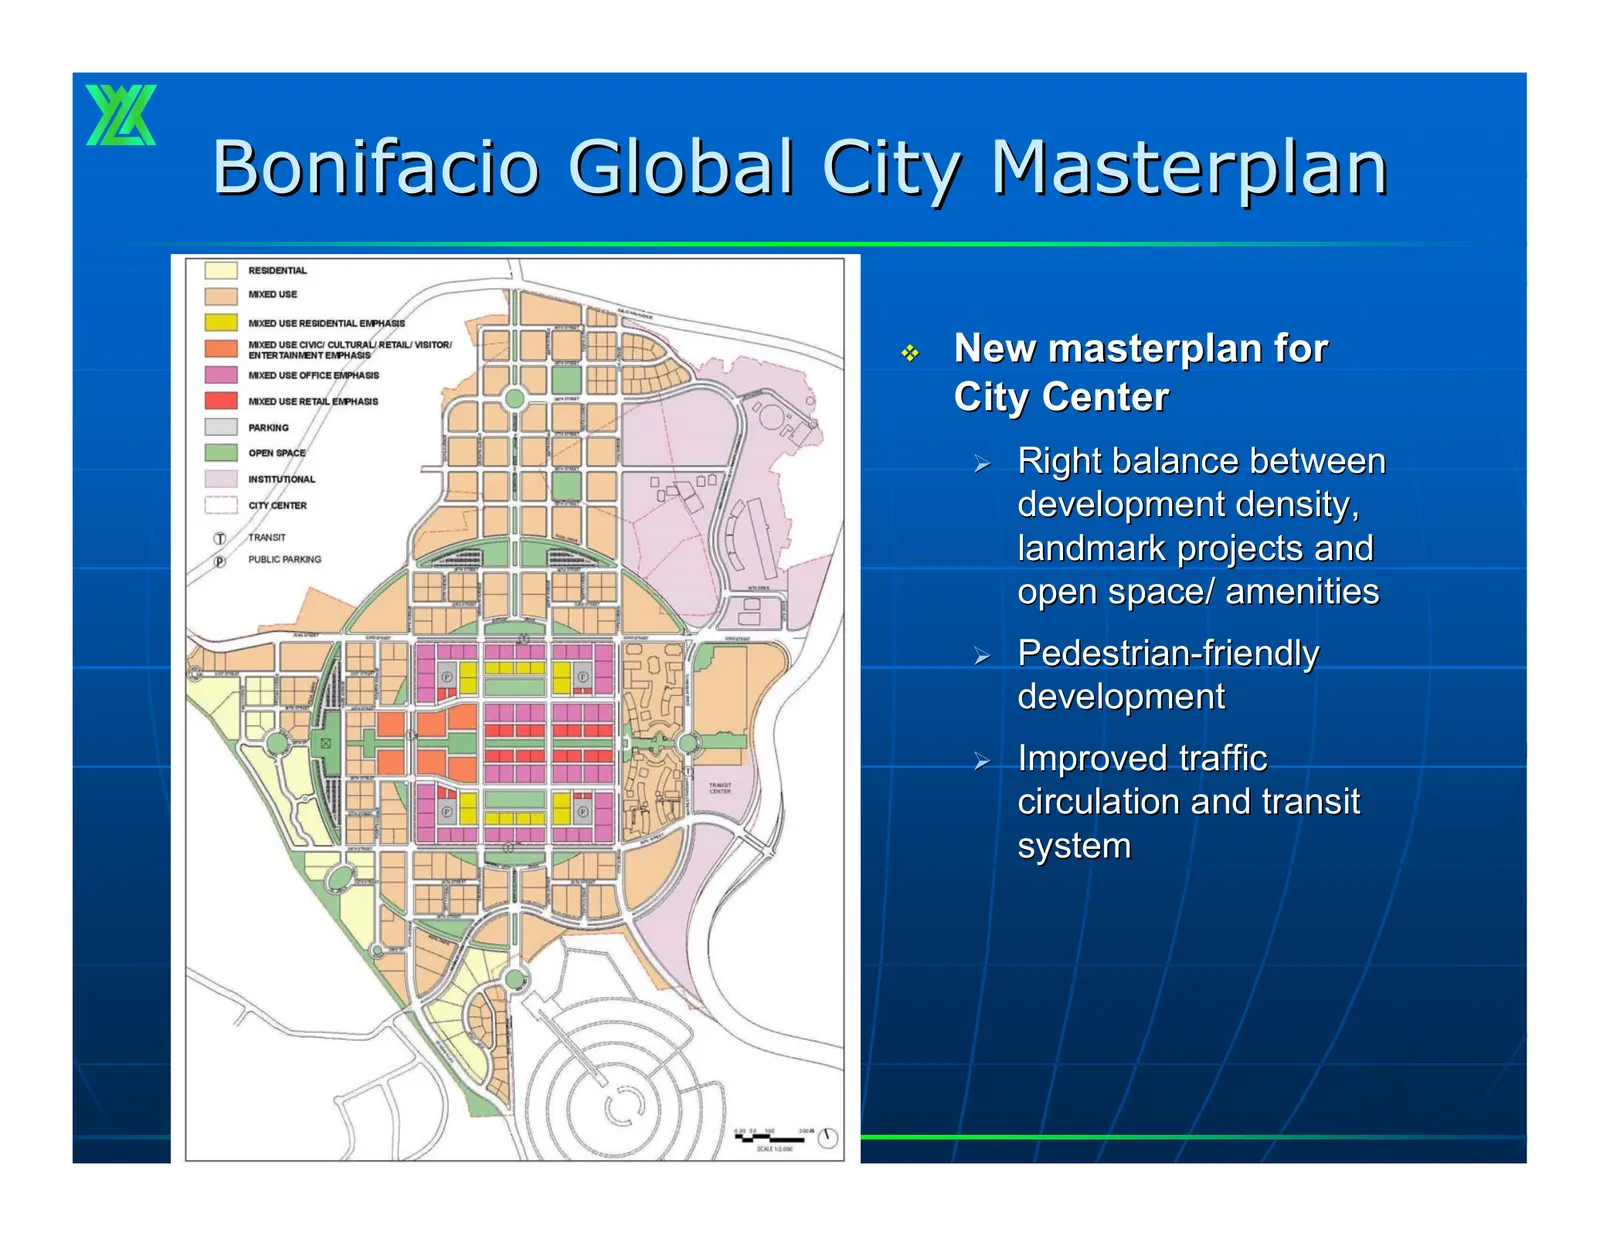
Bonifacio Global City Masterplan New masterplan for City Center ¾ Right balance between development density, landmark projects and open space/ amenities ¾ Pedestrian-friendly development ¾ Improved traffic circulation and transit system
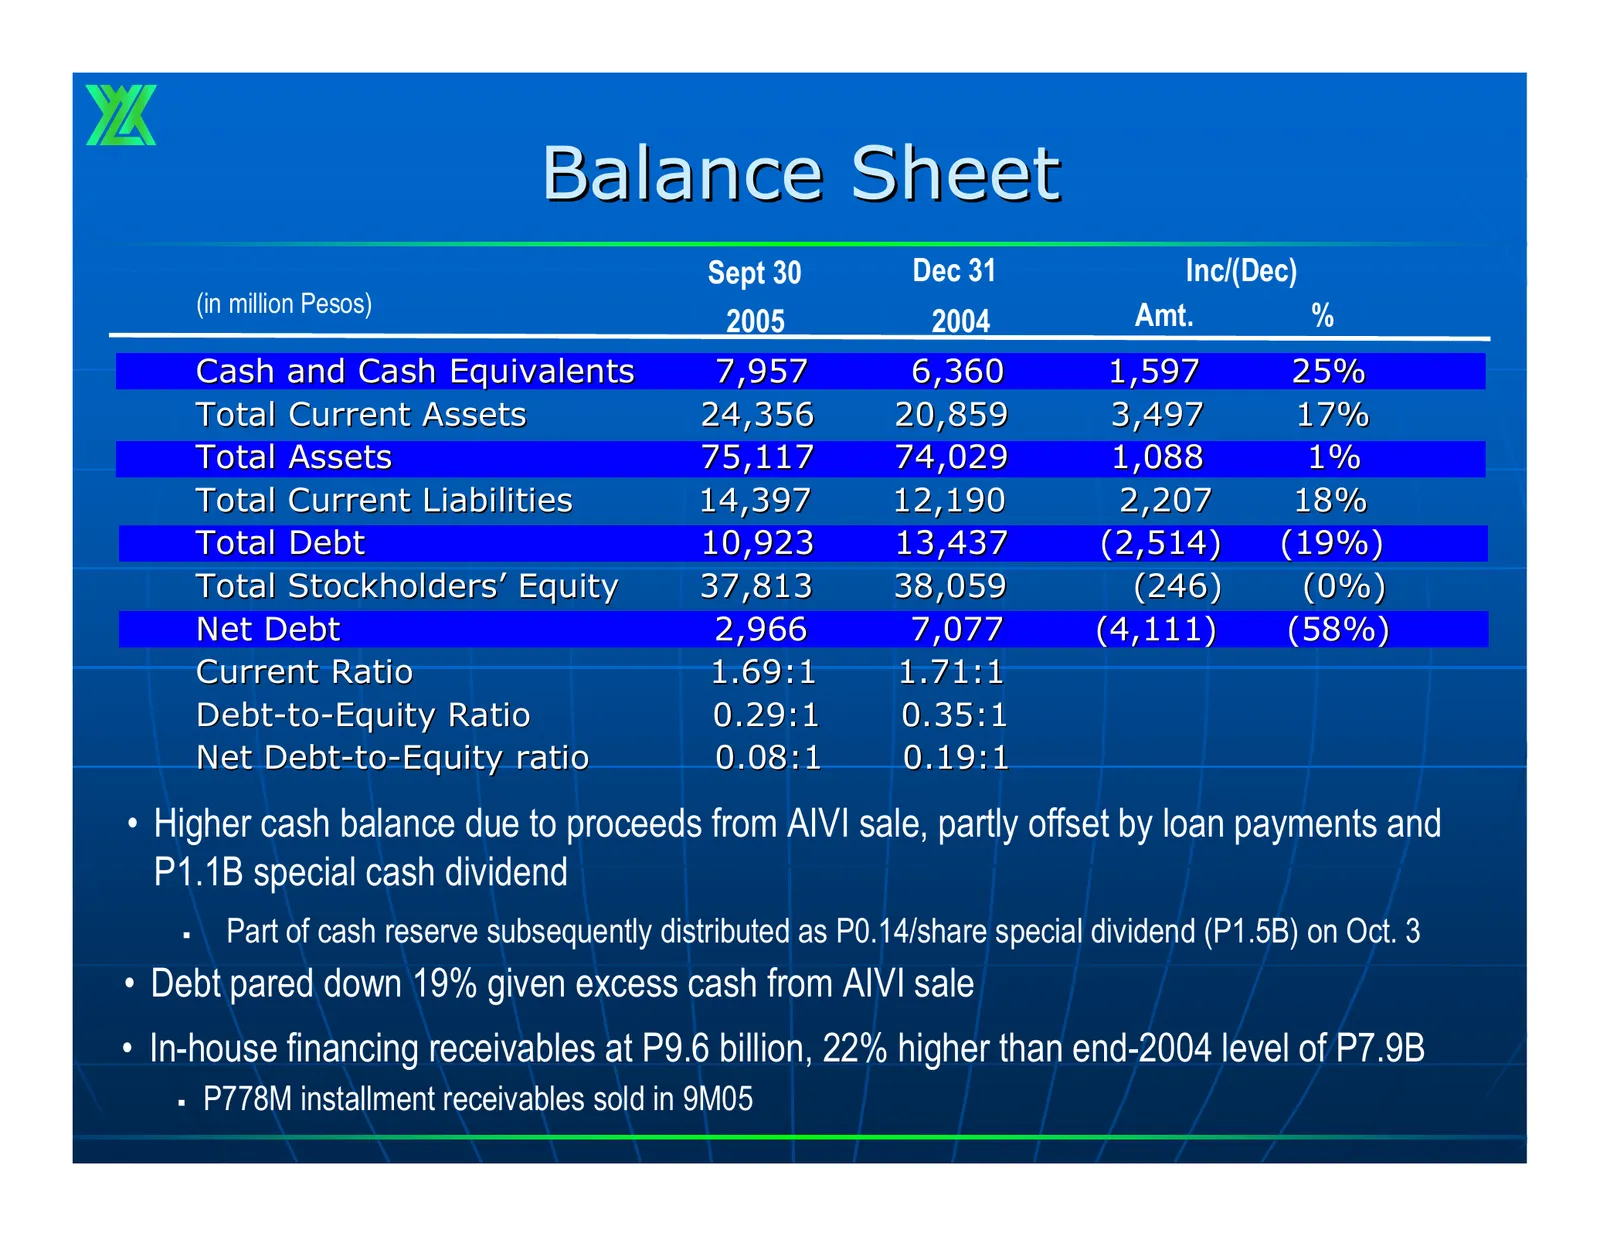
Slide 25: Balance Sheet
Balance Sheet Sept 30 Dec 31 Inc/(Dec) (in million Pesos) Amt. % 2005 2004 Cash and Cash Equivalents 7,957 6,360 1,597 25% Total Current Assets 24,356 20,859 3,497 17% Total Assets 75,117 74,029 1,088 1% Total Current Liabilities 14,397 12,190 2,207 18% Total Debt 10,923 13,437 (2,514) (19%) Total S
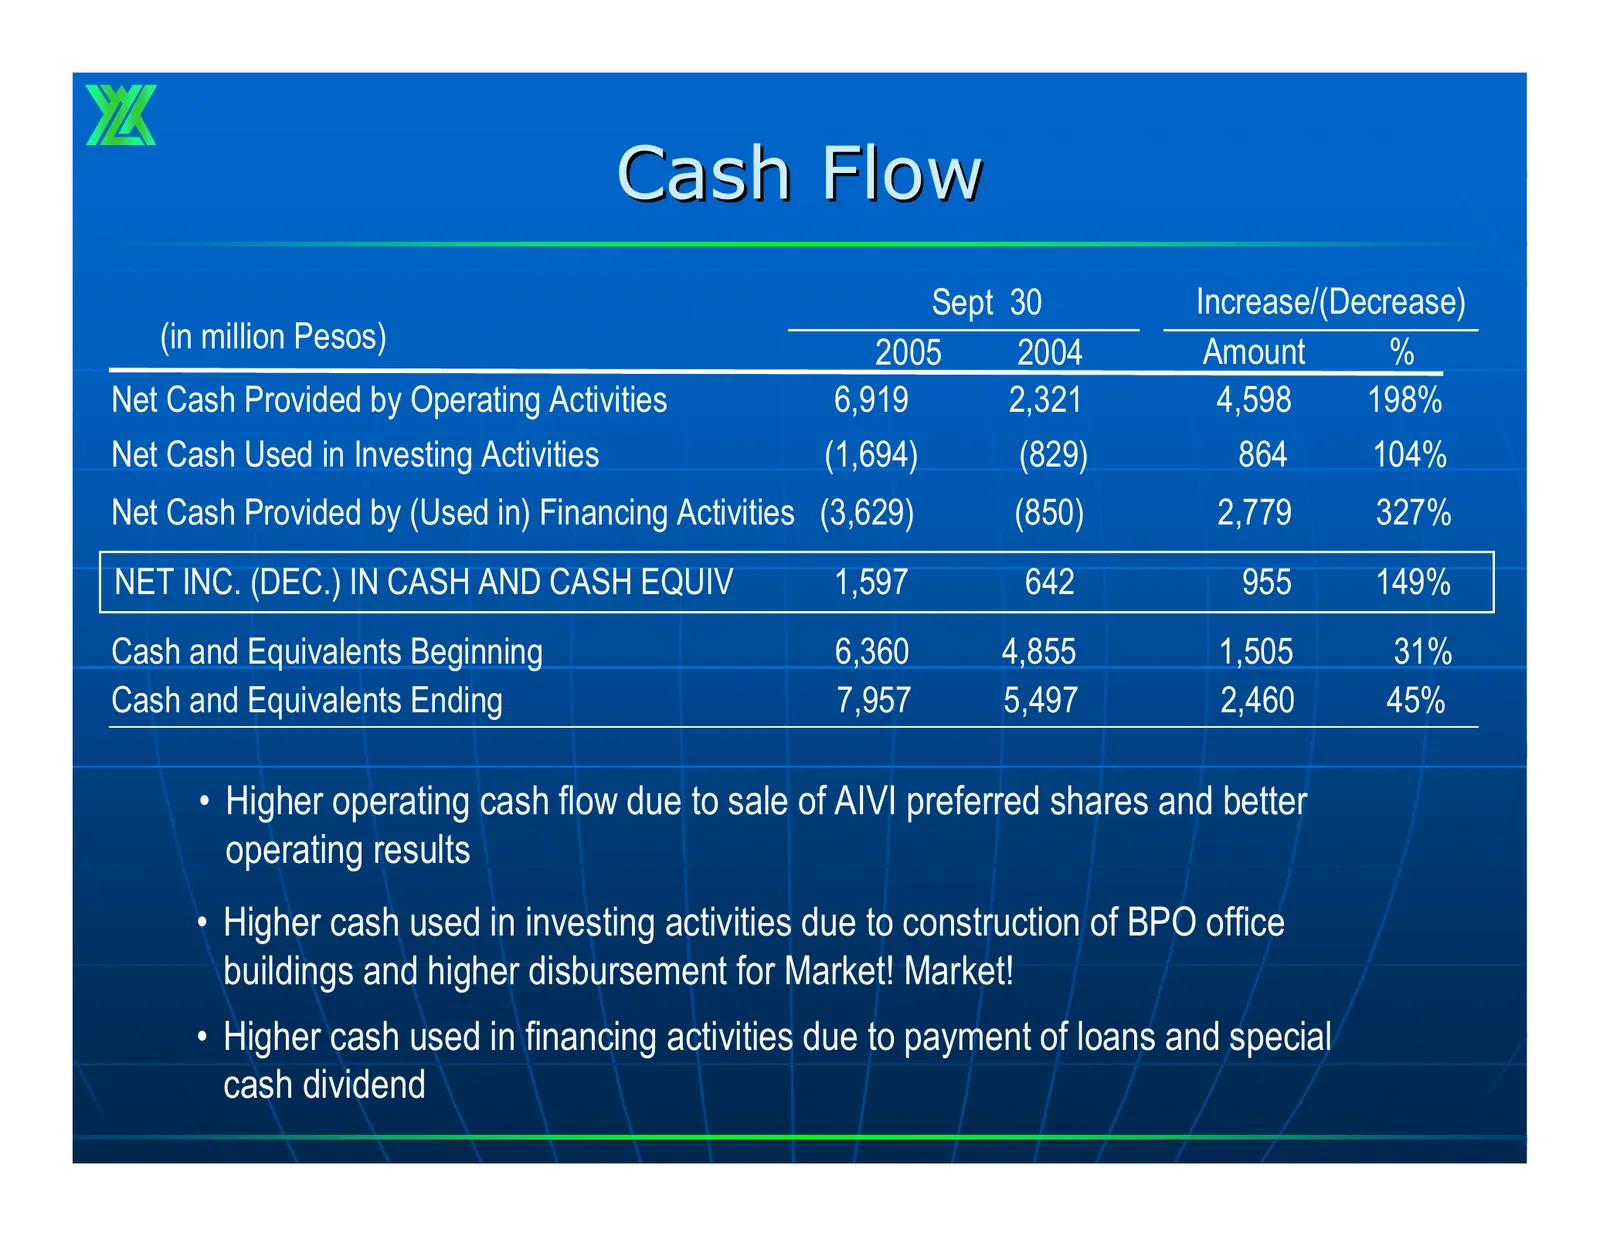
Slide 26: Cash Flow
Cash Flow Sept 30 Increase/(Decrease) (in million Pesos) 2005 2004 Amount % Net Cash Provided by Operating Activities 6,919 2,321 4,598 198% Net Cash Used in Investing Activities (1,694) (829) 864 104% Net Cash Provided by (Used in) Financing Activities (3,629) (850) 2,779 327% NET INC. (DEC.) IN CA
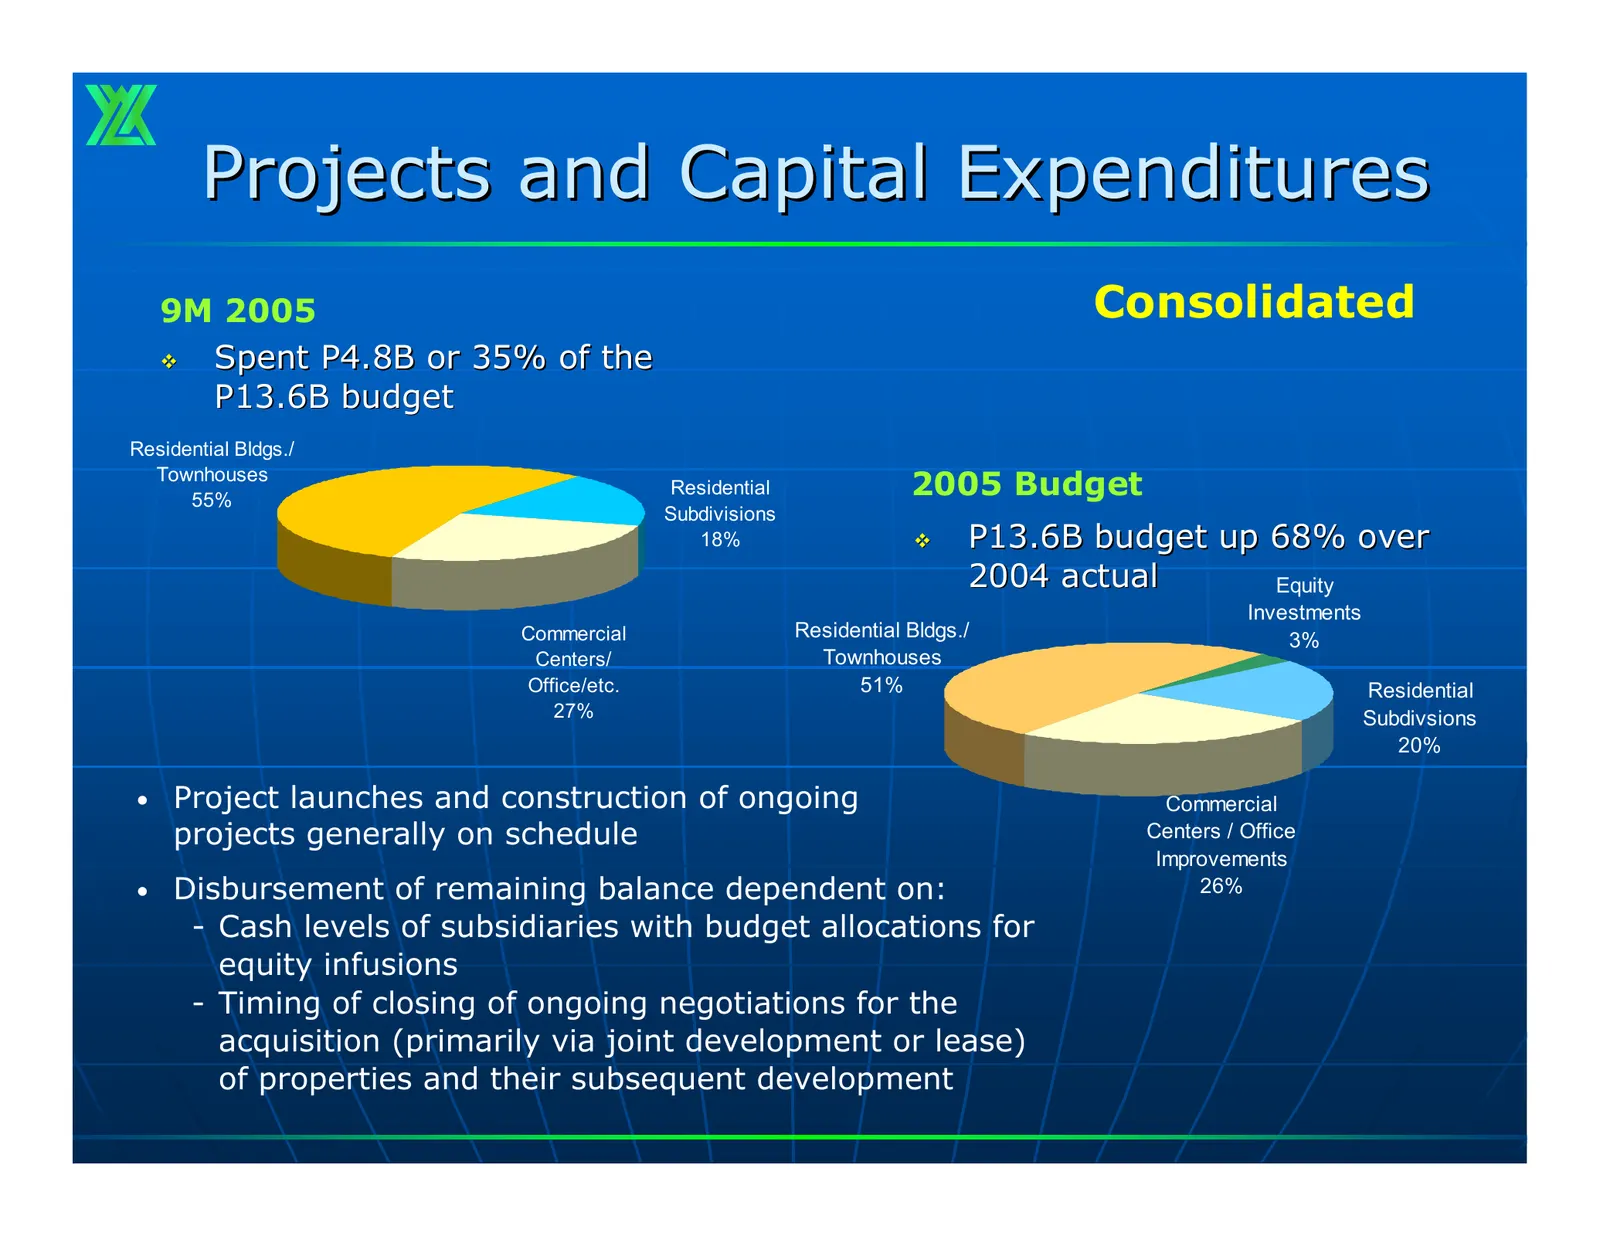
Slide 27: Projects and Capital Expenditures
Projects and Capital Expenditures 9M 2005 Consolidated Spent P4.8B or 35% of the P13.6B budget Residential Bldgs./ Townhouses 55% Residential 2005 Budget Subdivisions 18% P13.6B budget up 68% over 2004 actual Equity Investments Commercial Residential Bldgs./ 3% Centers/ Townhouses Office/etc. 51
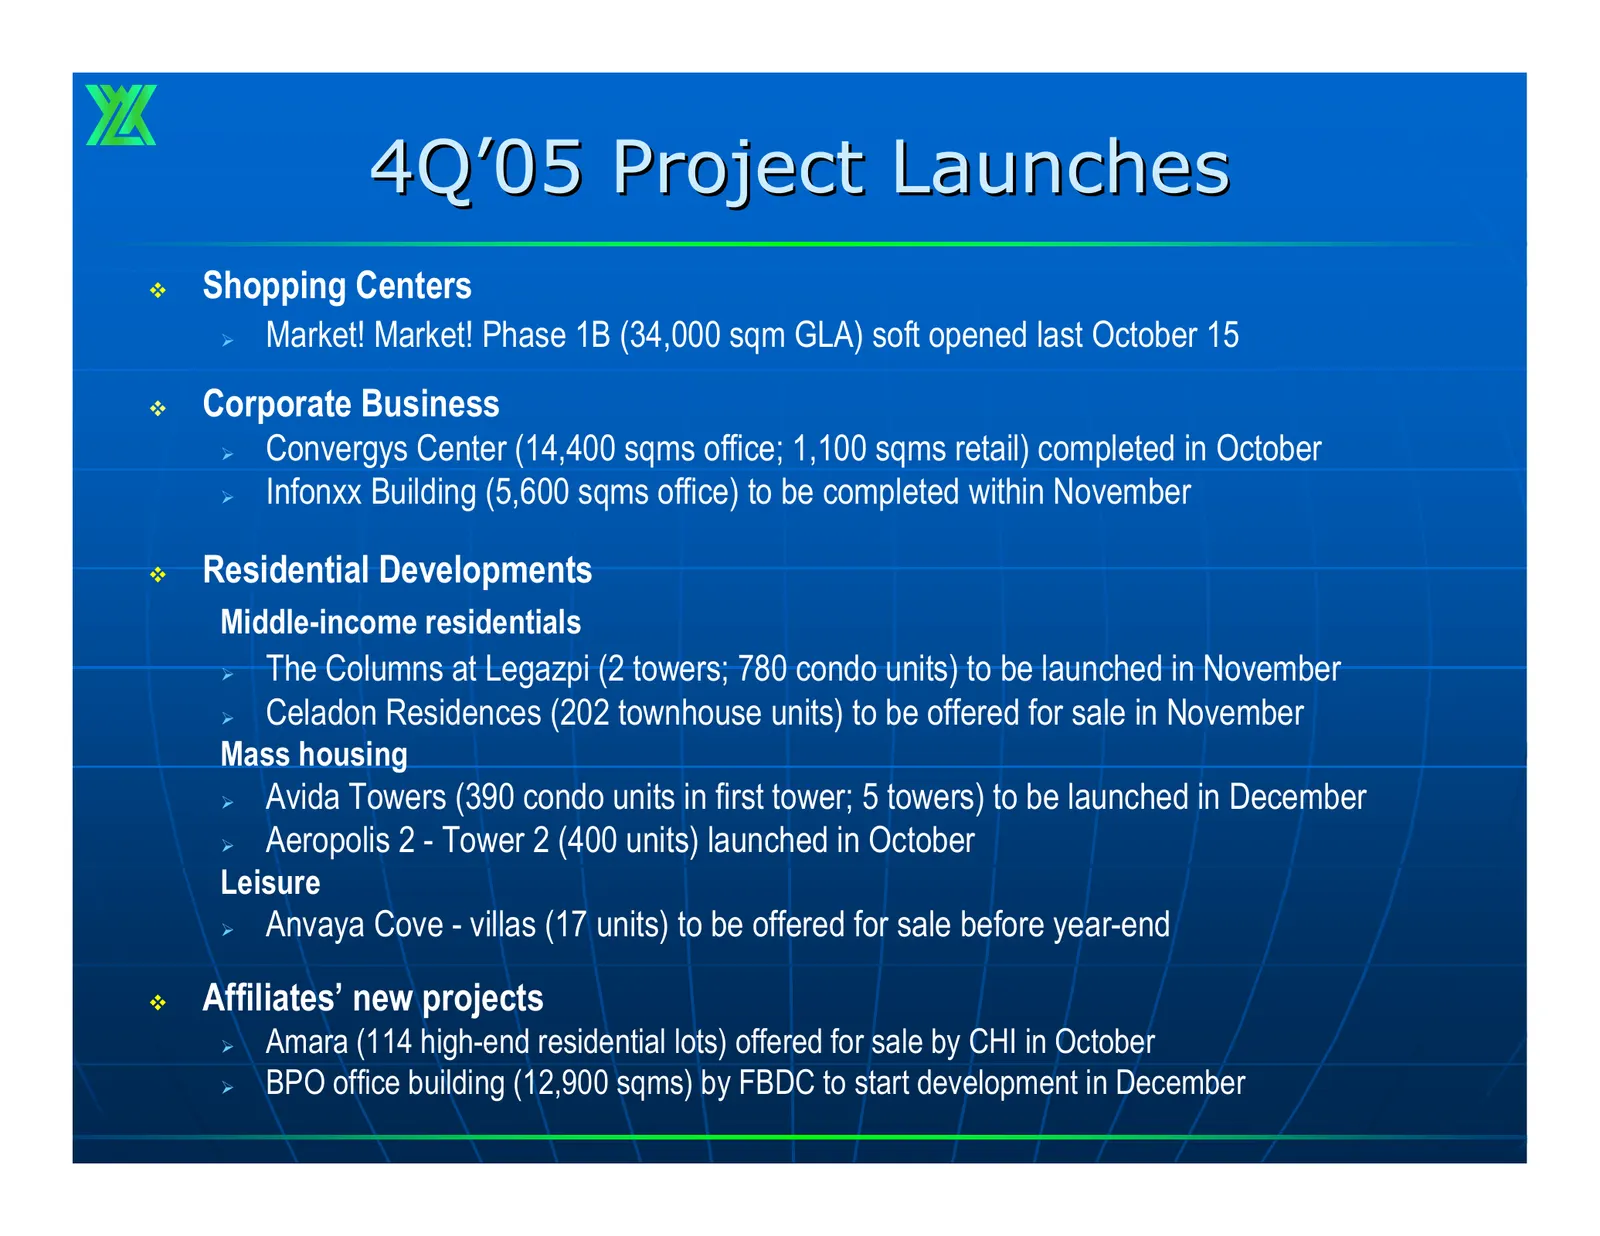
Slide 28: 4Q'05 Project Launches
4Q’05 Project Launches Shopping Centers ¾ Market! Market! Phase 1B (34,000 sqm GLA) soft opened last October 15 Corporate Business ¾ Convergys Center (14,400 sqms office; 1,100 sqms retail) completed in October ¾ Infonxx Building (5,600 sqms office) to be completed within November Residential
Slide 29: Ayala Land, Inc.
Ma Ayala Land, Inc.
Source: Internet Archive copy of ayalaland.com.ph
More decks from Ayala Land Inc.
 Q1 2026 Earnings Presentation15 slides · Apr 30, 2026
 Q4 2025 Earnings Presentation16 slides · Feb 20, 2026
 Q1 2025 Earnings Presentation10 slides · May 6, 2025
 FY2024 Earnings Presentation15 slides · Feb 20, 2025
 Q1 2024 Earnings Presentation37 slides · May 16, 2024
 Q1 2024 Earnings Presentation12 slides · May 8, 2024