Tiger Brands Limited · JSE:TBS
Tiger Brands — FY2009 Earnings Presentation
38 slides from Tiger Brands's earnings presentation, September 2009
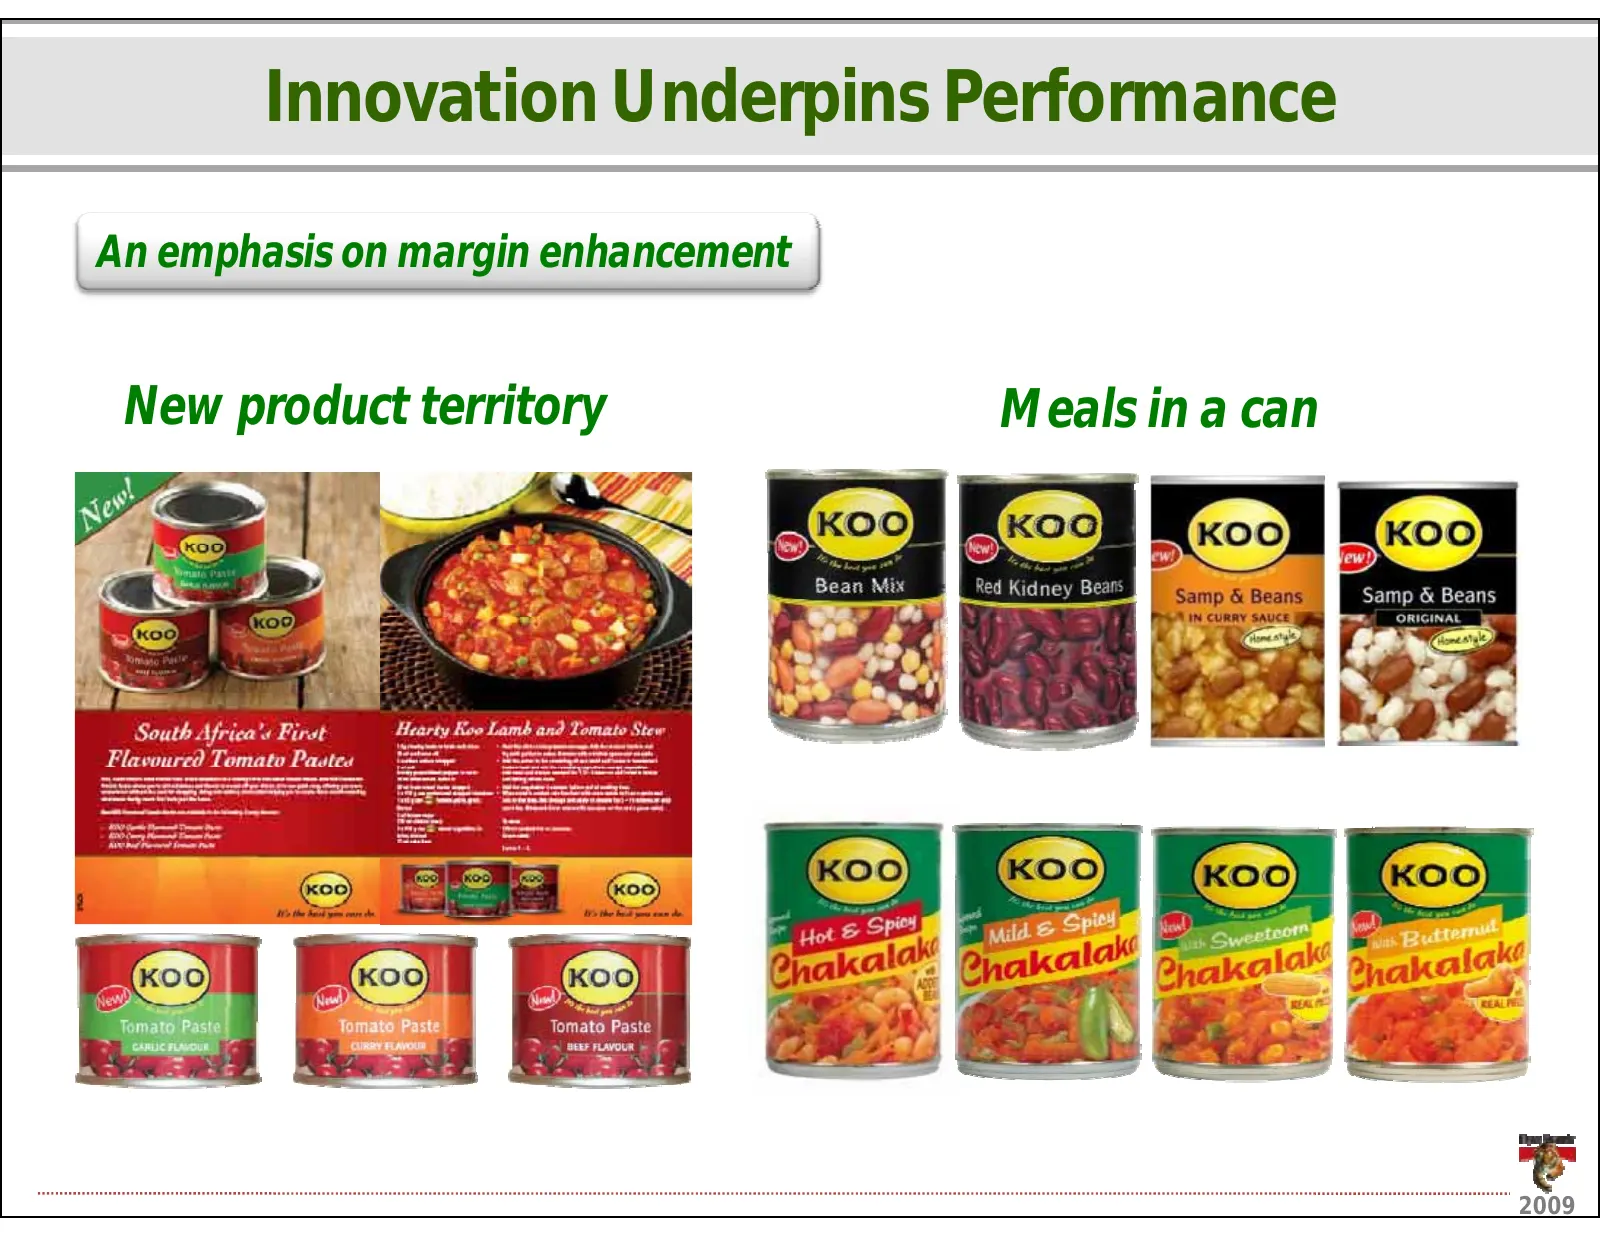
Slide 1: Innovation Underpins Performance
InnovationUnderpinsPerformance Anemphasisonmarginenhancement Newproductterritory Mealsinacan 2009
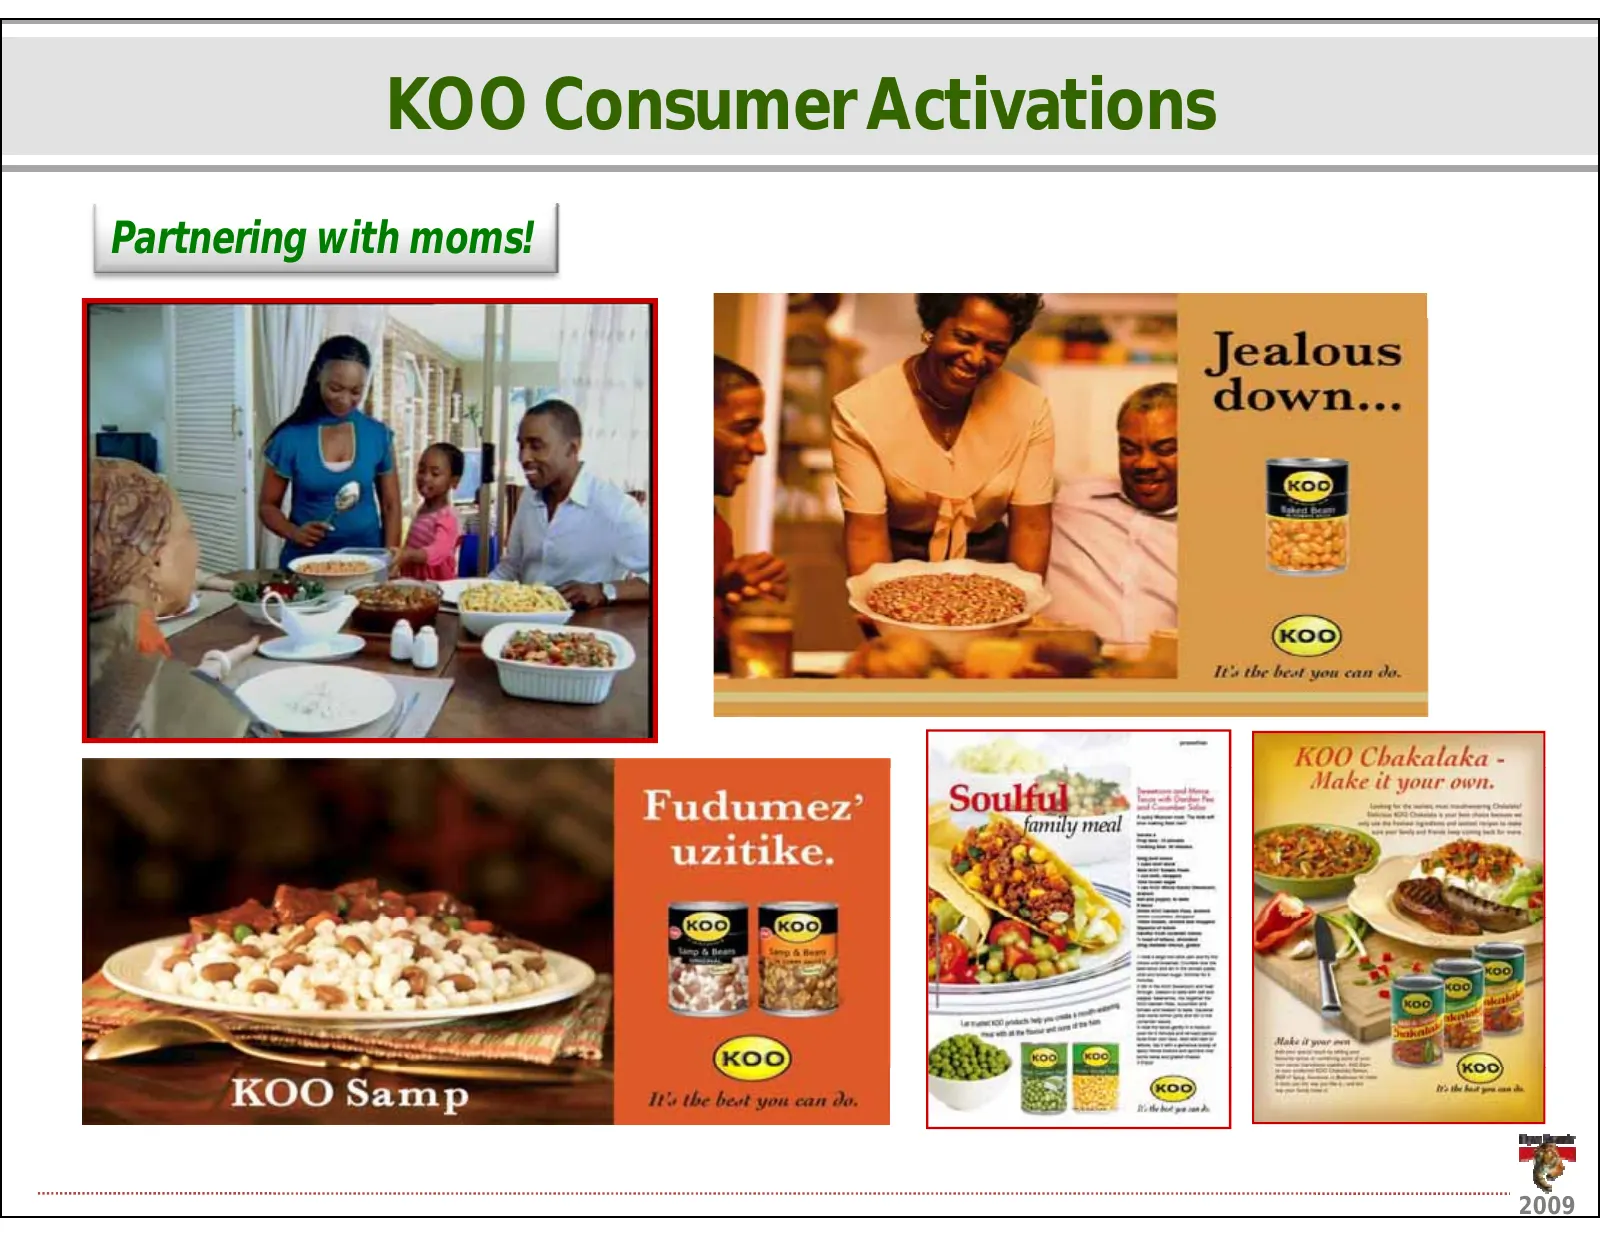
Slide 2: KOO Consumer Activations
KOOConsumerActivations Partneringwithmoms! 2009
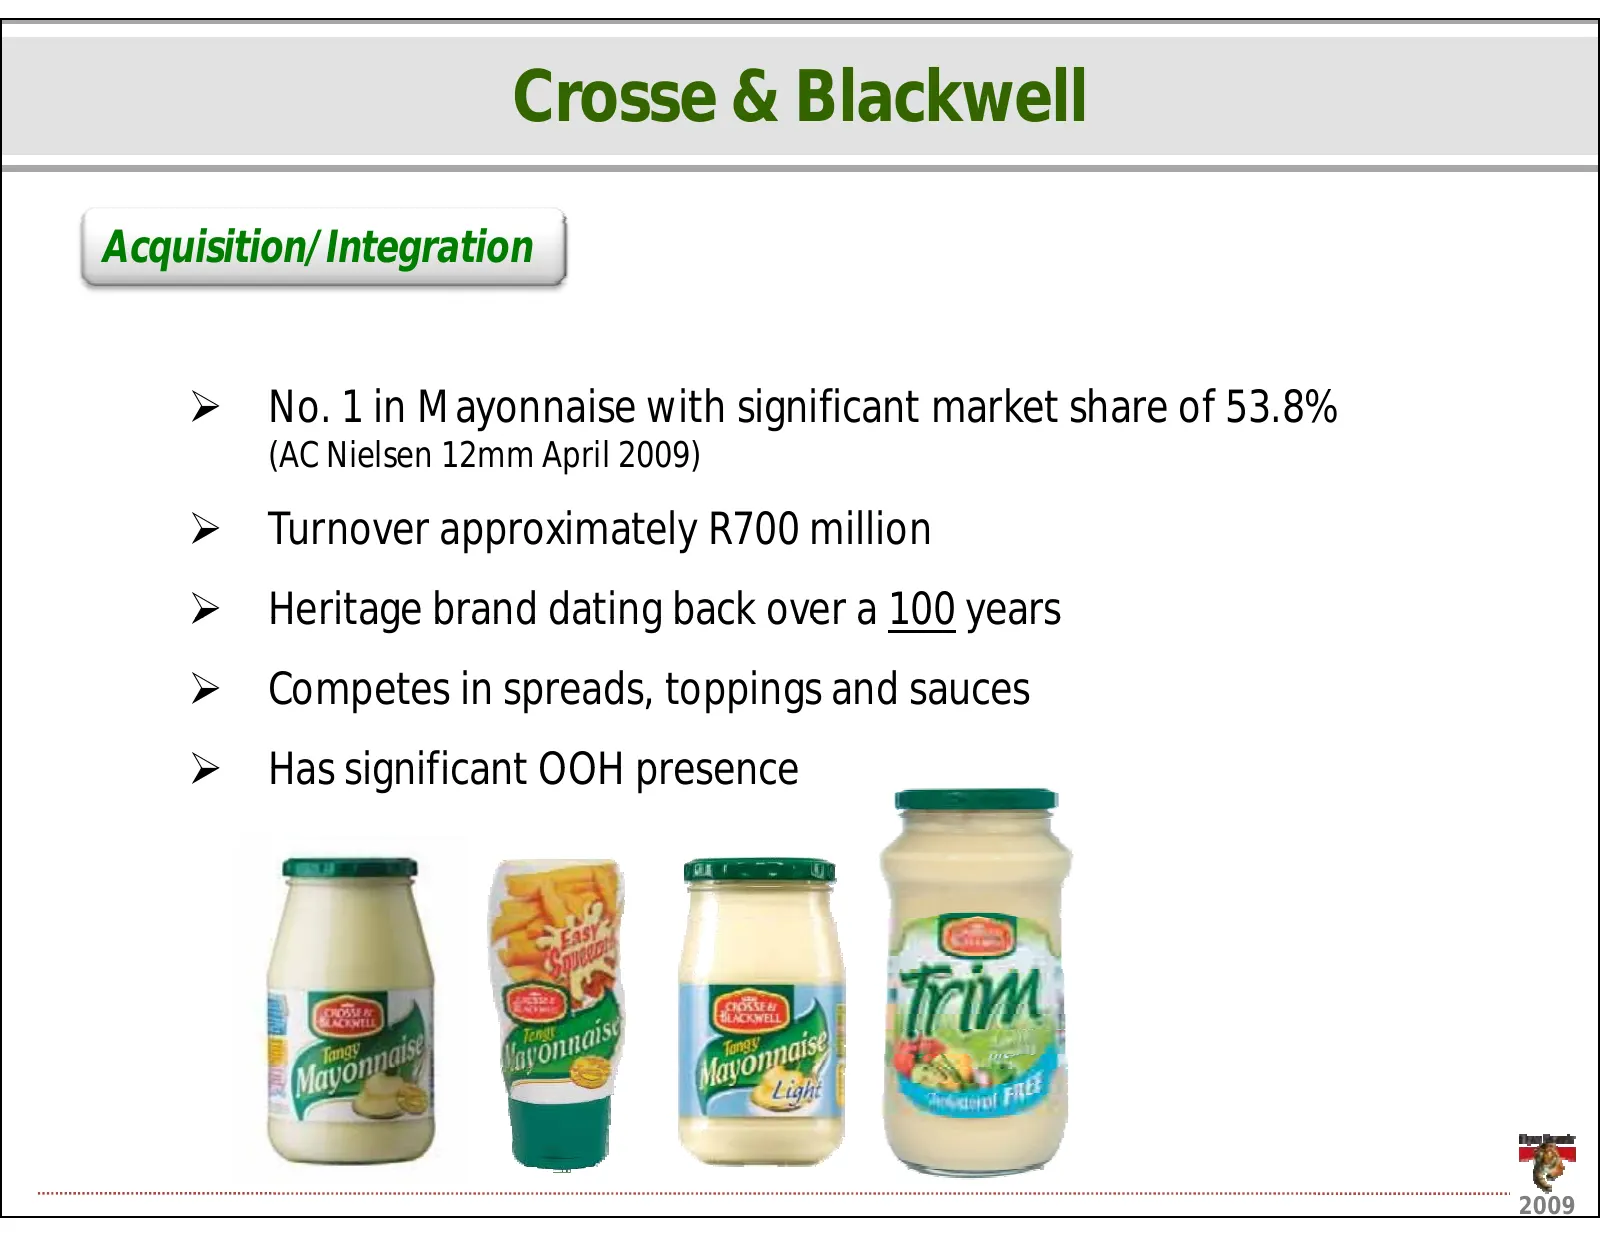
Slide 3: Crosse & Blackwell Acquisition/Integration
Crosse&Blackwell Acquisition/Integration ¾ No.1inMayonnaisewithsignificantmarketshareof53.8% ( (ACNielsen12mmApril2009) p ) ¾ TurnoverapproximatelyR700million ¾ Heritage brand dating back over a 100 years Heritagebranddatingbackovera100 ¾ Competesinspreads,toppingsandsauces ¾ Has significant OOH pre
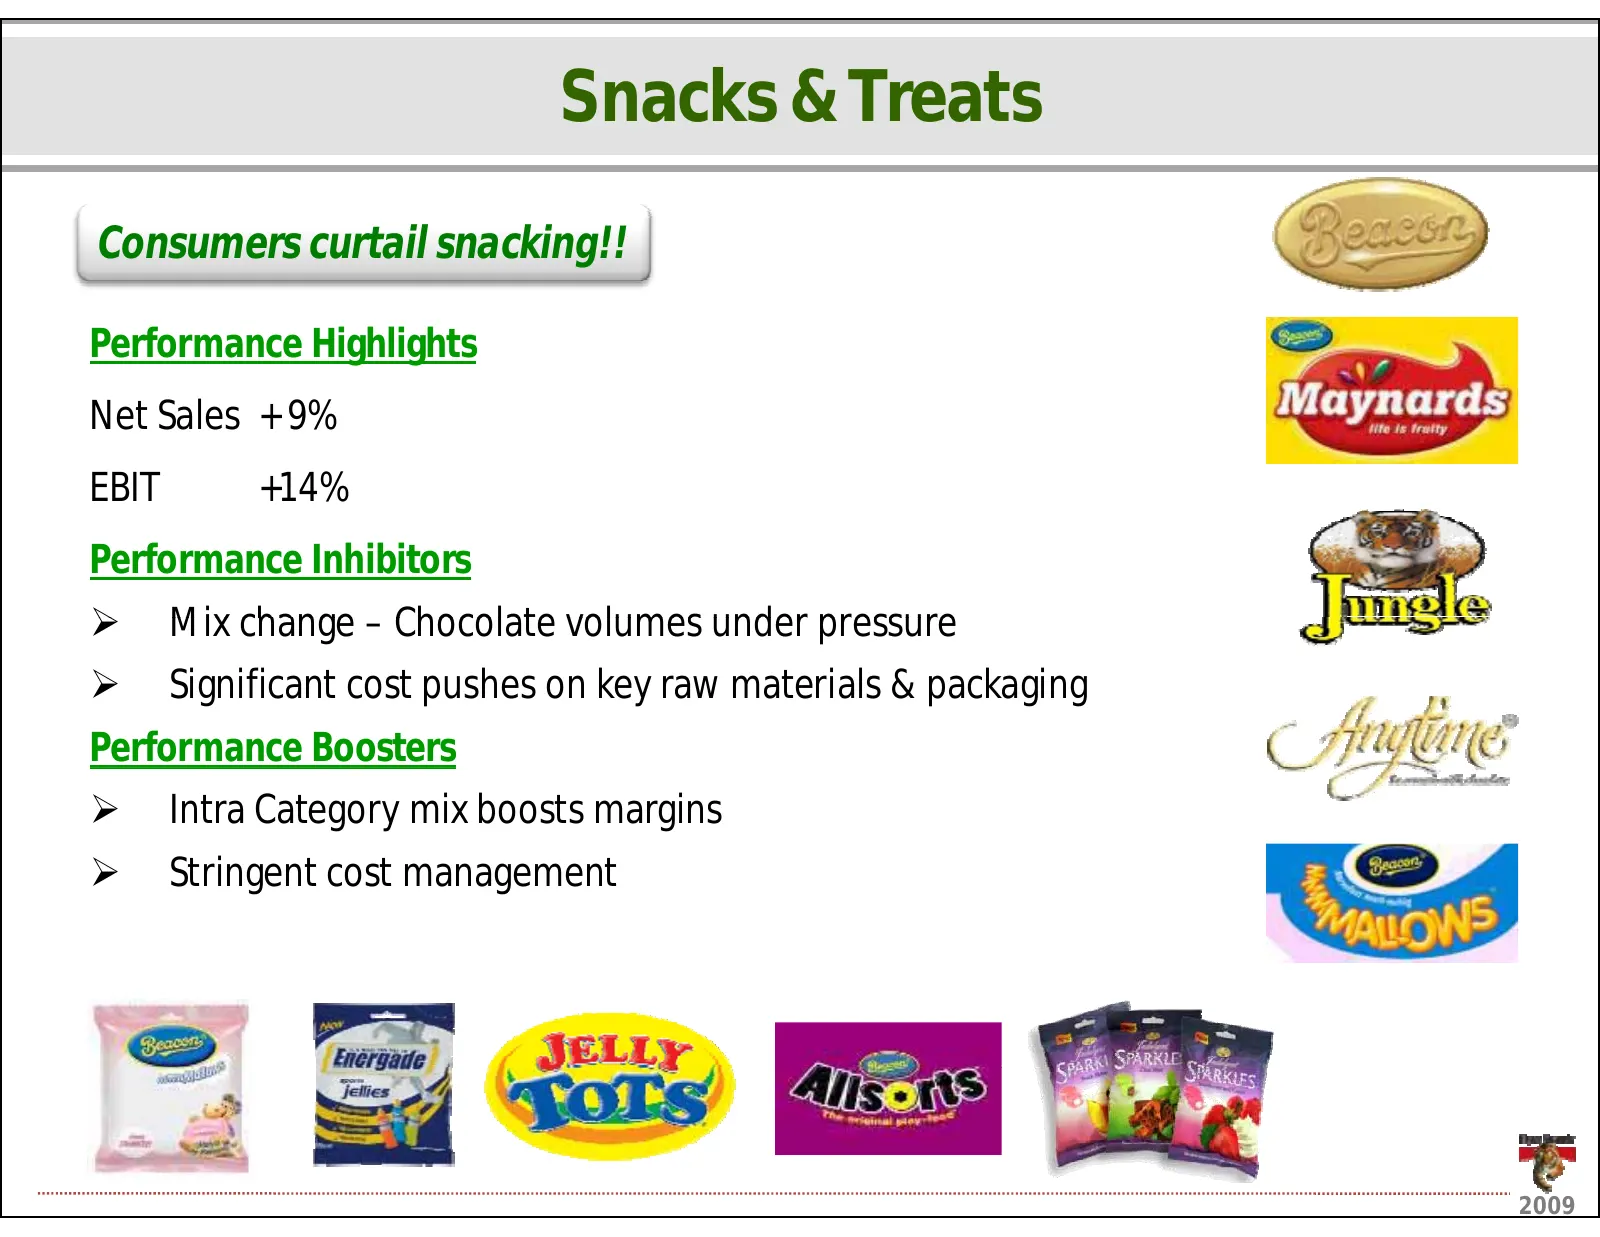
Slide 4: Snacks & Treats
Snacks&Treats Consumerscurtailsnacking!! PerformanceHighlights NetSales+9% EBIT +14% PerformanceInhibitors ¾ Mix change Chocolatevolumesunderpressure Mixchange– Chocolate volumes under pressure ¾ Significantcostpushesonkeyrawmaterials&packaging PerformanceBoosters ¾ IntraCategorymixboostsmargins ¾ S
Slide 5: Snacks & Treats
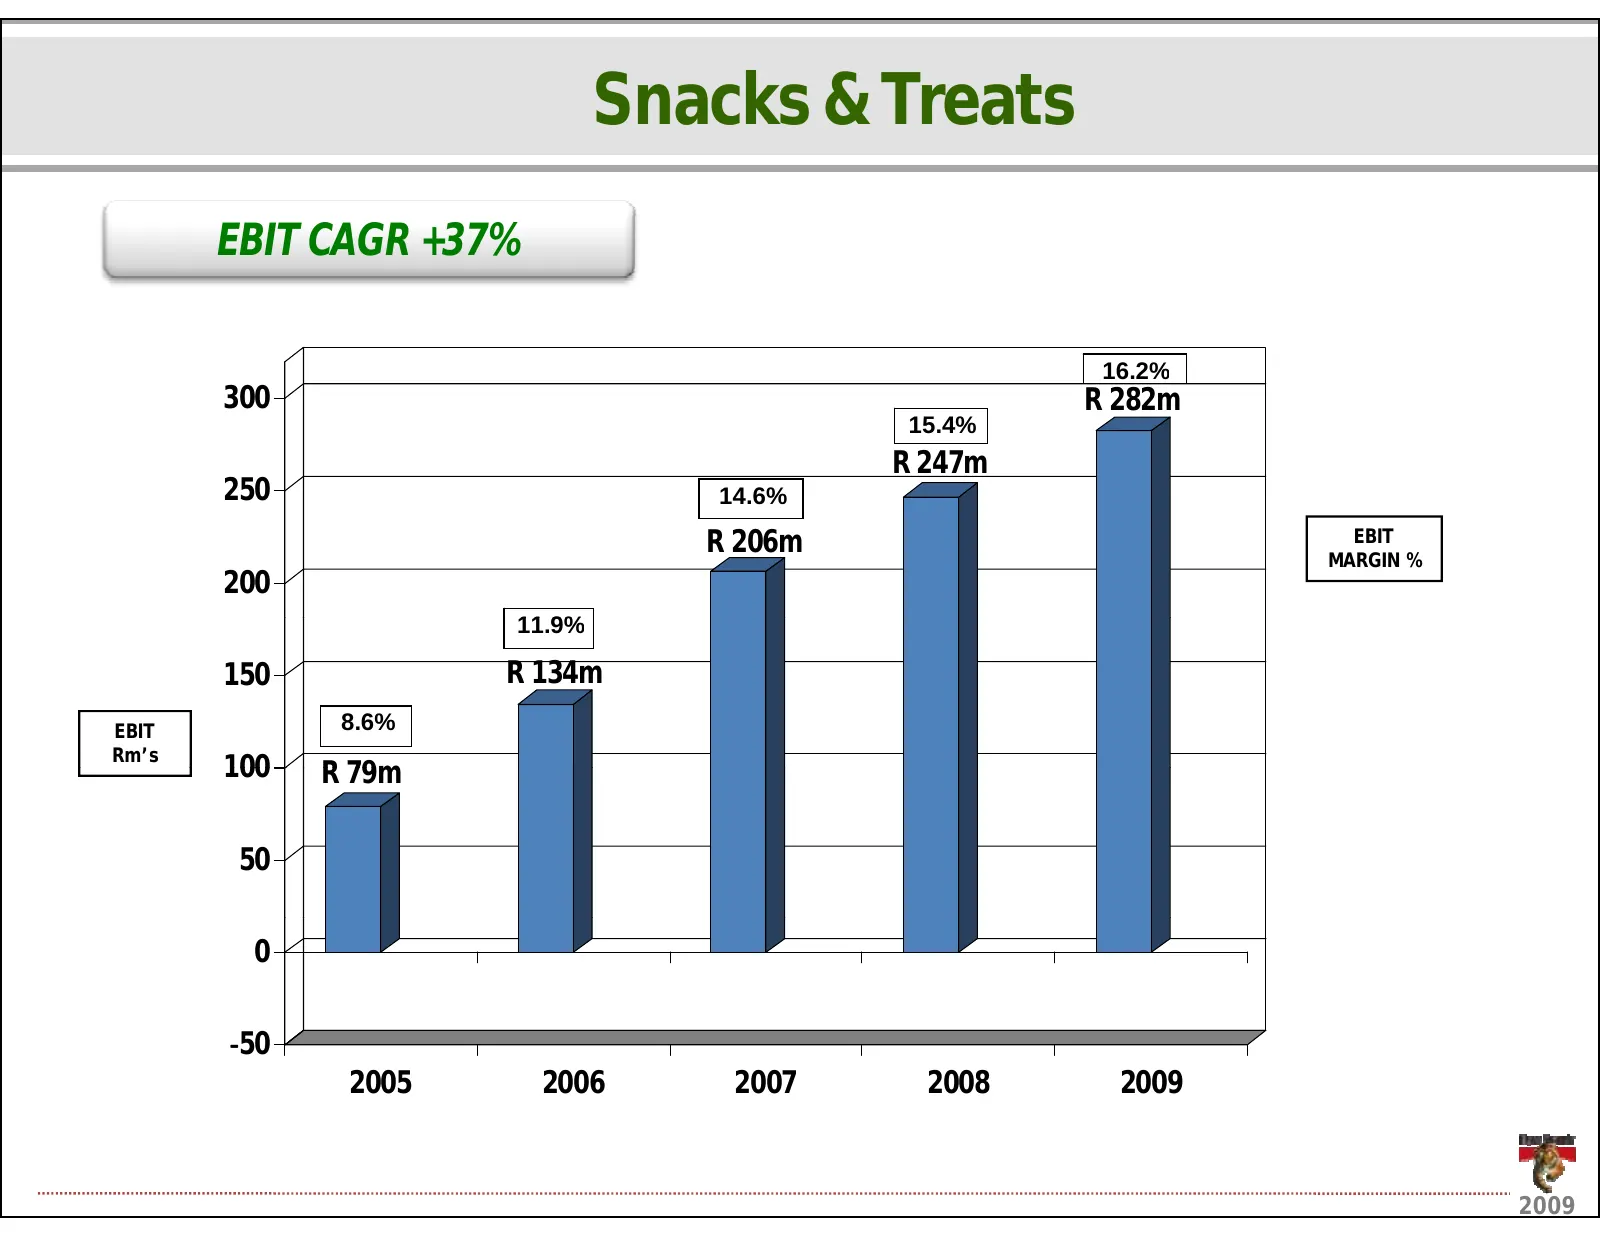
Snacks&Treats EBITCAGR+37% 16.2% 300 R282m 15.4% R 247m R247m 250 14.6% R206m EBIT MARGIN % 200 11 9% 11.9% 150 R134m EBIT 8.6% Rm’s 100 R 79 R79m 50 0 Ͳ50 2005 2006 2007 2008 2009 2009
Slide 6: Managing the Downturn
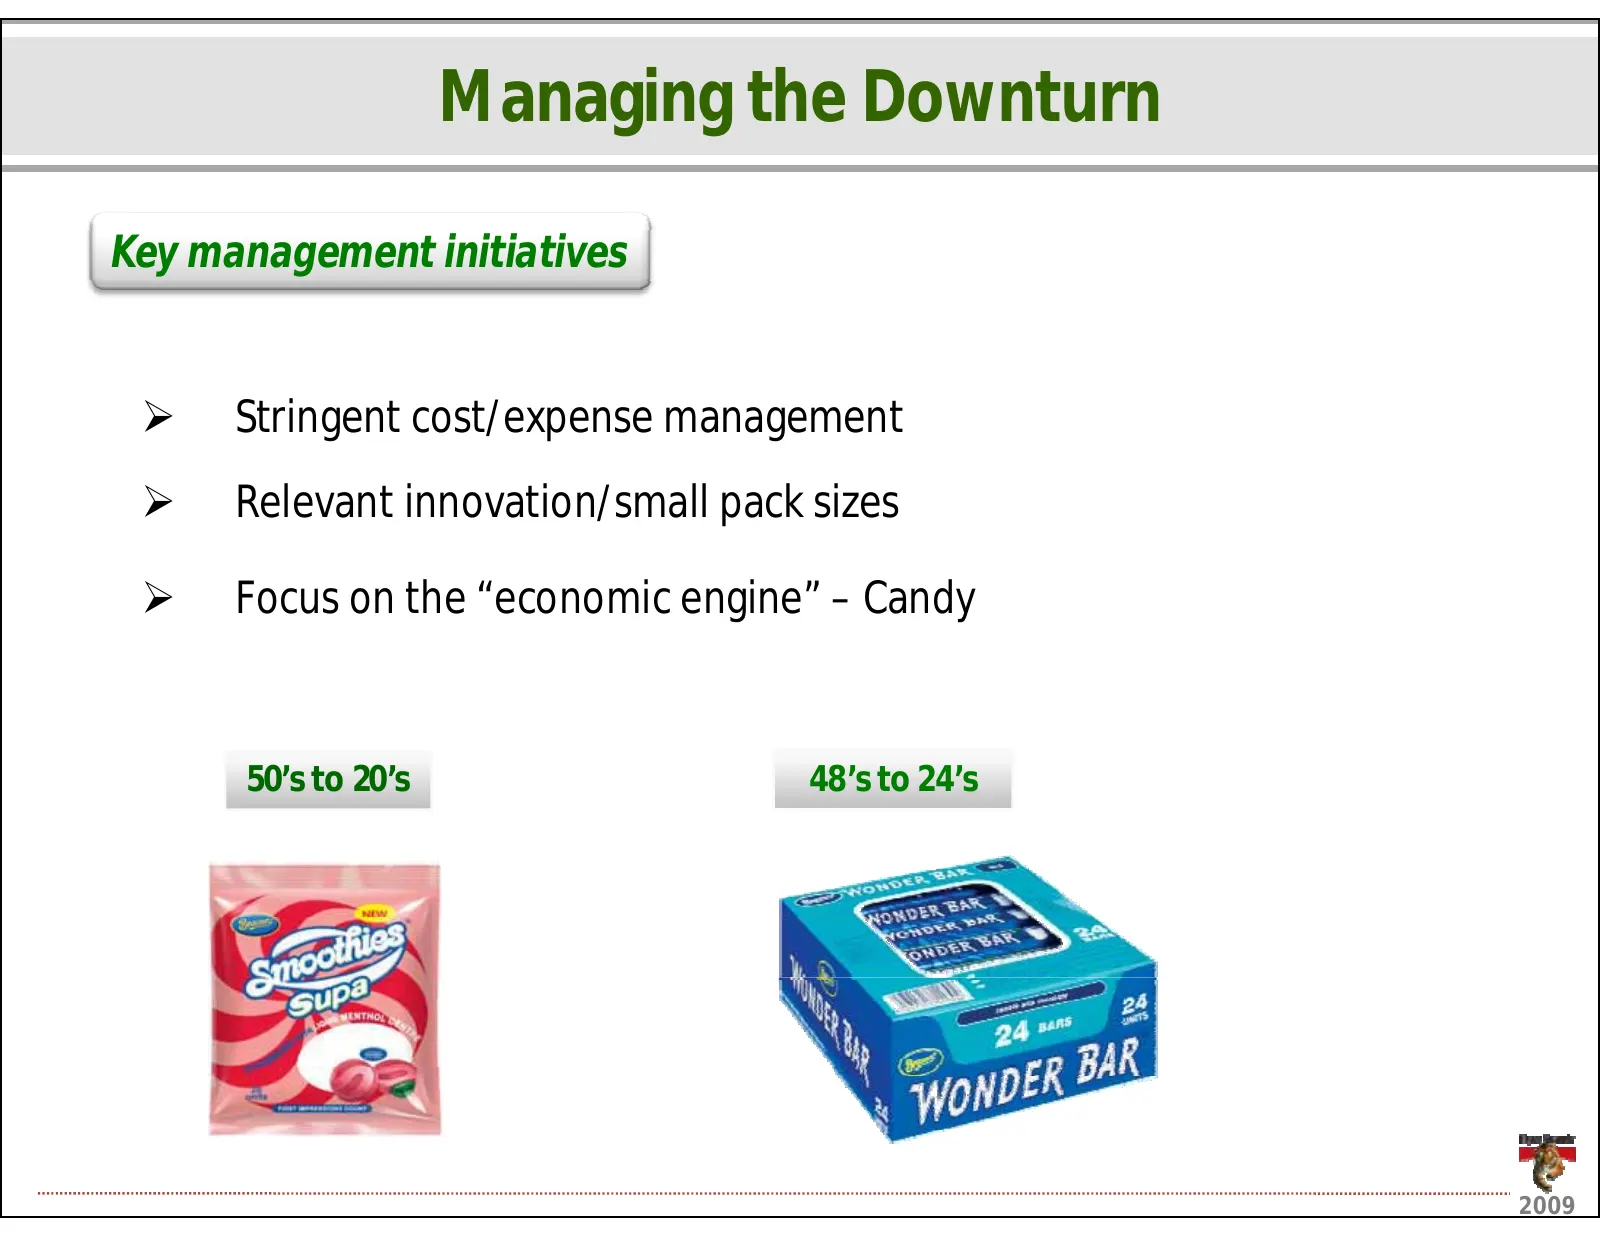
ManagingtheDownturn Keymanagementinitiatives ¾ Stringentcost/expensemanagement ¾ Relevantinnovation/smallpacksizes ¾ Focusonthe“economicengine”– g Candyy 50’sto20’s 48’sto24’s 8 2009
Slide 7: Snacks & Treats: Innovation remains key: Candy
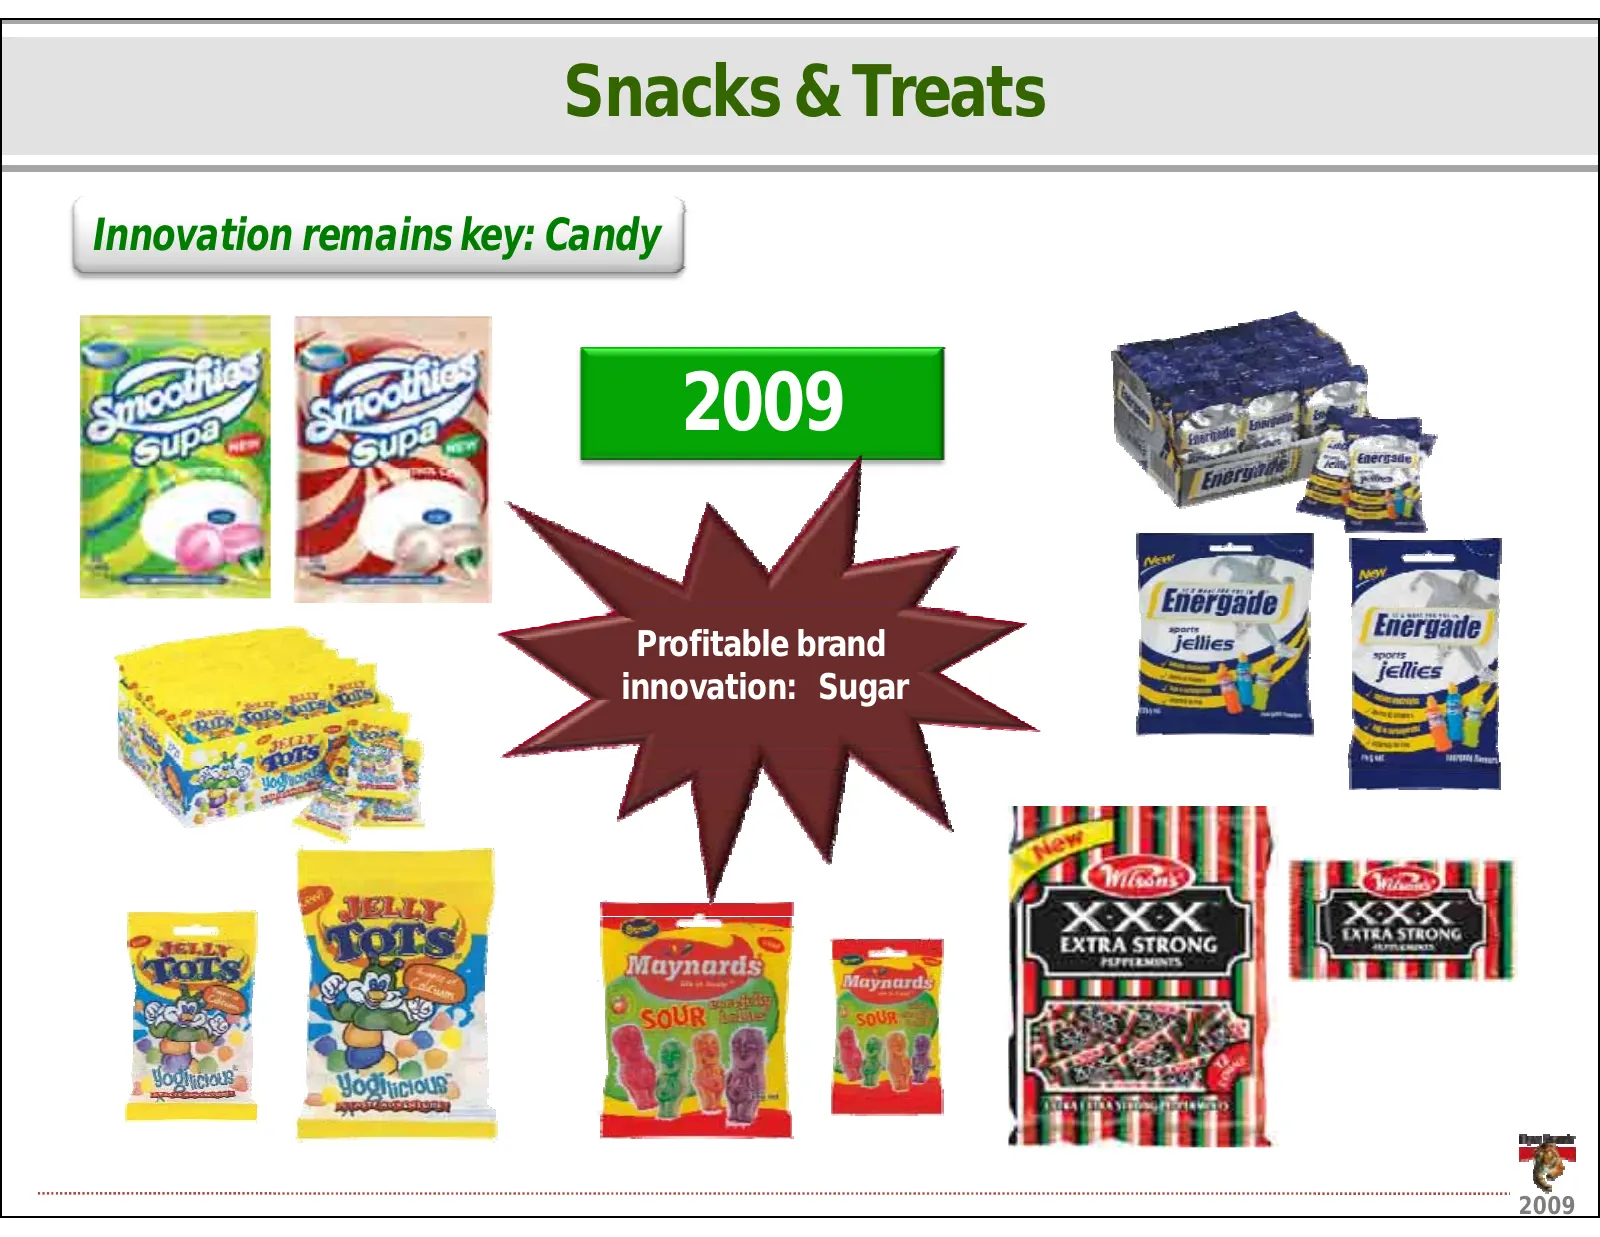
Snacks&Treats Innovationremainskey:Candy 2009 Profitablebrand innovation: Sugar 2009
Slide 8: Snacks & Treats: Innovation remains key: Chocolate
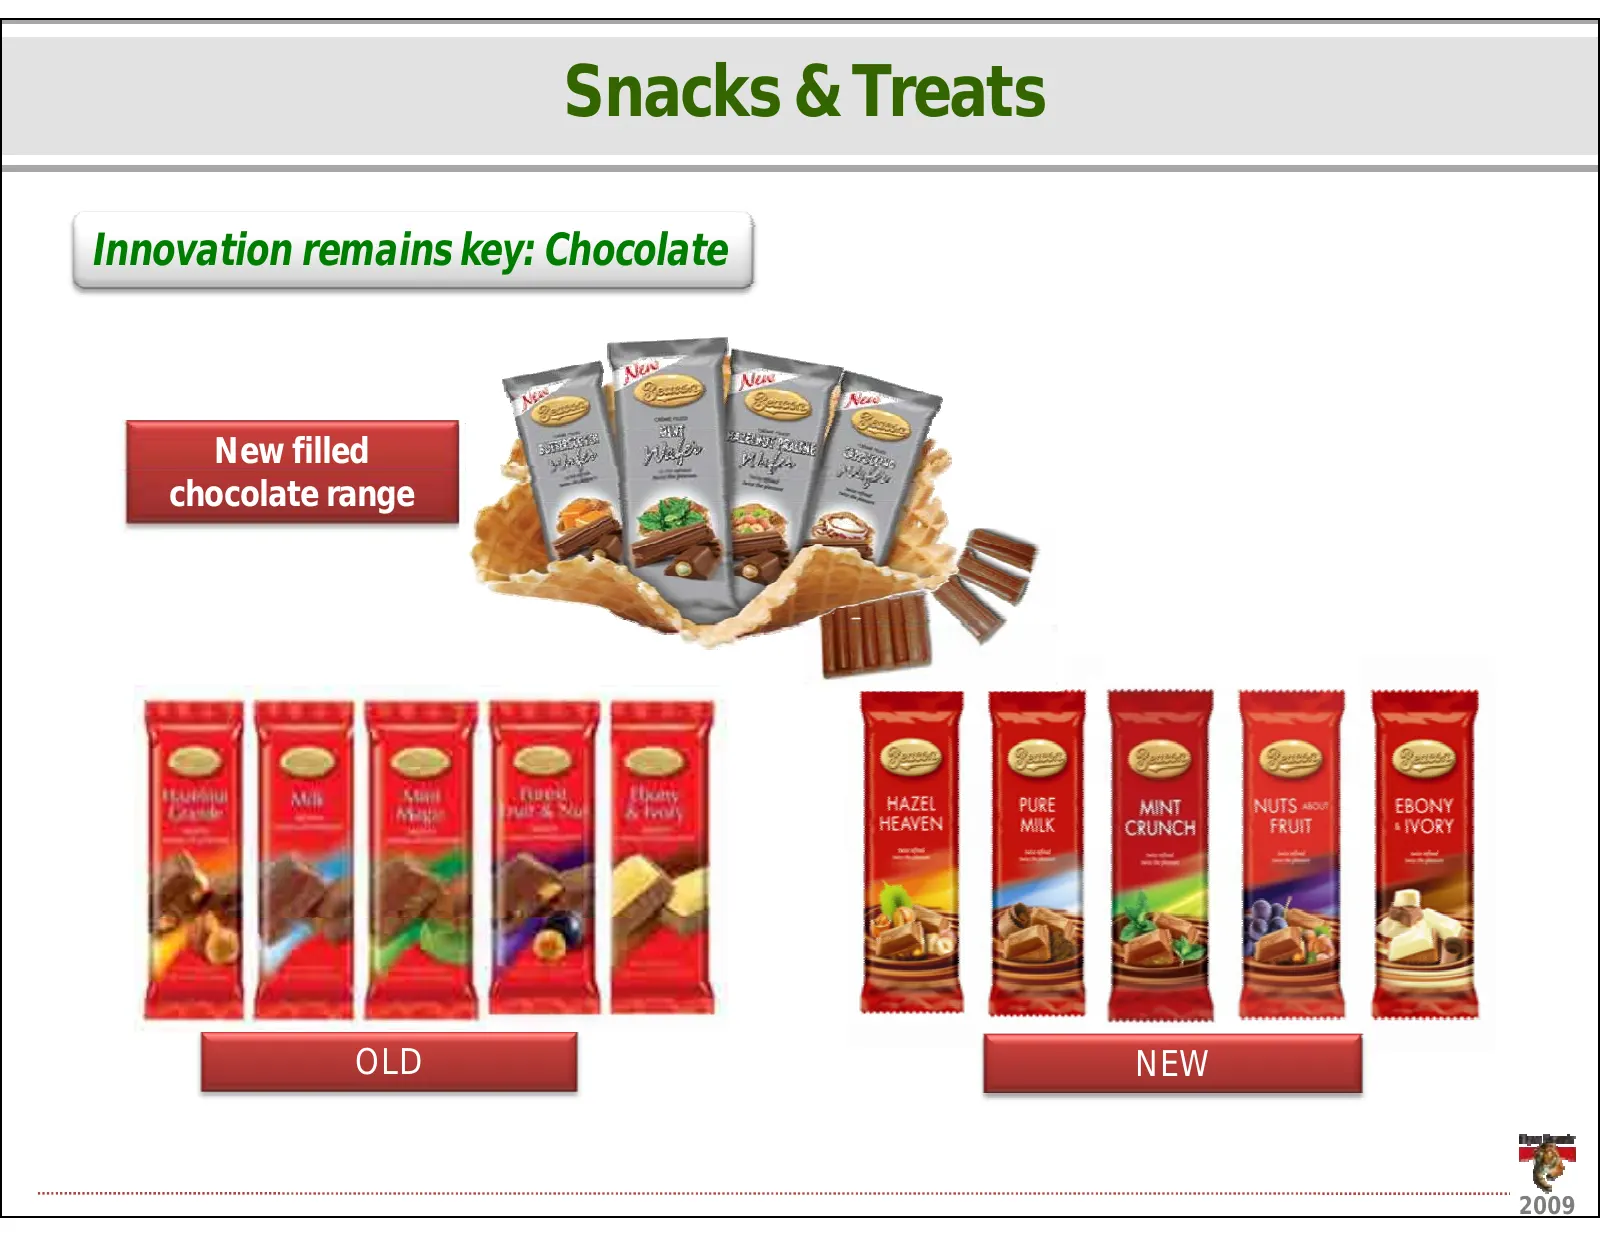
Snacks&Treats Innovationremainskey:Chocolate Newfilled chocolaterange OLD NEW 2009
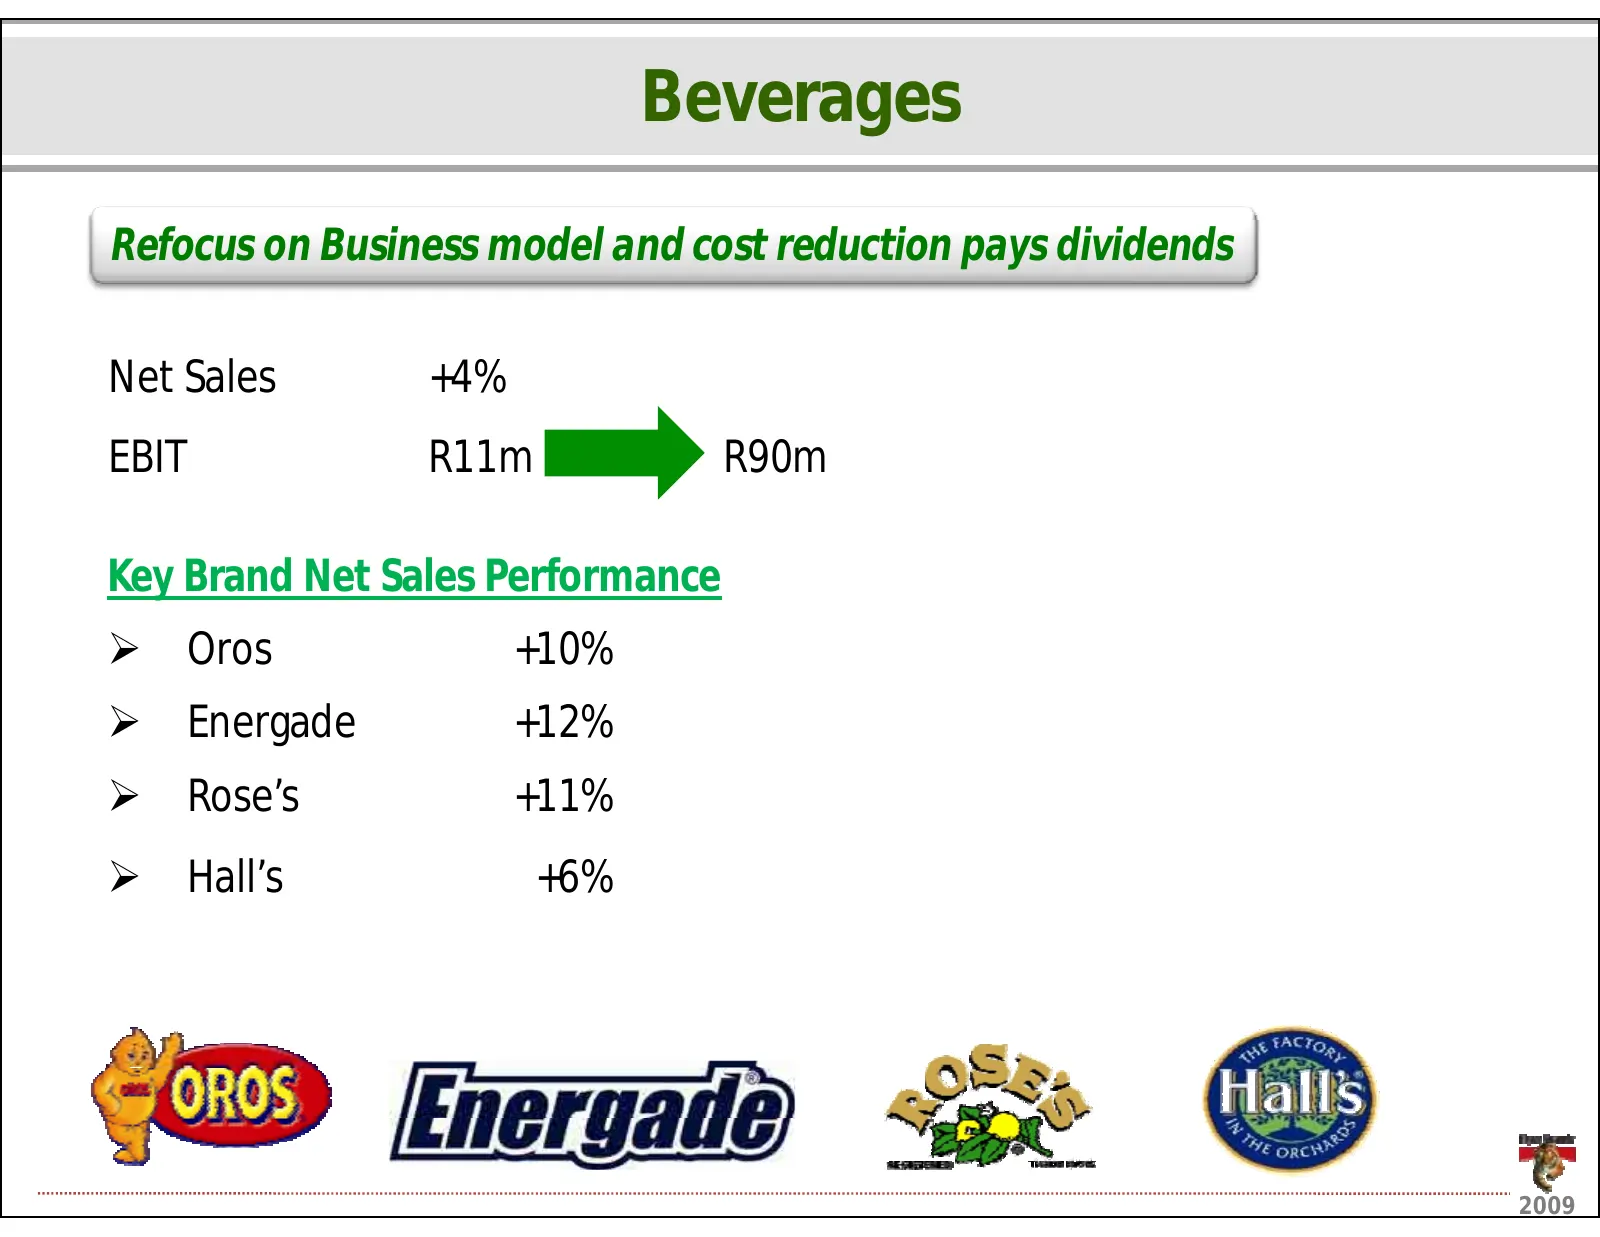
Slide 9: Beverages
Beverages RefocusonBusinessmodelandcostreductionpaysdividends NetSales +4% EBIT R11m R11mR90m R90m KeyBrandNetSalesPerformance ¾ Oros +10% ¾ Energade +12% ¾ Rose’s +11% ¾ Hall’s +6% 2009
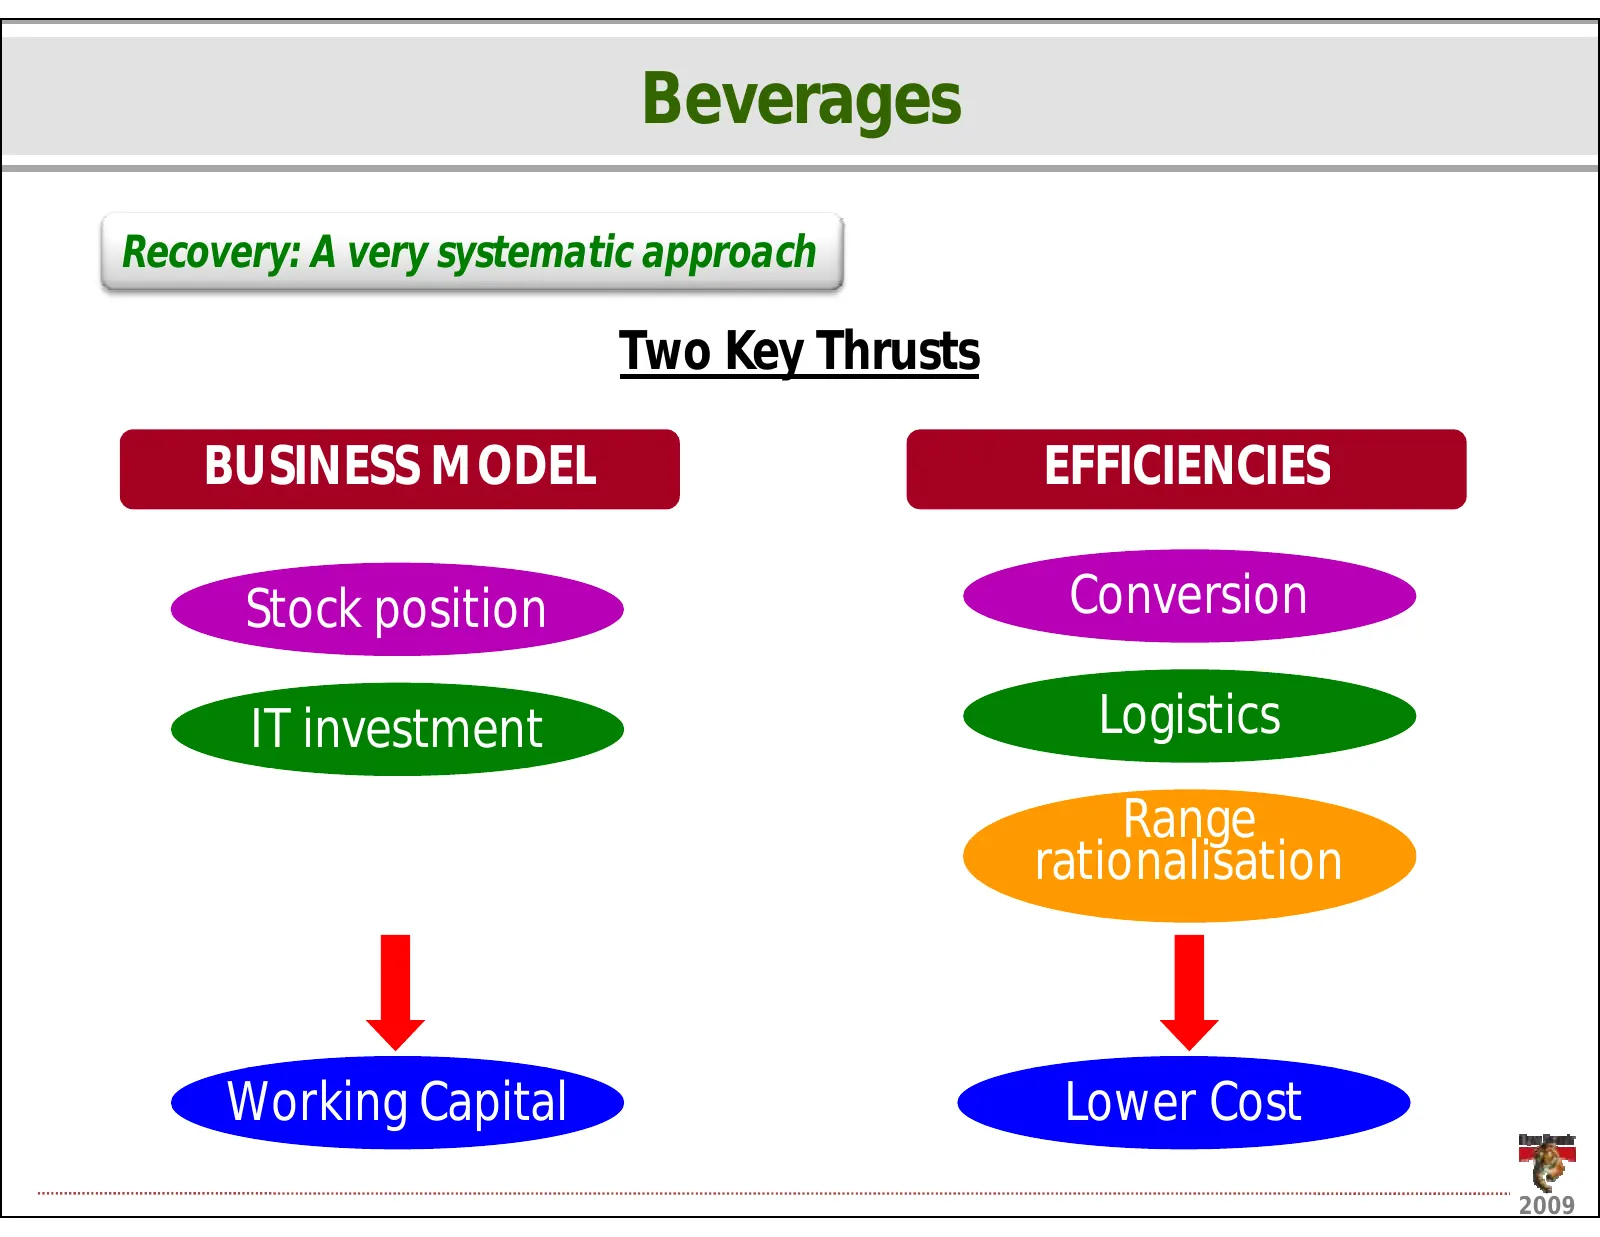
Slide 10: Beverages: Recovery: A very systematic approach
Beverages Recovery:Averysystematicapproach TwoKeyThrusts BUSINESS MODEL BUSINESSMODEL EFFICIENCIES Stock position Stockposition Conversion ITinvestment Logistics Range rationalisation WorkingCapital LowerCost 2009
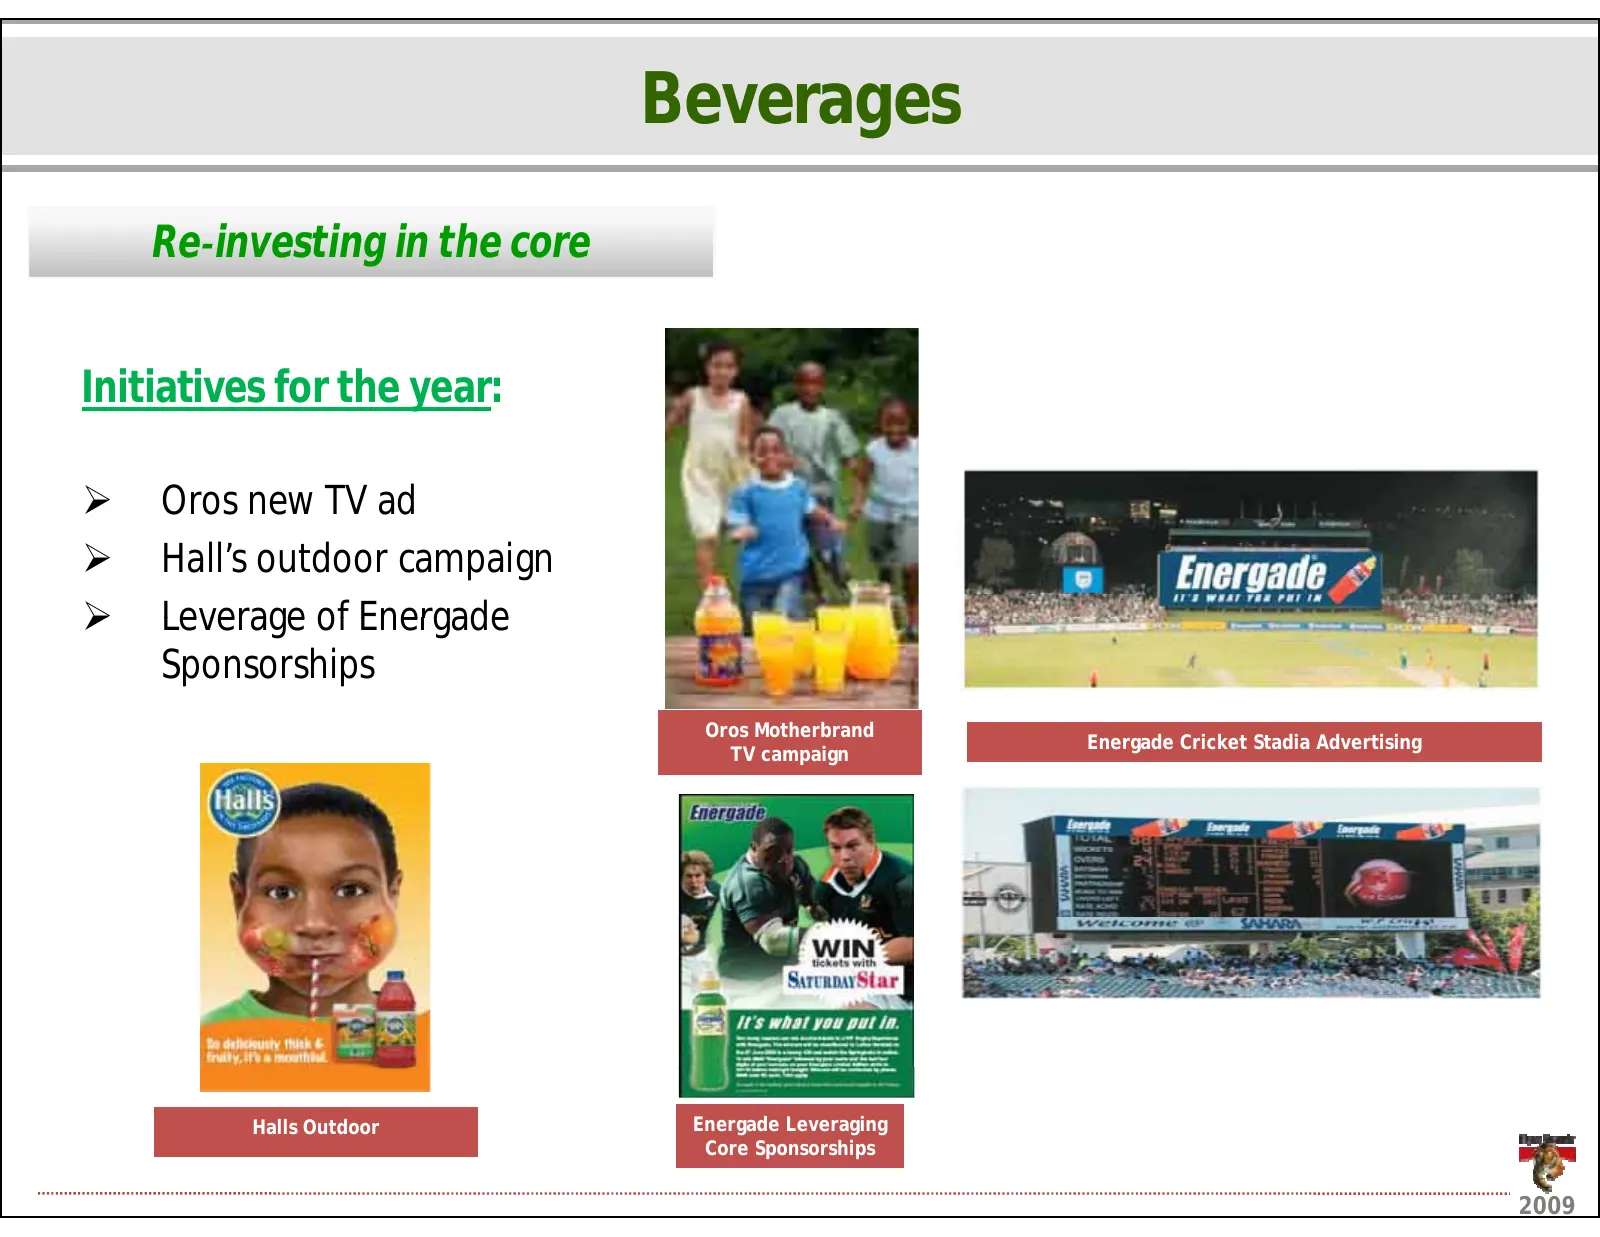
Slide 11: Beverages: Re-investing in the core
Beverages ReǦinvestinginthecore Initiativesfortheyear: ¾ OrosnewTVad ¾ Hall’soutdoorcampaign ¾ Leverage of Energade LeverageofEnergade Sponsorships Oros Motherbrand Energade Cricket Stadia Advertising TV campaign Halls Outdoor Energade Leveraging Core Sponsorships 2009
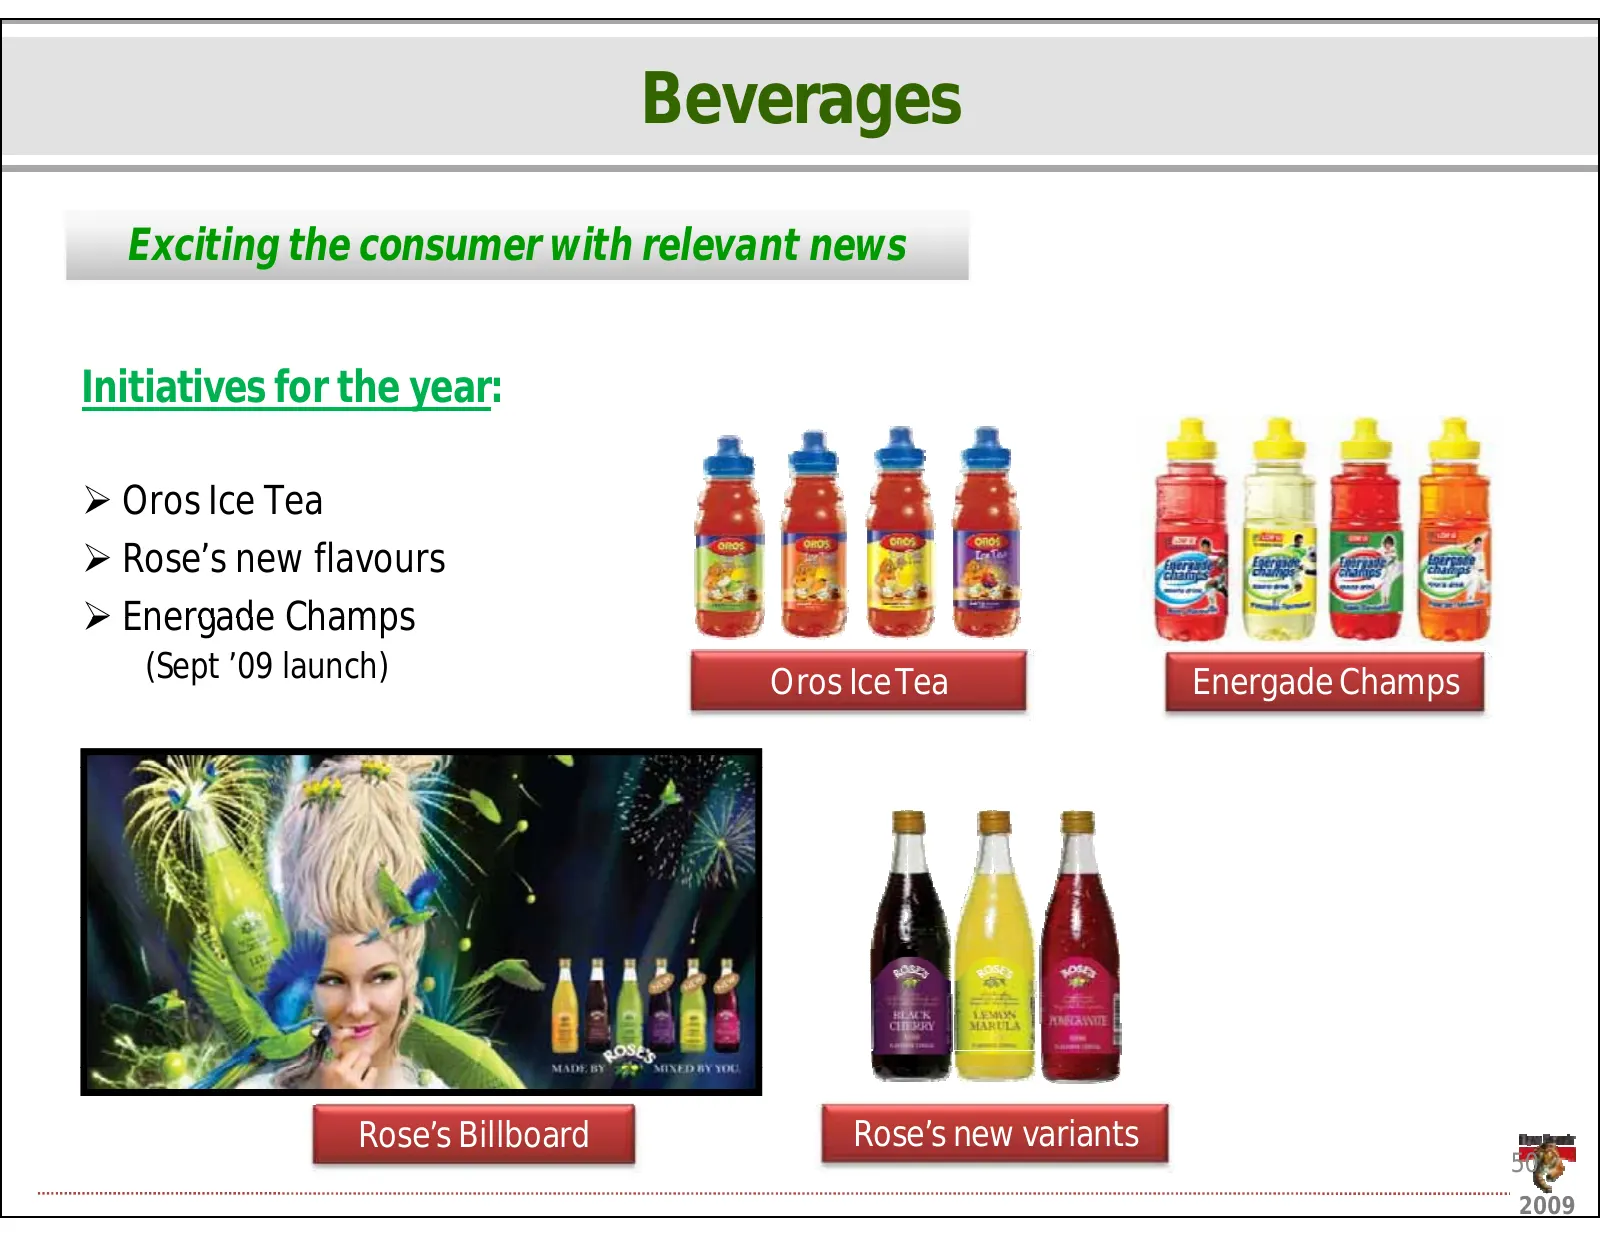
Slide 12: Beverages: Exciting the consumer with relevant news
Beverages Excitingtheconsumerwithrelevantnews Initiativesfortheyear: ¾ OrosIceTea ¾ Rose’snewflavours ¾ Energade EnergadeChamps Champs (Sept’09launch) OrosIceTea EnergadeChamps Rose’sBillboard Rose’snewvariants 50 2009
Slide 13: Beverages: Good progress but still work to be done
Beverages Goodprogressbutstillworktobedone ¾ Coststructure • Overheads • Manufacturing ¾ Productportfolio ¾ Continuedinvestmentinthecore C ti di t t i th 51 2009
Slide 14: Value Added Meat Products
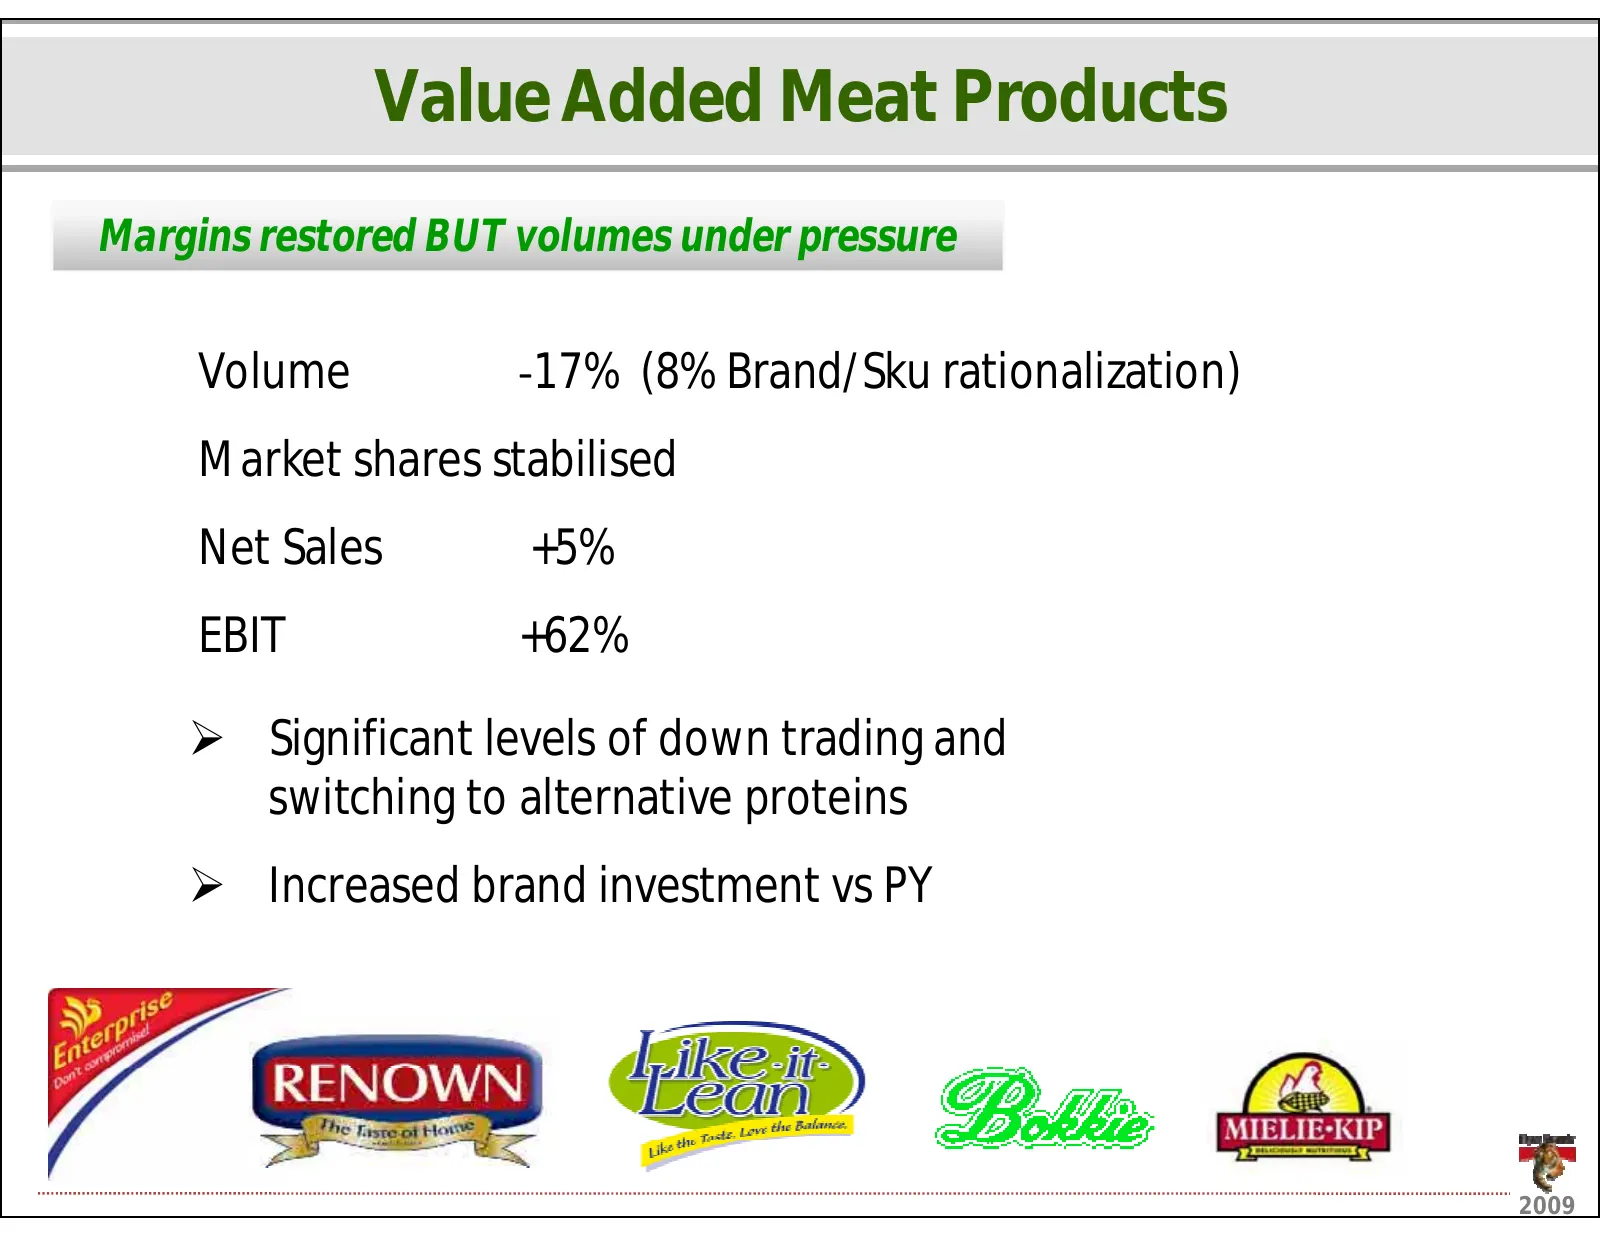
ValueAddedMeatProducts MarginsrestoredBUTvolumesunderpressure Volume Ͳ17%(8%Brand/Sku rationalization) Market shares stabilised Marketsharesstabilised NetSales +5% EBIT +62% ¾ Significantlevelsofdowntradingand switchingtoalternativeproteins ¾ IncreasedbrandinvestmentvsPY 2009
Slide 15: Value Added Meat Products: A focus on margin restoration
ValueAddedMeatProducts Afocusonmarginrestoration Managementinitiatives ¾ Cleanedupproductandbrandportfolios Cleaned up product and brand portfolios ¾ Pricepointmanagement ¾ Realised majoryieldbenefitsfromcapex ¾ Overheadreductiondrivenbyproductivitymeasures ¾ ValuereͲengineering 2009
Slide 16: Value Added Meat Products: We have continued to invest
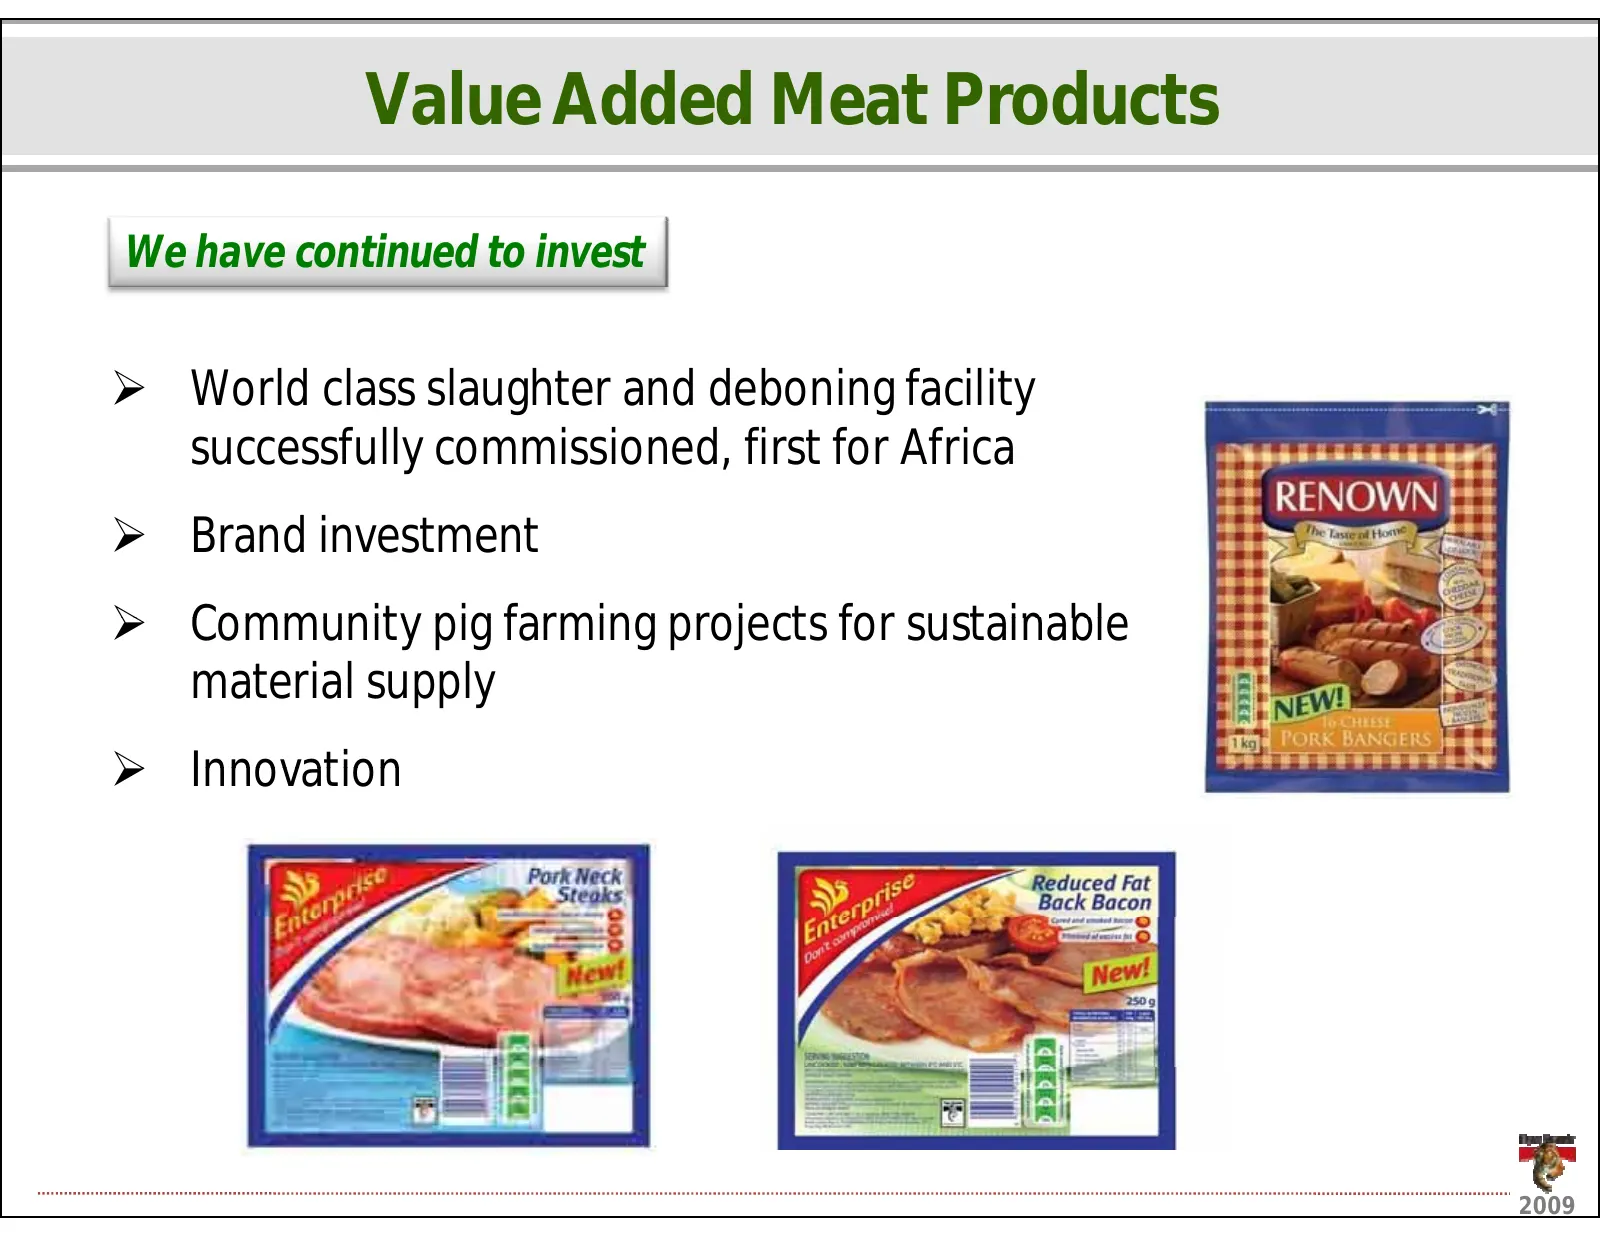
ValueAddedMeatProducts Wehavecontinuedtoinvest ¾ Worldclassslaughteranddeboningfacility y , successfullycommissioned,firstforAfrica ¾ Brandinvestment ¾ Community Communitypigfarmingprojectsforsustainable pig farming projects for sustainable materialsupply ¾ Innovation 2009
Slide 17: Home & Personal Care (HPC)
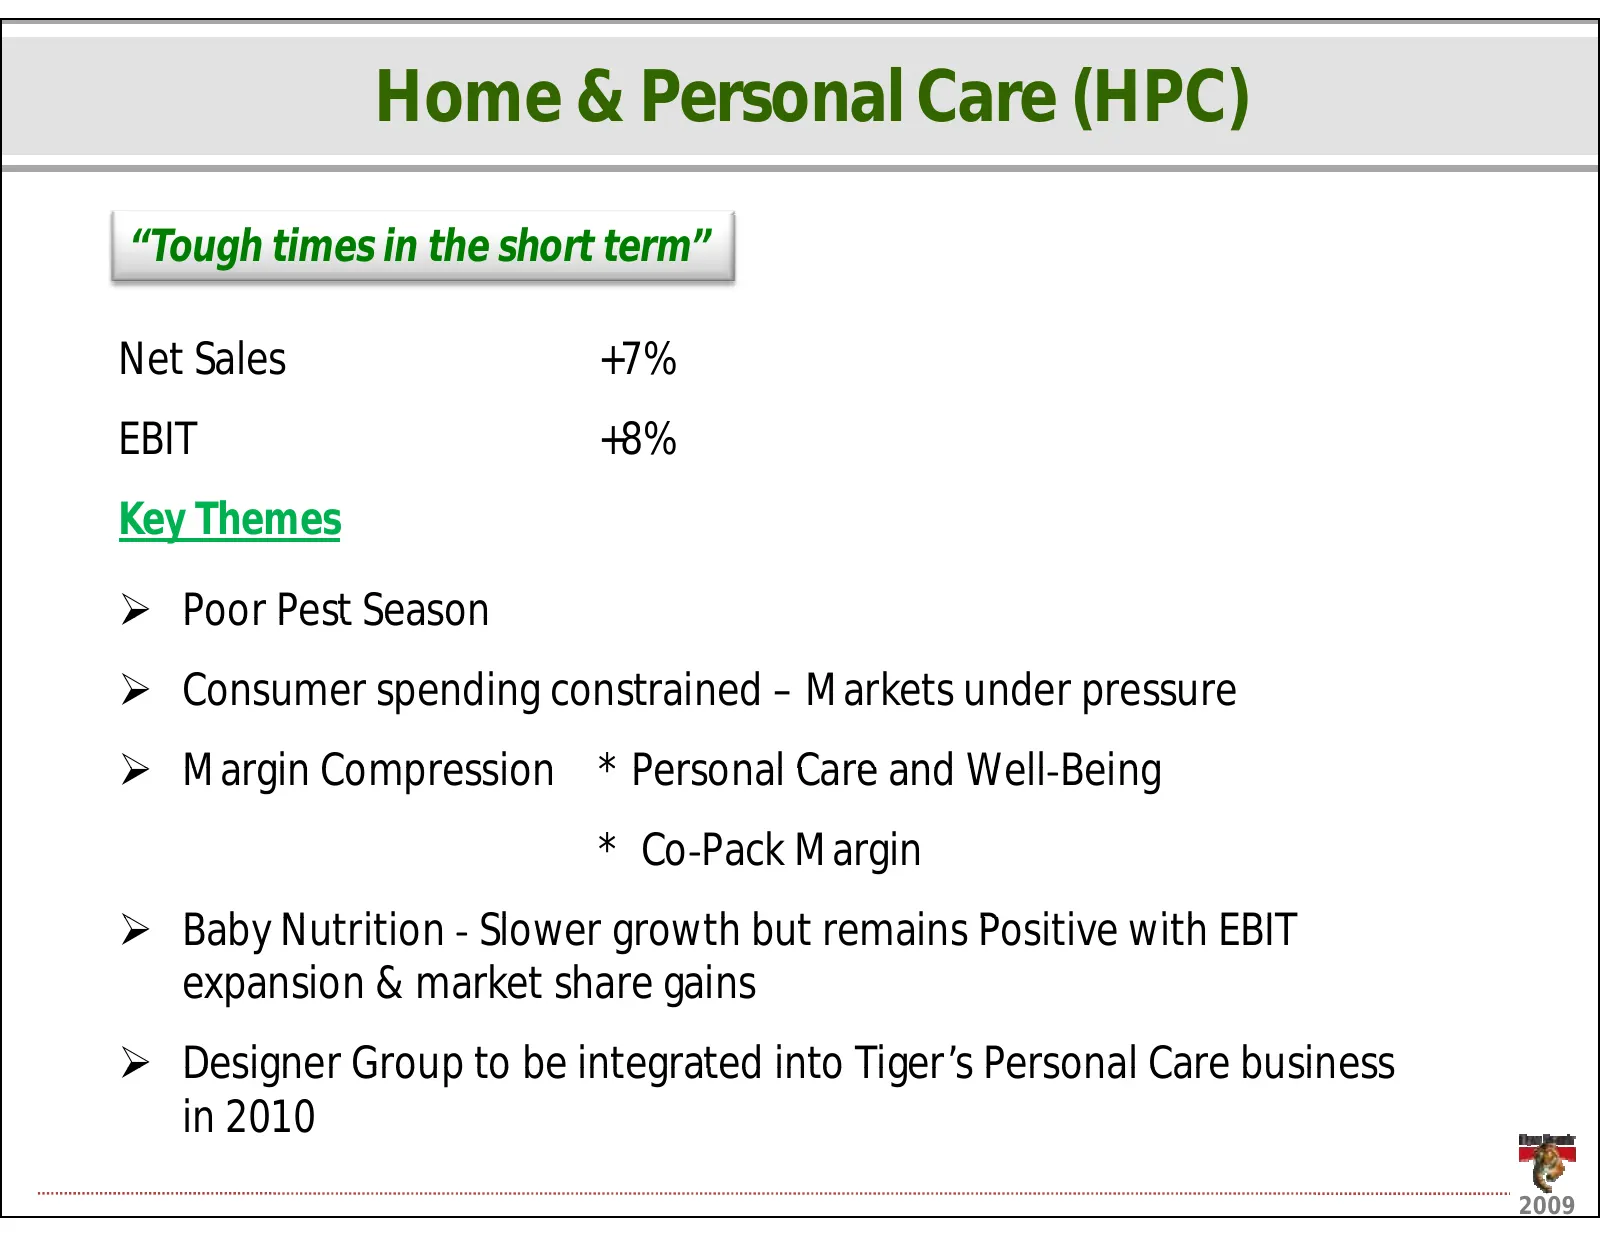
Home&PersonalCare(HPC) “Toughtimesintheshortterm” NetSales +7% EBIT +8% KeyThemes ¾ PoorPestSeason Poor Pest Season ¾ Consumerspendingconstrained– Marketsunderpressure ¾ MarginCompression Margin Compression *PersonalCareandWellͲBeing * Personal Care and Well Being *CoͲPackMargin ¾ BabyNutritionͲ B b
Slide 18: Home Care
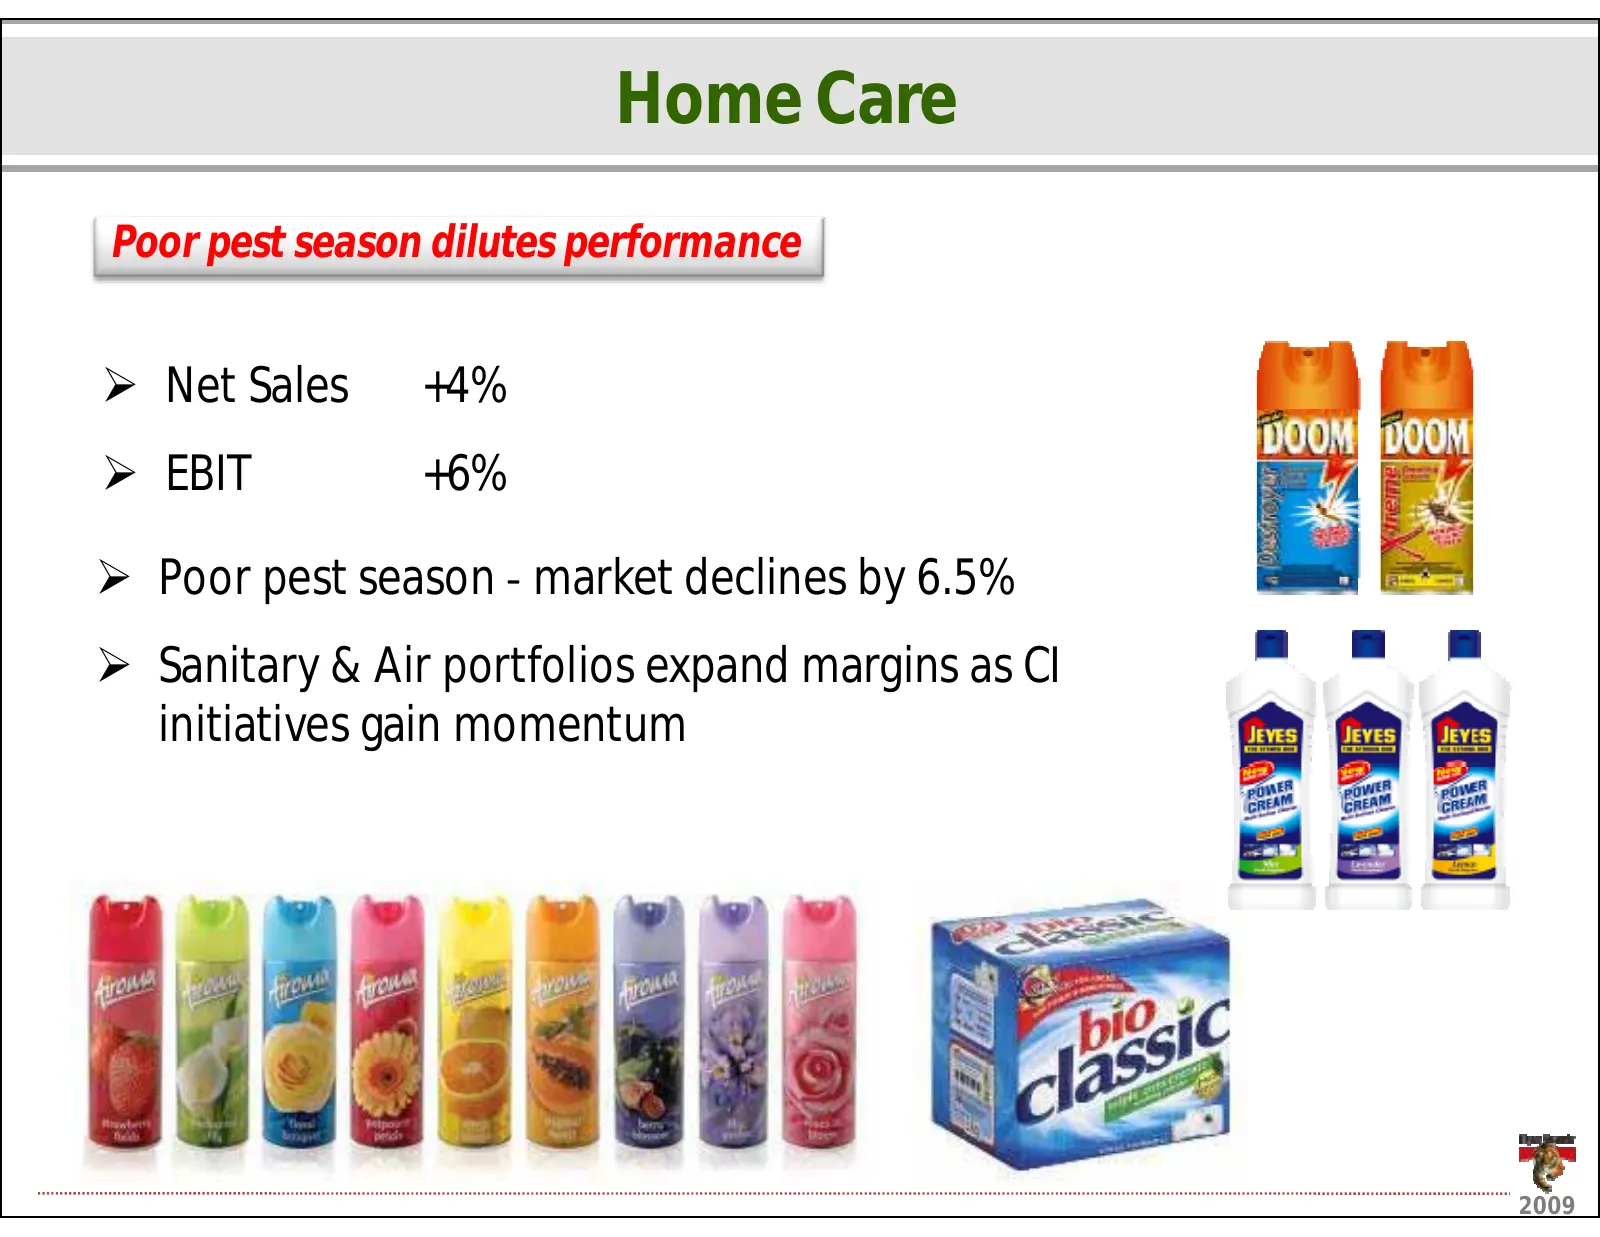
HomeCare Poorpestseasondilutesperformance ¾ NetSales +4% ¾ EBIT +6% ¾ PoorpestseasonͲ marketdeclinesby6.5% ¾ Sanitary&AirportfoliosexpandmarginsasCI initiativesgainmomentum 2009
Slide 19: Home Care: Value Based Innovation
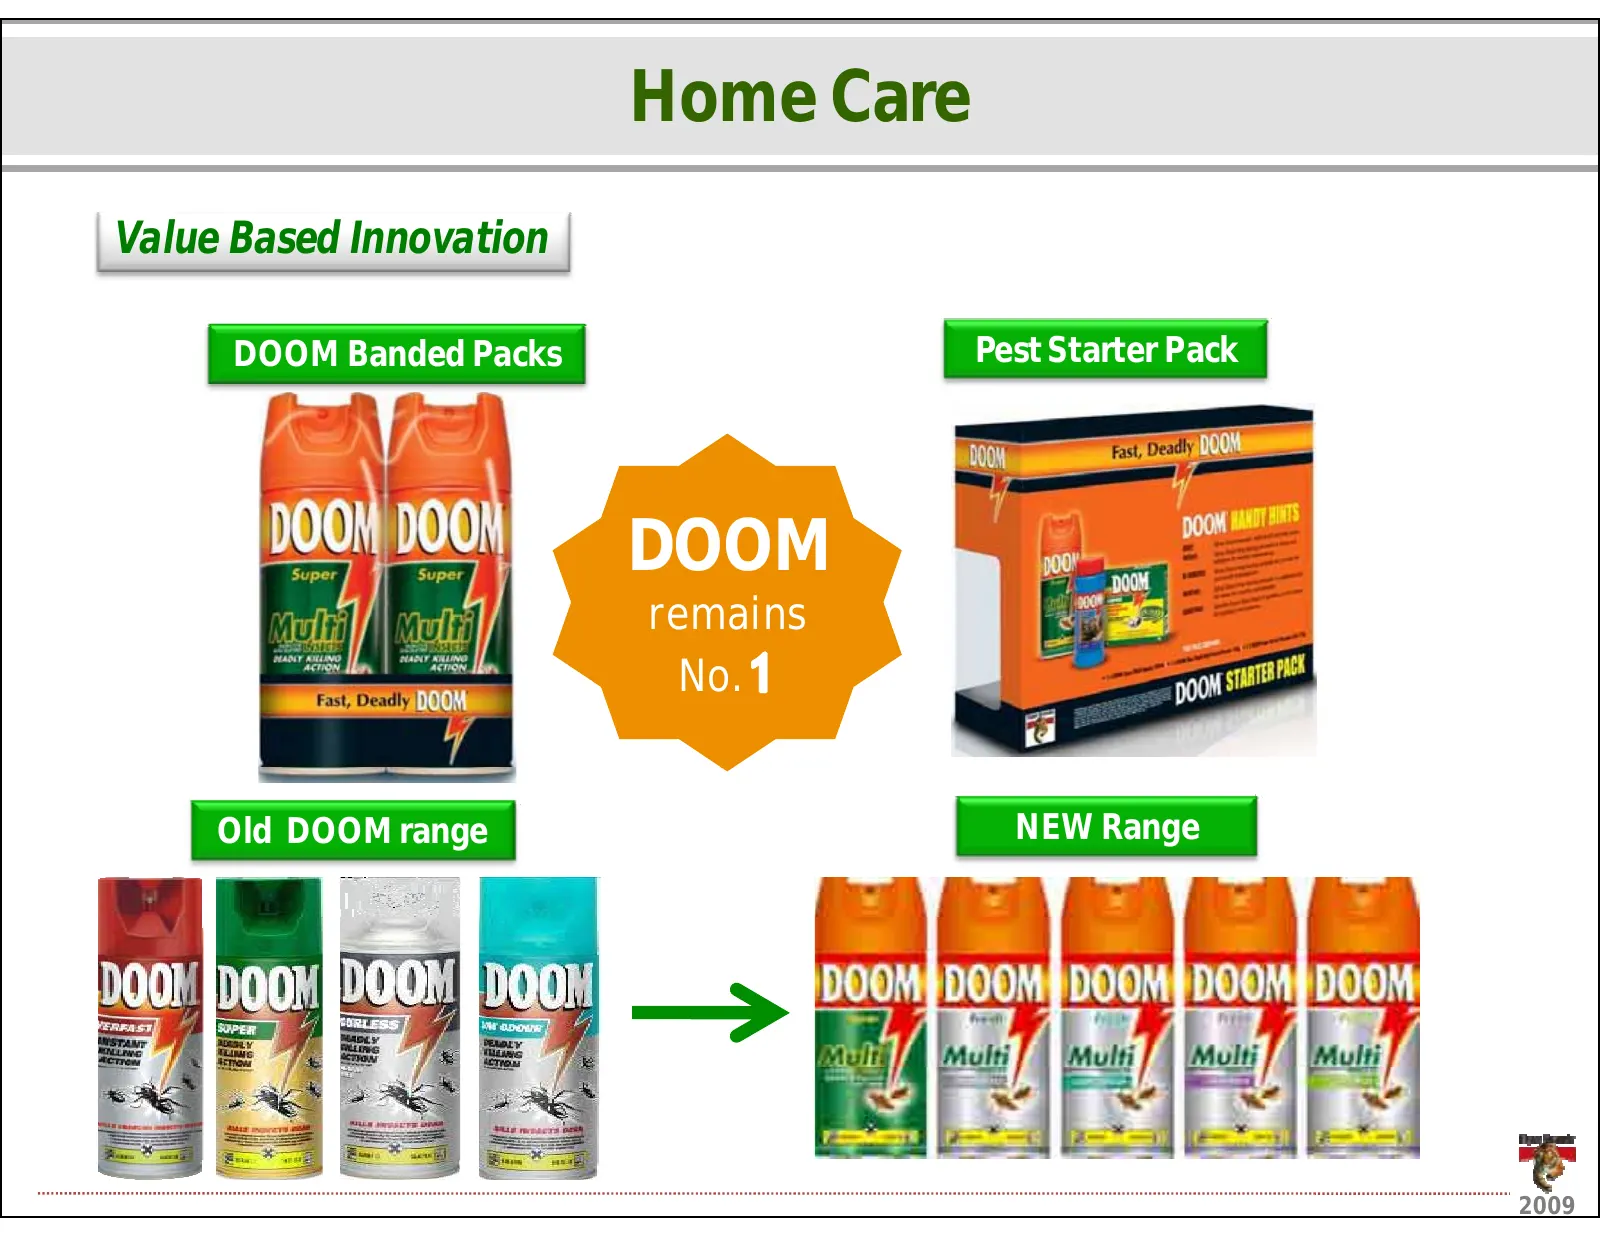
HomeCare ValueBasedInnovation DOOMBandedPacks PestStarterPack DOOM remains No. OldDOOMrange NEWRange 2009
Slide 20: Home Care: Umbrella Branding: Driving Synergies
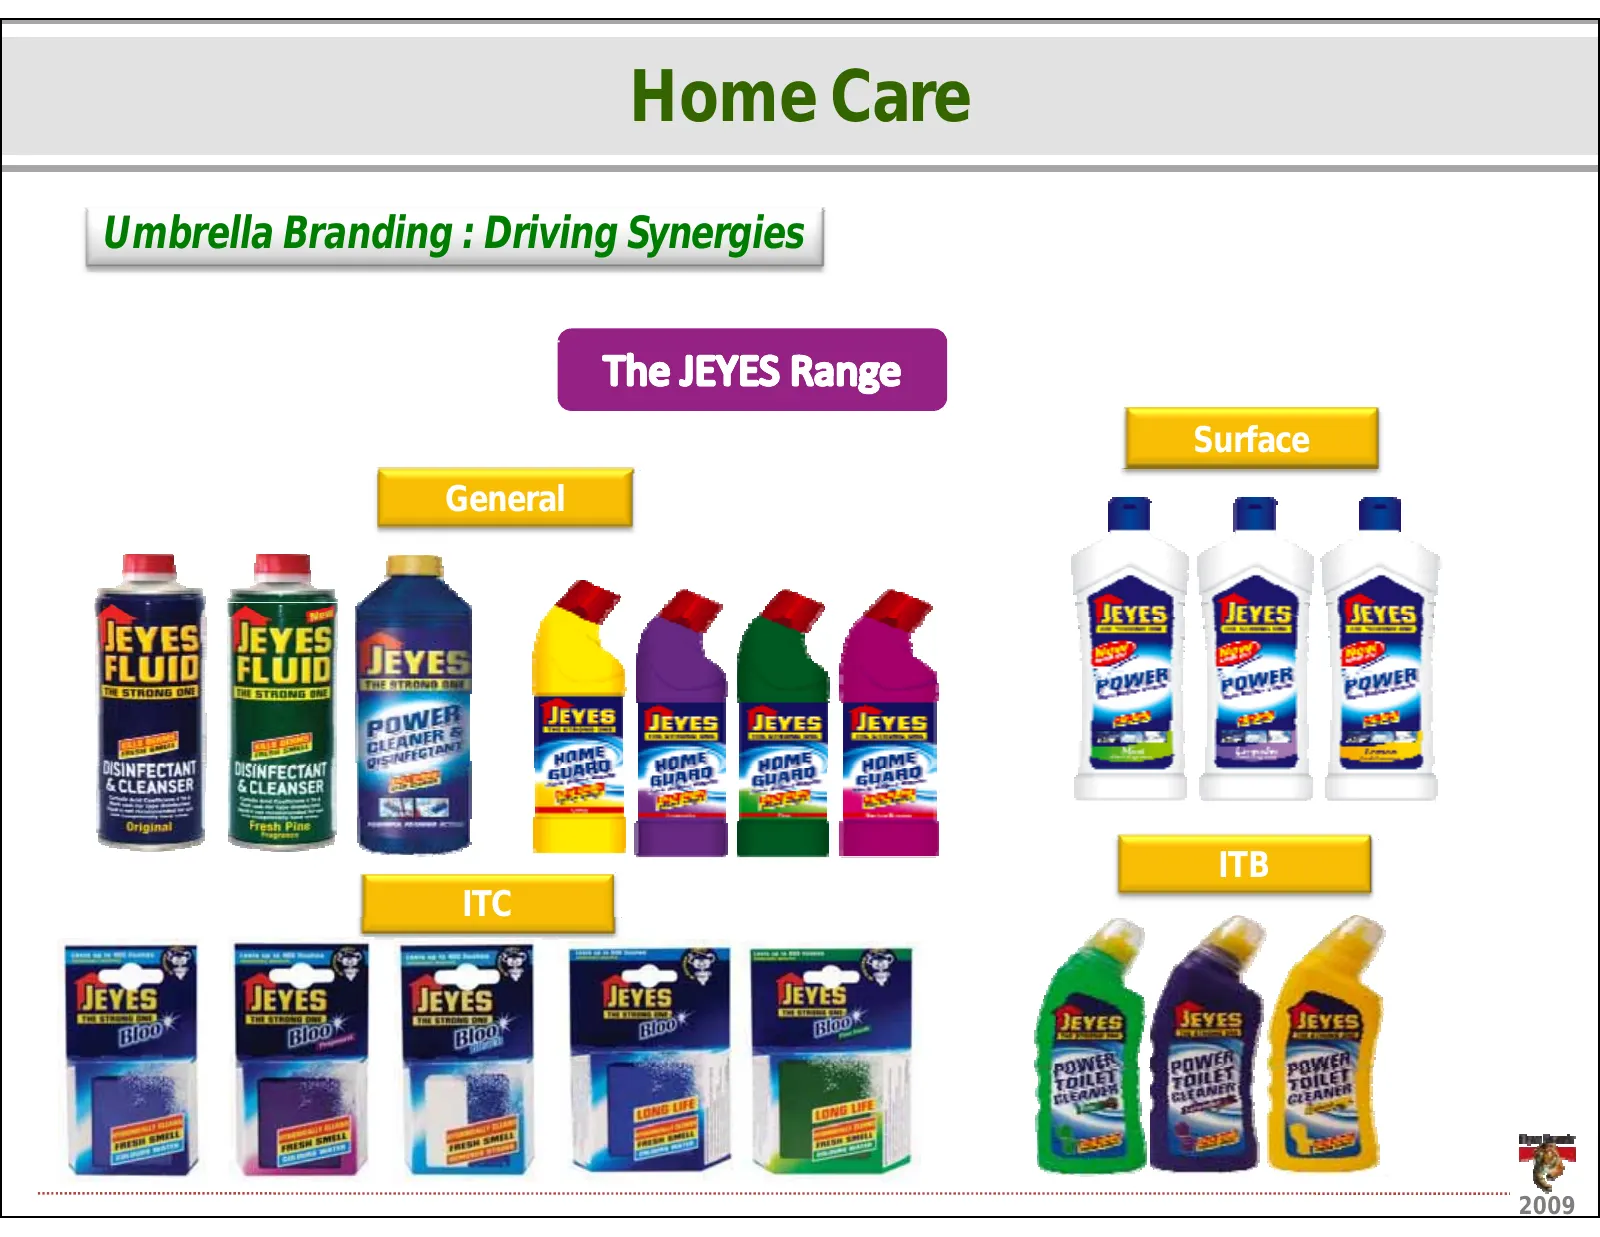
HomeCare UmbrellaBranding:DrivingSynergies Surface General ITB ITC 2009
Slide 21: Personal Care
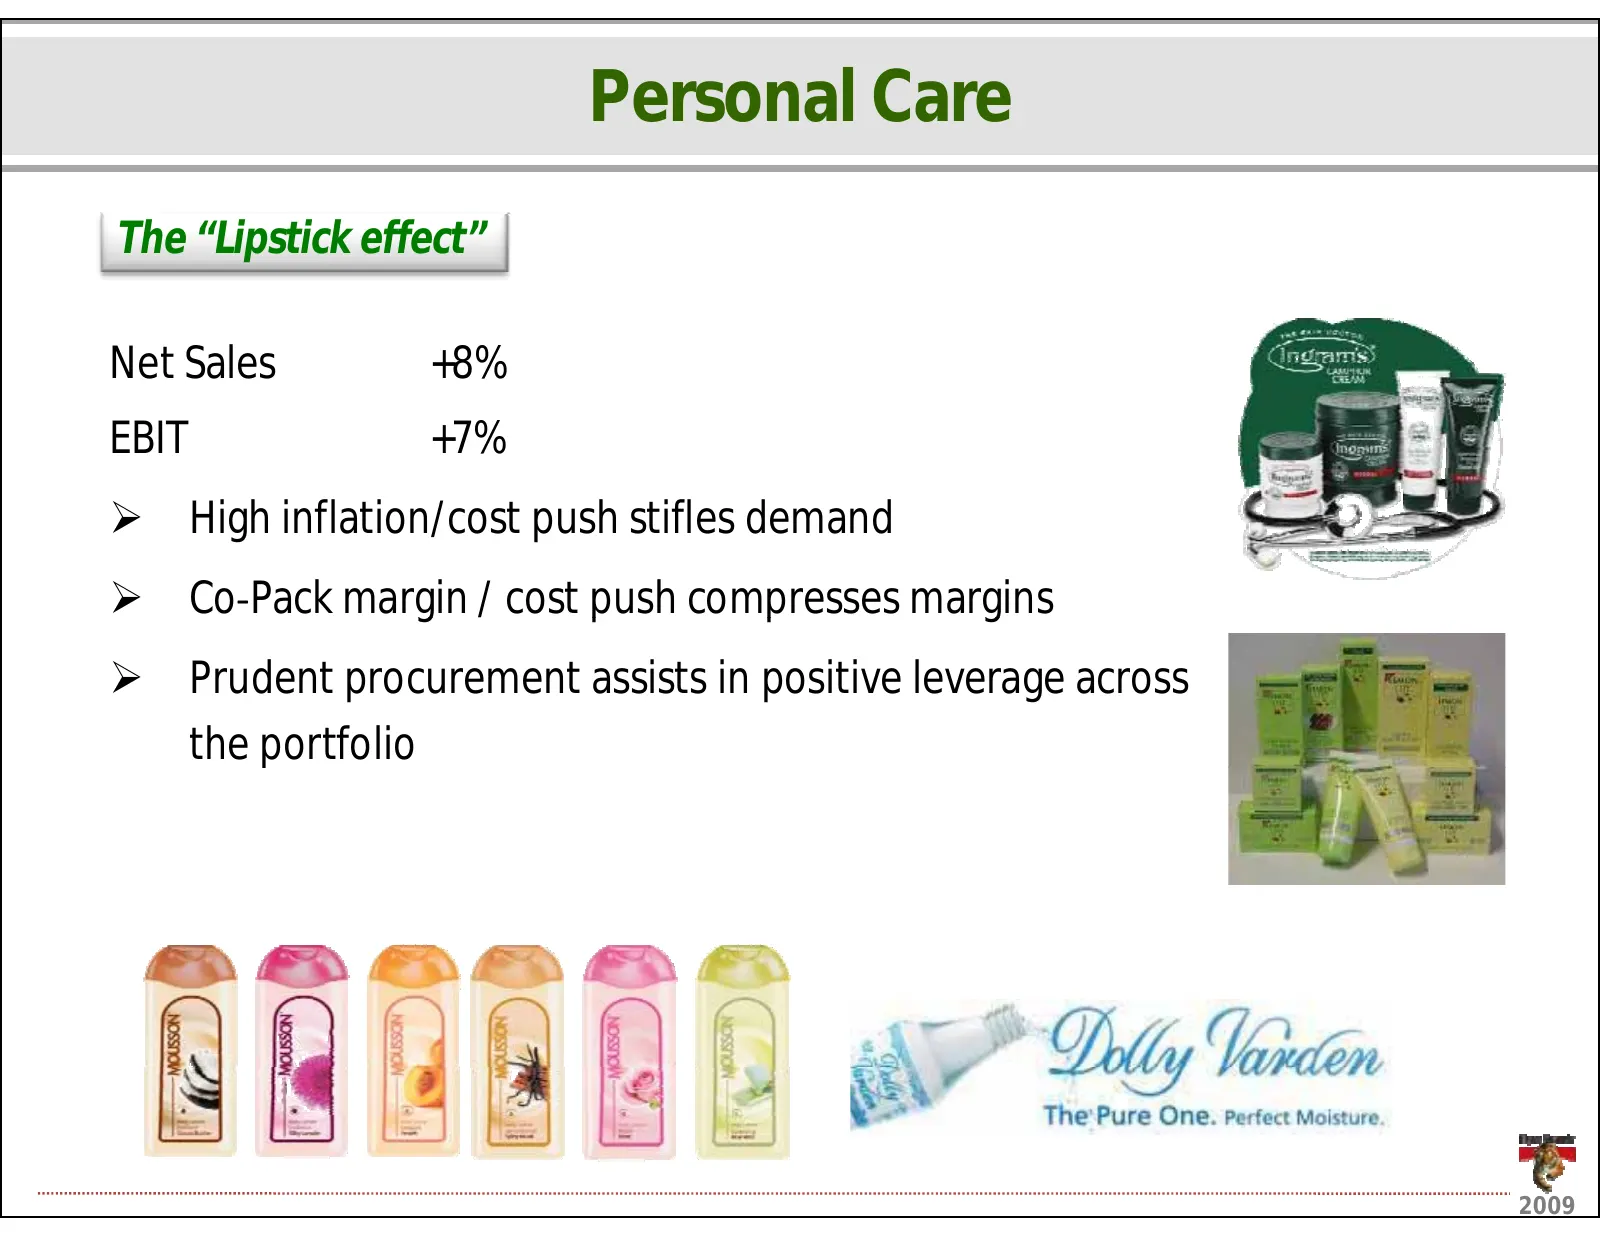
PersonalCare The“Lipstickeffect” NetSales +8% EBIT +7% ¾ Highinflation/costpushstiflesdemand ¾ CoͲPackmargin/costpushcompressesmargins g / p p g ¾ Prudentprocurementassistsinpositiveleverageacross theportfolio 2009
Slide 22: Personal Care: Re-investing in brands and facilities
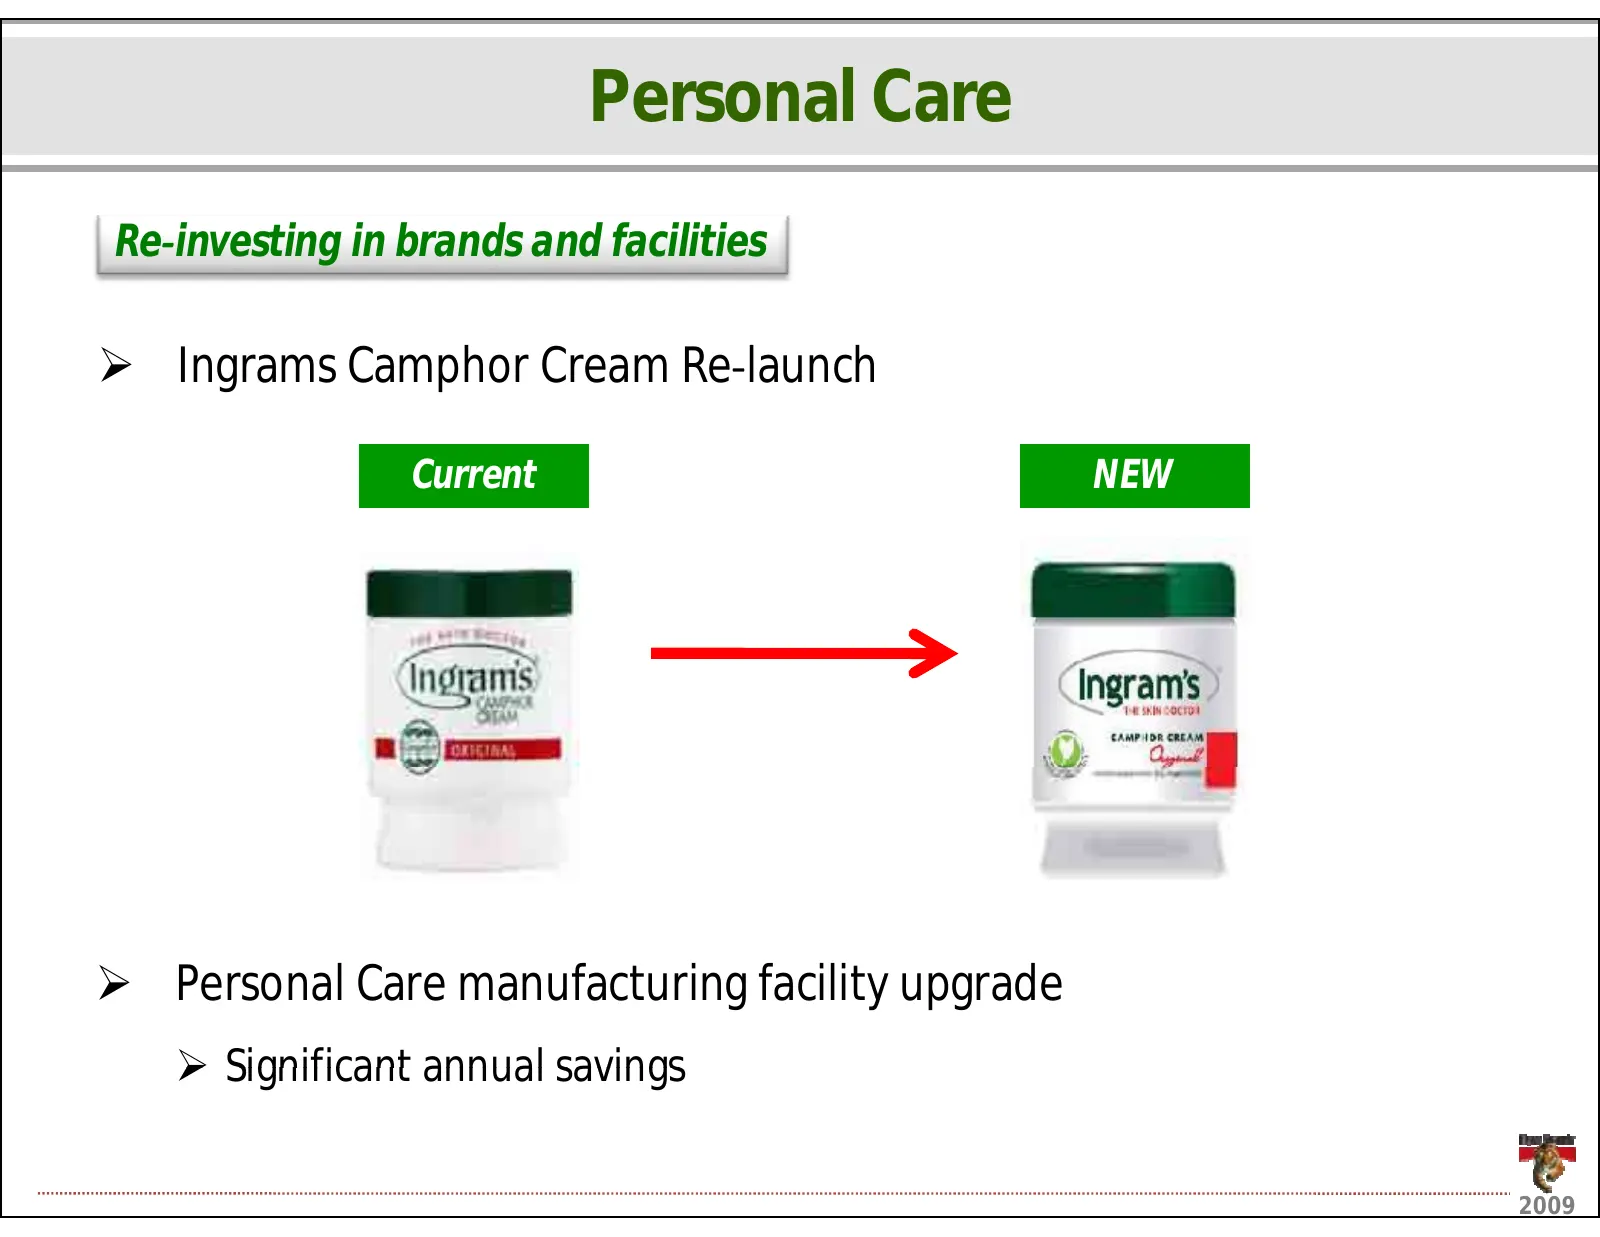
PersonalCare ReͲinvestinginbrandsandfacilities ¾ IngramsCamphorCreamReͲlaunch C Current t NEW ¾ PersonalCaremanufacturingfacilityupgrade ¾ Significantannualsavings Significant annual savings 2009
Slide 23: Designer Group
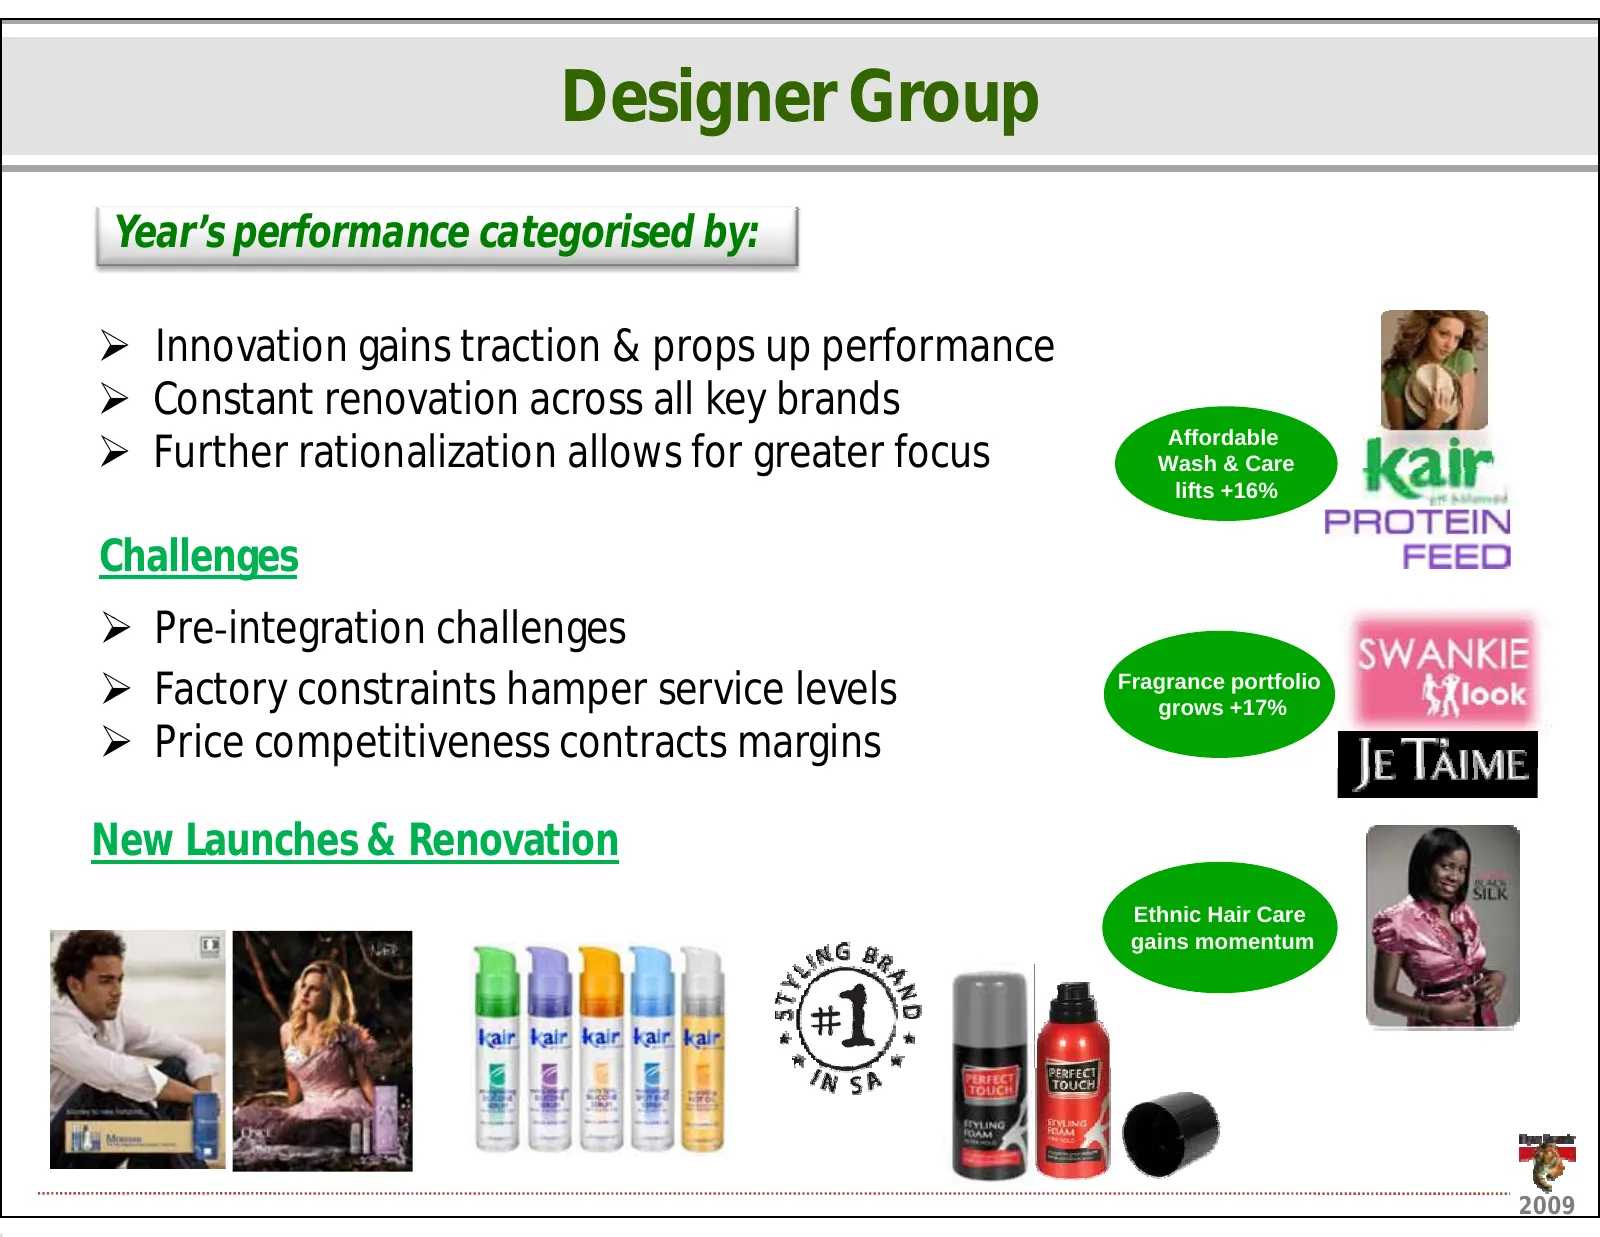
DesignerGroup Year’sperformancecategorised by: ¾ Innovationgainstraction&propsupperformance ¾ Constantrenovationacrossallkeybrands ¾ Furtherrationalizationallowsforgreaterfocus Affordable u t e at o a at o a o s o g eate ocus Wash & Care lifts +16% Challenges ¾ PreͲintegrationchallenges P i t ti h l
Slide 24: Baby Category
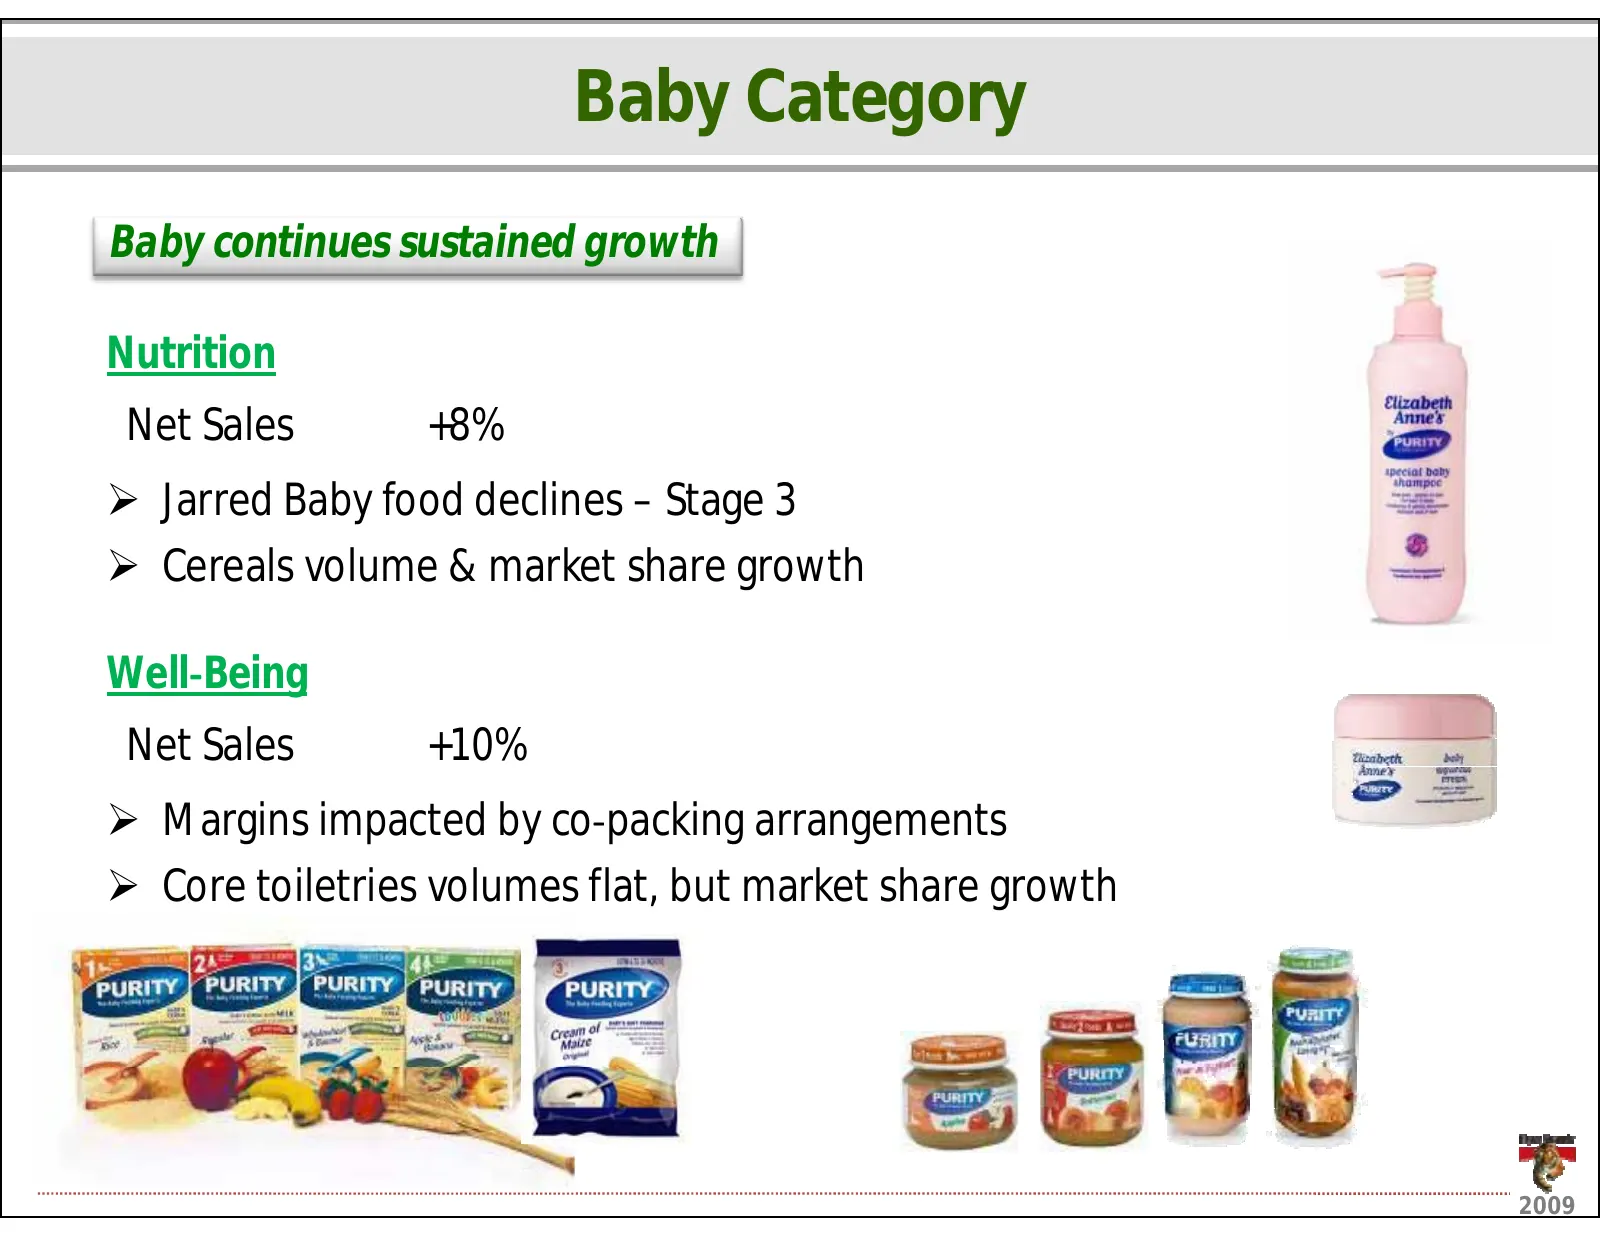
BabyCategory Babycontinuessustainedgrowth Nutrition NetSales +8% ¾ JarredBabyfooddeclines– Stage3 ¾ Cerealsvolume&marketsharegrowth WellͲBeing NetSales +10% ¾ MarginsimpactedbycoͲpackingarrangements ¾ Coretoiletriesvolumesflat,butmarketsharegrowth 2009
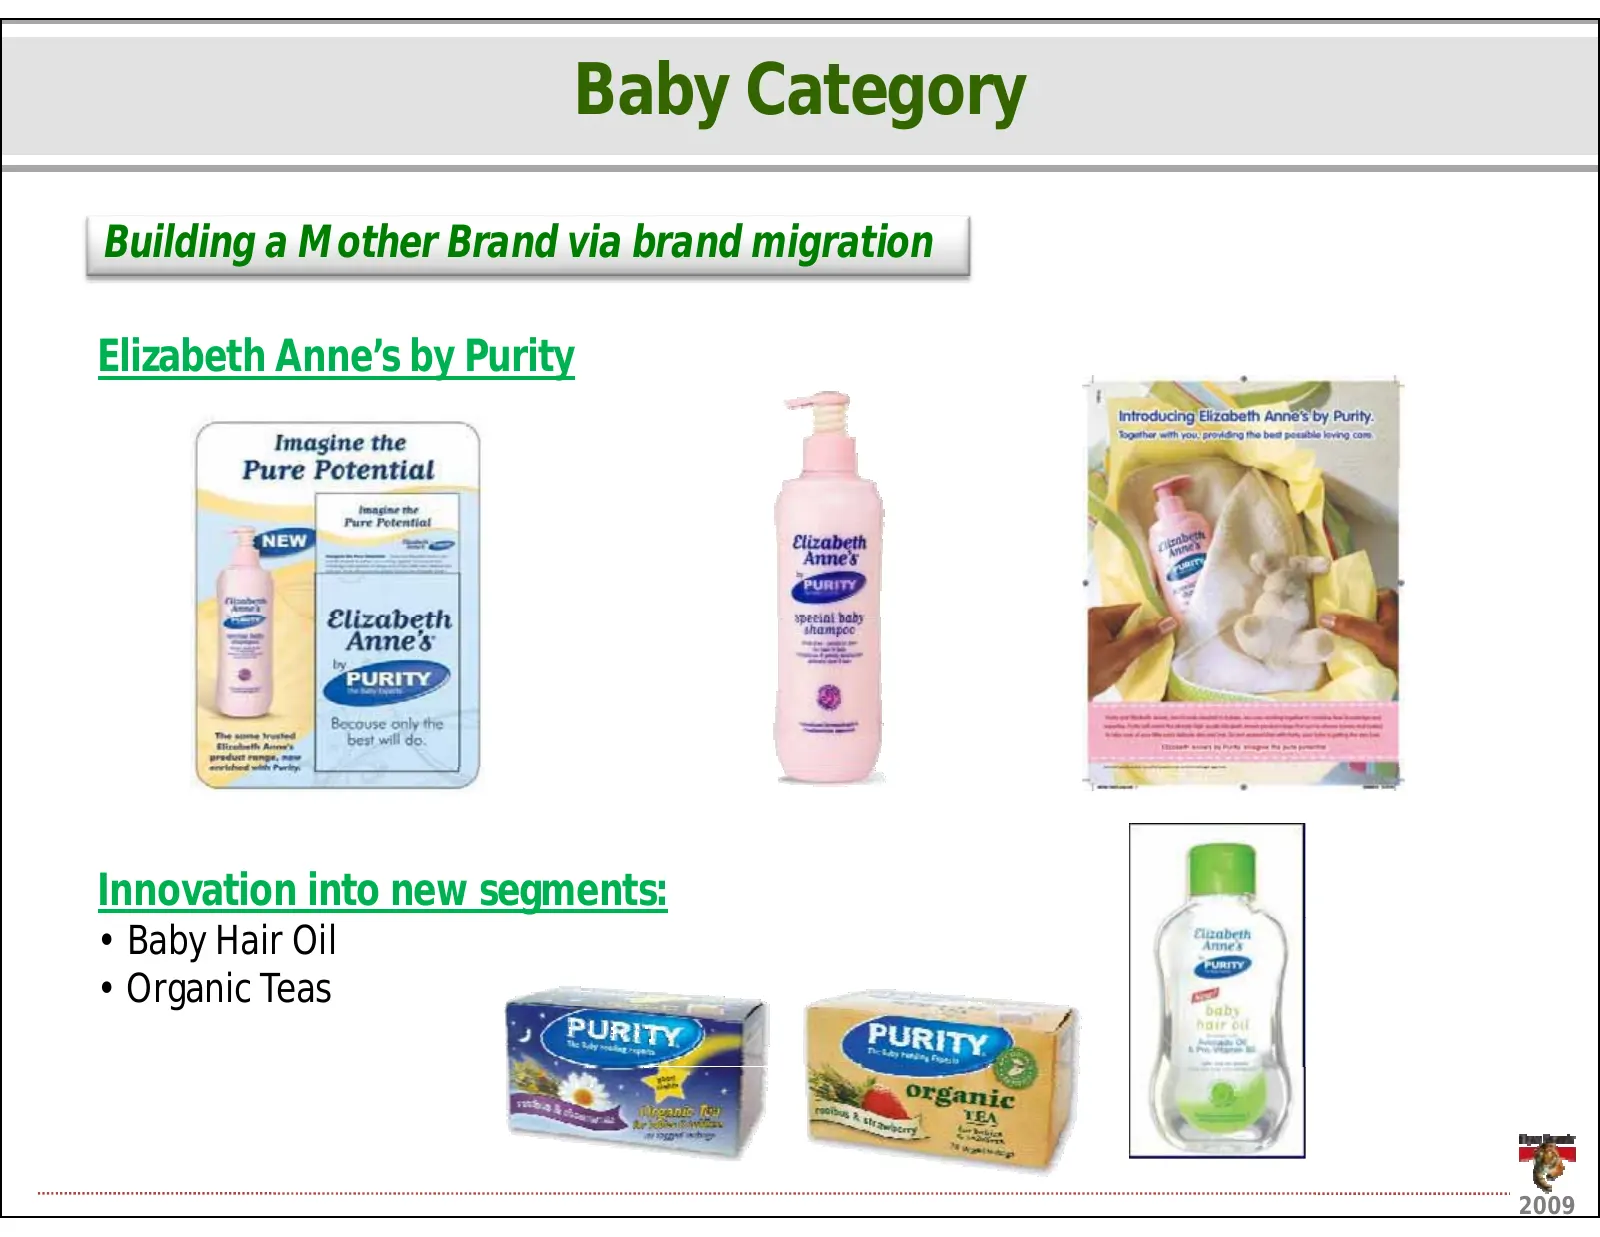
Slide 25: Baby Category: Building a Mother Brand via brand migration
BabyCategory BuildingaMotherBrandviabrandmigration ElizabethAnne’sbyPurity Innovationintonewsegments: • BabyHairOil • OrganicTeas 2009
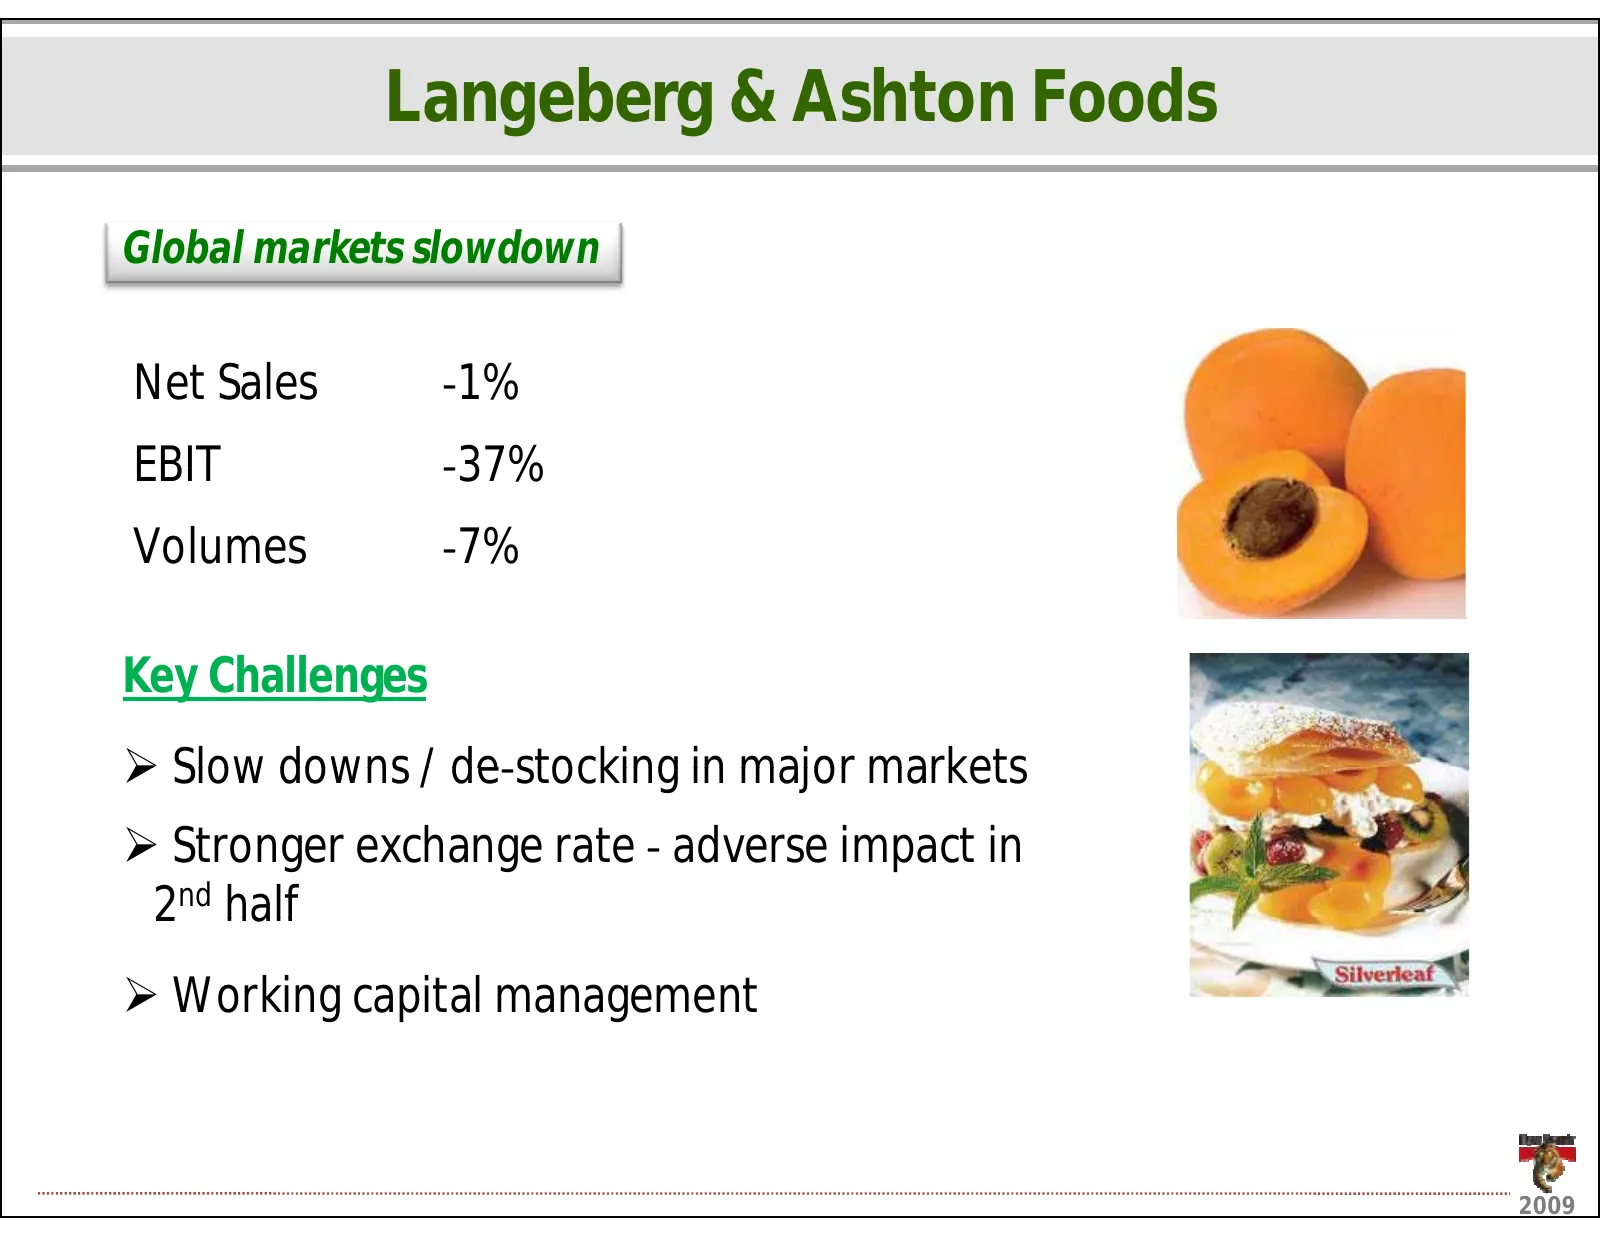
Slide 26: Langeberg & Ashton Foods
Langeberg&AshtonFoods Globalmarketsslowdown NetSales Ͳ1% EBIT EBIT Ͳ37% Volumes Ͳ7% KeyChallenges ¾ Slowdowns/deͲstockinginmajormarkets Slow downs / de stocking in major markets ¾ StrongerexchangerateͲ adverseimpactin 2nd half ¾ Workingcapitalmanagement 2009
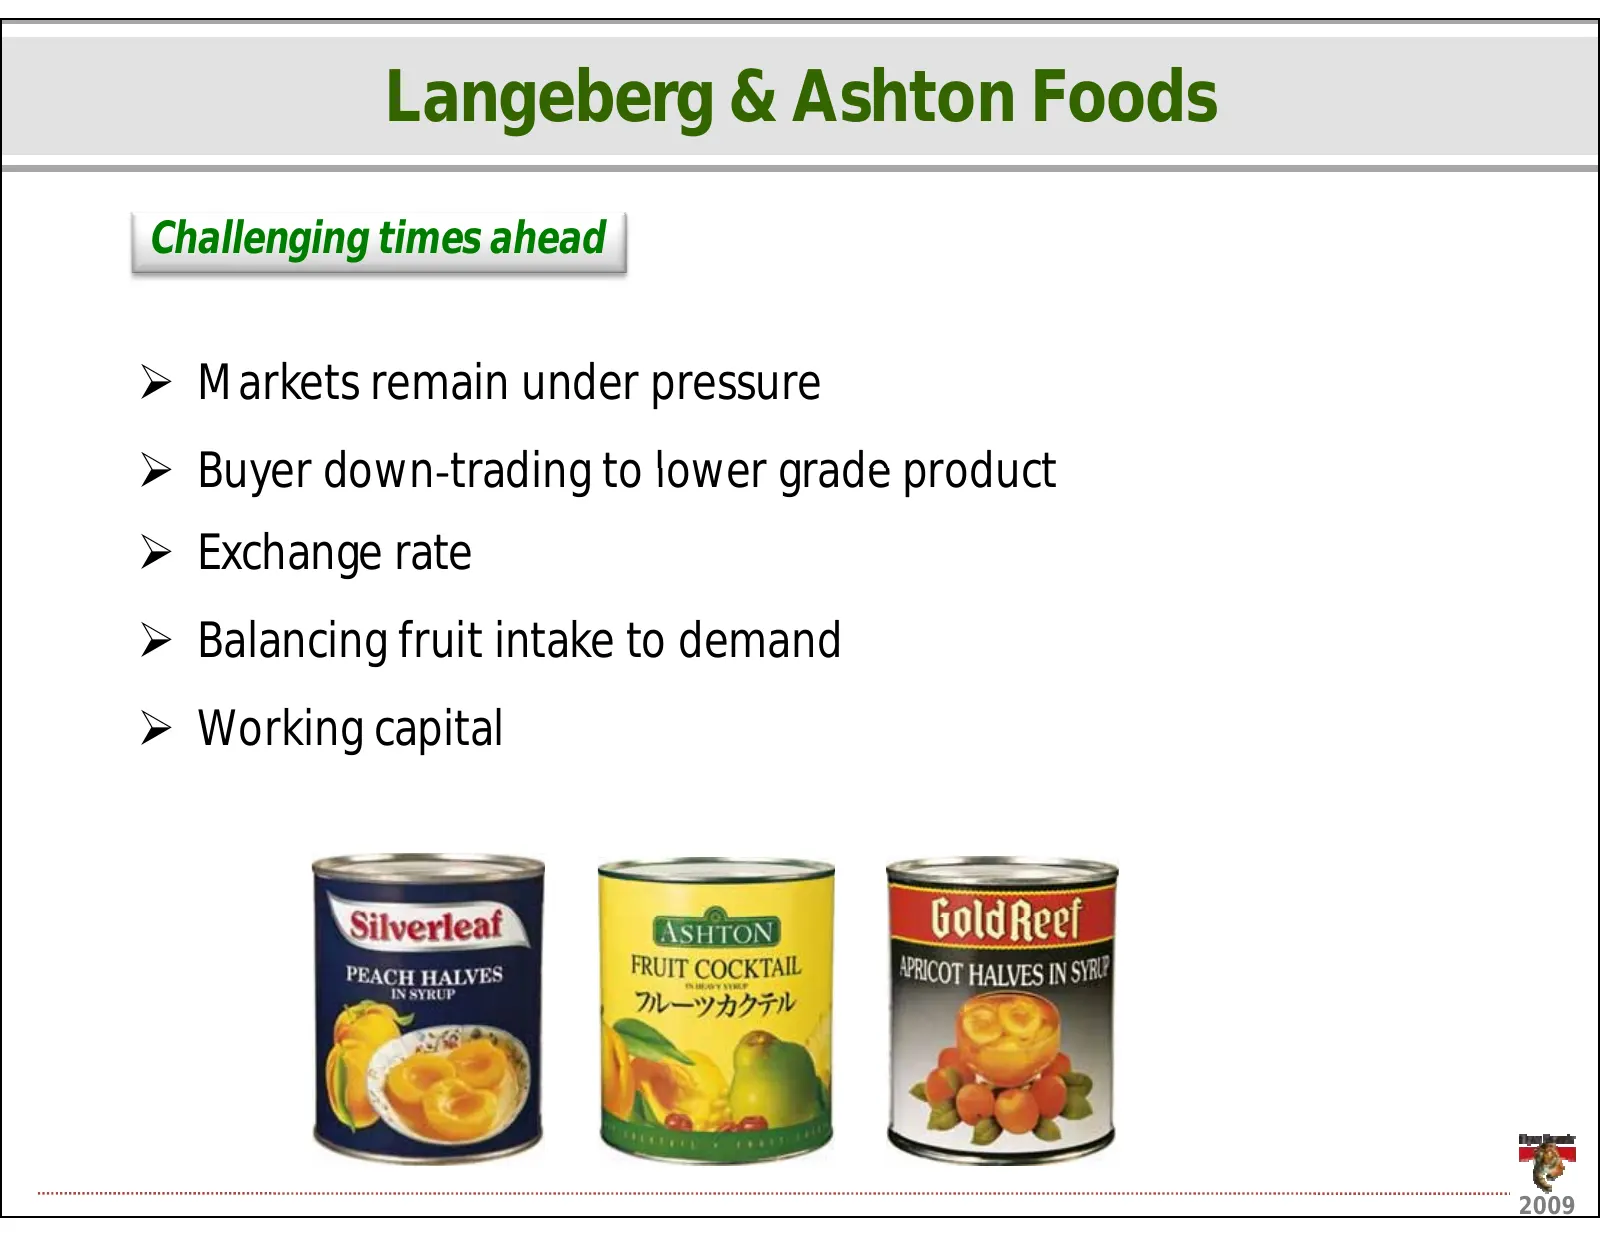
Slide 27: Langeberg & Ashton Foods: Challenging times ahead
Langeberg&AshtonFoods Challengingtimesahead ¾ Marketsremainunderpressure ¾ BuyerdownͲtradingtolowergradeproduct Buyer down trading to lower grade product ¾ Exchangerate ¾ Balancingfruitintaketodemand ¾ Workingcapital 2009
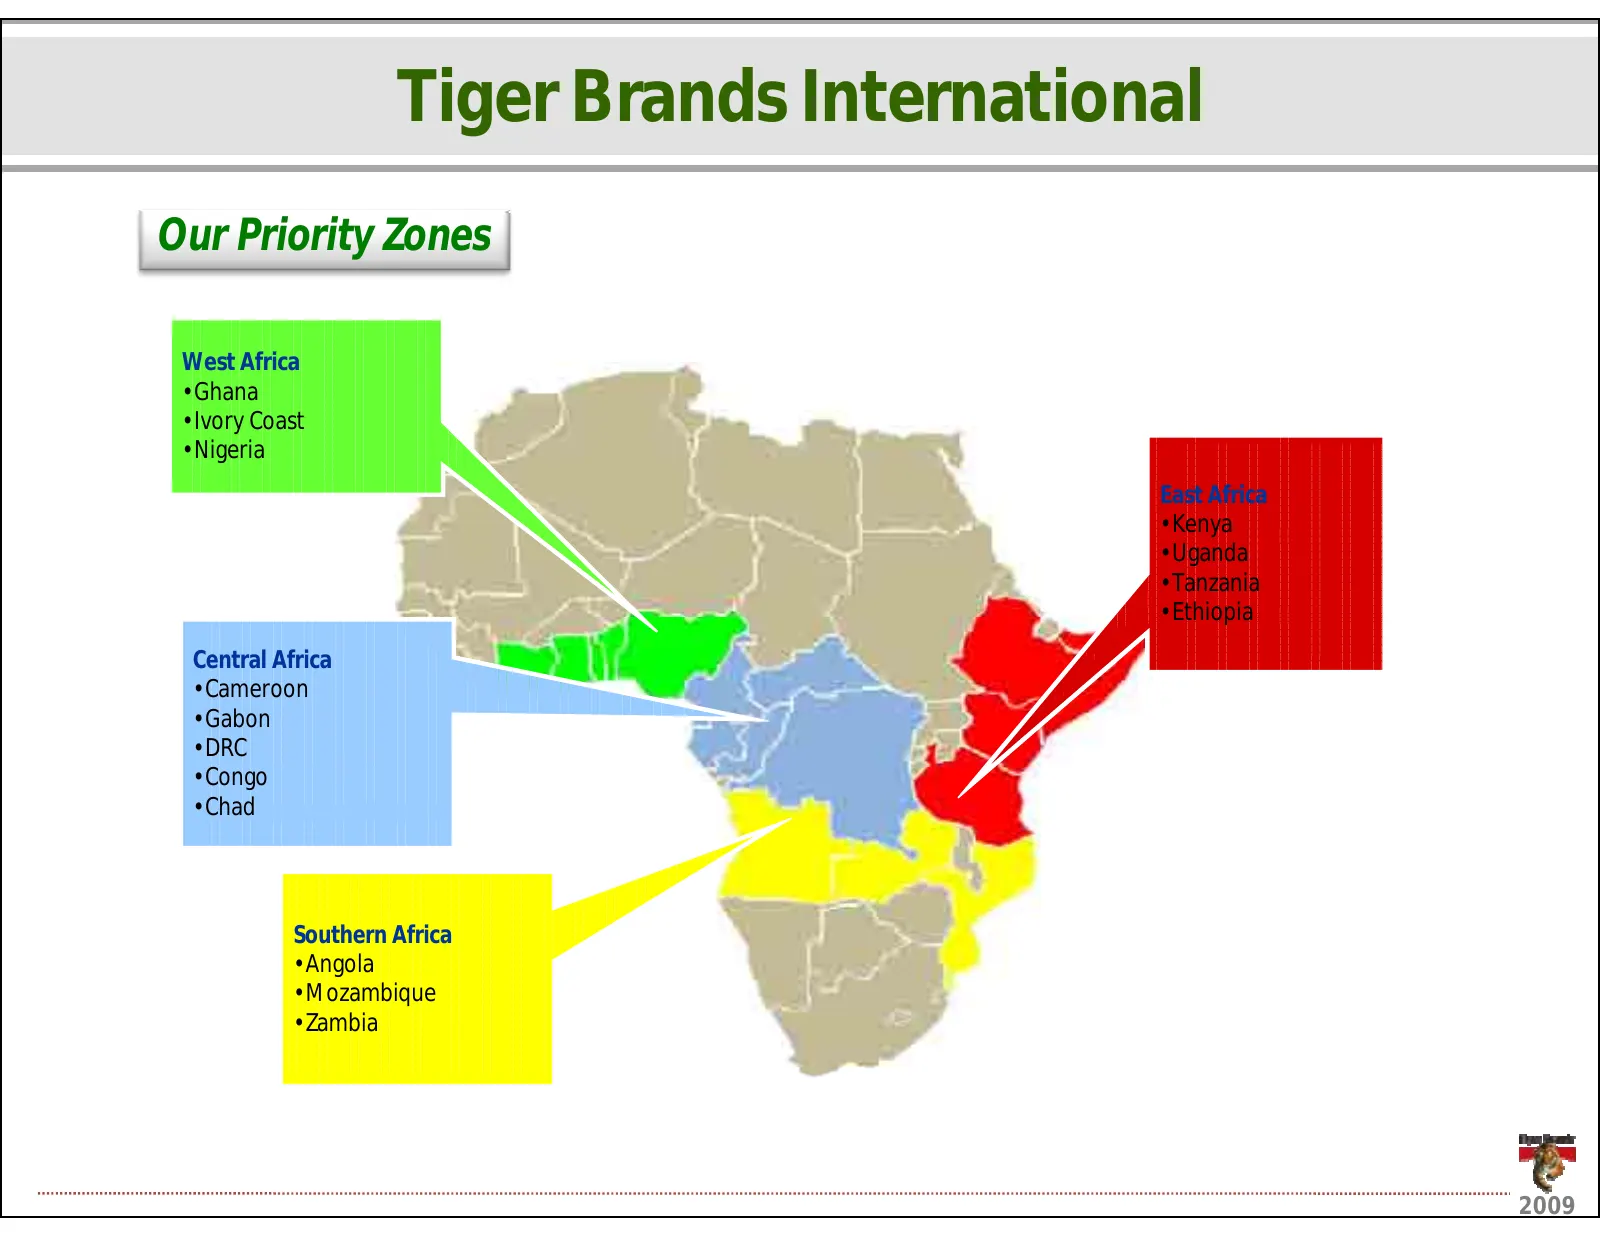
Slide 28: Tiger Brands International: Our Priority Zones
TigerBrandsInternational OurPriorityZones WestAfrica •Ghana •IvoryCoast •Nigeria EastAfrica •Kenya •Uganda •Tanzania •Ethiopia Ethiopia CentralAfrica •Cameroon •Gabon •DRC •Congo •Chad SouthernAfrica •Angola •Mozambique •Zambia 2009
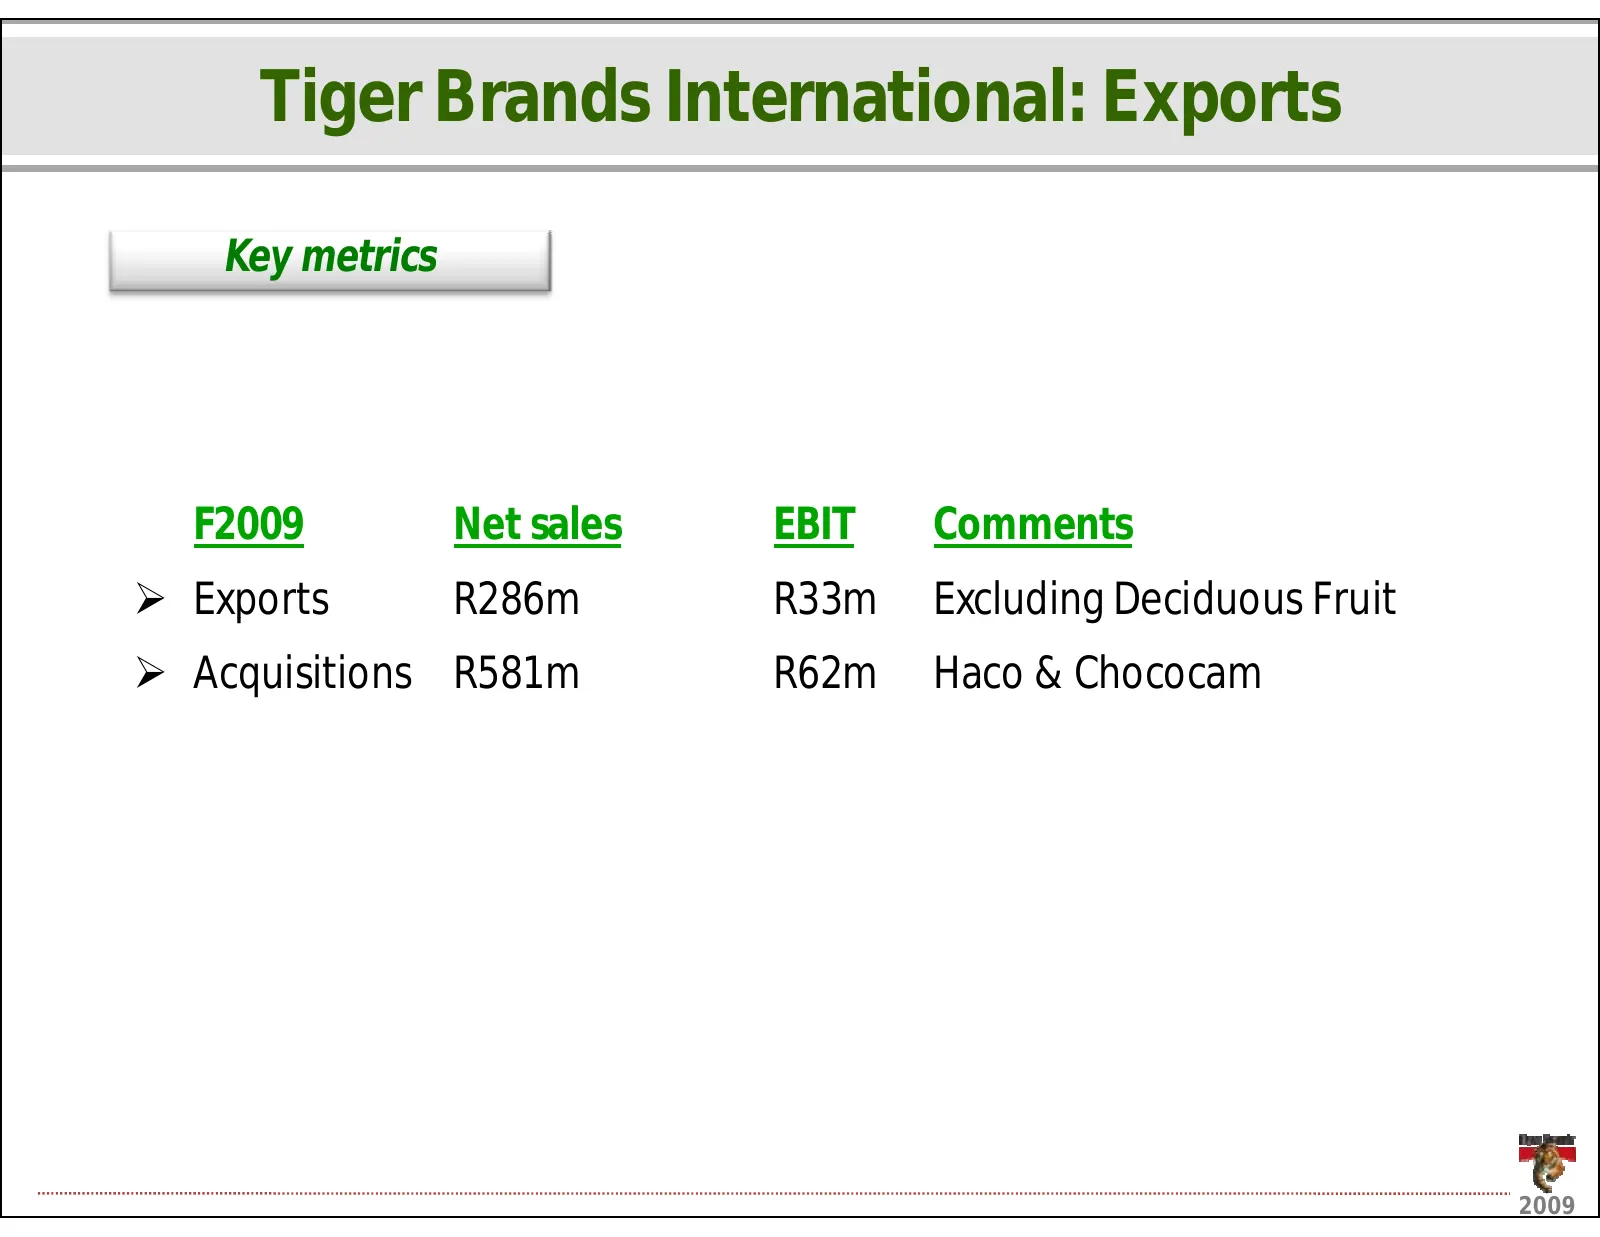
Slide 29: Tiger Brands International: Exports
TigerBrandsInternational:Exports Keymetrics F2009 Netsales EBIT Comments ¾ Exports p R286m R33m ExcludingDeciduousFruit g ¾ Acquisitions R581m R62m Haco&Chococam 2009
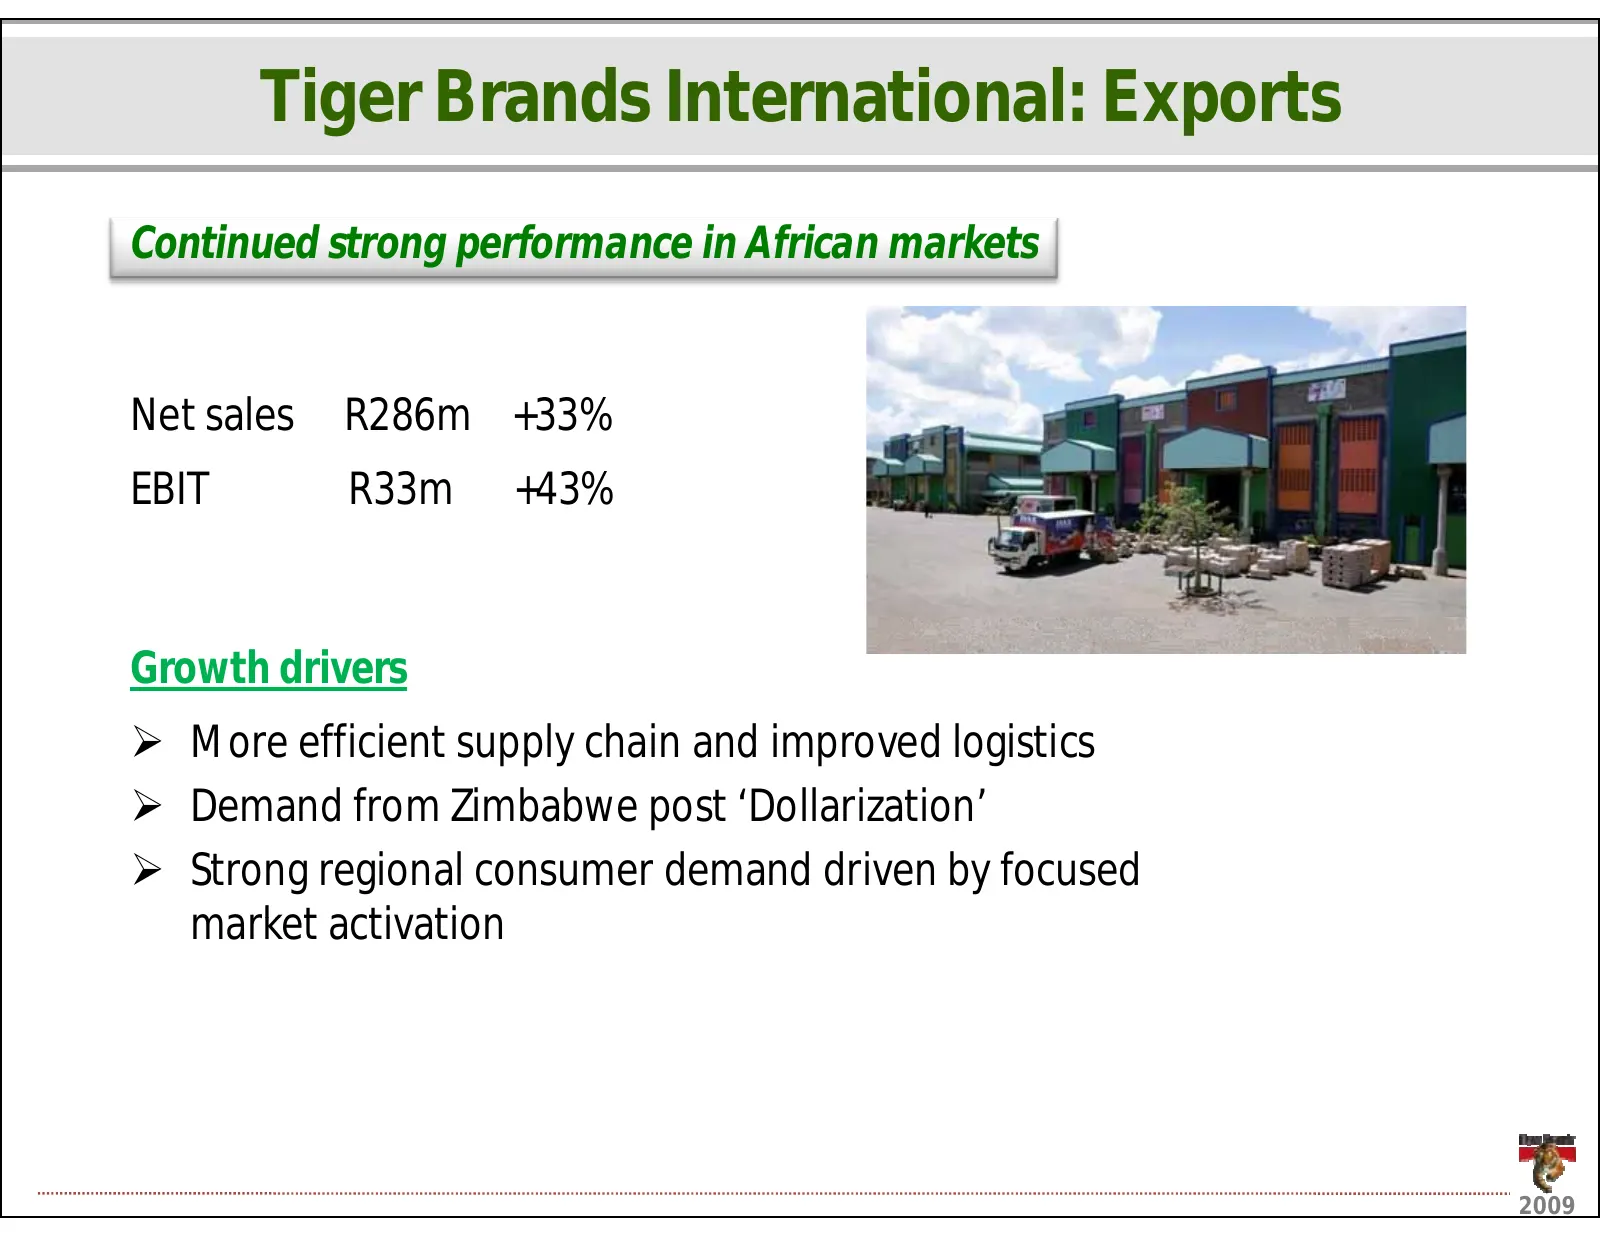
Slide 30: Tiger Brands International: Exports
TigerBrandsInternational:Exports ContinuedstrongperformanceinAfricanmarkets Netsales R286m+33% EBIT R33m+43% Growthdrivers ¾ Moreefficientsupplychainandimprovedlogistics ¾ DemandfromZimbabwepost‘Dollarization’ ¾ Strongregionalconsumerdemanddrivenbyfocused marketactivation k t ti ti 2009
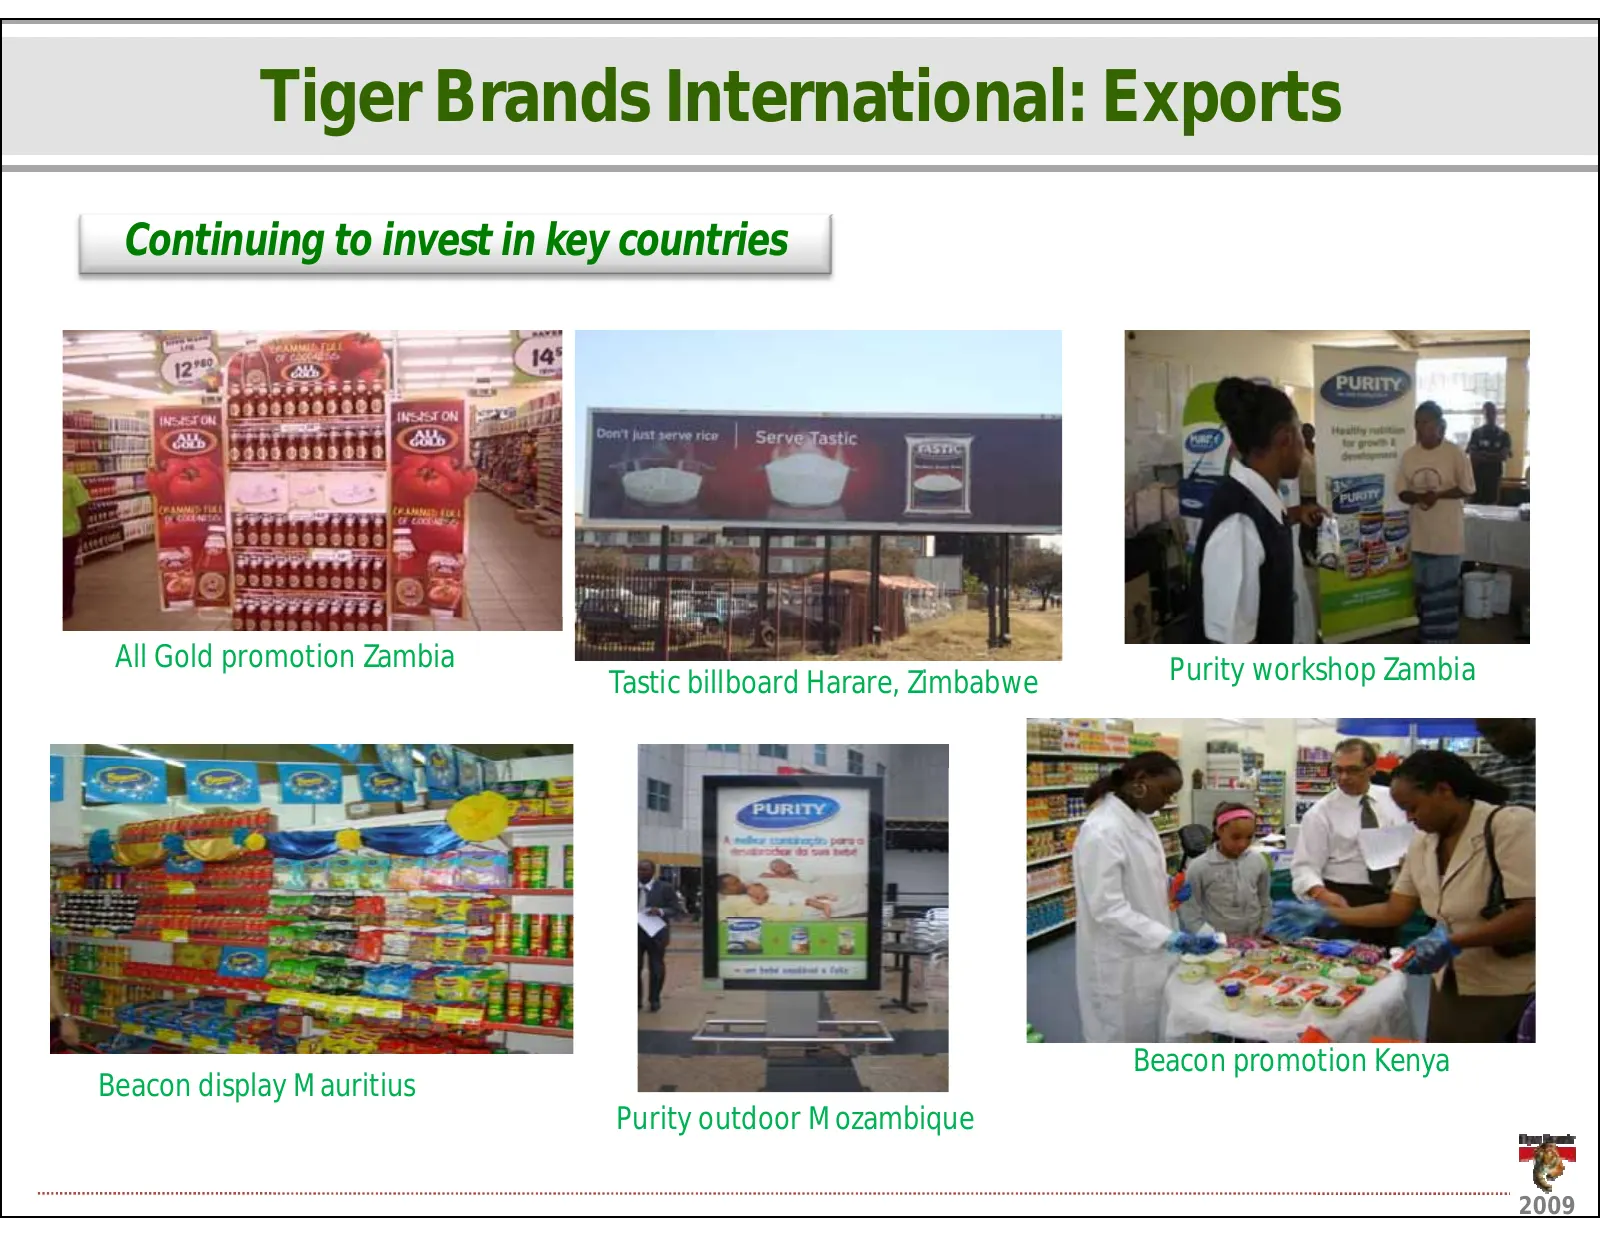
Slide 31: Continuing to invest in key countries
TigerBrandsInternational:Exports Continuingtoinvestinkeycountries AllGoldpromotionZambia PurityworkshopZambia TasticbillboardHarare,Zimbabwe Beacon promotion Kenya BeaconpromotionKenya BeacondisplayMauritius PurityoutdoorMozambique 2009
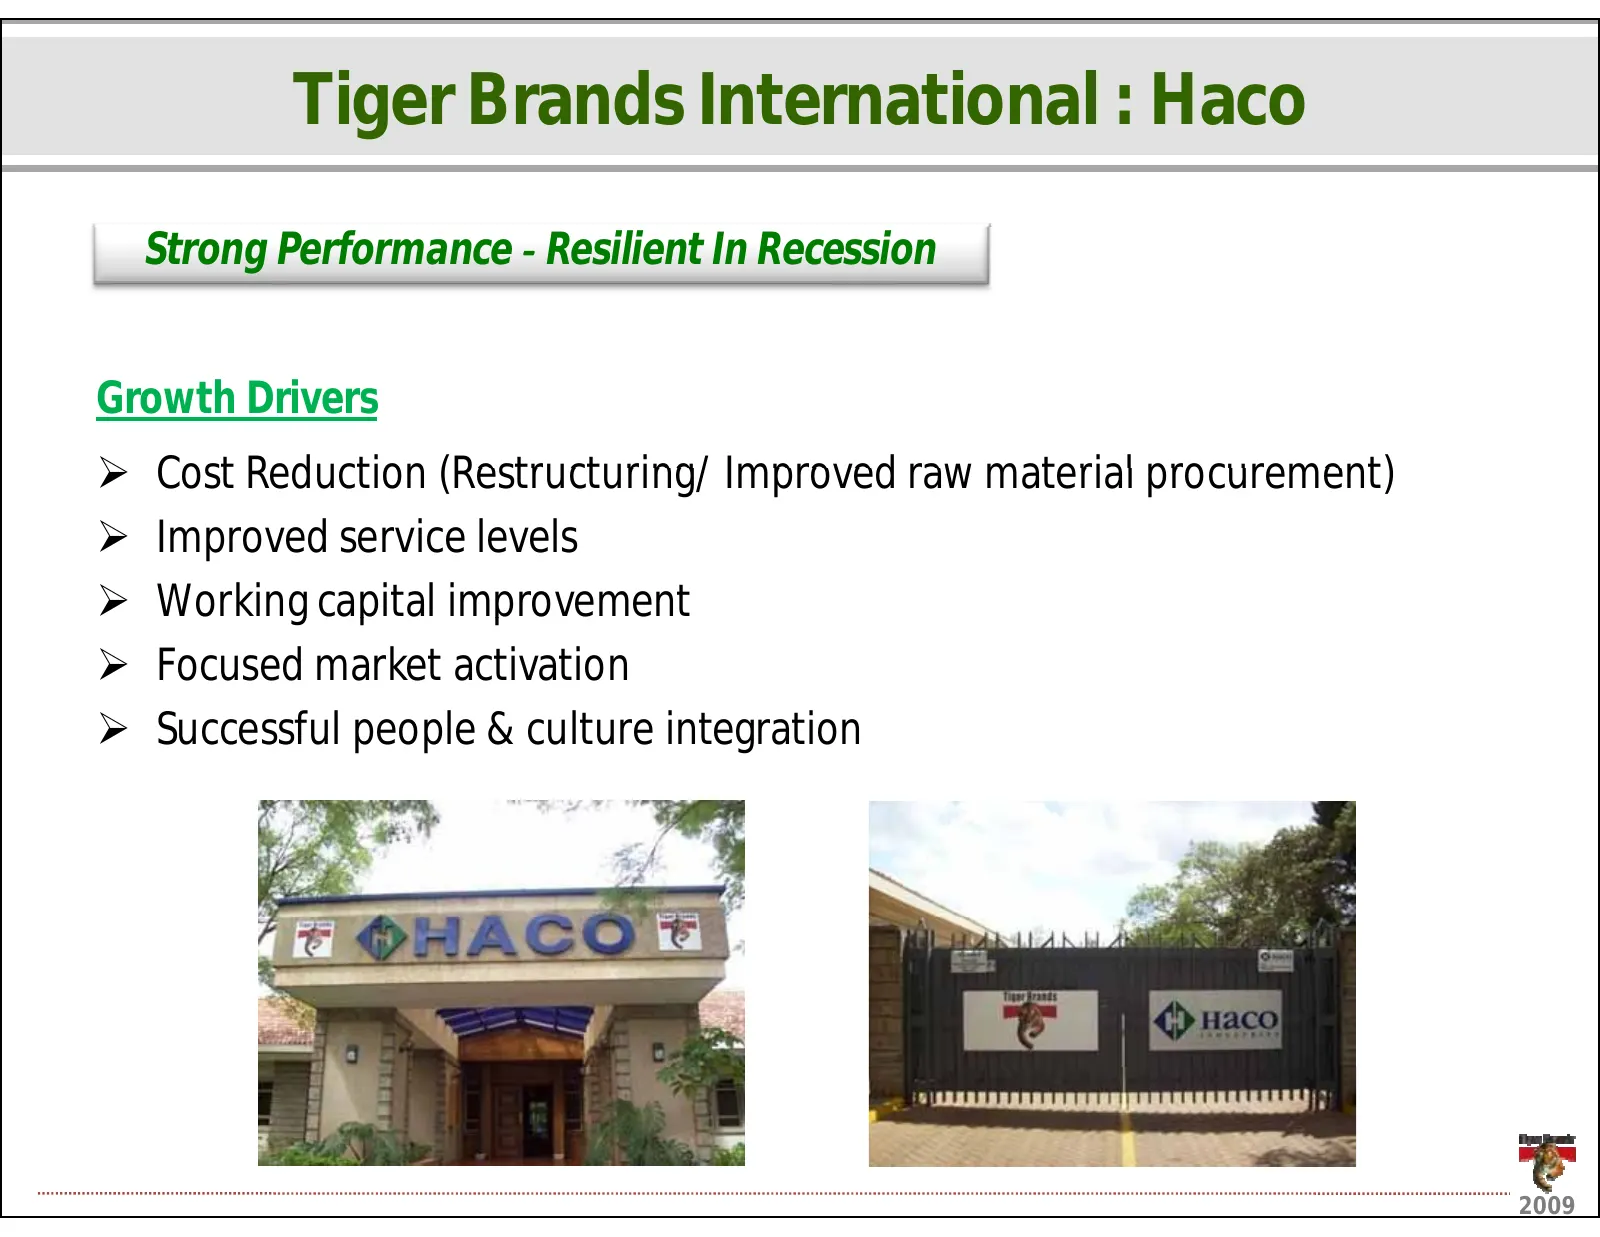
Slide 32: Tiger Brands International: Haco
TigerBrandsInternational:Haco StrongPerformanceͲ ResilientInRecession GrowthDrivers ¾ CostReduction(Restructuring/Improvedrawmaterialprocurement) Cost Reduction (Restructuring/ Improved raw material procurement) ¾ Improvedservicelevels ¾ Workingcapitalimprovement g p p ¾ Focusedmarketactivation ¾ Su
Slide 33: Haco: Strong Brands. Sustained market leadership
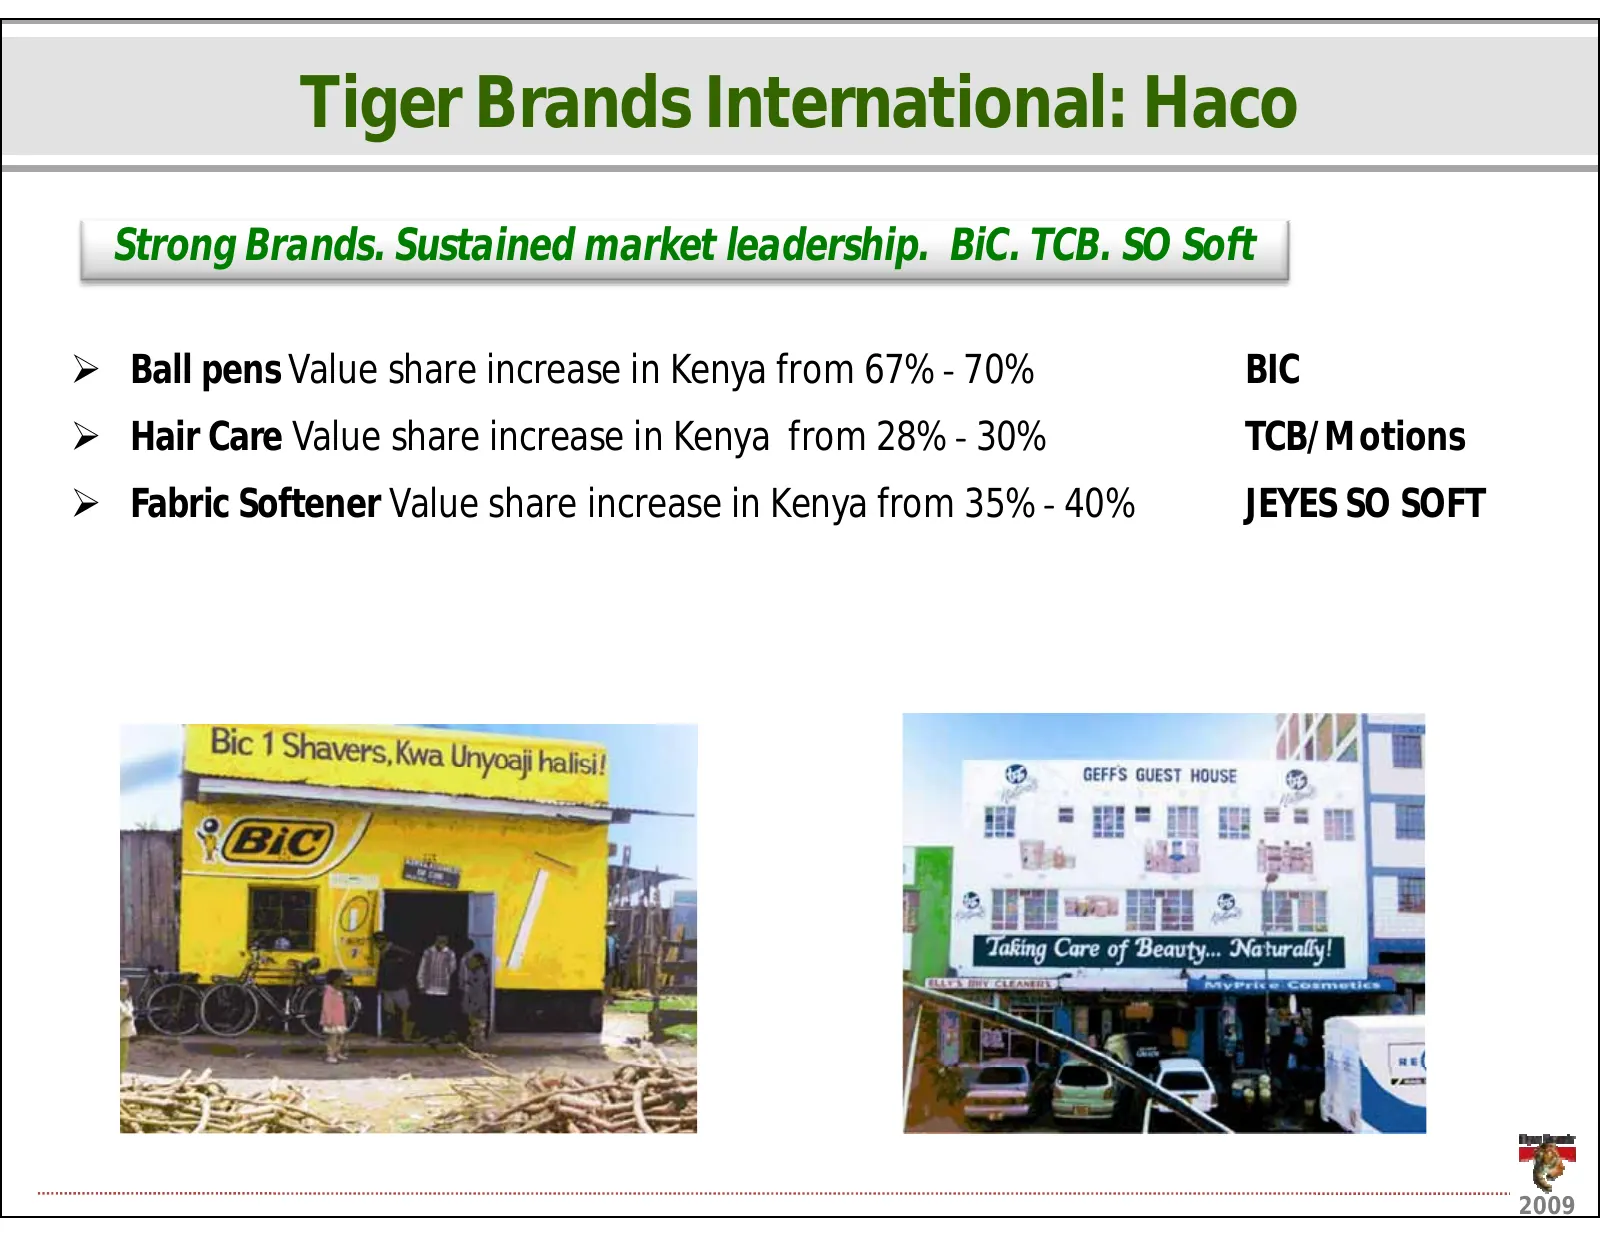
TigerBrandsInternational:Haco StrongBrands.Sustainedmarketleadership.BiC.TCB.SOSoft ¾ BallpensValueshareincreaseinKenyafrom67%Ͳ 70% BIC ¾ HairCareValueshareincreaseinKenyafrom28%Ͳ 30% TCB/Motions ¾ FabricSoftenerValueshareincreaseinKenyafrom35%Ͳ 40% JEYESSOSOFT 2009
Slide 34: Chococam - Cameroon: Successful Integration
ChococamǦ Cameroon SuccessfulIntegration NetSales +28%vs PYannualised EBIT +26%vs PYannualised F2009Focus: ¾ Sustainableplatformforfuturegrowth: Sustainable platform for future growth: • Keymanagementappointments • Systems,processesanddisciplines • Robust internal audit focus and controls Robustinte
Slide 35: Chococam - Cameroon: 2010: Investing for growth
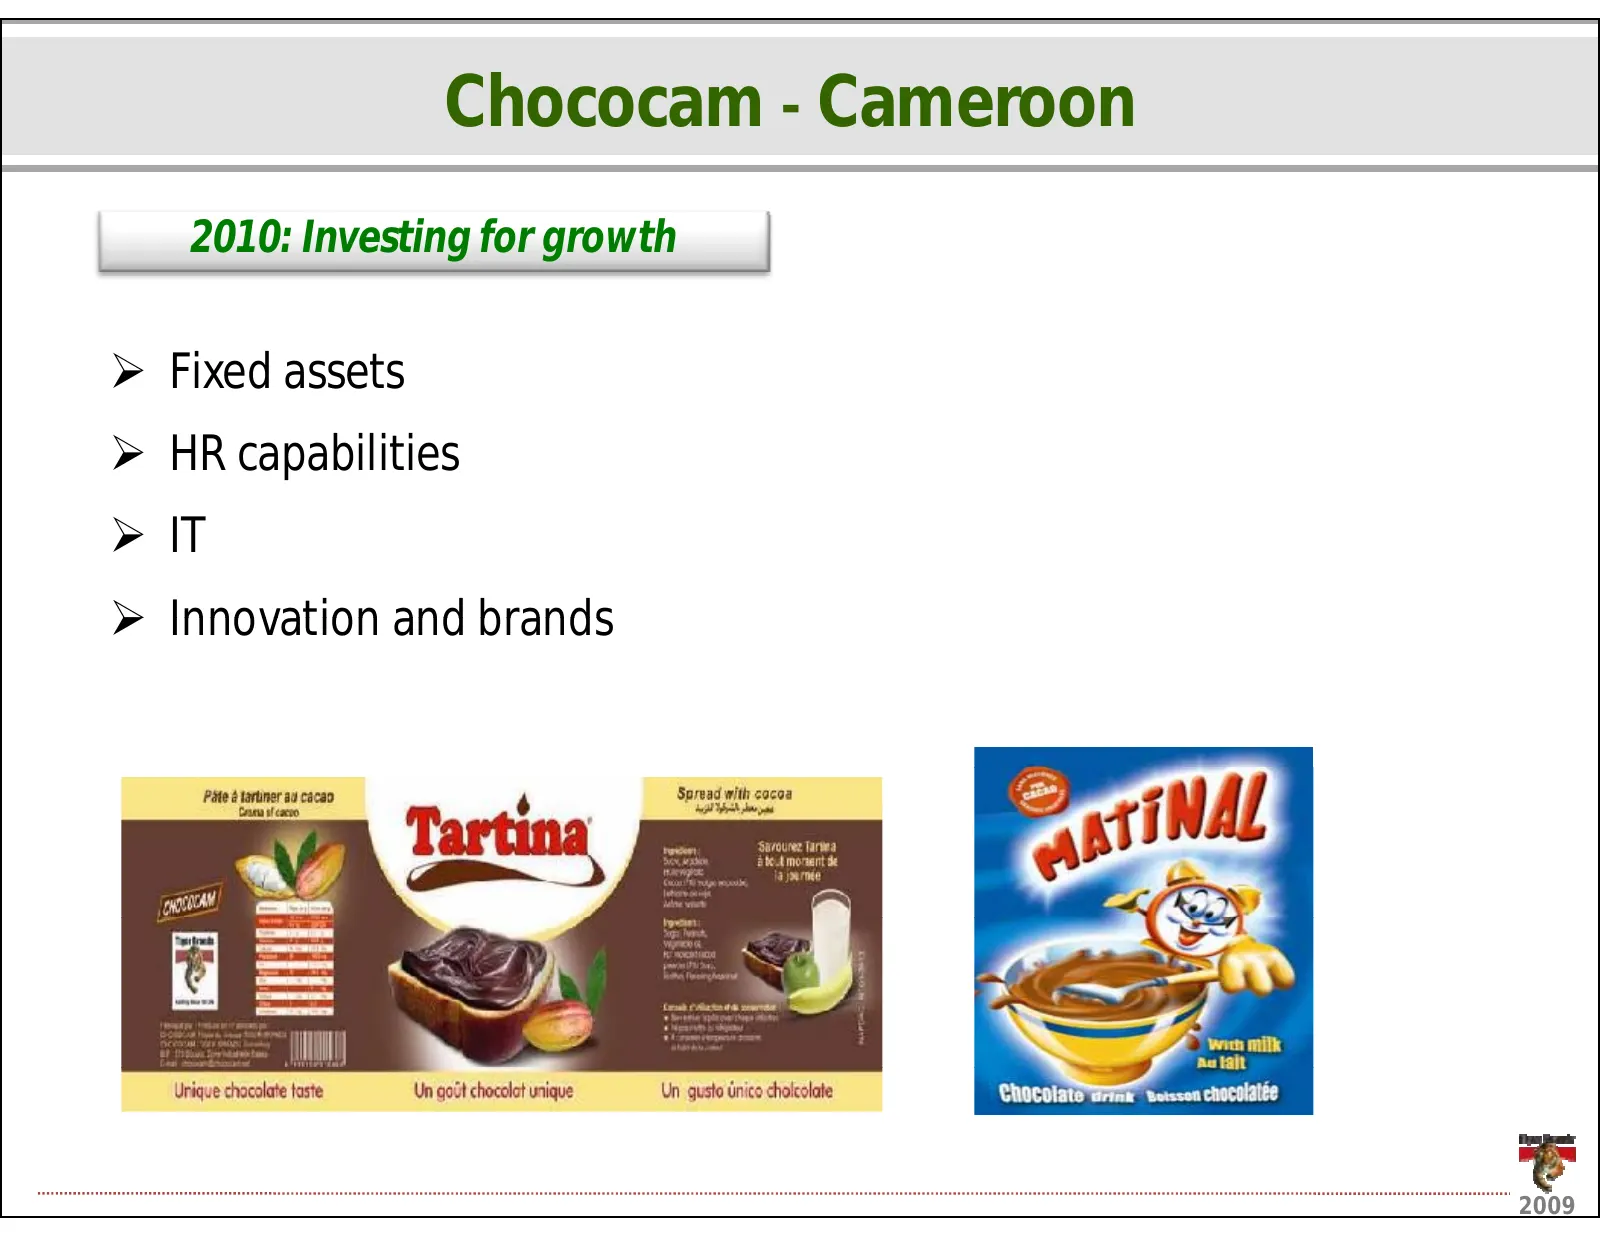
ChococamǦ Cameroon 2010:Investingforgrowth ¾ Fixedassets ¾ HRcapabilities HR capabilities ¾ IT ¾ Innovationandbrands Innovation and brands 2009
Slide 36: Tiger Brands International: Continuing to prospect
TigerBrandsInternational Continuingtoprospect ¾ Africancontinentfocus ¾ EmphasisonidentifiedsubͲregions ¾ Acquisitionremainskeytheme • Existingterritories • Newgeographies ¾ Continuetodriveexports 2009
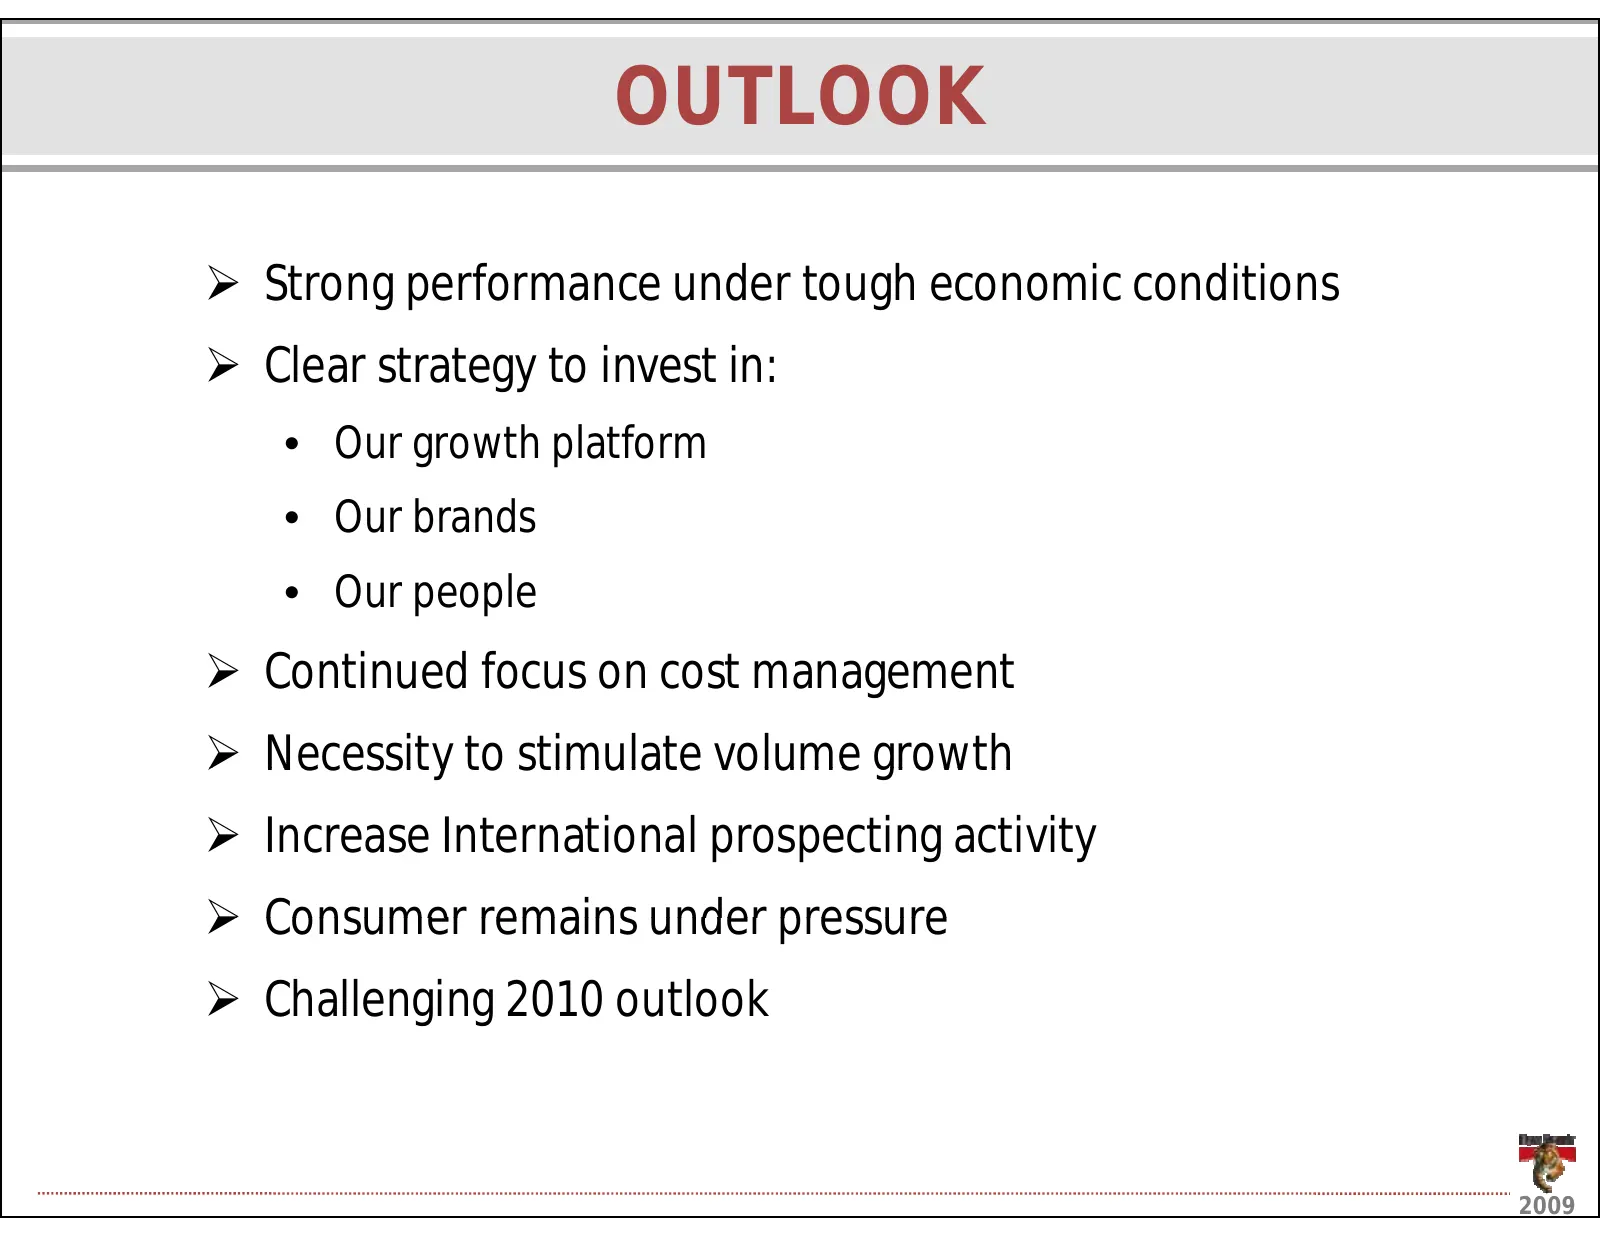
Slide 37: Outlook
OUTLOOK ¾ Strongperformanceundertougheconomicconditions ¾ Clearstrategytoinvestin: • Ourgrowthplatform • Ourbrands • Ourpeople ¾ Continuedfocusoncostmanagement ¾ Necessitytostimulatevolumegrowth Necessity to stimulate volume growth ¾ IncreaseInternationalprospectingactivity ¾ Consumerremainsunderpre

Slide 38: 2009
2009
Source: Internet Archive copy of tigerbrands.com
More decks from Tiger Brands Limited
 H1 2026 Earnings Presentation37 slides · Jun 1, 2026
 H1 2026 Earnings Presentation38 slides · Jun 1, 2026
 FY2025 Earnings Presentation38 slides · Nov 26, 2025
 H1 2025 Earnings Presentation43 slides · May 28, 2025
 H1 FY2024 Earnings Presentation38 slides · May 27, 2024
 FY2023 Earnings Presentation45 slides · Dec 1, 2023