HCC Insurance — Conference Presentation (February 2007)
37 slides from HCC Insurance's conference presentation, Feb 12, 2007

Slide 1
Slide 2: Notice About Forward Looking Statements
NOTICE ABOUT THIS PRESENTATION ABOUT FORWARD LOOKING STATEMENTS: This presentation contains certain "forward looking statements" within the meaning of Section 27A of the Securities Act of 1933, and Section 21E of the Securities Exchange Act of 1934, which are intended to be covered by the safe harbo
Slide 3: Overview
OVERVIEW
Slide 4: Corporate Profile
CORPORATE PROFILE Specialty Insurance since 1974 Based in Houston, Texas with offices across the USA and international offices in Bermuda, Spain and the U.K. Diversified operations include Insurance Companies, Underwriting Agencies and Intermediaries Rated A+ (Superior) by A.M. Best Company and AA (
Slide 5: Corporate Philosophy
CORPORATE PHILOSOPHY Long Term Growth of Shareholders' Equity Capital Preservation Diversification of Operations Disciplined Underwriting Cycle Management Conservative Investments Risk Management
Slide 6: Shareholders Equity
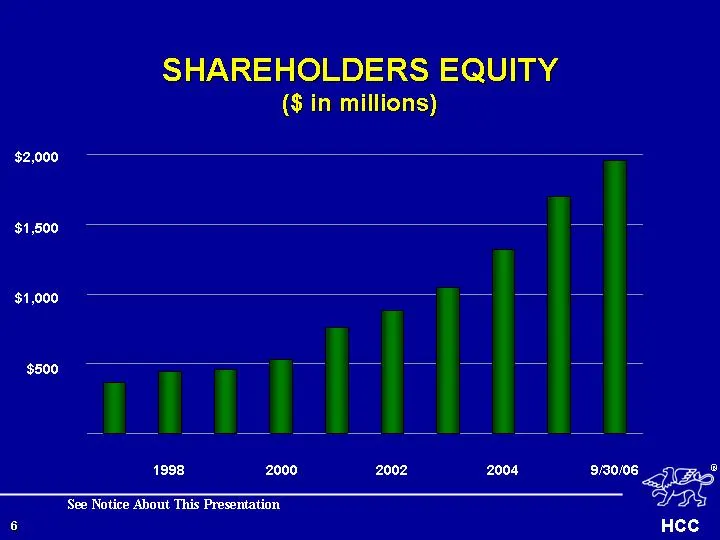
SHAREHOLDERS EQUITY ($ in millions) $1,500 $1,000 $500 1998 2000 2002 2004 9/30/06 $2,000 See Notice About This Presentation
Slide 7: Return on Equity
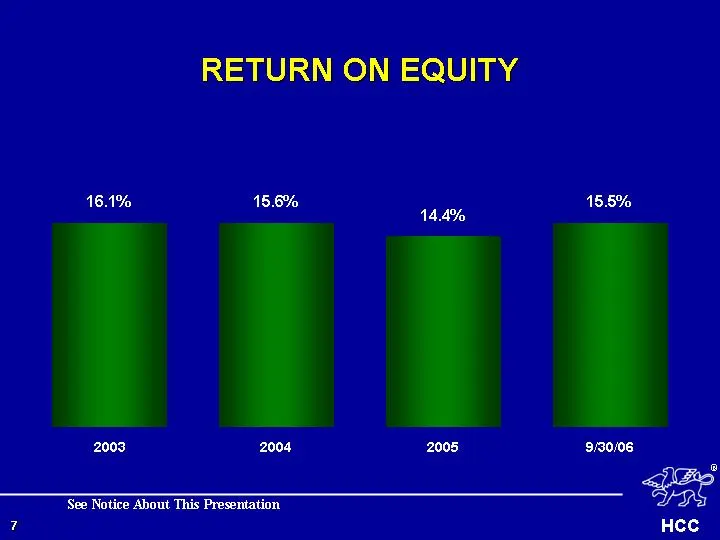
RETURN ON EQUITY 2003 16.1% 2004 15.6% 14.4% 9/30/06 15.5% 2005 See Notice About This Presentation
Slide 8: Growth in Book Value
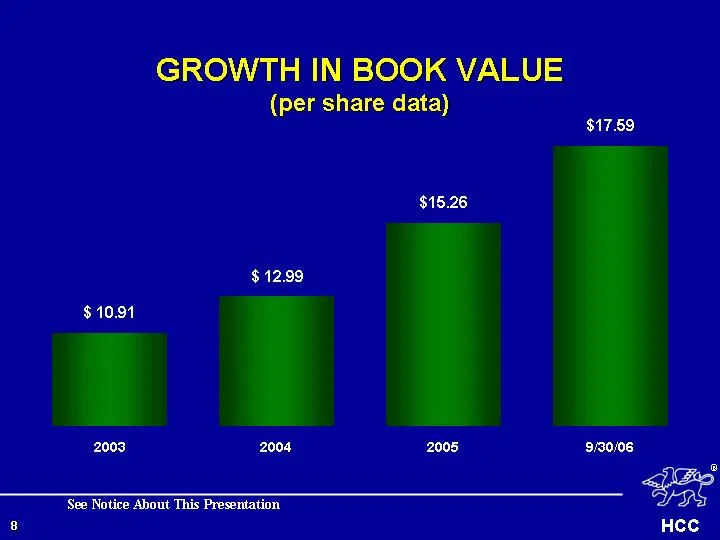
GROWTH IN BOOK VALUE (per share data) 2003 $ 10.91 2004 $ 12.99 $15.26 2005 9/30/06 $17.59 See Notice About This Presentation
Slide 9: Operations
OPERATIONS
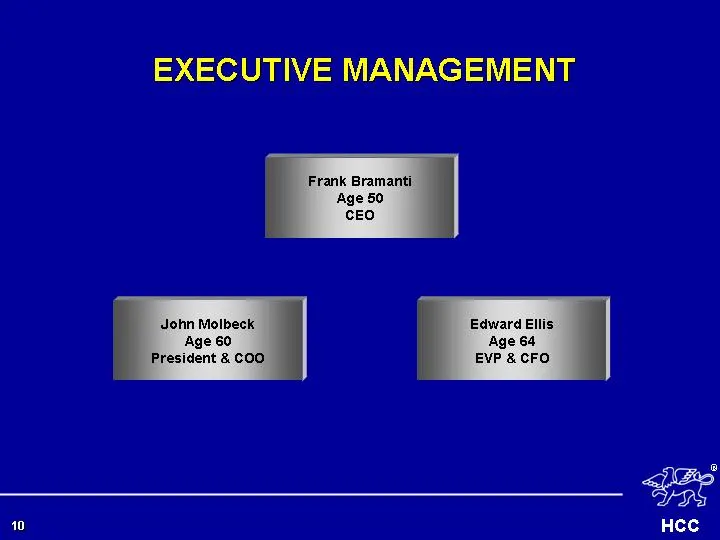
Slide 10: Executive Management
EXECUTIVE MANAGEMENT Frank Bramanti Age 50 CEO Edward Ellis Age 64 EVP & CFO
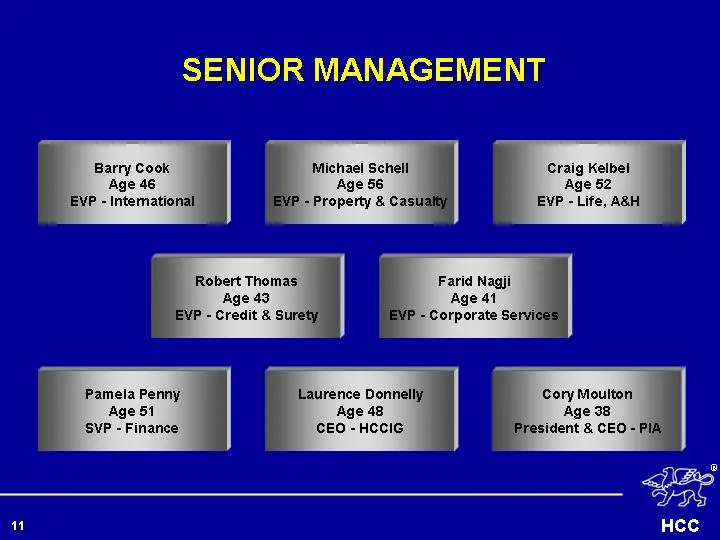
Slide 11: Senior Management
SENIOR MANAGEMENT Michael Schell Age 56 EVP - Property & Casualty Robert Thomas Age 43 EVP - Credit & Surety Pamela Penny Age 51 SVP - Finance Farid Nagji Age 41 EVP - Corporate Services Cory Moulton Age 38 President & CEO - PIA Laurence Donnelly Age 48 CEO - HCCIG Craig Kelbel Age 52 EVP - Life, A&
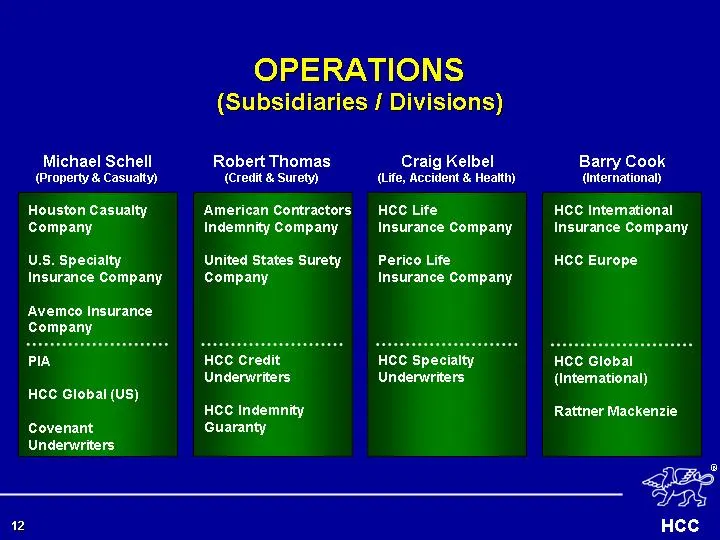
Slide 12: Operations (Subsidiaries / Divisions)
OPERATIONS (Subsidiaries / Divisions) Michael Schell (Property & Casualty) Houston Casualty Company U.S. Specialty Insurance Company Avemco Insurance Company PIA HCC Global (US) Covenant Underwriters Robert Thomas (Credit & Surety) American Contractors Indemnity Company United States Surety Company
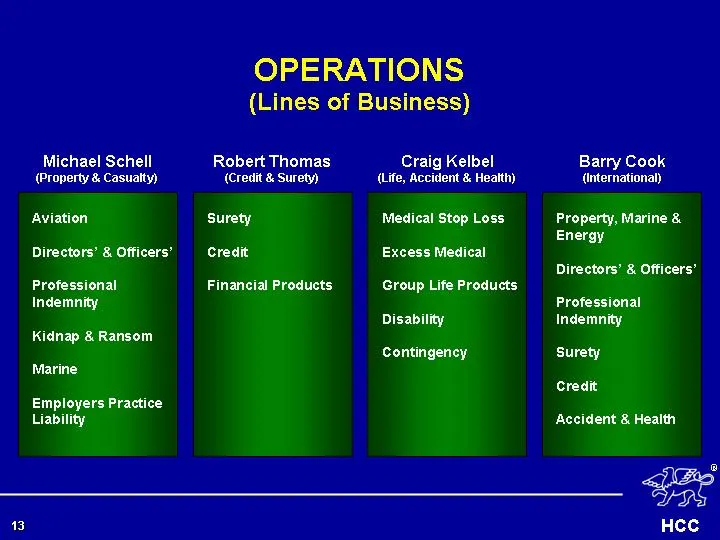
Slide 13: Operations (Lines of Business)
OPERATIONS (Lines of Business) Michael Schell (Property & Casualty) Aviation Directors' & Officers' Professional Indemnity Kidnap & Ransom Marine Employers Practice Liability Craig Kelbel (Life, Accident & Health) Medical Stop Loss Excess Medical Group Life Products Disability Contingency Robert Tho
Slide 14: Financials
FINANCIALS
Slide 15: Balance Sheet
BALANCE SHEET
Slide 16: Strong Balance Sheet
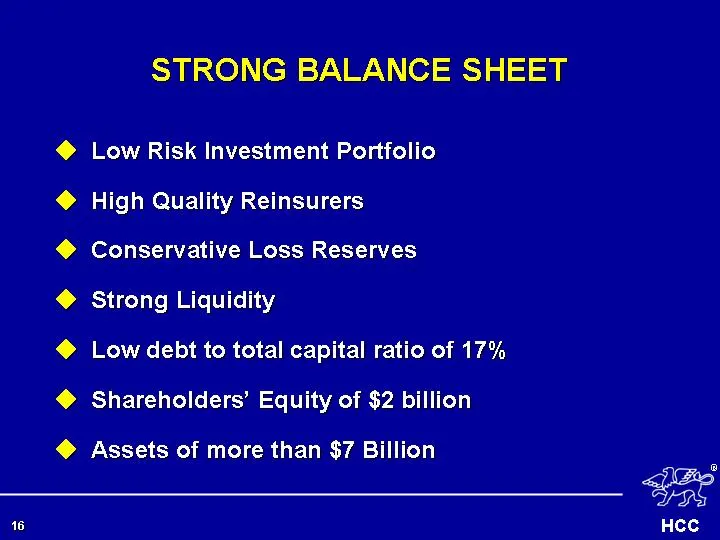
STRONG BALANCE SHEET Conservative Loss Reserves Strong Liquidity Low debt to total capital ratio of 17% Shareholders' Equity of $2 billion Assets of more than $7 Billion High Quality Reinsurers Low Risk Investment Portfolio
Slide 17: Reinsurance Recoverables
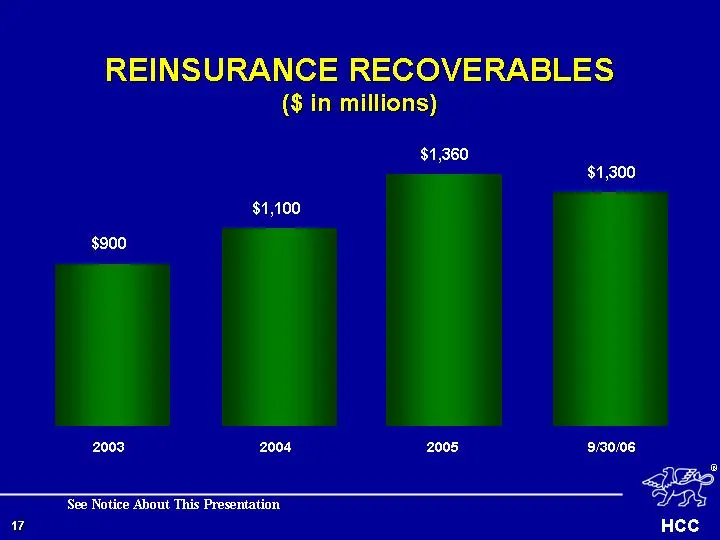
REINSURANCE RECOVERABLES ($ in millions) 9/30/06 $1,300 2003 $900 $1,100 2004 2005 $1,360 See Notice About This Presentation
Slide 18: Net Loss Reserves
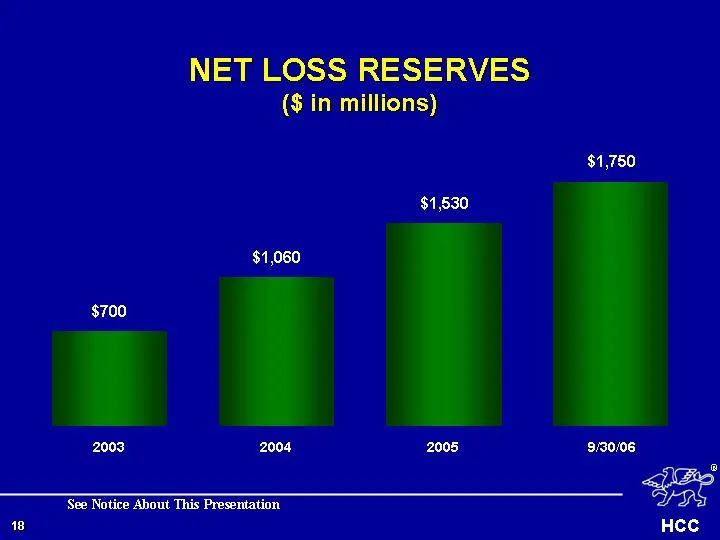
NET LOSS RESERVES ($ in millions) 9/30/06 $1,750 2003 $700 $1,060 2004 2005 $1,530 See Notice About This Presentation
Slide 19: Cash Flow
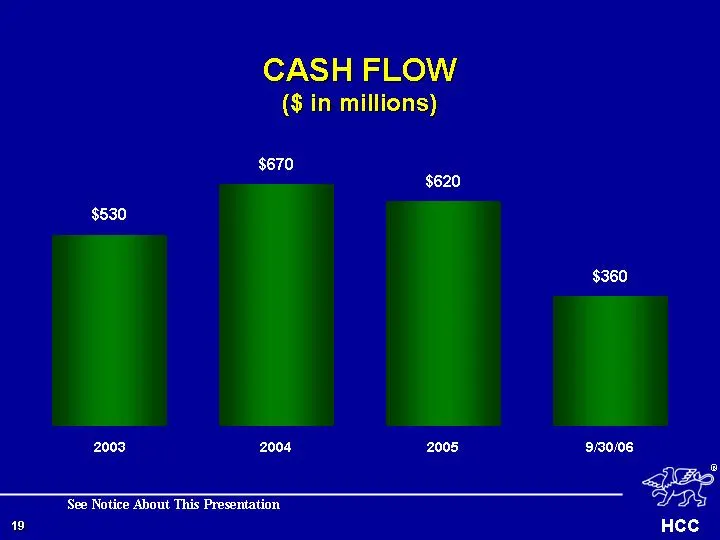
CASH FLOW ($ in millions) 2003 $530 2004 $670 $620 2005 9/30/06 $360 See Notice About This Presentation
Slide 20: Investment Assets
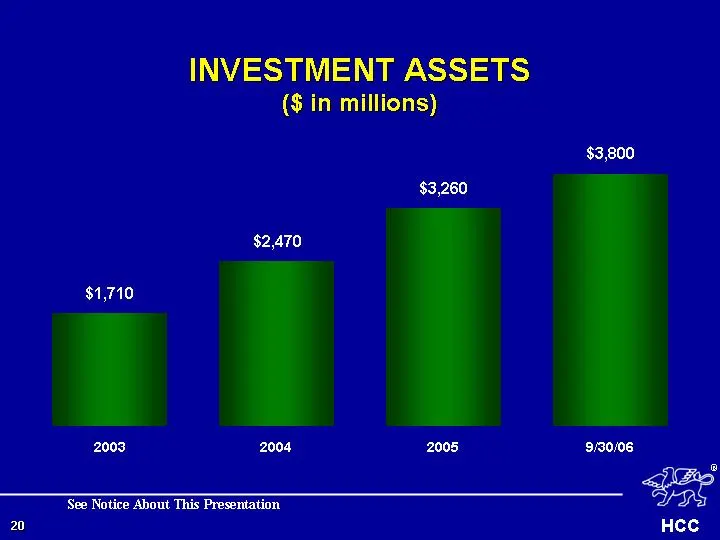
INVESTMENT ASSETS ($ in millions) 2003 $1,710 2004 $2,470 $3,260 2005 9/30/06 $3,800 See Notice About This Presentation
Slide 21: Conservative Investment Portfolio
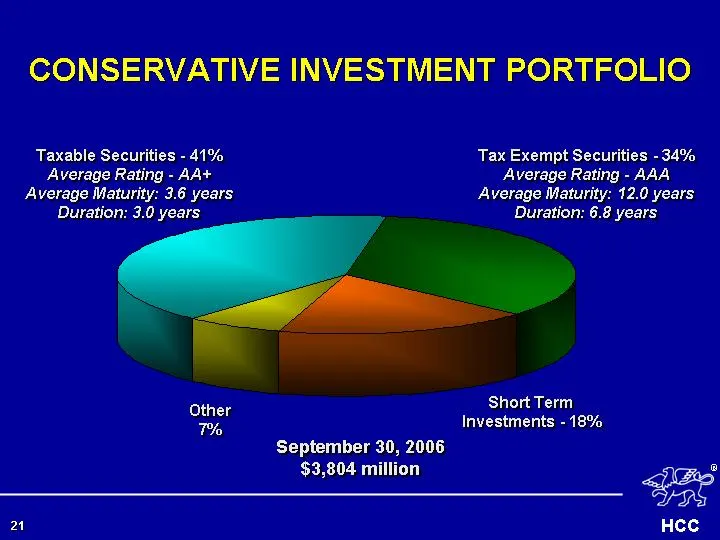
1st Qtr Tax Exempt Securities 34 Short Term Investments 18 Other 7 Taxable Securities 41 Taxable Securities - 41% Average Rating - AA+ Average Maturity: 3.6 years Duration: 3.0 years Tax Exempt Securities - 34% Average Rating - AAA Average Maturity: 12.0 years Duration: 6.8 years Other 7% September
Slide 22: Total Assets
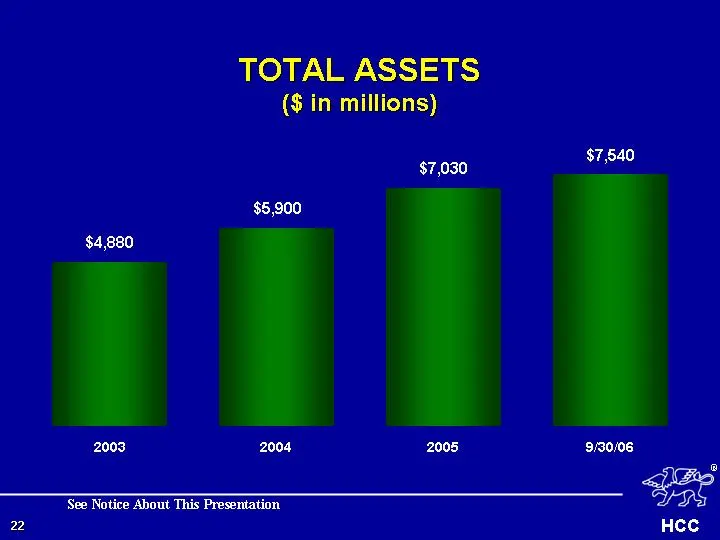
TOTAL ASSETS ($ in millions) 2003 $4,880 2004 $5,900 $7,030 2005 9/30/06 $7,540 See Notice About This Presentation
Slide 23: Shareholders Equity
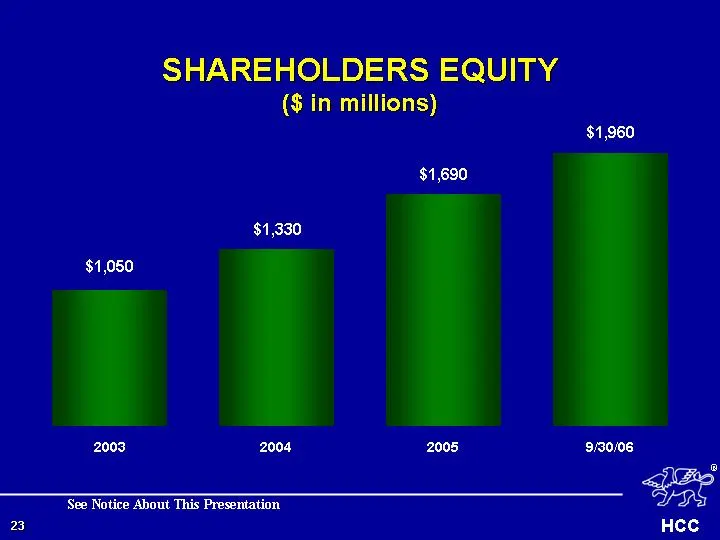
SHAREHOLDERS EQUITY ($ in millions) 2003 $1,050 2004 $1,330 $1,690 9/30/06 $1,960 2005 See Notice About This Presentation
Slide 24: Income Statement
INCOME STATEMENT
Slide 25: Gross Written Premium
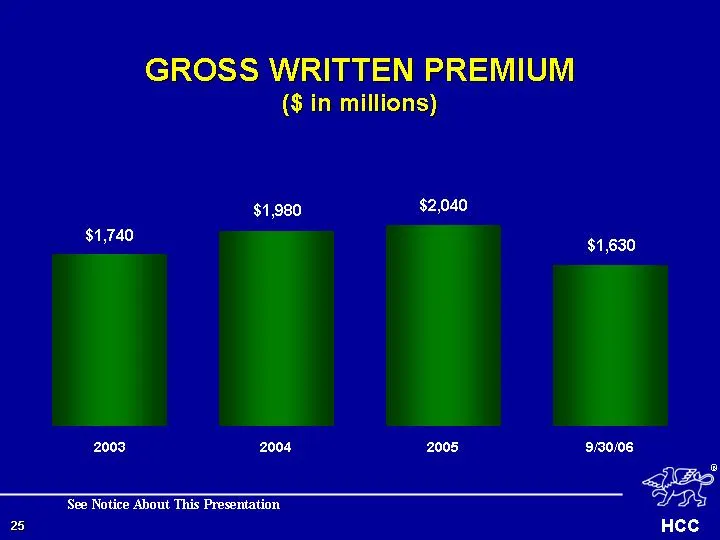
GROSS WRITTEN PREMIUM ($ in millions) 2003 $1,740 2004 $1,980 $2,040 2005 9/30/06 $1,630 See Notice About This Presentation
Slide 26: Net Written Premium
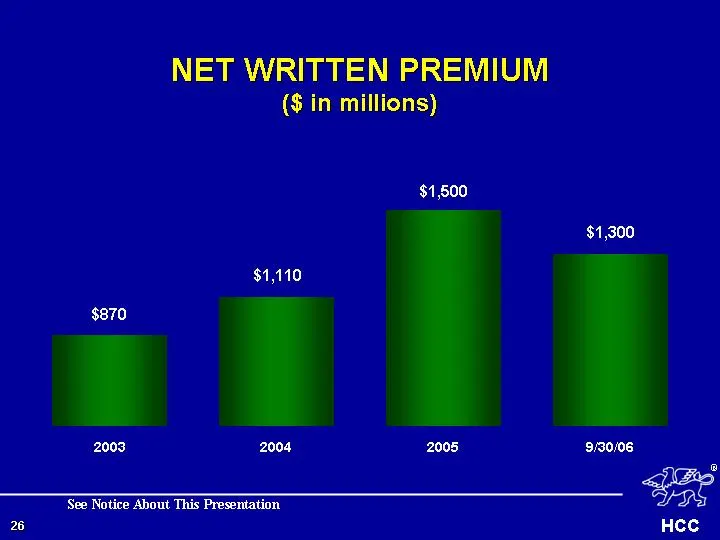
NET WRITTEN PREMIUM ($ in millions) 2003 $870 2004 $1,110 $1,500 2005 9/30/06 $1,300 See Notice About This Presentation
Slide 27: Revenue: Net Earned Premium
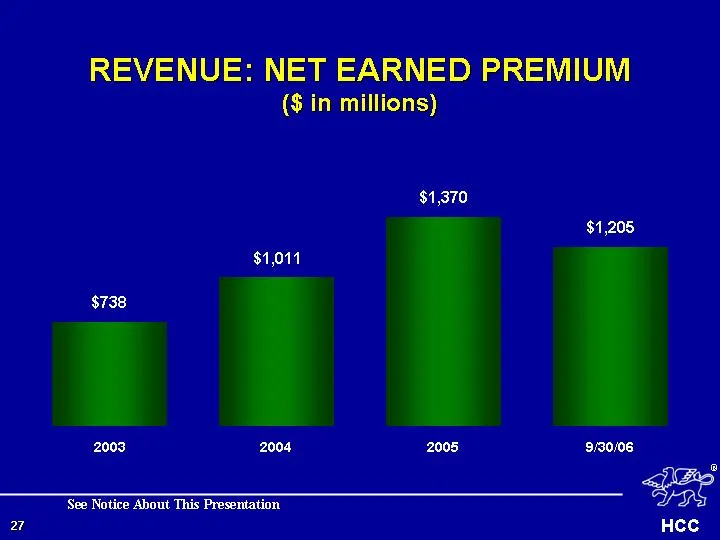
REVENUE: NET EARNED PREMIUM ($ in millions) 2003 $738 2004 $1,011 $1,370 2005 9/30/06 $1,205 See Notice About This Presentation
Slide 28: Revenue: Fee & Commission Income
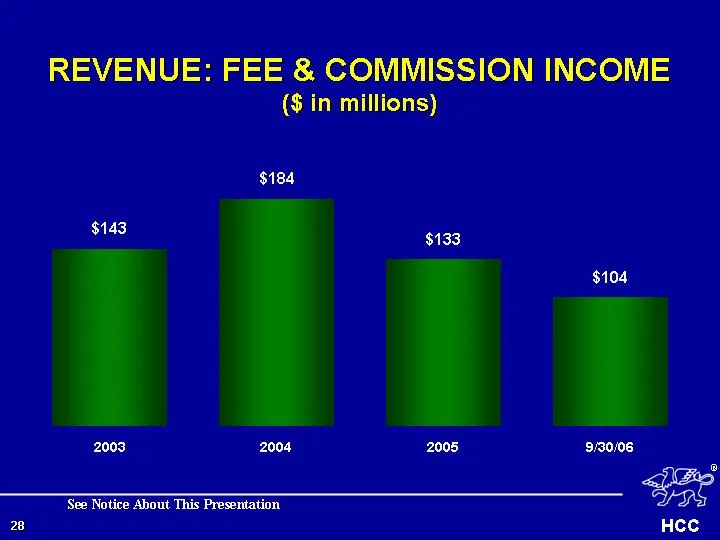
REVENUE: FEE & COMMISSION INCOME ($ in millions) 2003 $143 2004 $184 $133 2005 9/30/06 $104 See Notice About This Presentation
Slide 29: Revenue: Investment Income
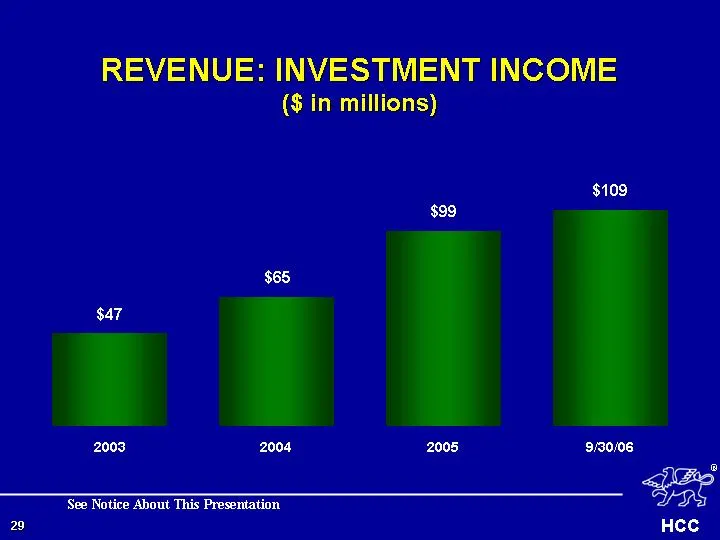
REVENUE: INVESTMENT INCOME ($ in millions) 2003 $47 2004 $65 $99 2005 9/30/06 $109 See Notice About This Presentation
Slide 30: Total Revenue
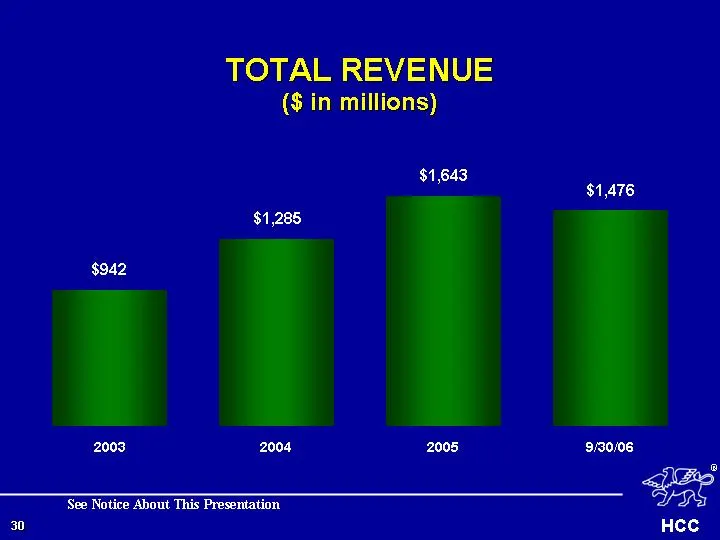
TOTAL REVENUE ($ in millions) 2003 $942 2004 $1,285 $1,643 2005 9/30/06 $1,476 See Notice About This Presentation
Slide 31: GAAP Combined Ratio
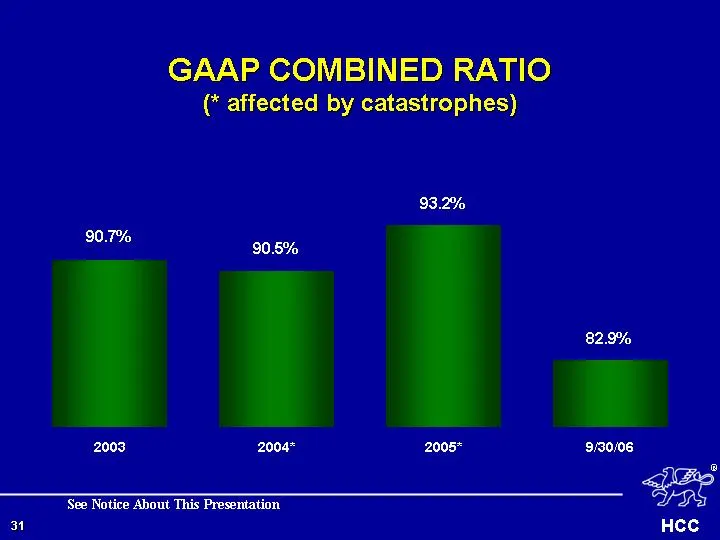
GAAP COMBINED RATIO (* affected by catastrophes) 2003 90.7% 2004* 90.5% 93.2% 9/30/06 82.9% 2005* See Notice About This Presentation
Slide 32: Net Earnings
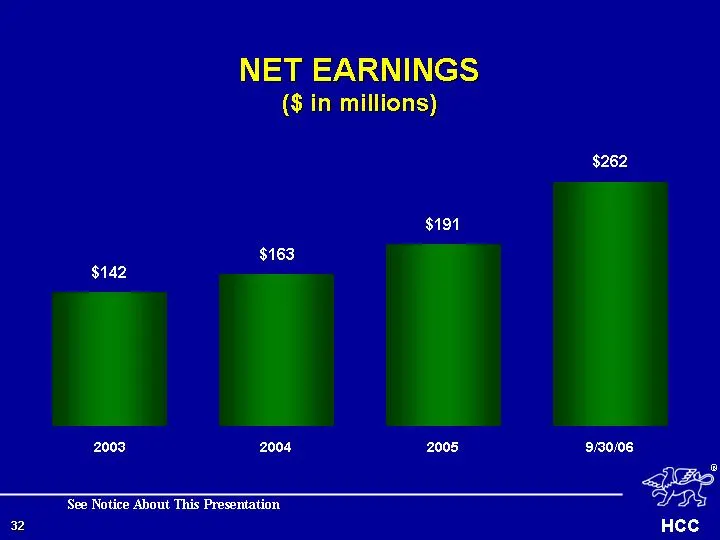
NET EARNINGS ($ in millions) 2003 $142 2004 $163 $191 2005 9/30/06 $262 See Notice About This Presentation
Slide 33: Net Earnings per Diluted Share
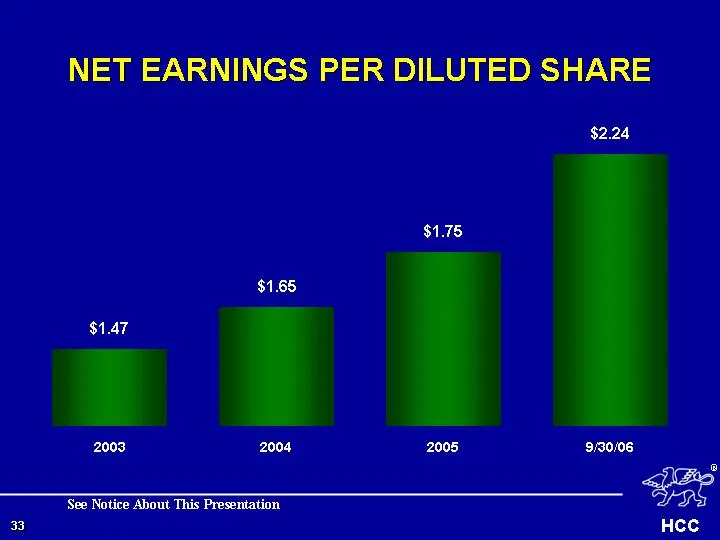
NET EARNINGS PER DILUTED SHARE 2003 $1.47 2004 $1.65 $1.75 2005 9/30/06 $2.24 See Notice About This Presentation
Slide 34: Summary
SUMMARY
Slide 35: HCC Key Strengths
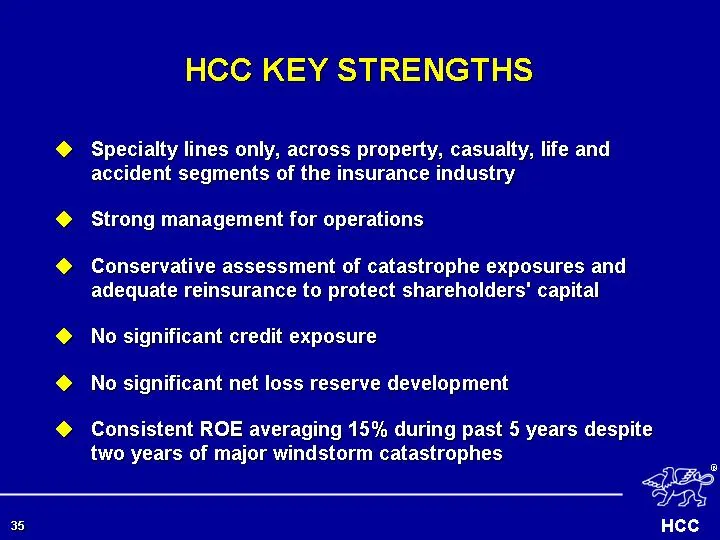
HCC KEY STRENGTHS Specialty lines only, across property, casualty, life and accident segments of the insurance industry Strong management for operations Conservative assessment of catastrophe exposures and adequate reinsurance to protect shareholders' capital No significant net loss reserve developm
Slide 36: Notice About Forward Looking Statements
NOTICE ABOUT THIS PRESENTATION ABOUT FORWARD LOOKING STATEMENTS: This presentation contains certain "forward looking statements" within the meaning of Section 27A of the Securities Act of 1933, and Section 21E of the Securities Exchange Act of 1934, which are intended to be covered by the safe harbo

Slide 37
Source: SEC EDGAR · 8-K filed Feb 12, 2007
More decks from HCC Insurance Holdings Inc
 Q2 2015 Earnings Presentation31 slides · Aug 14, 2015
 Merger or Acquisition (June 2015)22 slides · Jun 23, 2015
 Merger or Acquisition (June 2015)10 slides · Jun 10, 2015
 Merger or Acquisition (June 2015)30 slides · Jun 10, 2015
 Q1 2015 Earnings Presentation35 slides · May 21, 2015
 36th Annual Raymond James Institutional Investors Conference (February 2015)36 slides · Feb 27, 2015