Middlefield Banc — Shareholder Meeting (May 2014)
30 slides from Middlefield Banc's shareholder meeting presentation, May 14, 2014
Slide 1: Annual Shareholders' Meeting
Exhibit 99.1 Annual Shareholders’ Meeting May 14, 2014
Slide 2: Annual Meeting Agenda
Annual Meeting Agenda Introductions Annual Meeting-Shareholder Proposals Business Overview Questions, Comments, and Discussion Voting Results Adjournment
Slide 3: Board of Directors
Board of Directors Thomas G. Caldwell James R. Heslop, II Eric W. Hummel Kenneth E. Jones Darryl E. Mast James J. McCaskey William J. Skidmore Joseph J. Thomas Robert W. Toth Carolyn J. Turk
Slide 4: The Middlefield Banking Company welcomes: Clayton W. Rose, III
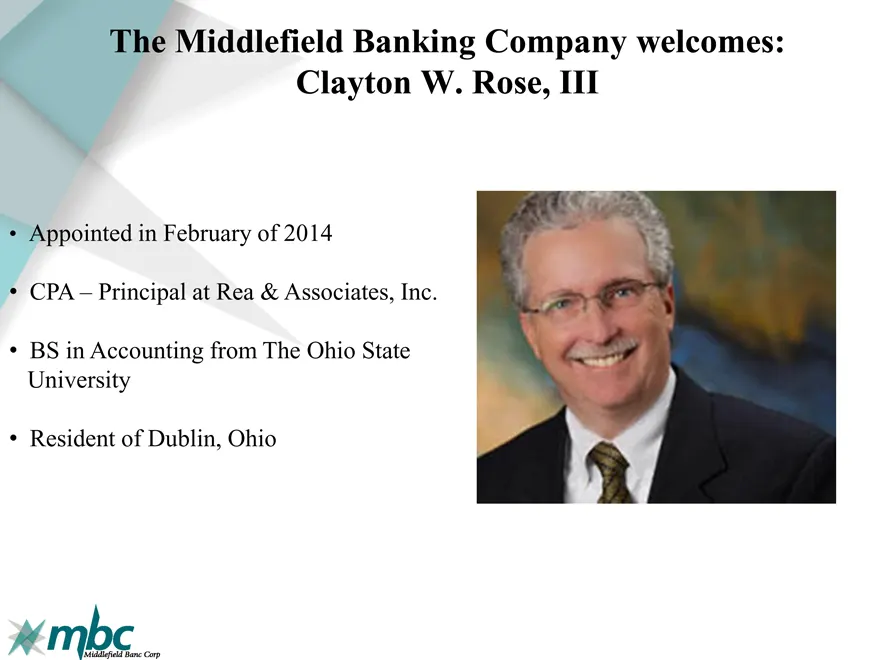
The Middlefield Banking Company welcomes: Clayton W. Rose, III Appointed in February of 2014 CPA – Principal at Rea & Associates, Inc. BS in Accounting from The Ohio State University Resident of Dublin, Ohio
Slide 5: Experienced Management Team
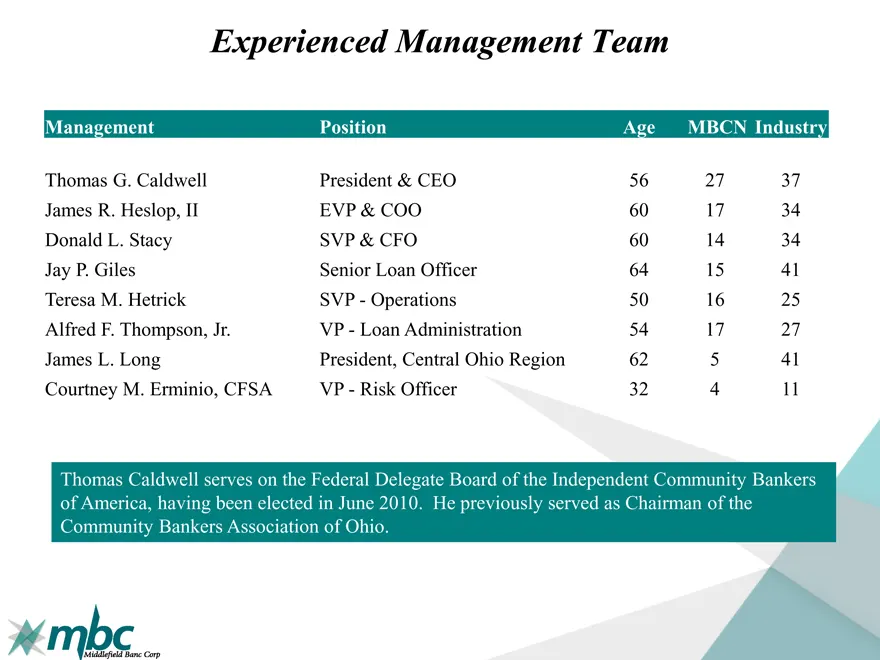
Experienced Management Team Management Position Age MBCN Industry Thomas G. Caldwell President & CEO 56 27 37 James R. Heslop, II EVP & COO 60 17 34 Donald L. Stacy SVP & CFO 60 14 34 Jay P. Giles Senior Loan Officer 64 15 41 Teresa M. Hetrick SVP—Operations 50 16 25 Alfred F. Thompson, Jr. VP—Loan
Slide 6: Shareholder Proposals
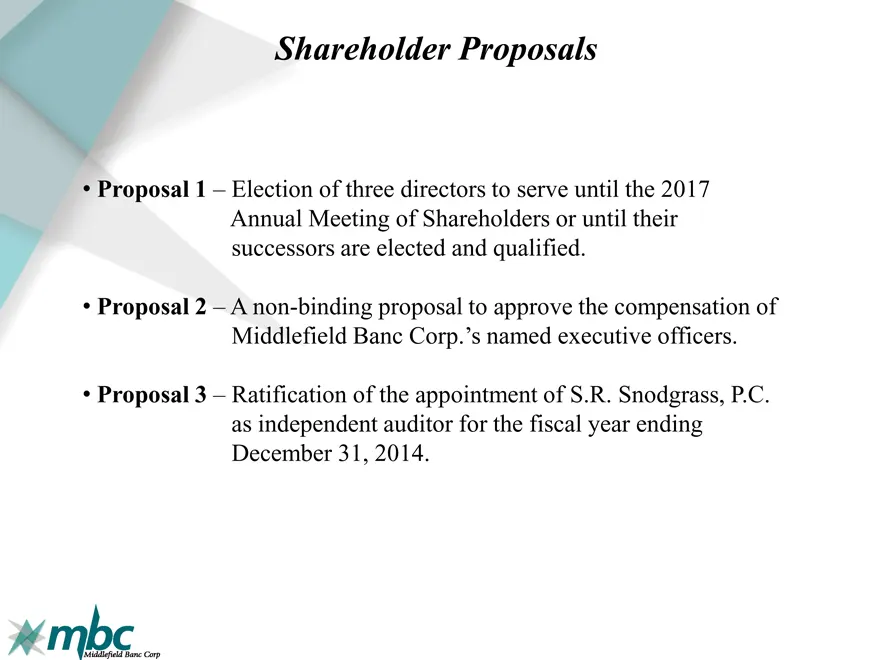
Shareholder Proposals Proposal 1 – Election of three directors to serve until the 2017 Annual Meeting of Shareholders or until their successors are elected and qualified. Proposal 2 – A non-binding proposal to approve the compensation of Middlefield Banc Corp.’s named executive officers. Proposal 3
Slide 7: Annual Shareholder Presentation
Annual Shareholder Presentation Thomas G. Caldwell President & Chief Executive Officer
Slide 8: Forward Looking Statements
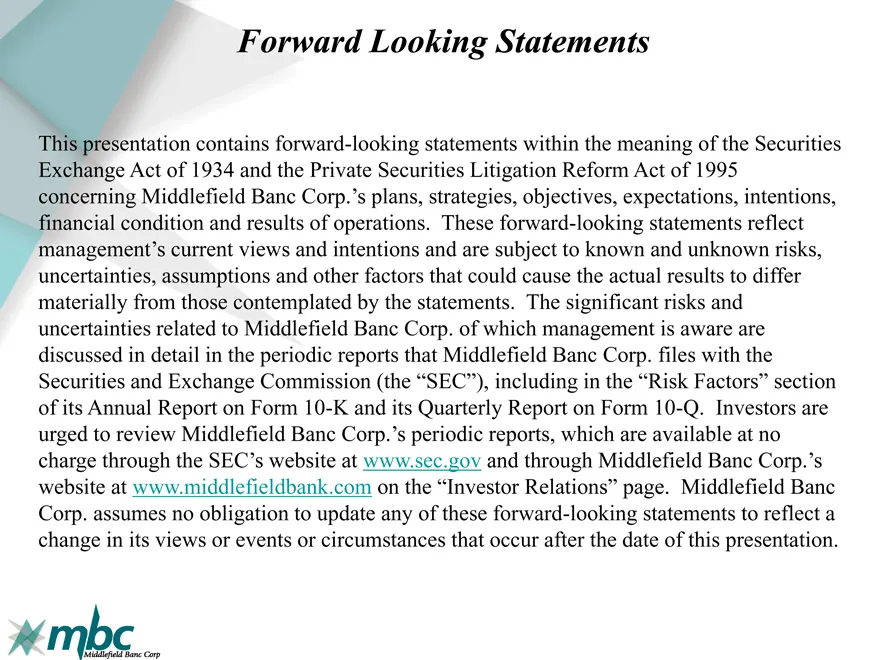
Forward Looking Statements This presentation contains forward-looking statements within the meaning of the Securities Exchange Act of 1934 and the Private Securities Litigation Reform Act of 1995 concerning Middlefield Banc Corp.’s plans, strategies, objectives, expectations, intentions, financial c
Slide 9: Branch Locations
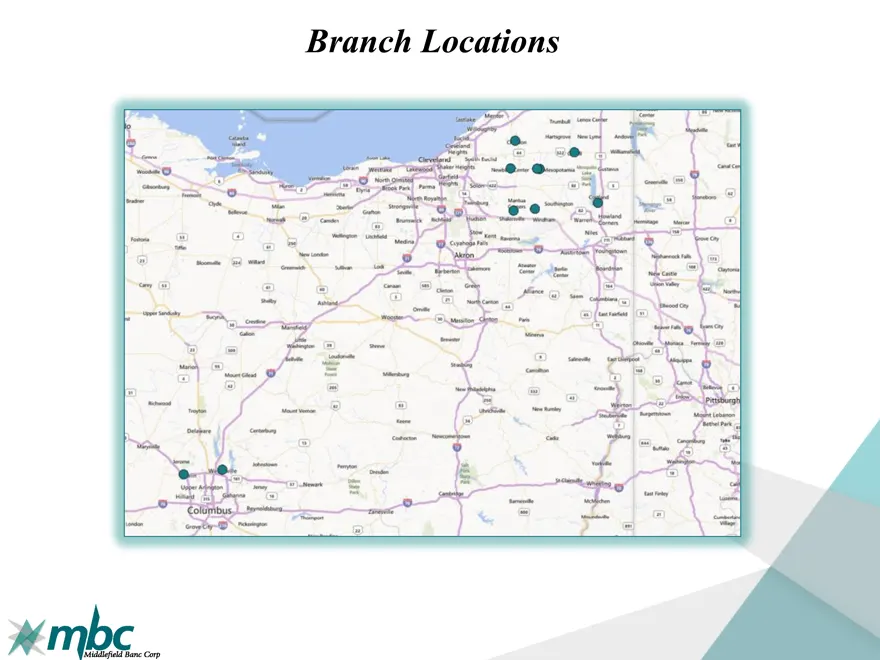
Branch Locations
Slide 10: Financial Summary
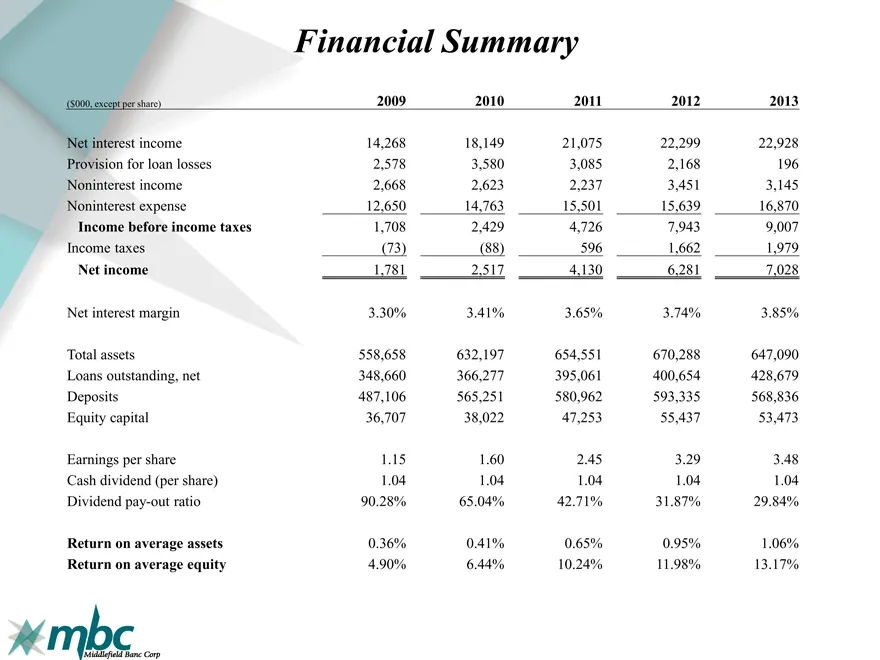
Financial Summary ($000, except per share) 2009 2010 2011 2012 2013 Net interest income 14,268 18,149 21,075 22,299 22,928 Provision for loan losses 2,578 3,580 3,085 2,168 196 Noninterest income 2,668 2,623 2,237 3,451 3,145 Noninterest expense 12,650 14,763 15,501 15,639 16,870 Income before incom
Slide 11: Net Income
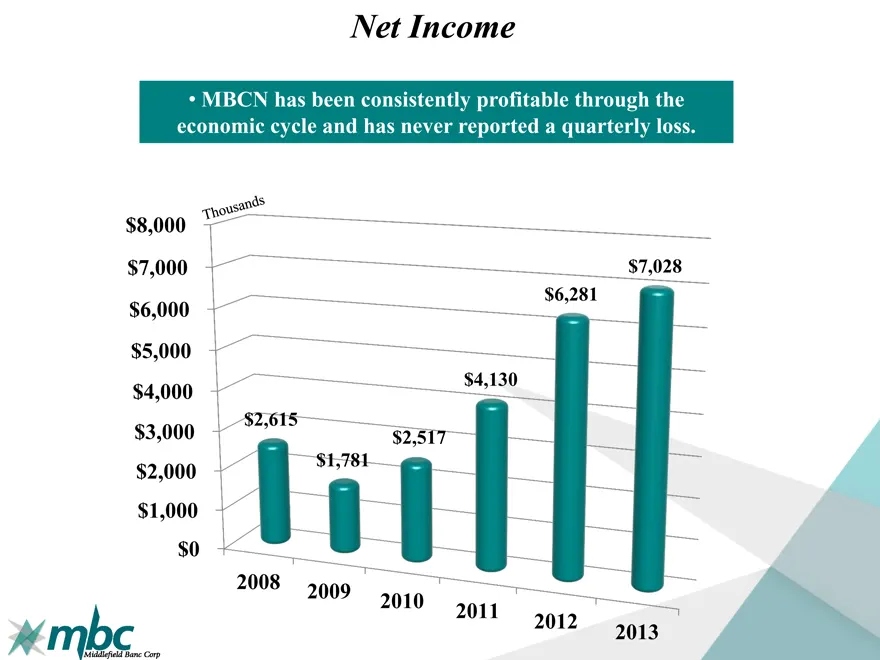
Net Income MBCN has been consistently profitable through the economic cycle and has never reported a quarterly loss. thousands $8,000 $7,000 $7,028 $6,281 $6,000 $5,000 $4,000 $4,130 $2,615 $3,000 $2,517 $2,000 $1,781 $1,000 $0 2008 2009 2010 2011 2012 2013
Slide 12: Earnings Per Share
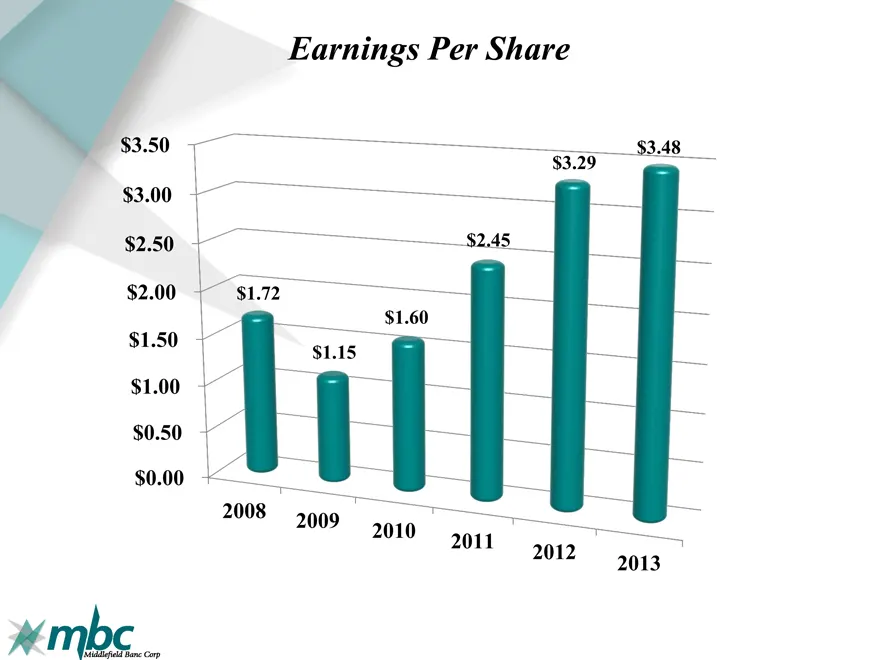
Earnings Per Share $3.50 $3.48 $3.29 $3.00 $2.50 $2.45 $2.00 $1.72 $1.60 $1.50 $1.15 $1.00 $0.50 $0.00 2008 2009 2010 2011 2012 2013
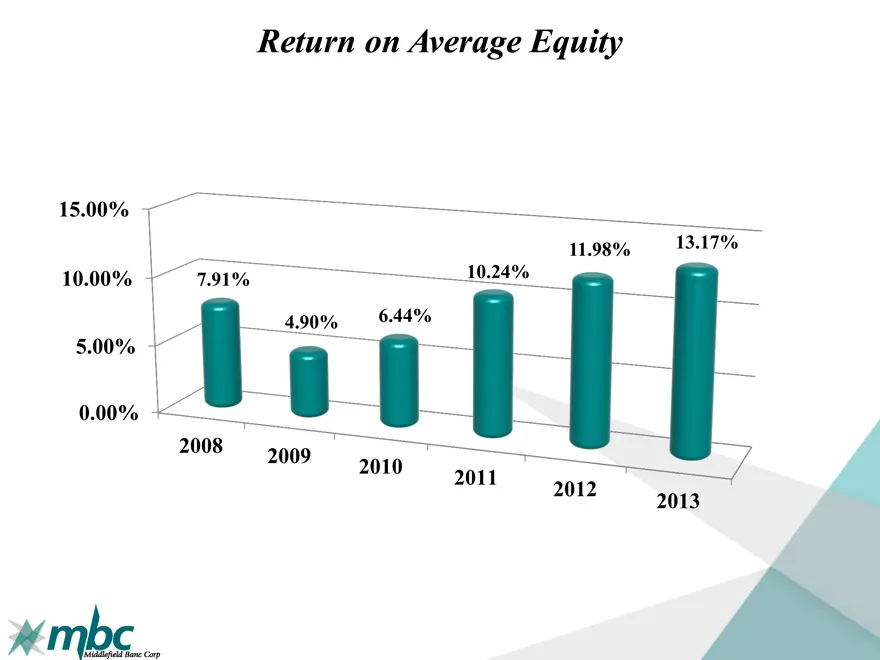
Slide 13: Return on Average Equity
Return on Average Equity 14.00% 12.00% 11.98% 13.17% 10.00% 7.91% 10.24% 4.90% 6.44% 8.00% 6.00% 4.00% 2.00% 0.00% 2008 2009 2010 2011 2012 2013
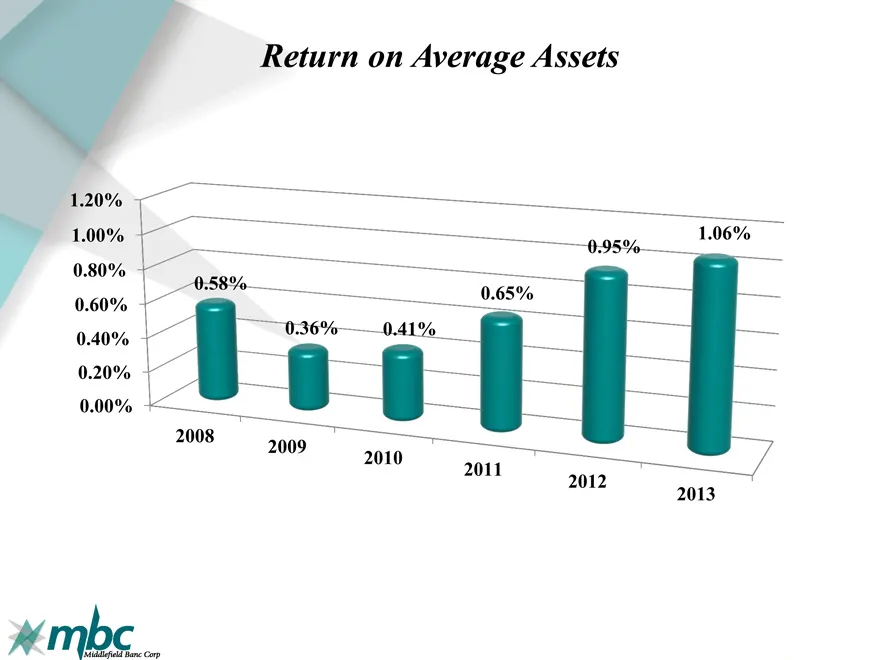
Slide 14: Return on Average Assets
Return on Average Assets 1.20% 1.00% 1.06% 0.95% 0.80% 0.58% 0.65% 0.60% 0.40% 0.36% 0.41% 0.20% 0.00% 2008 2009 2010 2011 2012 2013
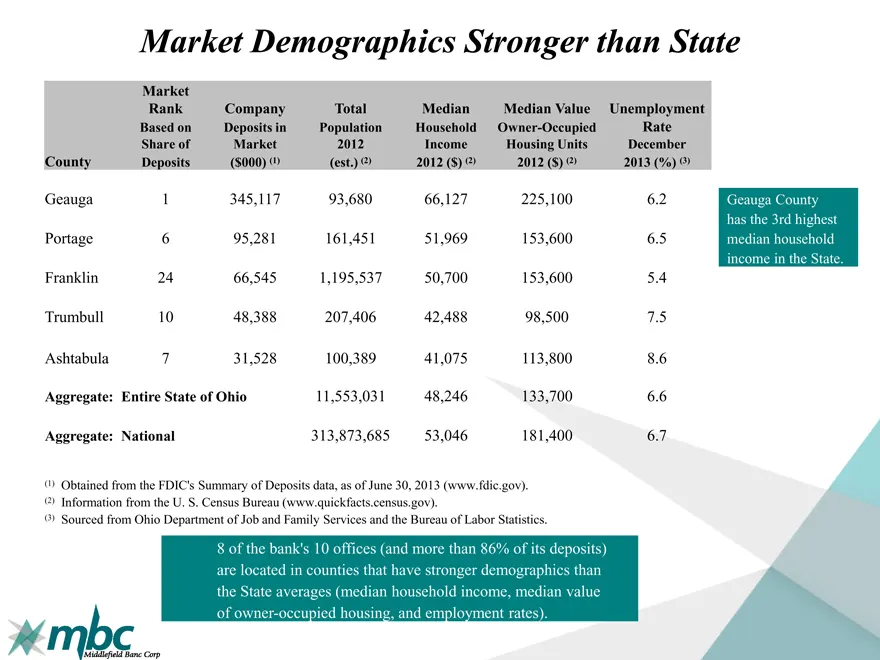
Slide 15: Market Demographics Stronger than State
Market Demographics Stronger than State Market Rank Company Total Median Median Value Unemployment Based on Deposits in Population Household Owner-Occupied Rate Share of Market 2012 Income Housing Units December County Deposits ($000) (1) (est.) (2) 2012 ($) (2) 2012 ($) (2) 2013 (%) (3) Geauga 1 34
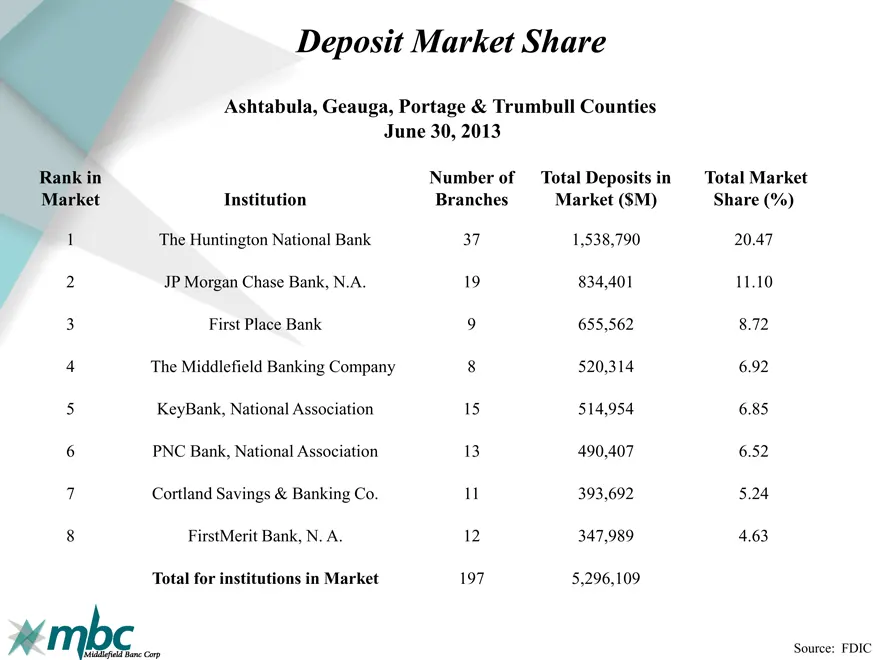
Slide 16: Deposit Market Share
Deposit Market Share Ashtabula, Geauga, Portage & Trumbull Counties June 30, 2013 Rank in Number of Total Deposits in Total Market Market Institution Branches Market ($M) Share (%) The Huntington National Bank 37 1,538,790 20.47 JP Morgan Chase Bank, N.A. 19 834,401 11.10 First Place Bank 9 655,562
Slide 17: Total Assets
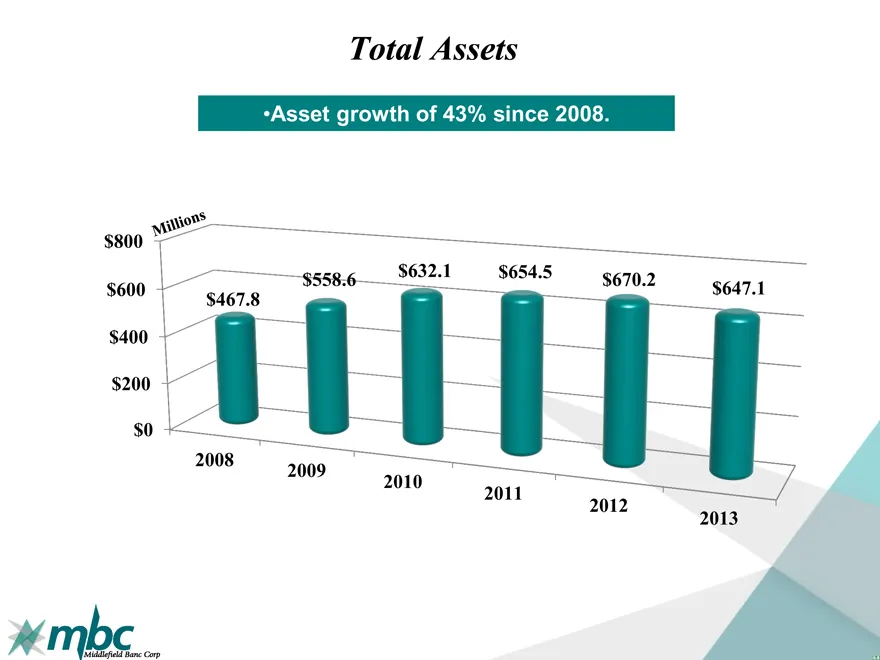
Total Assets Asset growth of 43% since 2008. $800 Millions $558.6 $632.1 $654.5 $670.2 $600 $647.1 $467.8 $400 $200 $0 2008 2009 2010 2011 2012 2013
Slide 18: Strong Loan Growth
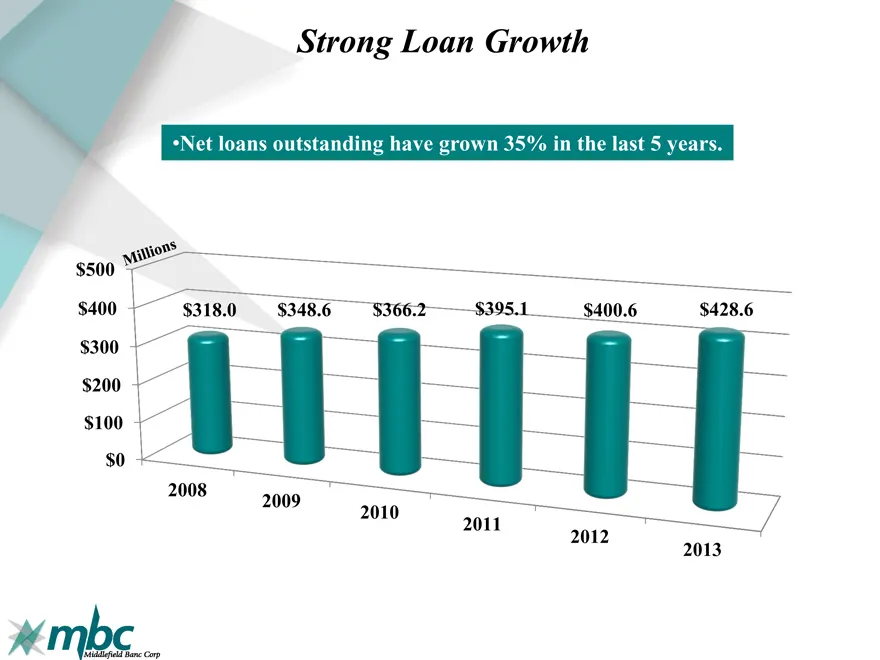
Strong Loan Growth • Net loans outstanding have grown 35% in the last 5 years. $500 Millions $400 $318.0 $348.6 $366.2 $395.1 $400.6 $428.6 $300 $200 $100 $0 2008 2009 2010 2011 2012 2013
Slide 19: Stable and Diverse Loan Portfolio
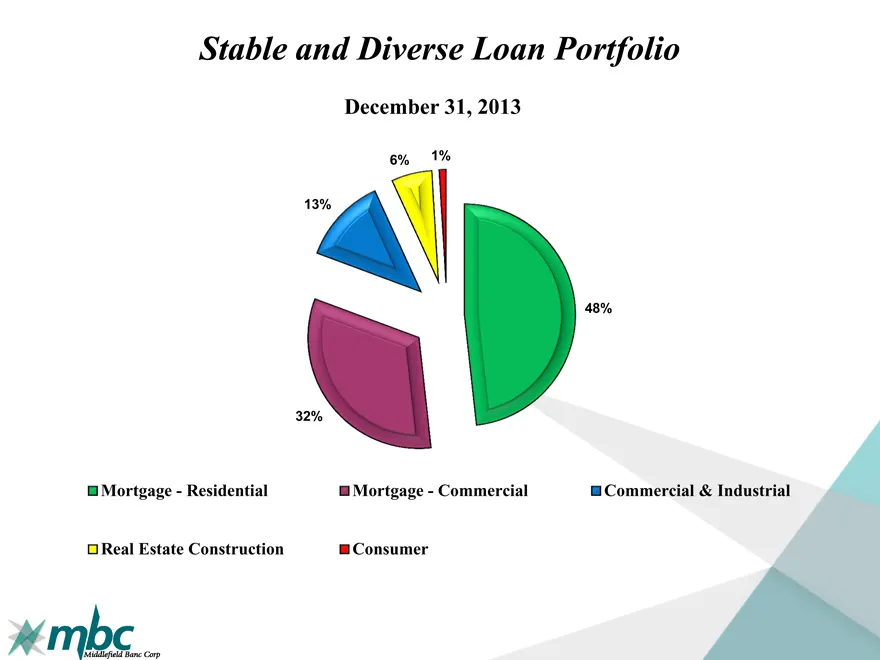
Stable and Diverse Loan Portfolio December 31, 2013 6% 1% 13% 48% 32% Mortgage—Residential Mortgage—Commercial Commercial & Industrial Real Estate Construction Consumer
Slide 20: Asset Quality
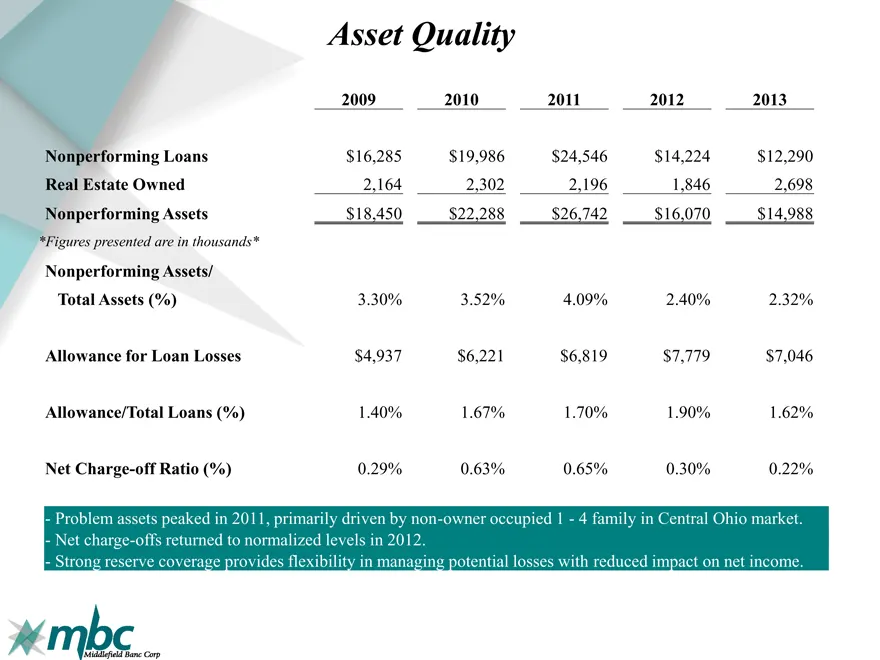
Asset Quality 2009 2010 2011 2012 2013 Nonperforming Loans $16,285 $19,986 $24,546 $14,224 $12,290 Real Estate Owned 2,164 2,302 2,196 1,846 2,698 Nonperforming Assets $18,450 $22,288 $26,742 $16,070 $14,988 *Figures presented are in thousands* Nonperforming Assets/ Total Assets (%) 3.30% 3.52% 4.09
Slide 21: Securities Portfolio
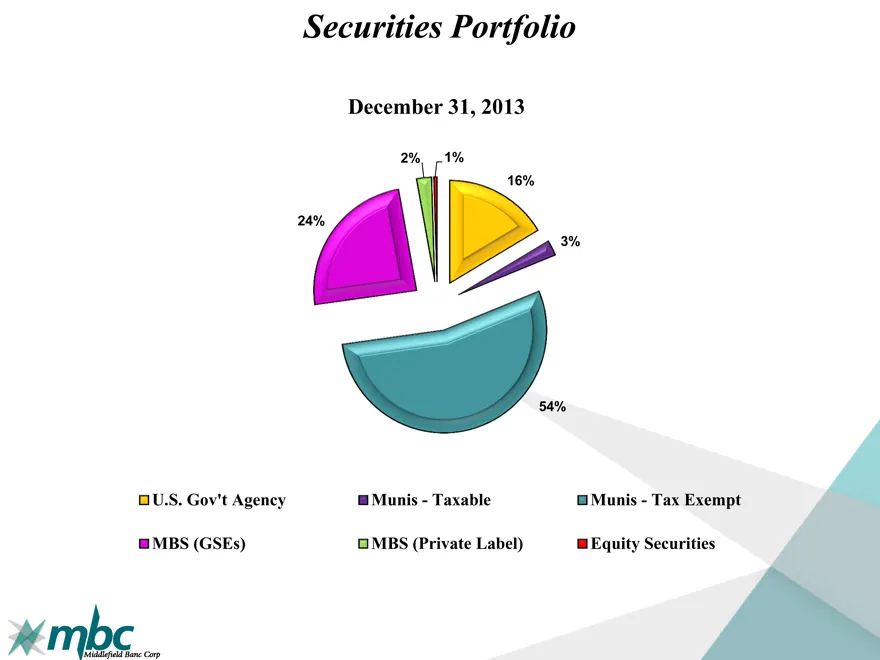
Securities Portfolio December 31, 2013 2% 1% 16% 24% 3% 54% U.S. Gov’t Agency Munis—Taxable Munis—Tax Exempt MBS (GSEs) MBS (Private Label) Equity Securities
Slide 22: Managed Deposit Growth
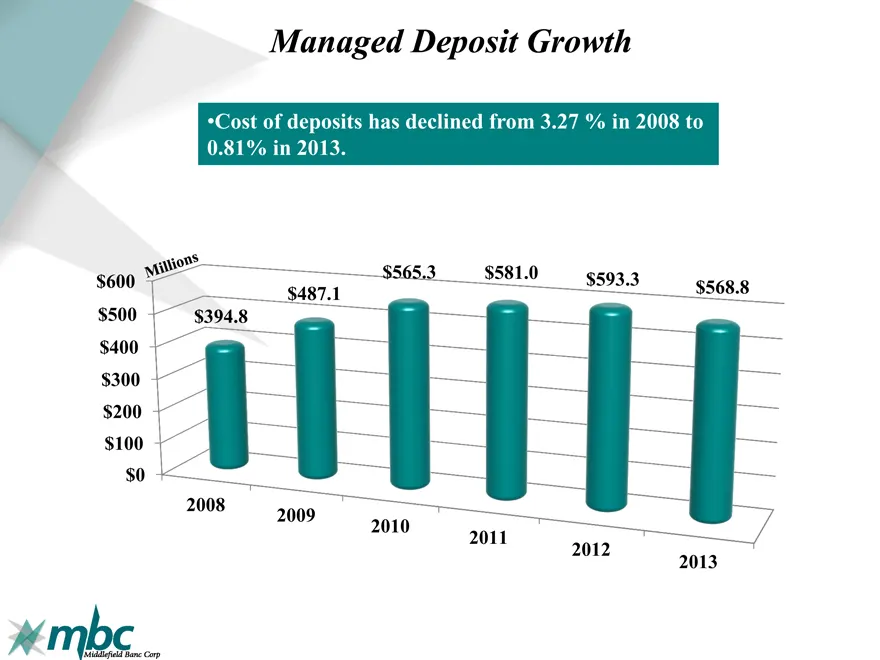
Managed Deposit Growth • Cost of deposits has declined from 3.27 % in 2008 to 0.81% in 2013. $600 Millions $565.3 $581.0 $593.3 $568.8 $487.1 $500 $394.8 $400 $300 $200 $100 $0 2008 2009 2010 2011 2012 2013
Slide 23: Strong Core Deposit Base
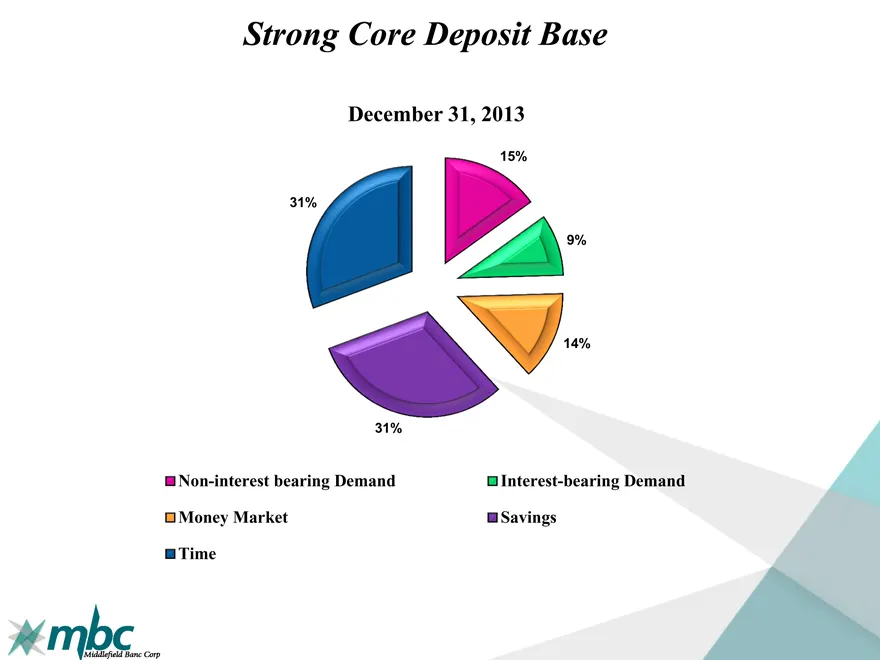
Strong Core Deposit Base December 31, 2013 15% 31% 9% 14% 31% Non-interest bearing Demand Interest-bearing Demand Money Market Savings Time
Slide 24: Capital Ratios
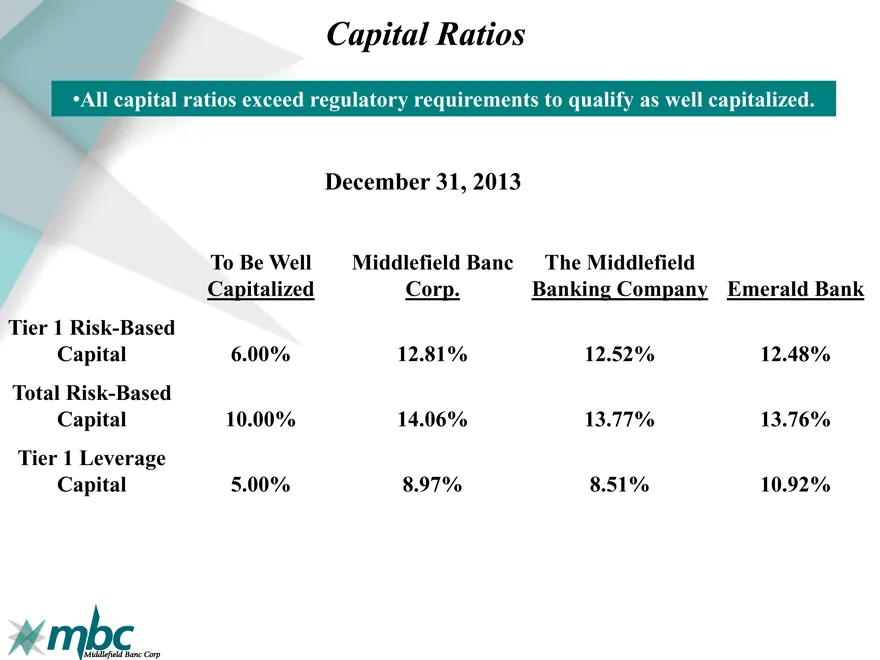
Capital Ratios • All capital ratios exceed regulatory requirements to qualify as well capitalized. December 31, 2013 To Be Well Middlefield Banc The Middlefield Capitalized Corp. Banking Company Emerald Bank Tier 1 Risk-Based Capital 6.00% 12.81% 12.52% 12.48% Total Risk-Based Capital 10.00% 14.06%
Slide 25: 2013 Initiatives
2013 Initiatives Quality loan growth Leverage technology Expand non-interest income Retain, attract, and develop high quality associates Continue building branch recognition
Slide 26: Today's Banking Landscape
Today’s Banking Landscape High level of competition for share of wallet Increasing regulatory concerns with added costs for smaller banks Economic challenges with a continued low rate environment and slow growth Uncertain loan demand
Slide 27: 2014 and Forward
2014 and Forward Personnel/Talent —Strong management to drive performance growth —Sales-orientation and cultural fit Operations/Risk Management —Expanded technology —Scaled to support growth initiatives —Diligent risk management incorporating regulatory environment Expand Share of Market/Share of Cu

Slide 28: Questions, Comments, and Discussion
Questions, Comments, and Discussion
Slide 29: Voting Results
Voting Results • Election of three Directors • Non-binding proposal on compensation • Ratification of appointment of S.R. Snodgrass, P.C.
Slide 30: Thank you for your support!
Thank you for your support! May 14, 2014
Source: SEC EDGAR · 8-K filed May 14, 2014
More decks from Middlefield Banc
 Merger or Acquisition (October 2025)27 slides · Oct 22, 2025
 Q2 2025 Earnings Presentation24 slides · Jul 28, 2025
 Investor Presentation (June 2025)23 slides · Jun 2, 2025
 Q4 2024 Earnings Presentation24 slides · Jan 27, 2025
 Investor Presentation (November 2024)25 slides · Nov 22, 2024
 Investor Presentation (July 2024)25 slides · Jul 29, 2024