Lagardere SA · EURONEXT:MMB
Lagardere SA — FY2021 Earnings Presentation
48 slides from Lagardere SA's earnings presentation, Feb 17, 2022
Slide 1: Full-Year 2021 Results
FULL-YEAR 2021 RESULTS 17 February 2022
Slide 2: Disclaimer
Full-year 2021 results / 17 February 2022 DISCLAIMER By reading this presentation, you further agree to be bound by the following limitations and qualifications: This presentation is for information purposes only and does not constitute an offer or solicitation for the sale or purchase of any securi
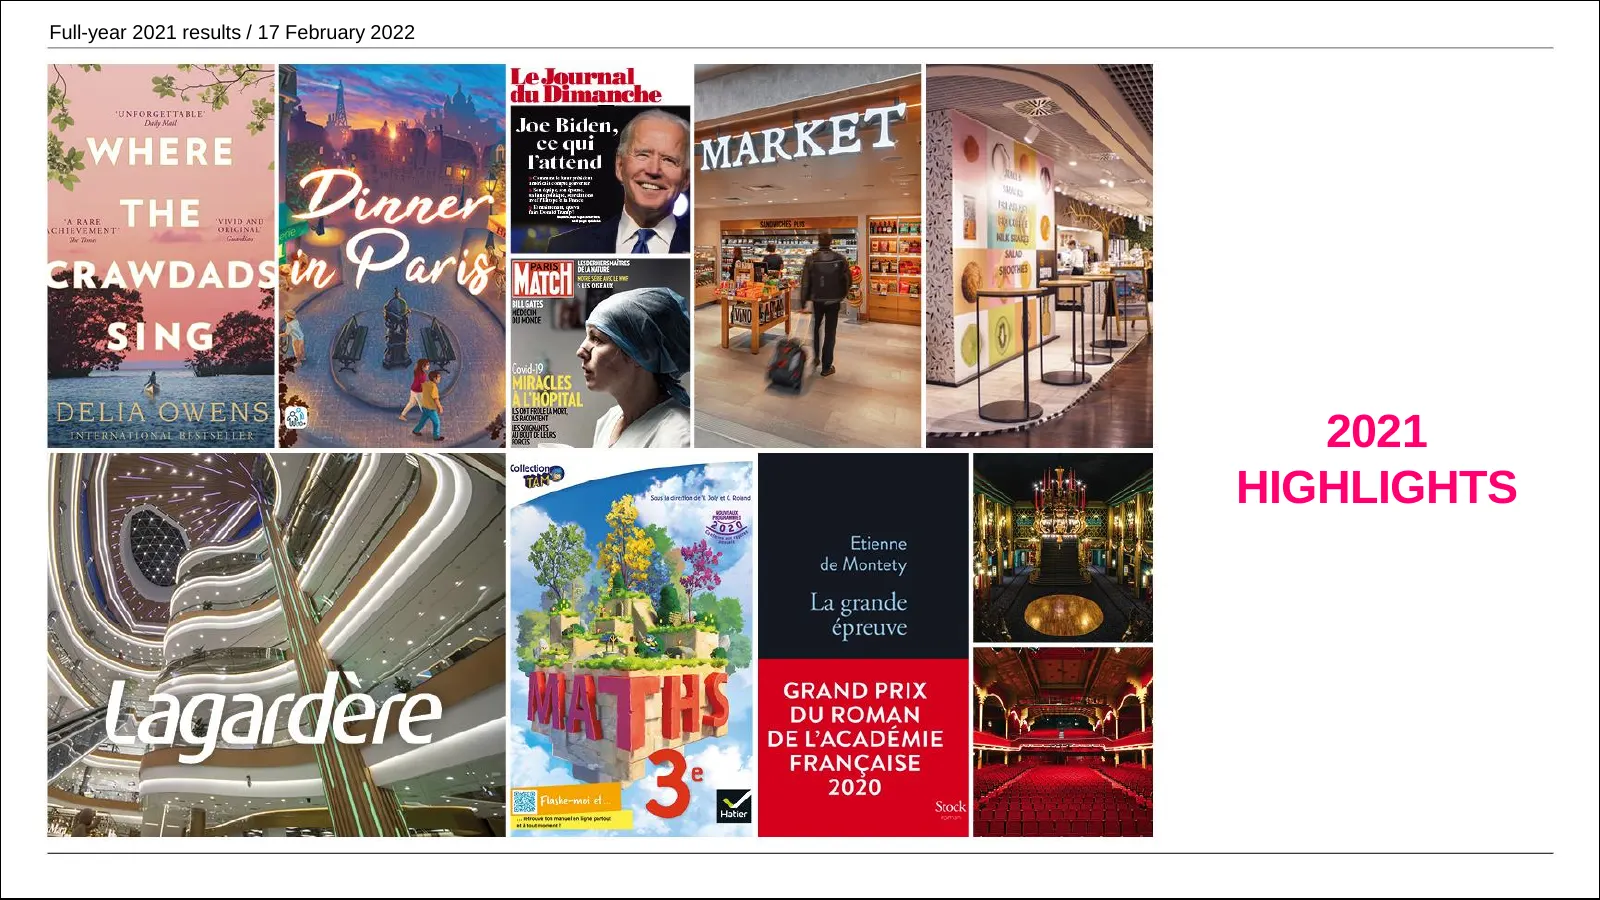
Slide 3: 2021 Highlights
Full-year 2021 results / 17 February 2022 2021 HIGHLIGHTS
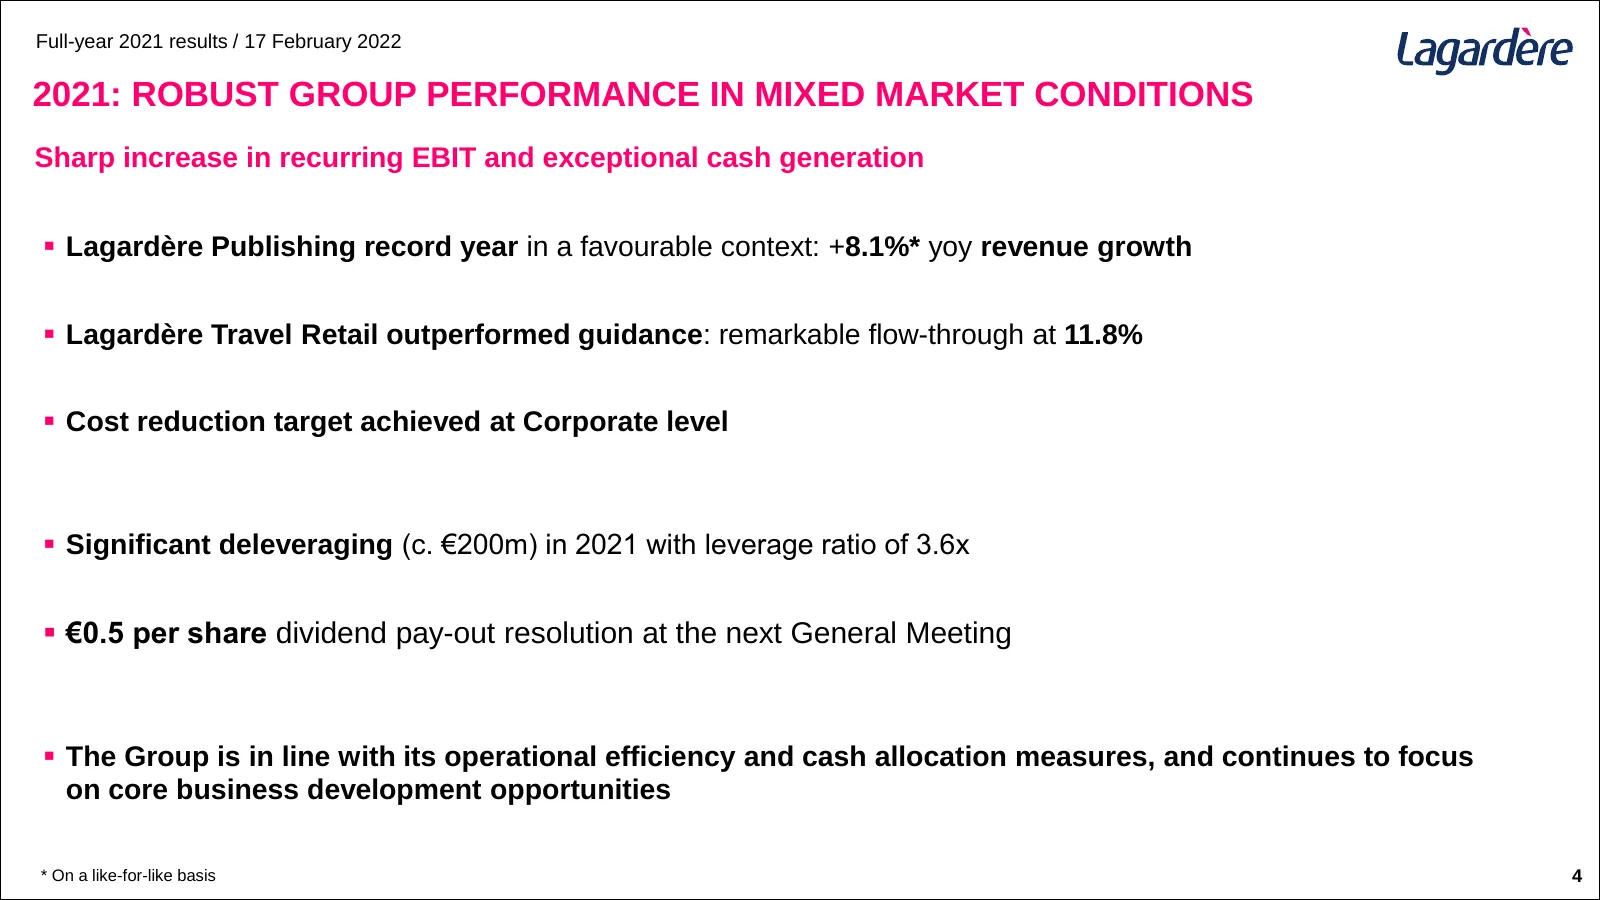
Slide 4: 2021: Robust Group Performance in Mixed Market Conditions
Full-year 2021 results / 17 February 2022 2021: ROBUST GROUP PERFORMANCE IN MIXED MARKET CONDITIONS Sharp increase in recurring EBIT and exceptional cash generation ▪ Lagardère Publishing record year in a favourable context: +8.1%* yoy revenue growth ▪ Lagardère Travel Retail outperformed guidance:
Slide 5: Growth & Profitability Restored in 2021
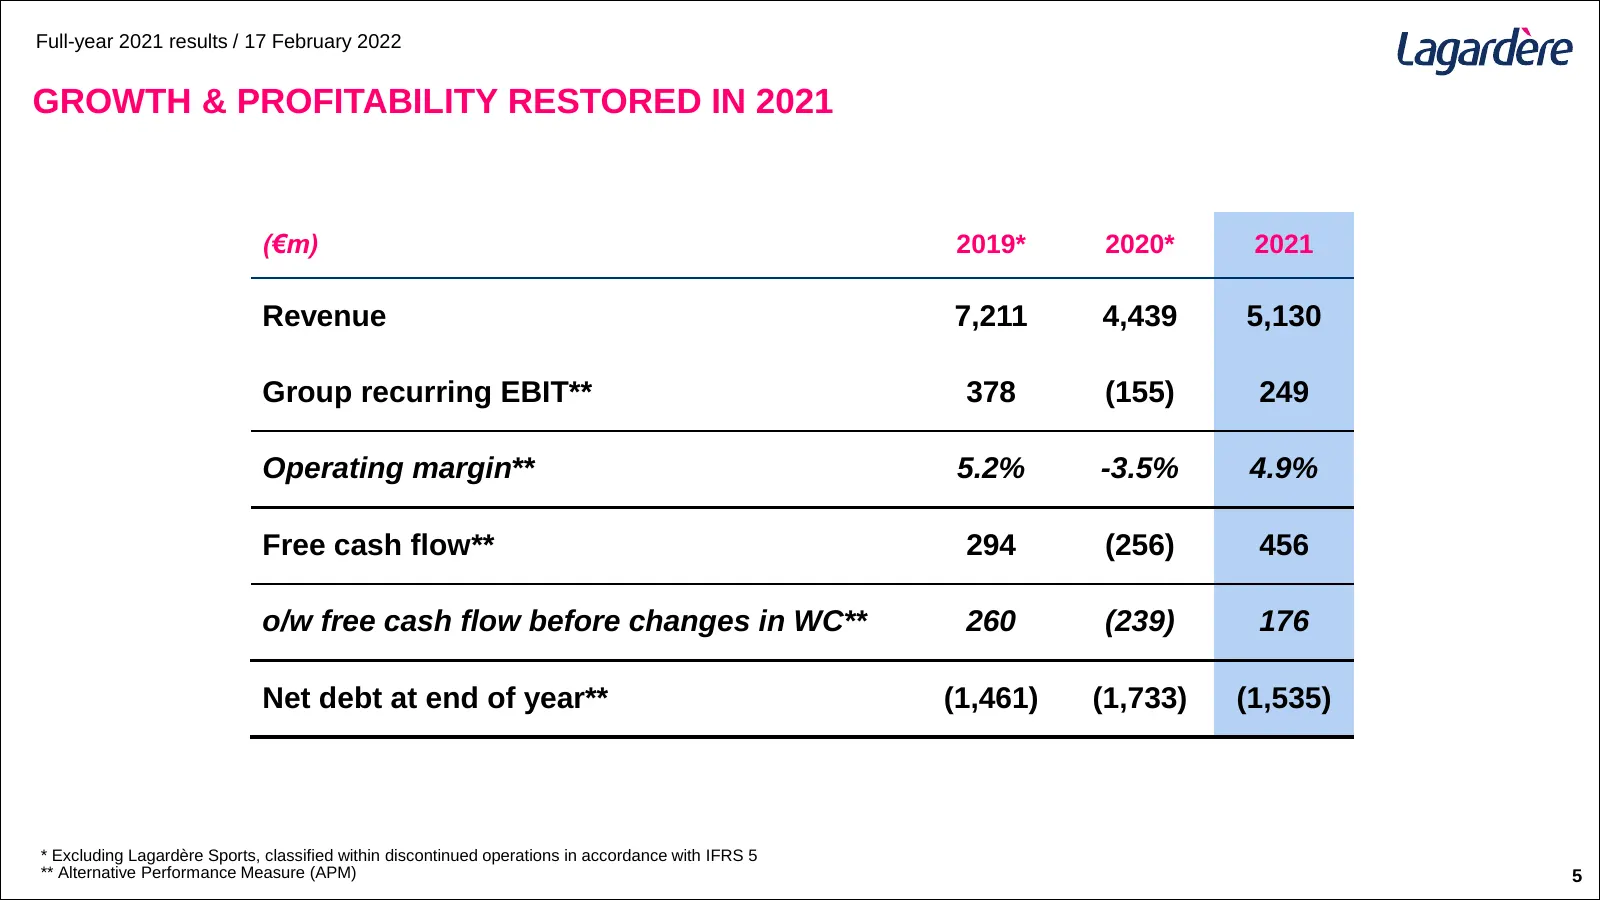
Full-year 2021 results / 17 February 2022 GROWTH & PROFITABILITY RESTORED IN 2021 (€m) 2019* 2020* 2021 Revenue 7,211 4,439 5,130 Group recurring EBIT** 378 (155) 249 Operating margin** 5.2% -3.5% 4.9% Free cash flow** 294 (256) 456 o/w free cash flow before changes in WC** 260 (239) 176 Net debt at
Slide 6: Strong Group Revenue Performance at +18.6%
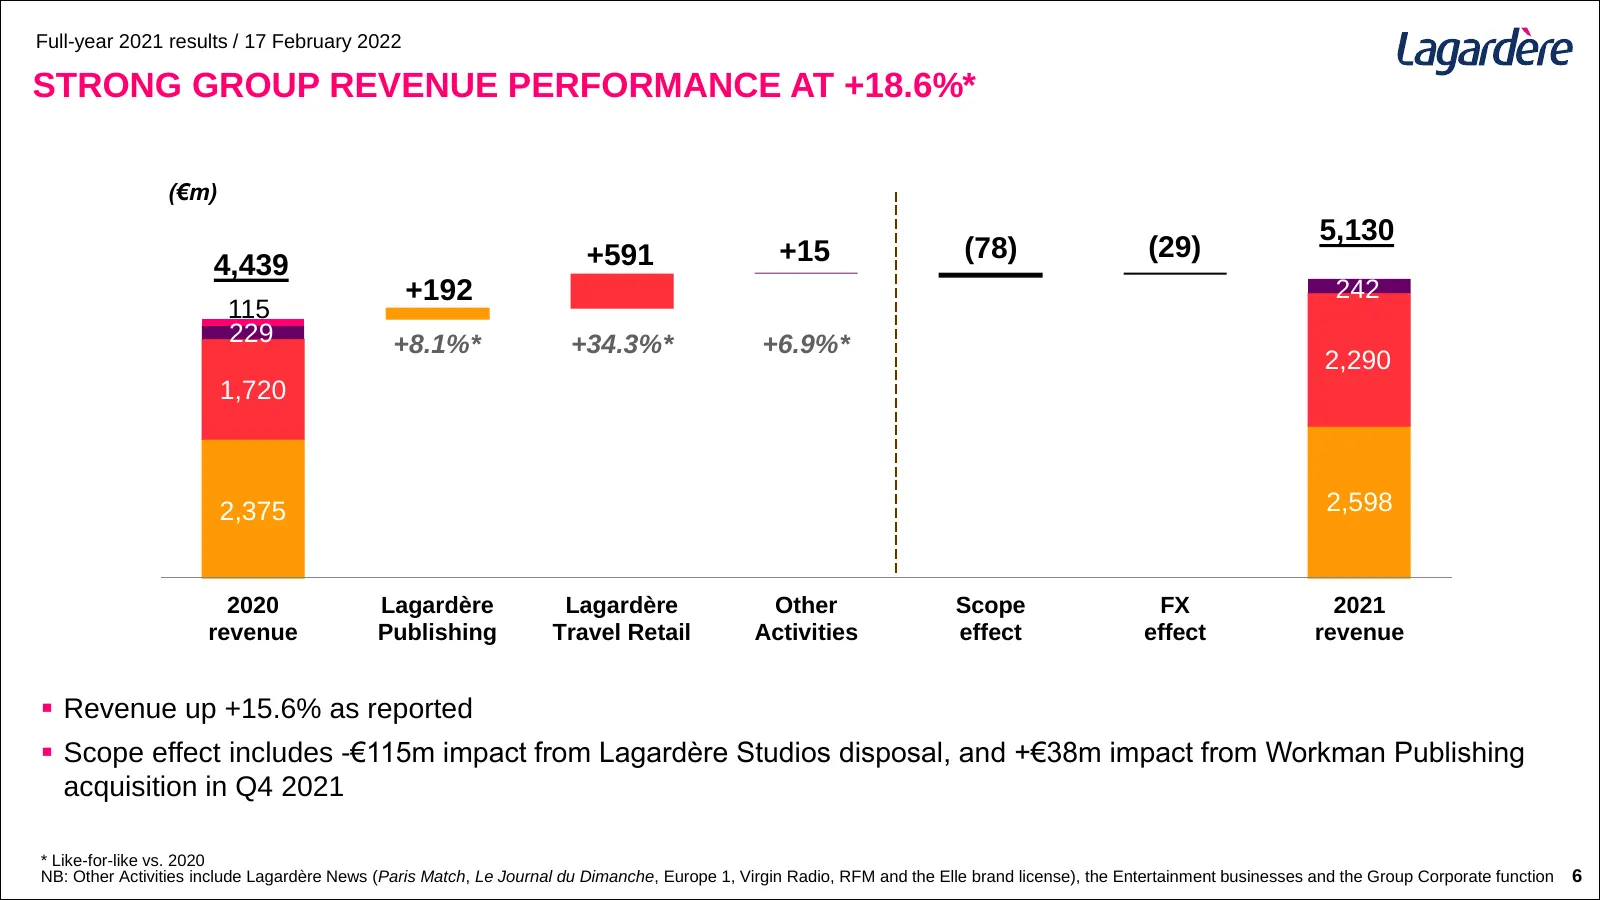
Full-year 2021 results / 17 February 2022 STRONG GROUP REVENUE PERFORMANCE AT +18.6%* (€m) 5,130 +591 +15 (78) (29) 4,439 +192 242 115 229 +8.1%* +34.3%* +6.9%* 2,290 1,720 2,375 2,598 2020 Lagardère Lagardère Other Scope FX 2021 revenue Publishing Travel Retail Activities effect effect revenue ▪ Re
Slide 7: Tremendous Improvement in Recurring EBIT Across Divisions
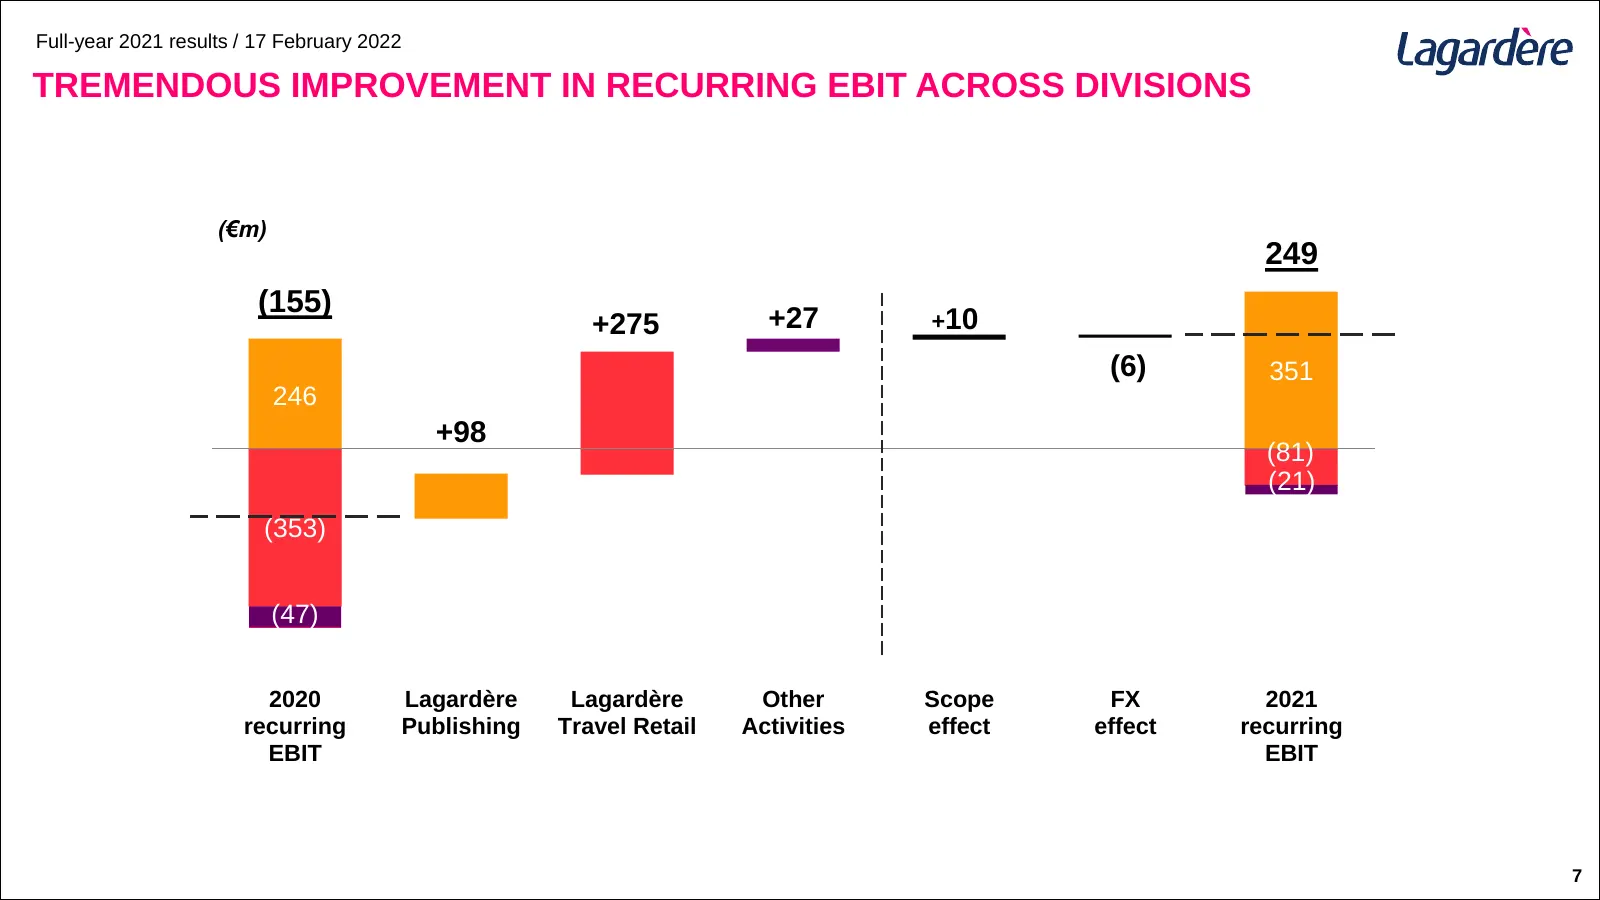
Full-year 2021 results / 17 February 2022 TREMENDOUS IMPROVEMENT IN RECURRING EBIT ACROSS DIVISIONS (€m) 249 (155) +275 +27 +10 (6) 351 246 +98 (81) (21) (353) (47) 2020 Lagardère Lagardère Other Scope FX 2021 recurring Publishing Travel Retail Activities effect effect recurring EBIT EBIT 7
Slide 8: ESG at Lagardère: Core Commitments
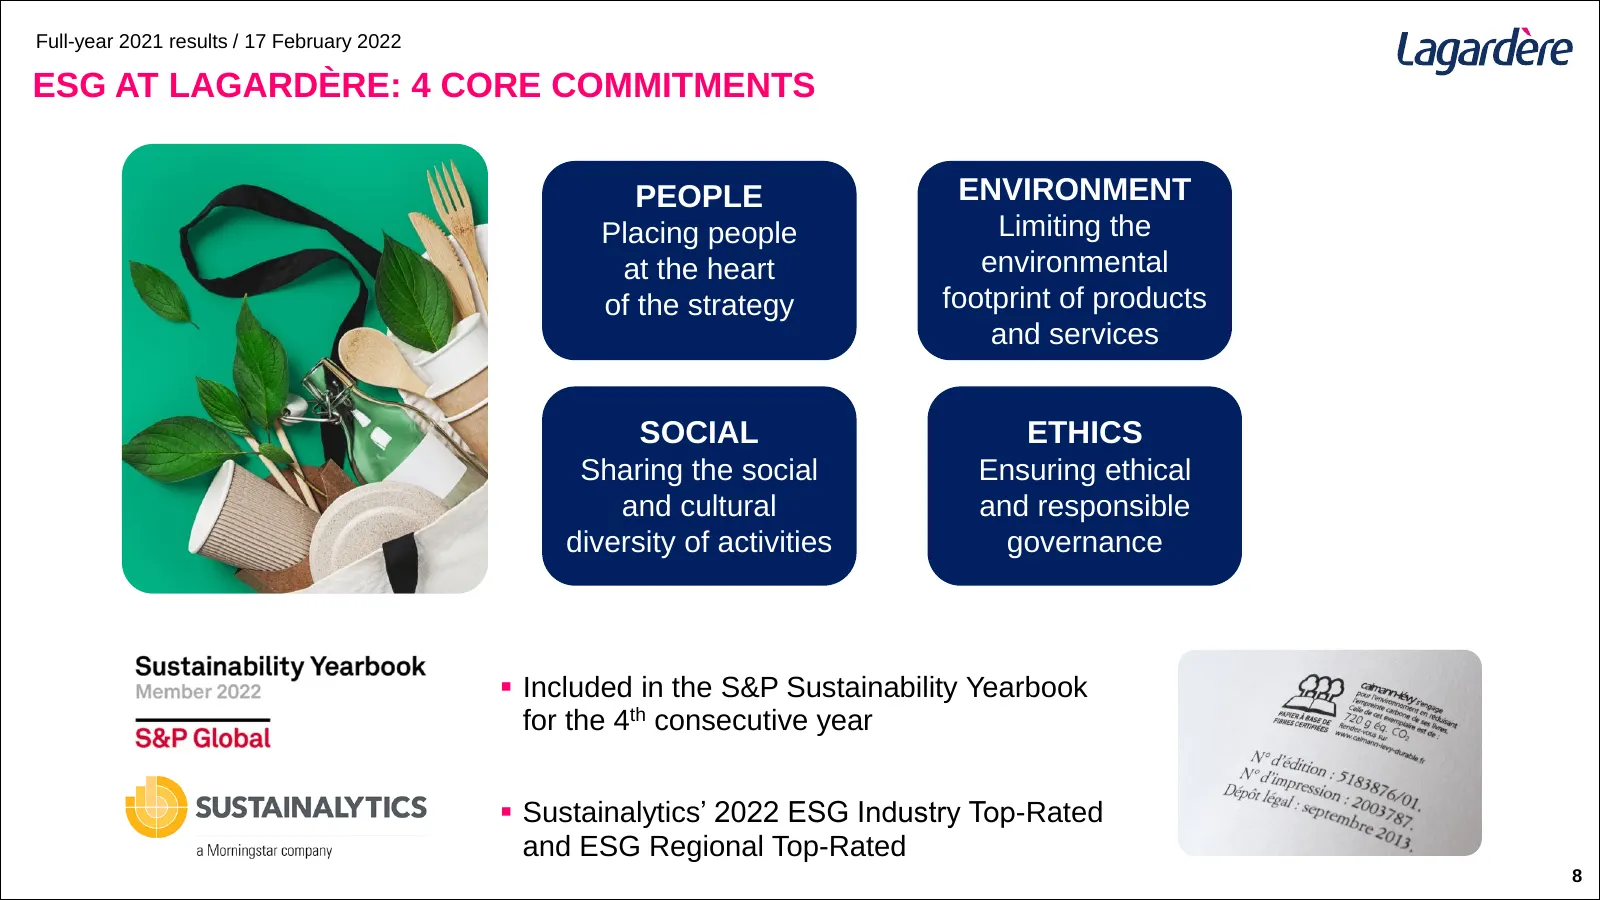
Full-year 2021 results / 17 February 2022 ESG AT LAGARDÈRE: 4 CORE COMMITMENTS PEOPLE ENVIRONMENT Placing people Limiting the at the heart environmental of the strategy footprint of products and services SOCIAL ETHICS Sharing the social Ensuring ethical and cultural and responsible diversity of acti
Slide 9: Delivering First Group Carbon Footprint Assessment in 2021
Full-year 2021 results / 17 February 2022 DELIVERING FIRST GROUP CARBON FOOTPRINT ASSESSMENT IN 2021 Calculated on the full scope (1, 2, 3), according to Greenhouse Gas Protocol methodology ▪ Relevant perimeter for Lagardère Publishing, Lagardère Travel Retail and Lagardère News ▪ Assessment to be d
Slide 10: Performance by Division
Full-year 2021 results / 17 February 2022 PERFORMANCE BY DIVISION
Slide 11: 2021 Performance
Full-year 2021 results / 17 February 2022 2021 PERFORMANCE
Slide 12: Exceptional Revenue Growth in an Unprecedented Context
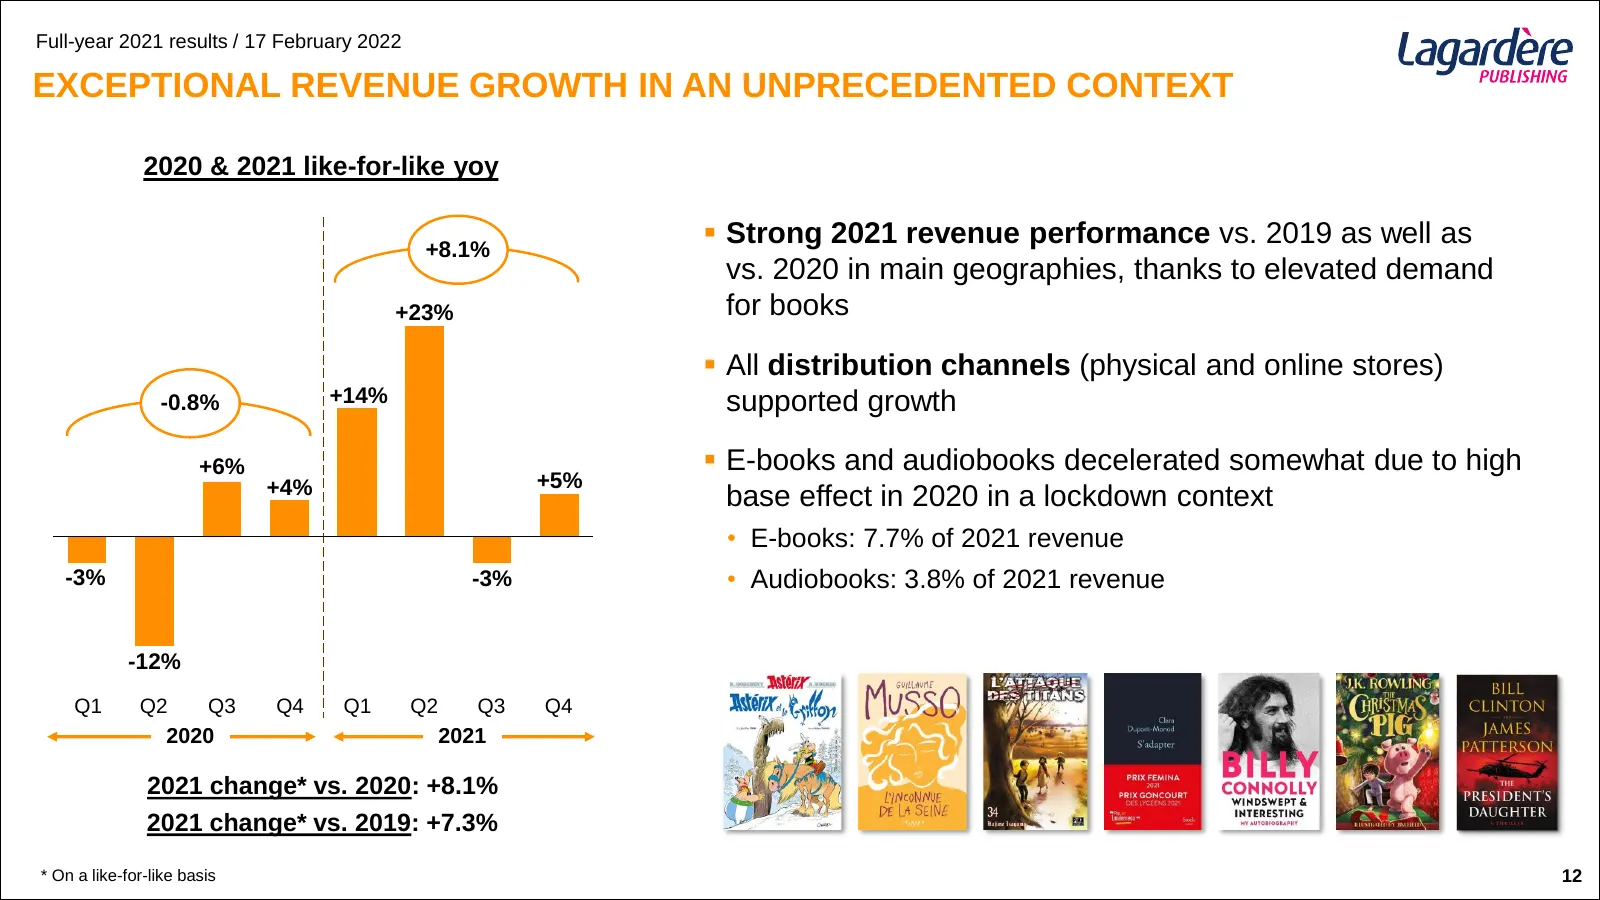
Full-year 2021 results / 17 February 2022 EXCEPTIONAL REVENUE GROWTH IN AN UNPRECEDENTED CONTEXT 2020 & 2021 like-for-like yoy +8.1% ▪ Strong 2021 revenue performance vs. 2019 as well as vs. 2020 in main geographies, thanks to elevated demand +23% for books ▪ All distribution channels (physical and
Slide 13: Illustrated Books & General Literature Driving Growth Across Regions
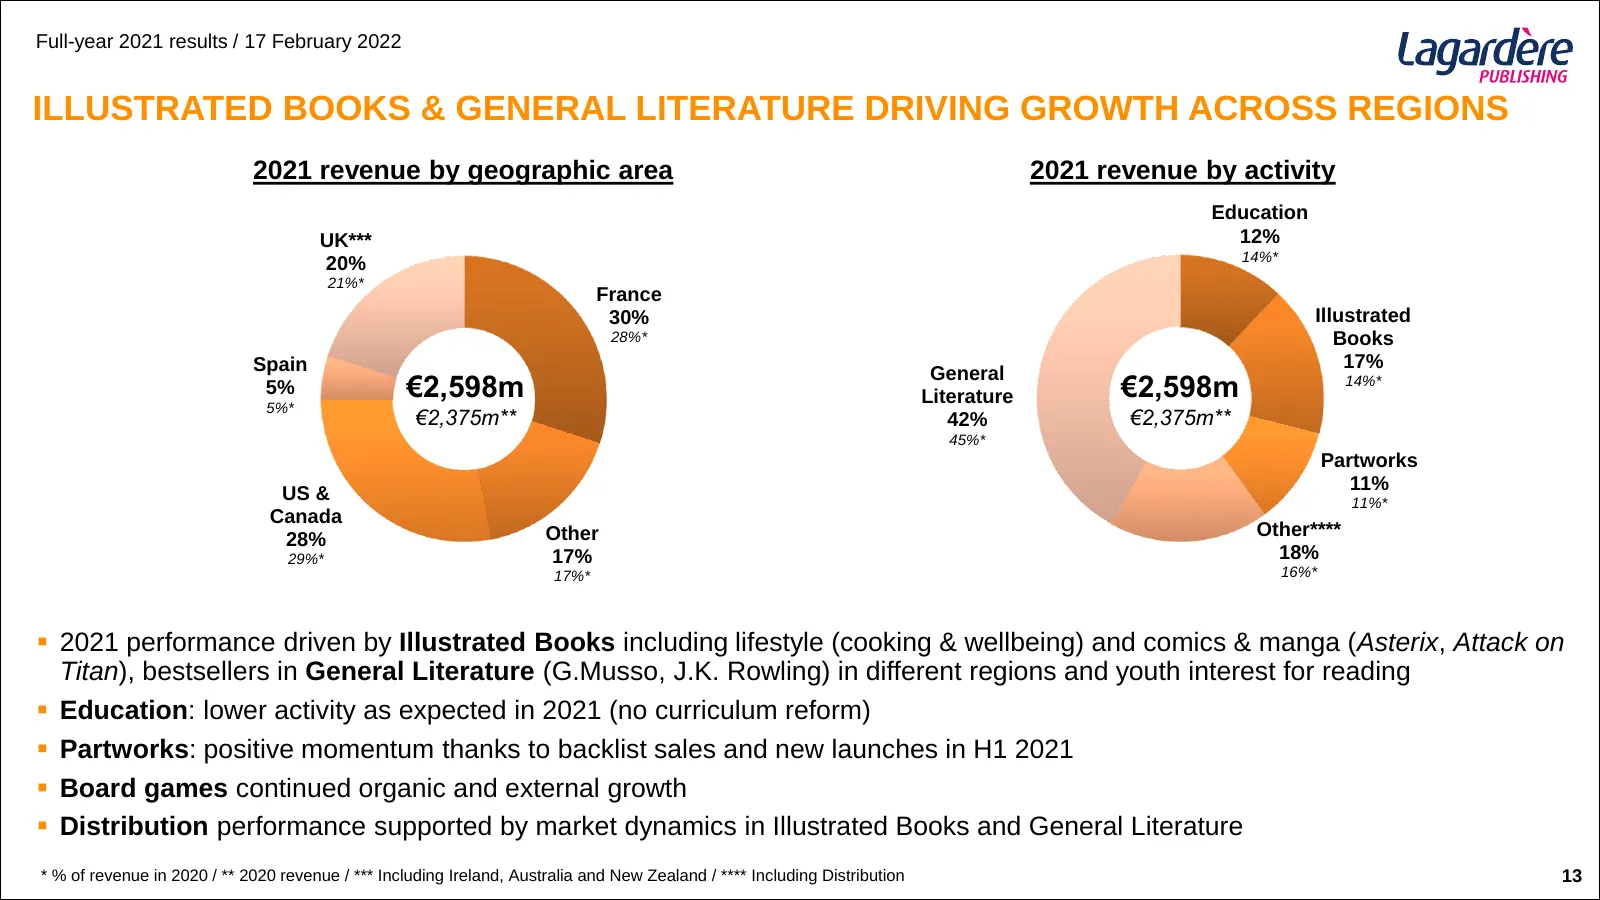
Full-year 2021 results / 17 February 2022 ILLUSTRATED BOOKS & GENERAL LITERATURE DRIVING GROWTH ACROSS REGIONS 2021 revenue by geographic area 2021 revenue by activity Education UK*** 12% 14%* 20% 21%* France 30% Illustrated 28%* Books Spain 17% General 5% €2,598m Literature €2,598m 14%* 5%* €2,375m
Slide 14: Lagardère Publishing Strengthening US Position with Workman Publishing
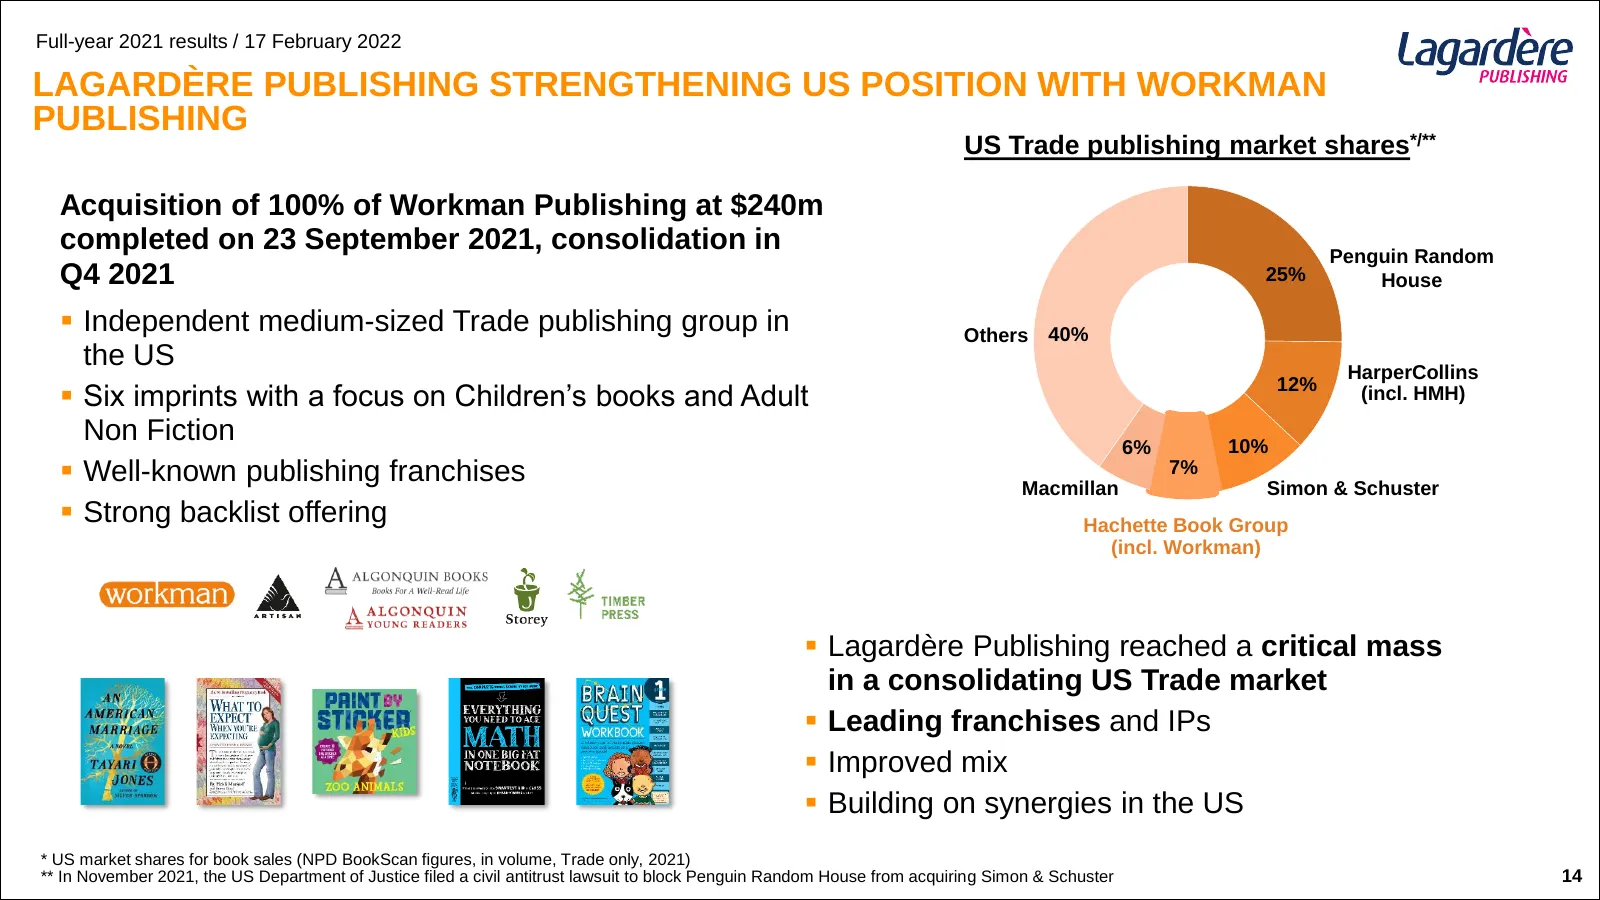
Full-year 2021 results / 17 February 2022 LAGARDÈRE PUBLISHING STRENGTHENING US POSITION WITH WORKMAN PUBLISHING US Trade publishing market shares*/** Acquisition of 100% of Workman Publishing at $240m completed on 23 September 2021, consolidation in Penguin Random Q4 2021 25% House ▪ Independent me
Slide 15: Record Profitability in 2021
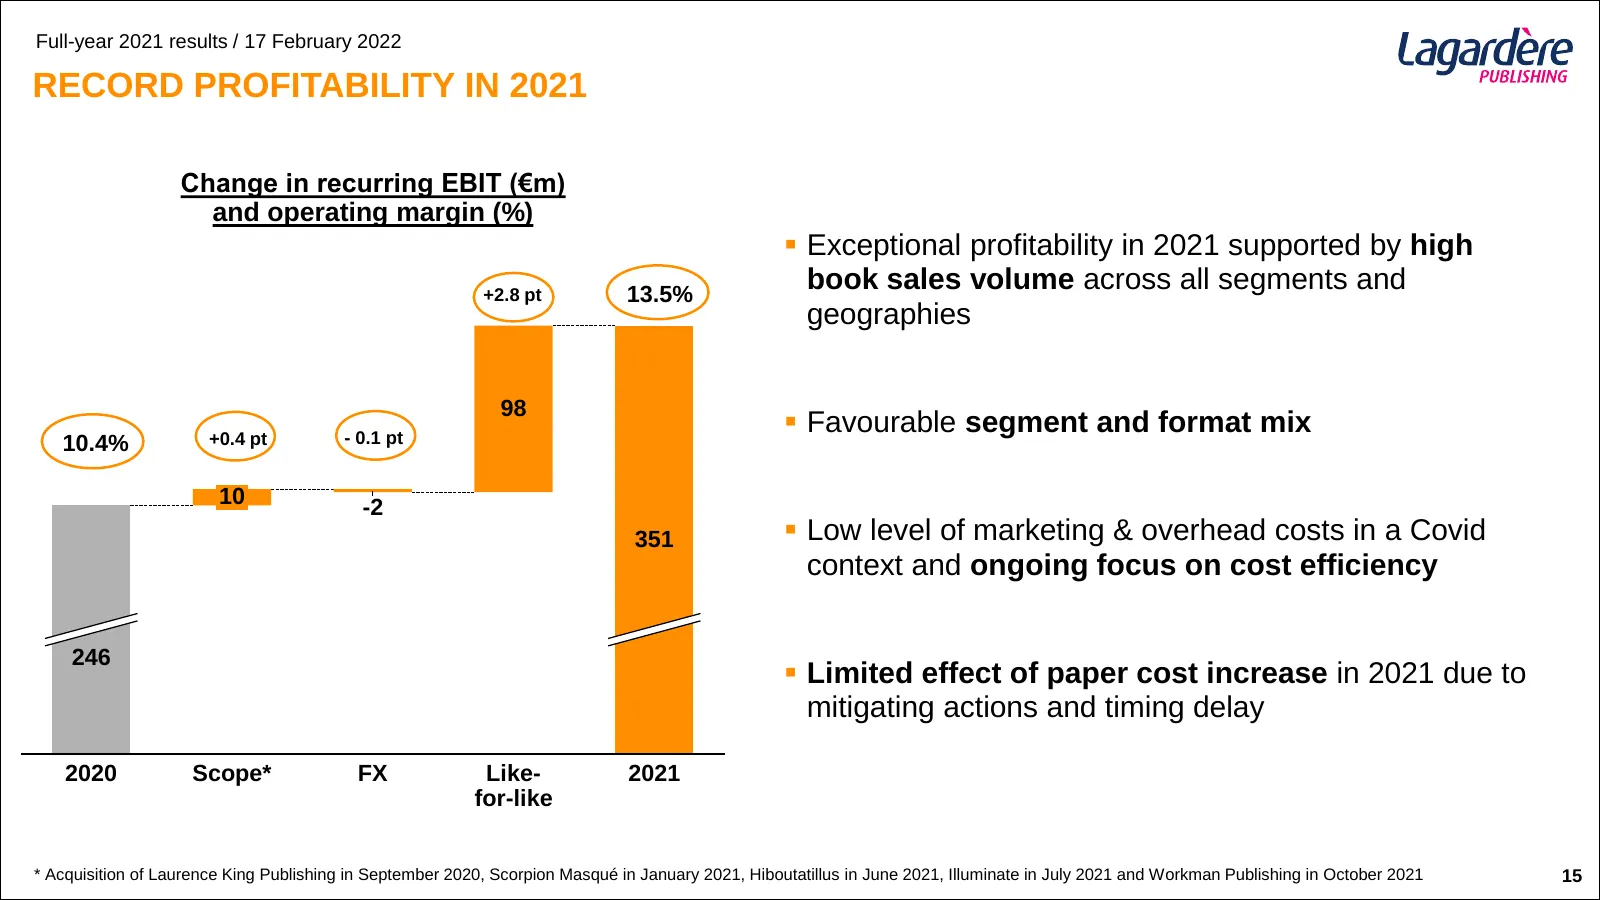
Full-year 2021 results / 17 February 2022 RECORD PROFITABILITY IN 2021 Change in recurring EBIT (€m) and operating margin (%) ▪ Exceptional profitability in 2021 supported by high +2.8 pt 13.5% book sales volume across all segments and geographies 98 +0.4 pt - 0.1 pt ▪ Favourable segment and format
Slide 16: Outstanding Cash Generation Thanks to Strong Operations
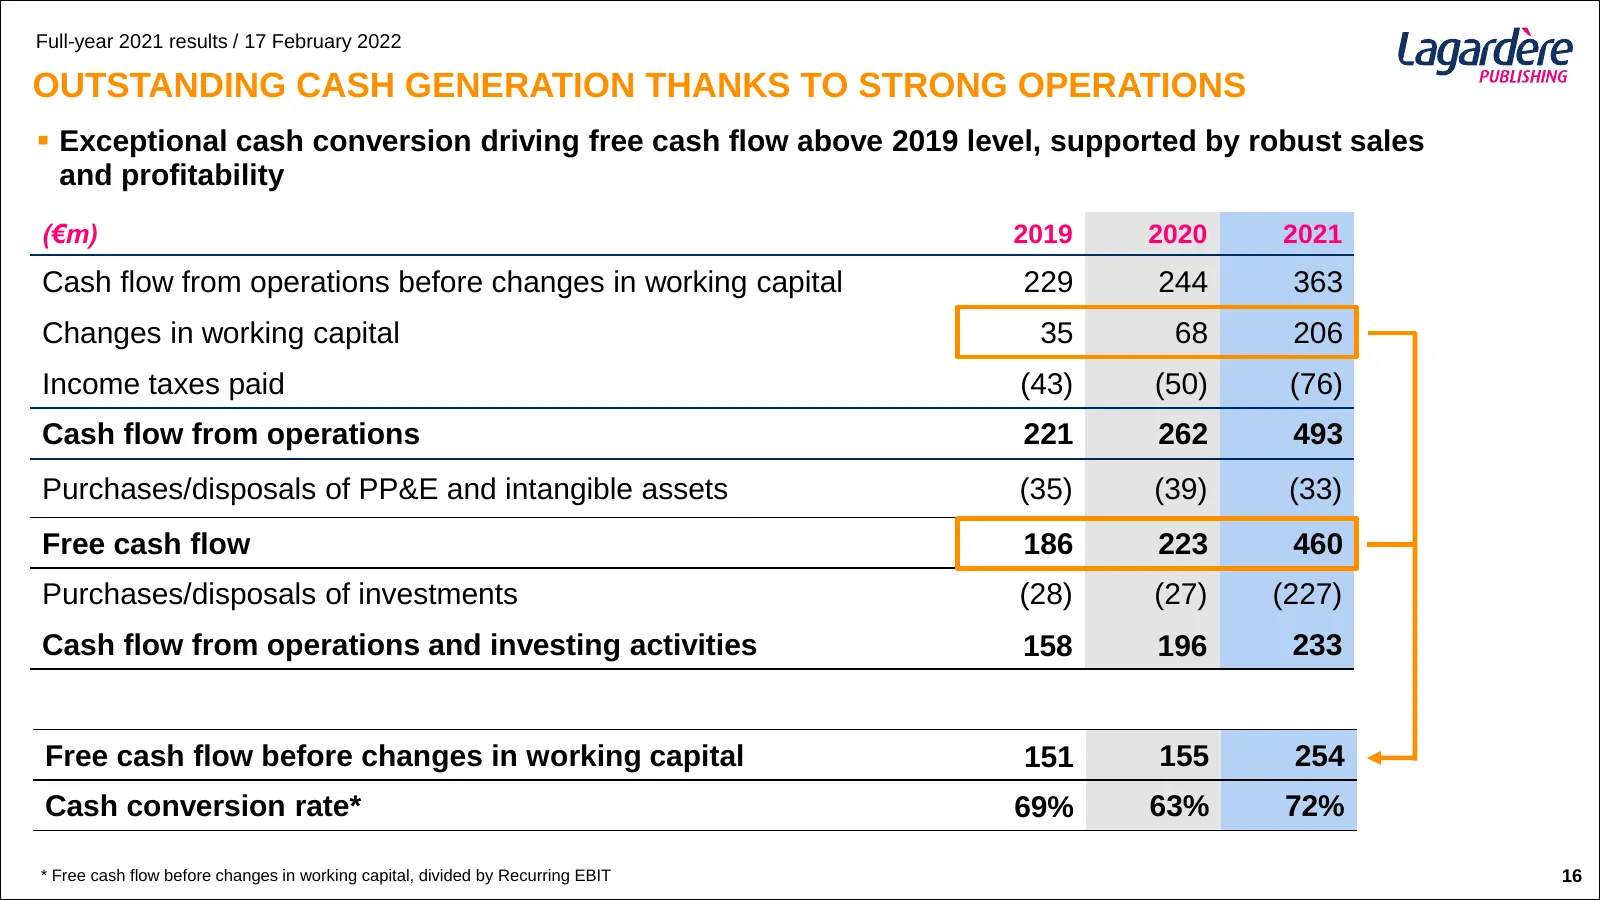
Full-year 2021 results / 17 February 2022 OUTSTANDING CASH GENERATION THANKS TO STRONG OPERATIONS ▪ Exceptional cash conversion driving free cash flow above 2019 level, supported by robust sales and profitability (€m) 2019 2020 2021 Cash flow from operations before changes in working capital 229 244
Slide 17: 2021 Performance
Full-year 2021 results / 17 February 2022 2021 PERFORMANCE
Slide 18: Sales Growth Outperforming Air Traffic Thanks to Domestic Travel
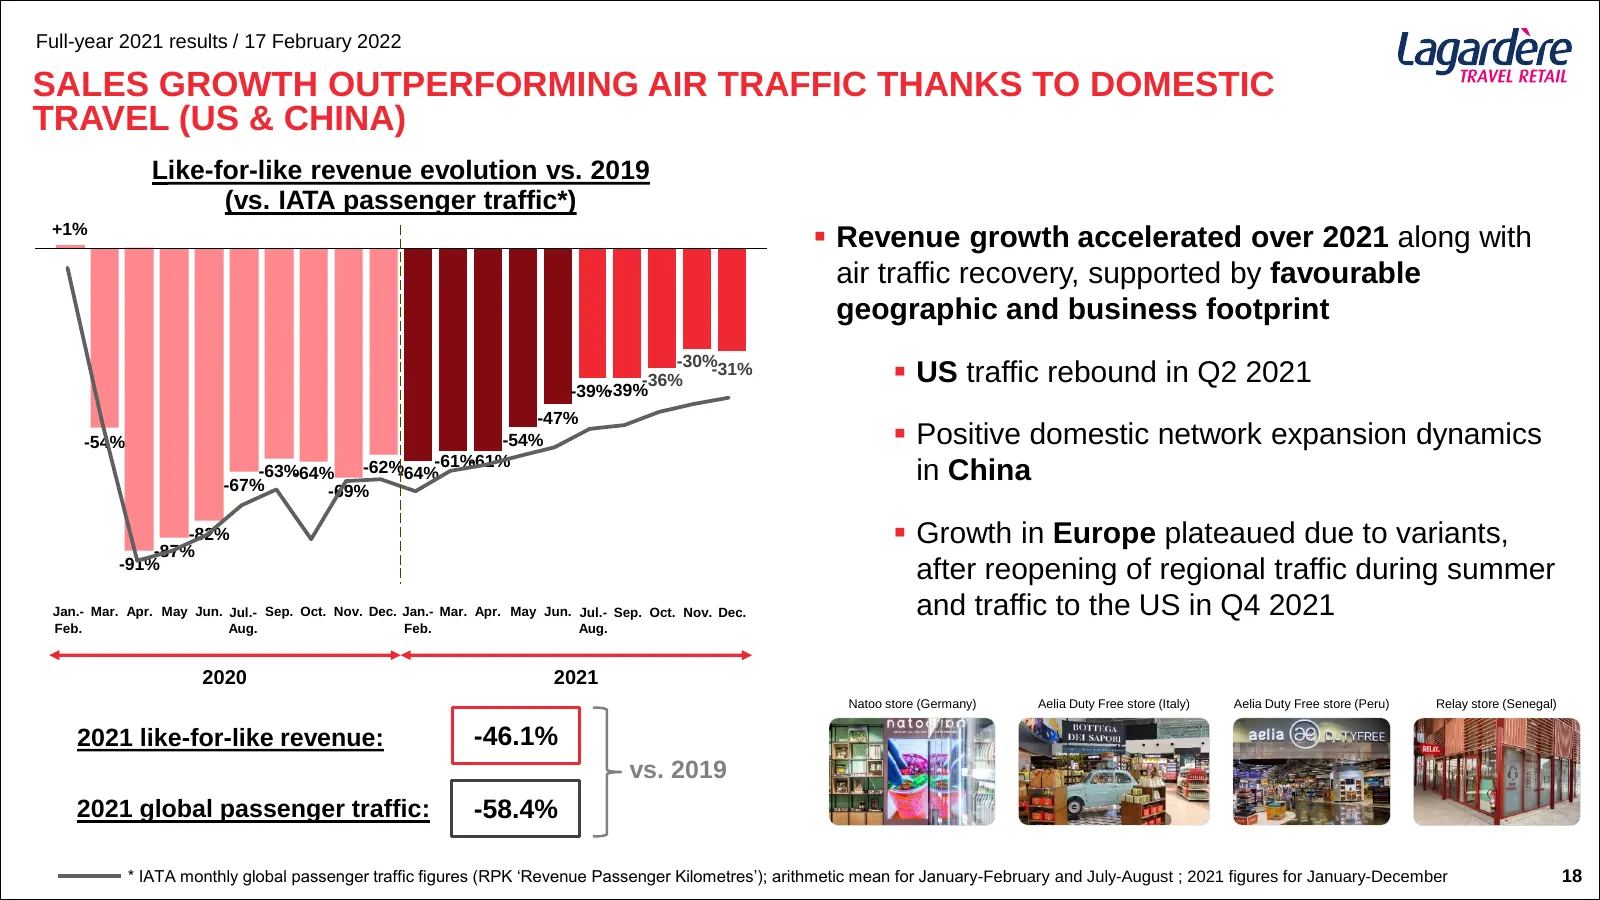
Full-year 2021 results / 17 February 2022 SALES GROWTH OUTPERFORMING AIR TRAFFIC THANKS TO DOMESTIC TRAVEL (US & CHINA) Like-for-like revenue evolution vs. 2019 (vs. IATA passenger traffic*) +1% ▪ Revenue growth accelerated over 2021 along with air traffic recovery, supported by favourable geographi
Slide 19: Geographic Footprint Rebalanced in Line with Traffic Recovery Trends
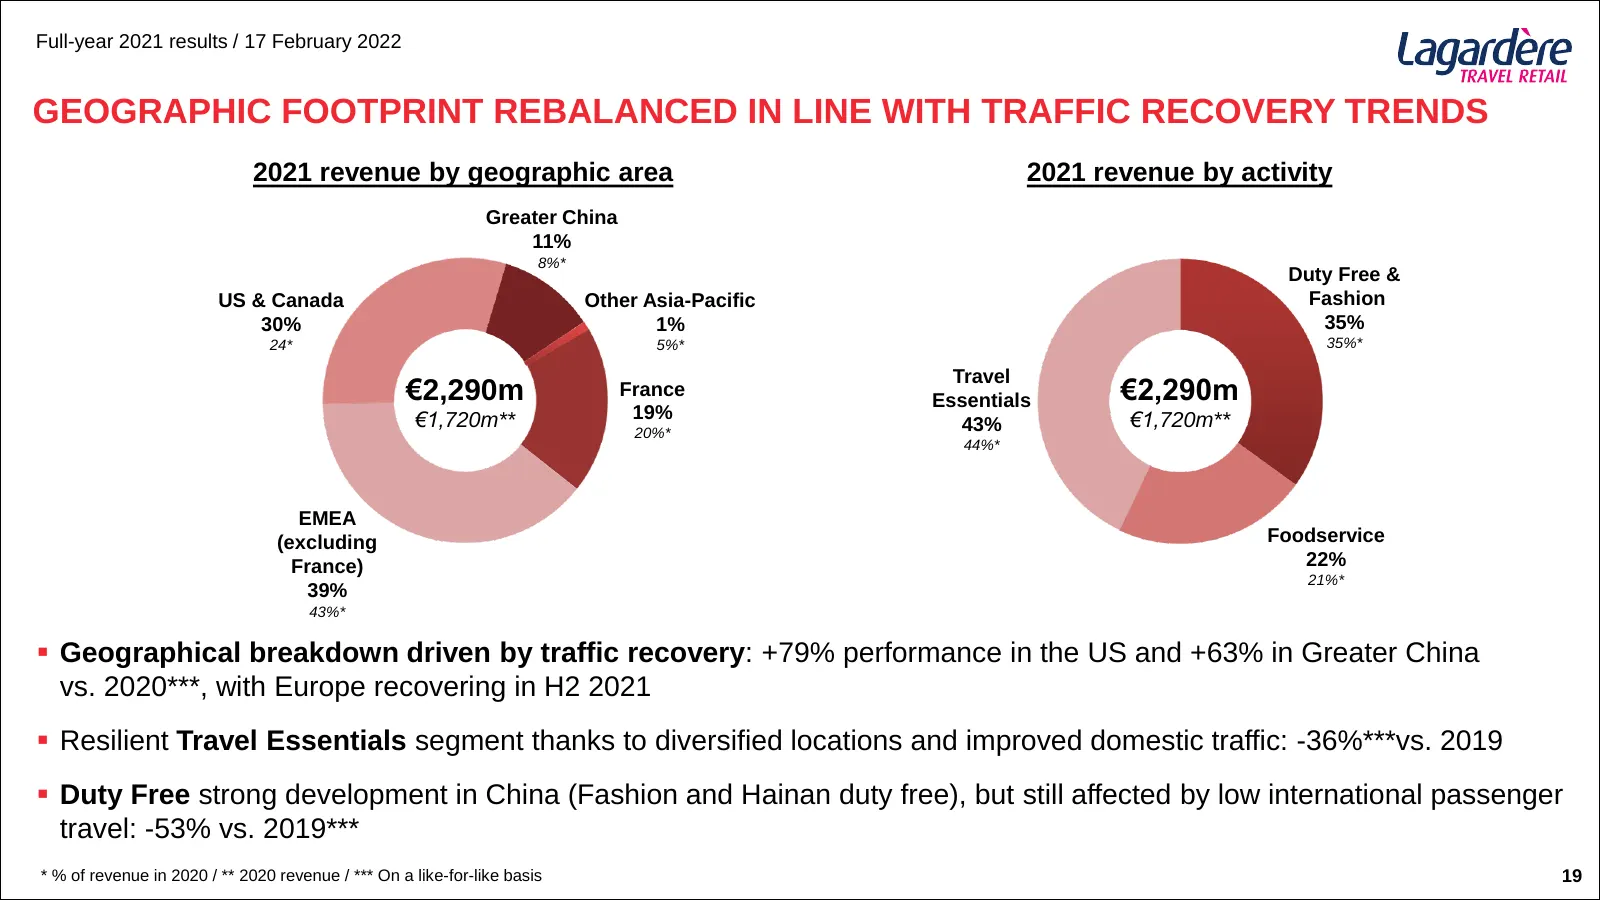
Full-year 2021 results / 17 February 2022 GEOGRAPHIC FOOTPRINT REBALANCED IN LINE WITH TRAFFIC RECOVERY TRENDS 2021 revenue by geographic area 2021 revenue by activity Greater China 11% 8%* Duty Free & US & Canada Other Asia-Pacific Fashion 30% 1% 35% 24* 5%* 35%* Travel €2,290m France Essentials €2
Slide 20: Focus on Lagardère Travel Retail's Expansion in North Asia
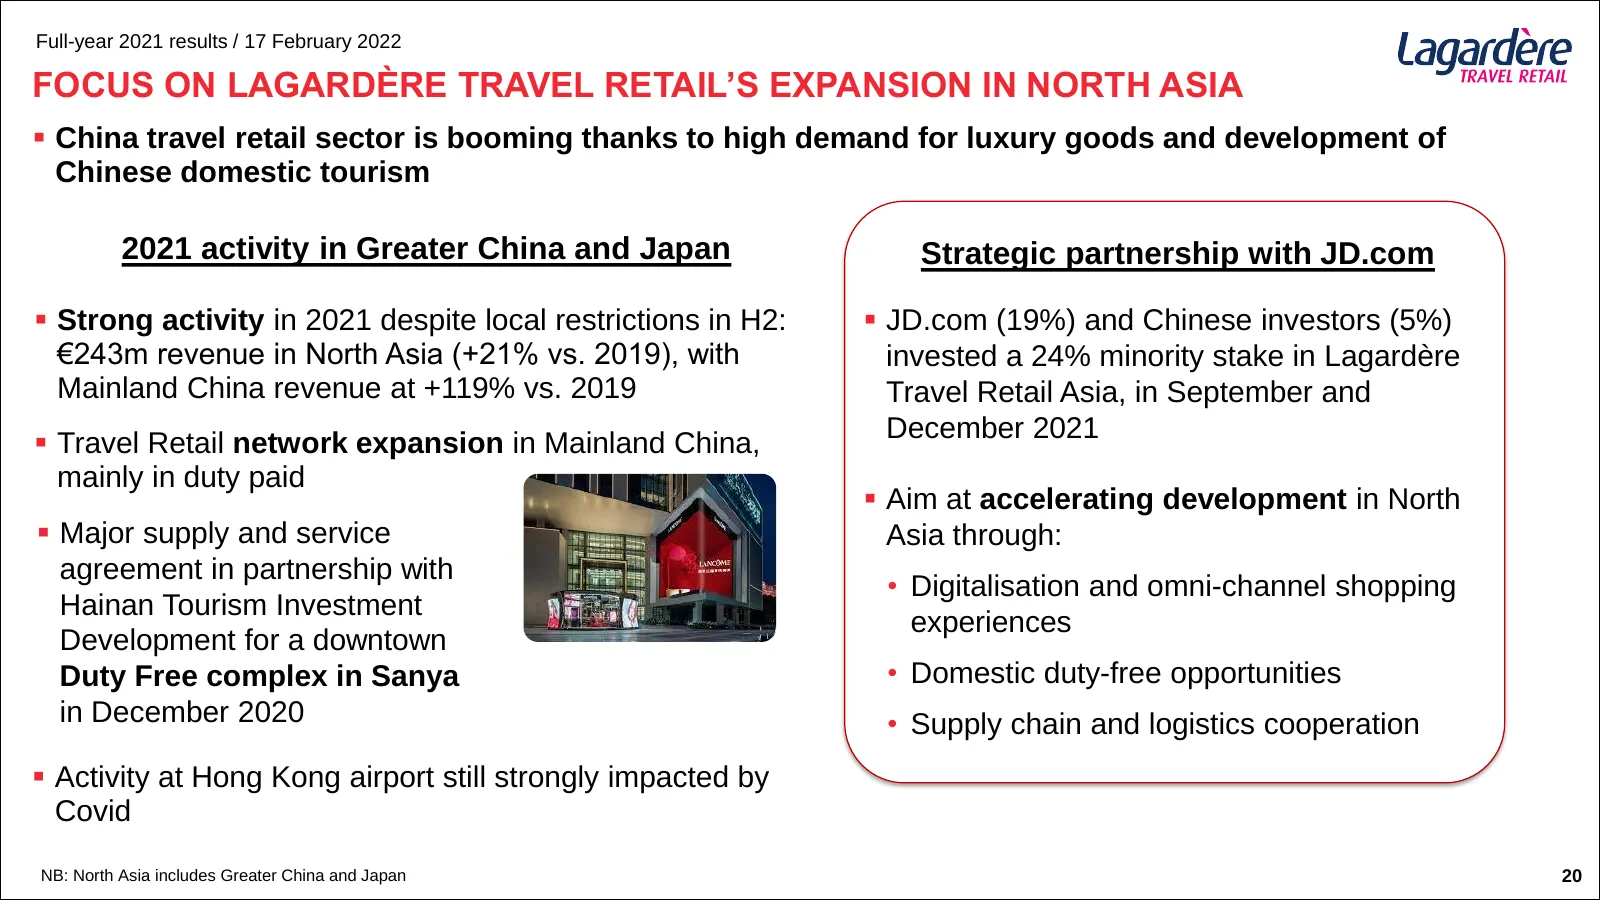
Full-year 2021 results / 17 February 2022 FOCUS ON LAGARDÈRE TRAVEL RETAIL’S EXPANSION IN NORTH ASIA ▪ China travel retail sector is booming thanks to high demand for luxury goods and development of Chinese domestic tourism 2021 activity in Greater China and Japan Strategic partnership with JD.com ▪
Slide 21: Efficient Cost Structure Ready for Accelerating Recovery
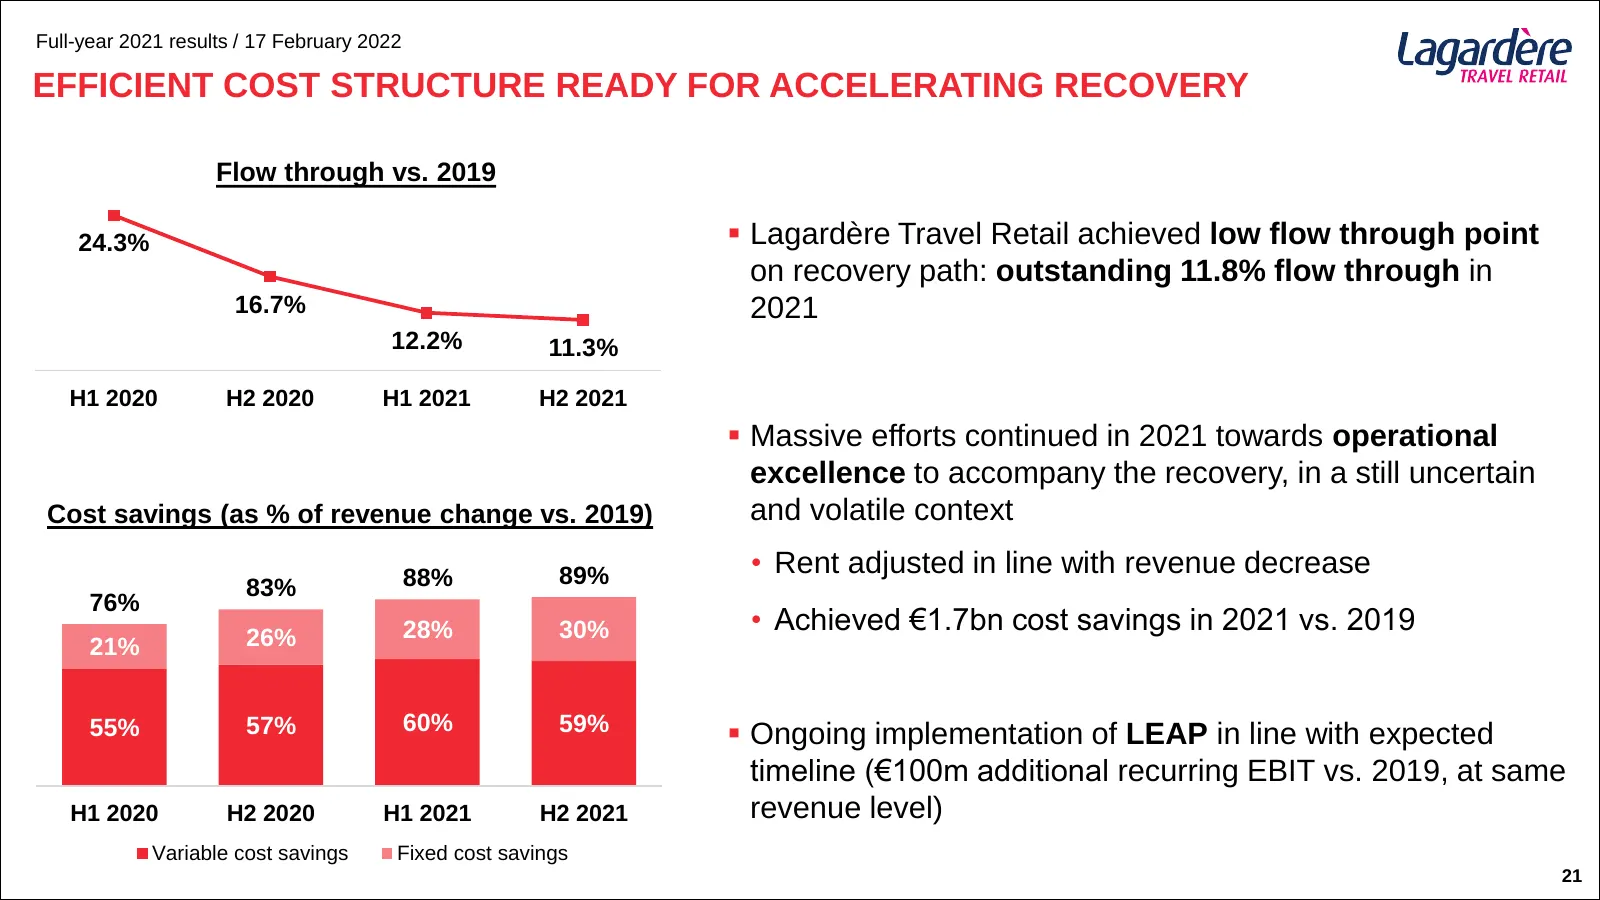
Full-year 2021 results / 17 February 2022 EFFICIENT COST STRUCTURE READY FOR ACCELERATING RECOVERY Flow through vs. 2019 24.3% ▪ Lagardère Travel Retail achieved low flow through point on recovery path: outstanding 11.8% flow through in 16.7% 2021 12.2% 11.3% H1 2020 H2 2020 H1 2021 H2 2021 ▪ Massiv
Slide 22: Significant Free Cash Flow Improvement Driven by Traffic Recovery
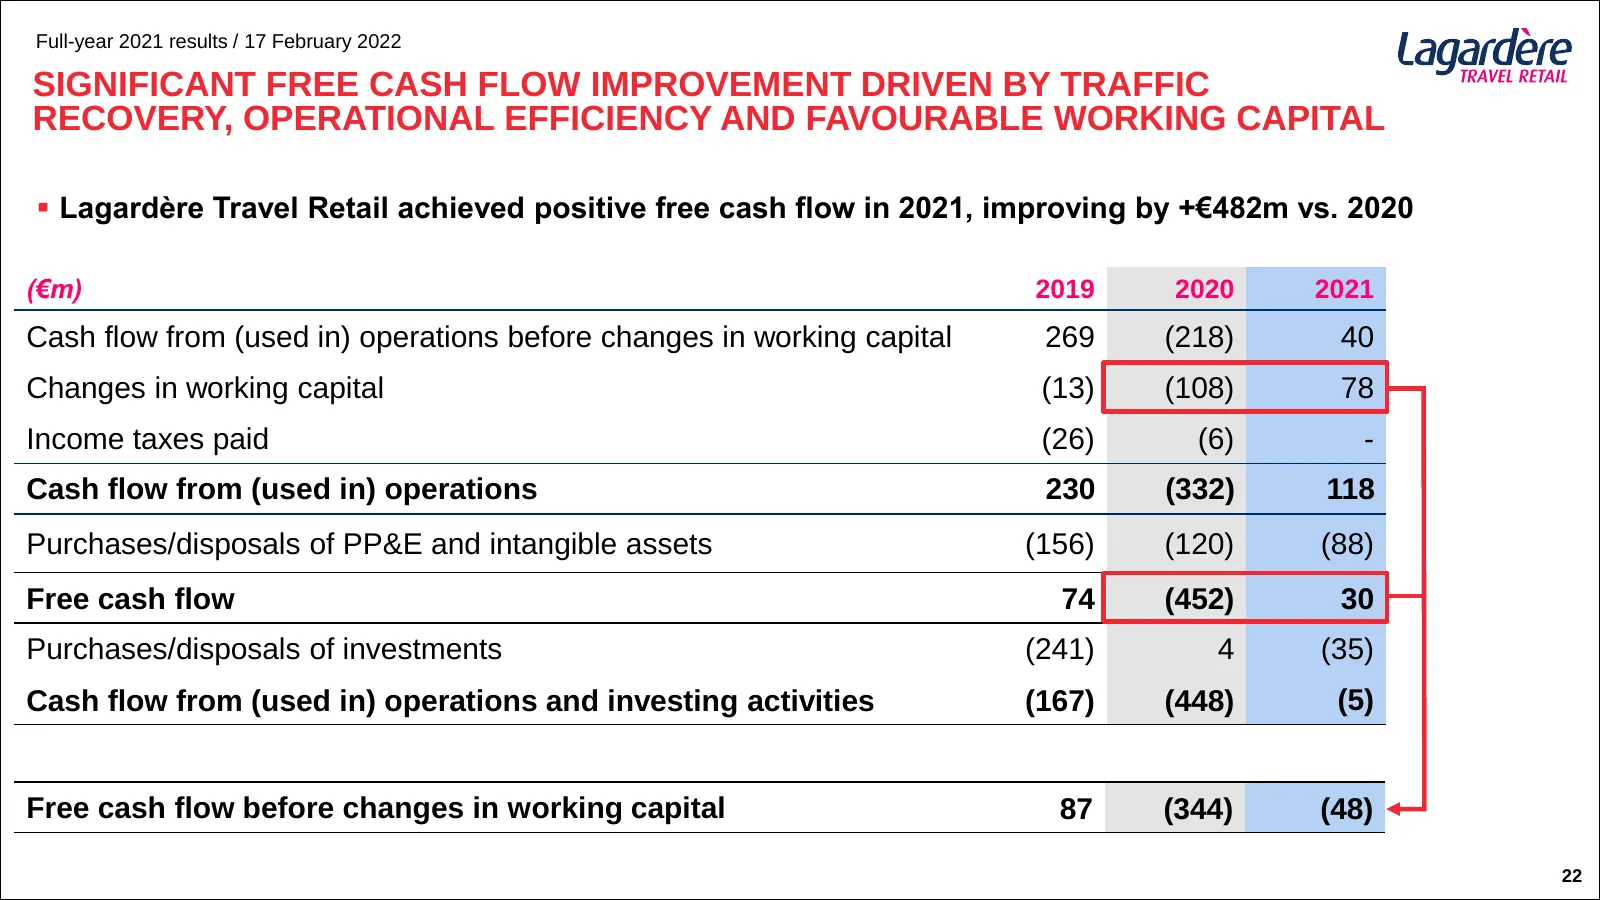
Full-year 2021 results / 17 February 2022 SIGNIFICANT FREE CASH FLOW IMPROVEMENT DRIVEN BY TRAFFIC RECOVERY, OPERATIONAL EFFICIENCY AND FAVOURABLE WORKING CAPITAL ▪ Lagardère Travel Retail achieved positive free cash flow in 2021, improving by +€482m vs. 2020 (€m) 2019 2020 2021 Cash flow from (used
Slide 23: Other Activities
Full-year 2021 results / 17 February 2022 OTHER ACTIVITIES
Slide 24: Other Activities Stable Performance and Cost Rationalisation
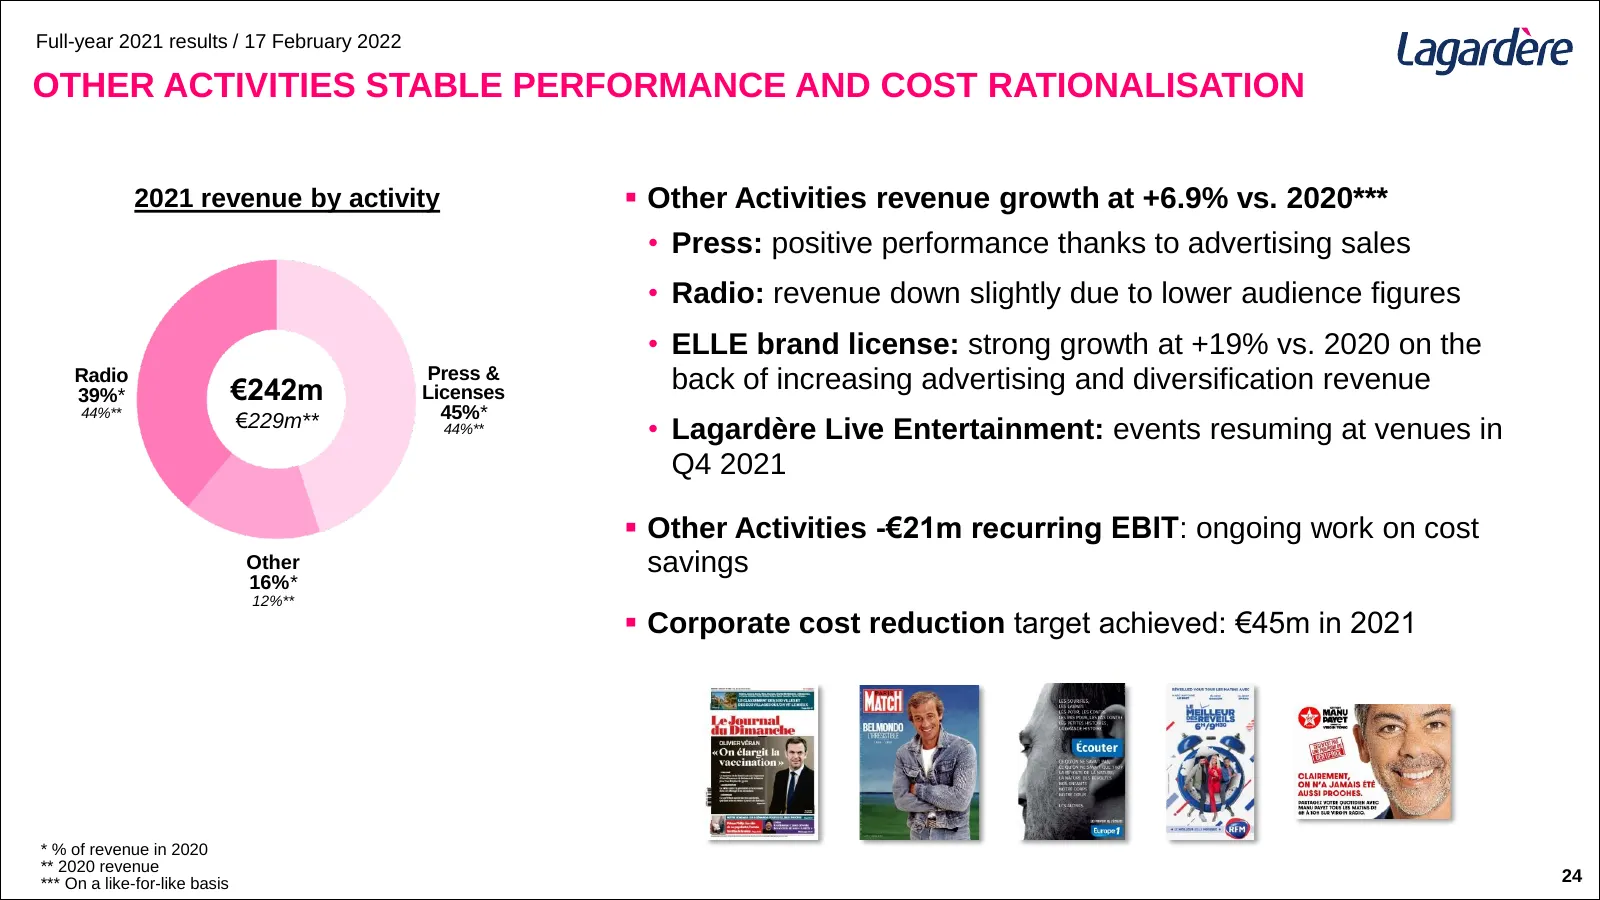
Full-year 2021 results / 17 February 2022 OTHER ACTIVITIES STABLE PERFORMANCE AND COST RATIONALISATION 2021 revenue by activity ▪ Other Activities revenue growth at +6.9% vs. 2020*** • Press: positive performance thanks to advertising sales • Radio: revenue down slightly due to lower audience figure
Slide 25: Group Results
Full-year 2021 results / 17 February 2022 GROUP RESULTS
Slide 26: 2021 Consolidated Income Statement
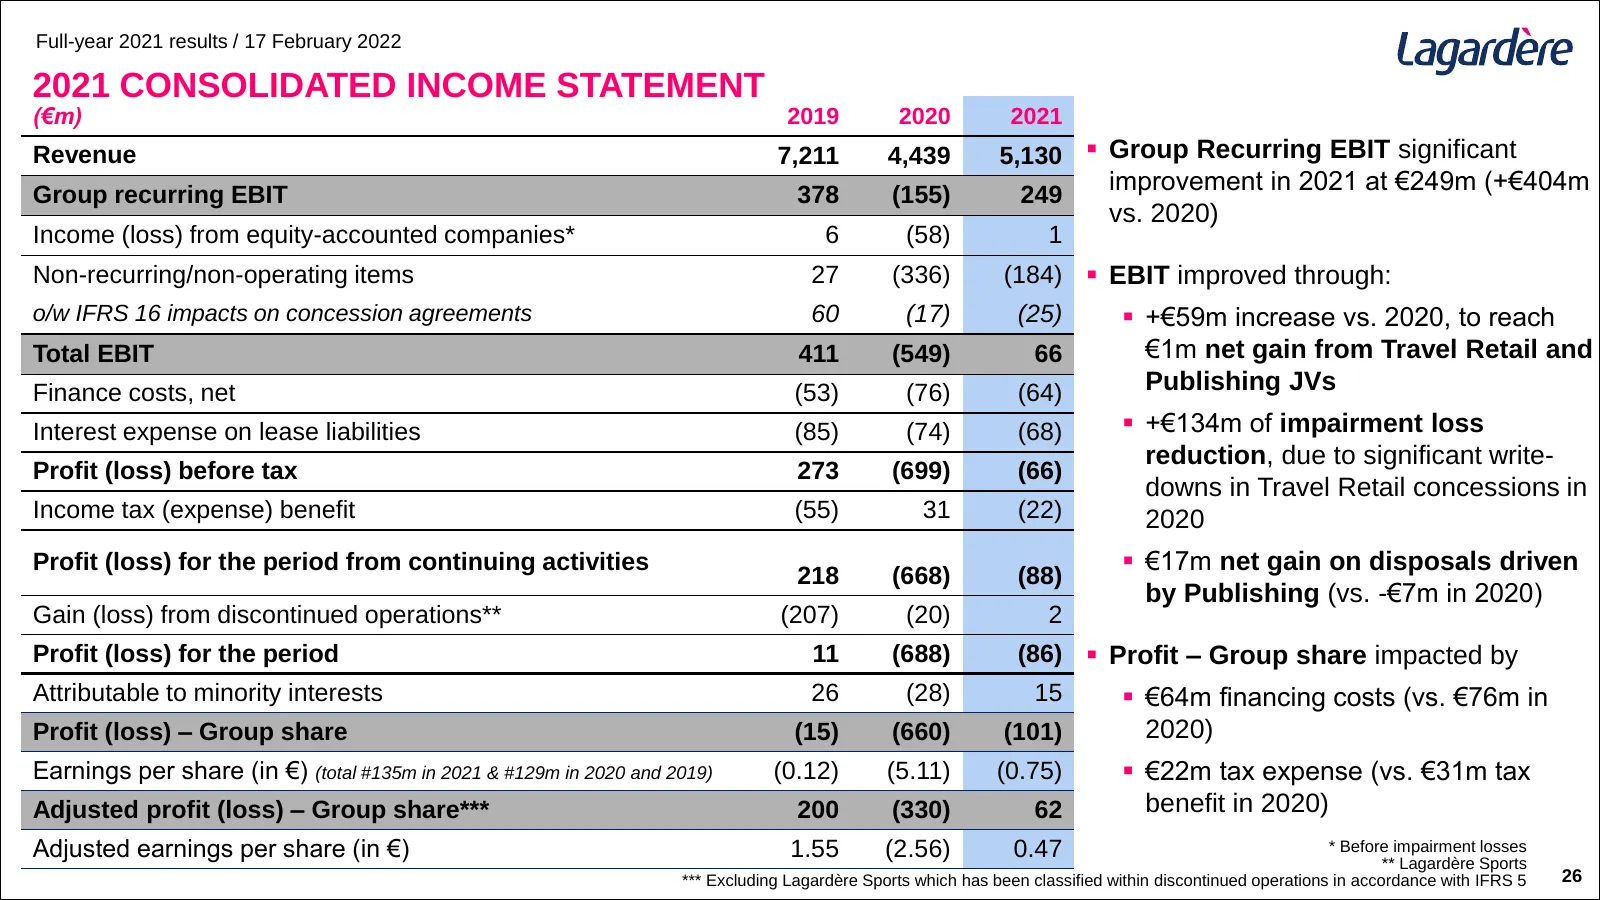
Full-year 2021 results / 17 February 2022 2021 CONSOLIDATED INCOME STATEMENT (€m) 2019 2020 2021 Revenue 7,211 4,439 5,130 ▪ Group Recurring EBIT significant Group recurring EBIT improvement in 2021 at €249m (+€404m 378 (155) 249 vs. 2020) Income (loss) from equity-accounted companies* 6 (58) 1 Non-
Slide 27: 2021 Consolidated Statement of Cash Flows
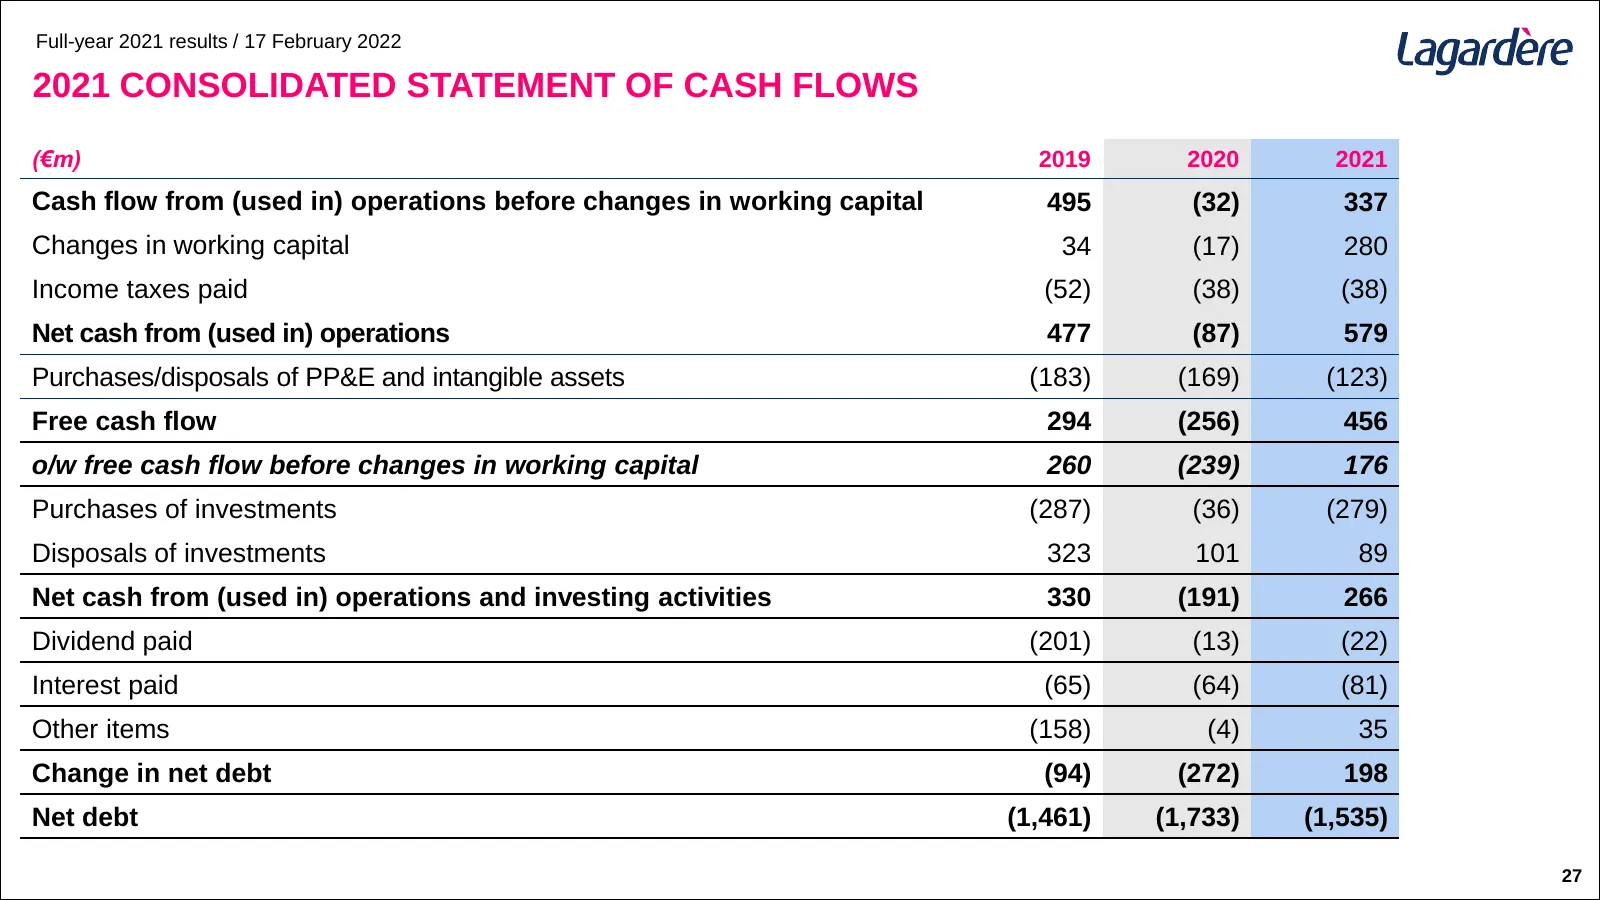
Full-year 2021 results / 17 February 2022 2021 CONSOLIDATED STATEMENT OF CASH FLOWS (€m) 2019 2020 2021 Cash flow from (used in) operations before changes in working capital 495 (32) 337 Changes in working capital 34 (17) 280 Income taxes paid (52) (38) (38) Net cash from (used in) operations 477 (8
Slide 28: Solid Liquidity with €2.0bn Available as of 31 December 2021
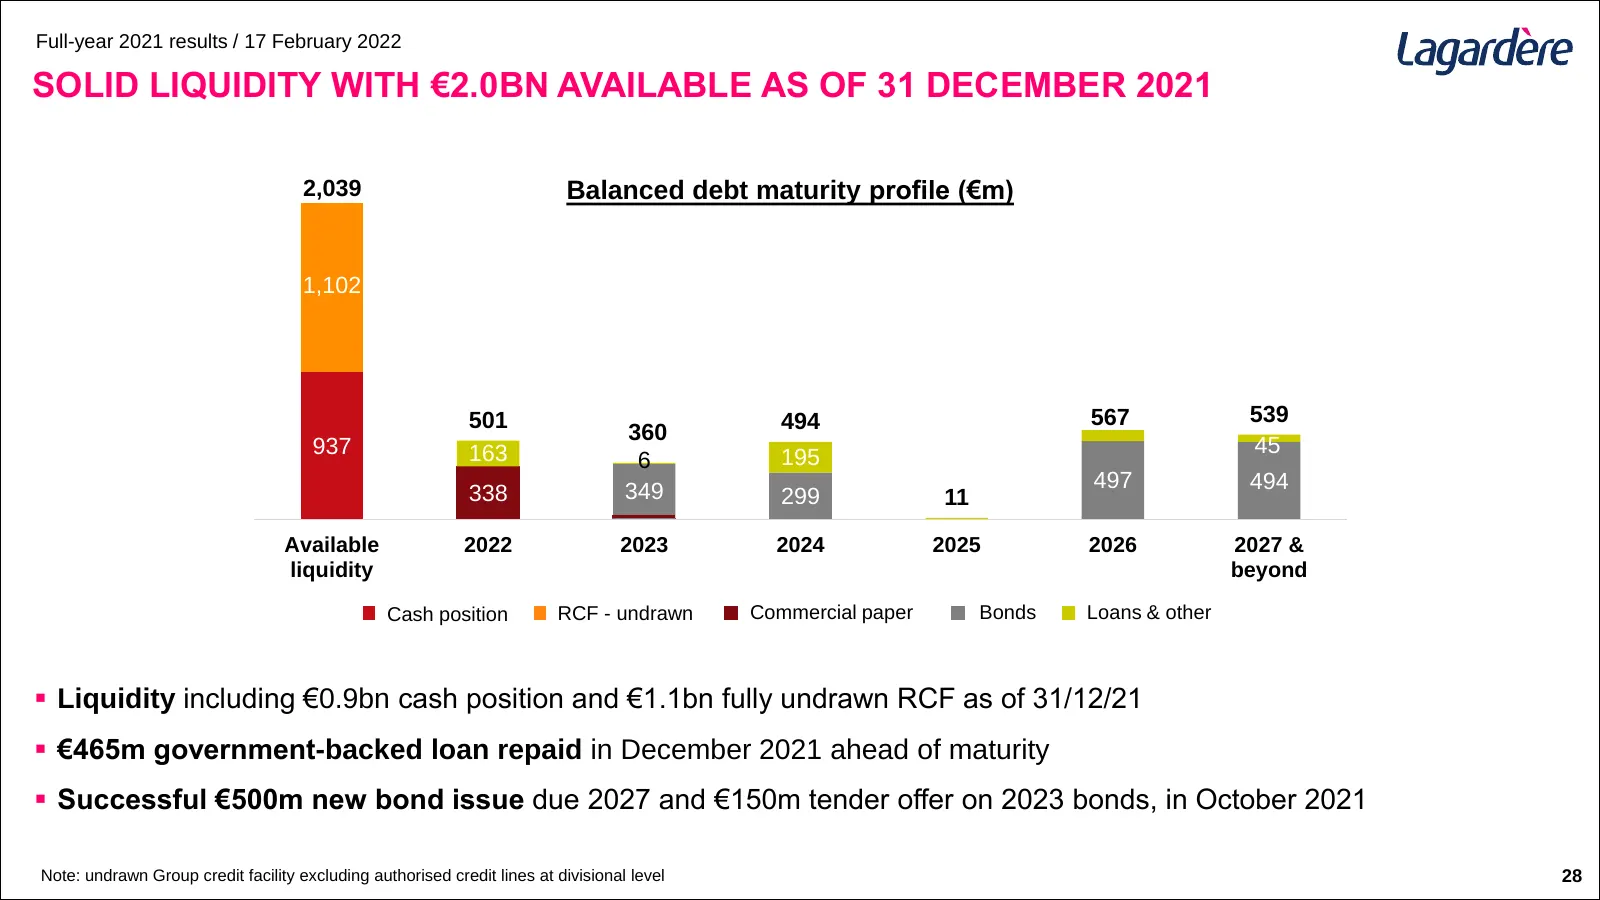
Full-year 2021 results / 17 February 2022 SOLID LIQUIDITY WITH €2.0BN AVAILABLE AS OF 31 DECEMBER 2021 2,039 Balanced debt maturity profile (€m) 1,102 501 494 567 539 360 937 163 45 6 195 349 497 494 338 299 11 Available 2022 2023 2024 2025 2026 2027 & liquidity beyond Cash position RCF - undrawn Co
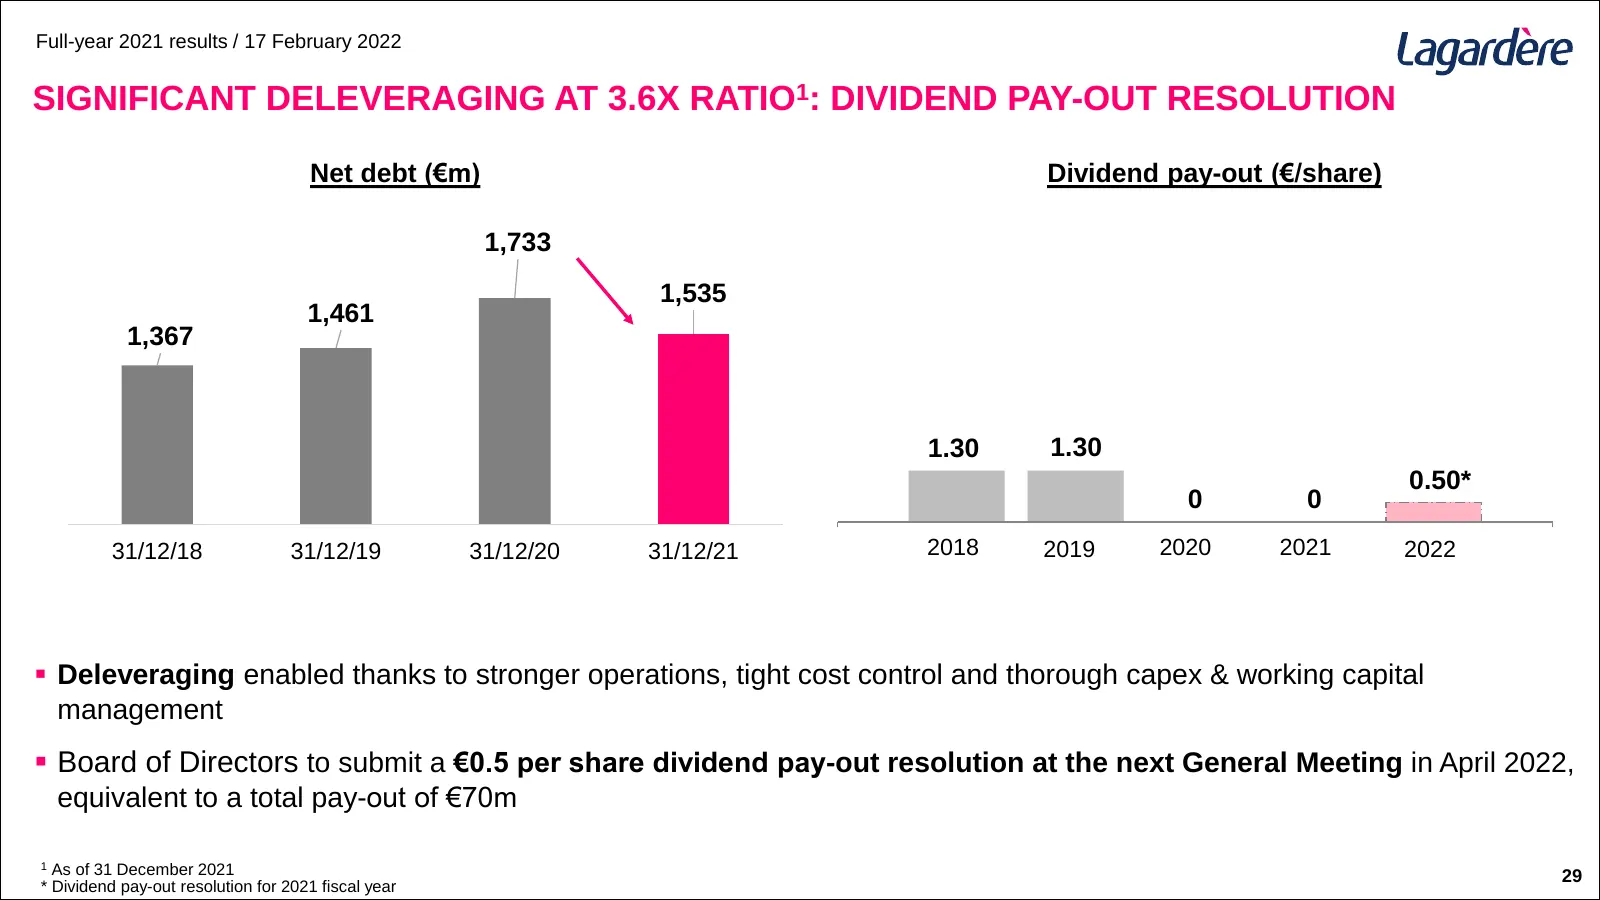
Slide 29: Significant Deleveraging at 3.6x Ratio: Dividend Pay-out Resolution
Full-year 2021 results / 17 February 2022 SIGNIFICANT DELEVERAGING AT 3.6X RATIO1: DIVIDEND PAY-OUT RESOLUTION Net debt (€m) Dividend pay-out (€/share) 1,733 1,535 1,461 1,367 1.30 1.30 0.50* 0 0 31/12/18 31/12/19 31/12/20 31/12/21 2018 2019 2020 2021 2022 ▪ Deleveraging enabled thanks to stronger o
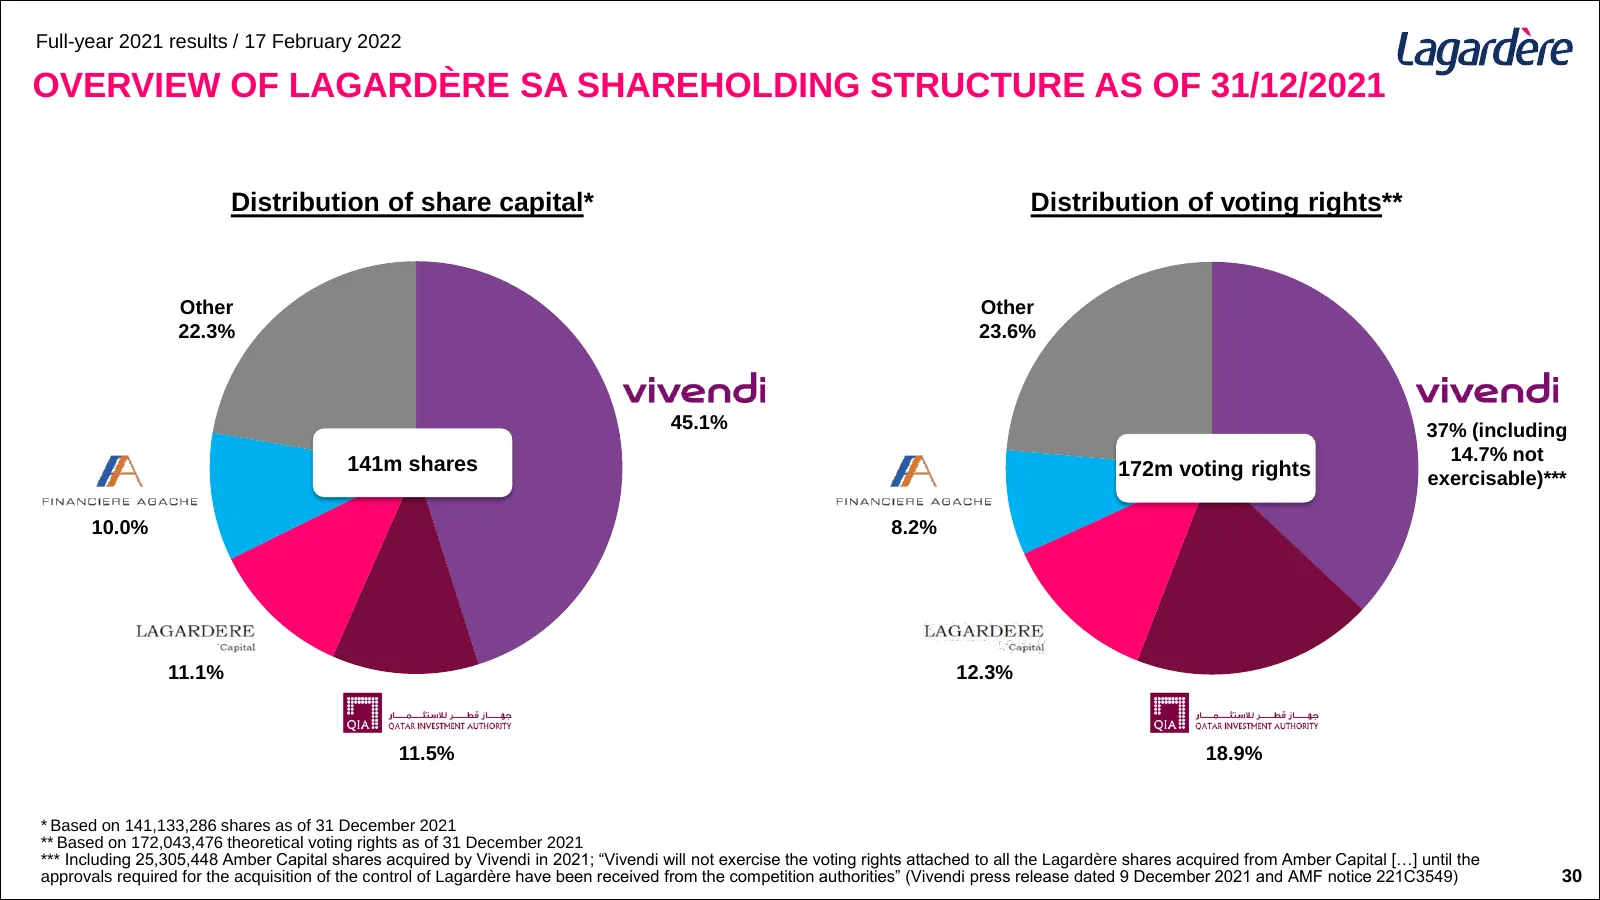
Slide 30: Overview of Lagardère SA Shareholding Structure as of 31/12/2021
Full-year 2021 results / 17 February 2022 OVERVIEW OF LAGARDÈRE SA SHAREHOLDING STRUCTURE AS OF 31/12/2021 Distribution of share capital* Distribution of voting rights** Other Other 22.3% 23.6% 45.1% 37% (including 141m shares 14.7% not 172m voting rights exercisable)*** 10.0% 8.2% 11.1% 12.3% 11.5%
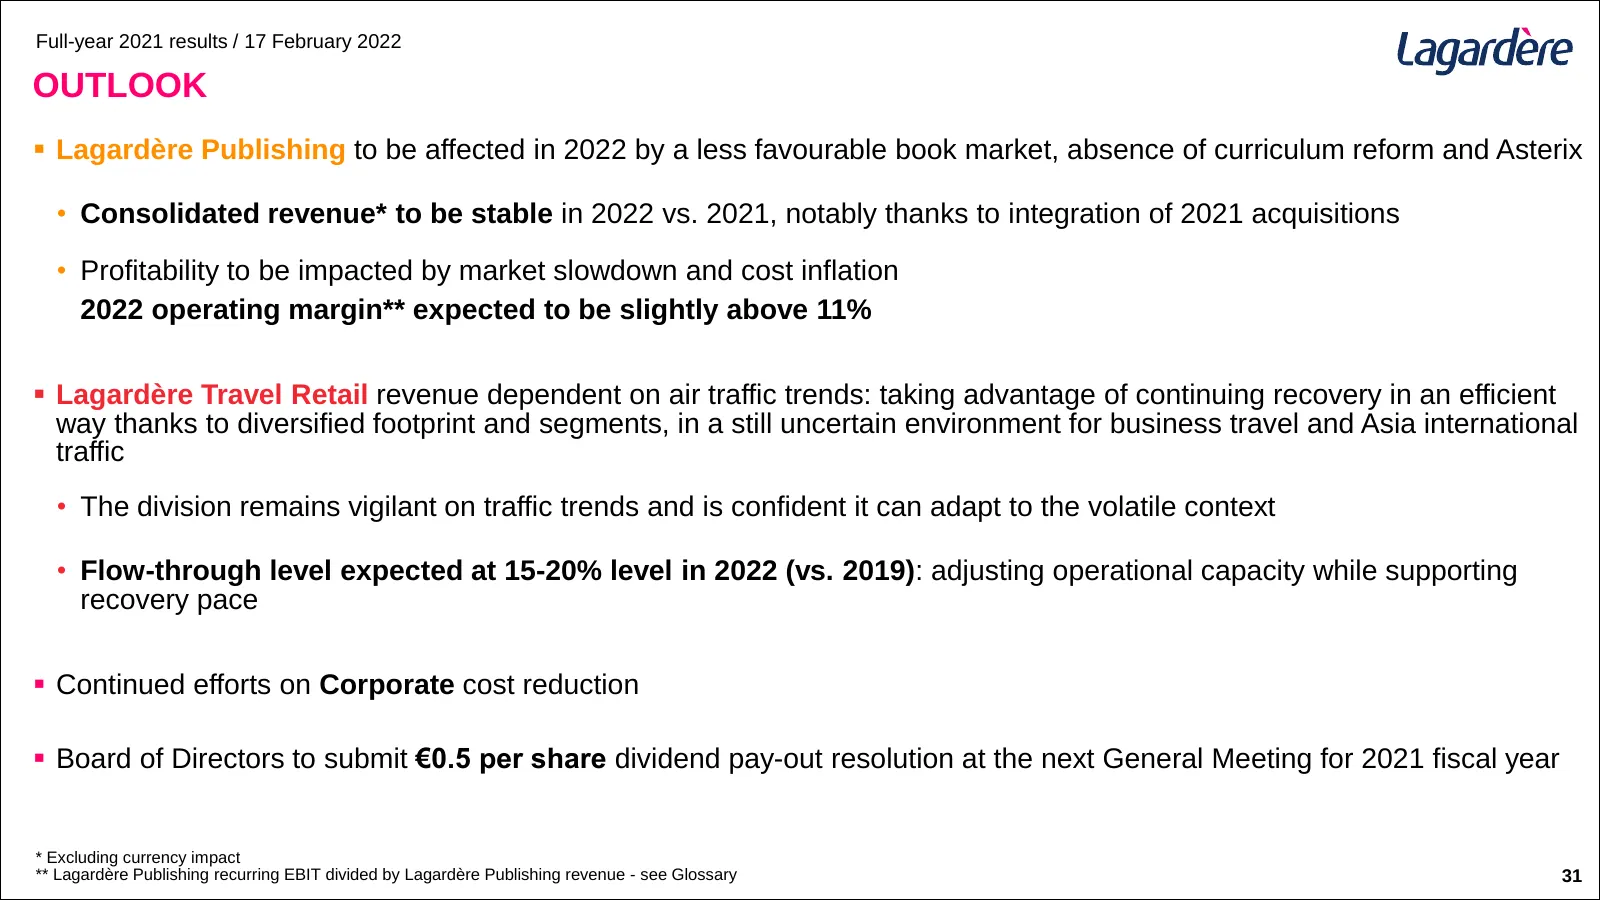
Slide 31: Outlook
Full-year 2021 results / 17 February 2022 OUTLOOK ▪ Lagardère Publishing to be affected in 2022 by a less favourable book market, absence of curriculum reform and Asterix • Consolidated revenue* to be stable in 2022 vs. 2021, notably thanks to integration of 2021 acquisitions • Profitability to be i
Slide 32: Appendices to the Consolidated Financial Statements
Full-year 2021 results / 17 February 2022 APPENDICES TO THE CONSOLIDATED FINANCIAL STATEMENTS
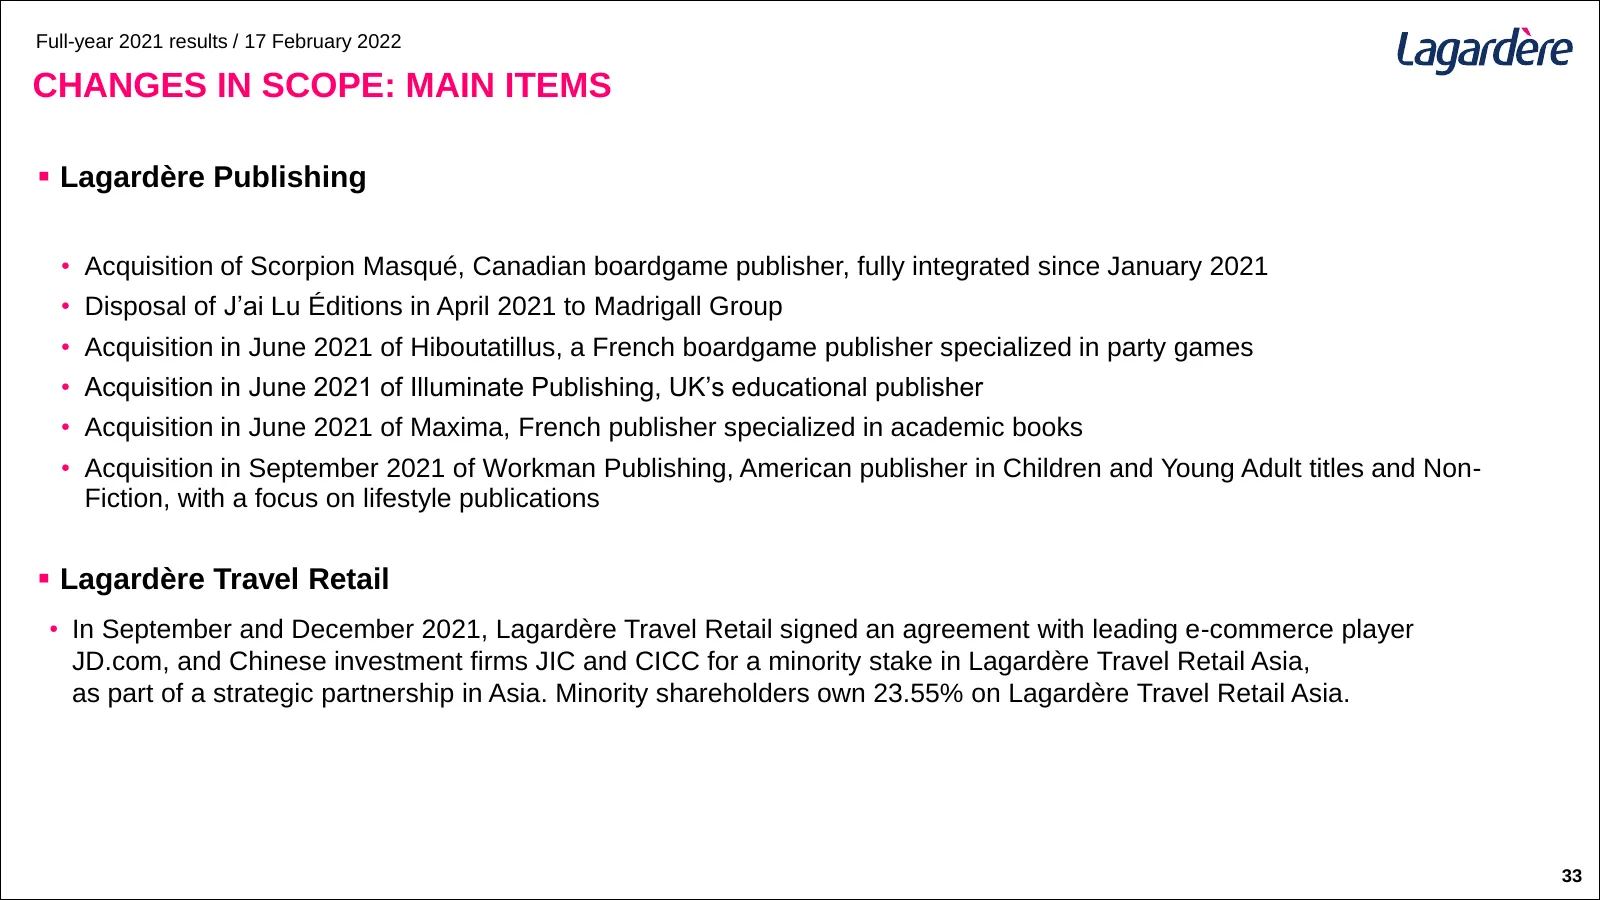
Slide 33: Changes in Scope: Main Items
Full-year 2021 results / 17 February 2022 CHANGES IN SCOPE: MAIN ITEMS ▪ Lagardère Publishing • Acquisition of Scorpion Masqué, Canadian boardgame publisher, fully integrated since January 2021 • Disposal of J’ai Lu Éditions in April 2021 to Madrigall Group • Acquisition in June 2021 of Hiboutatillu
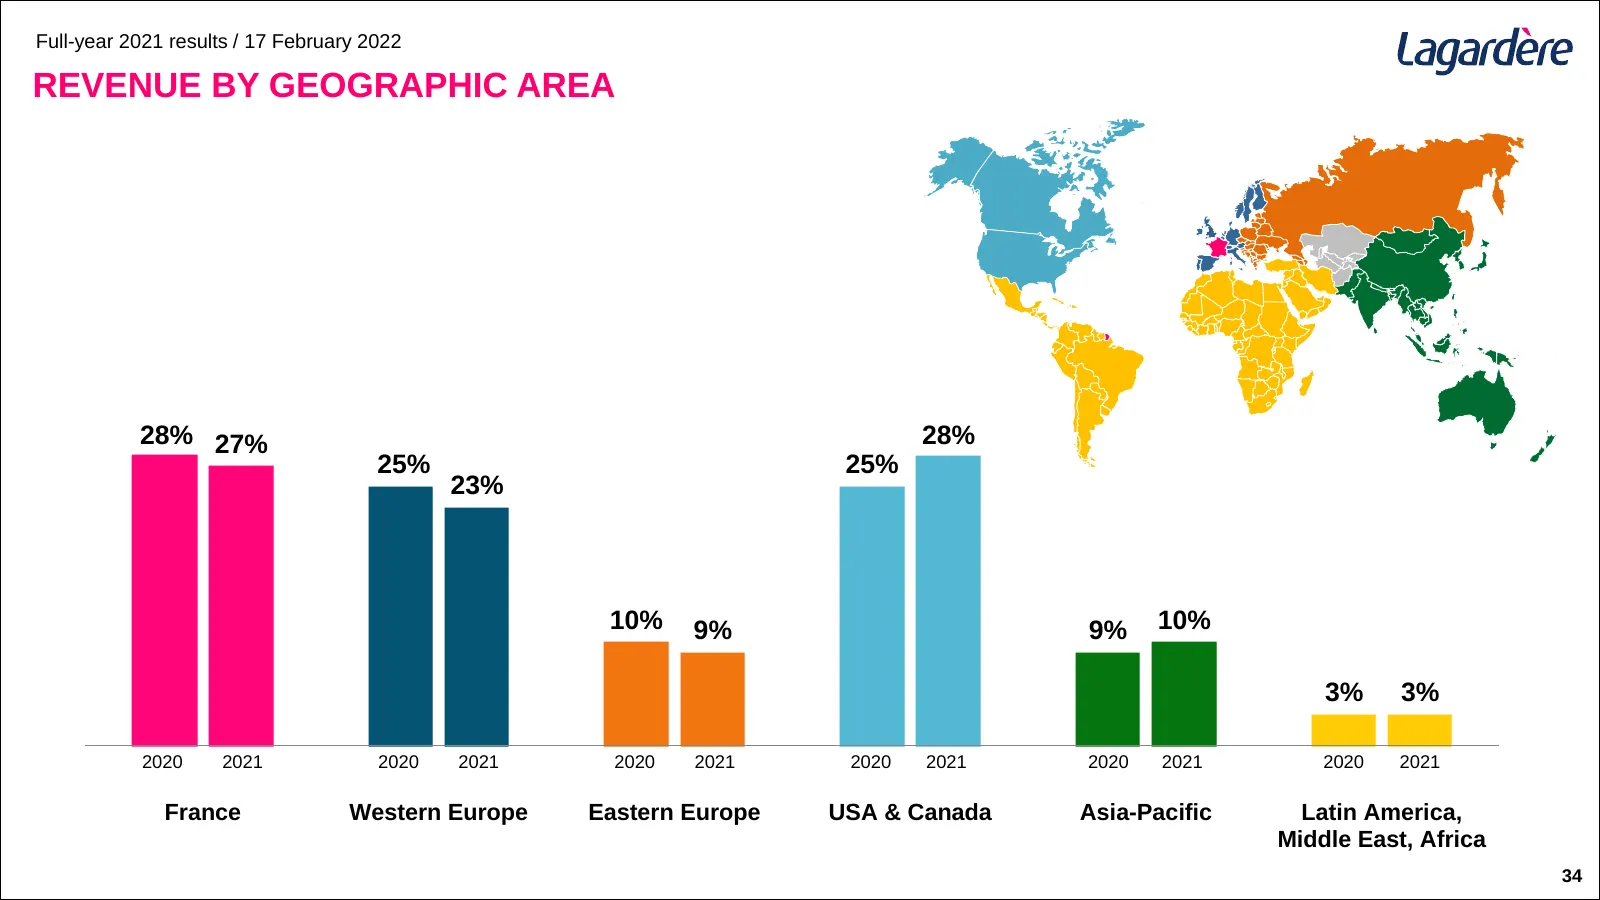
Slide 34: Revenue by Geographic Area
Full-year 2021 results / 17 February 2022 REVENUE BY GEOGRAPHIC AREA 28% 27% 28% 25% 25% 23% 10% 9% 9% 10% 3% 3% 2020 2021 2020 2021 2020 2021 2020 2021 2020 2021 2020 2021 France Western Europe Eastern Europe USA & Canada Asia-Pacific Latin America, Middle East, Africa 34
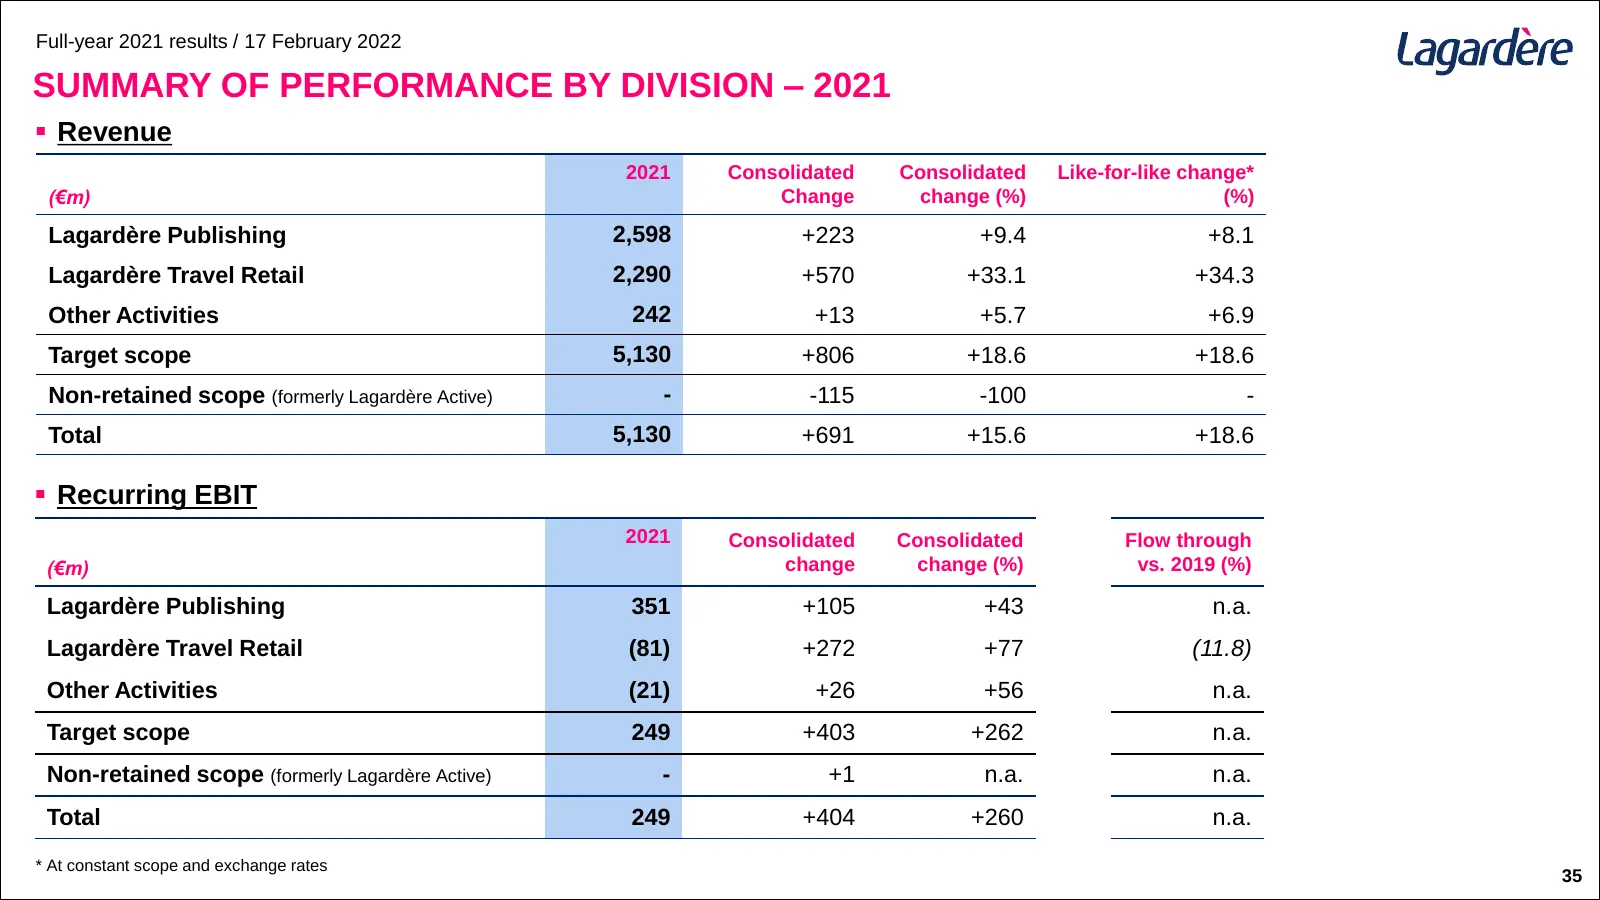
Slide 35: Summary of Performance by Division – 2021
Full-year 2021 results / 17 February 2022 SUMMARY OF PERFORMANCE BY DIVISION – 2021 ▪ Revenue 2021 Consolidated Consolidated Like-for-like change* (€m) Change change (%) (%) Lagardère Publishing 2,598 +223 +9.4 +8.1 Lagardère Travel Retail 2,290 +570 +33.1 +34.3 Other Activities 242 +13 +5.7 +6.9 Ta
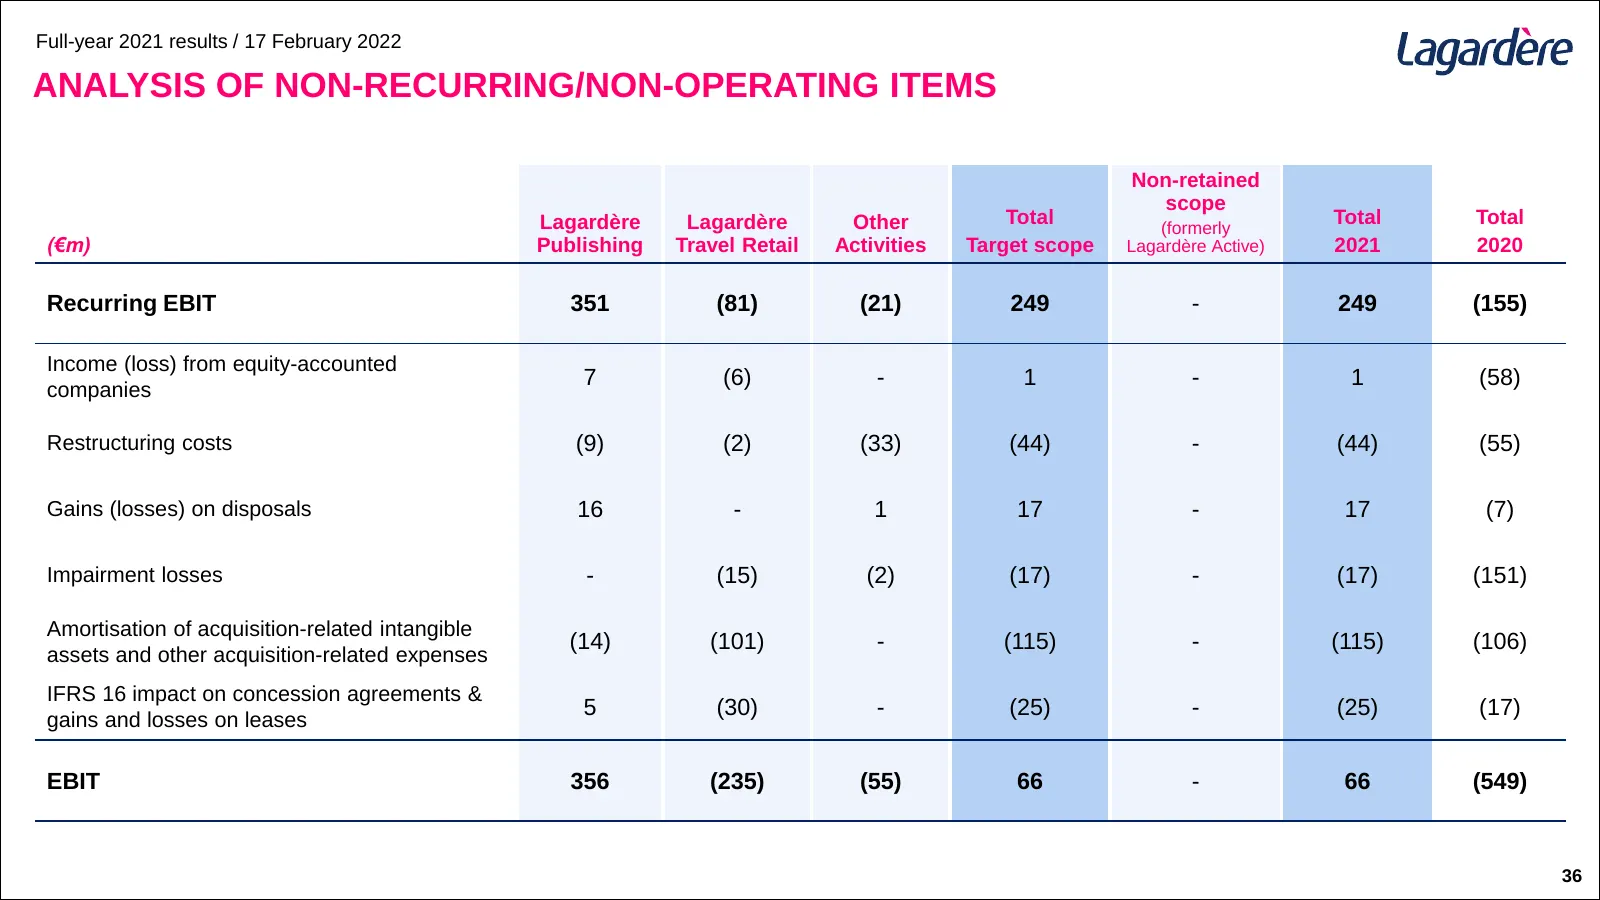
Slide 36: Analysis of Non-Recurring/Non-Operating Items
Full-year 2021 results / 17 February 2022 ANALYSIS OF NON-RECURRING/NON-OPERATING ITEMS Non-retained scope Lagardère Lagardère Other Total (formerly Total Total (€m) Publishing Travel Retail Activities Target scope Lagardère Active) 2021 2020 Recurring EBIT 351 (81) (21) 249 - 249 (155) Income (loss
Slide 37: Adjusted Profit – Group Share
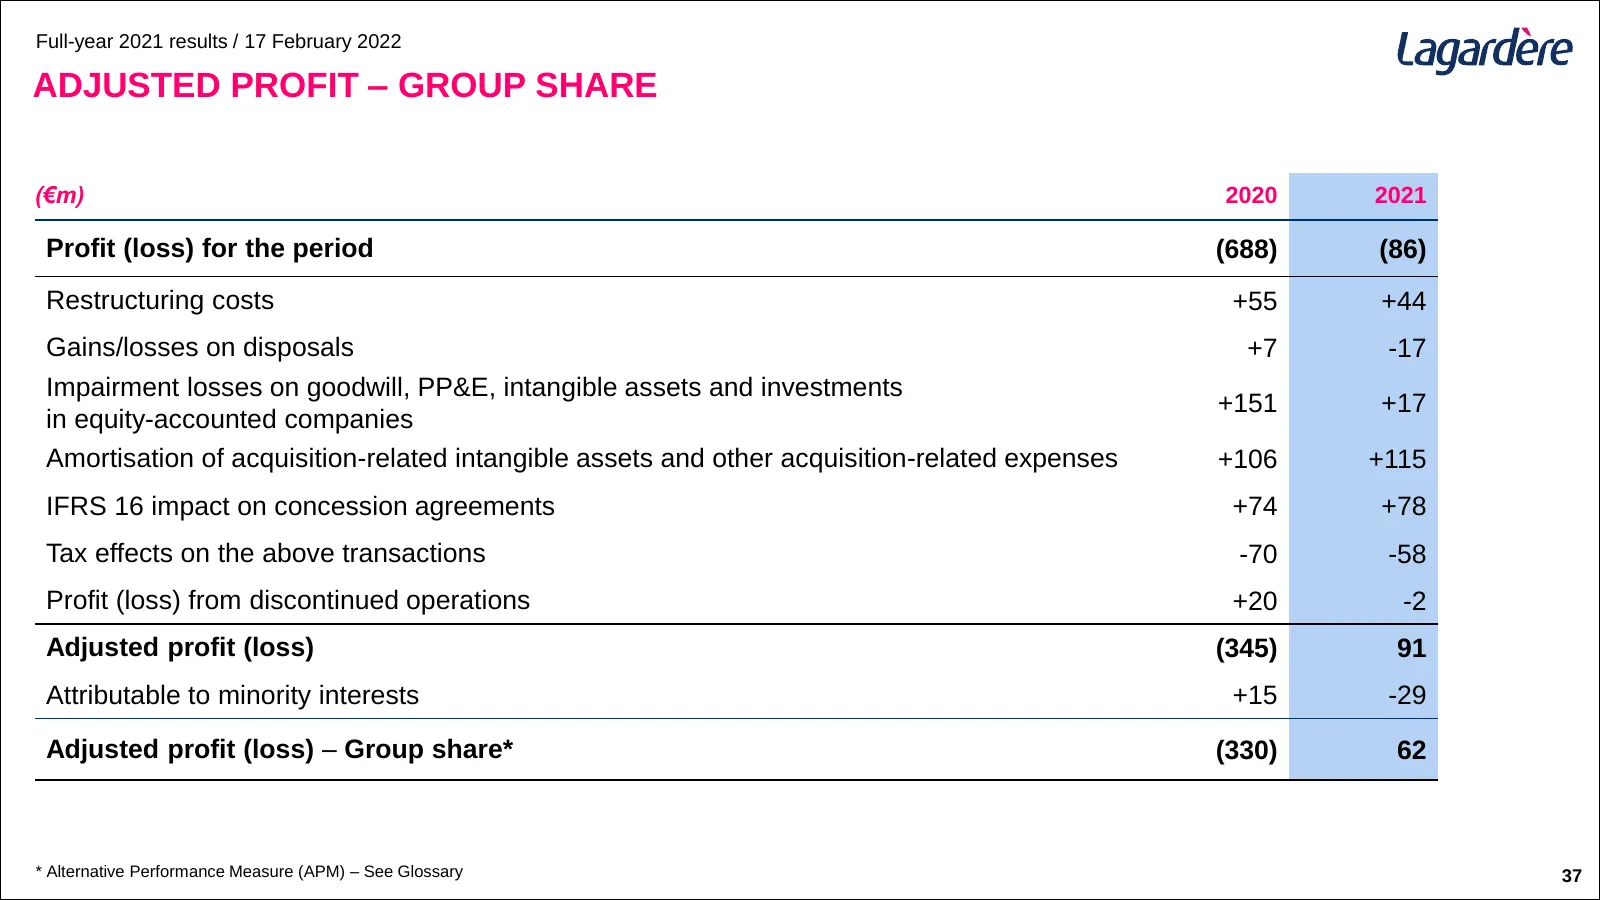
Full-year 2021 results / 17 February 2022 ADJUSTED PROFIT – GROUP SHARE (€m) 2020 2021 Profit (loss) for the period (688) (86) Restructuring costs +55 +44 Gains/losses on disposals +7 -17 Impairment losses on goodwill, PP&E, intangible assets and investments +151 +17 in equity-accounted companies Am
Slide 38: Group Recurring EBIT to Adjusted Profit (Loss) – Group Share
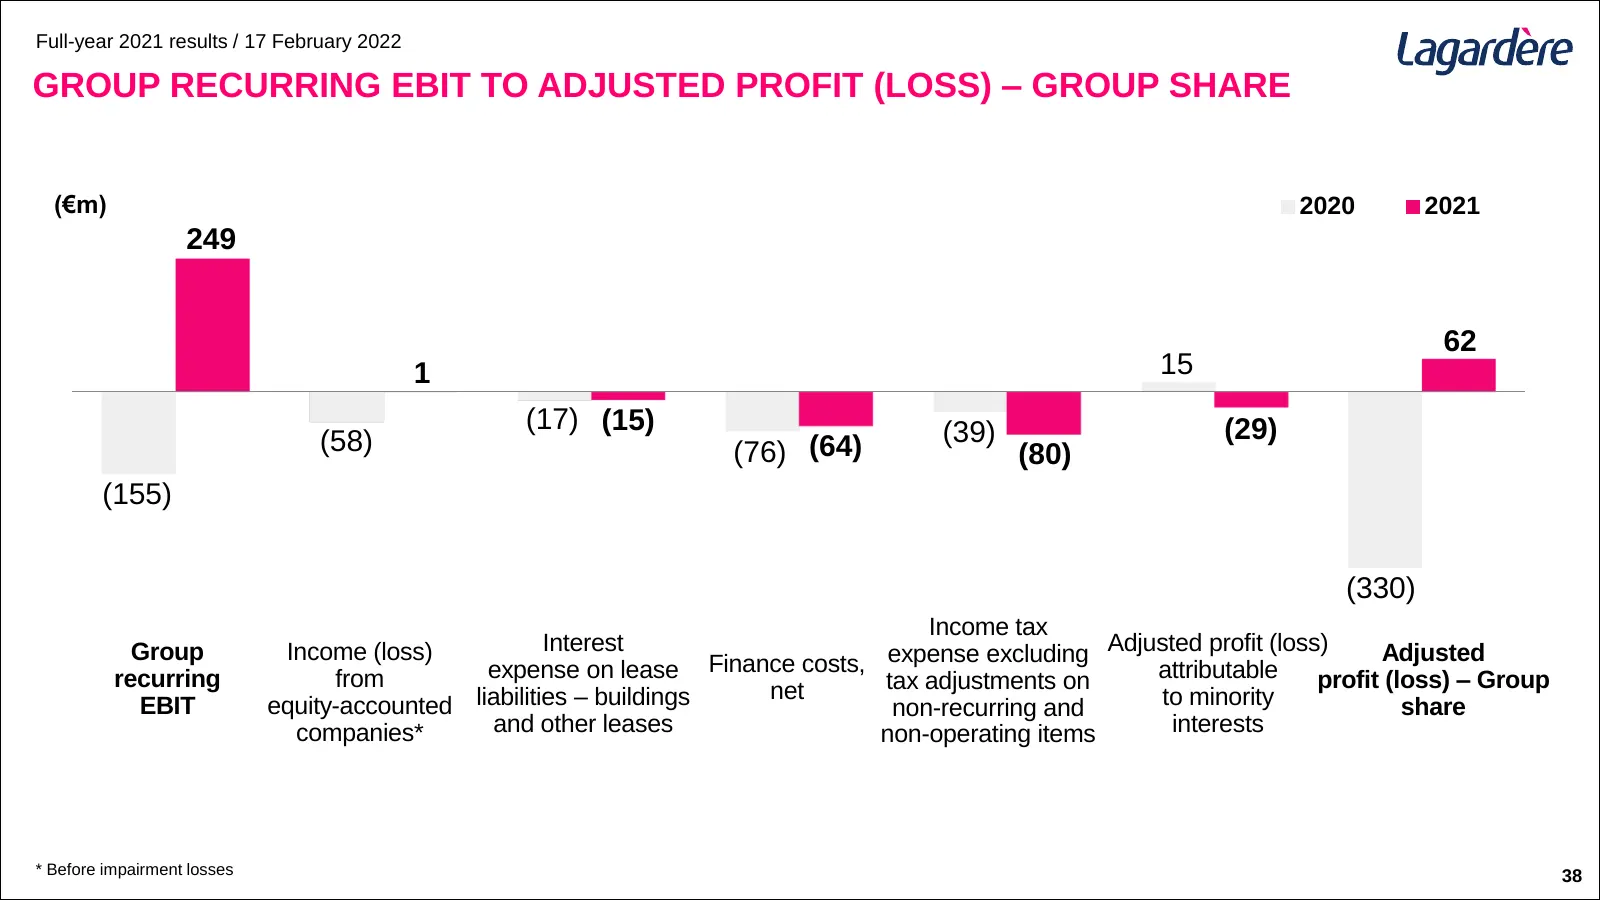
Full-year 2021 results / 17 February 2022 GROUP RECURRING EBIT TO ADJUSTED PROFIT (LOSS) – GROUP SHARE (€m) 2020 2021 249 62 1 15 (17) (15) (39) (29) (58) (76) (64) (80) (155) (330) Income tax Group Income (loss) Interest expense excluding Adjusted profit (loss) Adjusted expense on lease Finance cos
Slide 39: Free Cash Flow Reconciliation
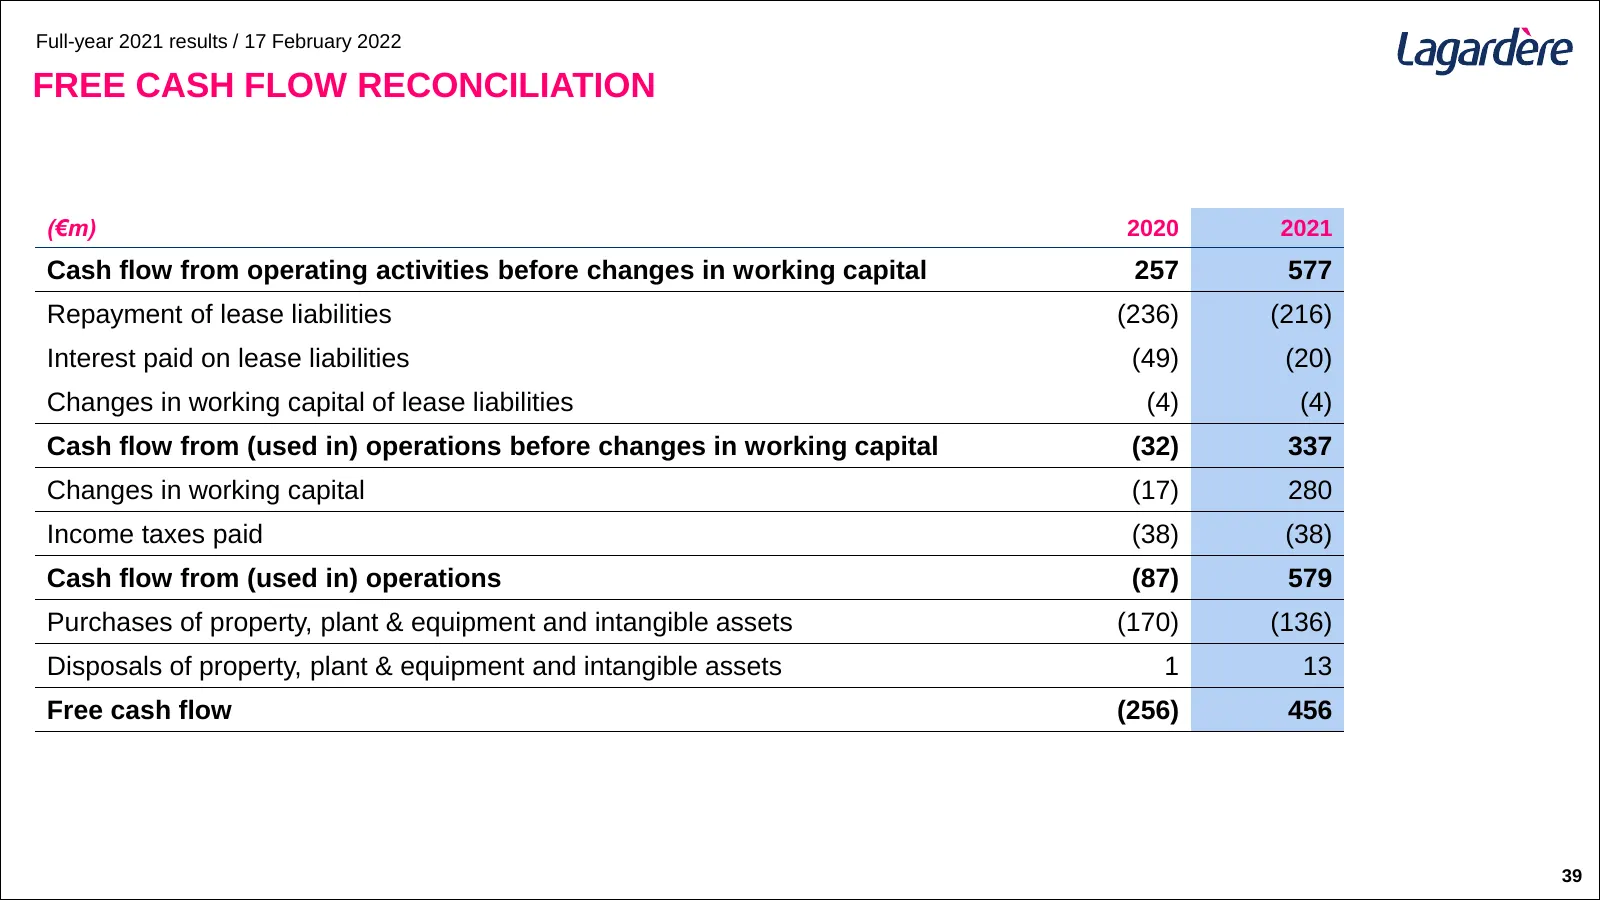
Full-year 2021 results / 17 February 2022 FREE CASH FLOW RECONCILIATION (€m) 2020 2021 Cash flow from operating activities before changes in working capital 257 577 Repayment of lease liabilities (236) (216) Interest paid on lease liabilities (49) (20) Changes in working capital of lease liabilities
Slide 40: Consolidated Balance Sheet
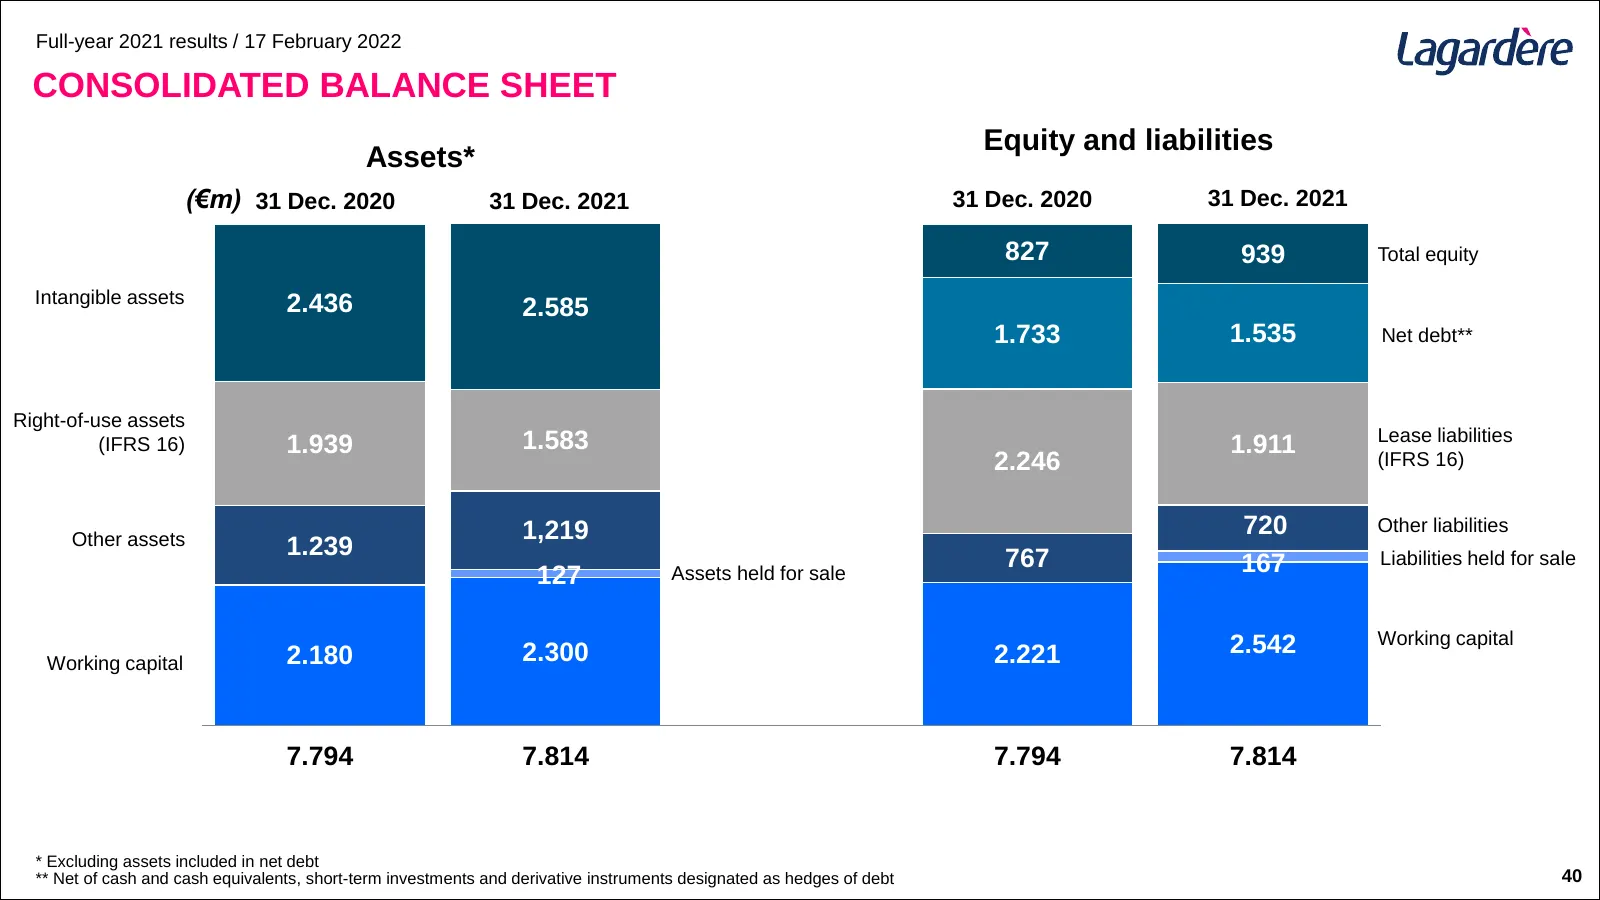
Full-year 2021 results / 17 February 2022 CONSOLIDATED BALANCE SHEET Equity and liabilities Assets* (€m) 31 Dec. 2020 31 Dec. 2021 31 Dec. 2020 31 Dec. 2021 827 939 Total equity Intangible assets 2.436 2.585 1.733 1.535 Net debt** Right-of-use assets 1.583 Lease liabilities (IFRS 16) 1.939 1.911 2.2
Slide 41: Consolidated Balance Sheet
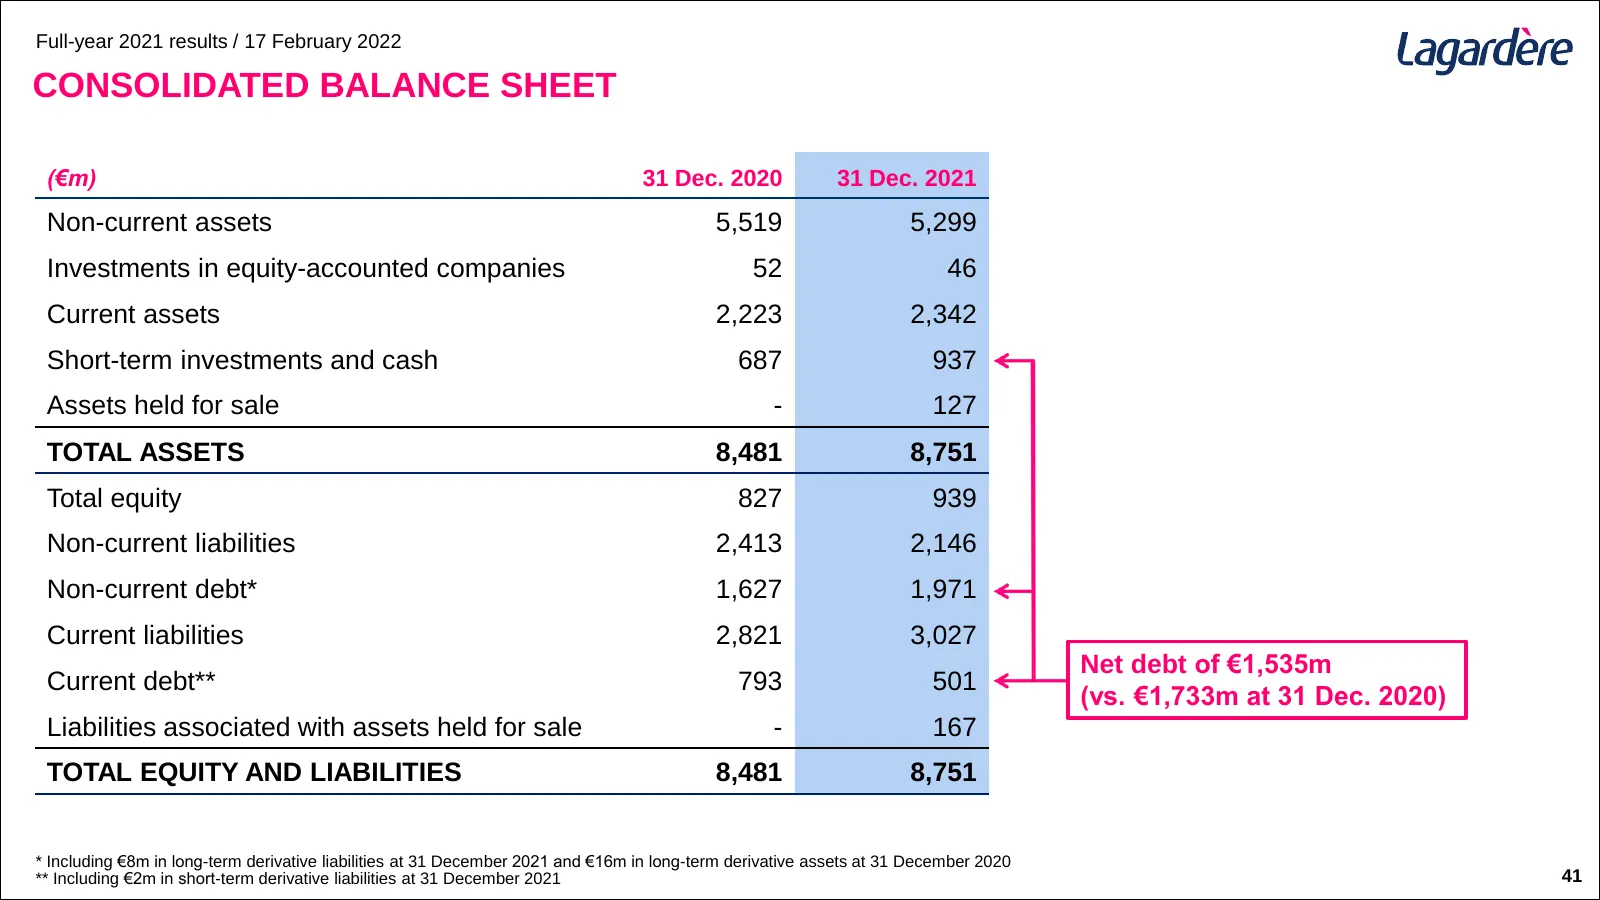
Full-year 2021 results / 17 February 2022 CONSOLIDATED BALANCE SHEET (€m) 31 Dec. 2020 31 Dec. 2021 Non-current assets 5,519 5,299 Investments in equity-accounted companies 52 46 Current assets 2,223 2,342 Short-term investments and cash 687 937 Assets held for sale - 127 TOTAL ASSETS 8,481 8,751 To
Slide 42: Glossary (1/3)
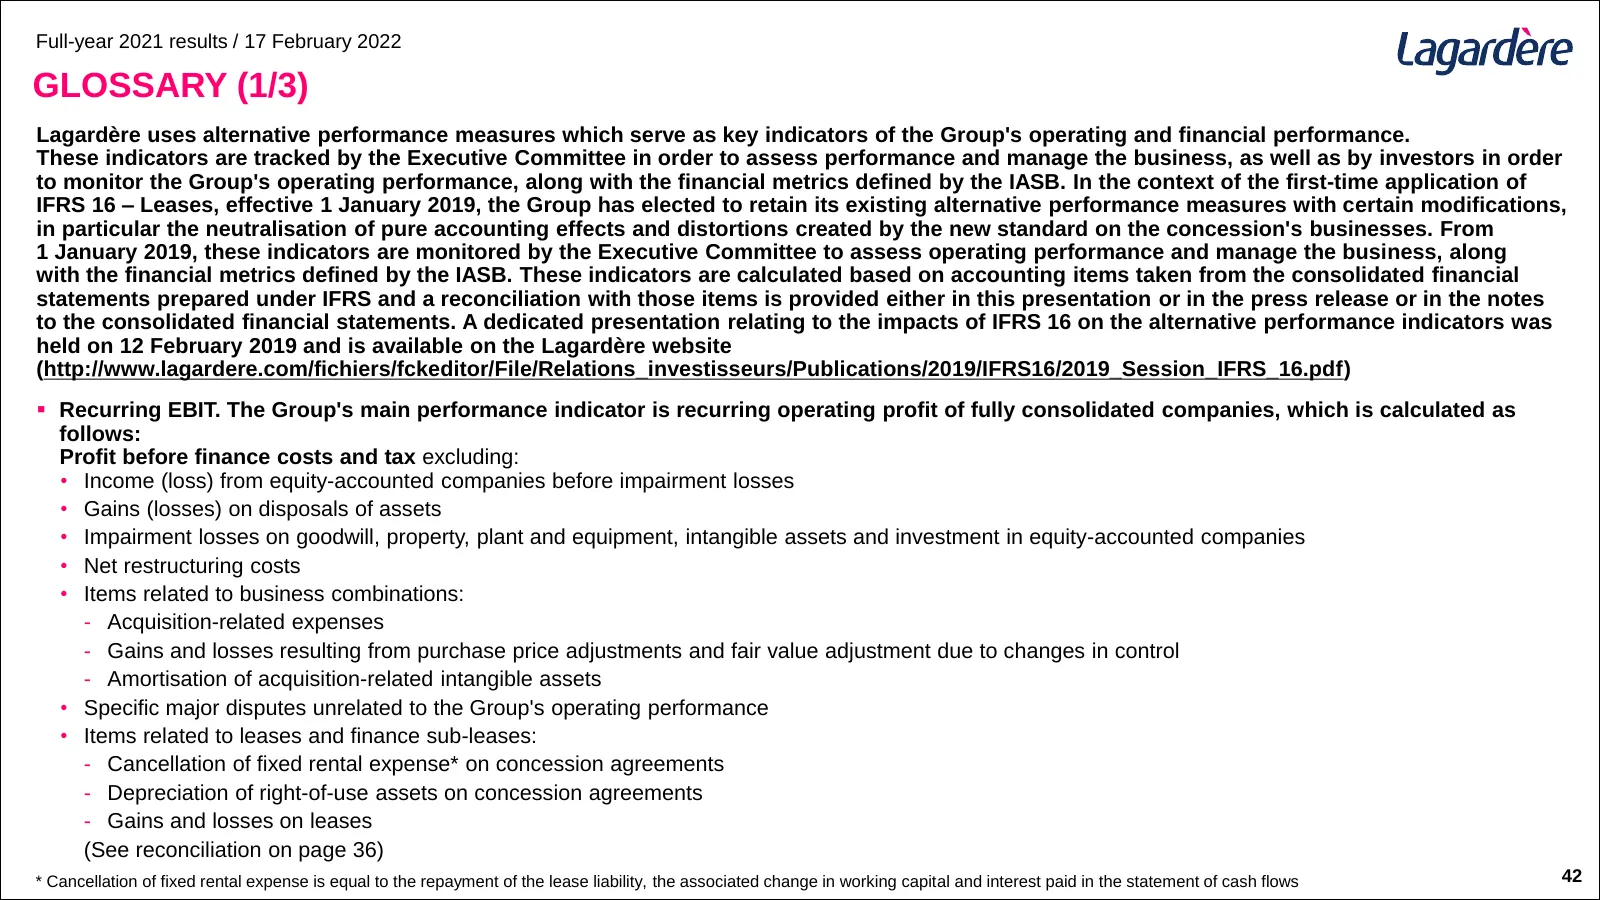
Full-year 2021 results / 17 February 2022 GLOSSARY (1/3) Lagardère uses alternative performance measures which serve as key indicators of the Group's operating and financial performance. These indicators are tracked by the Executive Committee in order to assess performance and manage the business, a
Slide 43: Glossary (2/3)
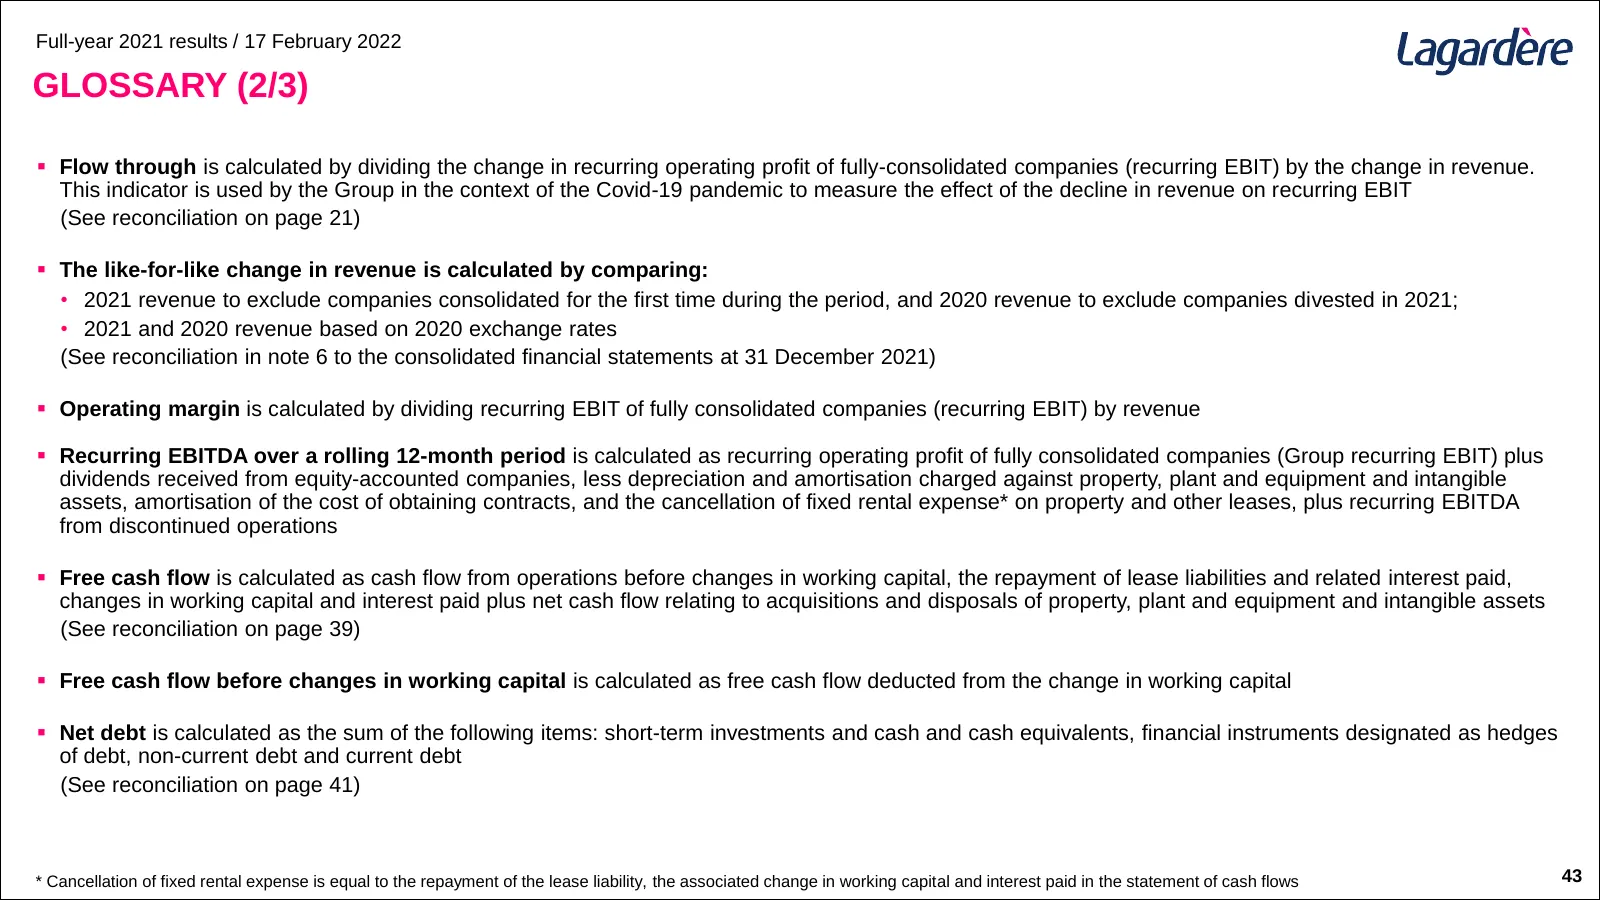
Full-year 2021 results / 17 February 2022 GLOSSARY (2/3) ▪ Flow through is calculated by dividing the change in recurring operating profit of fully-consolidated companies (recurring EBIT) by the change in revenue. This indicator is used by the Group in the context of the Covid-19 pandemic to measure
Slide 44: Glossary (3/3)
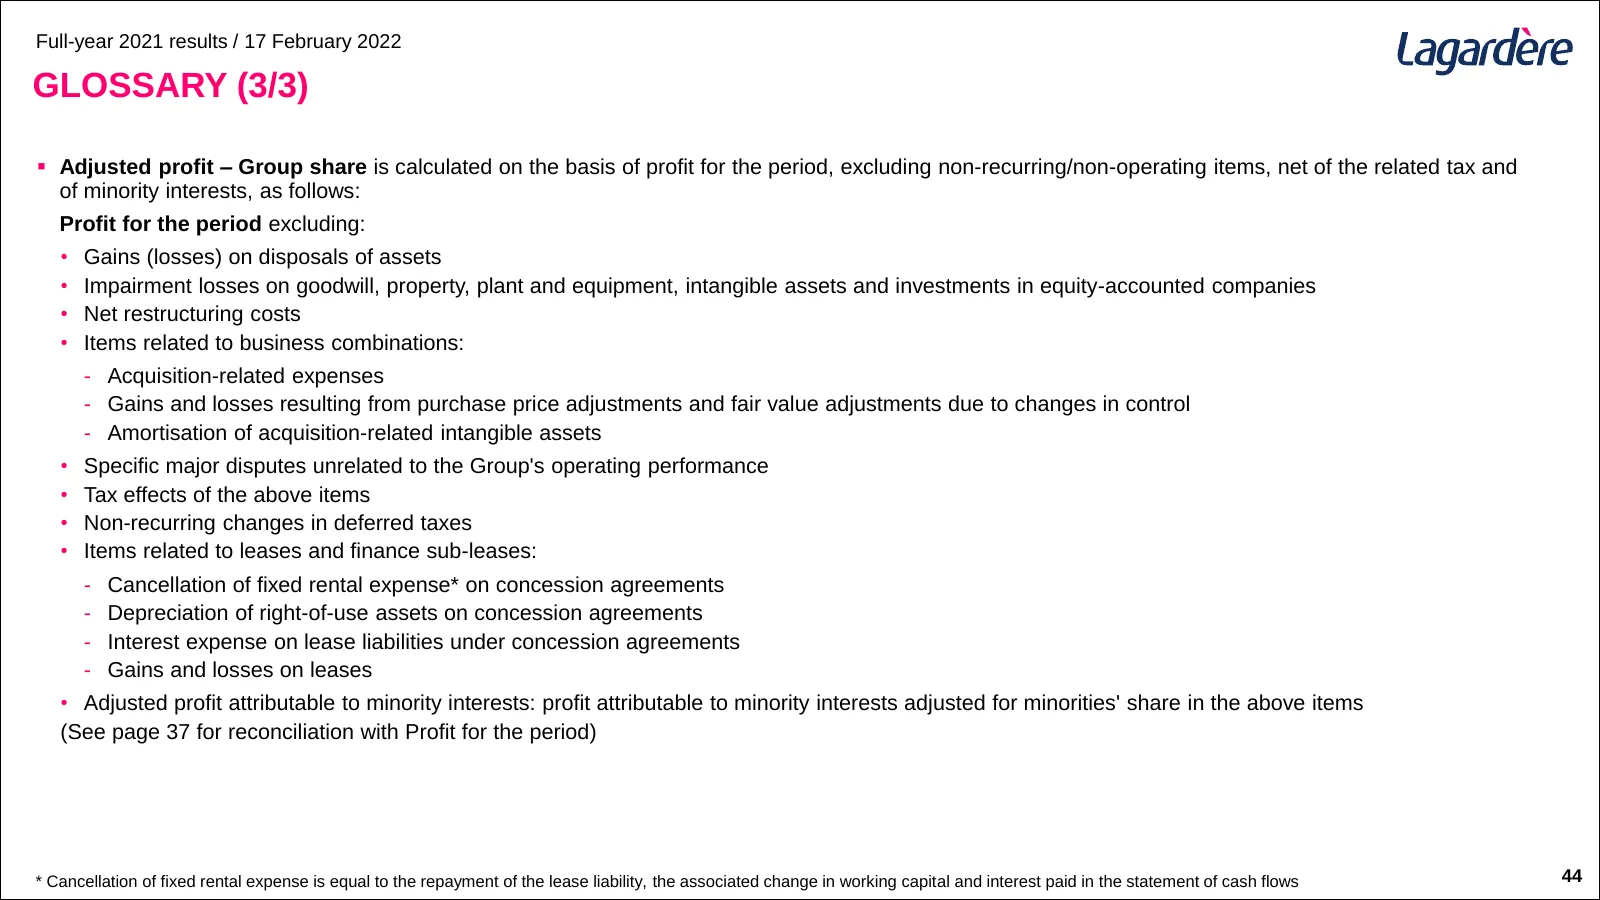
Full-year 2021 results / 17 February 2022 GLOSSARY (3/3) ▪ Adjusted profit – Group share is calculated on the basis of profit for the period, excluding non-recurring/non-operating items, net of the related tax and of minority interests, as follows: Profit for the period excluding: • Gains (losses) o
Slide 45: IFRS 16 Impact on the Consolidated Accounts
Full-year 2021 results / 17 February 2022 IFRS 16 IMPACT ON THE CONSOLIDATED ACCOUNTS
Slide 46: Impact of IFRS 16 on the Consolidated Income Statement and Related Indicators
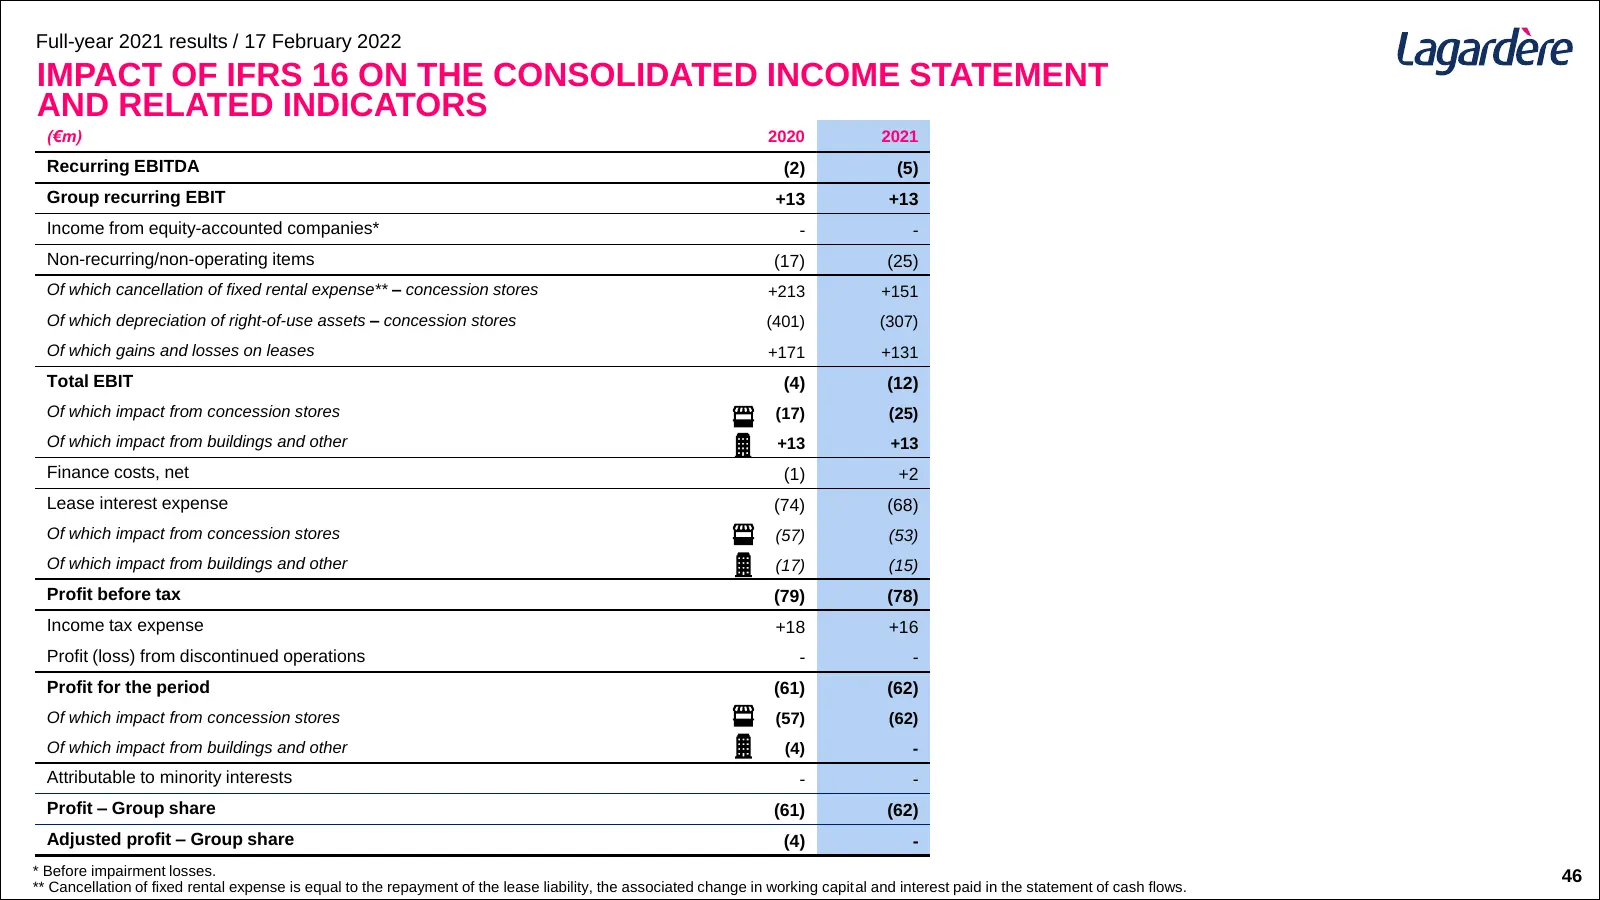
Full-year 2021 results / 17 February 2022 IMPACT OF IFRS 16 ON THE CONSOLIDATED INCOME STATEMENT AND RELATED INDICATORS (€m) 2020 2021 Recurring EBITDA (2) (5) Group recurring EBIT +13 +13 Income from equity-accounted companies* - - Non-recurring/non-operating items (17) (25) Of which cancellation o
Slide 47: Impact of IFRS 16 on the Consolidated Statement of Cash Flows
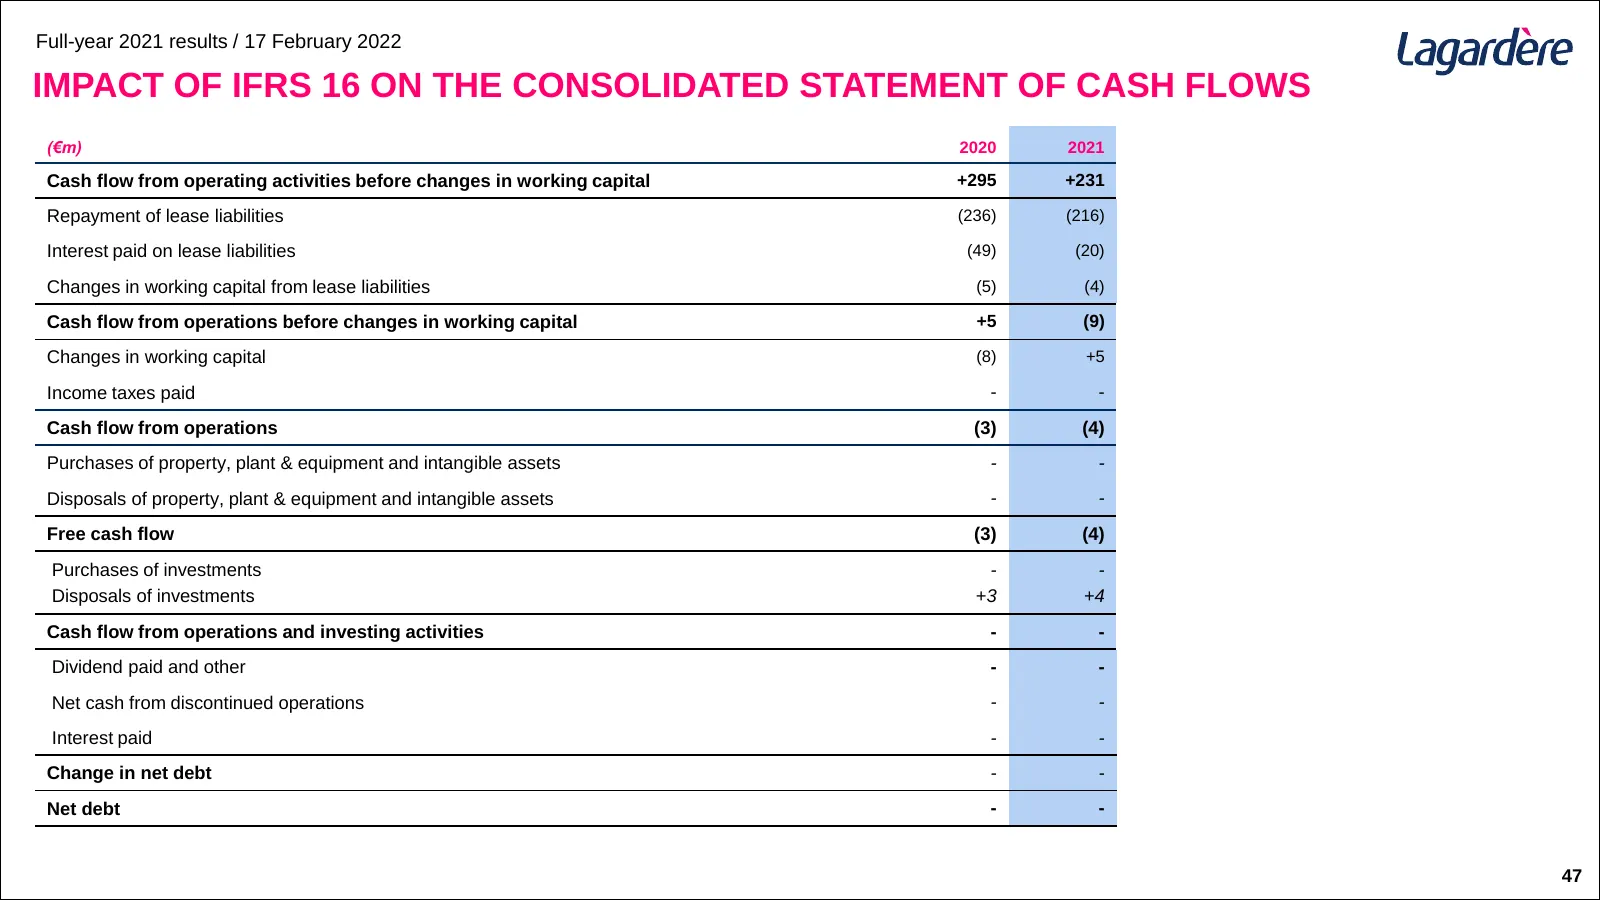
Full-year 2021 results / 17 February 2022 IMPACT OF IFRS 16 ON THE CONSOLIDATED STATEMENT OF CASH FLOWS (€m) 2020 2021 Cash flow from operating activities before changes in working capital +295 +231 Repayment of lease liabilities (236) (216) Interest paid on lease liabilities (49) (20) Changes in wo
Slide 48: Impact of IFRS 16 on the Consolidated Balance Sheet
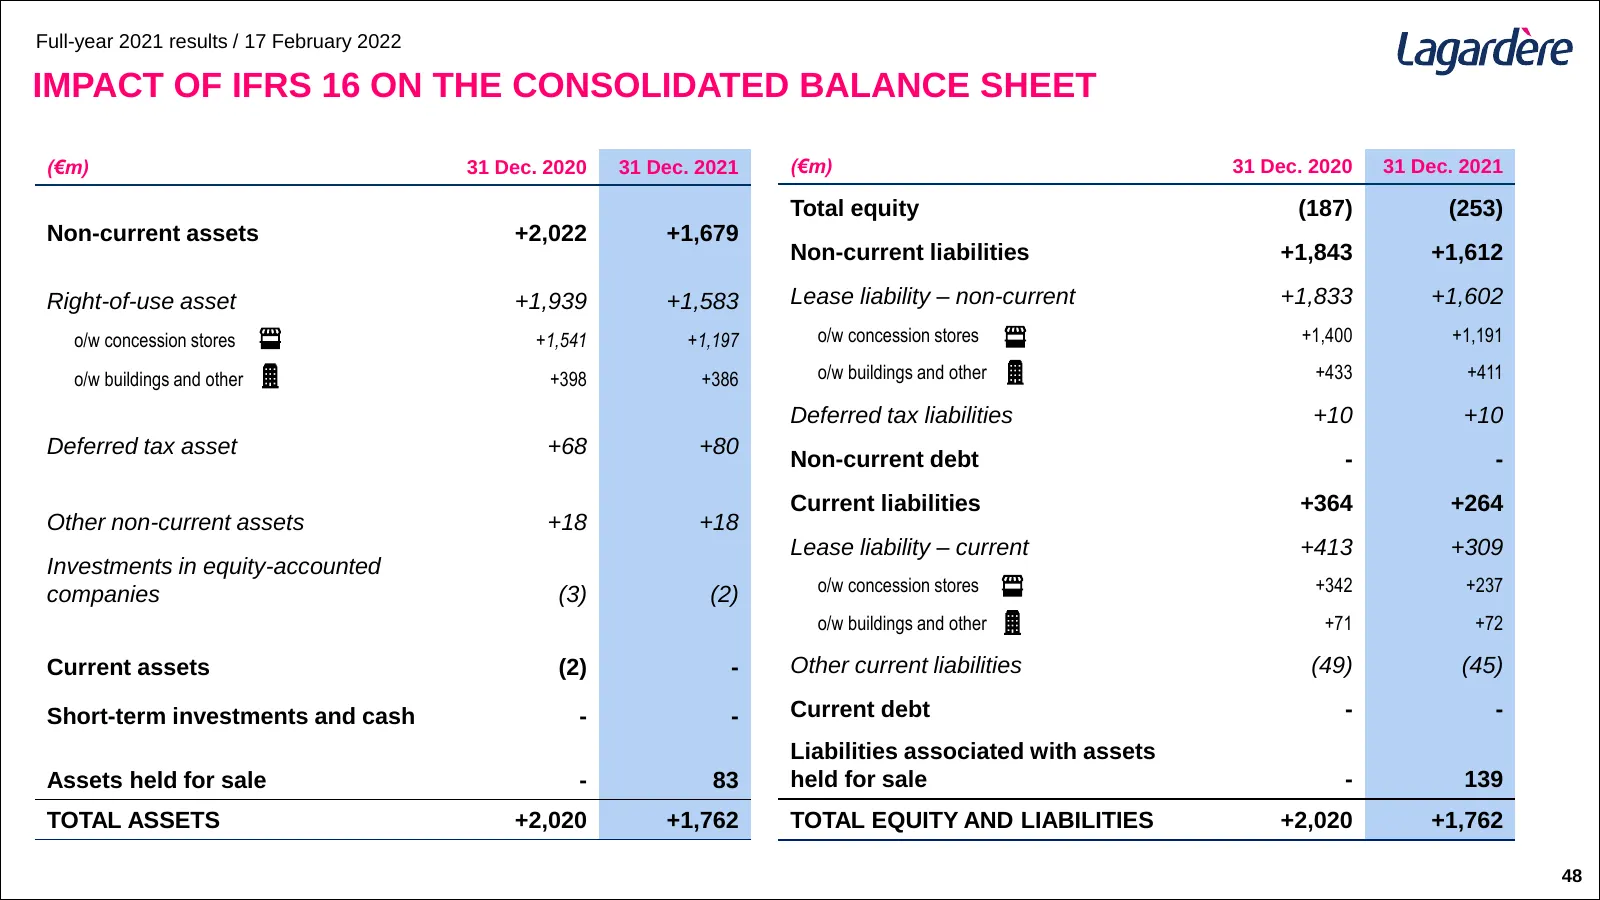
Full-year 2021 results / 17 February 2022 IMPACT OF IFRS 16 ON THE CONSOLIDATED BALANCE SHEET (€m) 31 Dec. 2020 31 Dec. 2021 (€m) 31 Dec. 2020 31 Dec. 2021 Total equity (187) (253) Non-current assets +2,022 +1,679 Non-current liabilities +1,843 +1,612 Right-of-use asset +1,939 +1,583 Lease liability
Source: Internet Archive copy of lagardere.com
More decks from Lagardere SA
 Debt Investor Presentation (September 2026)47 slides · September 2026
 H1 2026 Earnings Presentation36 slides · Jul 28, 2026
 Shareholder Meeting (May 2026)101 slides · May 5, 2026
 Shareholder Meeting (May 2026)101 slides · May 5, 2026
 Q1 2026 Earnings Presentation14 slides · Apr 16, 2026
 FY2025 Earnings Presentation44 slides · Feb 19, 2026