Ellaktor SA · ATHEX:ELLAKTOR
Ellaktor SA — El.Tech. Anemos — 3m 2017 Earnings Presentation
14 slides from Ellaktor SA's earnings presentation, June 2017
Slide 1: 3m 2017 Results
EL.TECH. ANEMOS MEMBER OF ELLAKTOR GROUP 3m 2017 Results June 2017
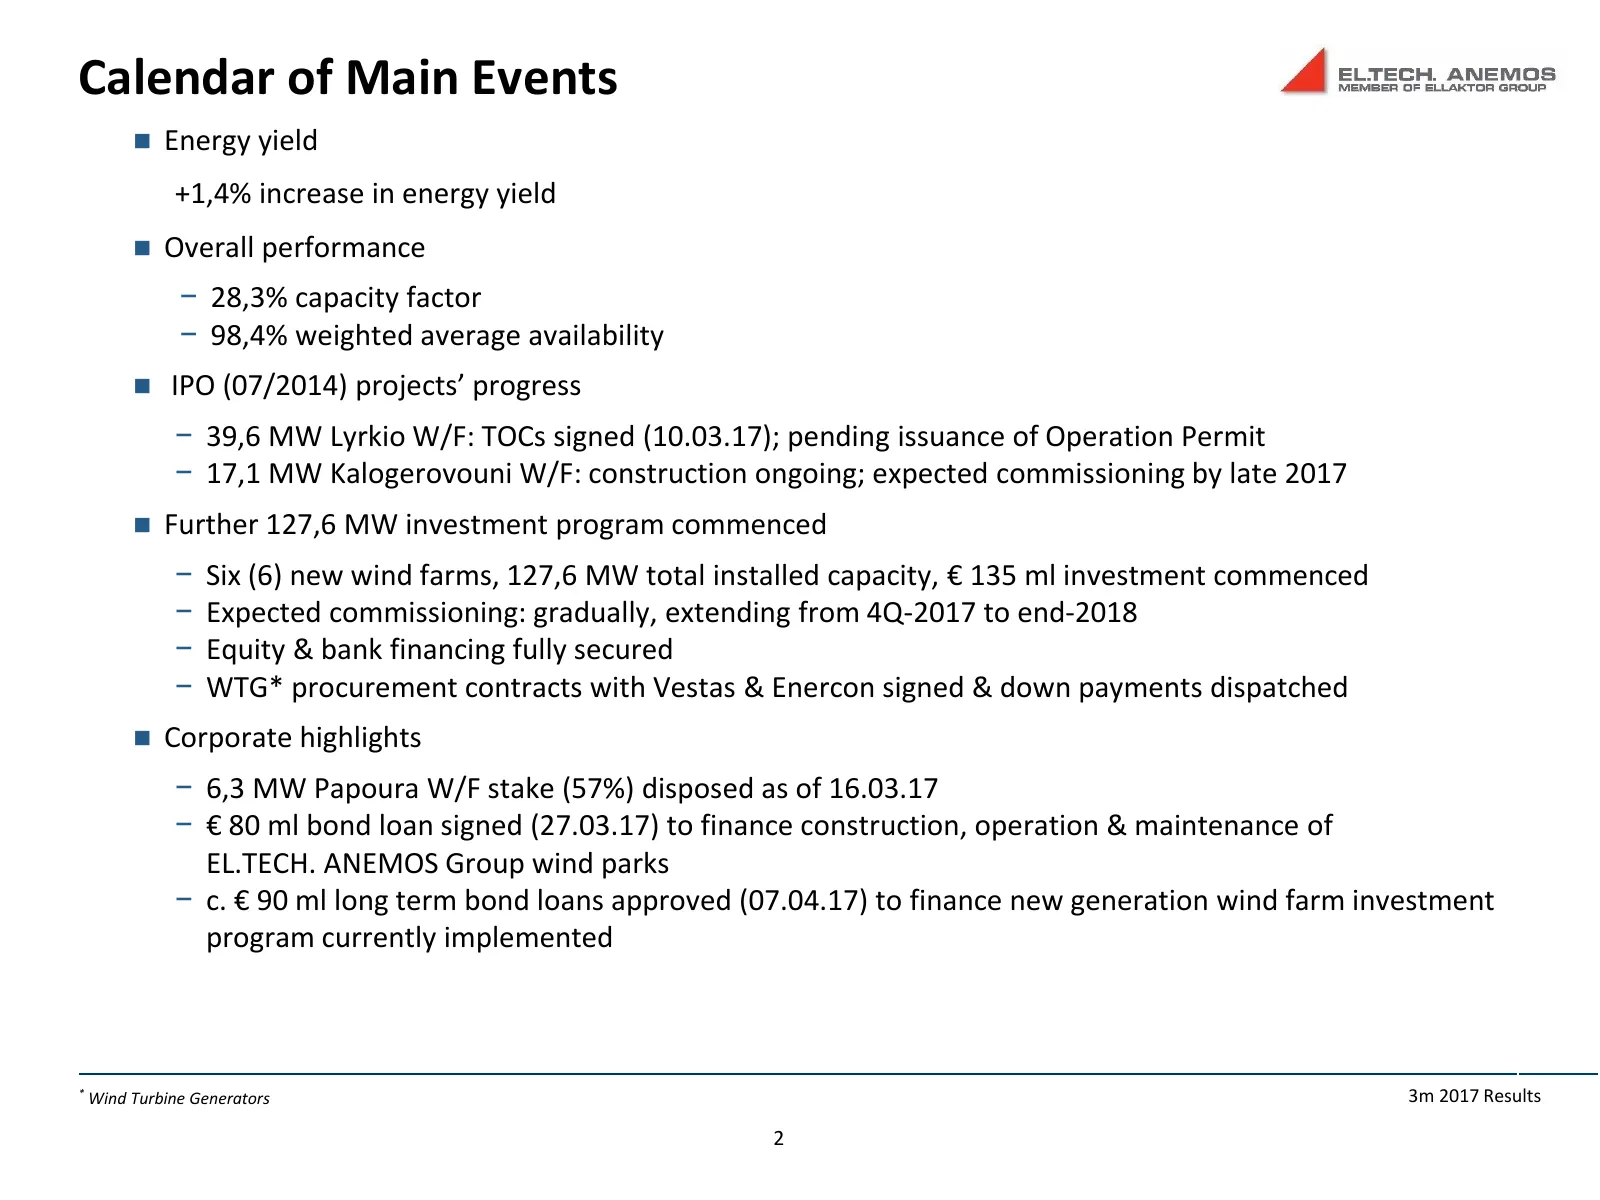
Slide 2: Calendar of Main Events
Calendar of Main Events Energy yield +1,4% increase in energy yield Overall performance − 28,3% capacity factor − 98,4% weighted average availability IPO (07/2014) projects’ progress − 39,6 MW Lyrkio W/F: TOCs signed (10.03.17); pending issuance of Operation Permit − 17,1 MW Kalogerovouni W/F:
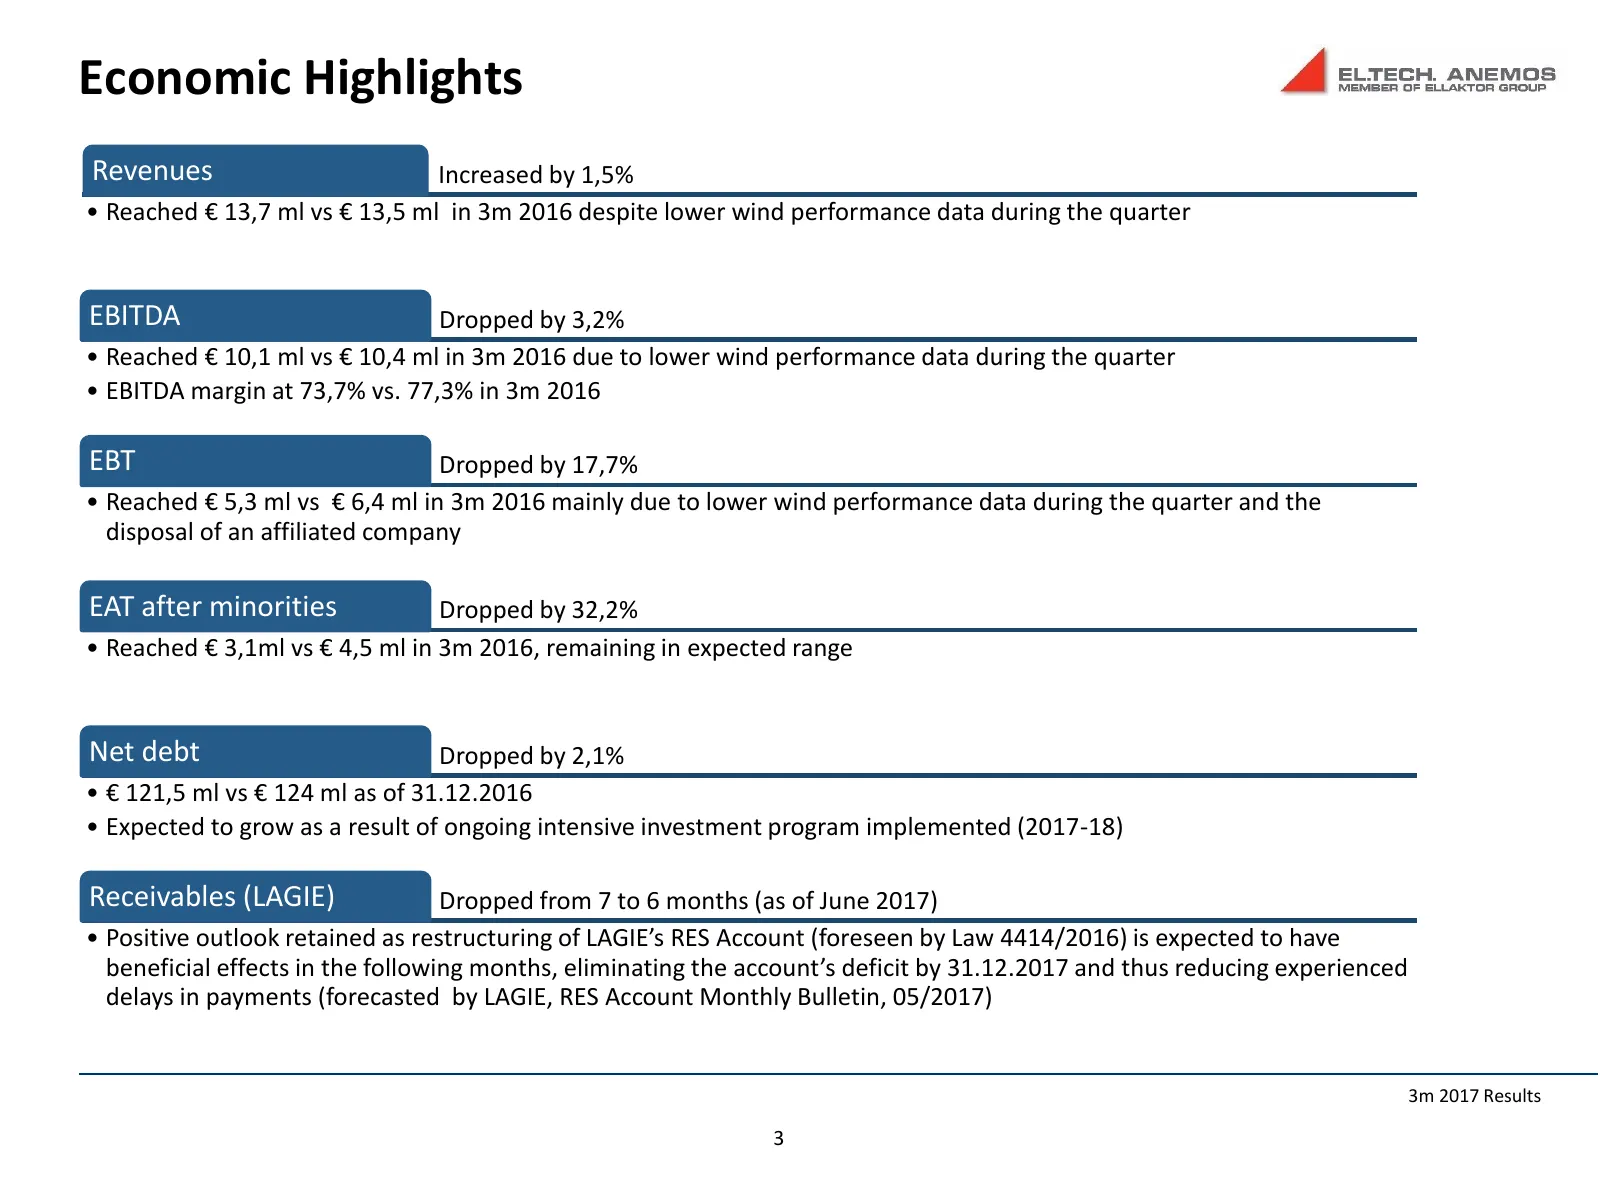
Slide 3: Economic Highlights
Economic Highlights Revenues Increased by 1,5% • Reached € 13,7 ml vs € 13,5 ml in 3m 2016 despite lower wind performance data during the quarter EBITDA Dropped by 3,2% • Reached € 10,1 ml vs € 10,4 ml in 3m 2016 due to lower wind performance data during the quarter • EBITDA margin at 73,7% vs. 77,3
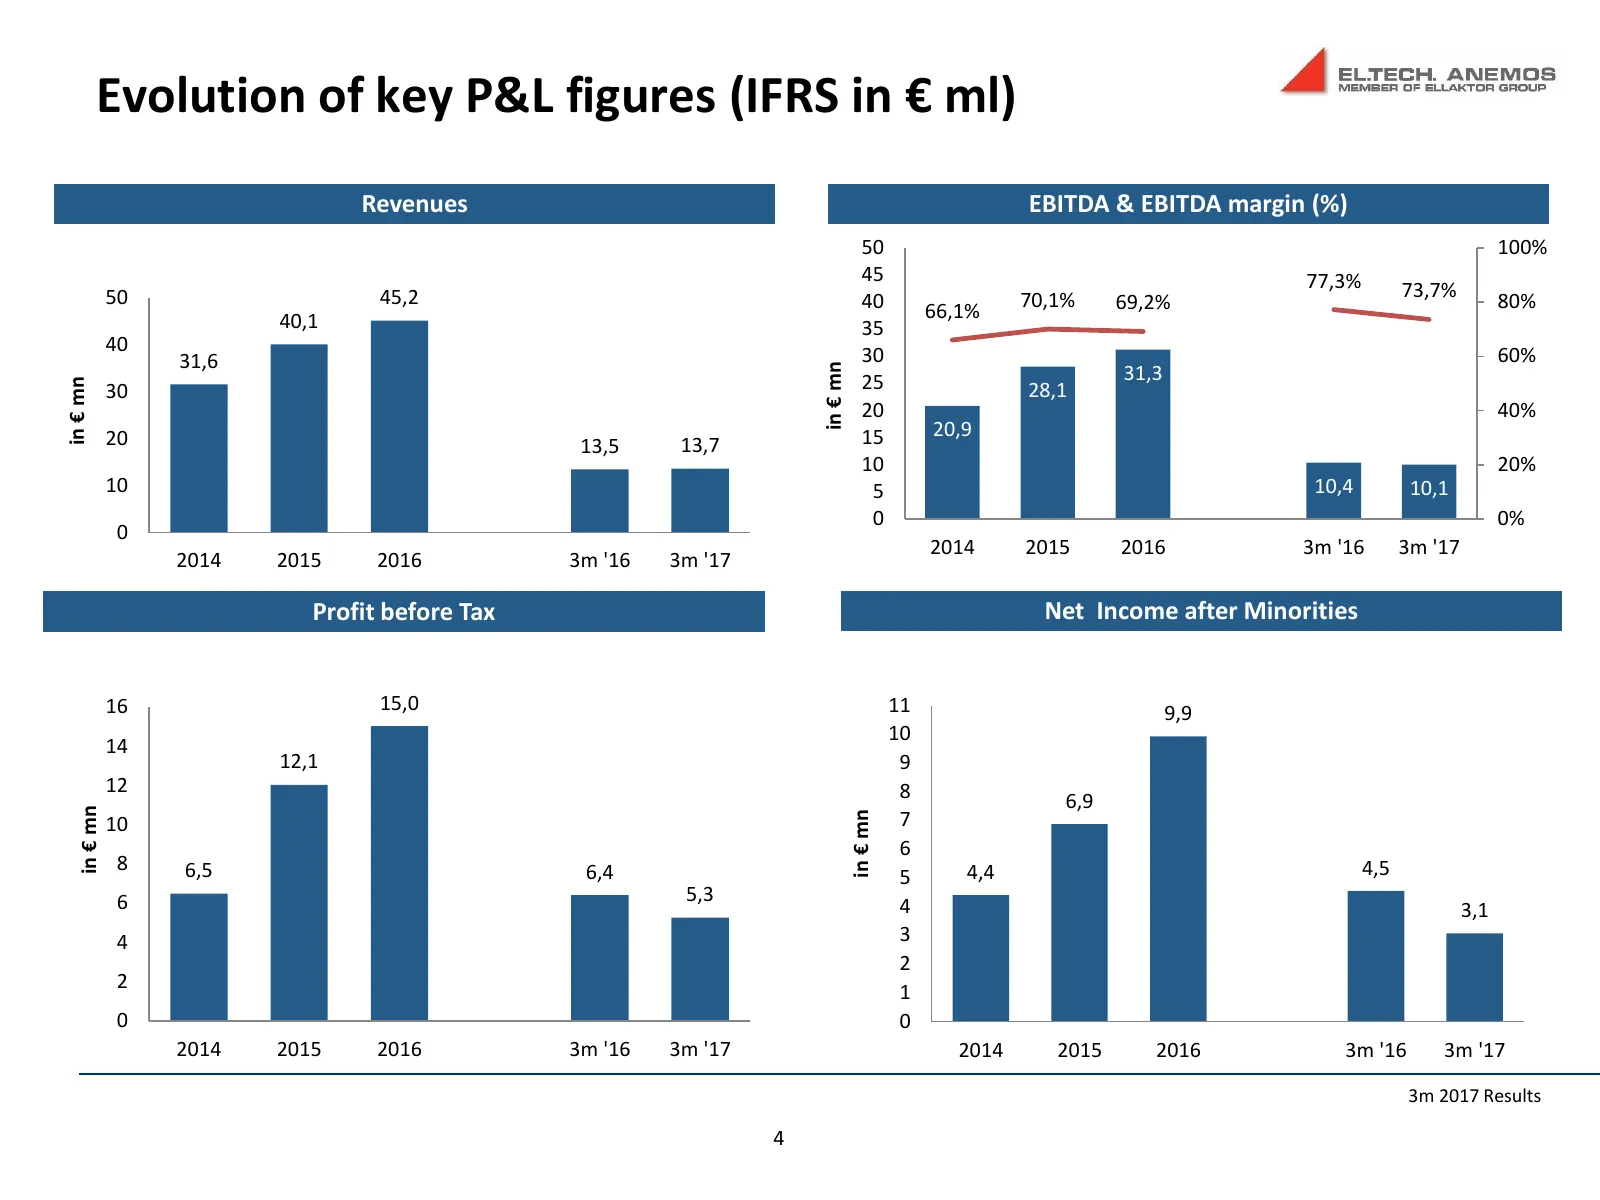
Slide 4: Evolution of key P&L figures (IFRS in € ml)
Evolution of key P&L figures (IFRS in € ml) Revenues EBITDA & EBITDA margin (%) 50 100% 45 77,3% 50 45,2 40 70,1% 73,7% 80% 66,1% 69,2% 40,1 35 40 31,6 30 60% in € mn 25 31,3 in € mn 30 28,1 20 40% 20 15 20,9 13,5 13,7 10 20% 10 5 10,4 10,1 0 0% 0 2014 2015 2016 3m '16 3m '17 2014 2015 2016 3m '16 3
Slide 5: Evolution of key Balance Sheet figures (IFRS in € ml)
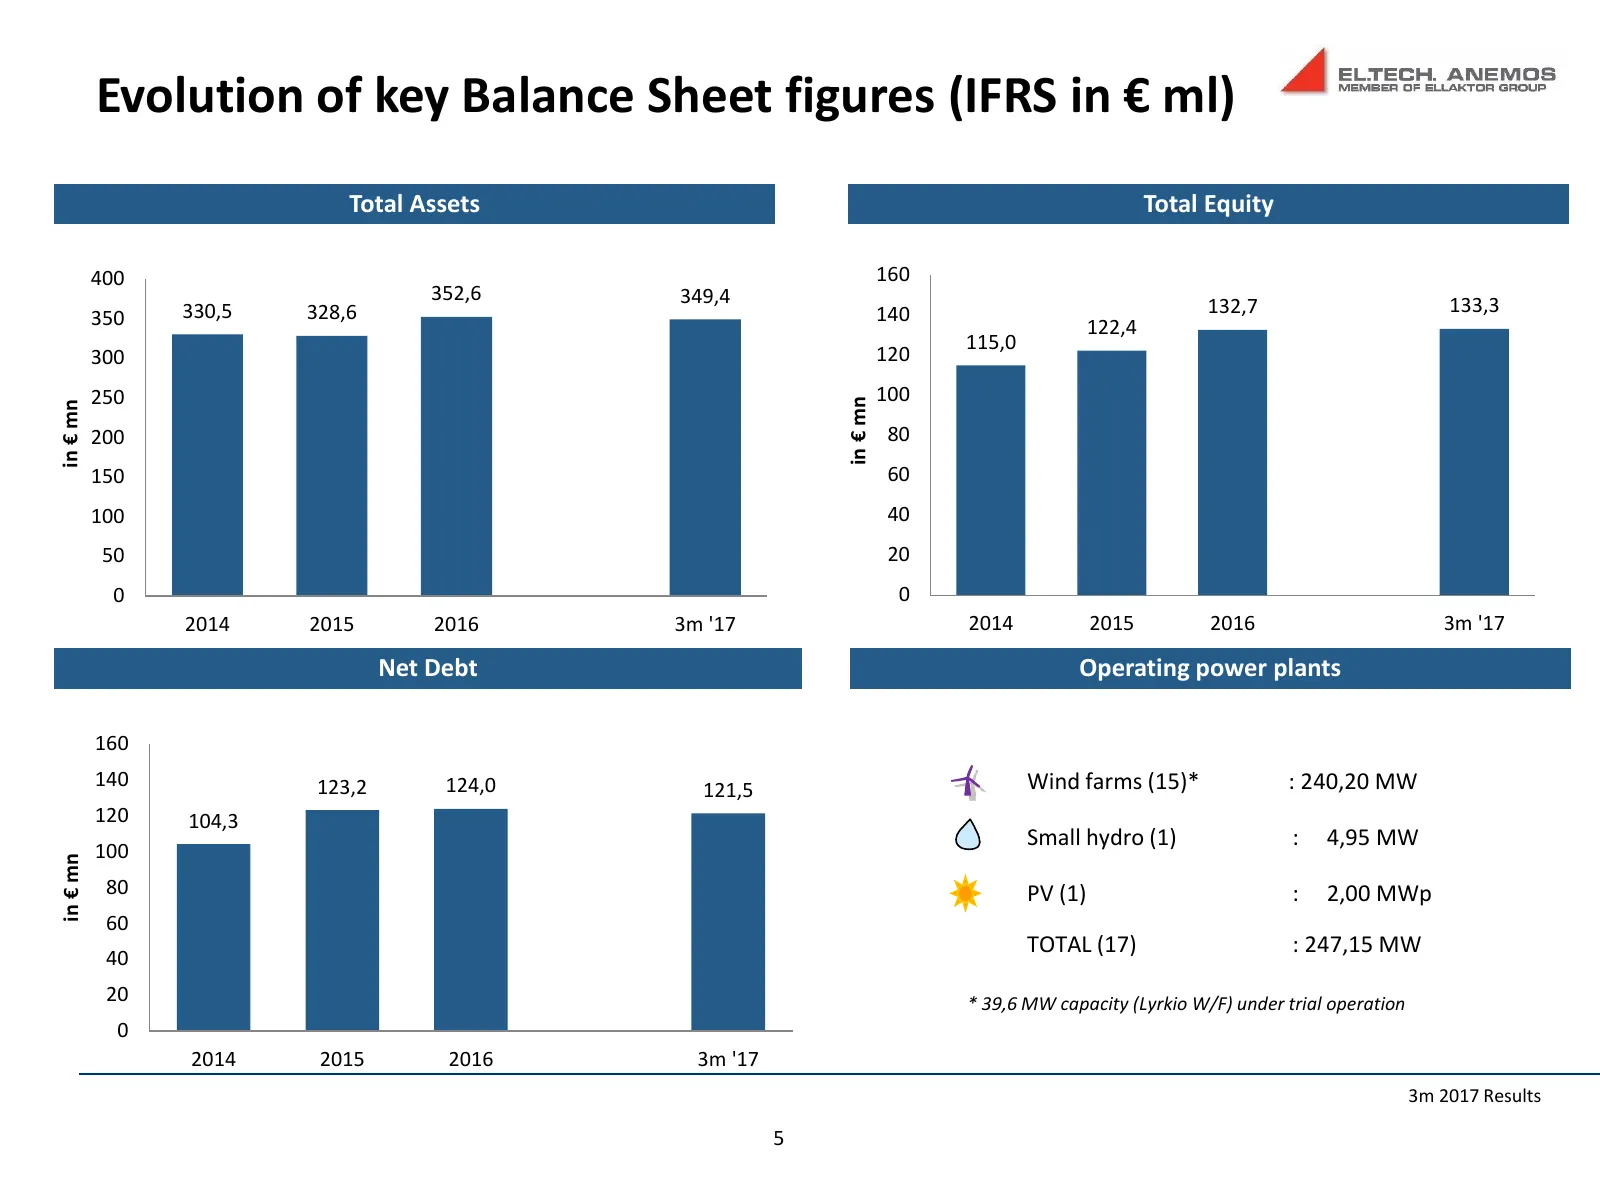
Evolution of key Balance Sheet figures (IFRS in € ml) Total Assets Total Equity 400 160 352,6 349,4 330,5 328,6 140 132,7 133,3 350 122,4 115,0 300 120 250 100 in € mn in € mn 200 80 150 60 100 40 50 20 0 0 2014 2015 2016 3m '17 2014 2015 2016 3m '17 Net Debt Operating power plants 160 140 123,2 124
Slide 6: RES Asset Portfolio
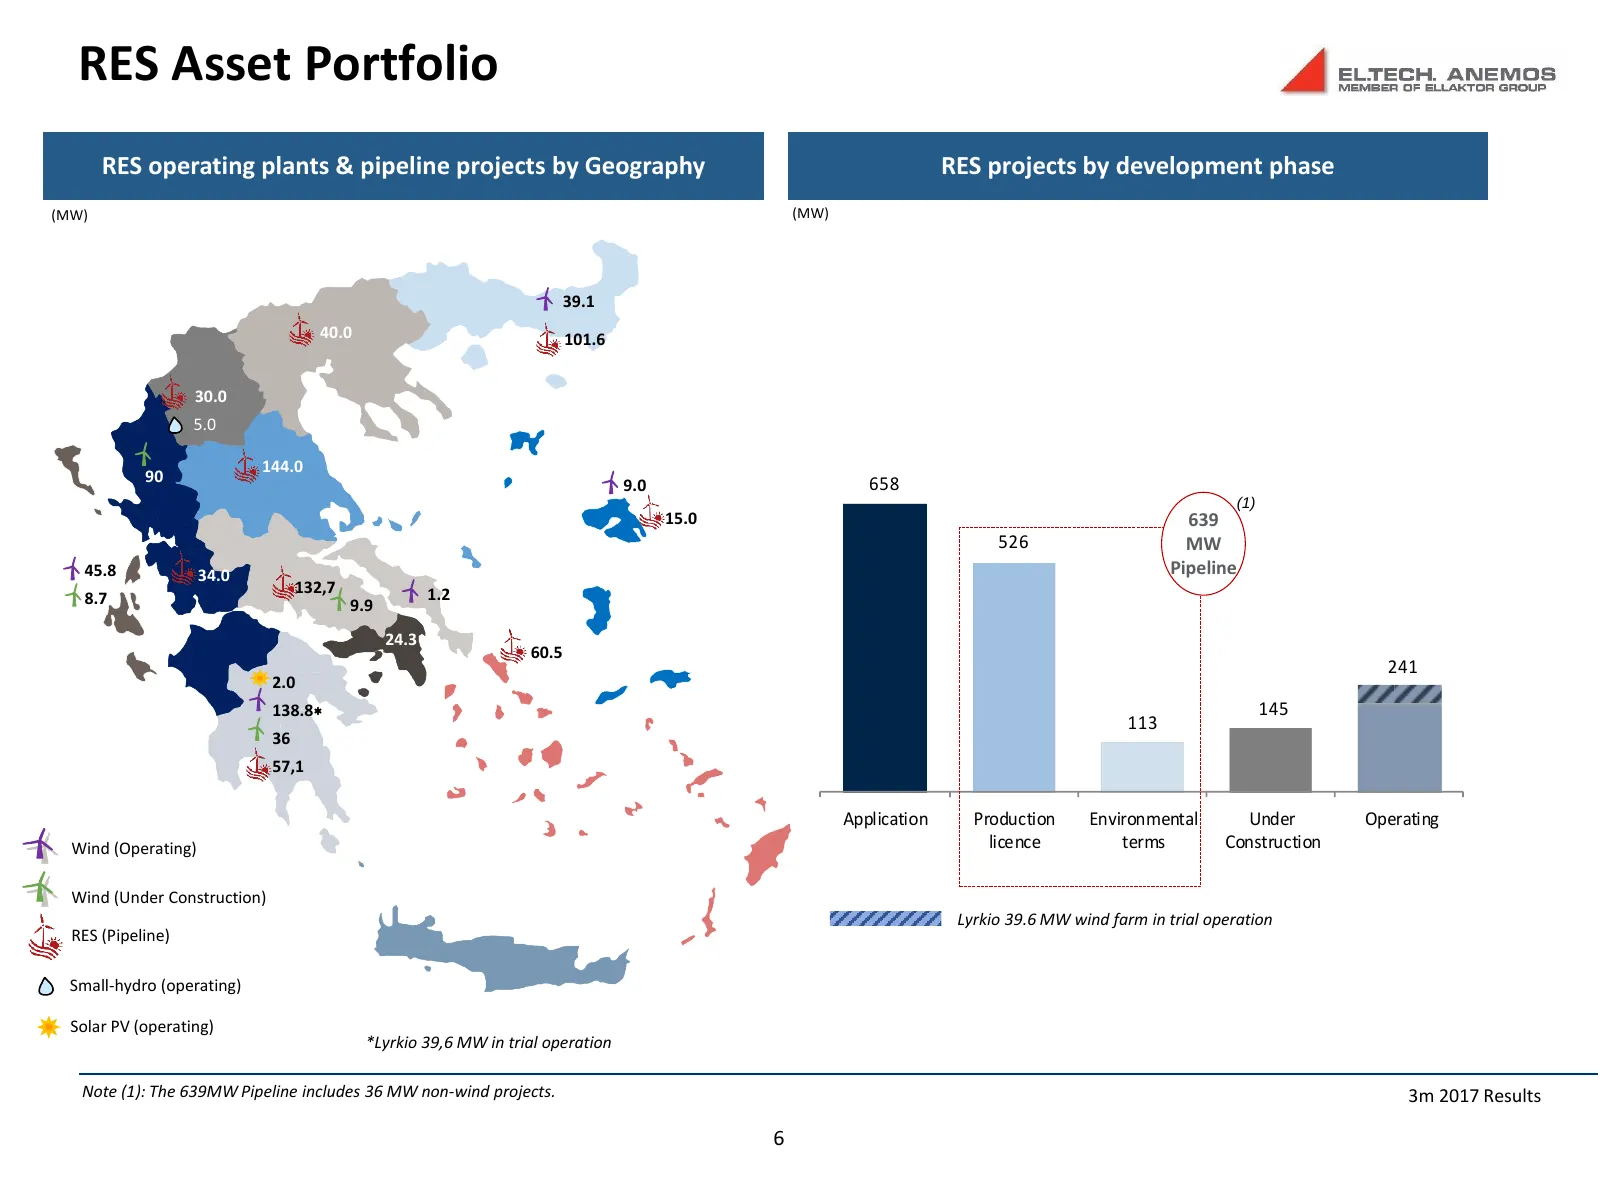
RES Asset Portfolio RES operating plants & pipeline projects by Geography RES projects by development phase (MW) (MW) 39.1 40.0 101.6 30.0 5.0 144.0 90 9.0 658 (1) 15.0 639 526 MW 45.8 34.0 Pipeline 132,7 1.2 8.7 9.9 24.3 60.5 241 2.0 138.8 145 113 36 57,1 Application Production Environmental Under
Slide 7: Strategy Going Forward – Maintain Growth Profile
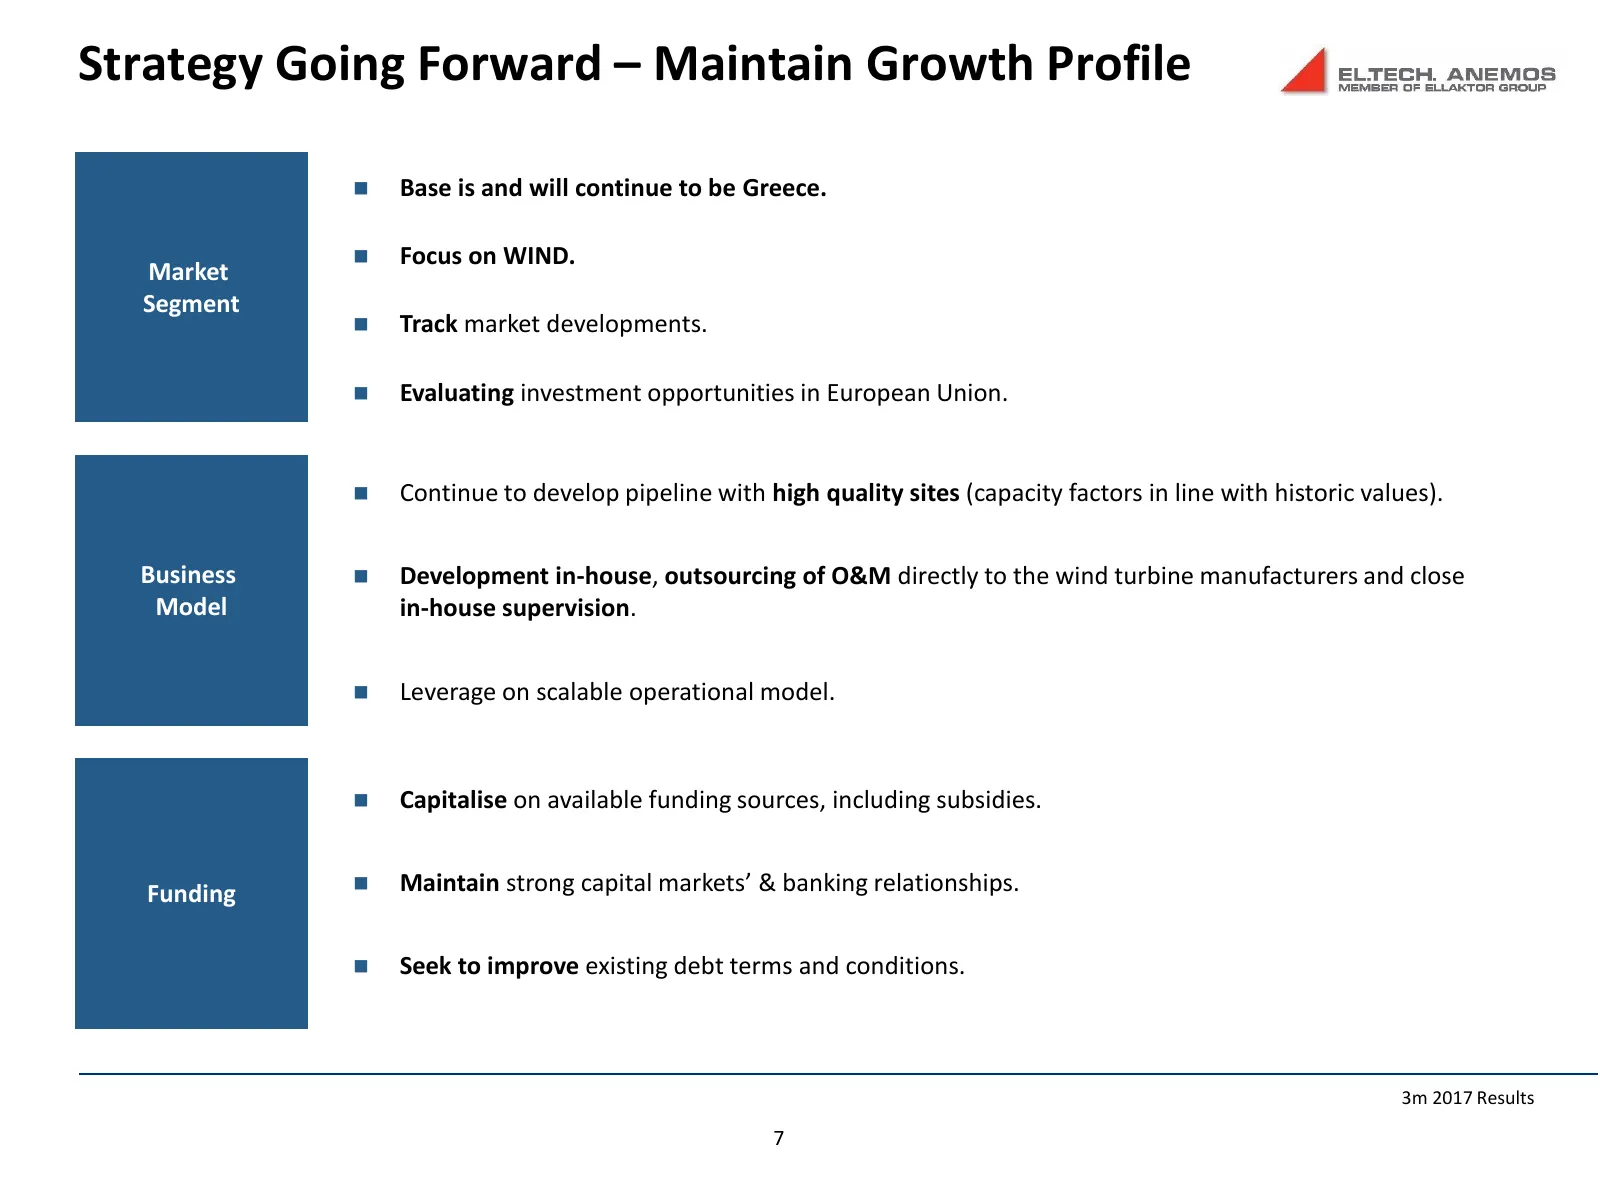
Strategy Going Forward – Maintain Growth Profile Base is and will continue to be Greece. Focus on WIND. Market Segment Track market developments. Evaluating investment opportunities in European Union. Continue to develop pipeline with high quality sites (capacity factors in line with histo
Slide 8: IPO Proceeds to finance wind farms of 93,5 MW
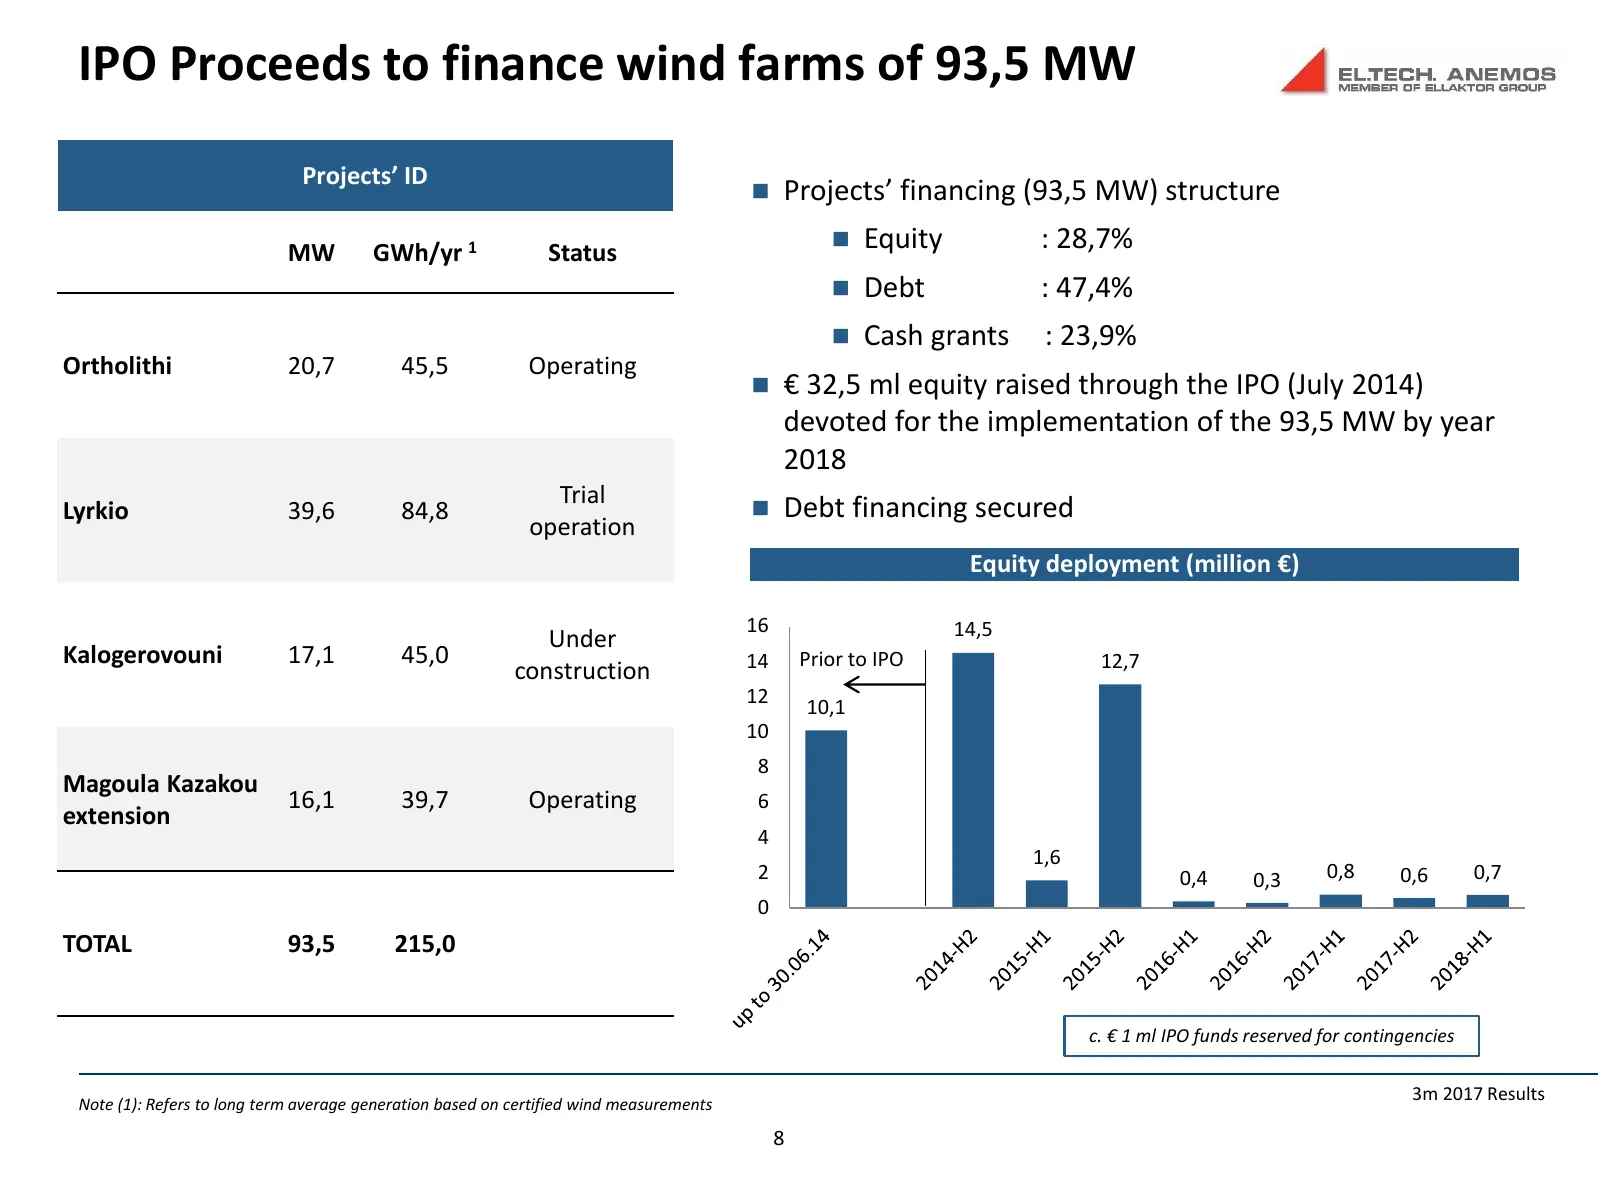
IPO Proceeds to finance wind farms of 93,5 MW Projects’ ID Projects’ financing (93,5 MW) structure Equity : 28,7% MW GWh/yr 1 Status Debt : 47,4% Cash grants : 23,9% Ortholithi 20,7 45,5 Operating € 32,5 ml equity raised through the IPO (July 2014) devoted for the implementation of the 93,
Slide 9: New generation wind farms 127,6 MW
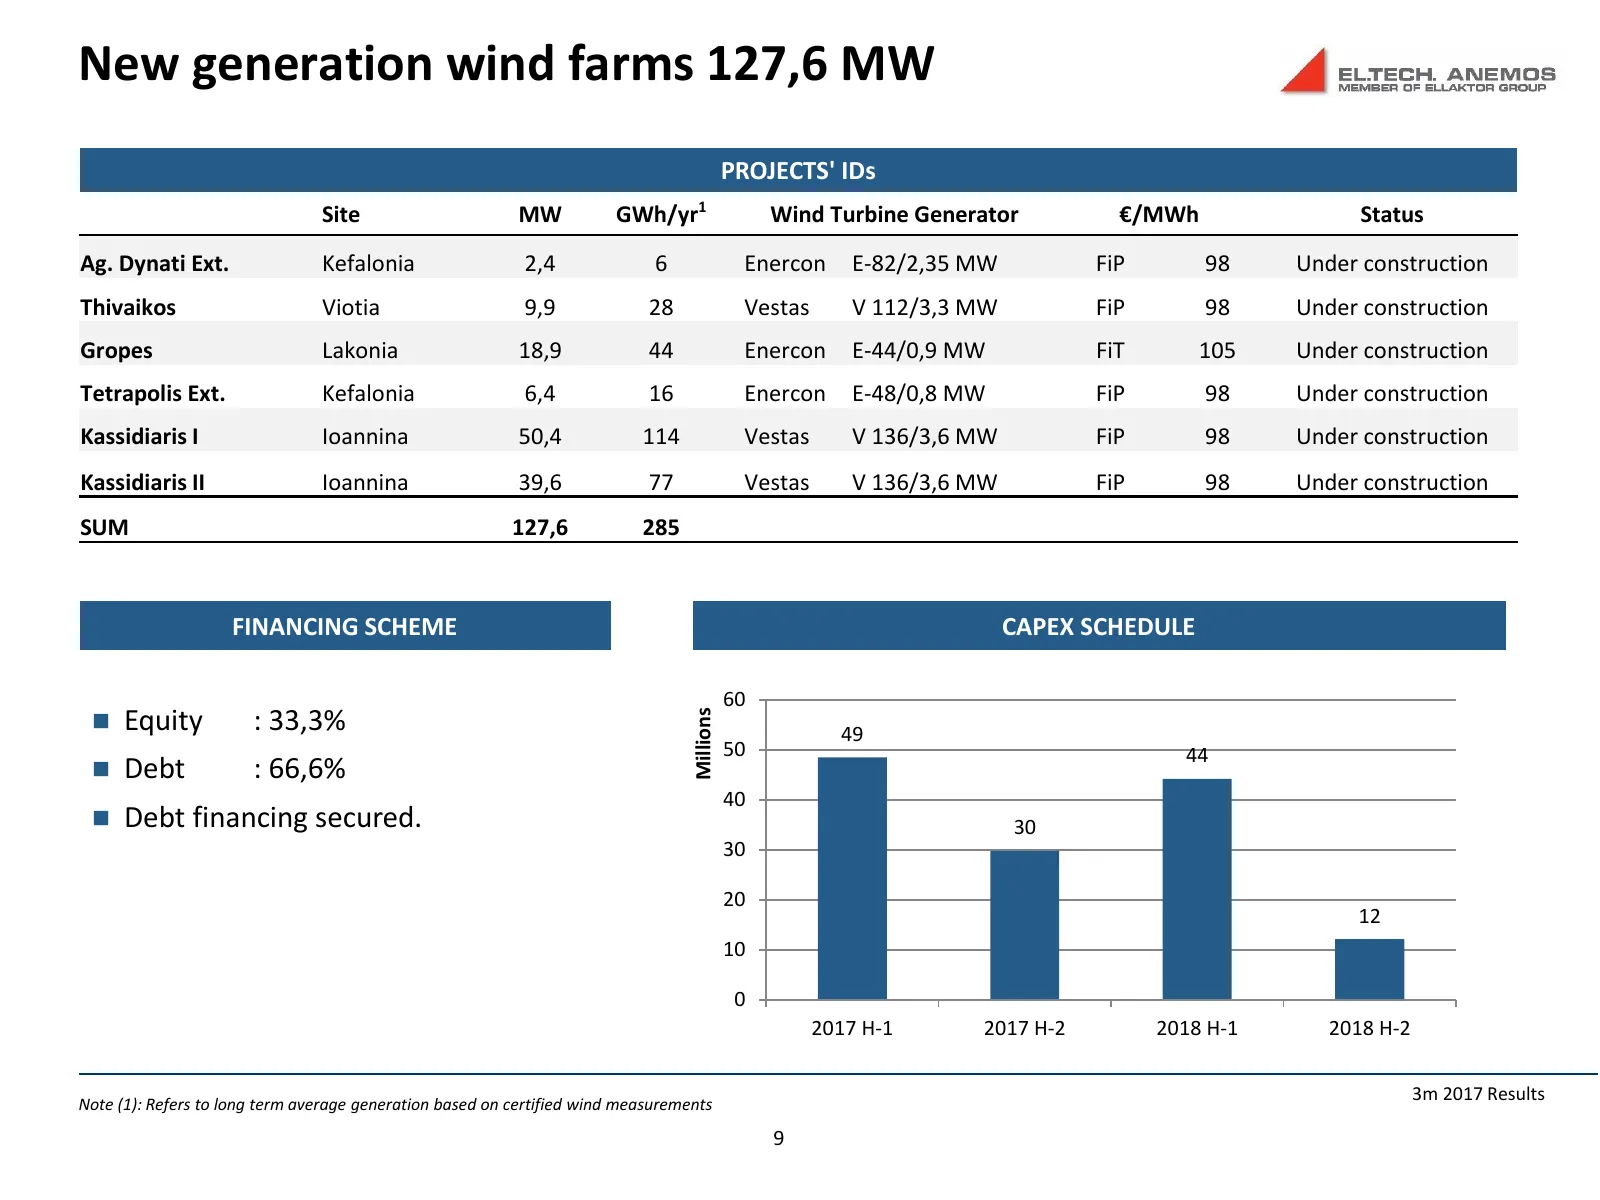
New generation wind farms 127,6 MW PROJECTS' IDs 1 Site MW GWh/yr Wind Turbine Generator €/ΜWh Status Ag. Dynati Ext. Kefalonia 2,4 6 Enercon E-82/2,35 MW FiP 98 Under construction Thivaikos Viotia 9,9 28 Vestas V 112/3,3 MW FiP 98 Under construction Gropes Lakonia 18,9 44 Enercon E-44/0,9 MW FiT 10
Slide 10: Performance
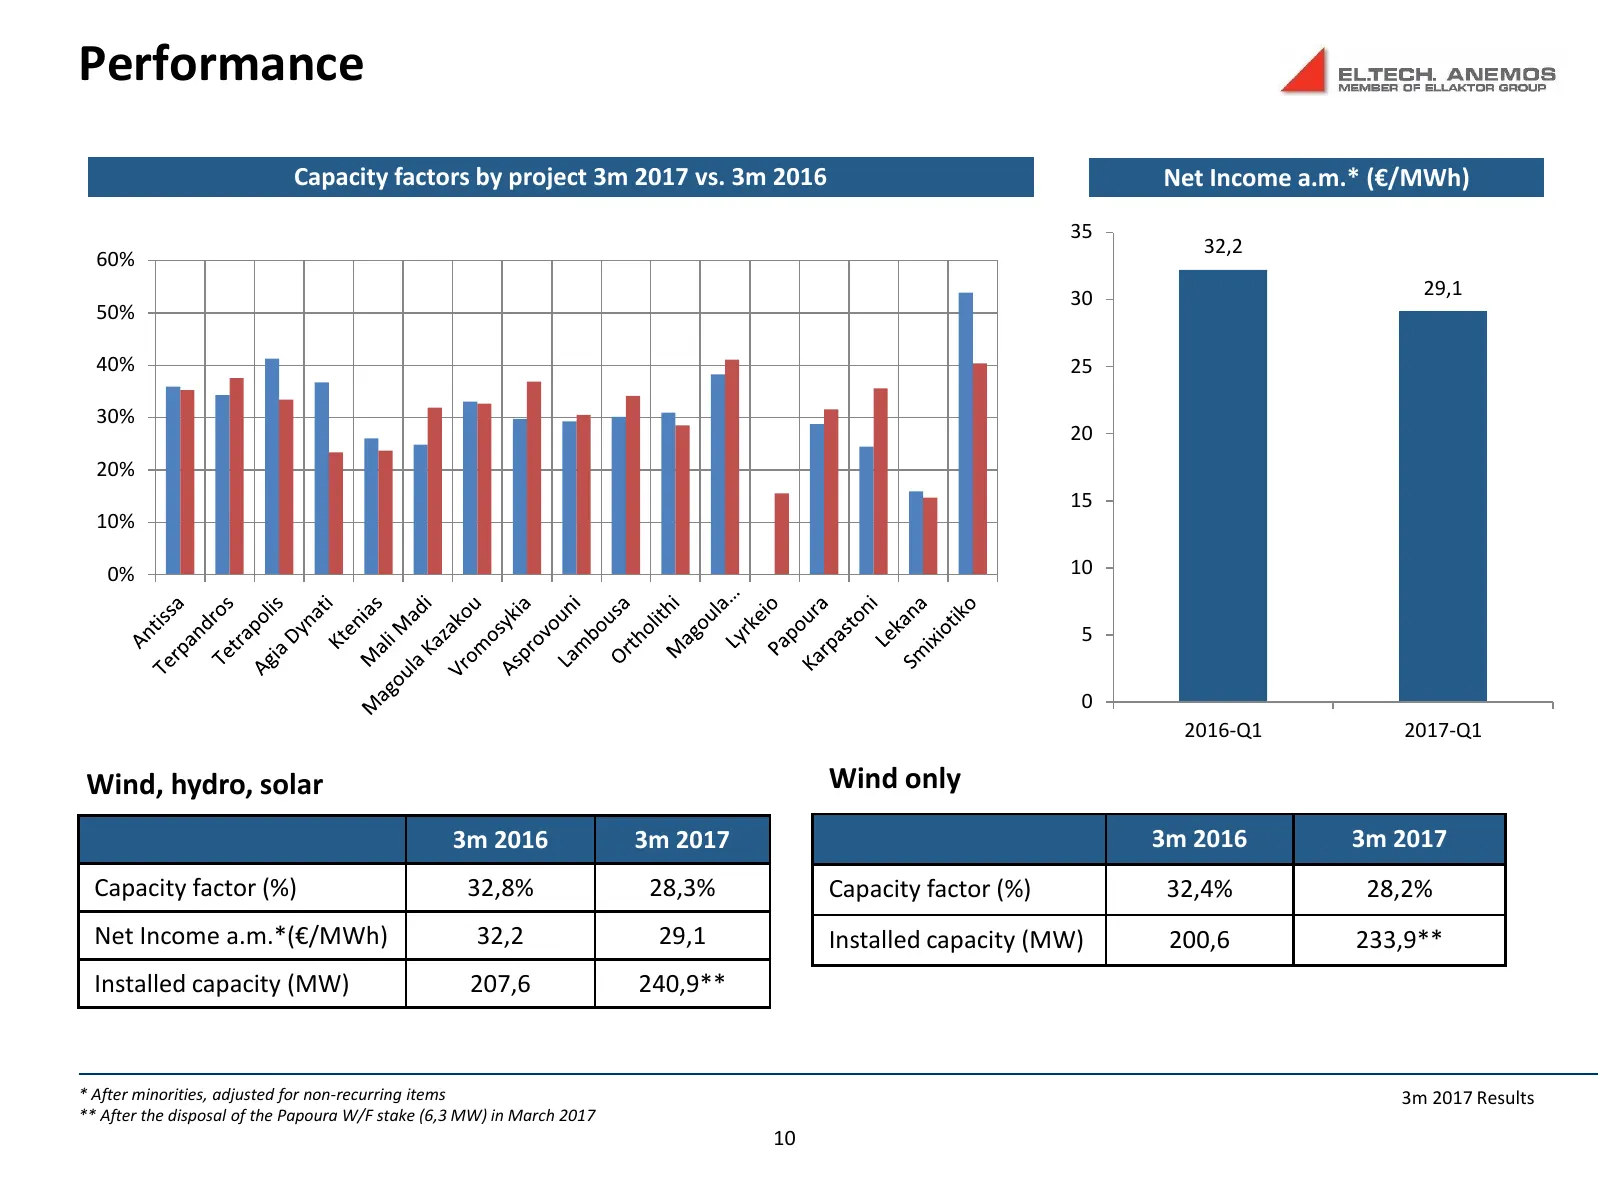
Performance Capacity factors by project 3m 2017 vs. 3m 2016 Net Income a.m.* (€/MWh) 35 32,2 60% 30 29,1 50% 40% 25 30% 20 20% 15 10% 0% 10 5 0 2016-Q1 2017-Q1 Wind, hydro, solar Wind only 3m 2016 3m 2017 3m 2016 3m 2017 Capacity factor (%) 32,8% 28,3% Capacity factor (%) 32,4% 28,2% Net Income a.m.
Slide 11: Group Asset Performance Details
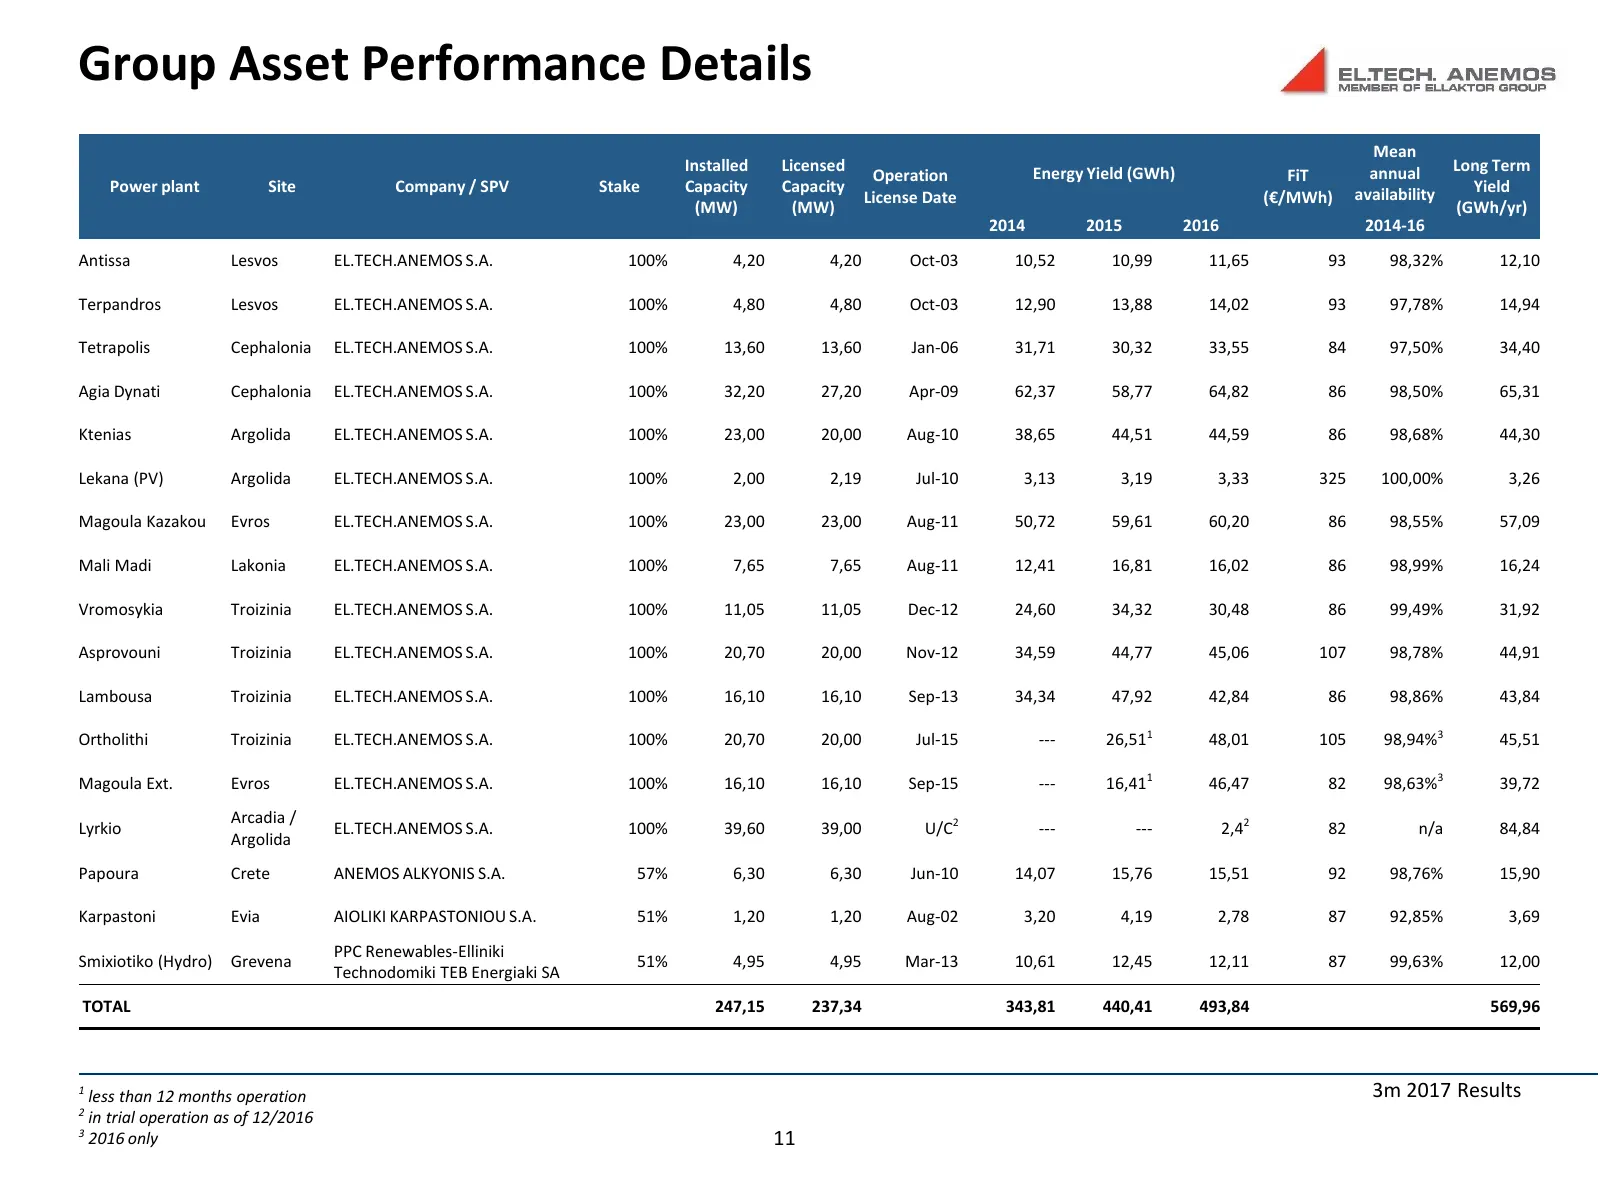
Group Asset Performance Details Mean Installed Licensed Energy Yield (GWh) annual Long Term Operation FiT Power plant Site Company / SPV Stake Capacity Capacity availability Yield License Date (€/MWh) (MW) (MW) (GWh/yr) 2014 2015 2016 2014-16 Antissa Lesvos EL.TECH.ANEMOS S.A. 100% 4,20 4,20 Oct-03
Slide 12: Consolidated P&L
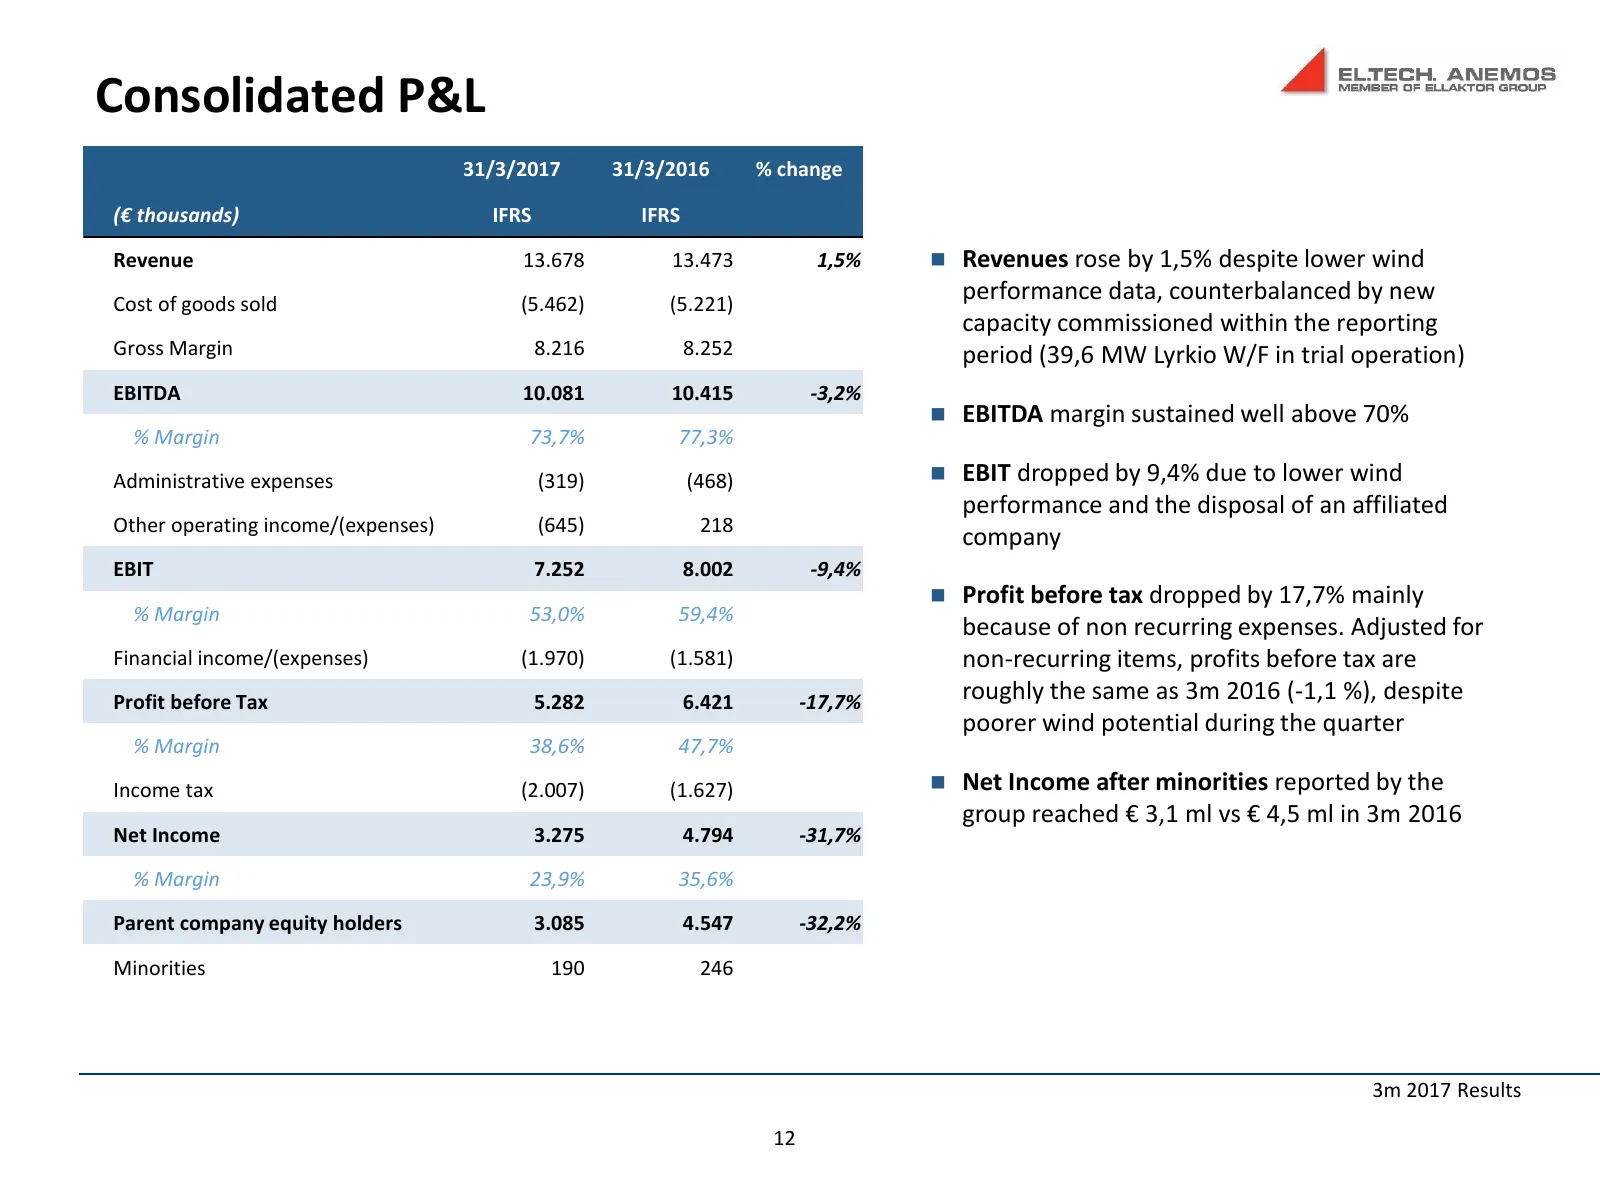
Consolidated P&L 31/3/2017 31/3/2016 % change (€ thousands) IFRS IFRS Revenue 13.678 13.473 1,5% Revenues rose by 1,5% despite lower wind Cost of goods sold (5.462) (5.221) performance data, counterbalanced by new capacity commissioned within the reporting Gross Margin 8.216 8.252 period (39,6 ΜW
Slide 13: Consolidated Balance Sheet
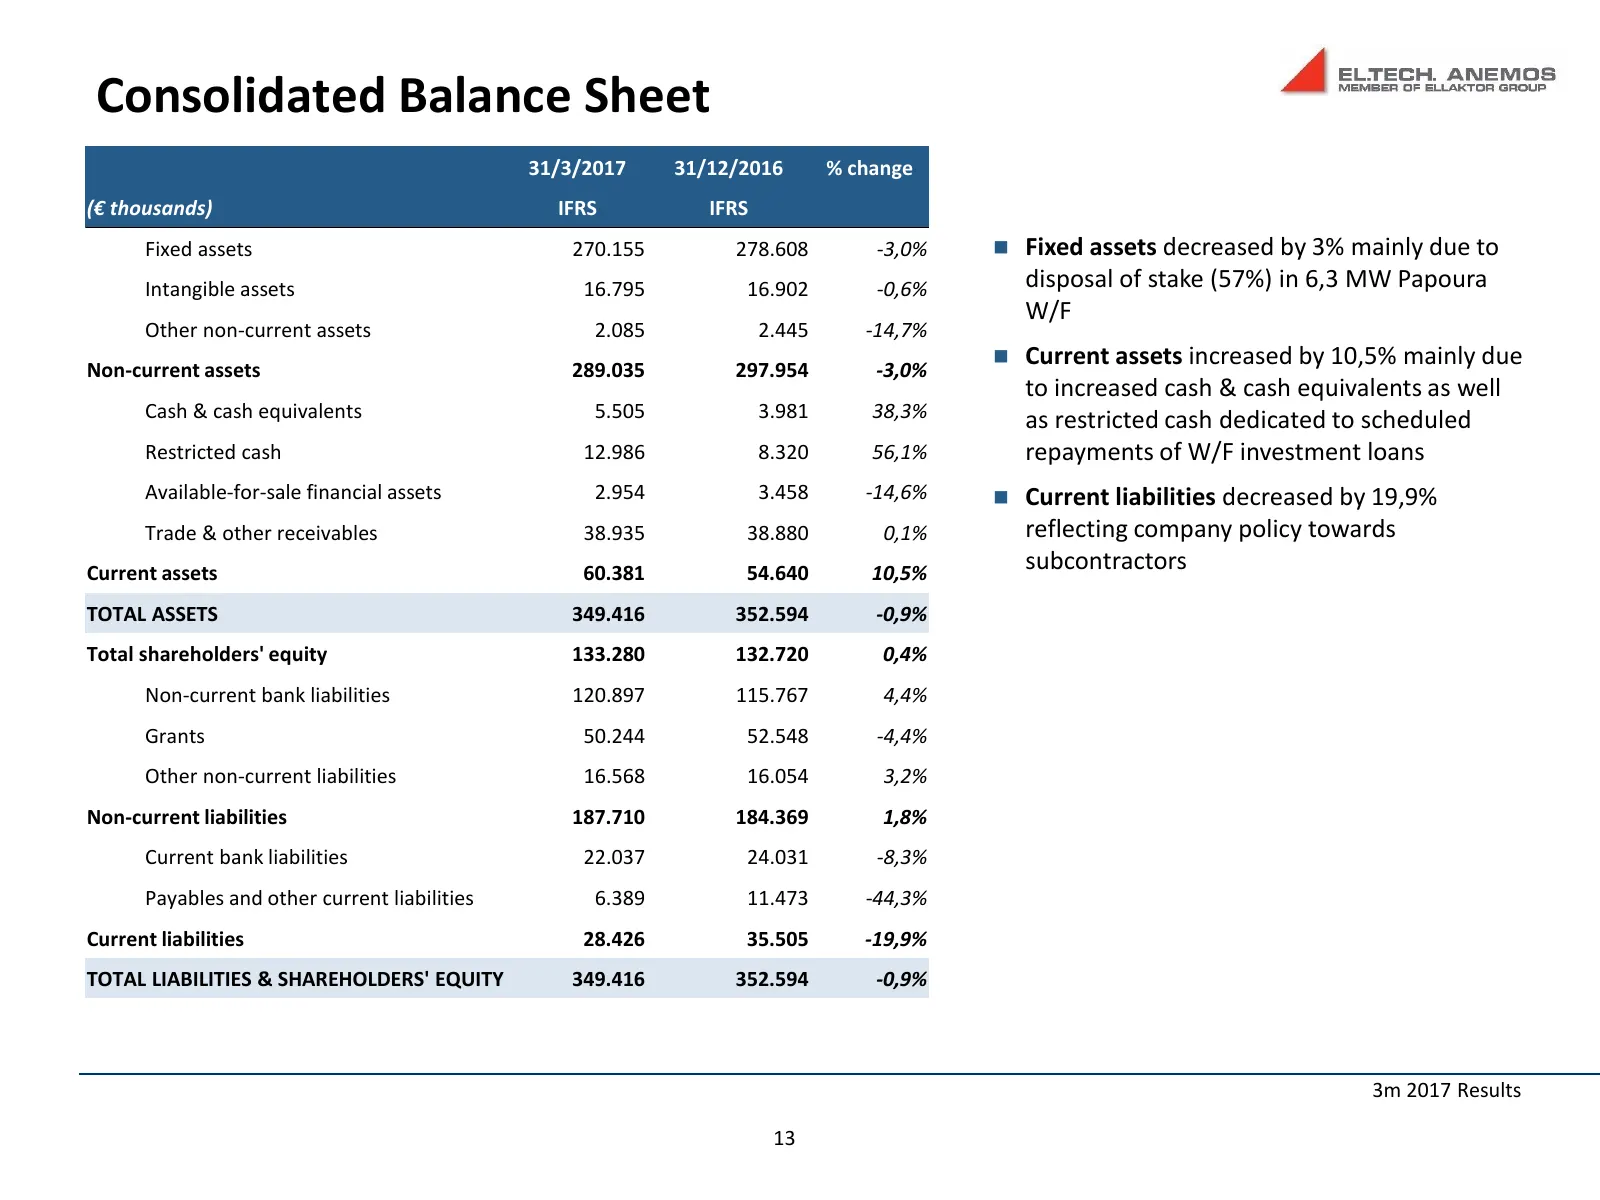
Consolidated Balance Sheet 31/3/2017 31/12/2016 % change (€ thousands) IFRS IFRS Fixed assets 270.155 278.608 -3,0% Fixed assets decreased by 3% mainly due to Intangible assets 16.795 16.902 -0,6% disposal of stake (57%) in 6,3 ΜW Papoura W/F Other non-current assets 2.085 2.445 -14,7% Current a
Slide 14: Consolidated Cash Flows
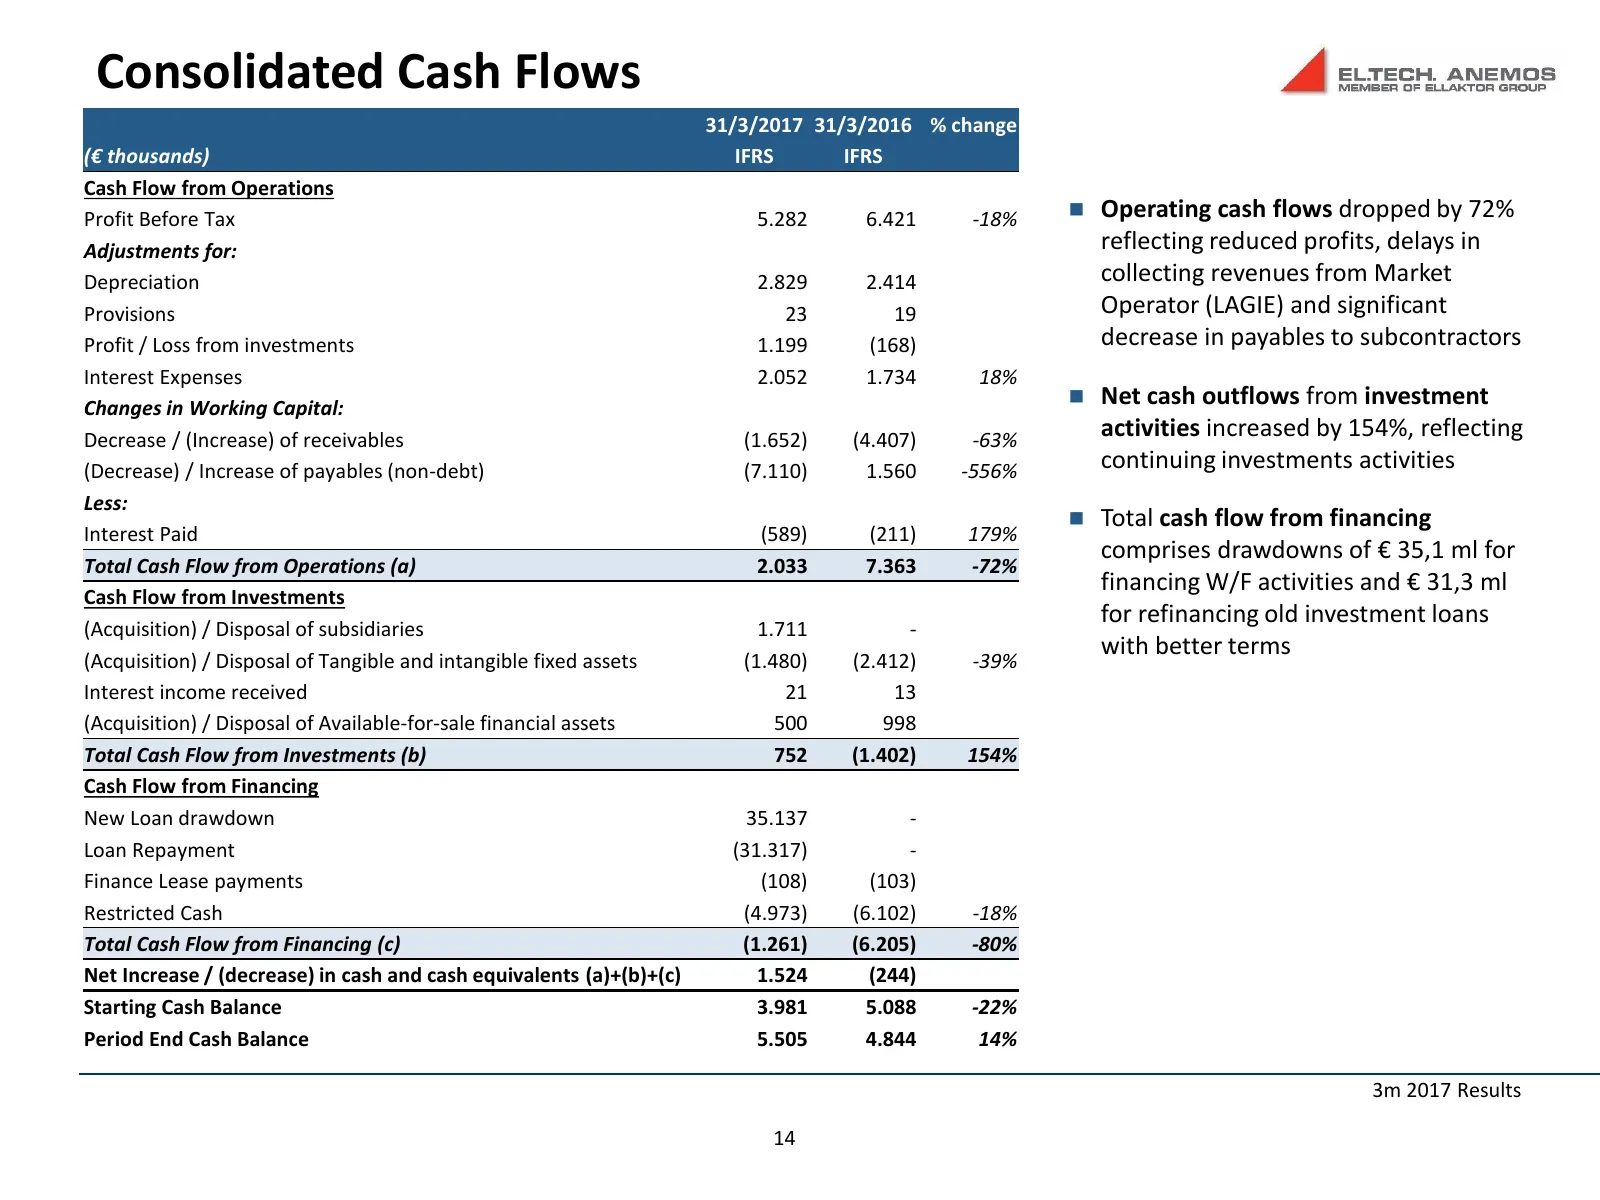
Consolidated Cash Flows 31/3/2017 31/3/2016 % change (€ thousands) IFRS IFRS Cash Flow from Operations Profit Before Tax 5.282 6.421 -18% Operating cash flows dropped by 72% Adjustments for: reflecting reduced profits, delays in Depreciation 2.829 2.414 collecting revenues from Market Provisions 2
Source: Internet Archive copy of ellaktor.com
More decks from Ellaktor SA
 FY2025 Earnings Presentation23 slides · Apr 17, 2026
 FY2024 Earnings Presentation30 slides · Apr 24, 2025
 H1 2024 Earnings Presentation30 slides · Sep 12, 2024
 FY2023 Earnings Presentation32 slides · Apr 18, 2024
 9M 2023 Earnings Presentation31 slides · Nov 23, 2023
 9M 2023 Earnings Presentation48 slides · November 2023