Freedom Financial Holdings Inc · OTC:FDVA
Freedom Financial — Shareholder Meeting (April 2023)
44 slides from Freedom Financial's shareholder meeting presentation, Apr 27, 2023
Slide 1: 2022 Annual Shareholders Meeting
2022 Annual Shareholders Meeting April 27, 2023 Joseph J. Thomas - President & CEO 1
Slide 2: Disclosure
Disclosure This presentation contains forward-looking statements, including our expectations with respect to future events that are subject to various risks and uncertainties. Factors that could cause actual results to differ materially from management's projections, forecasts, estimates, and expect
Slide 3: Agenda
Agenda Company Overview Management, Model & Market Results for Q1 2023 and FY 2022 Investment Summary 3
Slide 4: Our Company
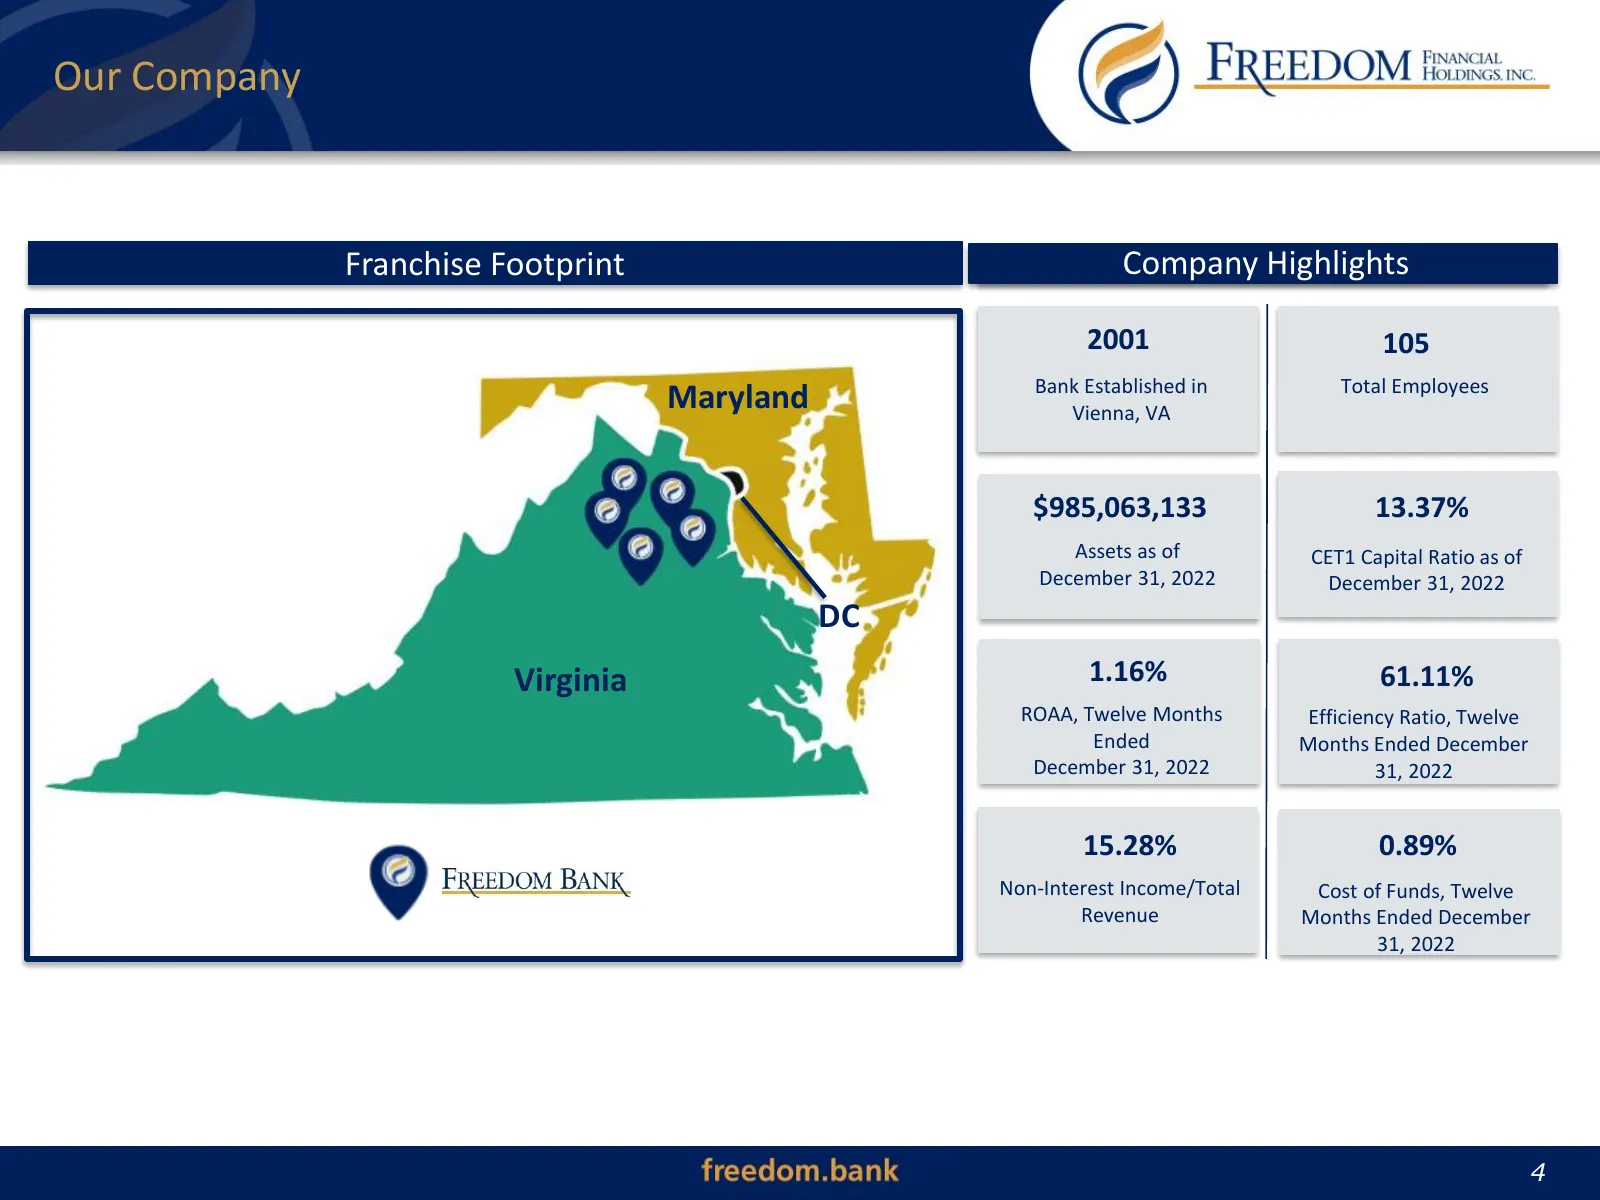
Our Company Franchise Footprint CompanyOverview Company Highlights 2001 105 Bank Established in Total Employees Maryland Vienna, VA $985,063,133 13.37% Assets as of CET1 Capital Ratio as of December 31, 2022 December 31, 2022 DC Virginia 1.16% 61.11% ROAA, Twelve Months Efficiency Ratio, Twelve Ende
Slide 5: Top Quartile Profitability Amongst Peers
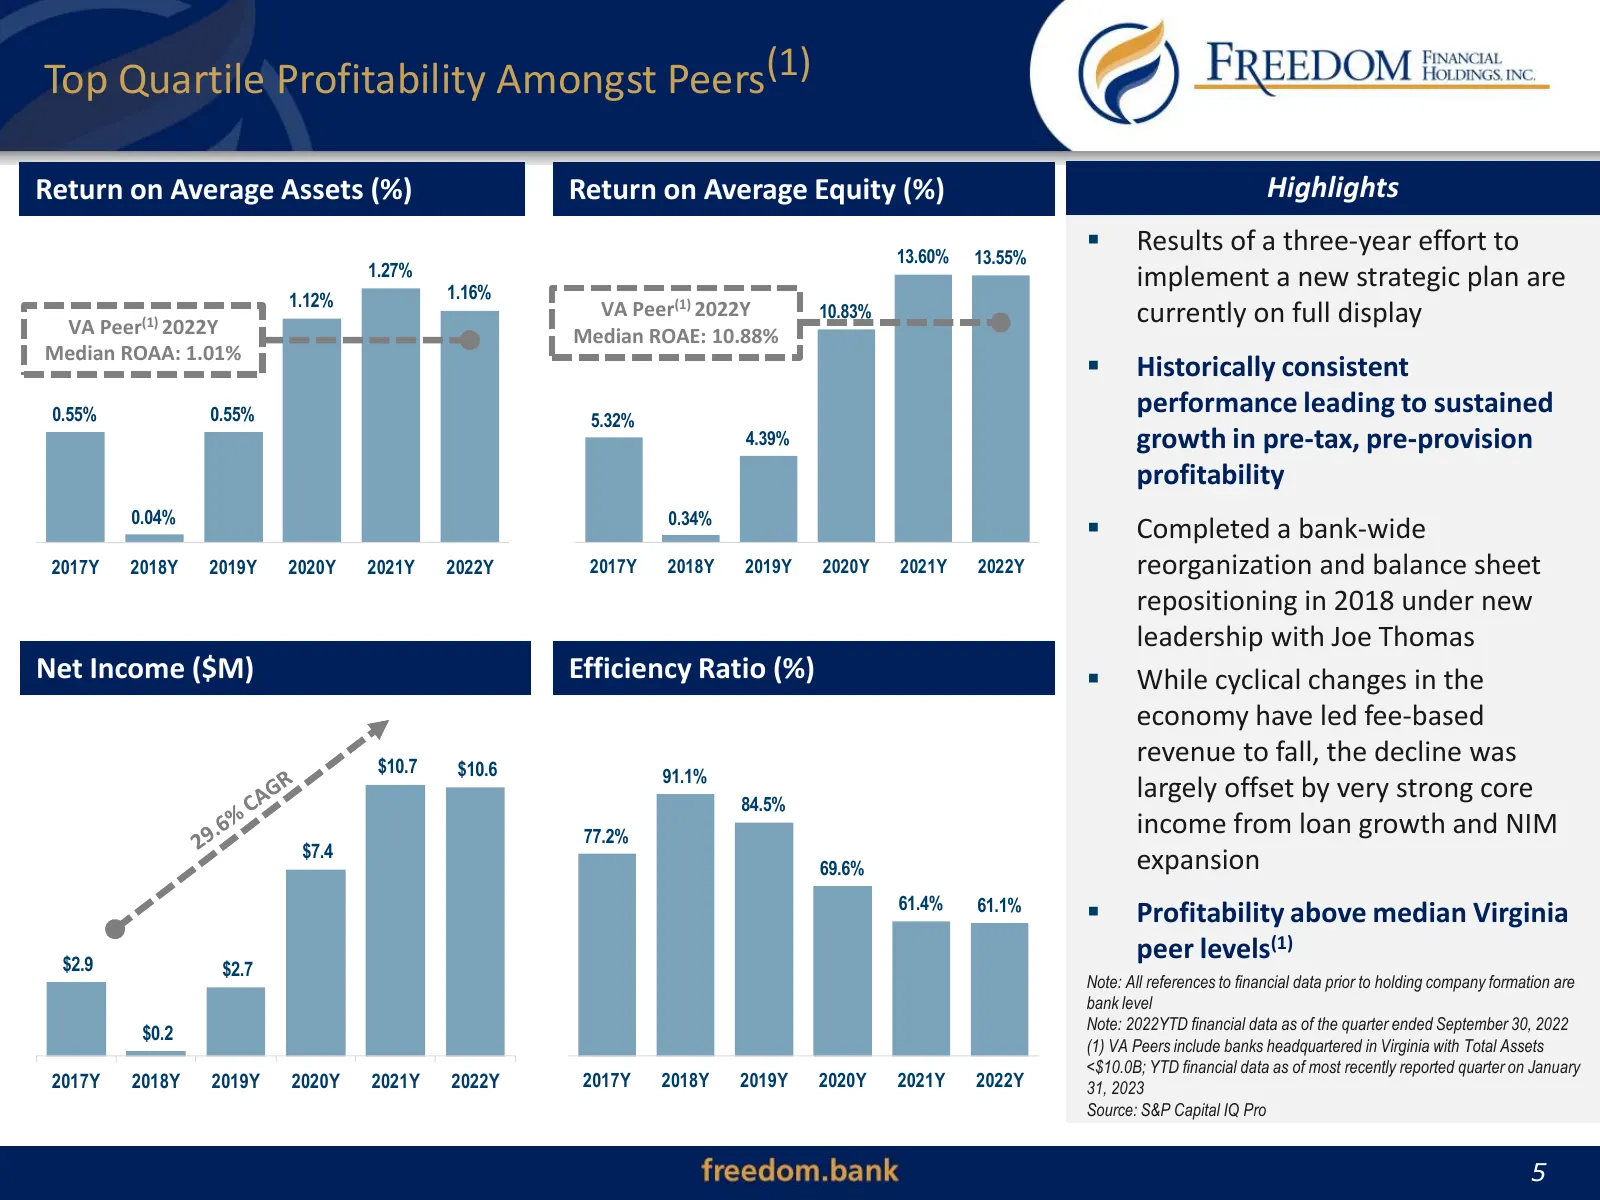
Top Quartile Profitability Amongst Peers(1) Return on Average Assets (%) Return on Average Equity (%) Highlights 13.60% 13.55% ▪ Results of a three-year effort to 1.27% implement a new strategic plan are 1.12% 1.16% VA Peer(1) 2022Y 10.83% currently on full display VA Peer(1) 2022Y Median ROAE: 10.8
Slide 6: Freedom Bank is Safe and Sound
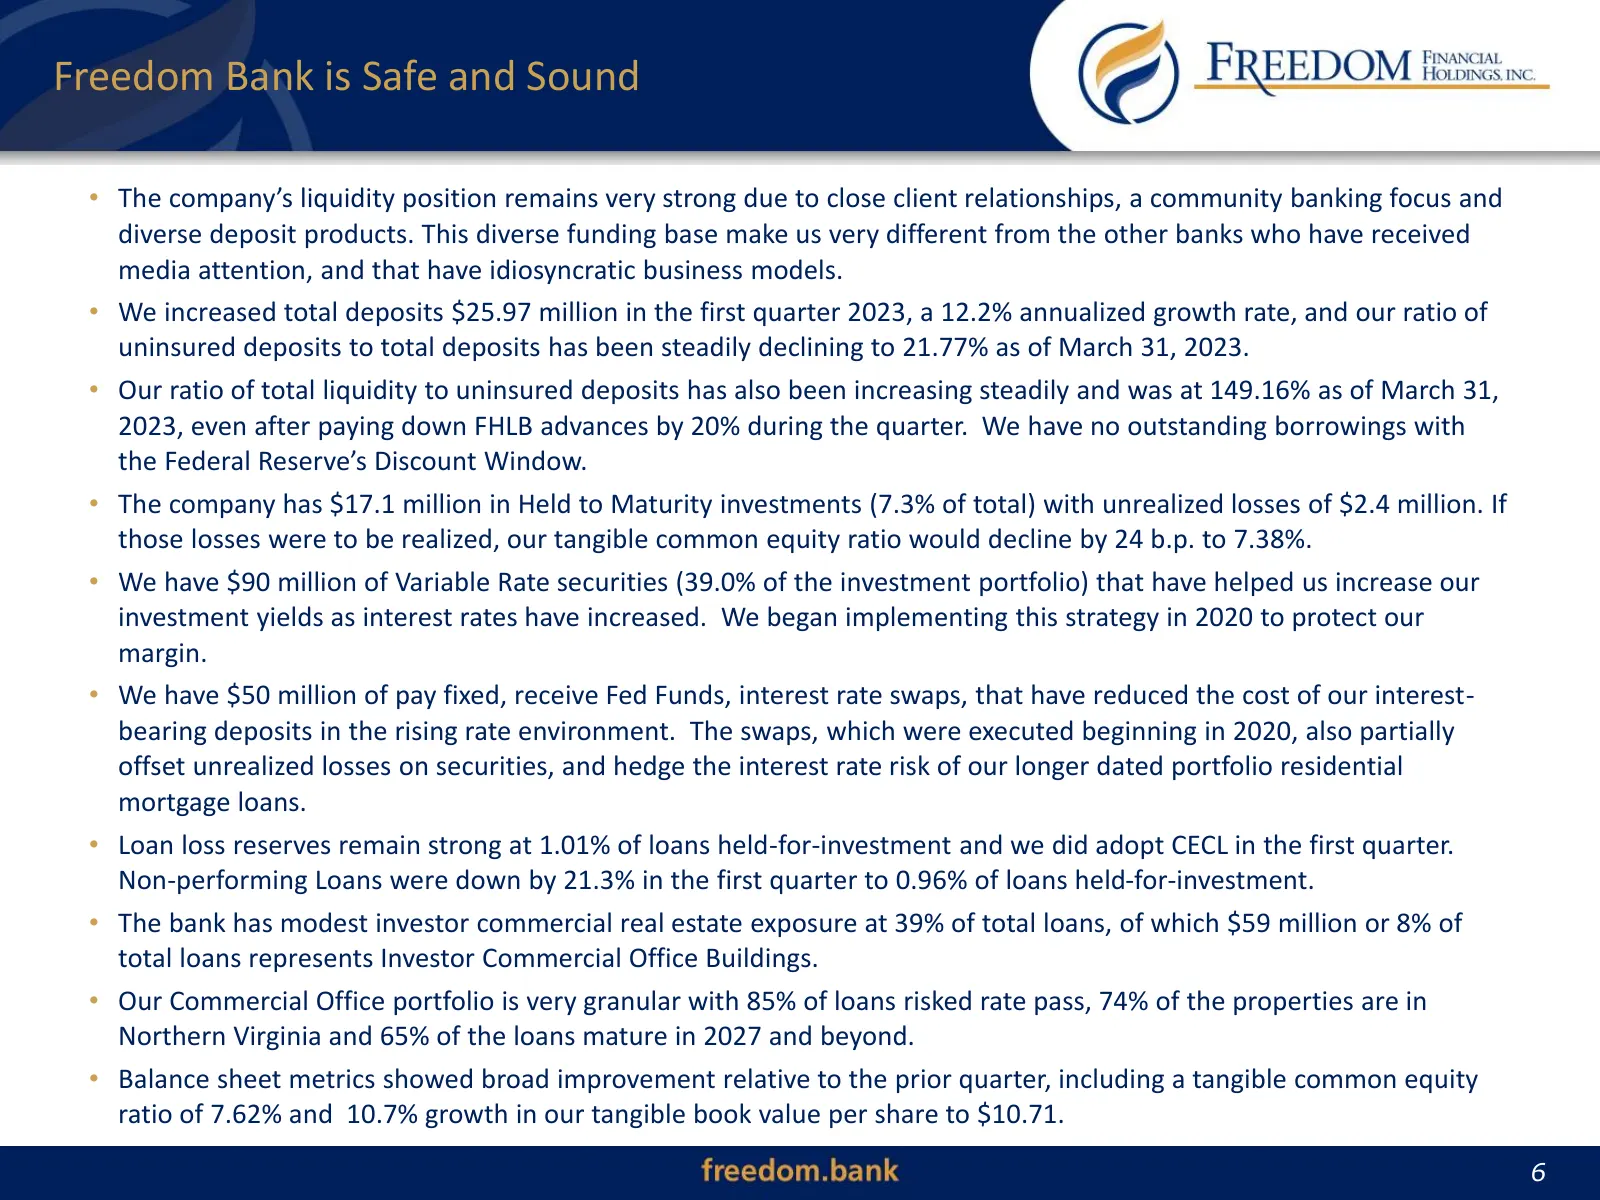
Freedom Bank is Safe and Sound • The company’s liquidity position remains very strong due to close client relationships, a community banking focus and diverse deposit products. This diverse funding base make us very different from the other banks who have received media attention, and that have idio
Slide 7: Investment Highlights
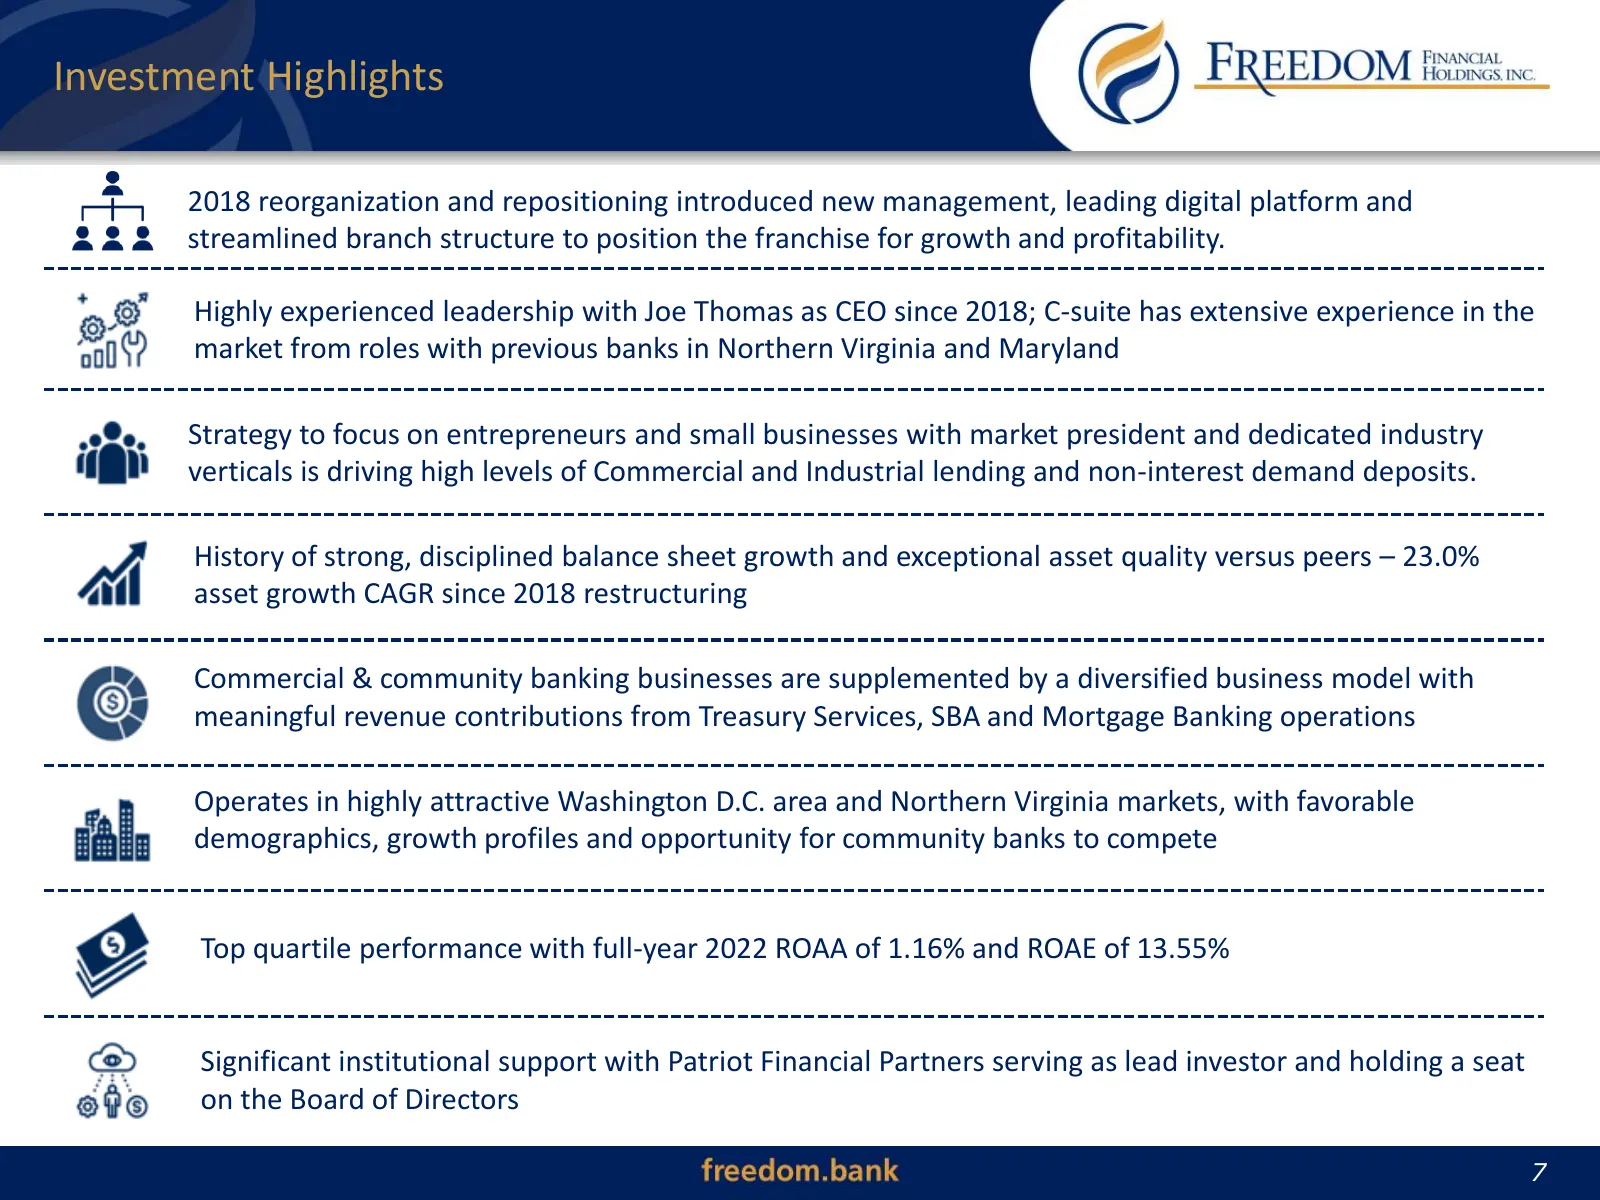
Investment Highlights ▪ 2018 reorganization and repositioning introduced new management, leading digital platform and streamlined branch structure to position the franchise for growth and profitability. ▪ Highly experienced leadership with Joe Thomas as CEO since 2018; C-suite has extensive experien
Slide 8: 2022 Accomplishments - Clients
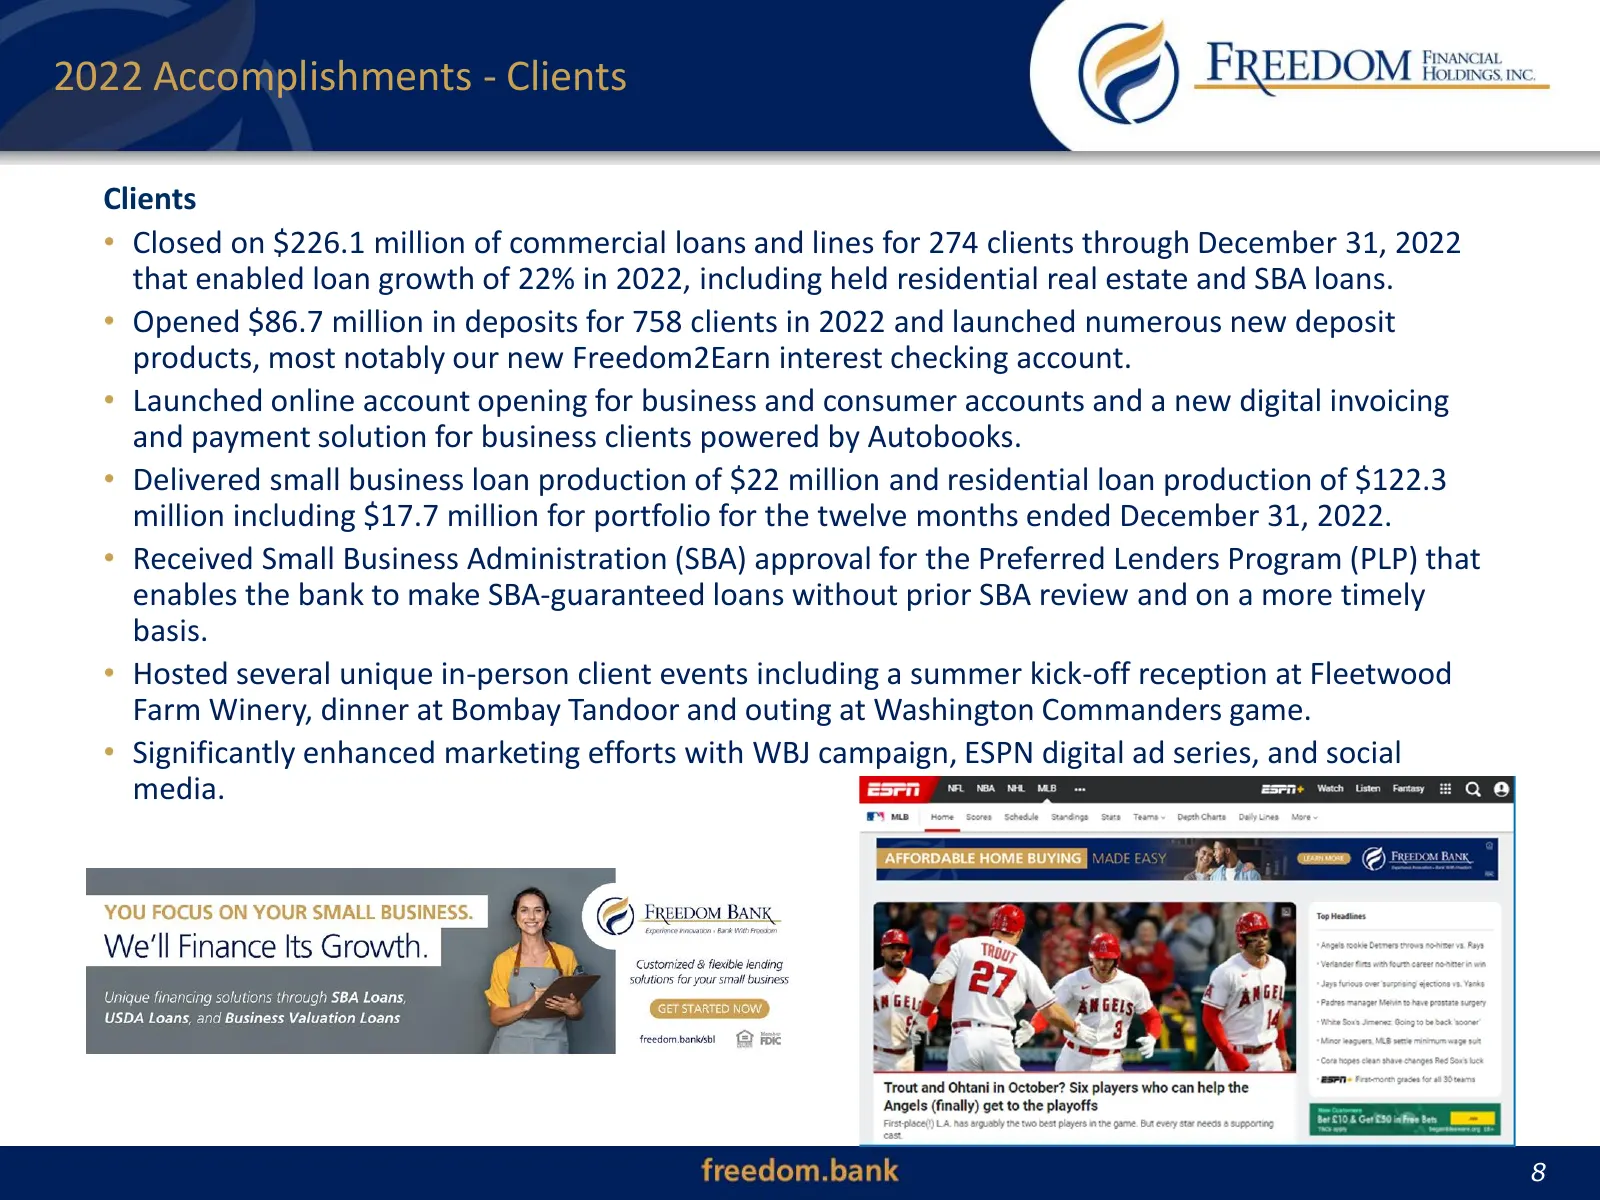
2022 Accomplishments - Clients Clients • Closed on $226.1 million of commercial loans and lines for 274 clients through December 31, 2022 that enabled loan growth of 22% in 2022, including held residential real estate and SBA loans. • Opened $86.7 million in deposits for 758 clients in 2022 and laun
Slide 9: 2022 Accomplishments - Colleagues
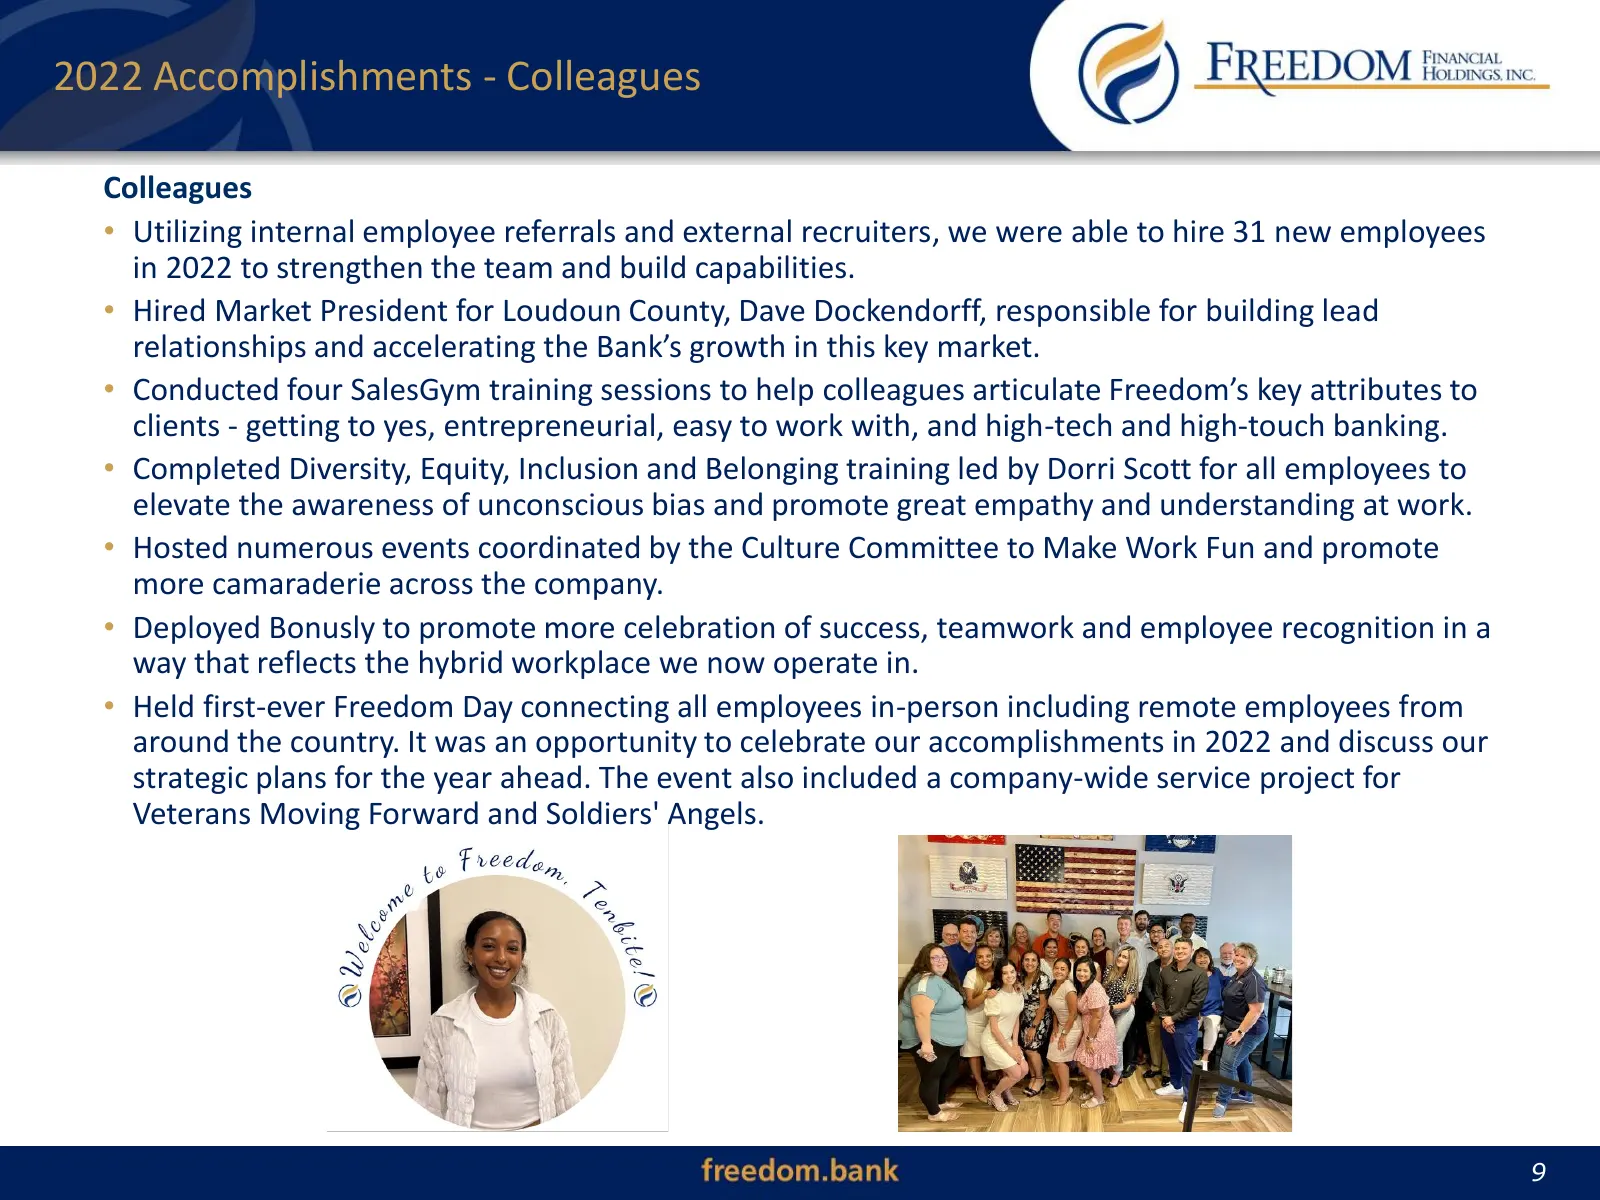
2022 Accomplishments - Colleagues Colleagues • Utilizing internal employee referrals and external recruiters, we were able to hire 31 new employees in 2022 to strengthen the team and build capabilities. • Hired Market President for Loudoun County, Dave Dockendorff, responsible for building lead rela
Slide 10: 2022 Accomplishments - Community
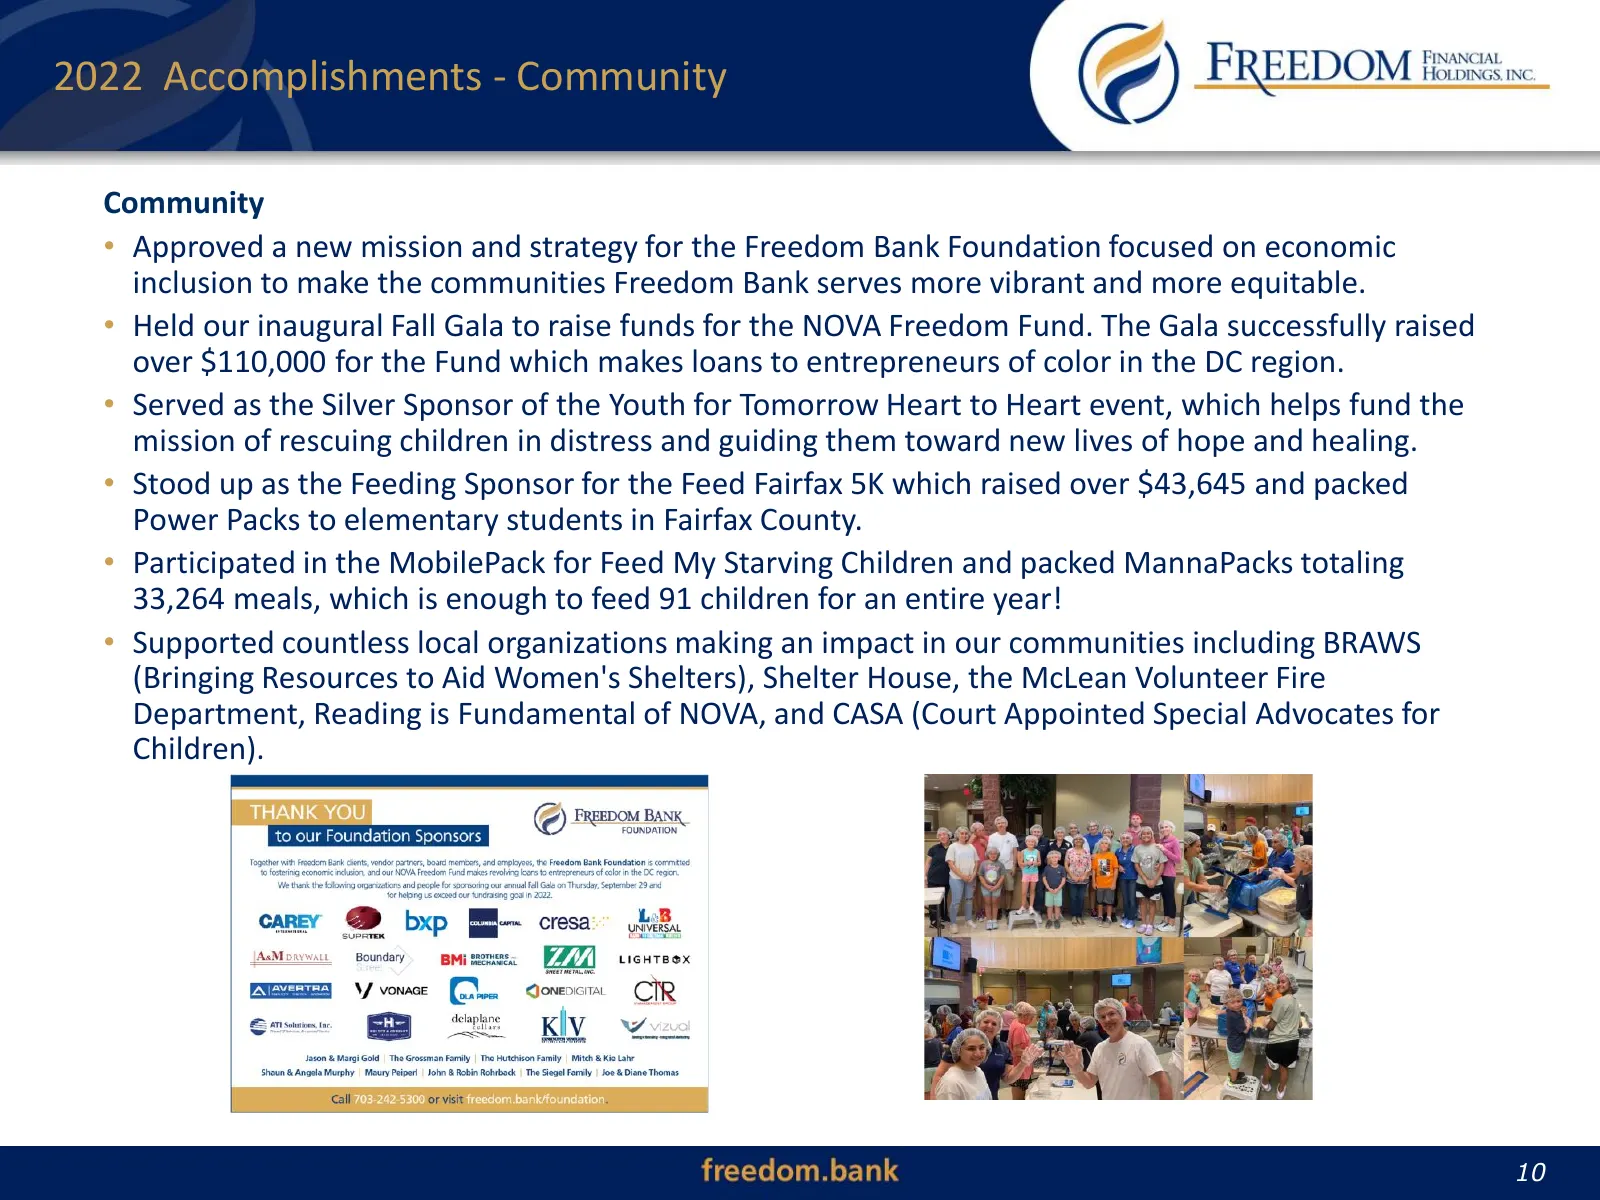
2022 Accomplishments - Community Community • Approved a new mission and strategy for the Freedom Bank Foundation focused on economic inclusion to make the communities Freedom Bank serves more vibrant and more equitable. • Held our inaugural Fall Gala to raise funds for the NOVA Freedom Fund. The Gal
Slide 11: 2022 Accomplishments - Brand
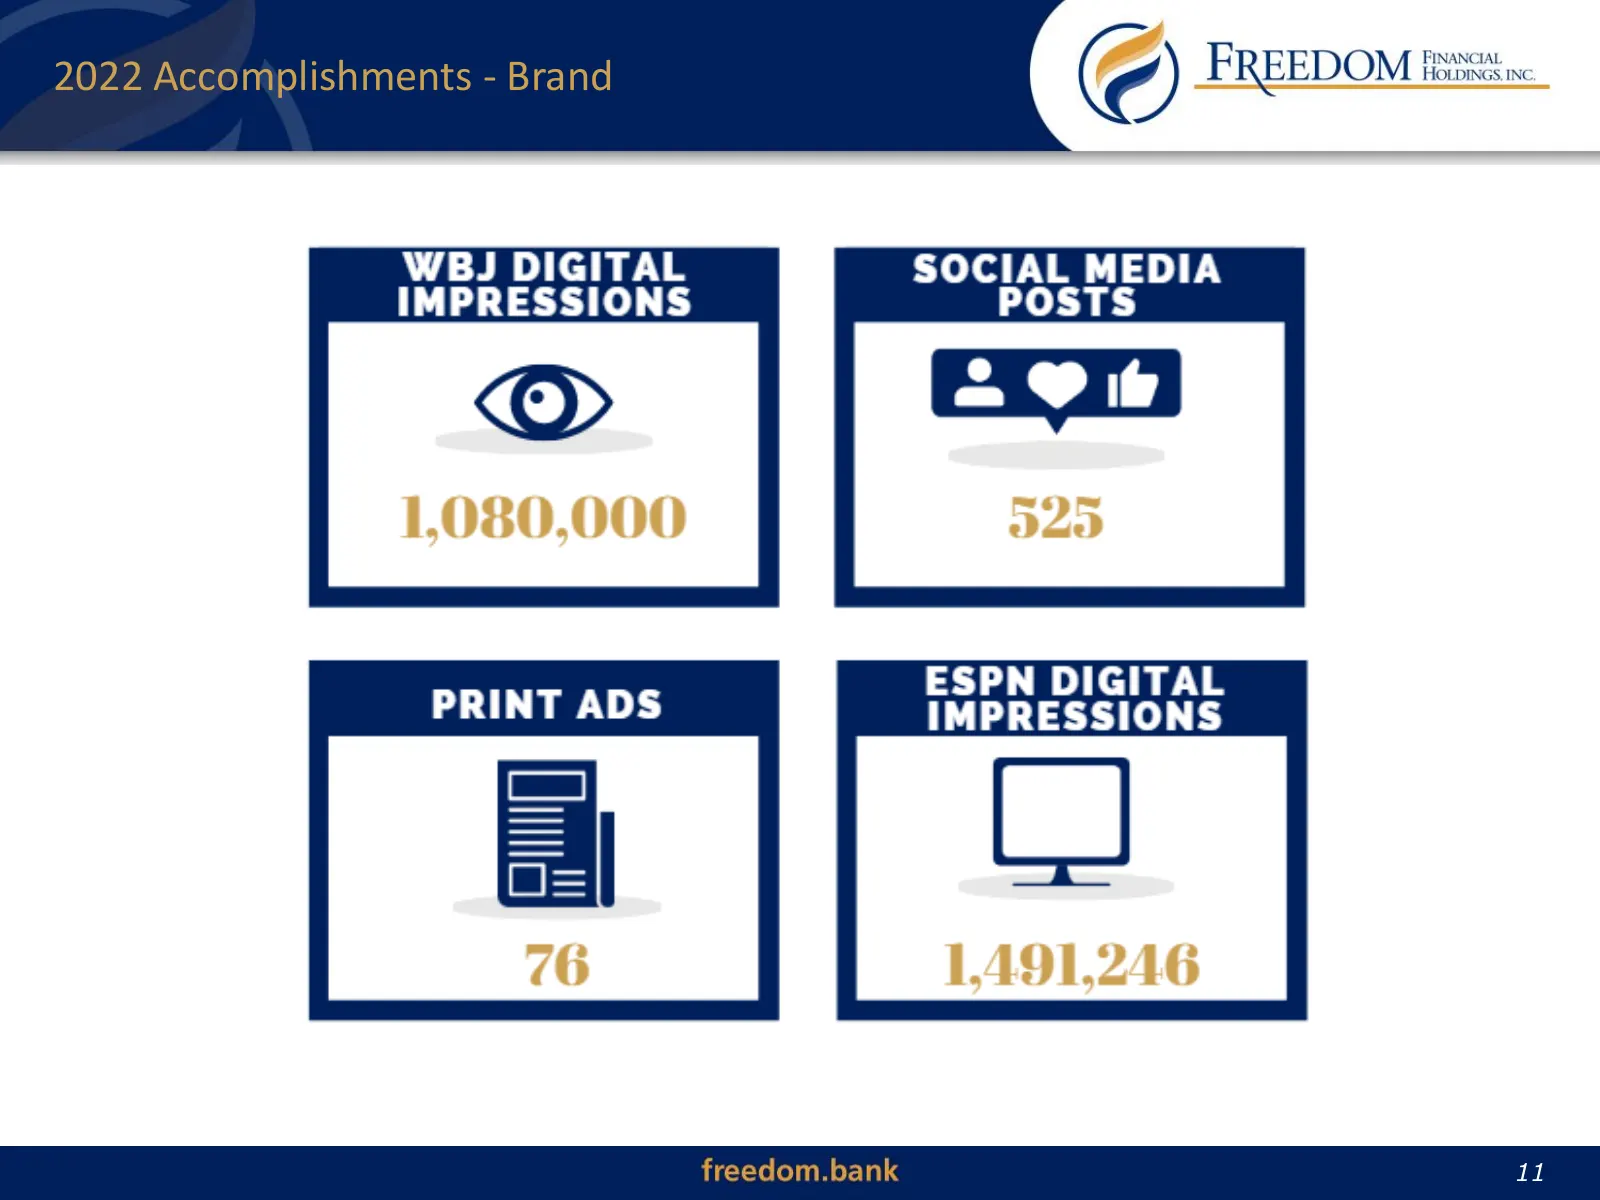
2022 Accomplishments - Brand 11 11
Slide 12: Management, Model & Market
Management, Model & Market 12
Slide 13: Board of Directors
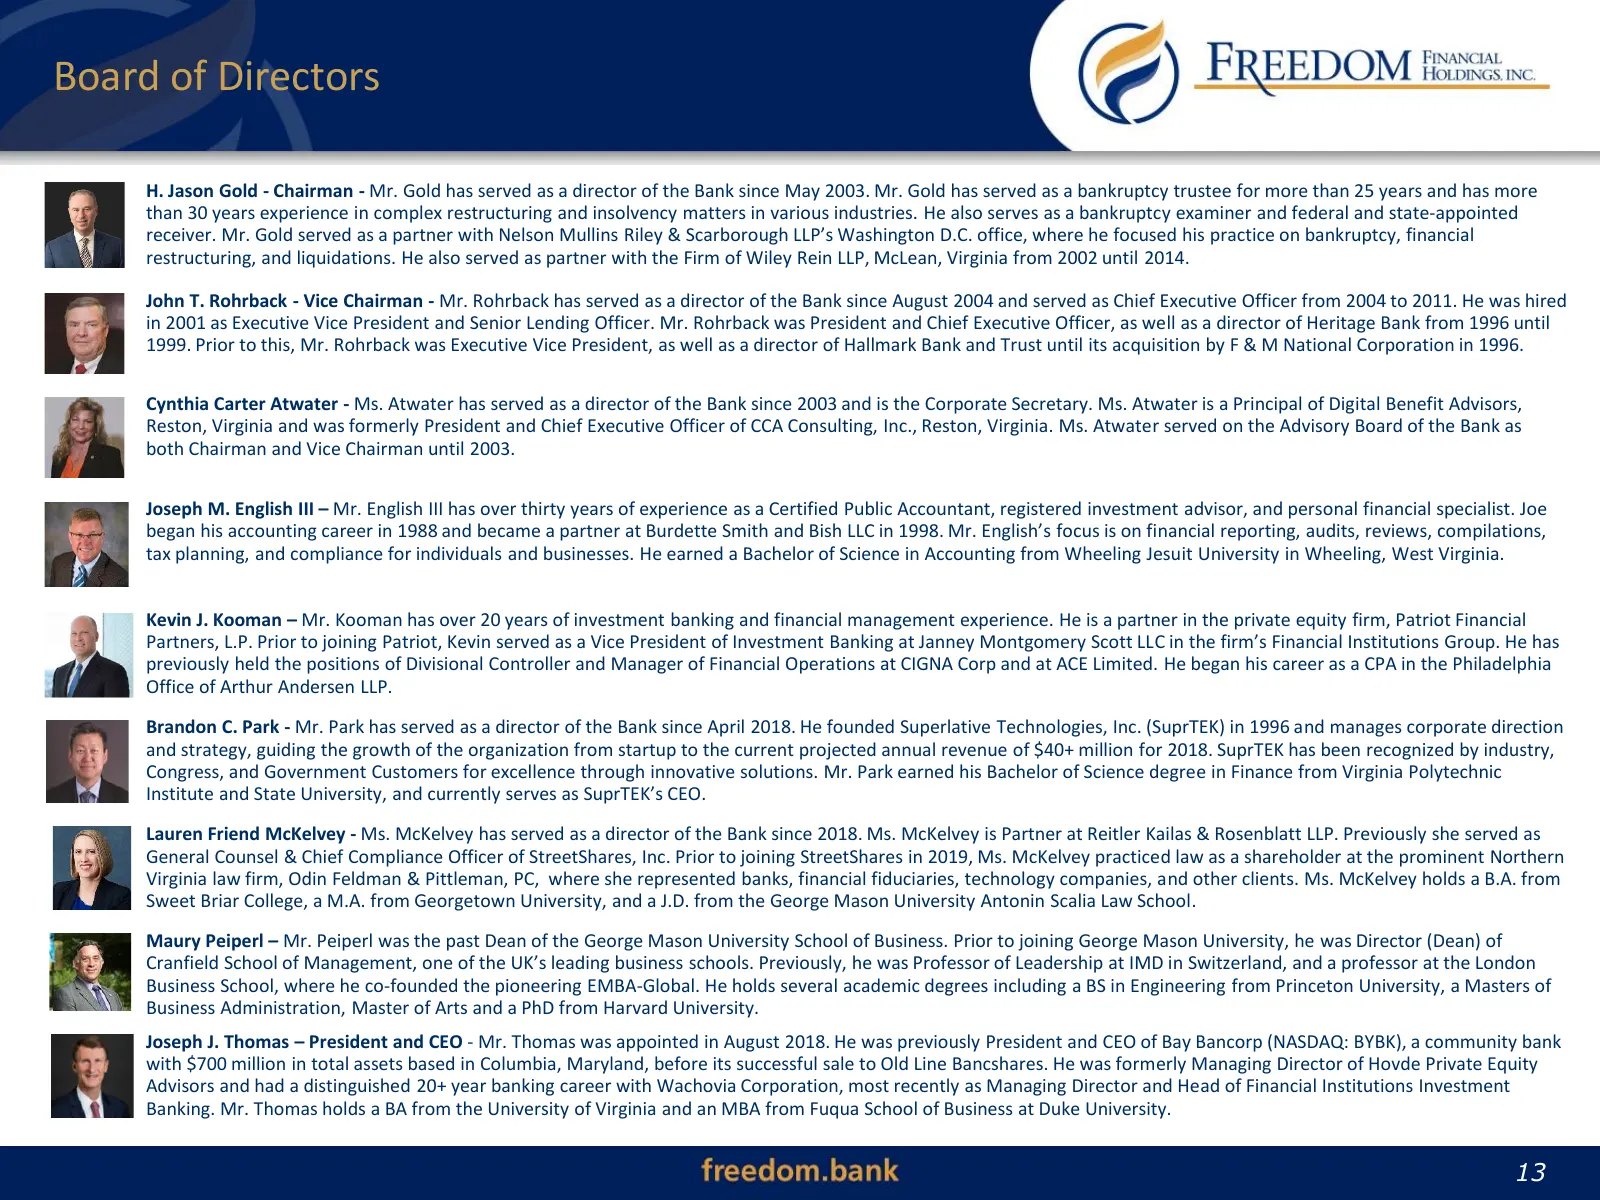
Board of Directors H. Jason Gold - Chairman - Mr. Gold has served as a director of the Bank since May 2003. Mr. Gold has served as a bankruptcy trustee for more than 25 years and has more than 30 years experience in complex restructuring and insolvency matters in various industries. He also serves a
Slide 14: Senior Management
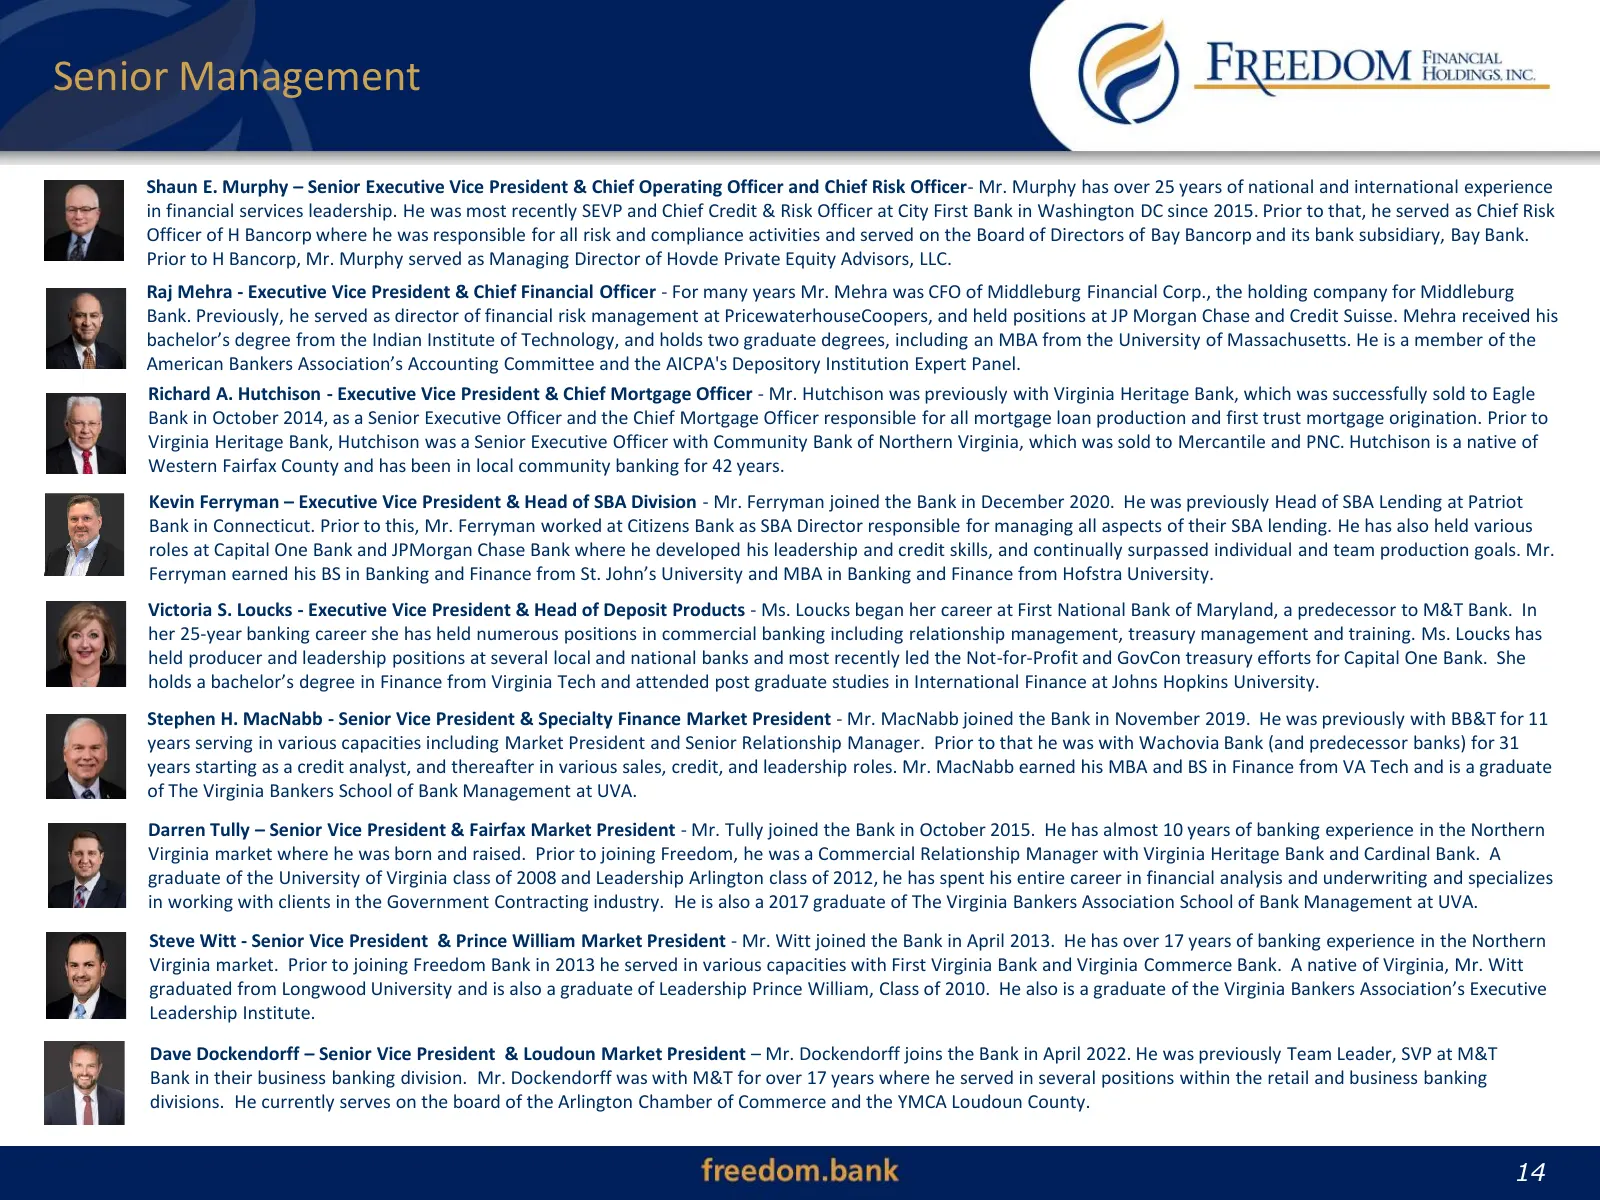
Senior Management Shaun E. Murphy – Senior Executive Vice President & Chief Operating Officer and Chief Risk Officer- Mr. Murphy has over 25 years of national and international experience in financial services leadership. He was most recently SEVP and Chief Credit & Risk Officer at City First Bank i
Slide 15: Business Lines
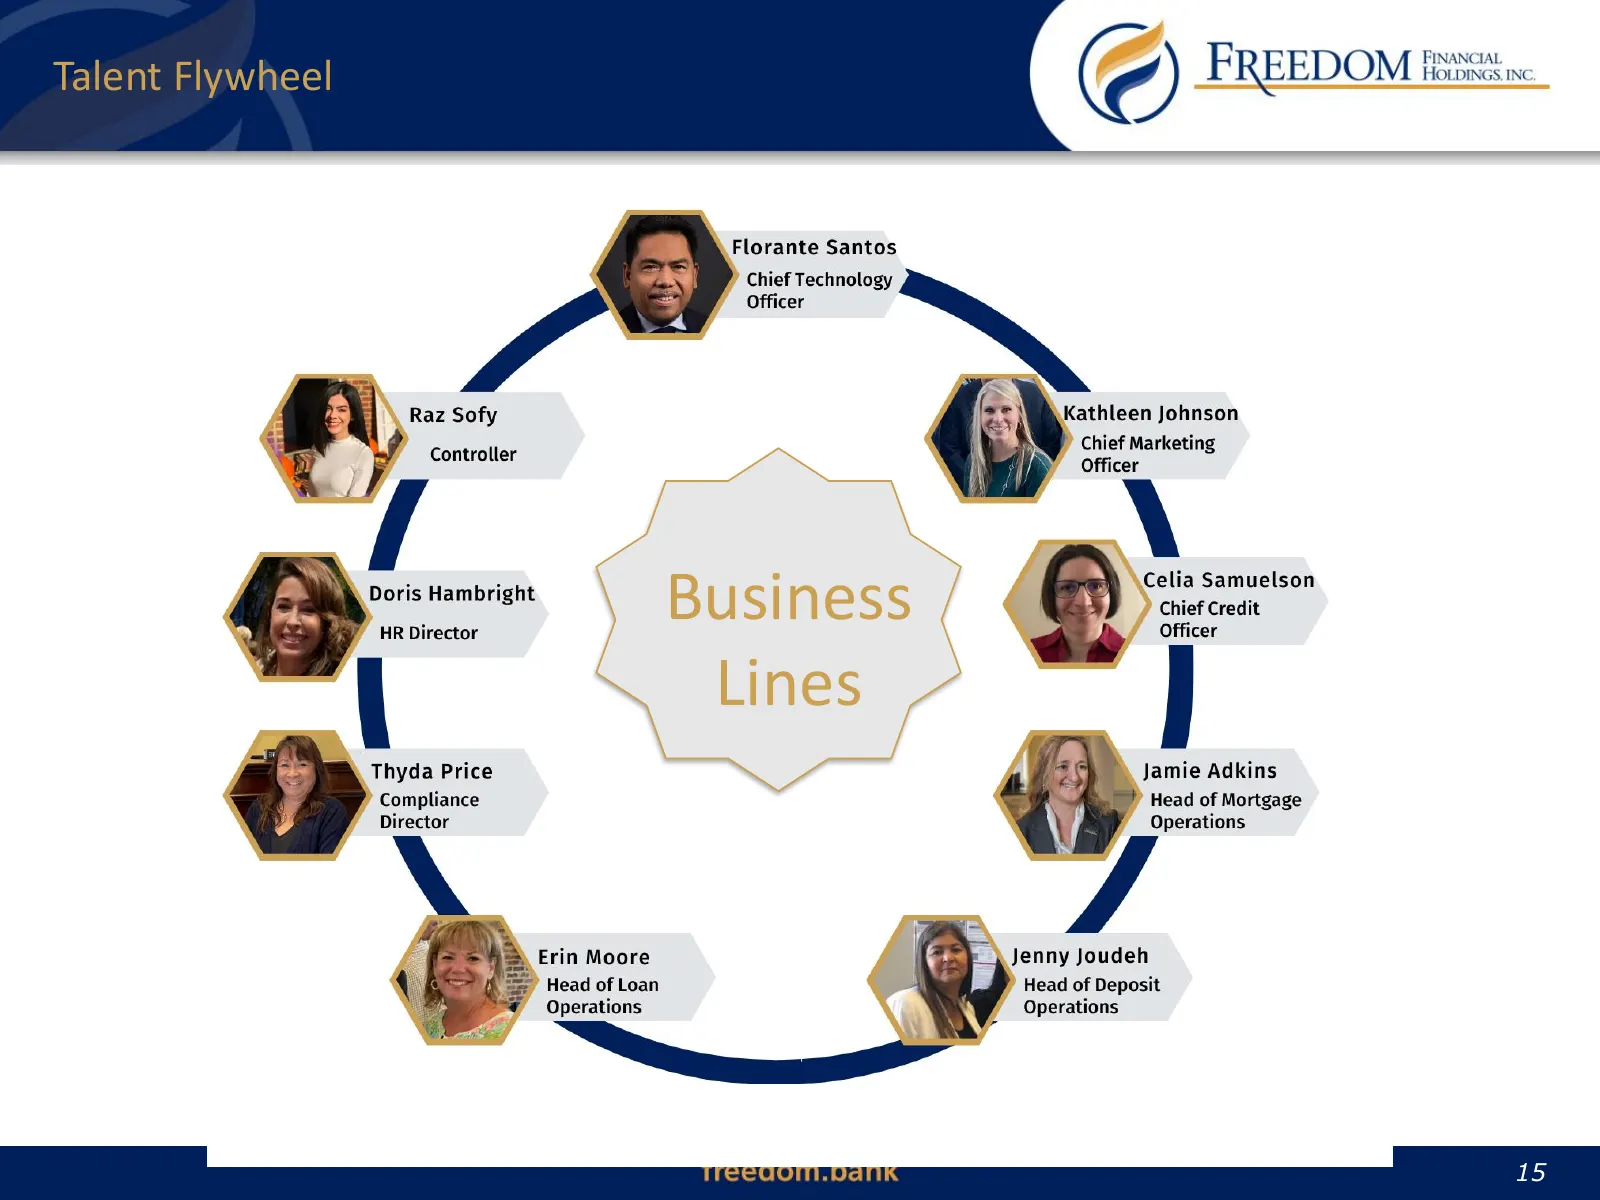
Talent Flywheel Business Lines 15 15
Slide 16: Diverse Business Lines
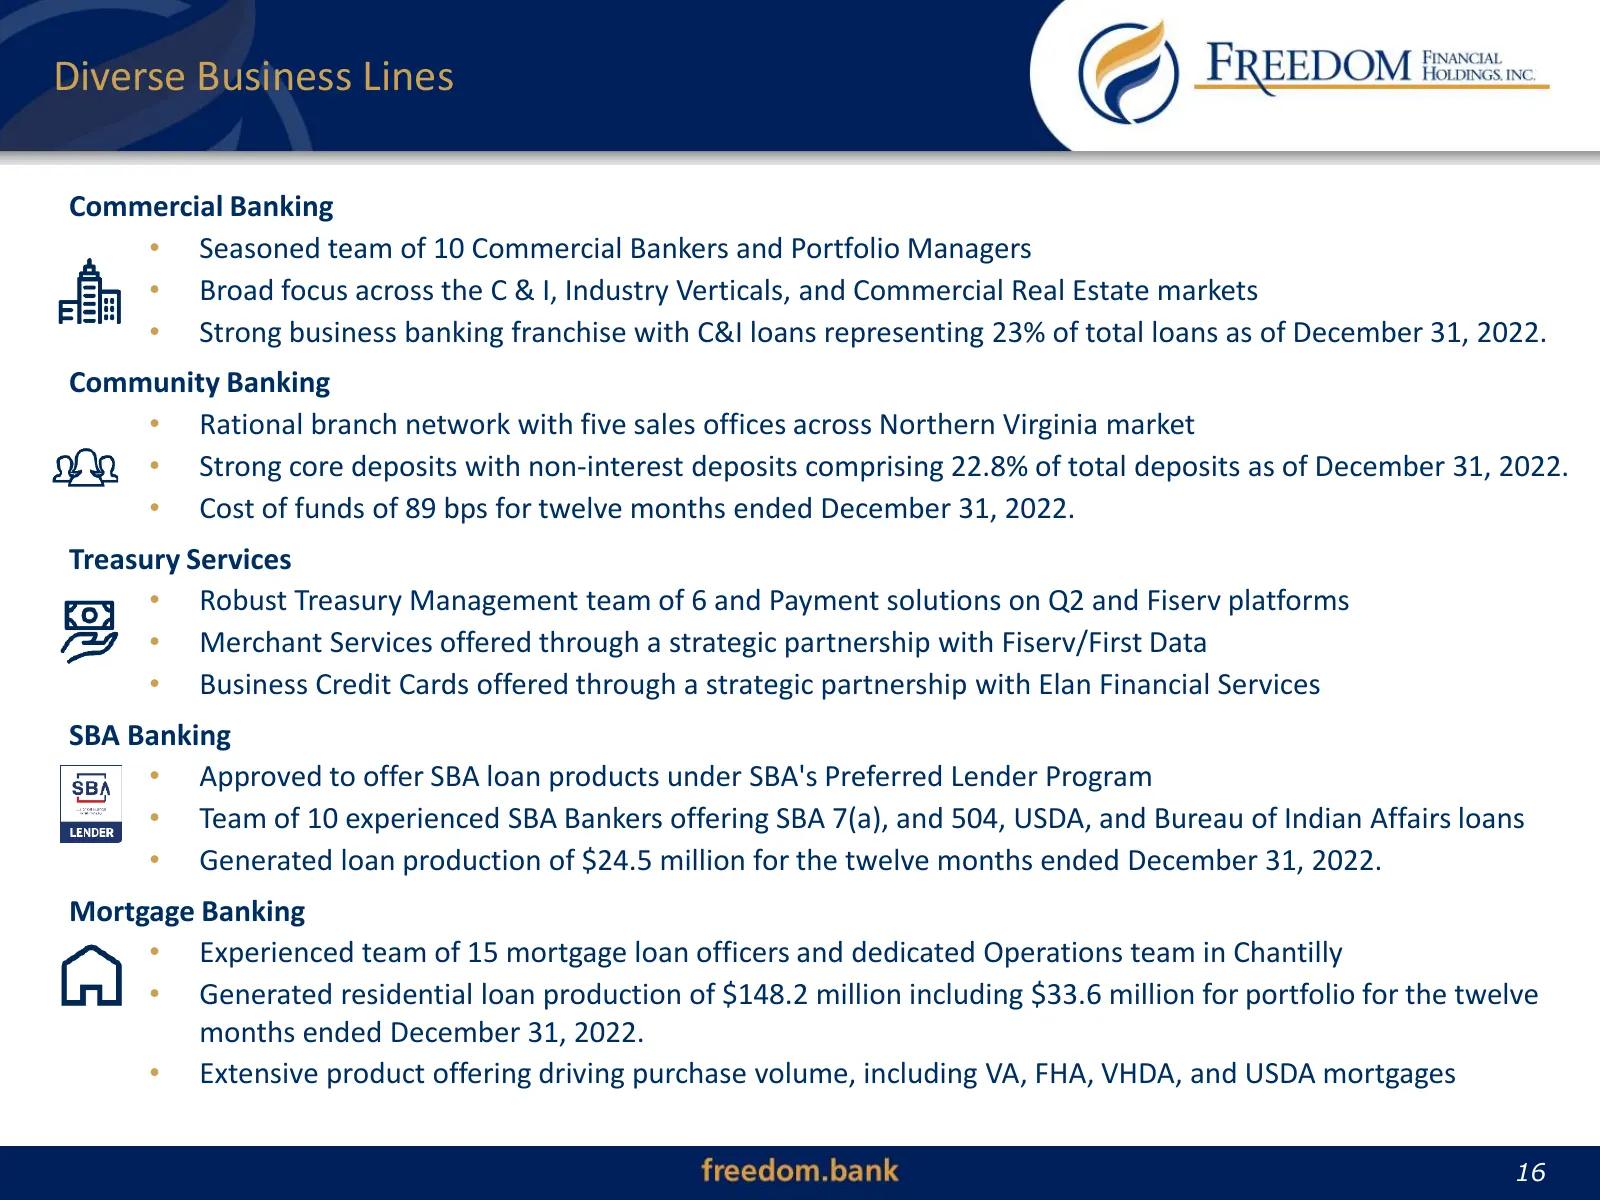
Diverse Business Lines Commercial Banking • Seasoned team of 10 Commercial Bankers and Portfolio Managers • Broad focus across the C & I, Industry Verticals, and Commercial Real Estate markets • Strong business banking franchise with C&I loans representing 23% of total loans as of December 31, 2022.
Slide 17: Technology Enabled Businesses
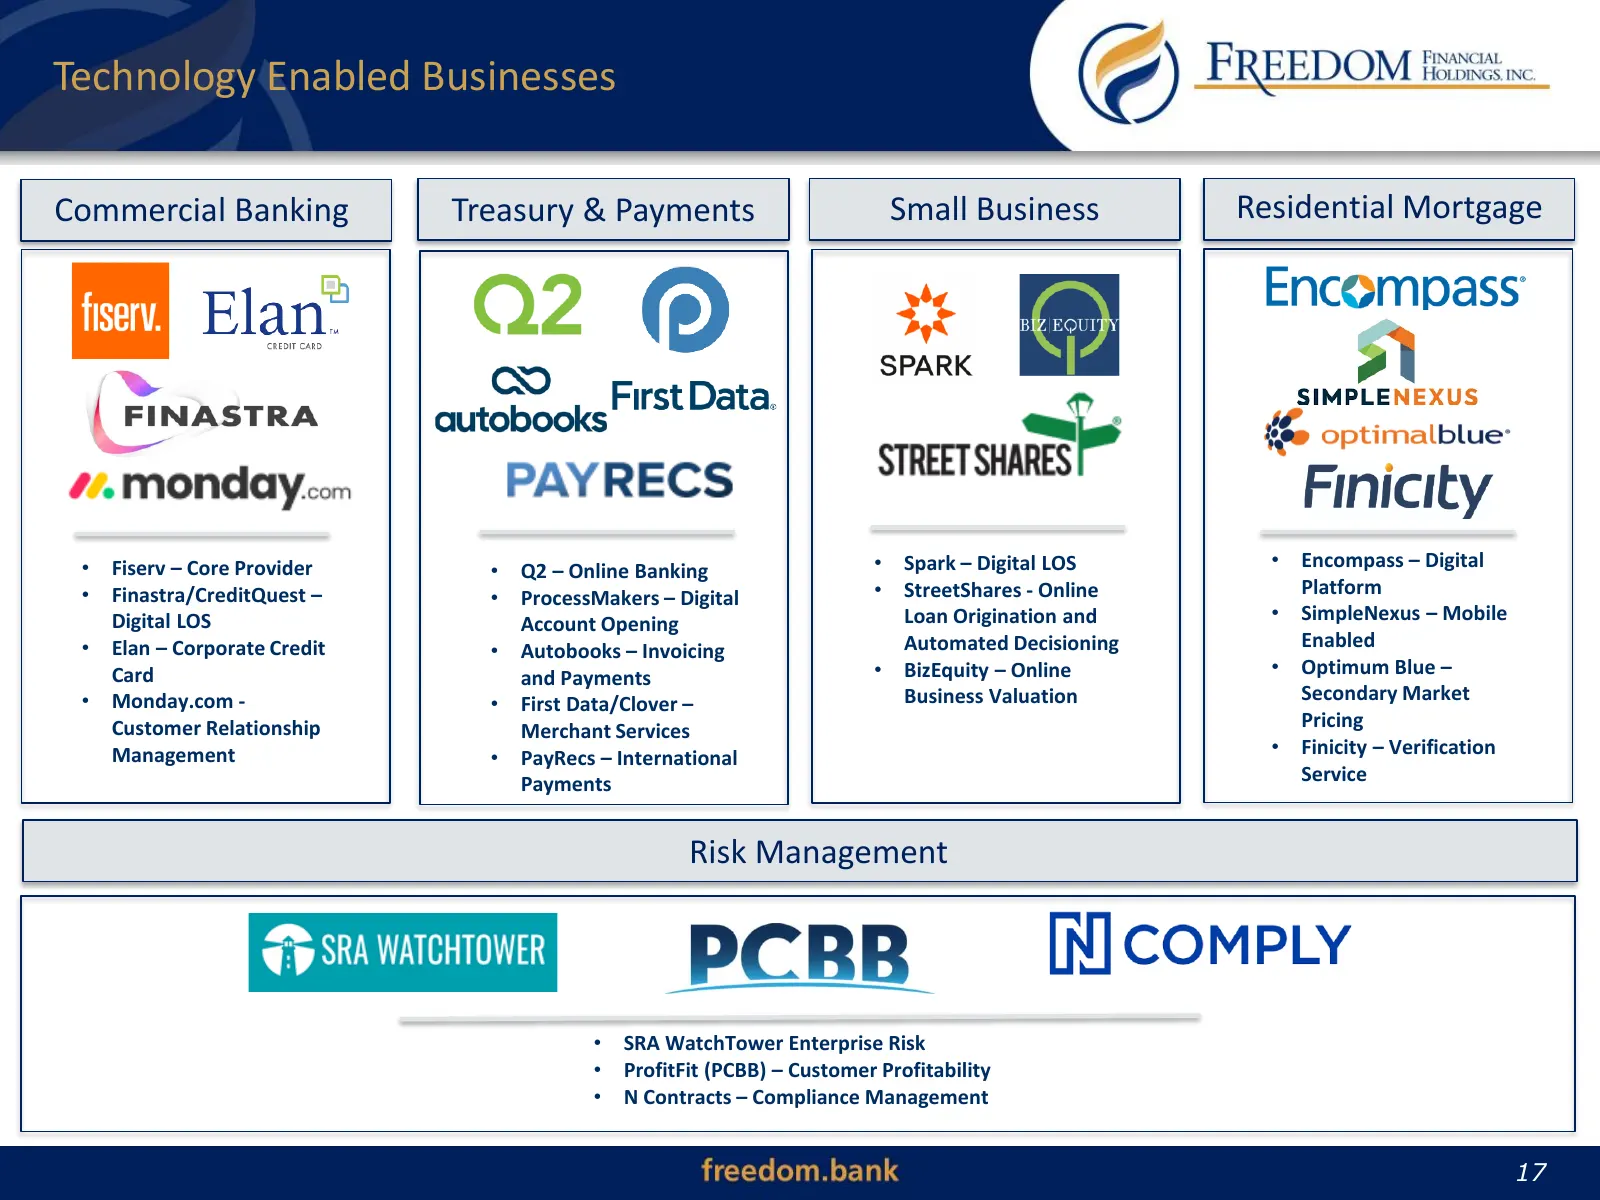
Technology Enabled Businesses Commercial Banking Treasury & Payments Small Business Residential Mortgage • Fiserv – Core Provider • Q2 – Online Banking • Spark – Digital LOS • Encompass – Digital • Finastra/CreditQuest – • ProcessMakers – Digital • StreetShares - Online Platform Digital LOS Account
Slide 18: 2022 Client Successes
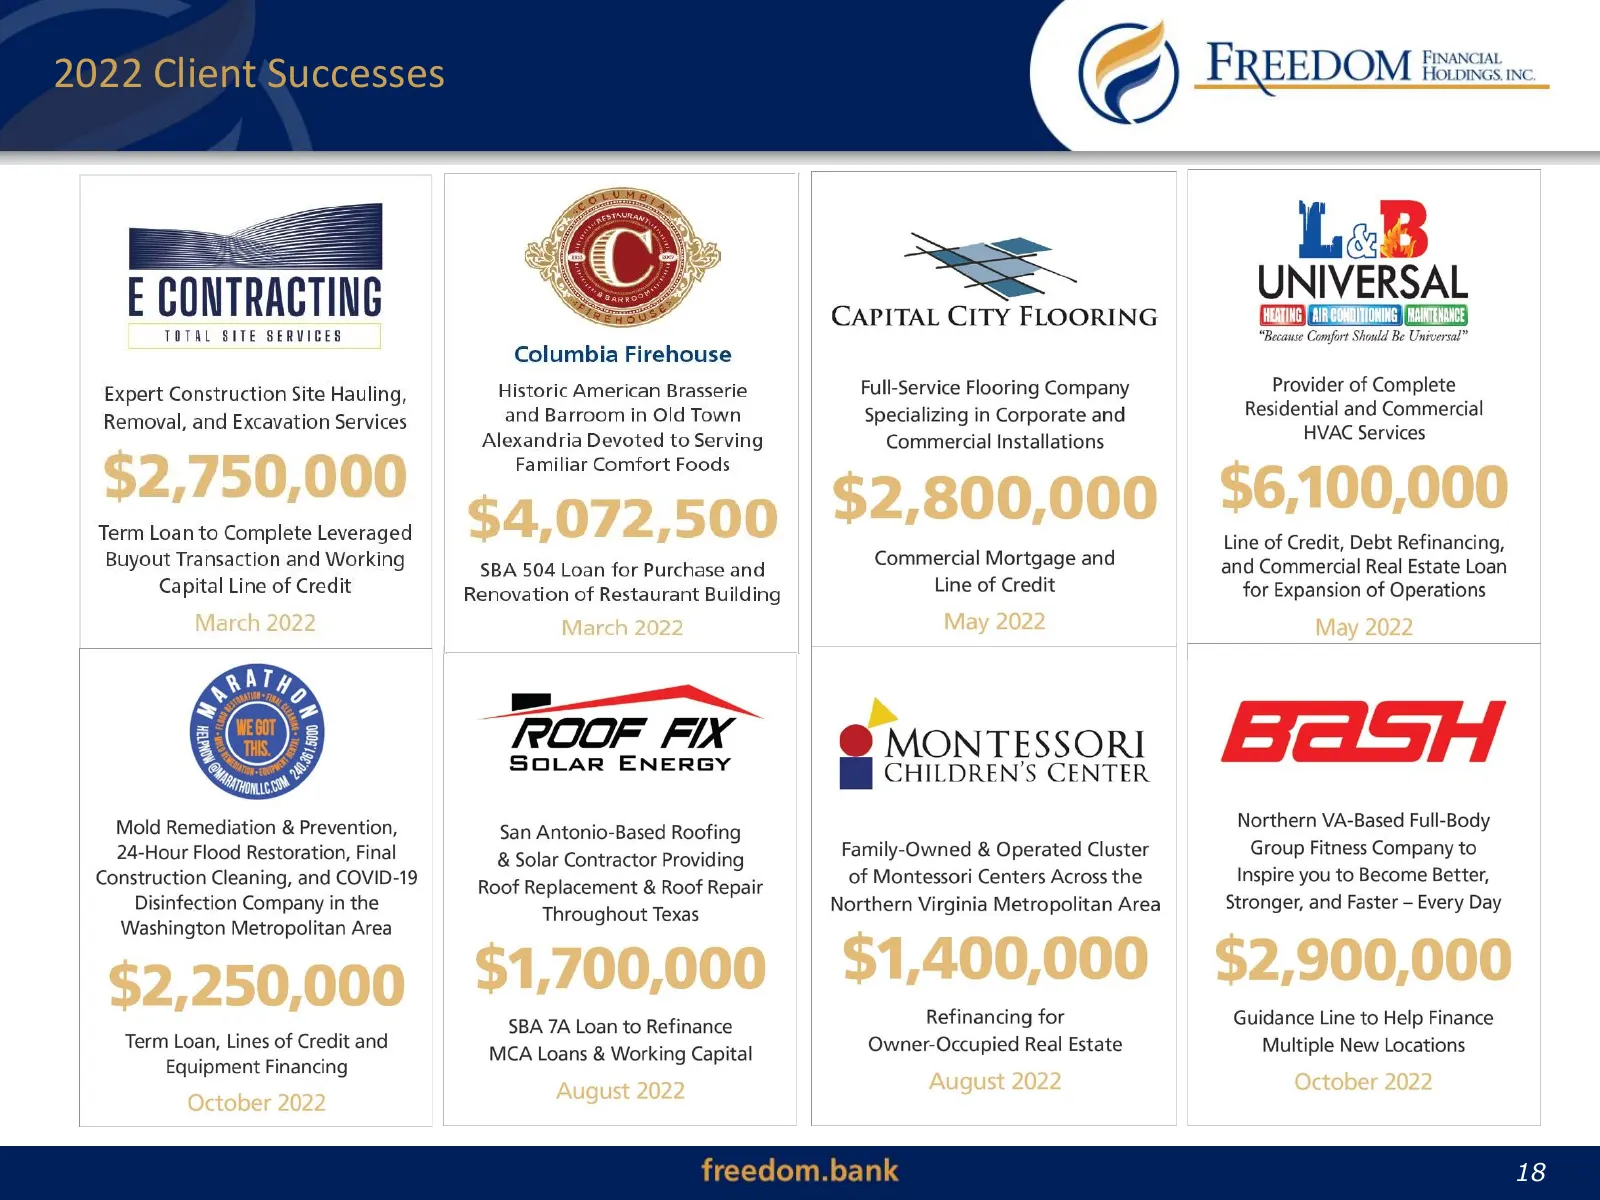
E CONTRACTING TOTAL SITE SERVICES Expert Construction Site Hauling, Removal, and Excavation Services $2,750,000 Term Loan to Complete Leveraged Buyout Transaction and Working Capital Line of Credit March 2022 Mold Remediation & Prevention, 24-Hour Flood Restoration, Final Construction Cleaning, and
Slide 19: Enhancing Our Footprint
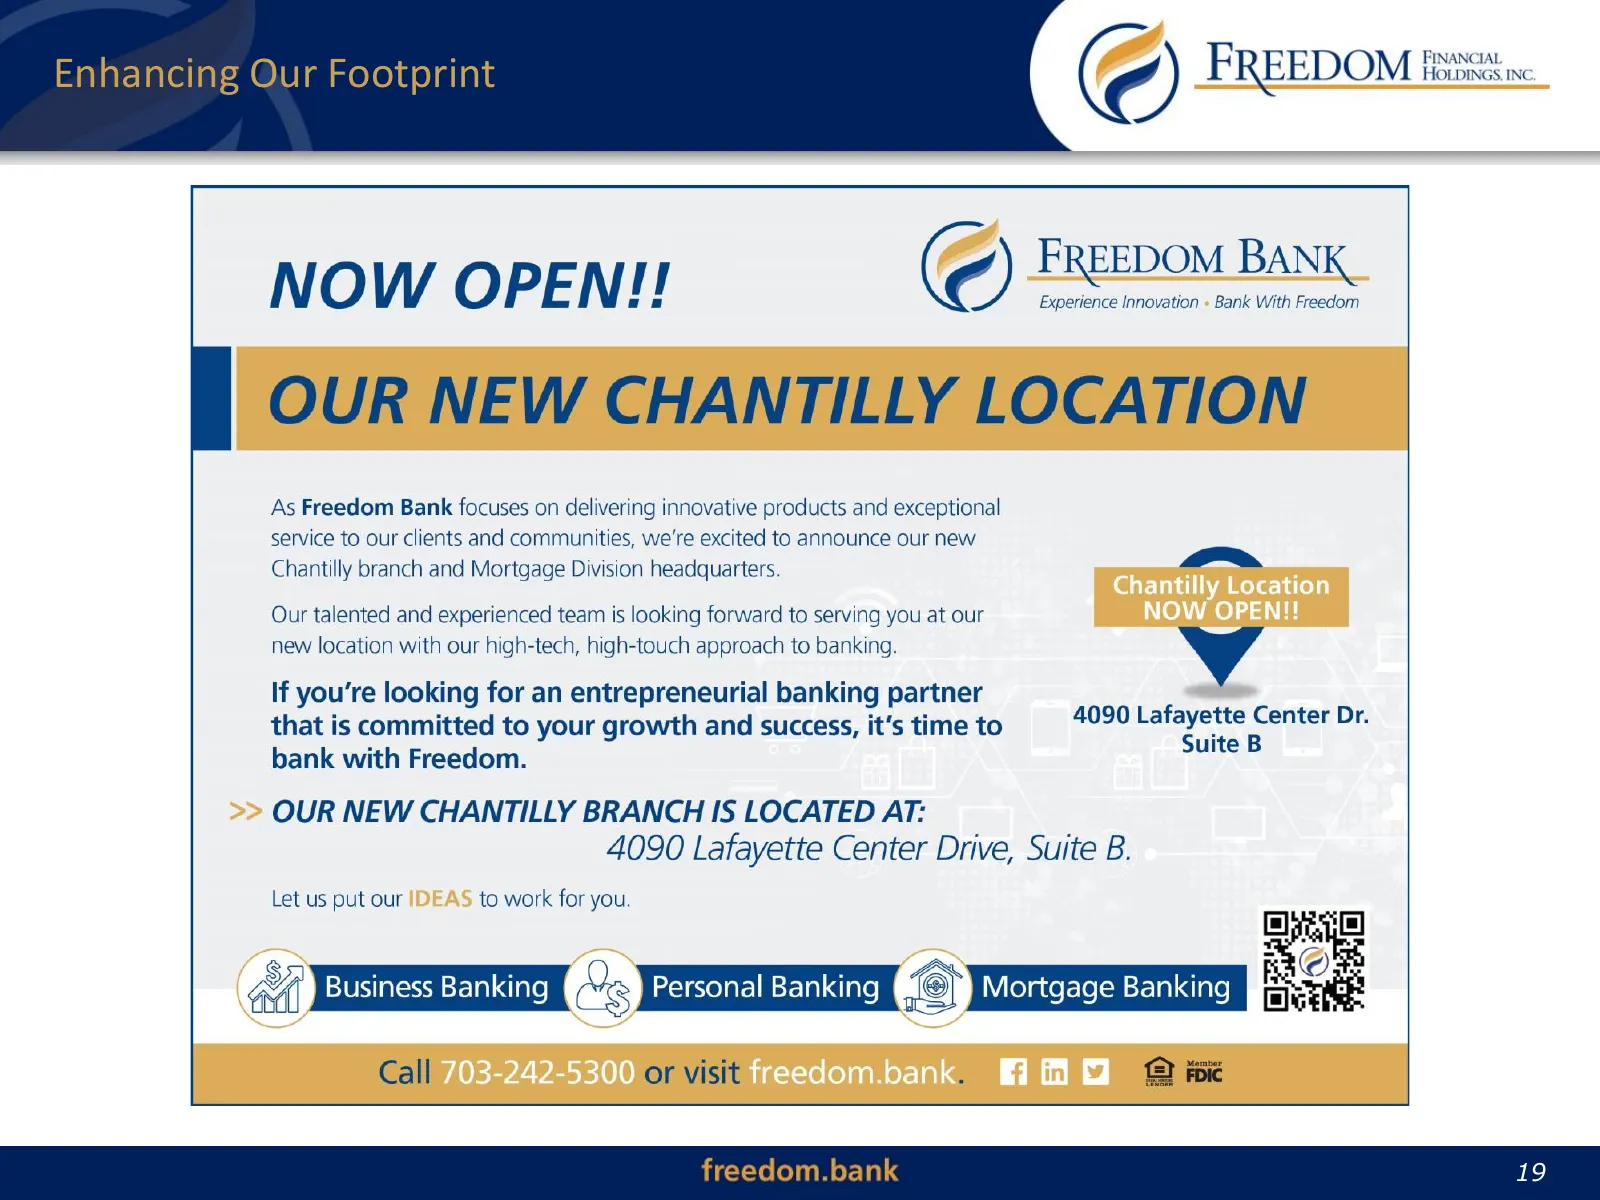
Enhancing Our Footprint 19 19
Slide 20: Operating Market Overview
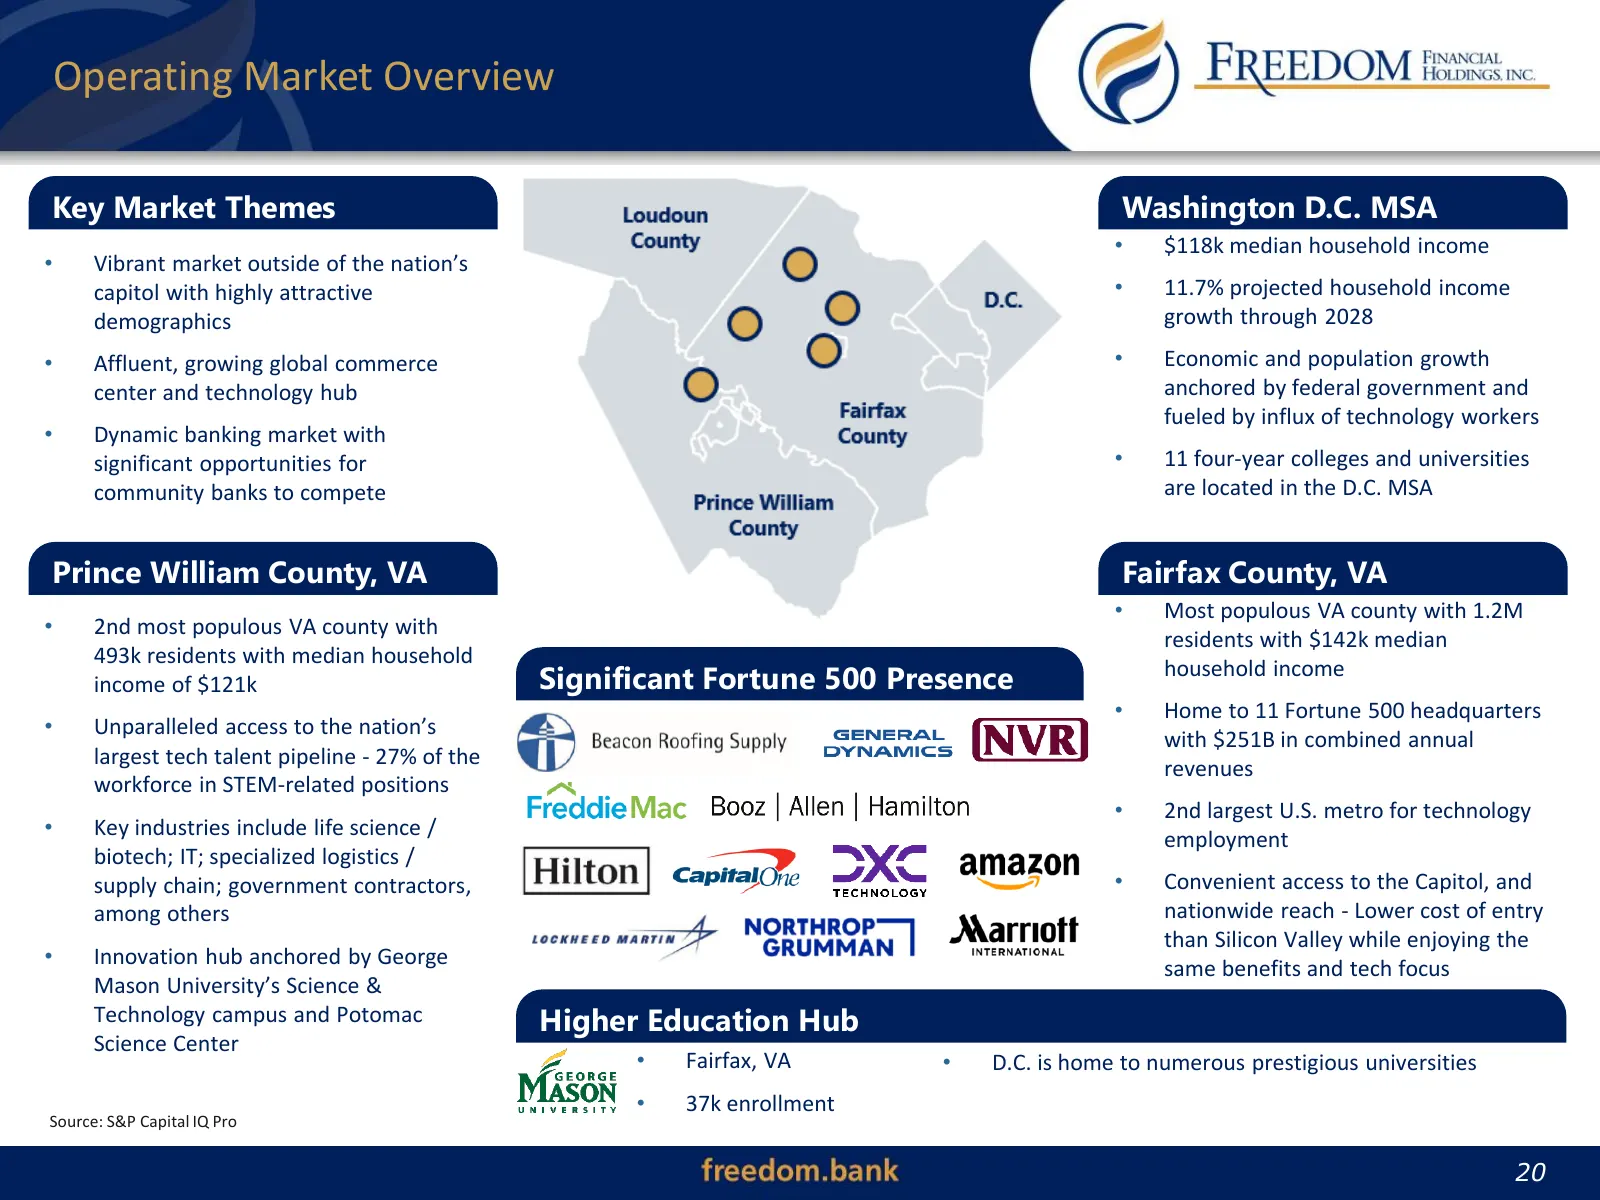
Operating Market Overview Key Market Themes Washington D.C. MSA • $118k median household income • Vibrant market outside ofFranchise the nation’s Footprint Company Overview capitol with highly attractive • 11.7% projected household income demographics growth through 2028 • Affluent, growing global c
Slide 21: Washington D.C. MSA Highlights
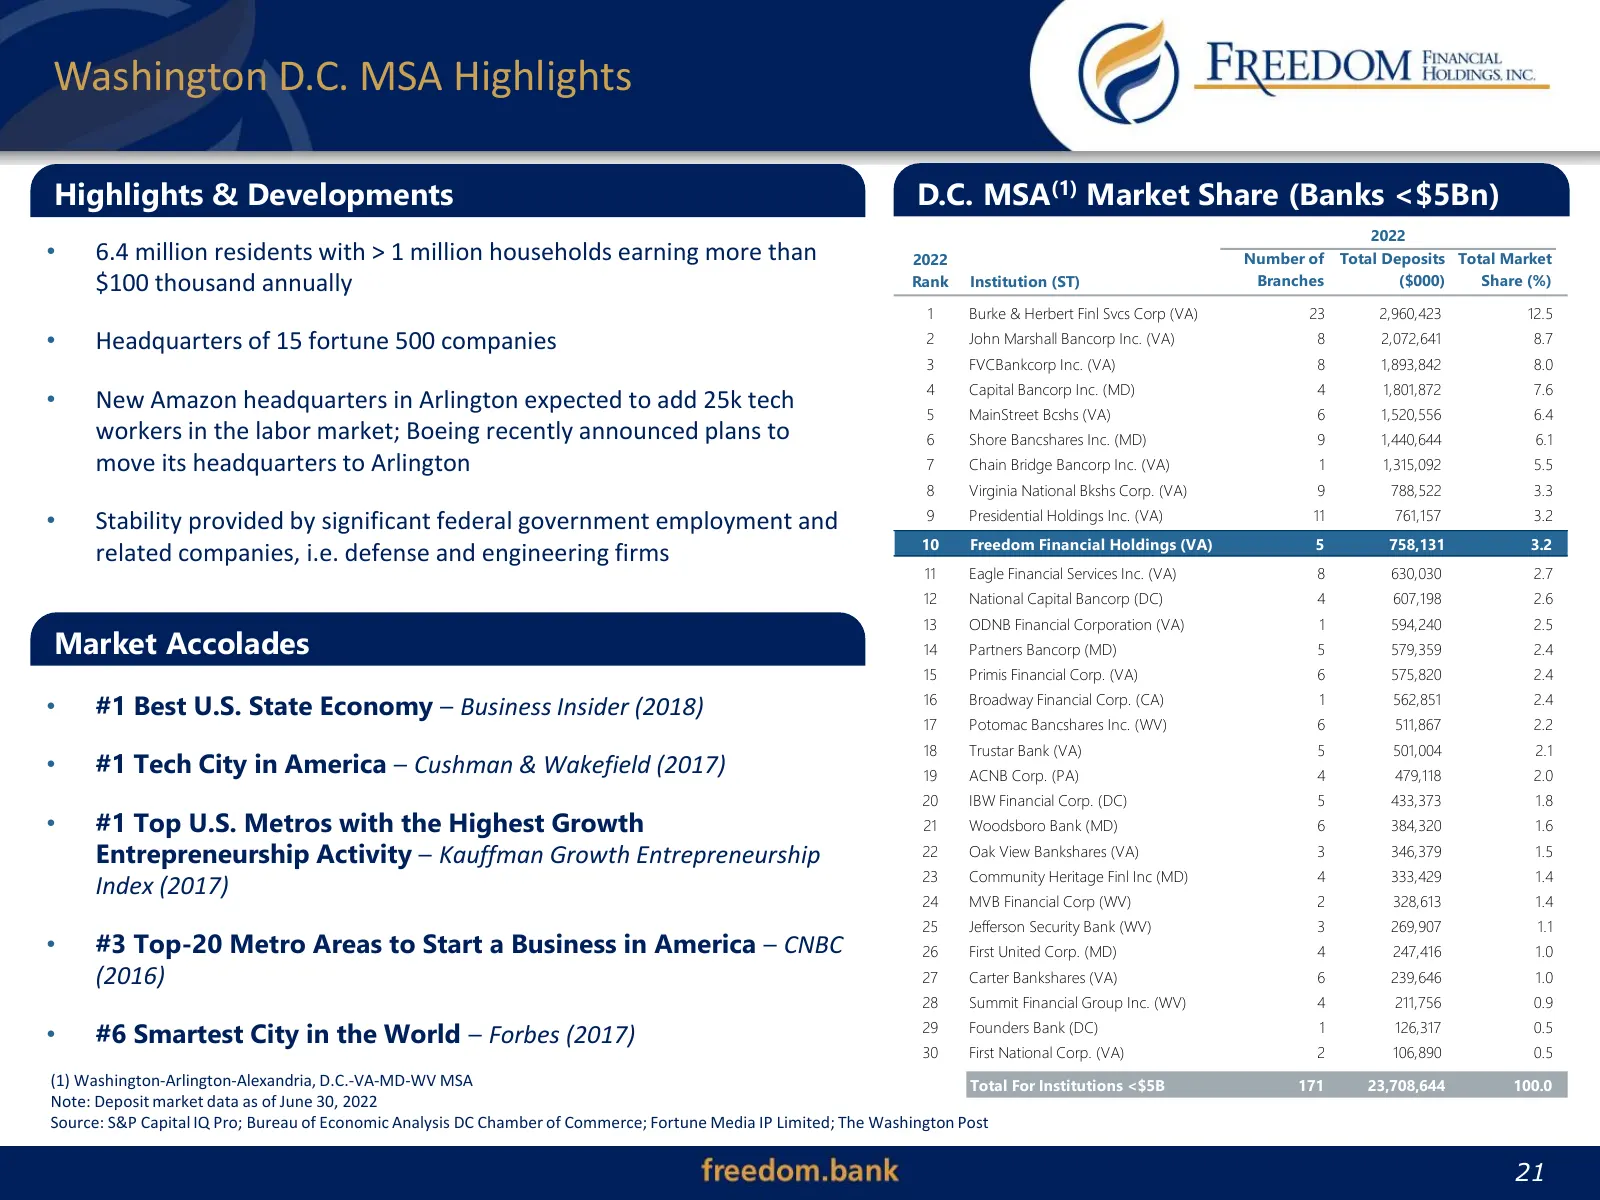
Washington D.C. MSA Highlights Highlights & Developments D.C. MSA(1) Market Share (Banks <$5Bn) 2022 • 6.4 million residents with > 1 million households earning more than $100 thousand annually Franchise Footprint 2022 Rank Institution (ST) Company Number of Total Deposits Total Market Overview Bran
Slide 22: Operating Market Demographics
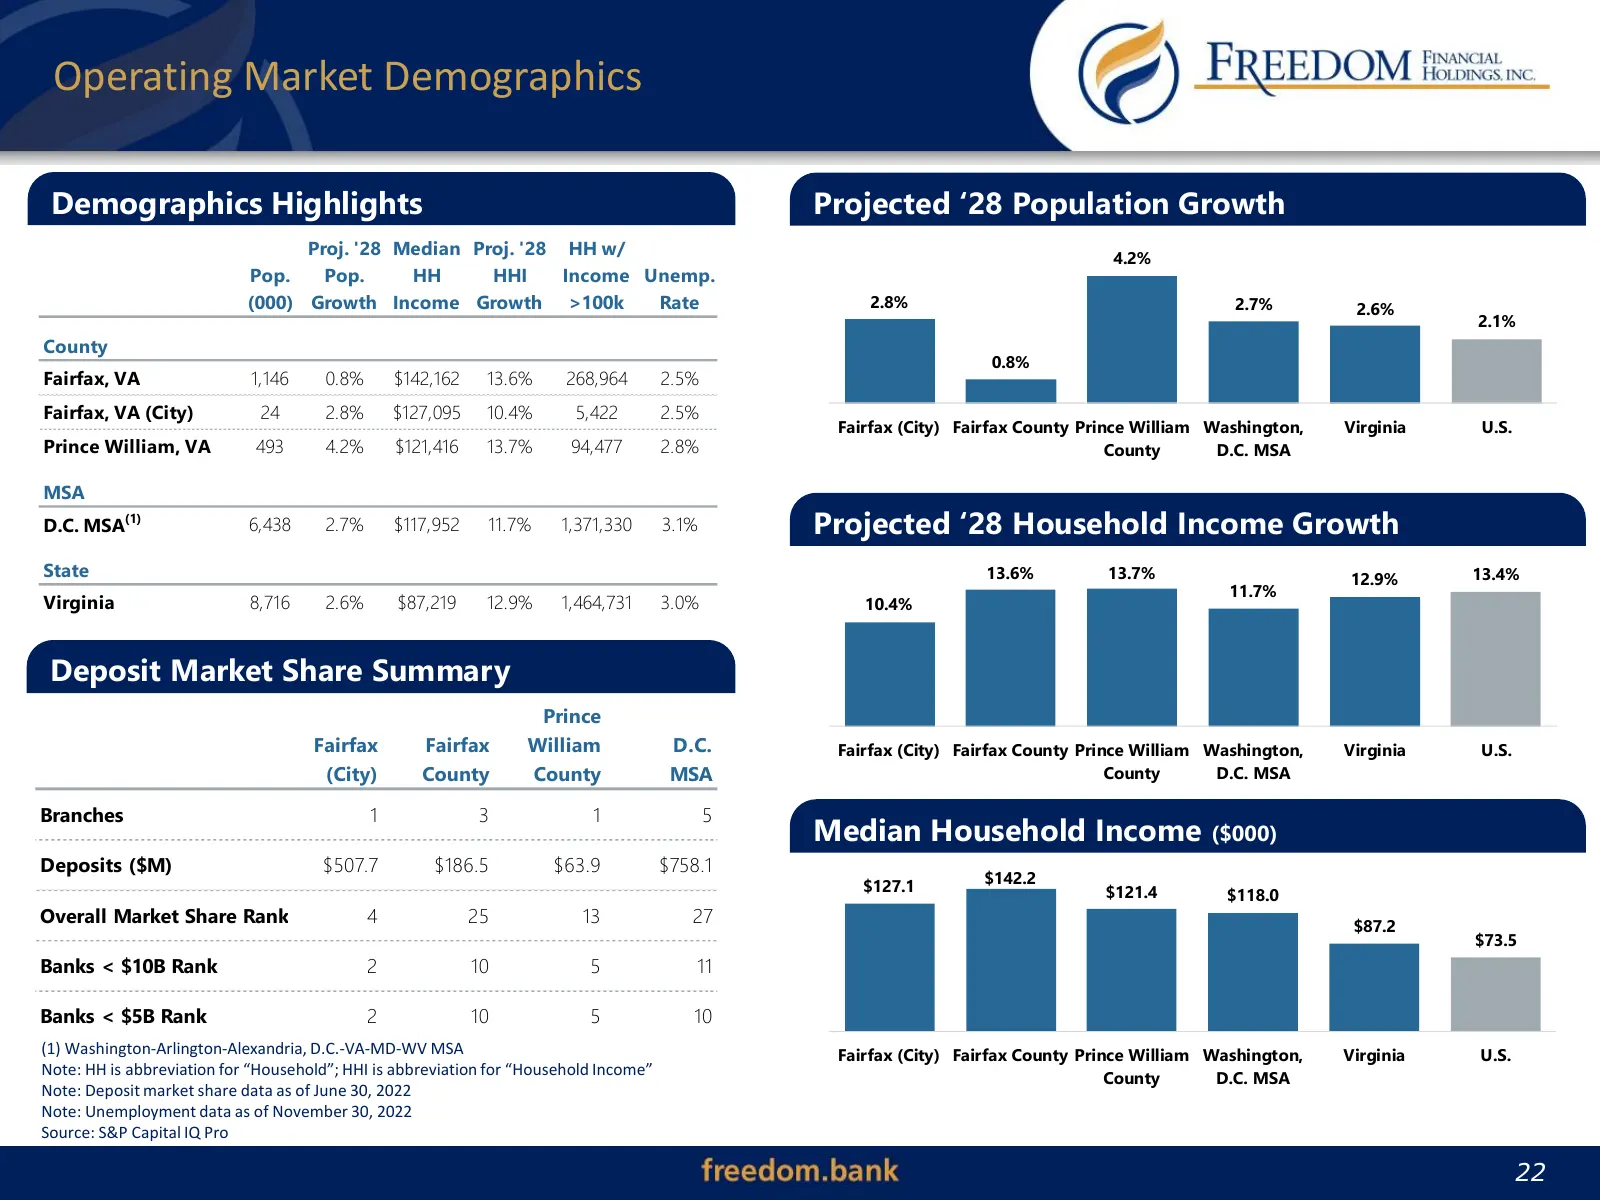
Operating Market Demographics Demographics Highly Highlights Affluent, High Growth Operating Environment Projected ‘28 Population Growth Proj. '28 Median Proj. '28 HH w/ 4.2% Pop. Pop. Franchise Footprint HH HHI Income Unemp. Company Overview (000) Growth Income Growth >100k Rate 2.8% 2.7% 2.6% 2.1%
Slide 23: Results for Q1 2023 and FY 2022
Results for Q1 2023 and FY 2022 23
Slide 24: Fourth Quarter and FY 2022 Performance Highlights
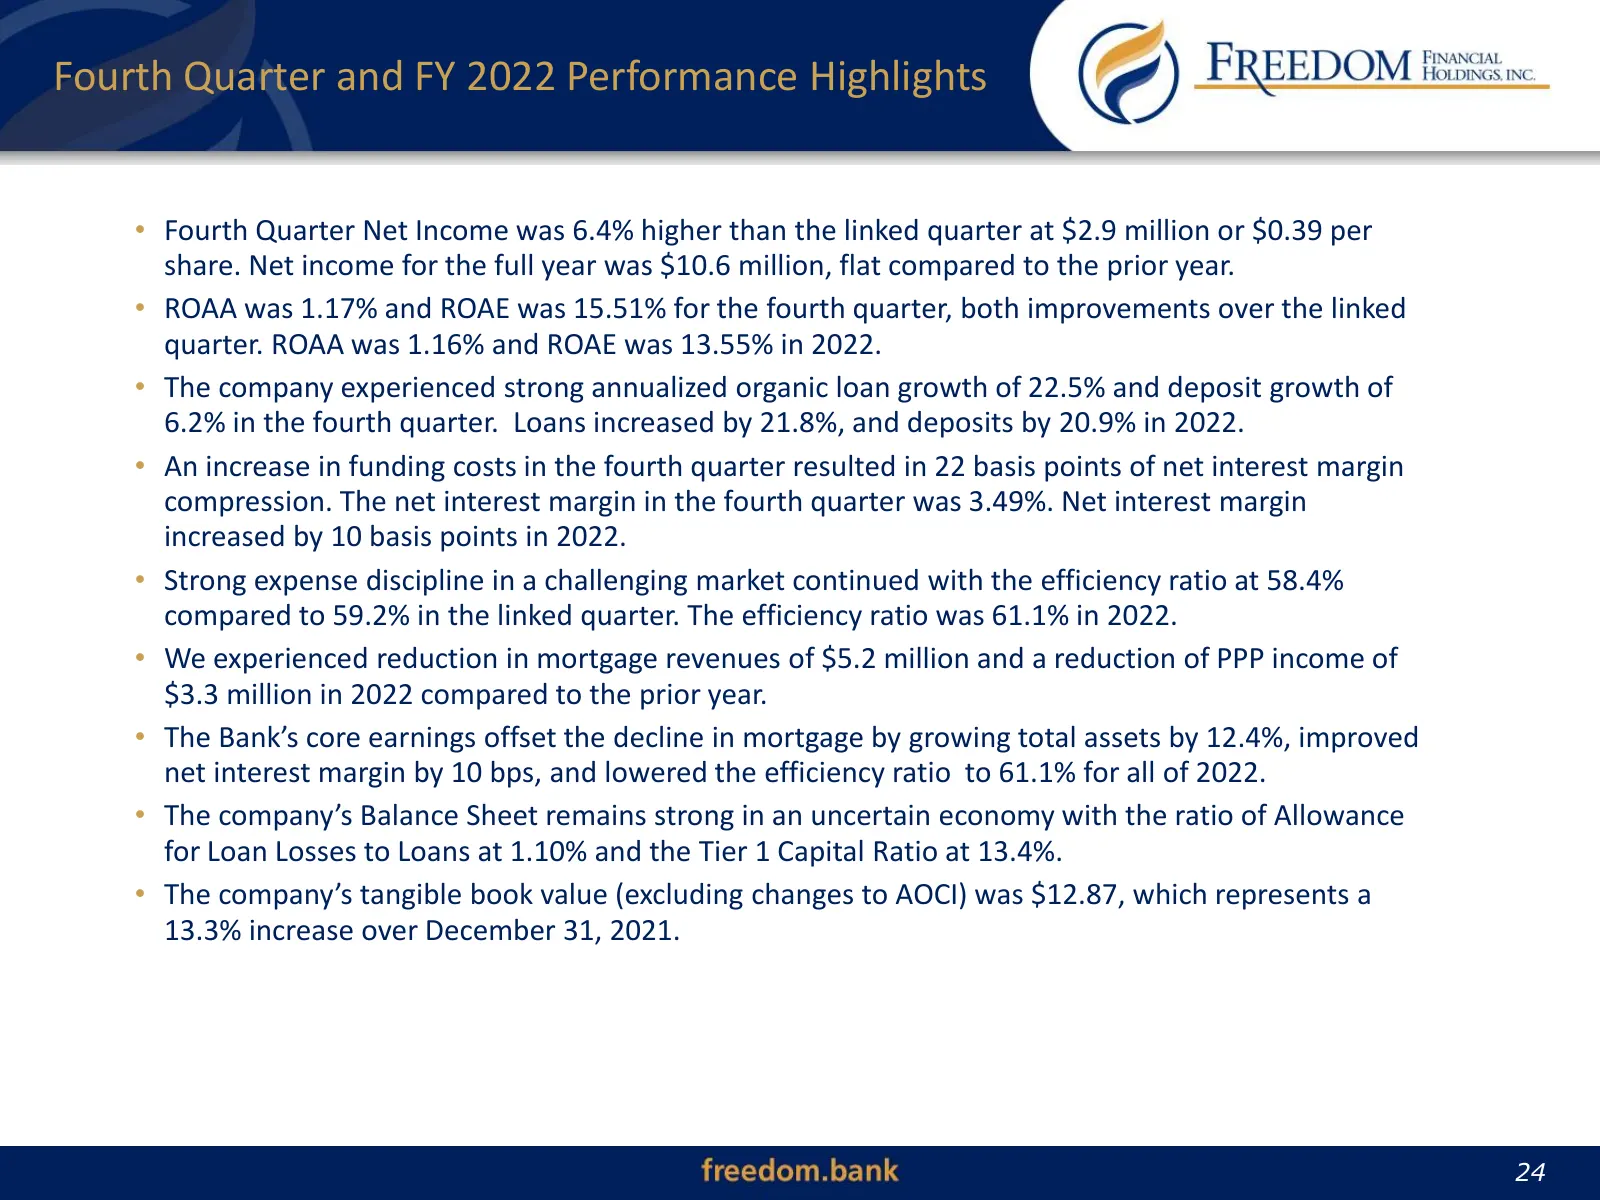
Fourth Quarter and FY 2022 Performance Highlights • Fourth Quarter Net Income was 6.4% higher than the linked quarter at $2.9 million or $0.39 per share. Net income for the full year was $10.6 million, flat compared to the prior year. • ROAA was 1.17% and ROAE was 15.51% for the fourth quarter, both
Slide 25: First Quarter 2023 Performance Highlights
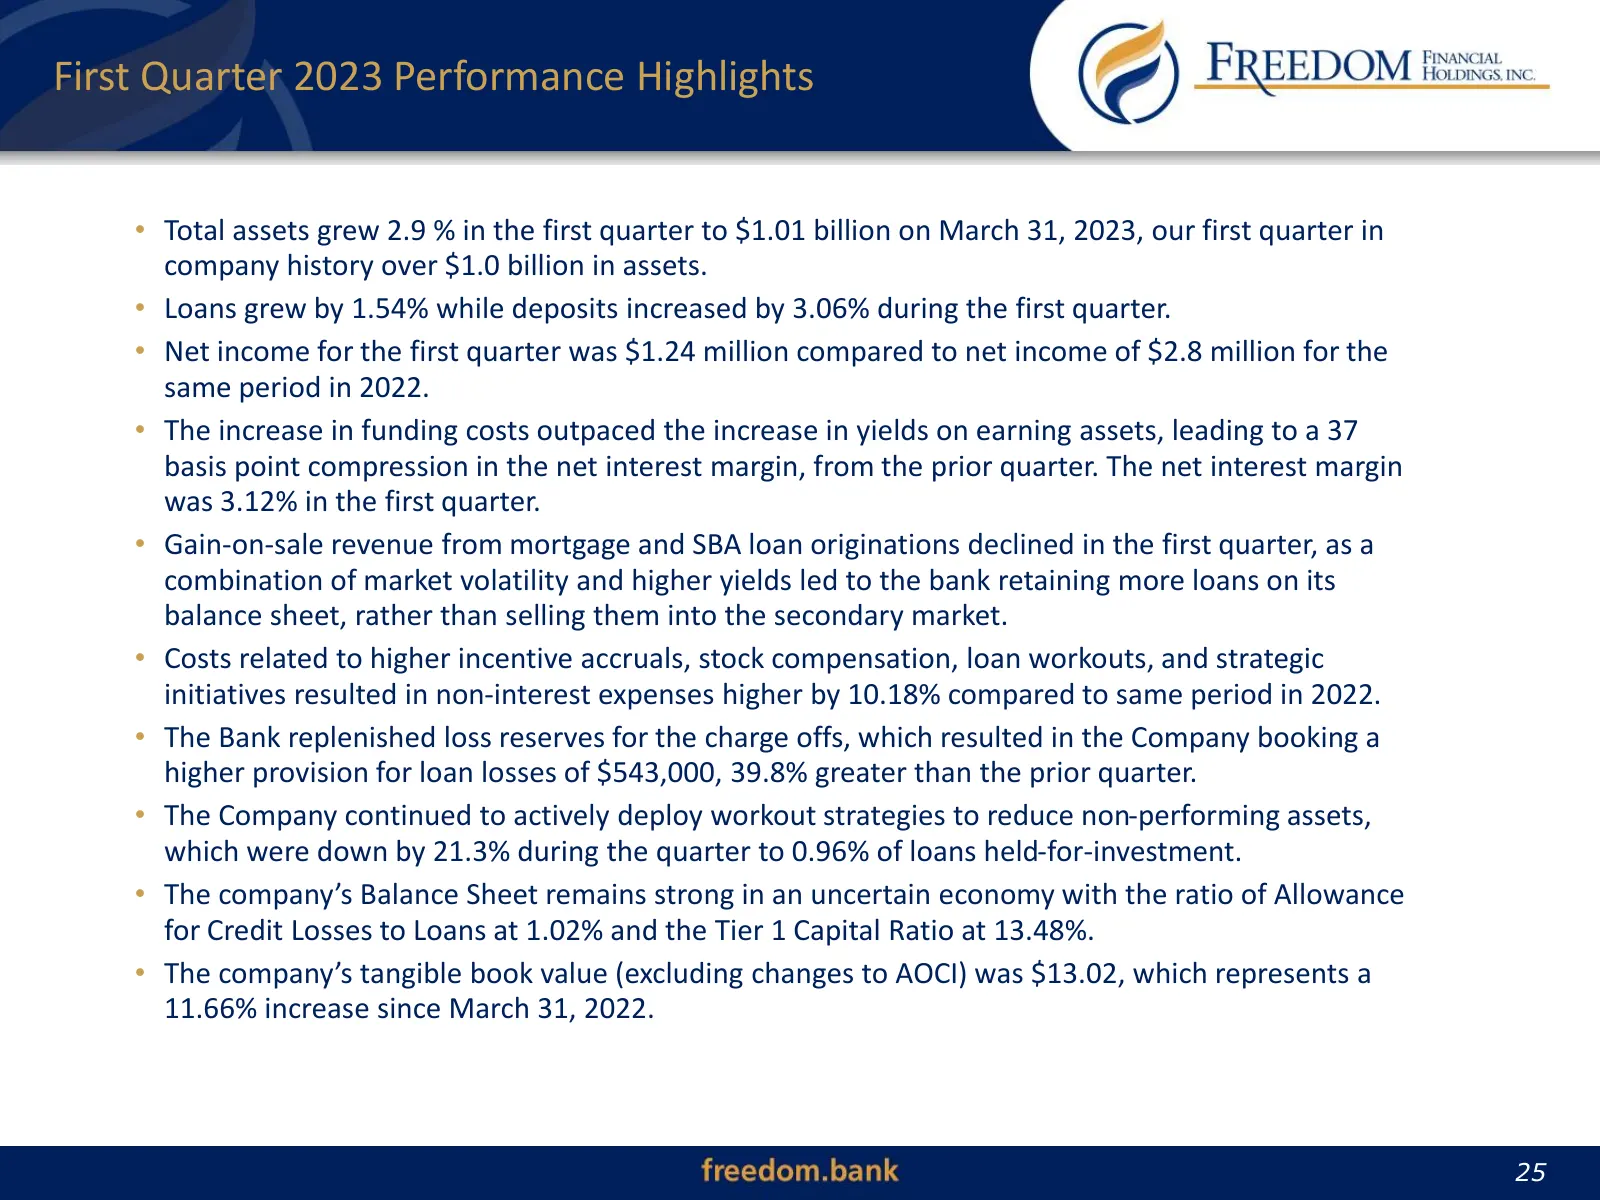
First Quarter 2023 Performance Highlights • Total assets grew 2.9 % in the first quarter to $1.01 billion on March 31, 2023, our first quarter in company history over $1.0 billion in assets. • Loans grew by 1.54% while deposits increased by 3.06% during the first quarter. • Net income for the first
Slide 26: Summary of Income Statements
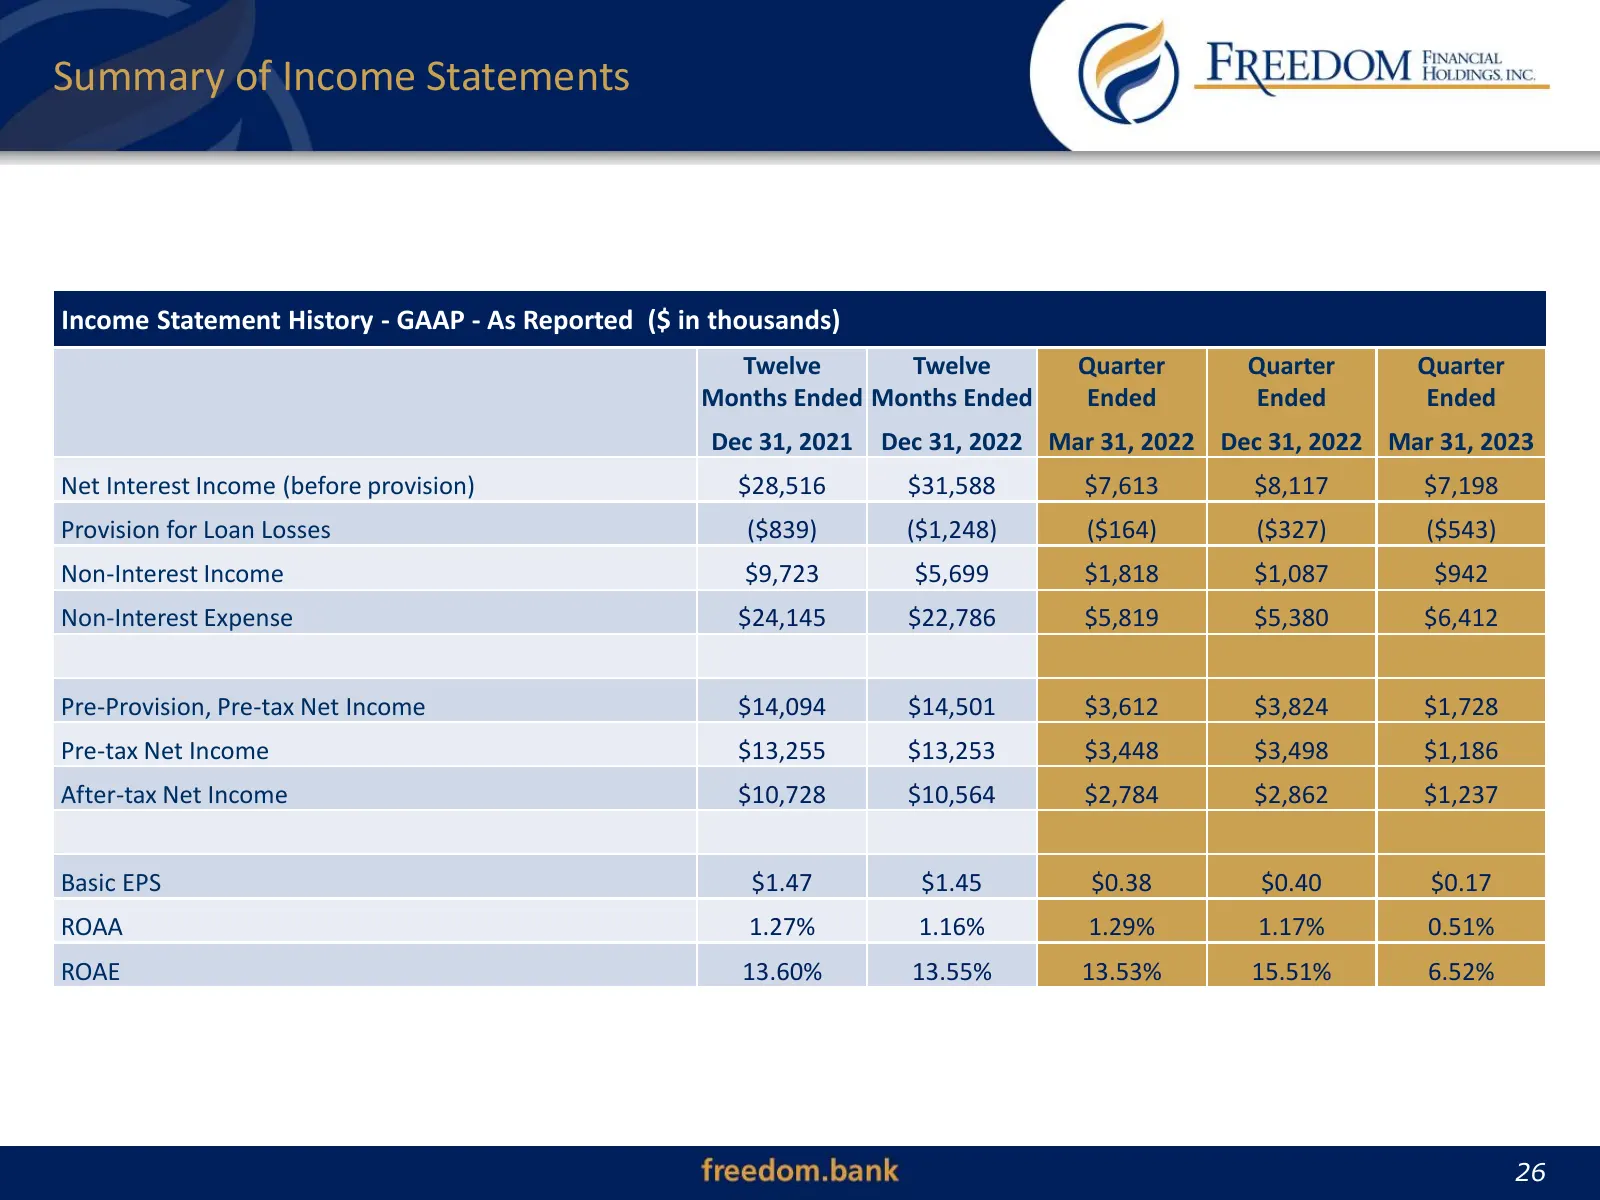
Summary of Income Statements Income Statement History - GAAP - As Reported ($ in thousands) Twelve Twelve Quarter Quarter Quarter Months Ended Months Ended Ended Ended Ended Dec 31, 2021 Dec 31, 2022 Mar 31, 2022 Dec 31, 2022 Mar 31, 2023 Net Interest Income (before provision) $28,516 $31,588 $7,613
Slide 27: Summary of Balance Sheets
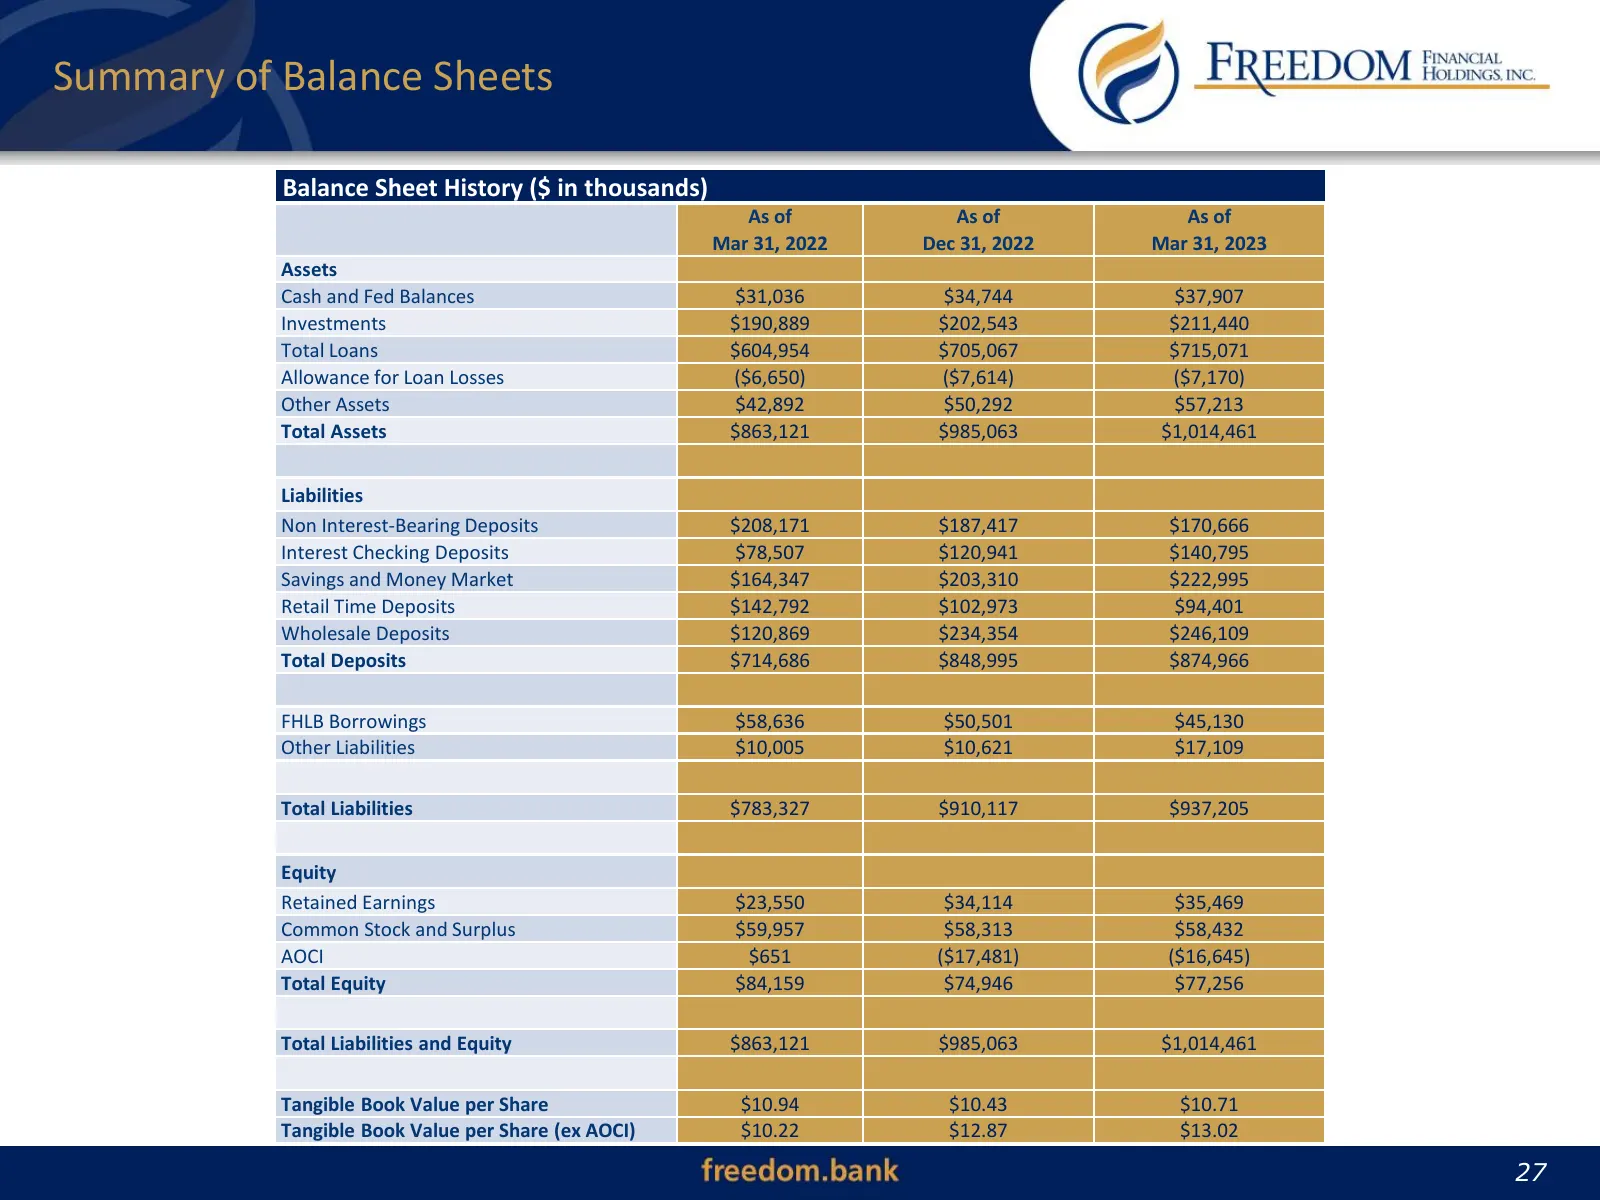
Summary of Balance Sheets Balance Sheet History ($ in thousands) As of As of As of Mar 31, 2022 Dec 31, 2022 Mar 31, 2023 Assets Cash and Fed Balances $31,036 $34,744 $37,907 Investments $190,889 $202,543 $211,440 Total Loans $604,954 $705,067 $715,071 Allowance for Loan Losses ($6,650) ($7,614) ($7
Slide 28: Historical Performance Trends
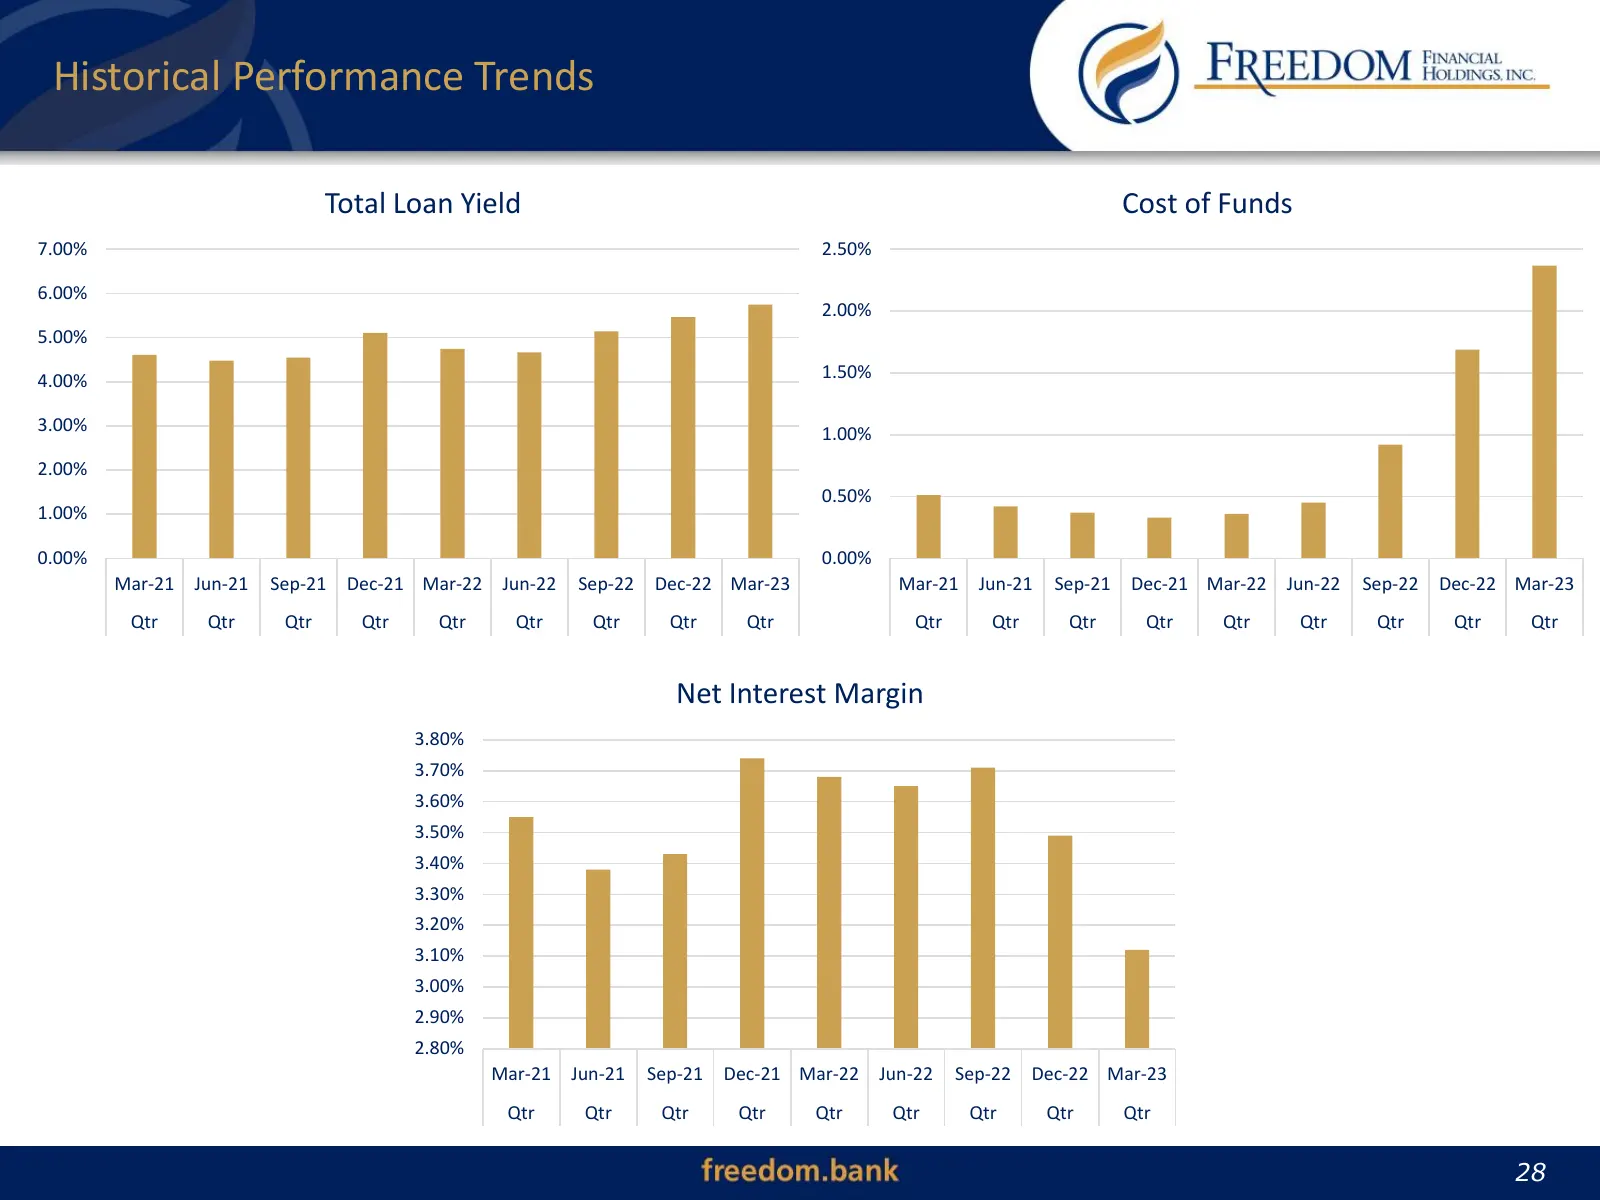
Historical Performance Trends Total Loan Yield Cost of Funds 7.00% 2.50% 6.00% 2.00% 5.00% 4.00% 1.50% 3.00% 1.00% 2.00% 0.50% 1.00% 0.00% 0.00% Mar-21 Jun-21 Sep-21 Dec-21 Mar-22 Jun-22 Sep-22 Dec-22 Mar-23 Mar-21 Jun-21 Sep-21 Dec-21 Mar-22 Jun-22 Sep-22 Dec-22 Mar-23 Qtr Qtr Qtr Qtr Qtr Qtr Qtr Q
Slide 29: Historical Performance Trends
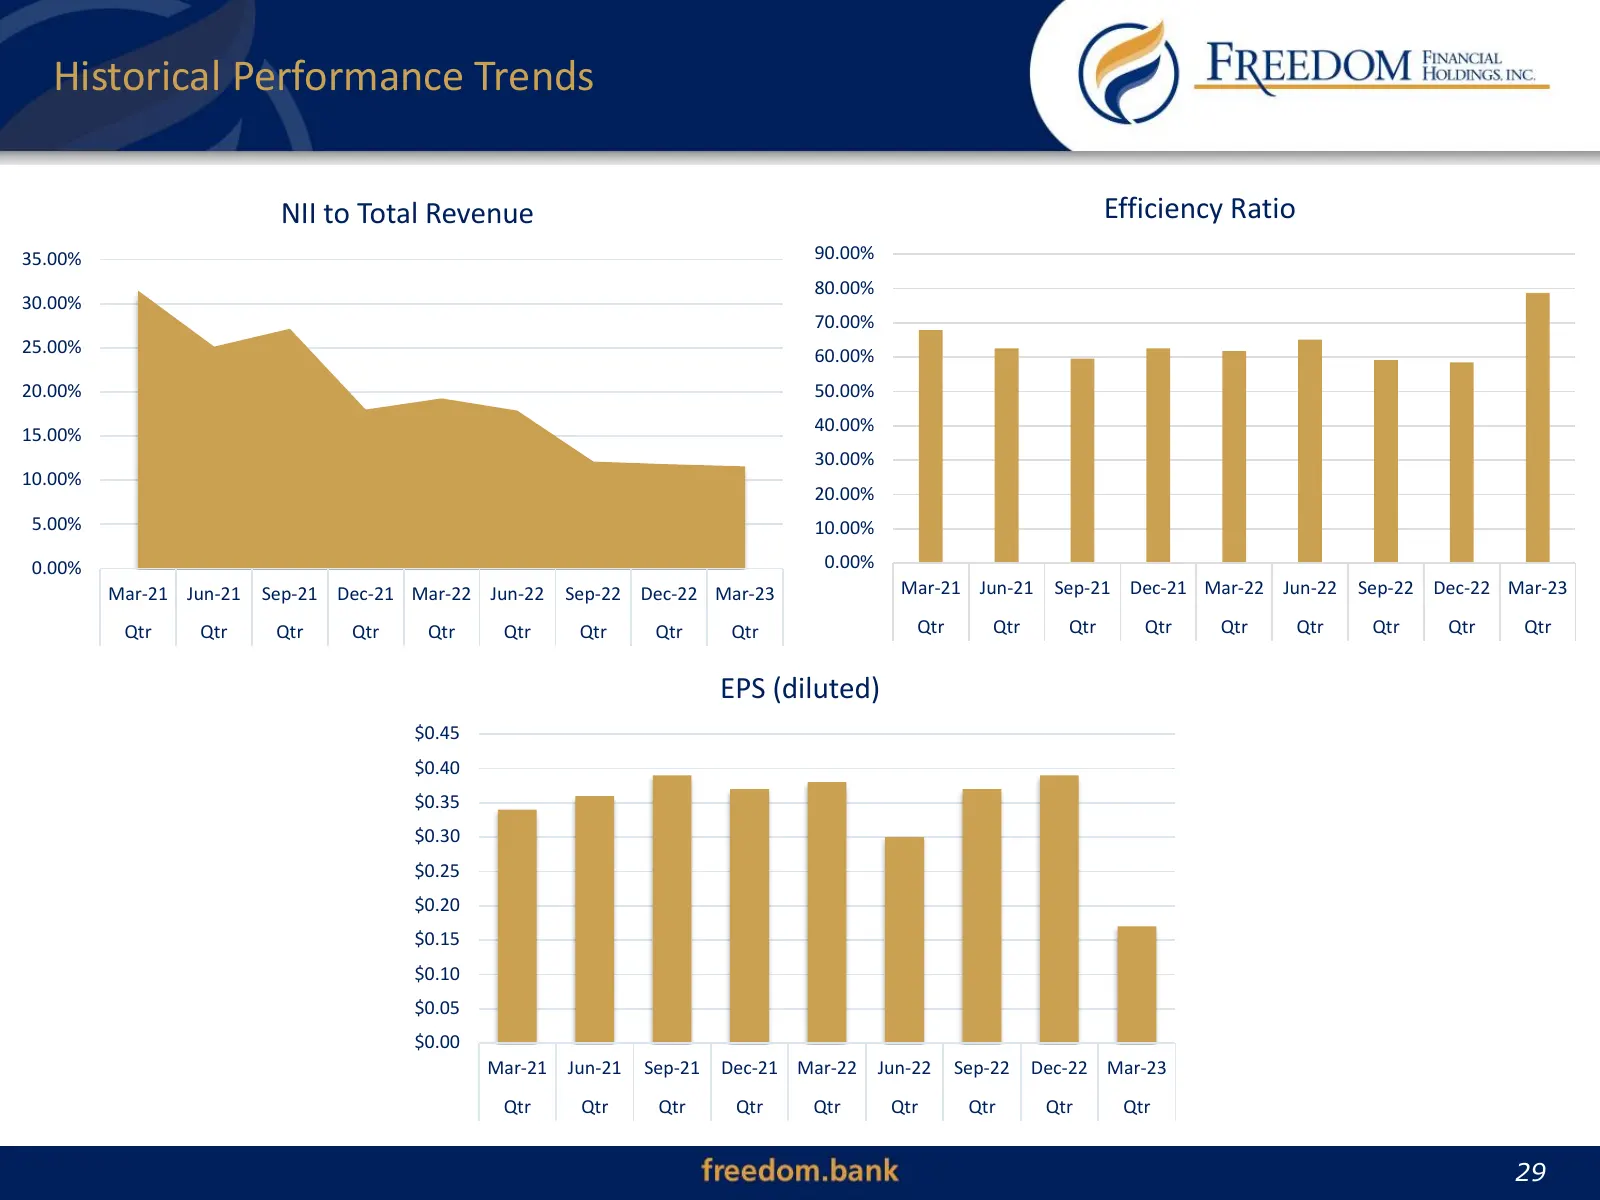
Historical Performance Trends NII to Total Revenue Efficiency Ratio 35.00% 90.00% 80.00% 30.00% 70.00% 25.00% 60.00% 20.00% 50.00% 40.00% 15.00% 30.00% 10.00% 20.00% 5.00% 10.00% 0.00% 0.00% Mar-21 Jun-21 Sep-21 Dec-21 Mar-22 Jun-22 Sep-22 Dec-22 Mar-23 Mar-21 Jun-21 Sep-21 Dec-21 Mar-22 Jun-22 Sep-
Slide 30: Historical Performance Trends
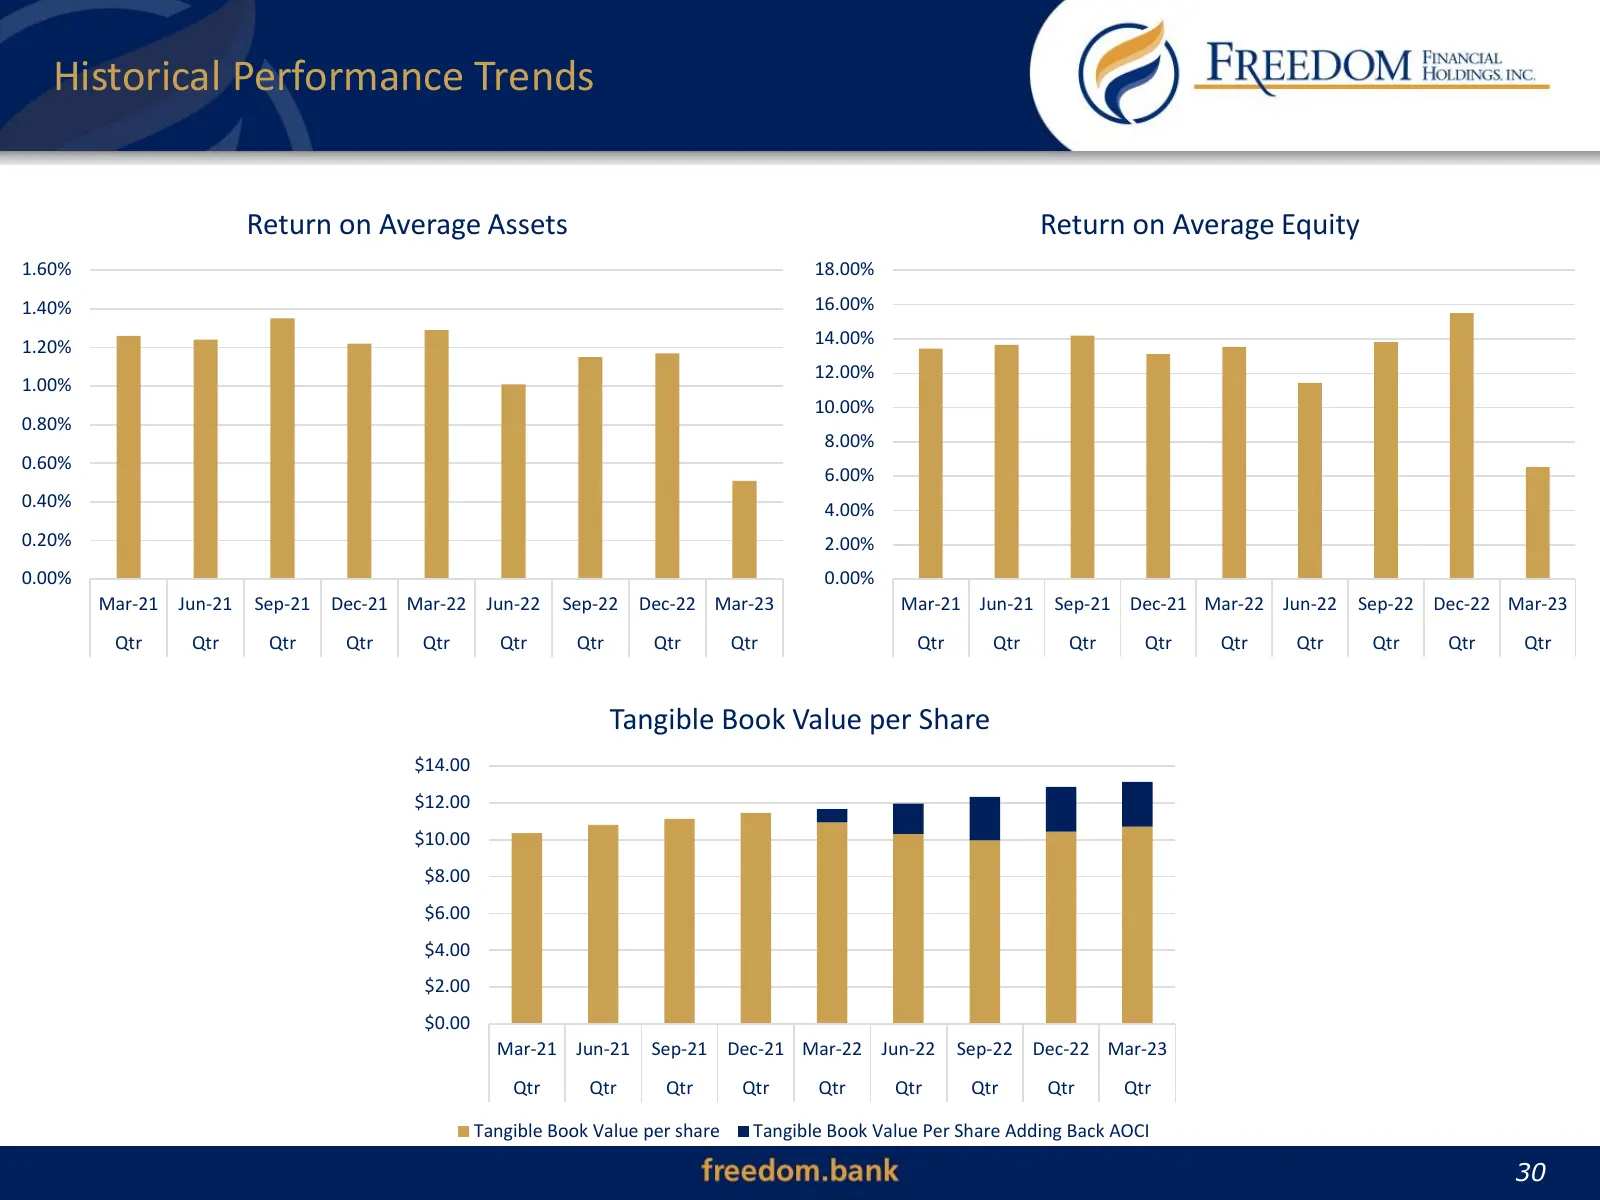
Historical Performance Trends Return on Average Assets Return on Average Equity 1.60% 18.00% 1.40% 16.00% 1.20% 14.00% 12.00% 1.00% 10.00% 0.80% 8.00% 0.60% 6.00% 0.40% 4.00% 0.20% 2.00% 0.00% 0.00% Mar-21 Jun-21 Sep-21 Dec-21 Mar-22 Jun-22 Sep-22 Dec-22 Mar-23 Mar-21 Jun-21 Sep-21 Dec-21 Mar-22 Jun
Slide 31: Investment Portfolio as of March 31, 2023
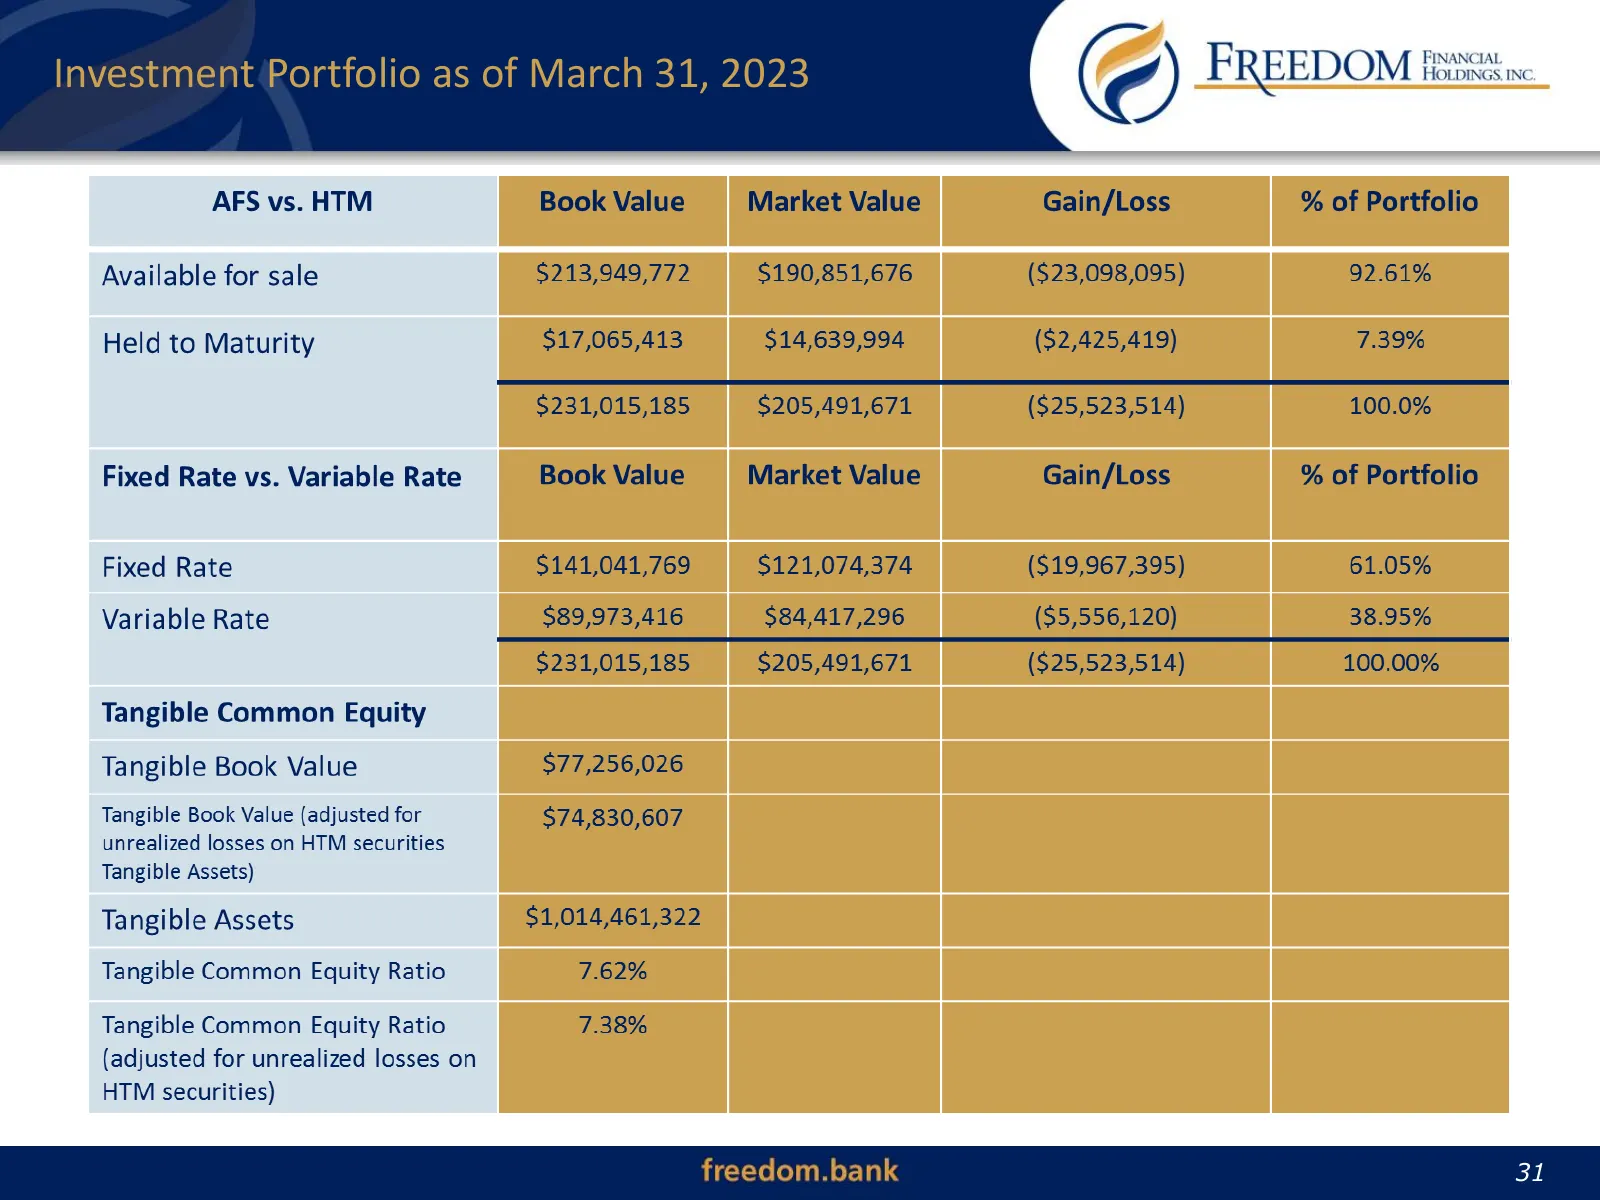
Investment Portfolio as of March 31, 2023 31 31
Slide 32: Liquidity as of March 31, 2023
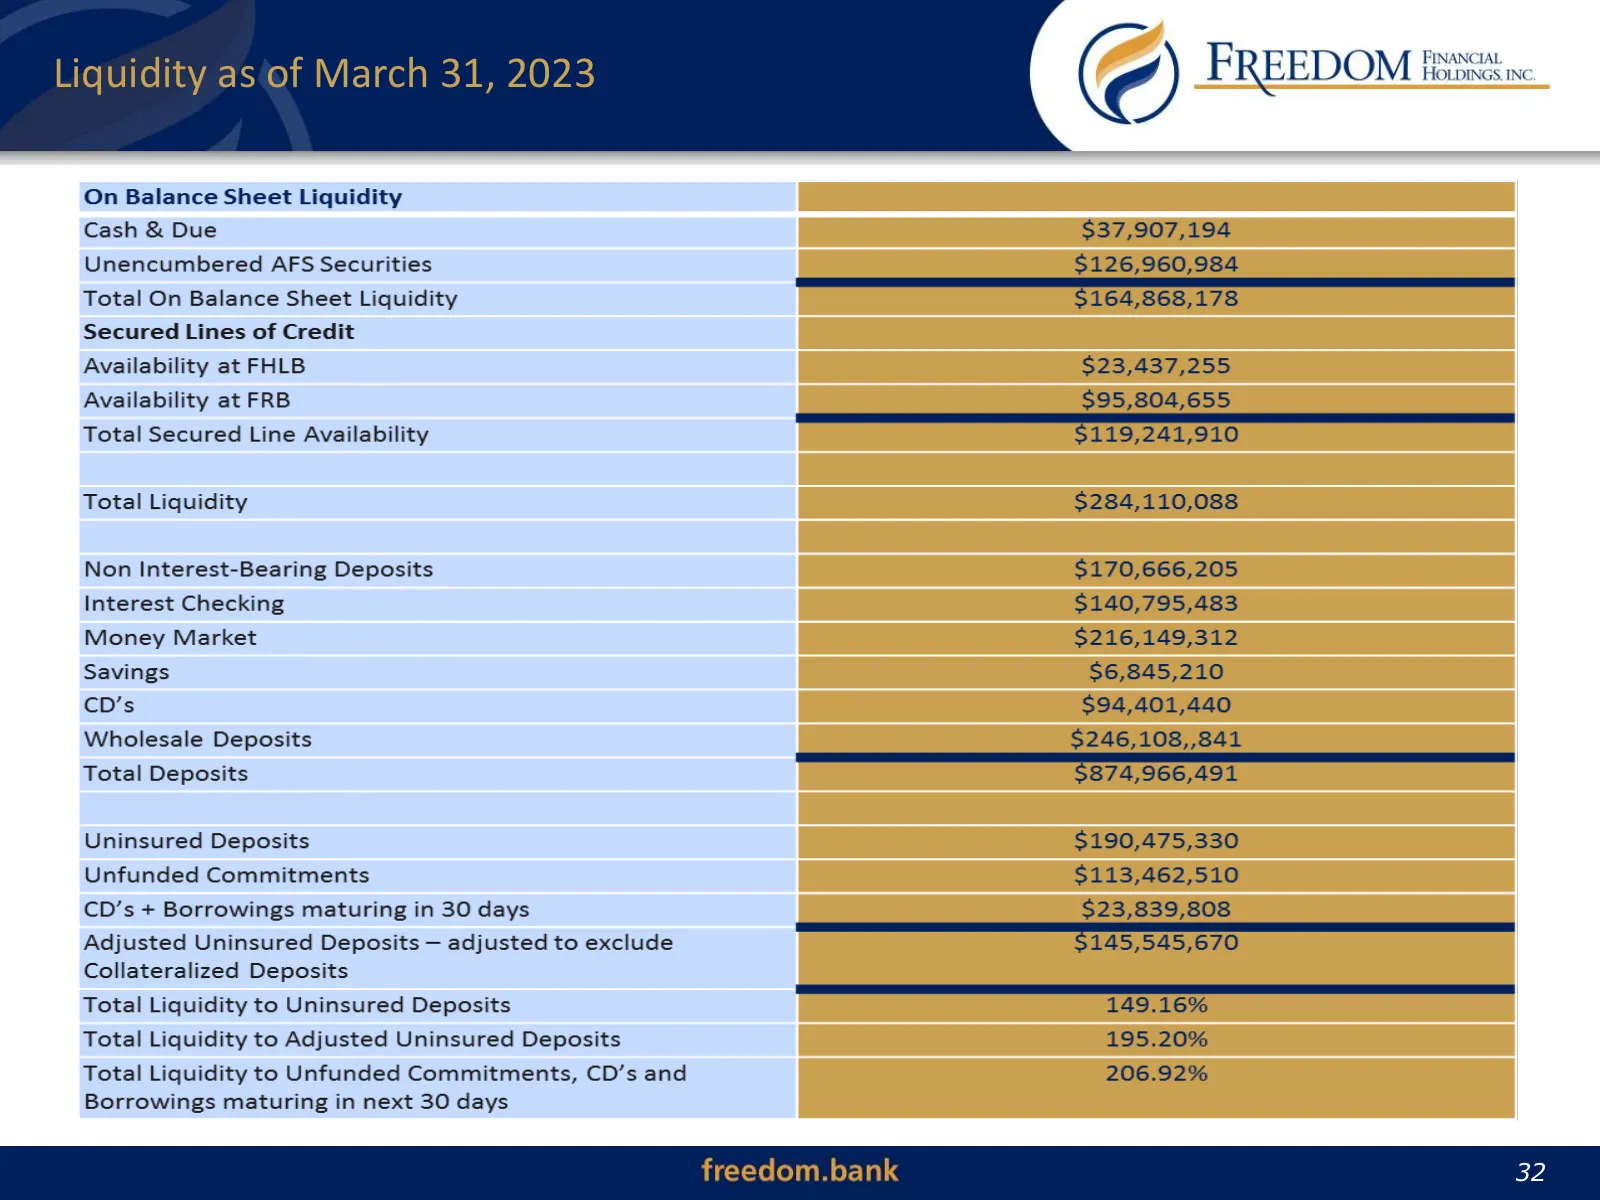
Liquidity as of March 31, 2023 32 32
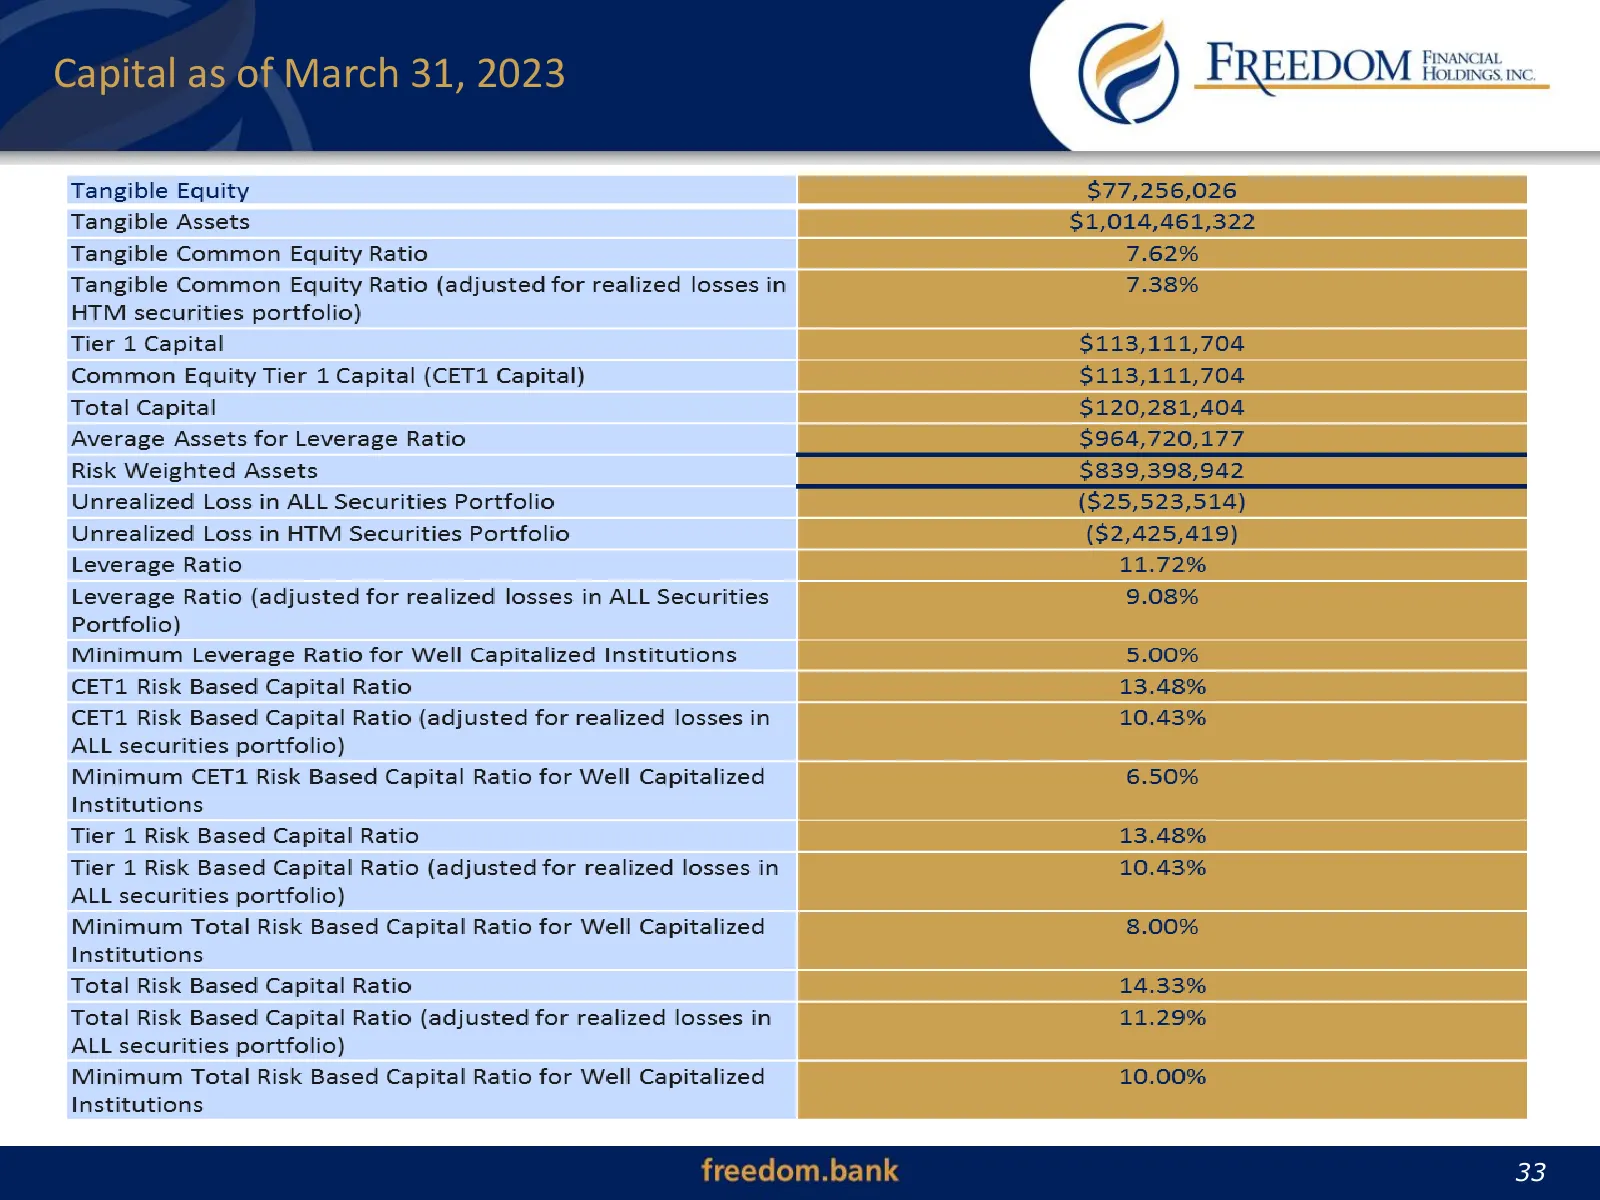
Slide 33: Capital as of March 31, 2023
Capital as of March 31, 2023 33 33
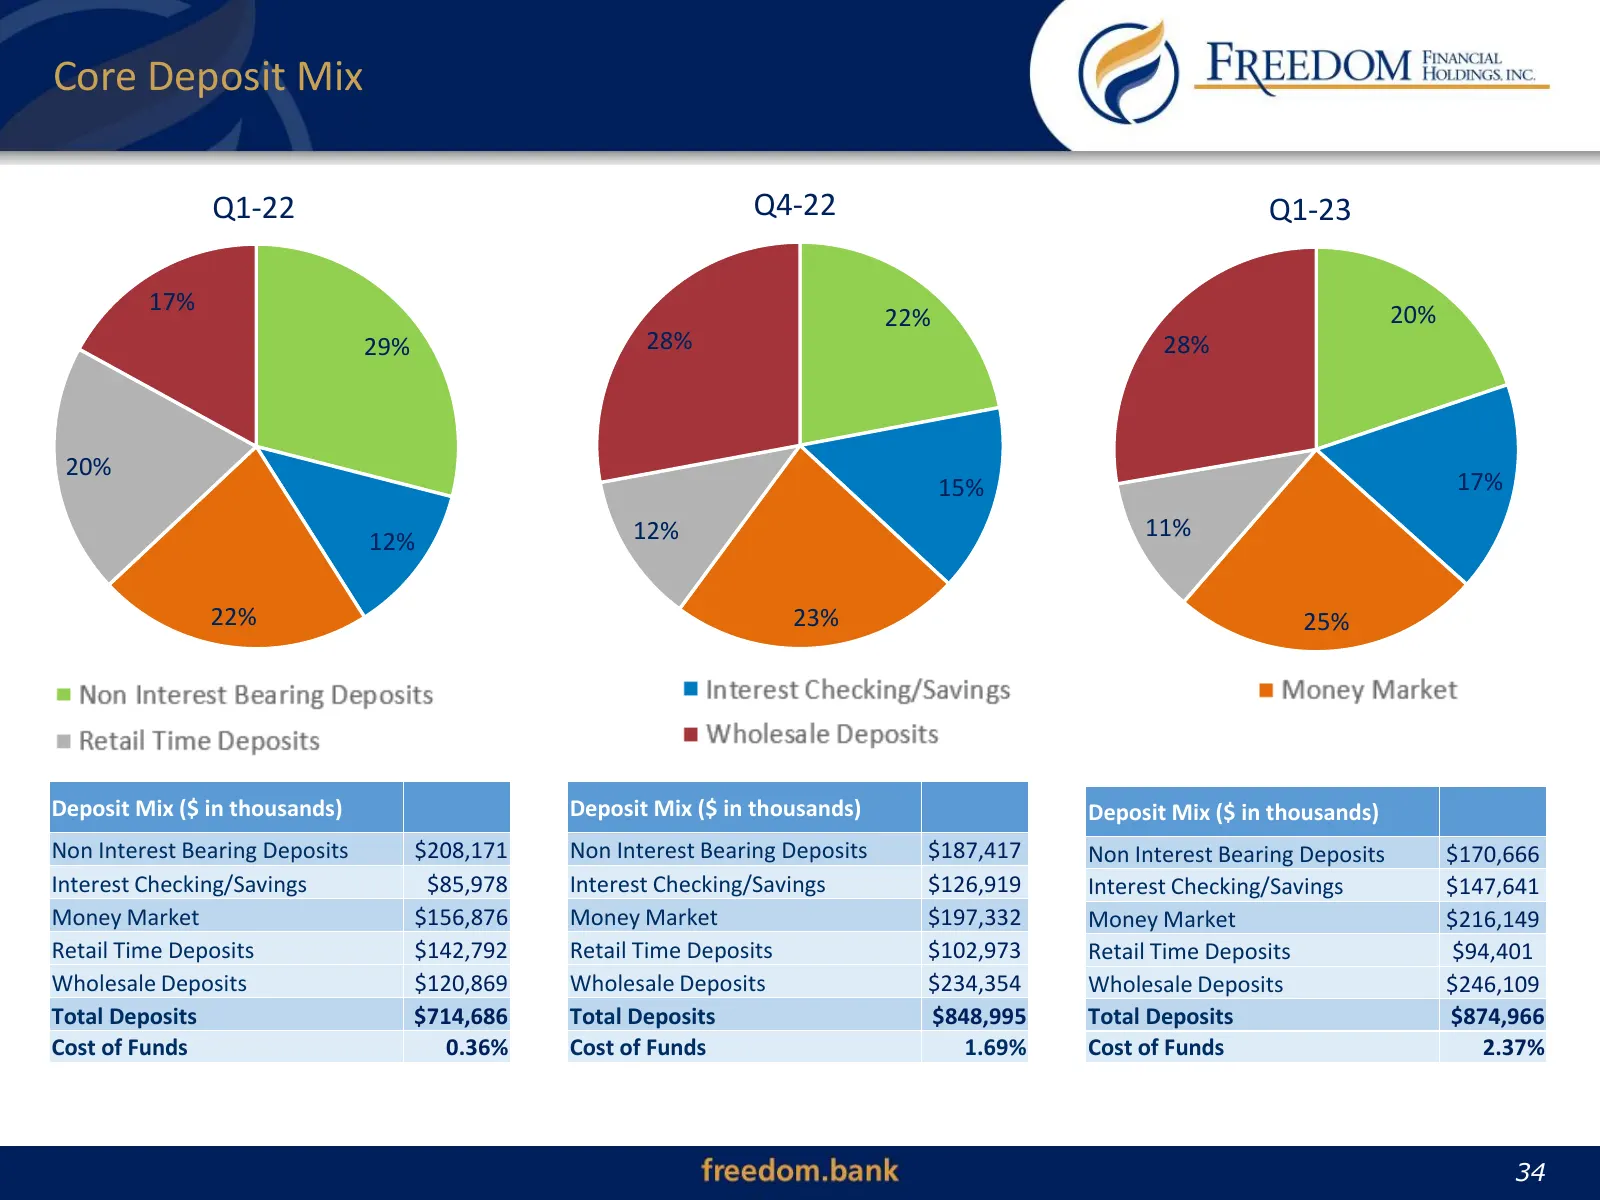
Slide 34: Core Deposit Mix
Core Deposit Mix Q1-22 Q4-22 Q1-23 17% 20% 22% 29% 28% 28% 20% 15% 17% 12% 11% 12% 22% 23% 25% Deposit Mix ($ in thousands) Deposit Mix ($ in thousands) Deposit Mix ($ in thousands) Non Interest Bearing Deposits $208,171 Non Interest Bearing Deposits $187,417 Non Interest Bearing Deposits $170,666 I
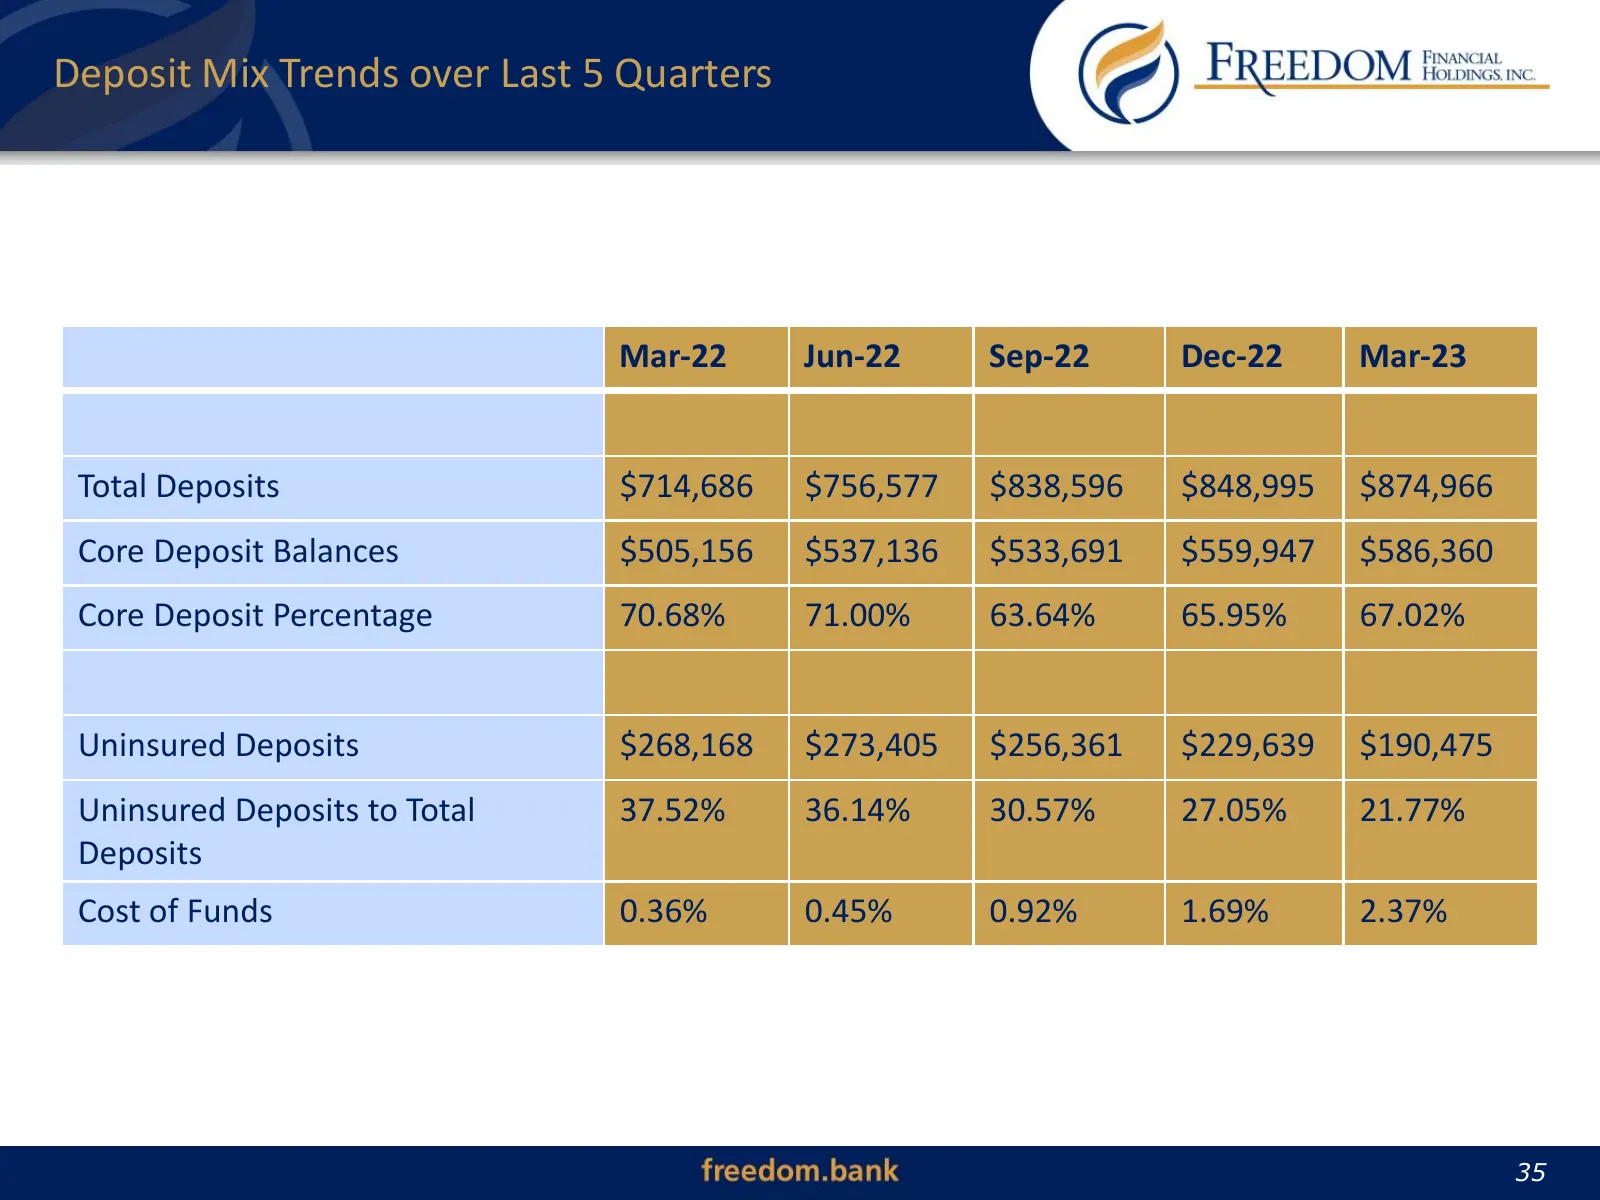
Slide 35: Deposit Mix Trends over Last 5 Quarters
Deposit Mix Trends over Last 5 Quarters Mar-22 Jun-22 Sep-22 Dec-22 Mar-23 Total Deposits $714,686 $756,577 $838,596 $848,995 $874,966 Core Deposit Balances $505,156 $537,136 $533,691 $559,947 $586,360 Core Deposit Percentage 70.68% 71.00% 63.64% 65.95% 67.02% Uninsured Deposits $268,168 $273,405 $2
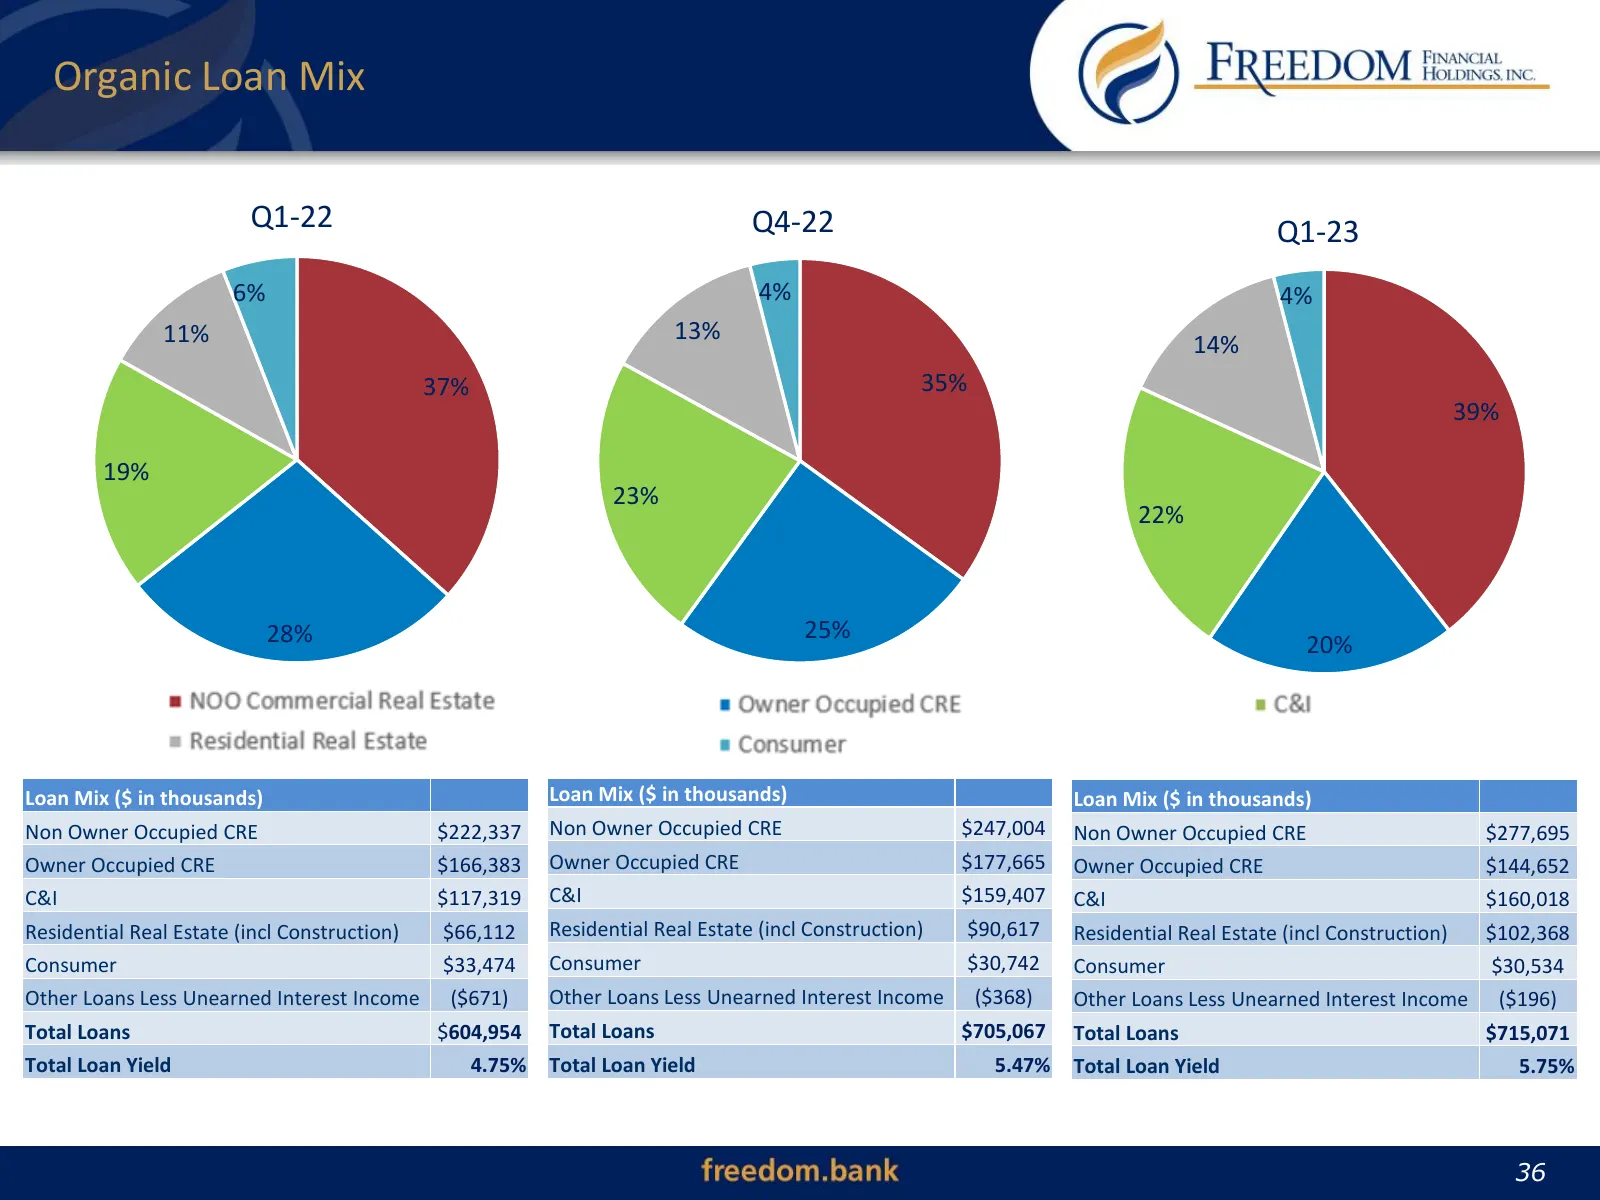
Slide 36: Organic Loan Mix
Organic Loan Mix Q1-22 Q4-22 Q1-23 6% 4% 4% 11% 13% 14% 37% 35% 39% 19% 23% 22% 28% 25% 20% Loan Mix ($ in thousands) Loan Mix ($ in thousands) Loan Mix ($ in thousands) Non Owner Occupied CRE $222,337 Non Owner Occupied CRE $247,004 Non Owner Occupied CRE $277,695 Owner Occupied CRE $166,383 Owner
Slide 37: Office CRE Loans as of March 31, 2023
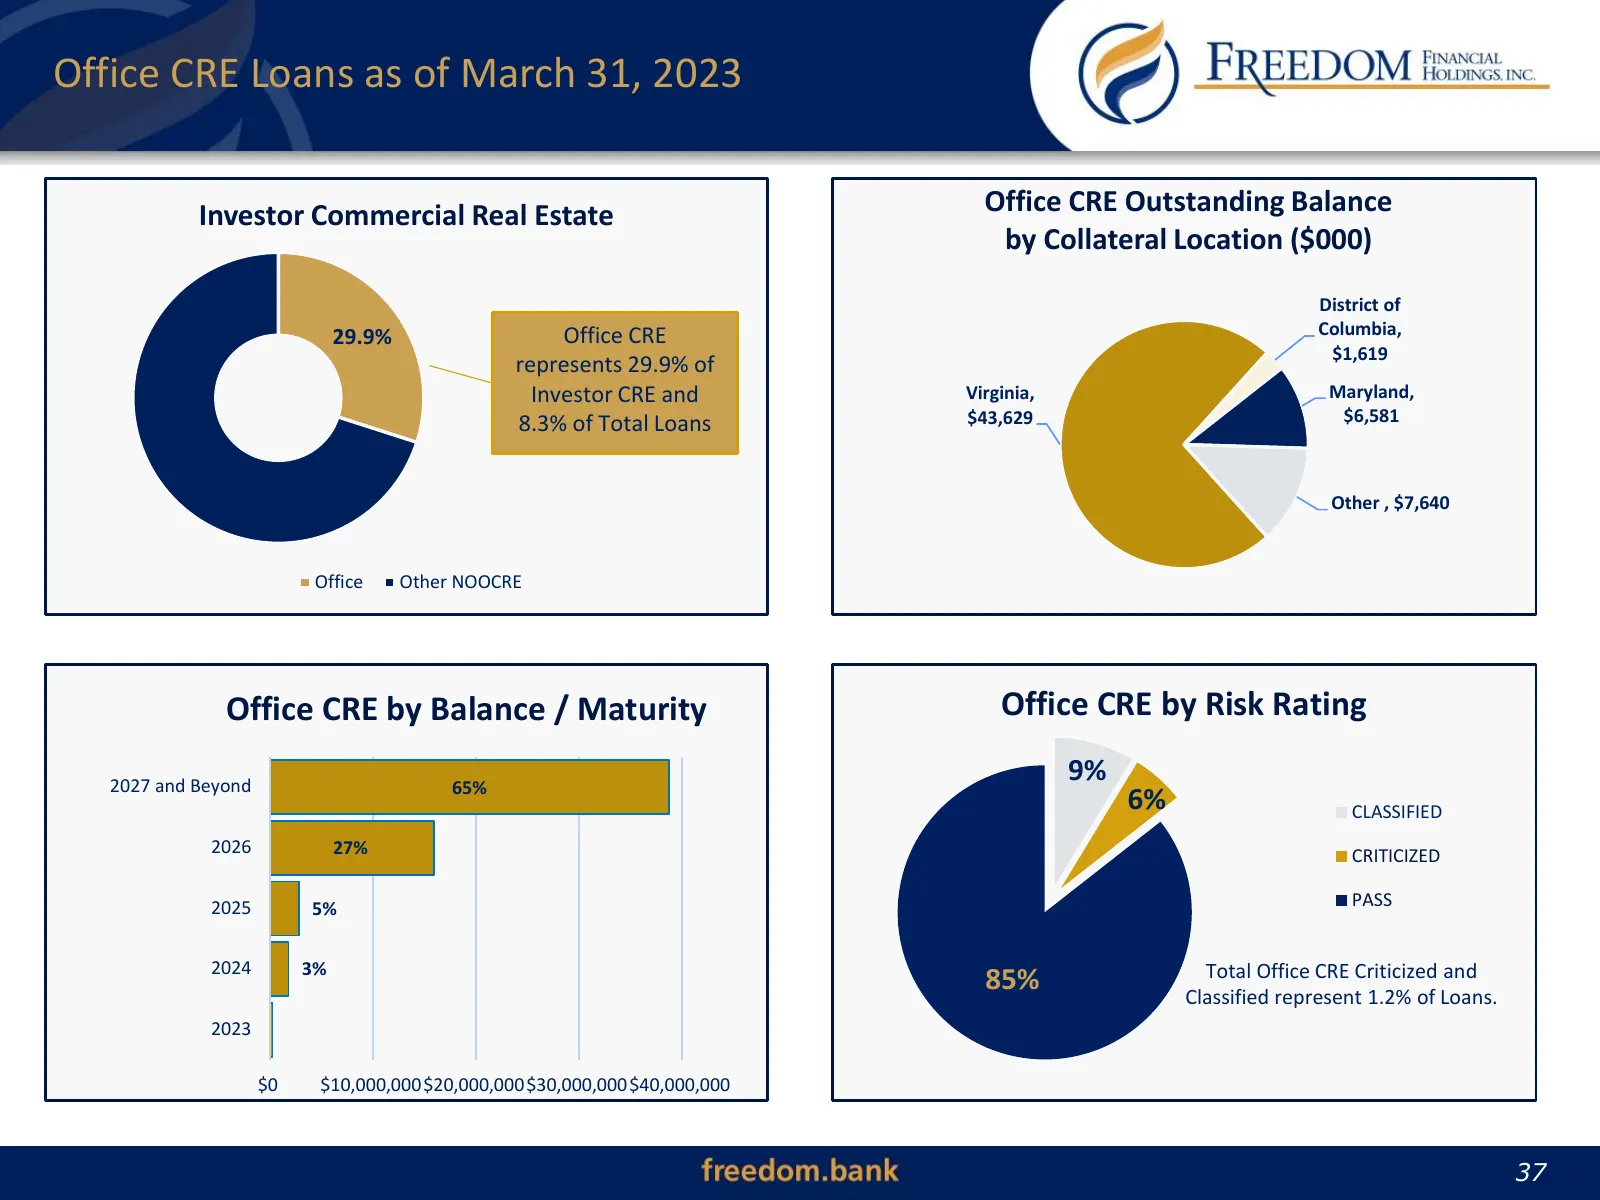
Office CRE Loans as of March 31, 2023 Investor Commercial Real Estate Office CRE Outstanding Balance by Collateral Location ($000) District of 29.9% Office CRE Columbia, $1,619 represents 29.9% of Investor CRE and Virginia, Maryland, 8.3% of Total Loans $43,629 $6,581 Other , $7,640 Office Other NOO
Slide 38: Investment Summary
Investment Summary 38
Slide 39: Vision and Values
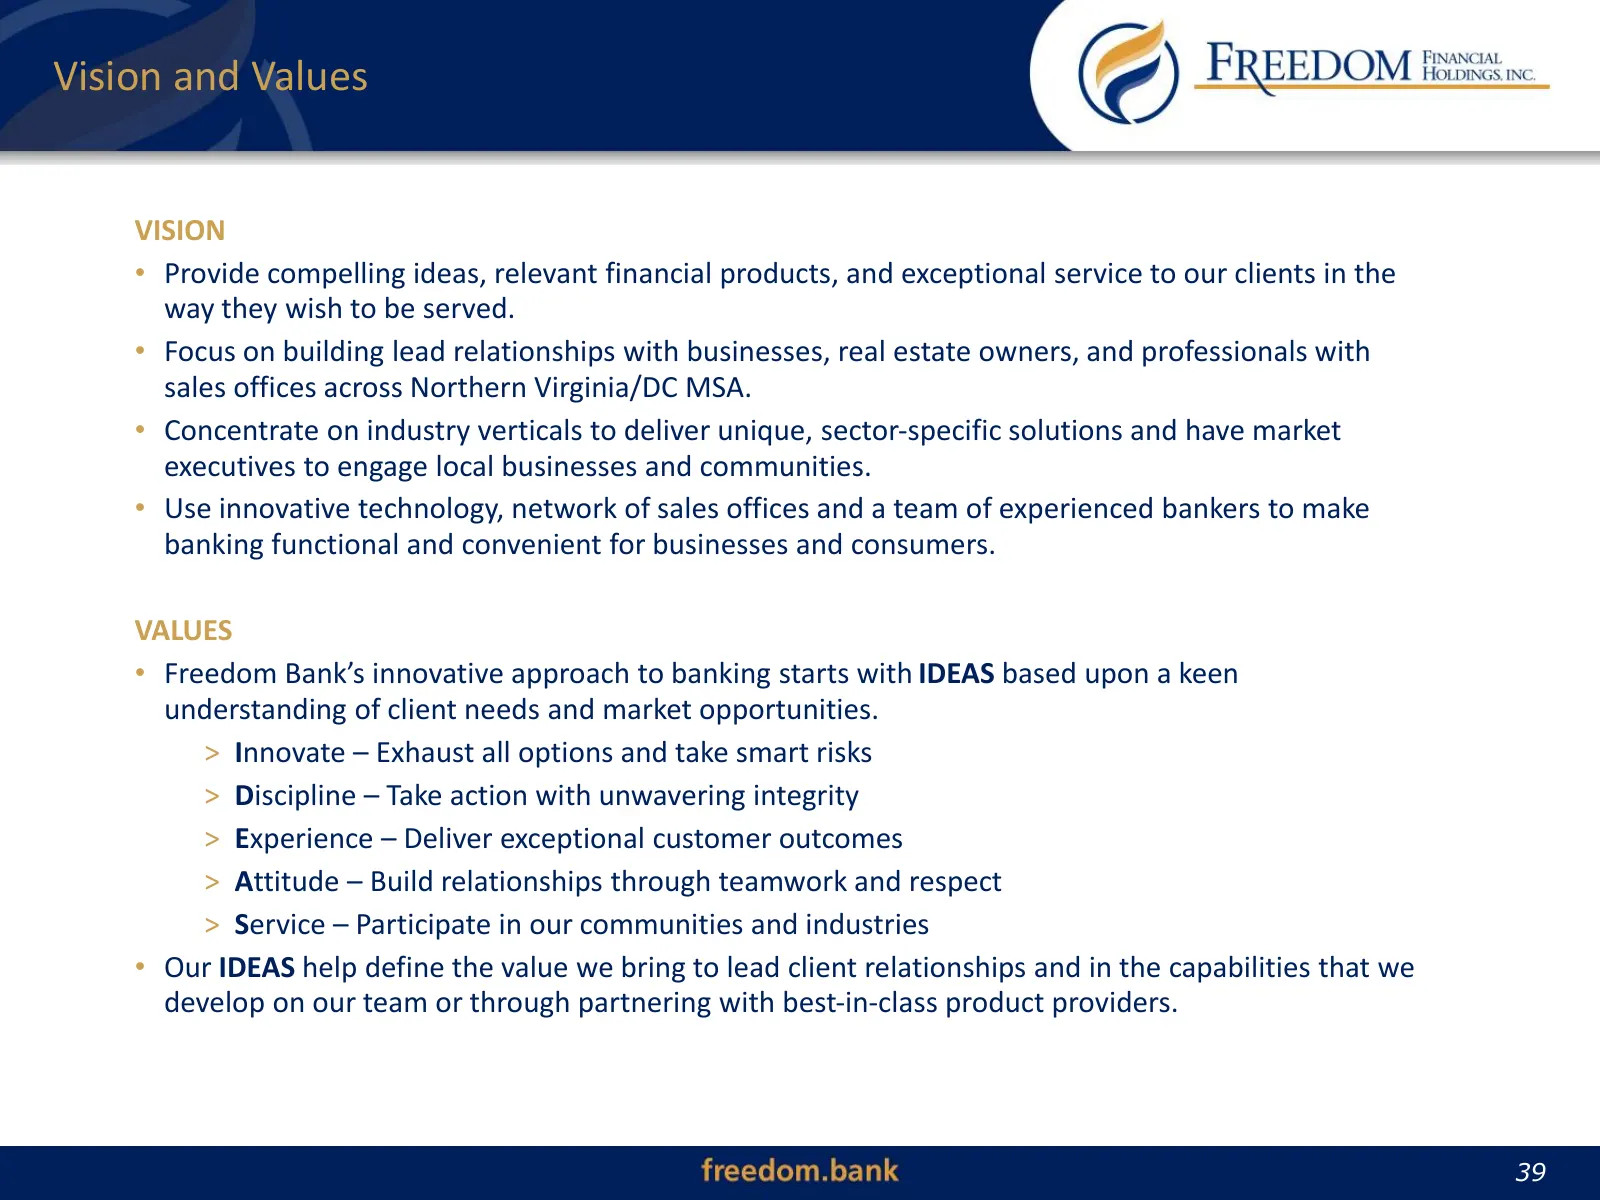
Vision and Values VISION • Provide compelling ideas, relevant financial products, and exceptional service to our clients in the way they wish to be served. • Focus on building lead relationships with businesses, real estate owners, and professionals with sales offices across Northern Virginia/DC MSA
Slide 40: Investing in our Strategic Plan
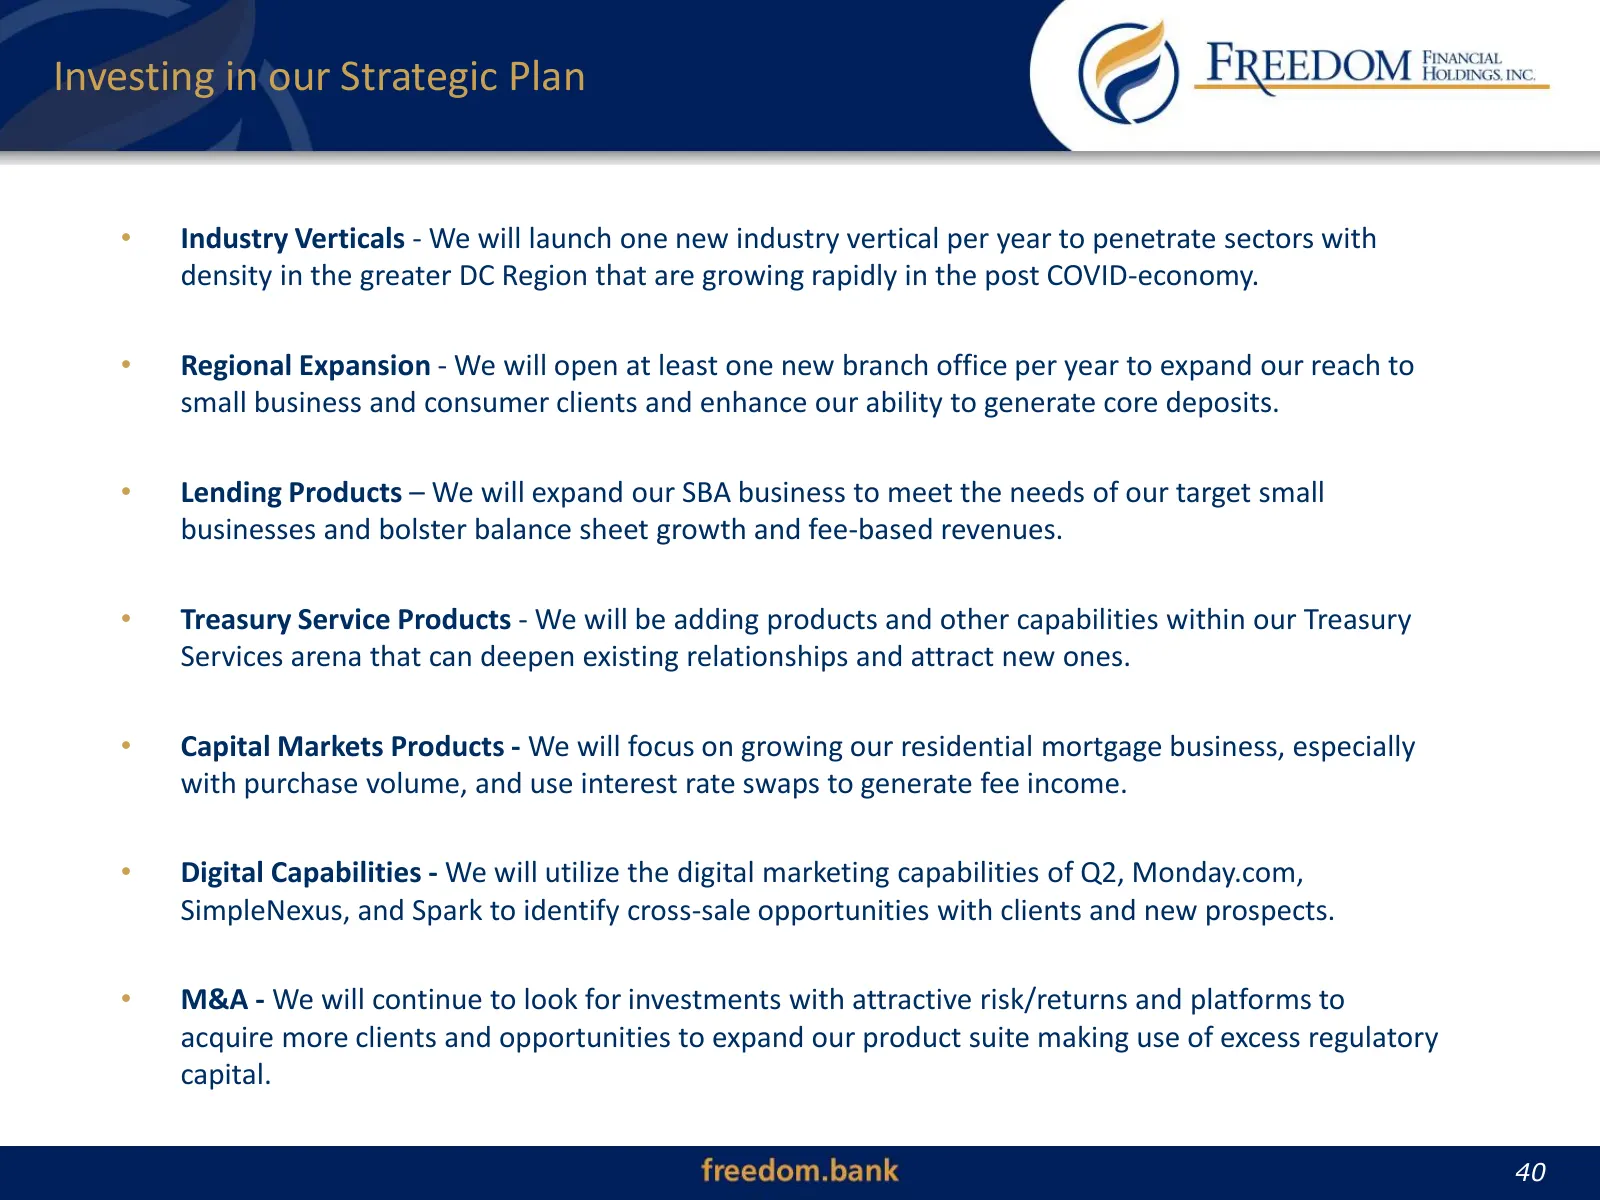
Investing in our Strategic Plan • Industry Verticals - We will launch one new industry vertical per year to penetrate sectors with density in the greater DC Region that are growing rapidly in the post COVID-economy. • Regional Expansion - We will open at least one new branch office per year to expan
Slide 41: Summary of Corporate Attributes
Summary of Corporate Attributes Washington DC MSA and the Northern Virginia market is one of the most affluent, diverse, and resilient economies in the United States and should fare better than most markets as inflation and rising interest rates begin to negatively impact local economies and asset v
Slide 42: Building Shareholder Value
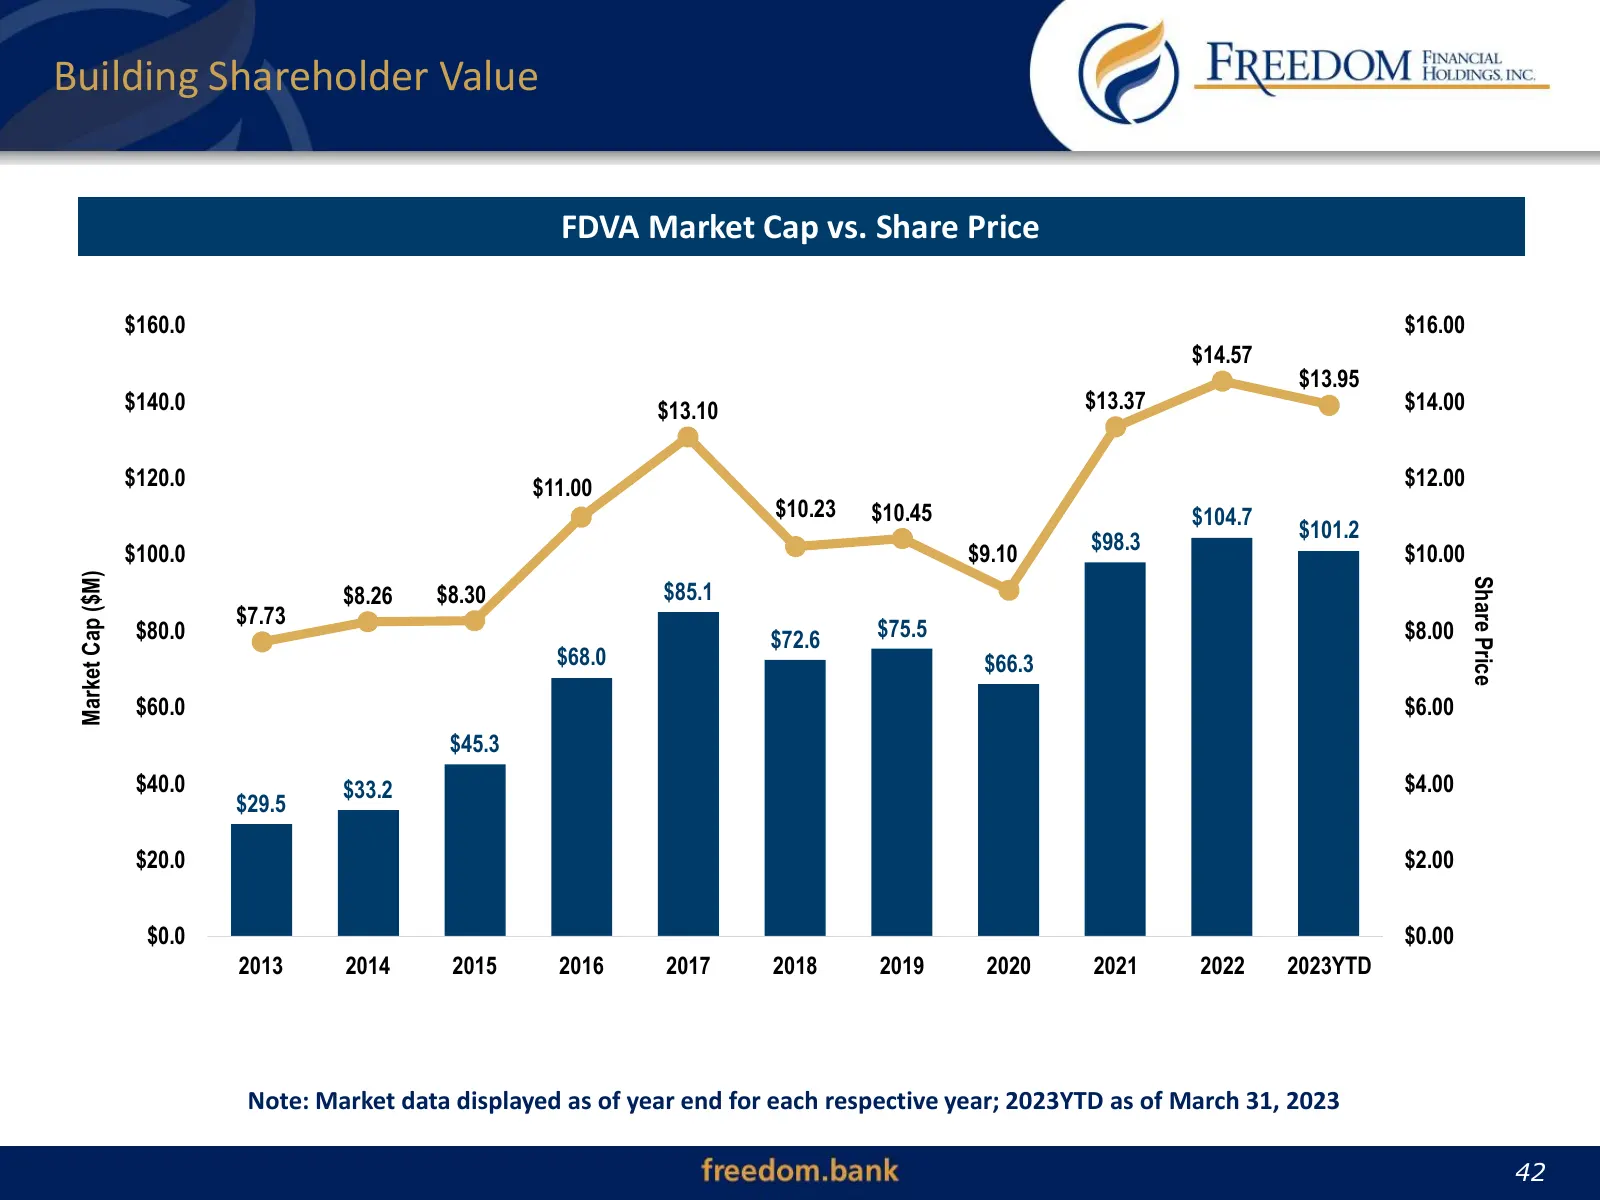
Building Shareholder Value FDVA Market Cap vs. Share Price $160.0 $16.00 $14.57 $13.95 $140.0 $13.10 $13.37 $14.00 $120.0 $11.00 $12.00 $10.23 $10.45 $104.7 $98.3 $101.2 $100.0 $9.10 $10.00 Market Cap ($M) Share Price $8.26 $8.30 $85.1 $7.73 $80.0 $72.6 $75.5 $8.00 $68.0 $66.3 $60.0 $6.00 $45.3 $40.
Slide 43: Stock Price Outperforming
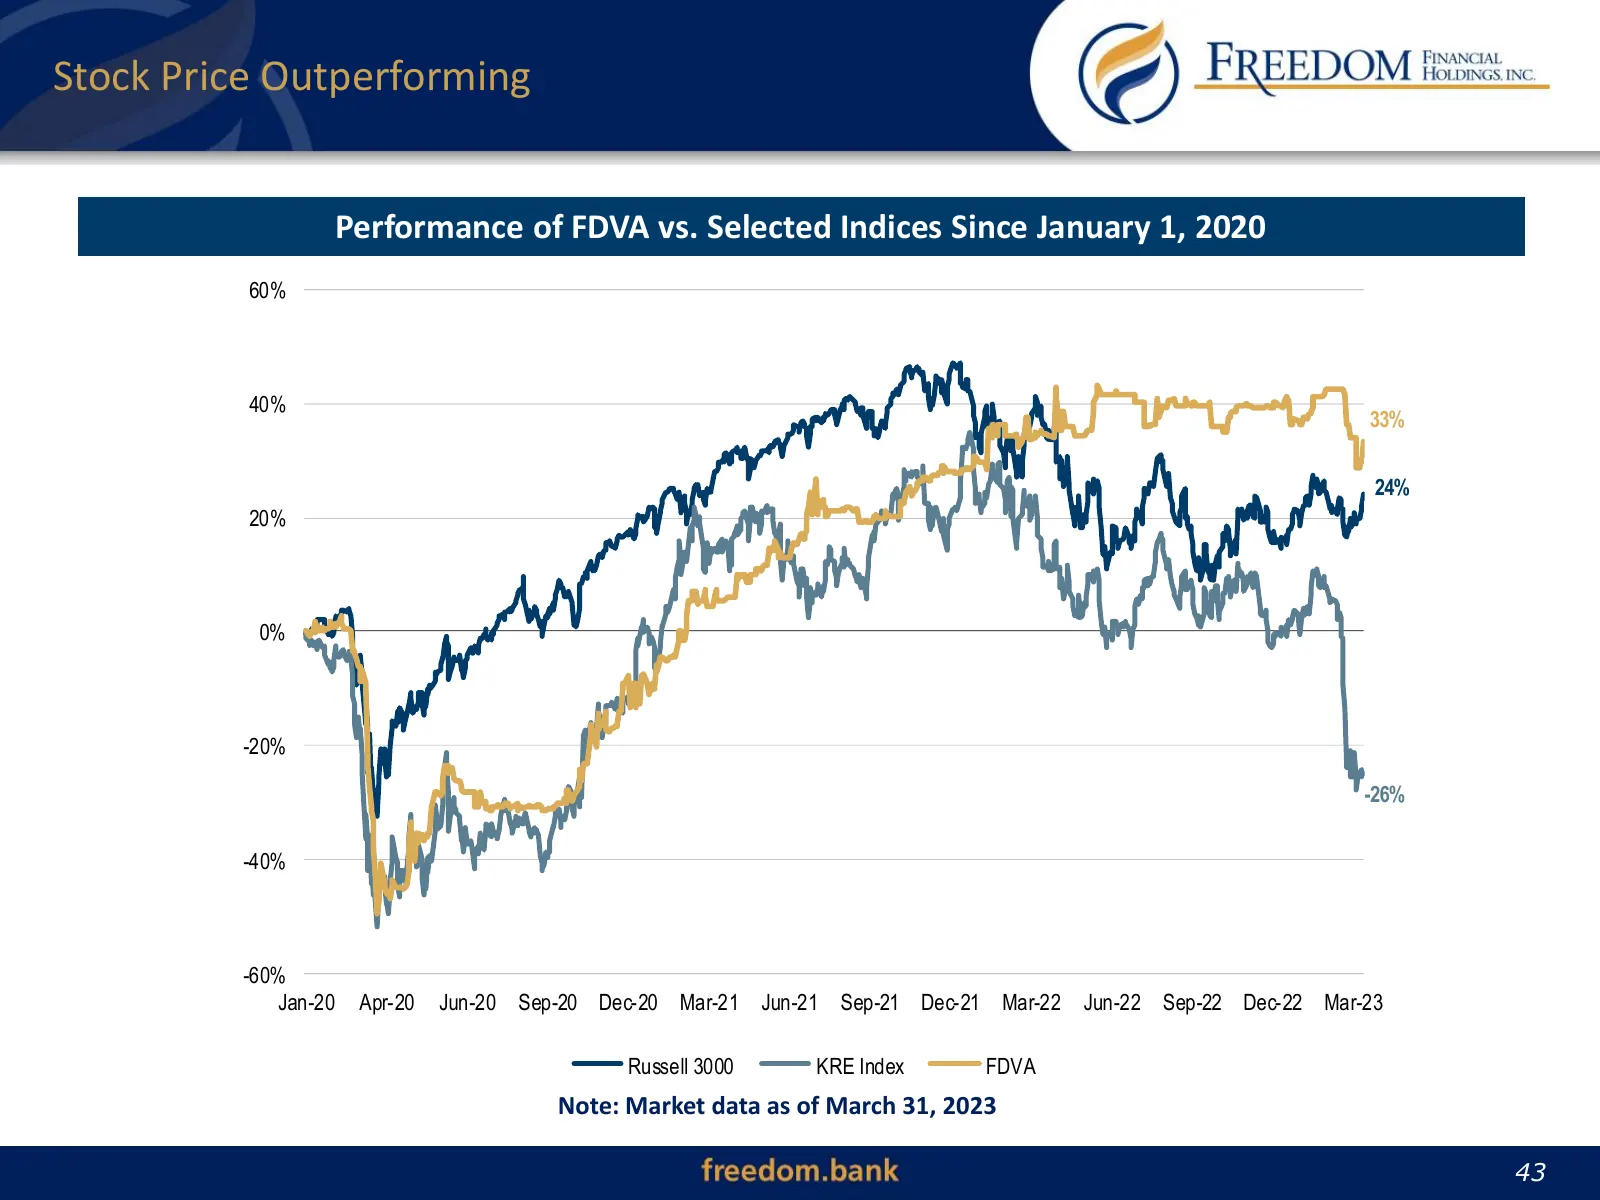
Stock Price Outperforming Performance of FDVA vs. Selected Indices Since January 1, 2020 60% 40% 33% 24% 20% 0% -20% -26% -40% -60% Jan-20 Apr-20 Jun-20 Sep-20 Dec-20 Mar-21 Jun-21 Sep-21 Dec-21 Mar-22 Jun-22 Sep-22 Dec-22 Mar-23 Russell 3000 KRE Index FDVA Note: Market data as of March 31, 2023 43
Slide 44: Contact Information
Contact Information Joseph J. Thomas, CFA President and CEO jthomas@freedom.bank 703-667-4161 10555 Main Street, Suite 600 Fairfax, VA 22030 44 44
Source: company website
More decks from Freedom Financial Holdings Inc
 Q3 2026 Earnings Presentation32 slides · Nov 3, 2026
 Q2 2026 Earnings Presentation31 slides · Aug 3, 2026
 Shareholder Meeting (April 2026)41 slides · Apr 30, 2026
 Q4 2025 Earnings Presentation39 slides · Jan 30, 2026
 Q3 2025 Earnings Presentation39 slides · Oct 31, 2025
 Q2 2025 Earnings Presentation38 slides · Aug 4, 2025