Varex Imaging Corporation · NASDAQ:VREX
Varex Imaging — Q2 2022 Earnings Presentation
22 slides from Varex Imaging's earnings presentation, May 3, 2022

Slide 1: Q2 FY22 Earnings Presentation
Solutions in Sight® Q2 FY22 Earnings Presentation May 3, 2022
Slide 2: Forward Looking Statements / Non-GAAP Measures
Forward Looking Statements / Non-GAAP Measures Forward Looking Statements Certain statements in this supplement contain “forward-looking statements” within the meaning of Section 27A of the Securities Act of 1933 and Section 21E of the Securities Exchange Act of 1934. Forward looking statements incl
Slide 3: Q2 FY22 Results
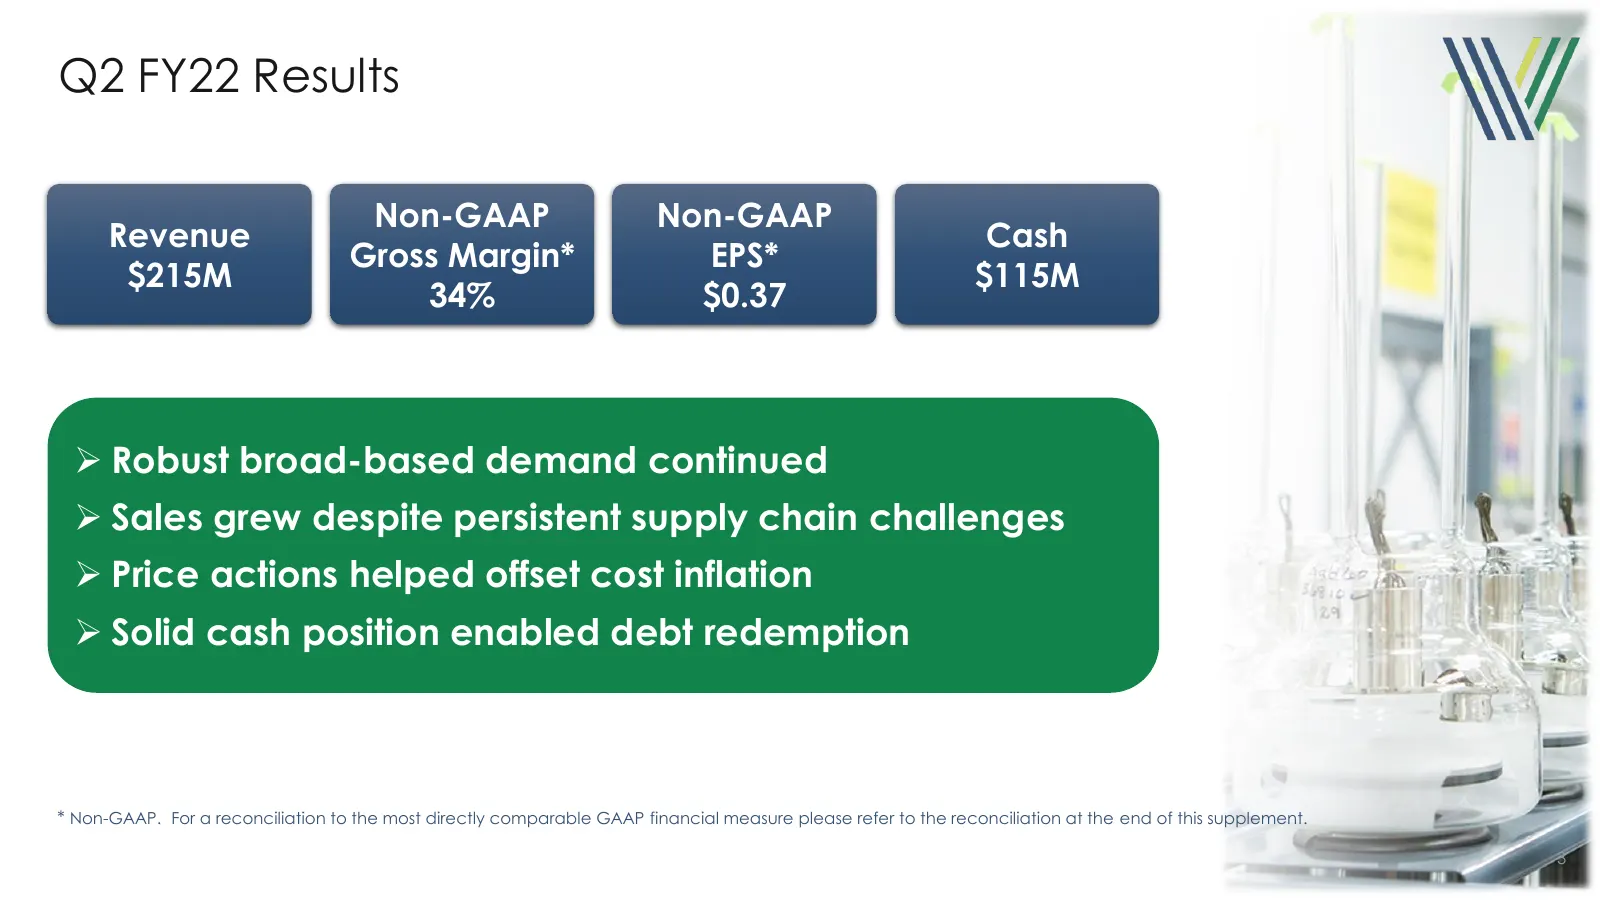
Q2 FY22 Results Non-GAAP Non-GAAP Revenue Cash Gross Margin* EPS* $215M $115M 34% $0.37 ➢ Robust broad-based demand continued ➢ Sales grew despite persistent supply chain challenges ➢ Price actions helped offset cost inflation ➢ Solid cash position enabled debt redemption * Non-GAAP. For a reconcili
Slide 4: Q2 FY22 Sequential Performance
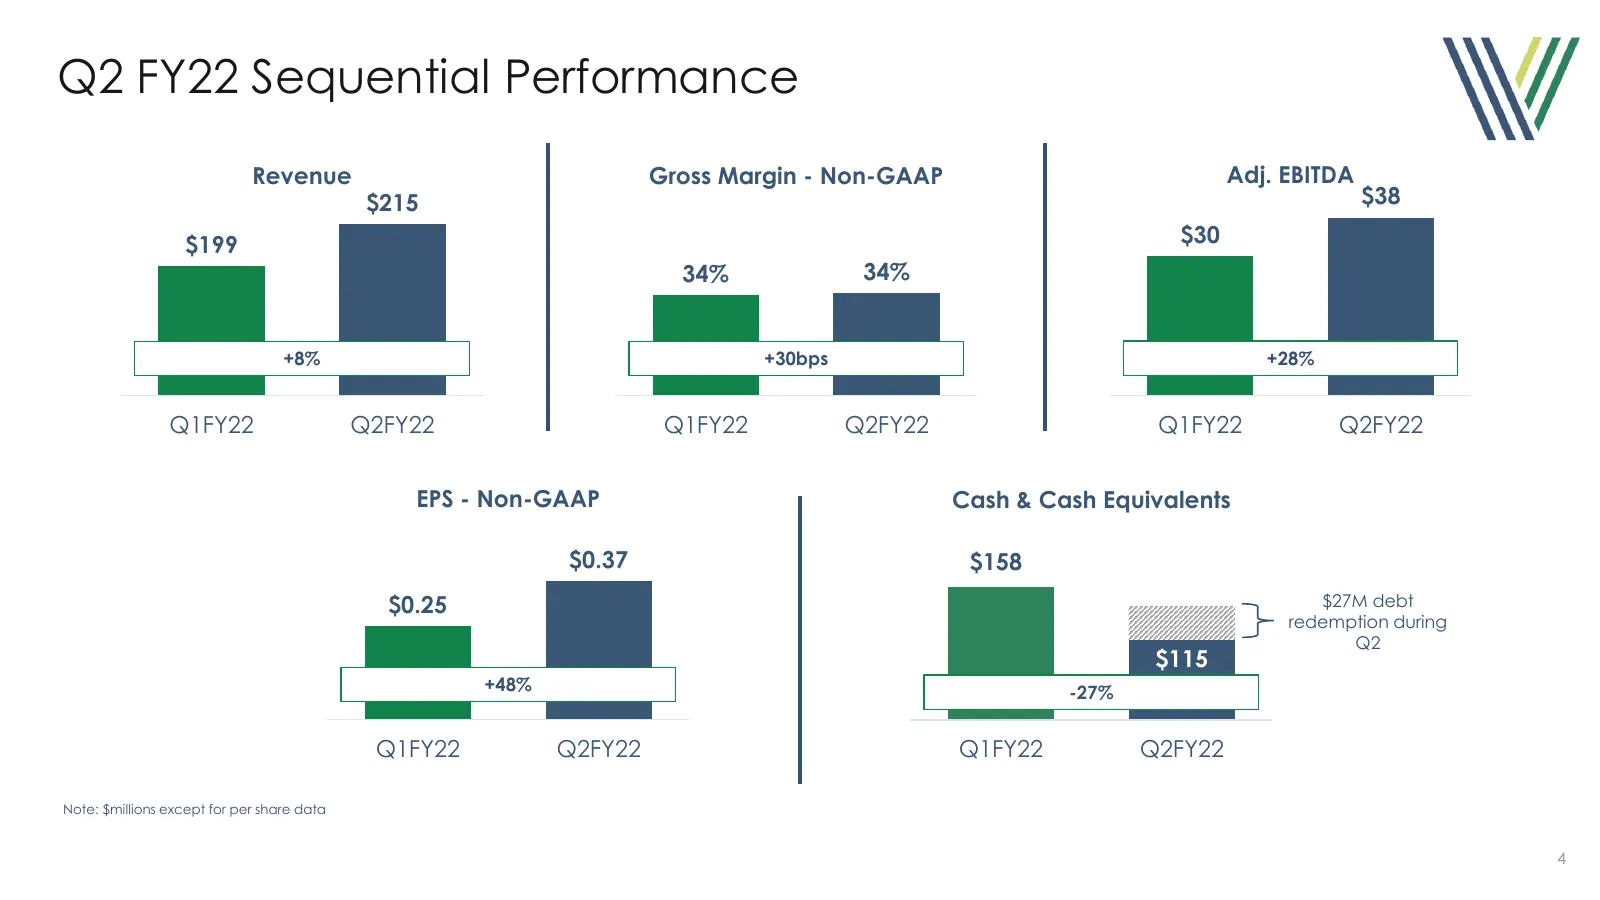
Q2 FY22 Sequential Performance Revenue Gross Margin - Non-GAAP Adj. EBITDA $215 $38 $199 $30 34% 34% +8% +30bps +28% Q1FY22 Q2FY22 Q1FY22 Q2FY22 Q1FY22 Q2FY22 EPS - Non-GAAP Cash & Cash Equivalents $0.37 $158 $0.25 $27M debt redemption during Q2 $115 +48% -27% Q1FY22 Q2FY22 Q1FY22 Q2FY22 Note: $mill
Slide 5: Current Demand Environment
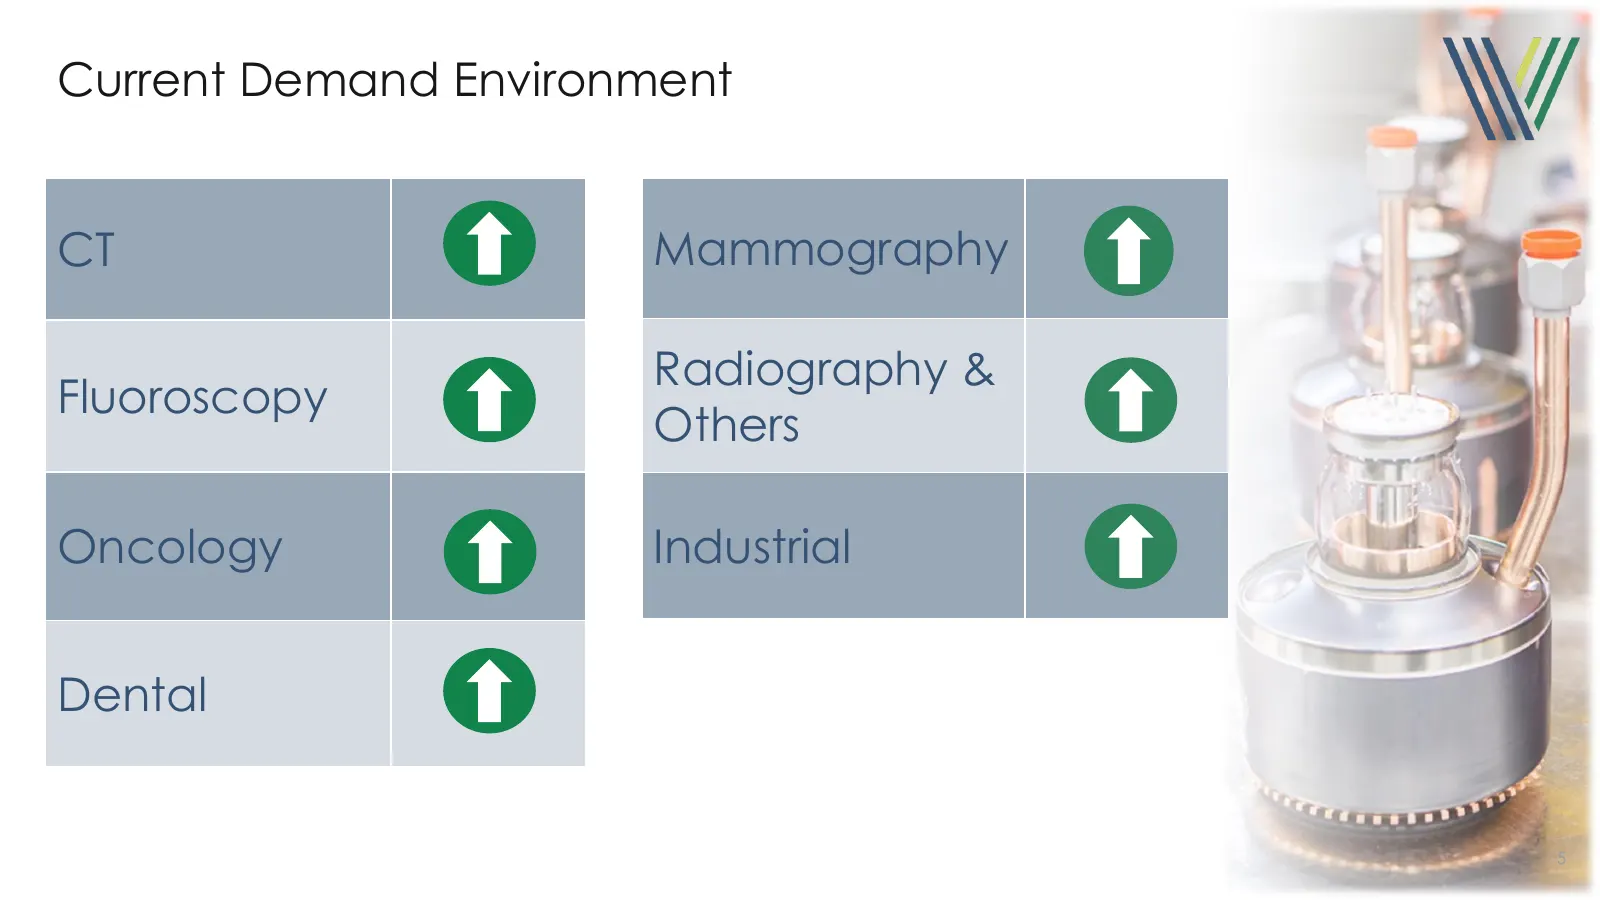
Current Demand Environment CT Mammography Radiography & Fluoroscopy Others Oncology Industrial Dental 5
Slide 6: Business dynamics
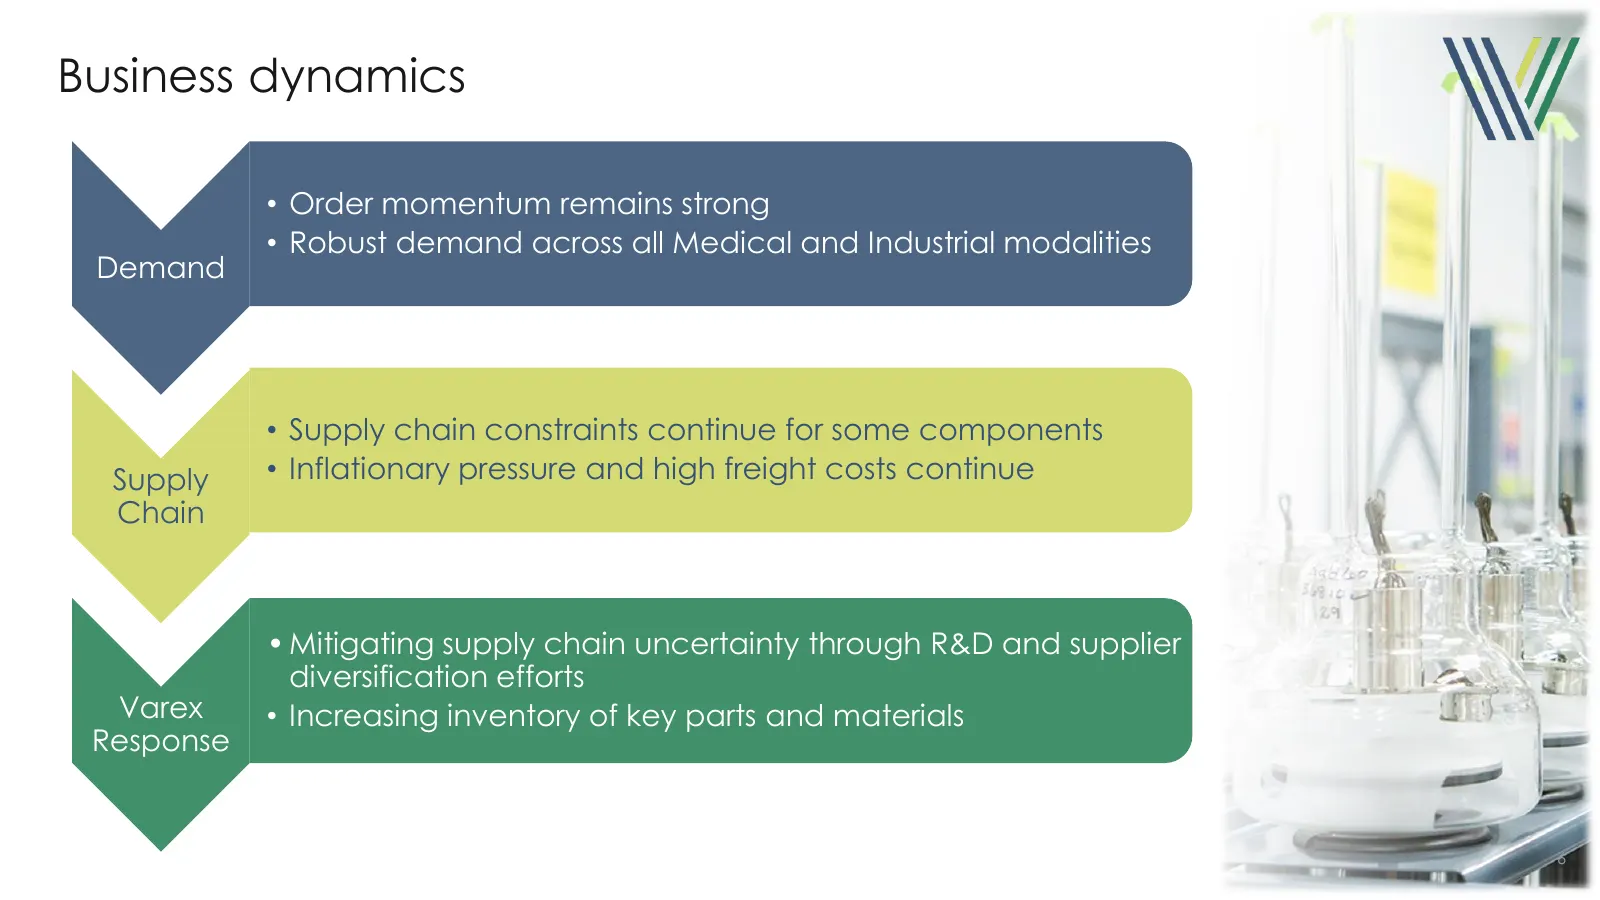
Business dynamics • Order momentum remains strong • Robust demand across all Medical and Industrial modalities Demand • Supply chain constraints continue for some components Supply • Inflationary pressure and high freight costs continue Chain • Mitigating supply chain uncertainty through R&D and sup
Slide 7: Q2 FY22 Revenue Details
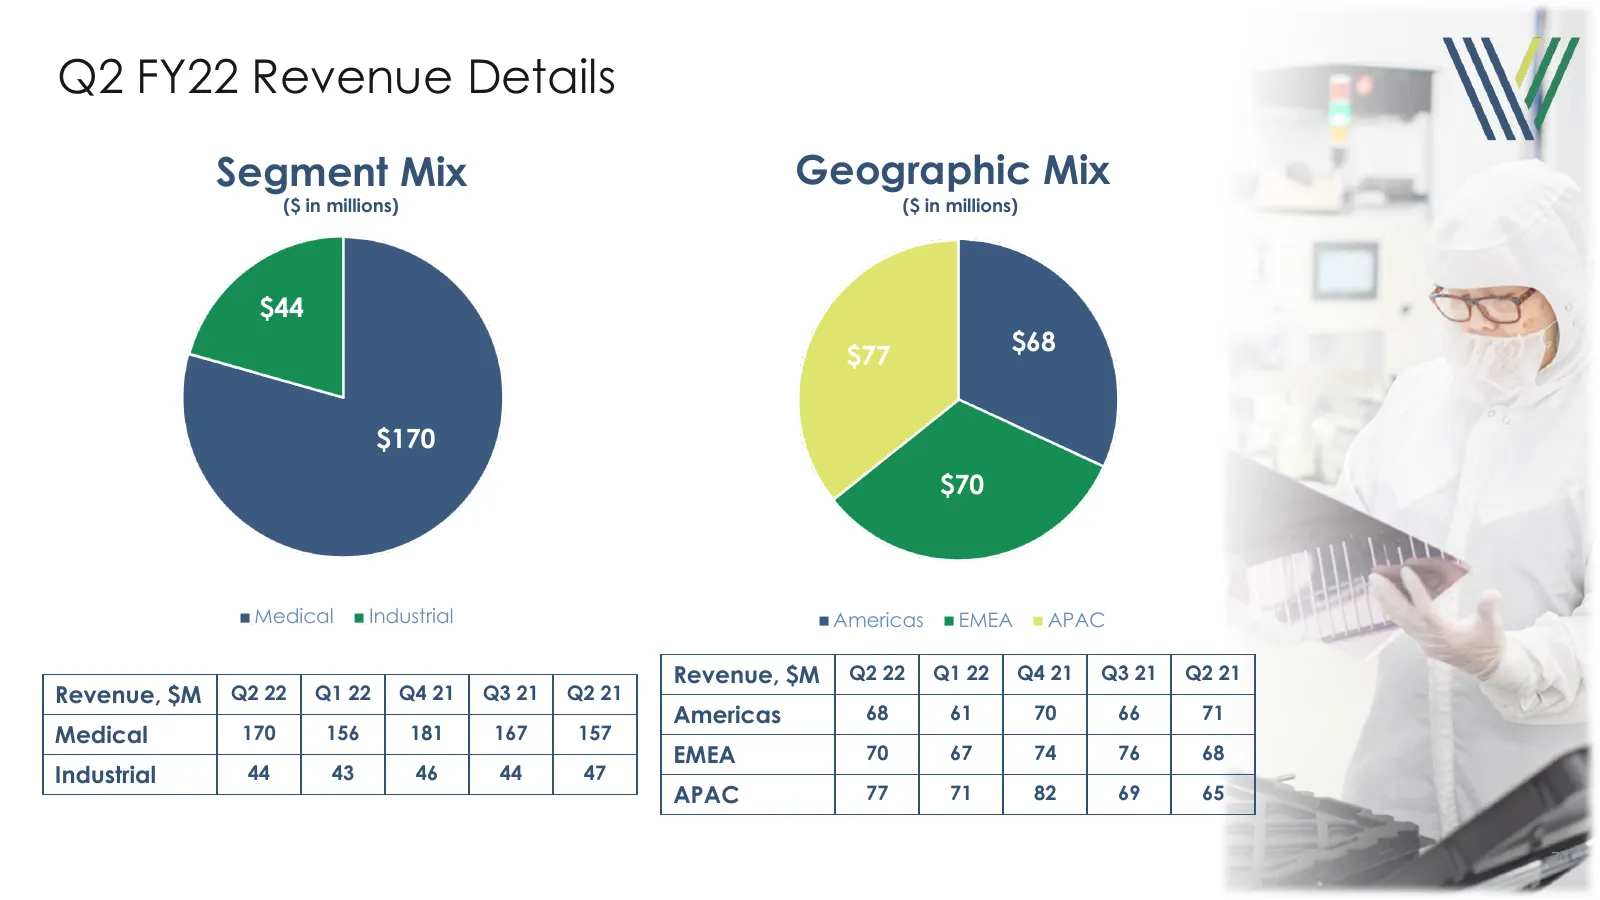
Q2 FY22 Revenue Details Segment Mix Geographic Mix ($ in millions) ($ in millions) $44 $68 $77 $170 $70 Medical Industrial Americas EMEA APAC Revenue, $M Q2 22 Q1 22 Q4 21 Q3 21 Q2 21 Revenue, $M Q2 22 Q1 22 Q4 21 Q3 21 Q2 21 Americas 68 61 70 66 71 Medical 170 156 181 167 157 EMEA 70 67 74 76 68 In
Slide 8: Quarterly Results - GAAP
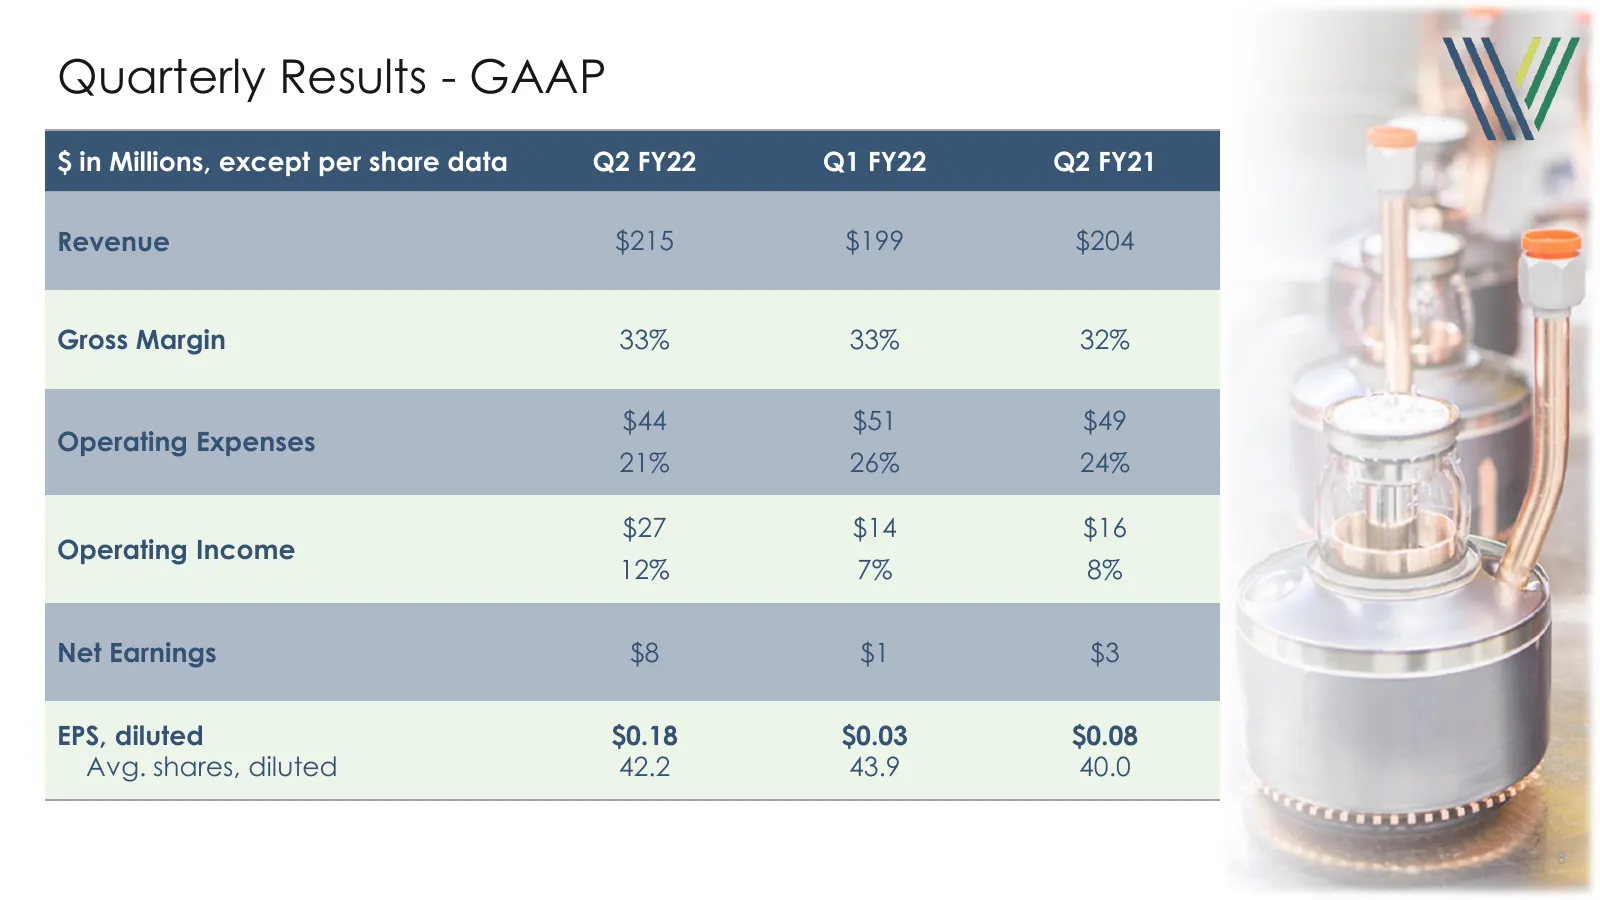
Quarterly Results - GAAP $ in Millions, except per share data Q2 FY22 Q1 FY22 Q2 FY21 Revenue $215 $199 $204 Gross Margin 33% 33% 32% $44 $51 $49 Operating Expenses 21% 26% 24% $27 $14 $16 Operating Income 12% 7% 8% Net Earnings $8 $1 $3 EPS, diluted $0.18 $0.03 $0.08 Avg. shares, diluted 42.2 43.9
Slide 9: Quarterly results – Non-GAAP
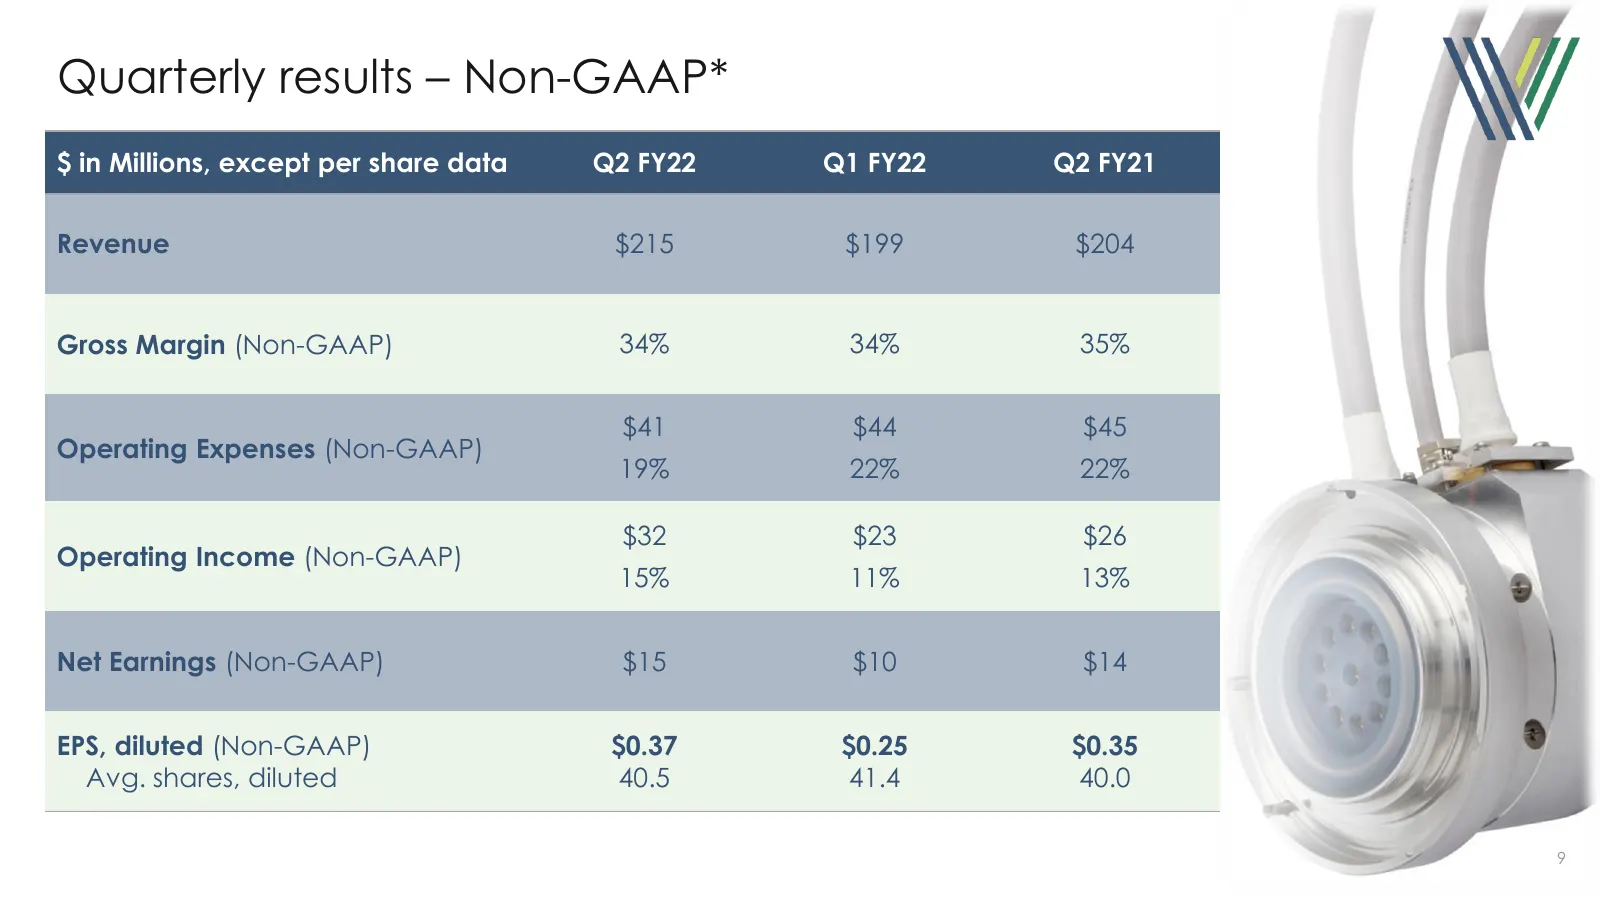
Quarterly results – Non-GAAP* $ in Millions, except per share data Q2 FY22 Q1 FY22 Q2 FY21 Revenue $215 $199 $204 Gross Margin (Non-GAAP) 34% 34% 35% $41 $44 $45 Operating Expenses (Non-GAAP) 19% 22% 22% $32 $23 $26 Operating Income (Non-GAAP) 15% 11% 13% Net Earnings (Non-GAAP) $15 $10 $14 EPS, dil
Slide 10: Select Balance Sheet Data
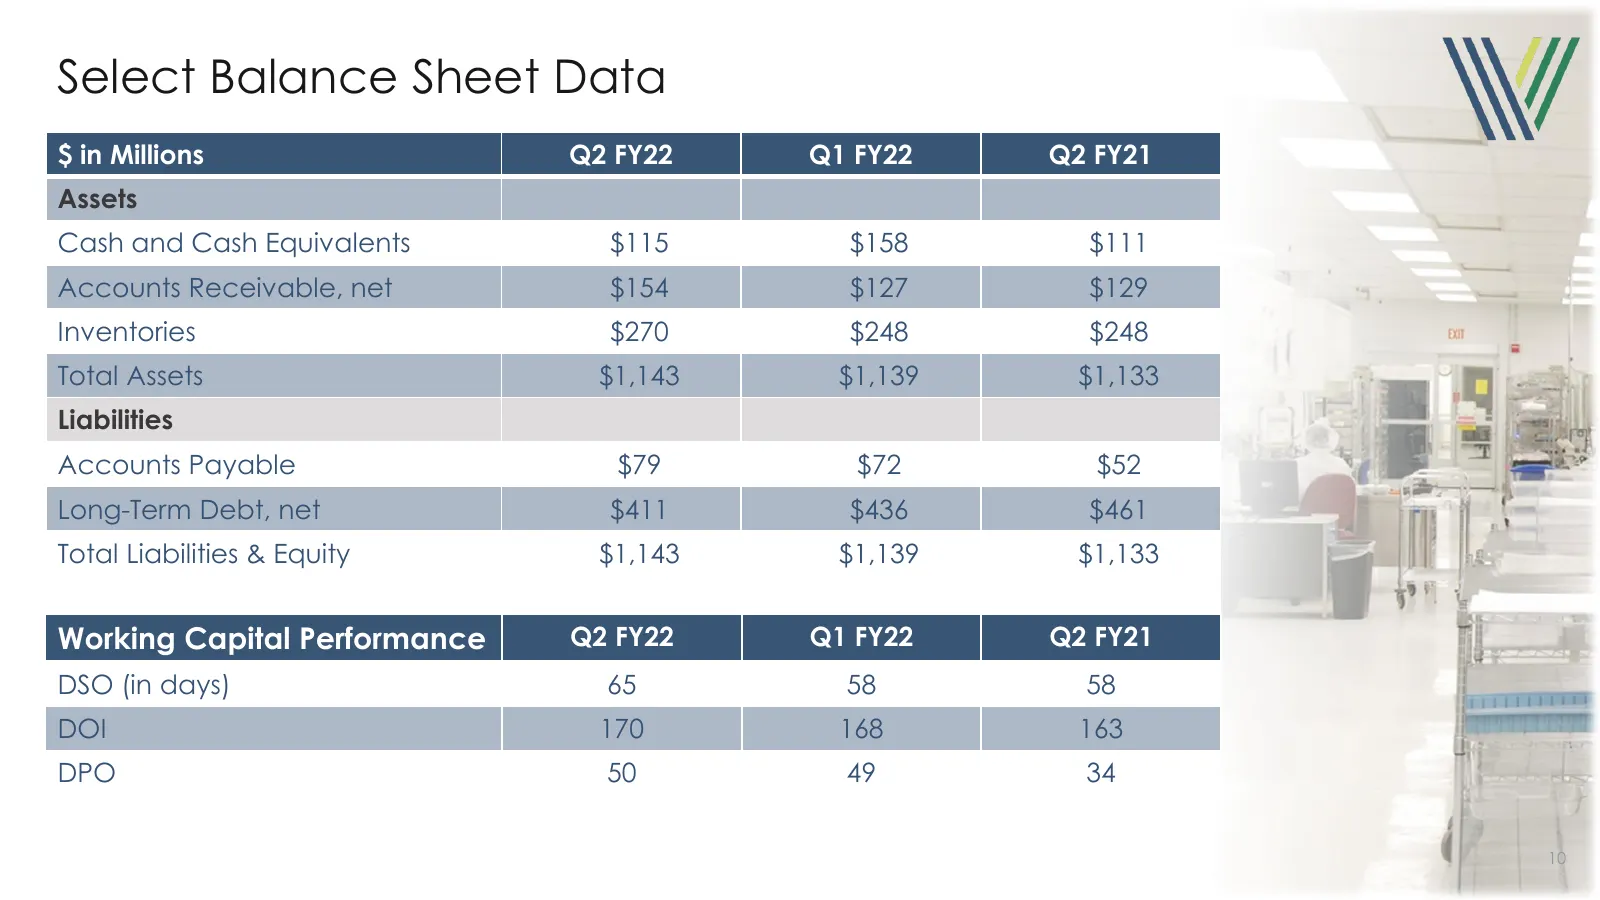
Select Balance Sheet Data $ in Millions Q2 FY22 Q1 FY22 Q2 FY21 Assets Cash and Cash Equivalents $115 $158 $111 Accounts Receivable, net $154 $127 $129 Inventories $270 $248 $248 Total Assets $1,143 $1,139 $1,133 Liabilities Accounts Payable $79 $72 $52 Long-Term Debt, net $411 $436 $461 Total Liabi
Slide 11: Select Debt and Cash Flow Data
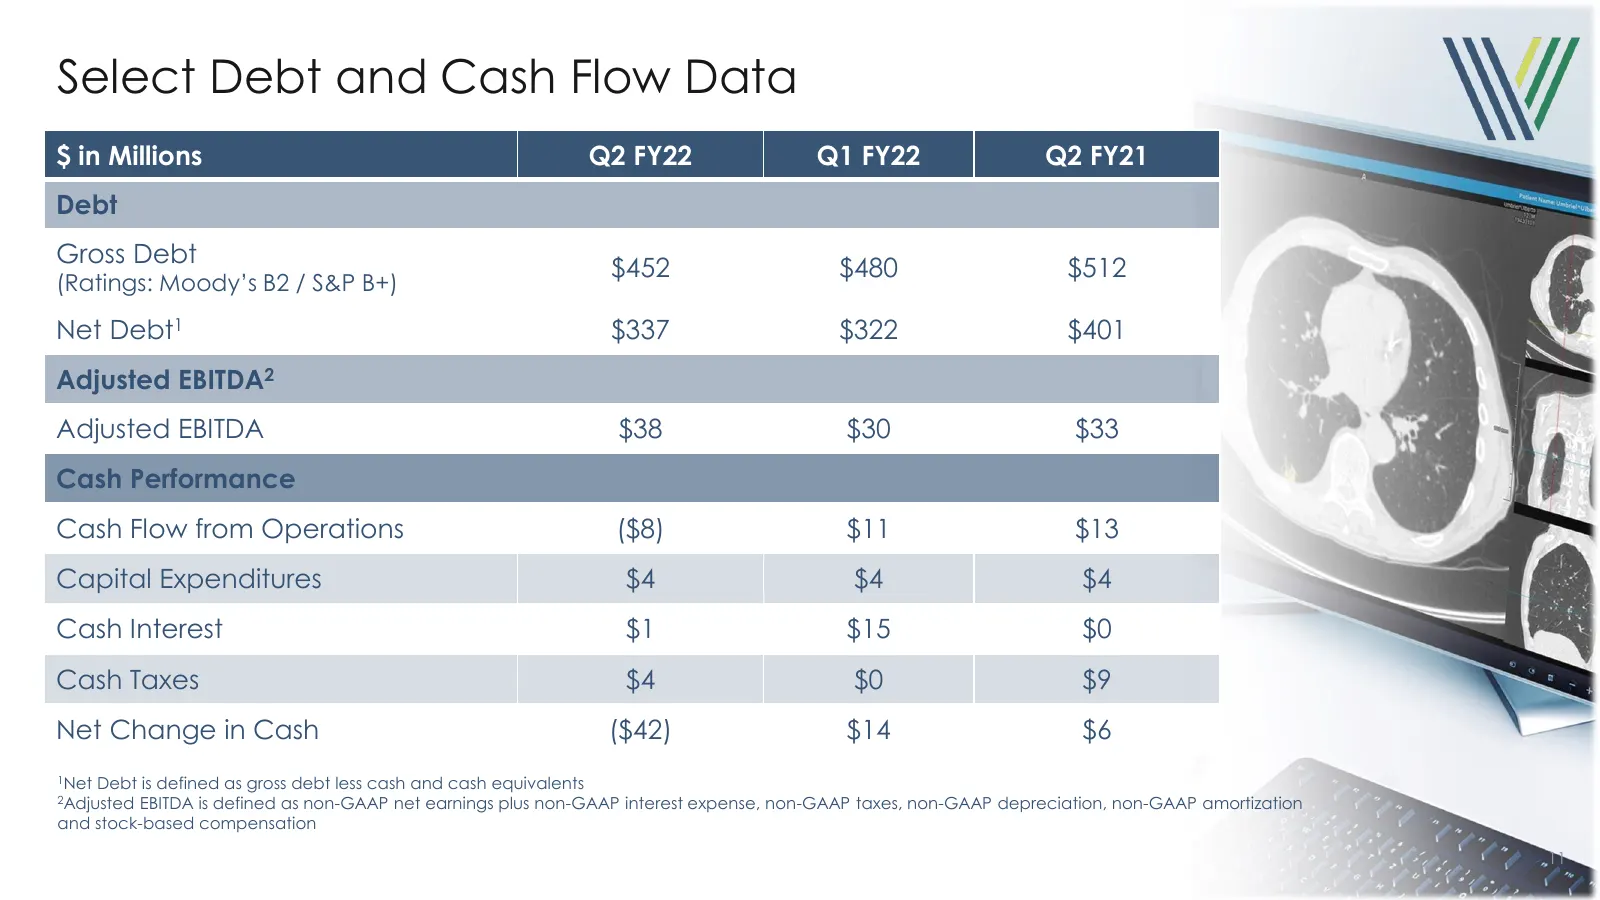
Select Debt and Cash Flow Data $ in Millions Q2 FY22 Q1 FY22 Q2 FY21 Debt Gross Debt $452 $480 $512 (Ratings: Moody’s B2 / S&P B+) Net Debt1 $337 $322 $401 Adjusted EBITDA2 Adjusted EBITDA $38 $30 $33 Cash Performance Cash Flow from Operations ($8) $11 $13 Capital Expenditures $4 $4 $4 Cash Interest
Slide 12: Outlook Q3 FY22
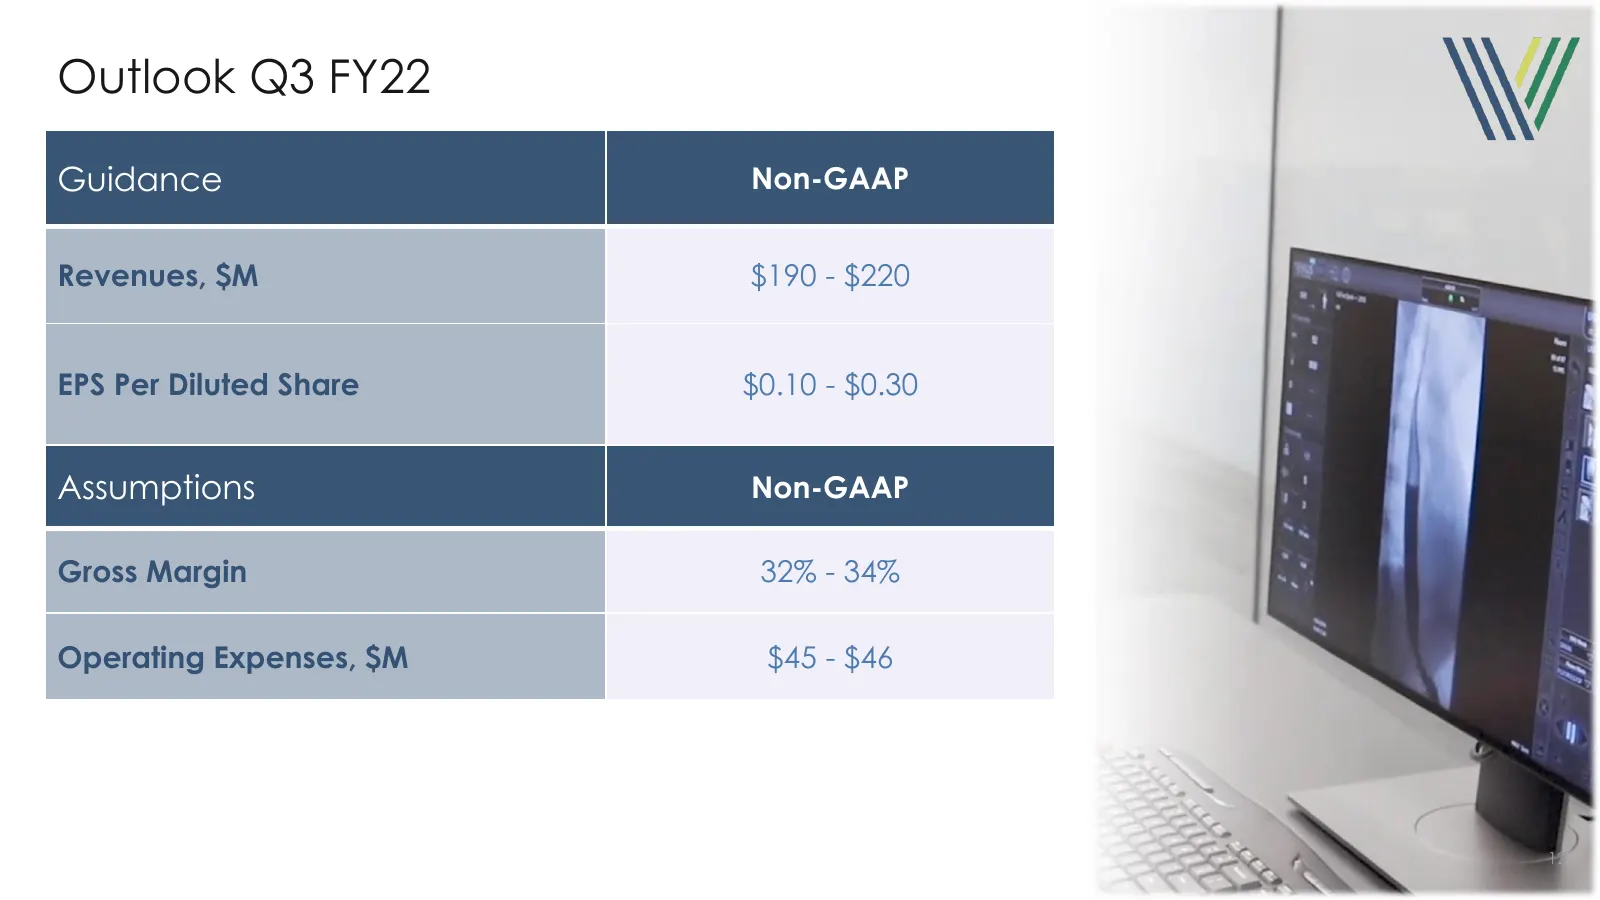
Outlook Q3 FY22 Guidance Non-GAAP Revenues, $M $190 - $220 EPS Per Diluted Share $0.10 - $0.30 Assumptions Non-GAAP Gross Margin 32% - 34% Operating Expenses, $M $45 - $46 12

Slide 13: Q&A
W VAREX MA G Solutions in Sight® VREX Nasdaq isted Pf Nasdaq Q&A

Slide 14: Non-GAAP Reconciliation
Solutions in Sight® Non – GAAP Reconciliation 14
Slide 15: Reconciliation between GAAP and Non-GAAP Financial measures (unaudited)
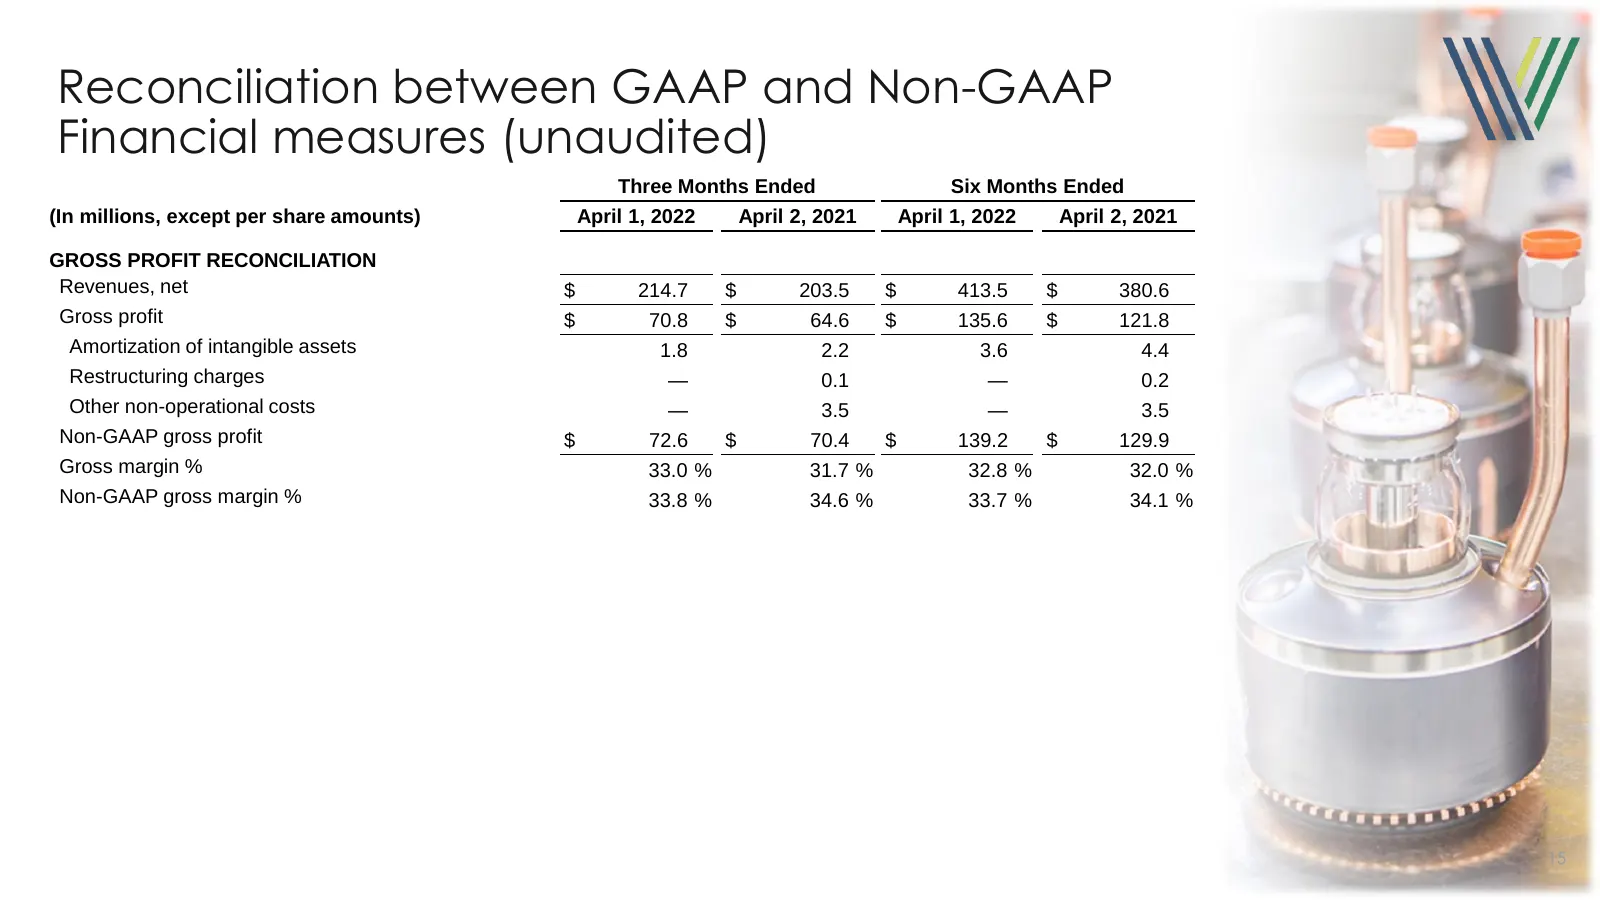
Reconciliation between GAAP and Non-GAAP Financial measures (unaudited) Three Months Ended Six Months Ended (In millions, except per share amounts) April 1, 2022 April 2, 2021 April 1, 2022 April 2, 2021 GROSS PROFIT RECONCILIATION Revenues, net $ 214.7 $ 203.5 $ 413.5 $ 380.6 Gross profit $ 70.8 $
Slide 16: Reconciliation between GAAP and Non-GAAP Financial measures (unaudited)
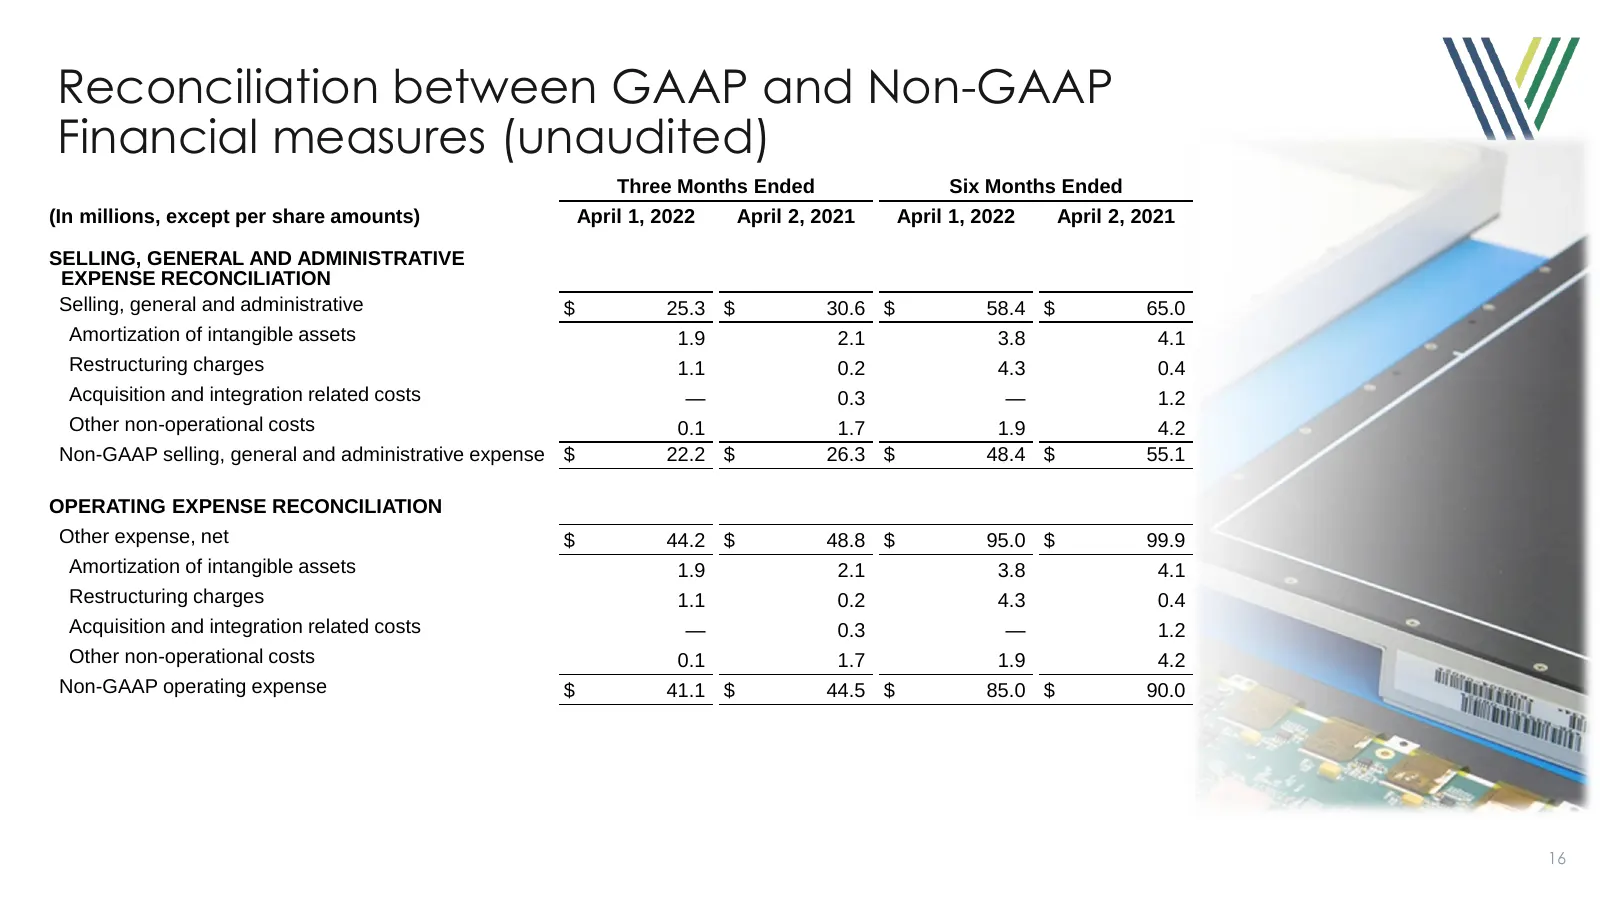
Reconciliation between GAAP and Non-GAAP Financial measures (unaudited) Three Months Ended Six Months Ended (In millions, except per share amounts) April 1, 2022 April 2, 2021 April 1, 2022 April 2, 2021 SELLING, GENERAL AND ADMINISTRATIVE EXPENSE RECONCILIATION Selling, general and administrative $
Slide 17: Reconciliation between GAAP and Non-GAAP Financial measures (unaudited)
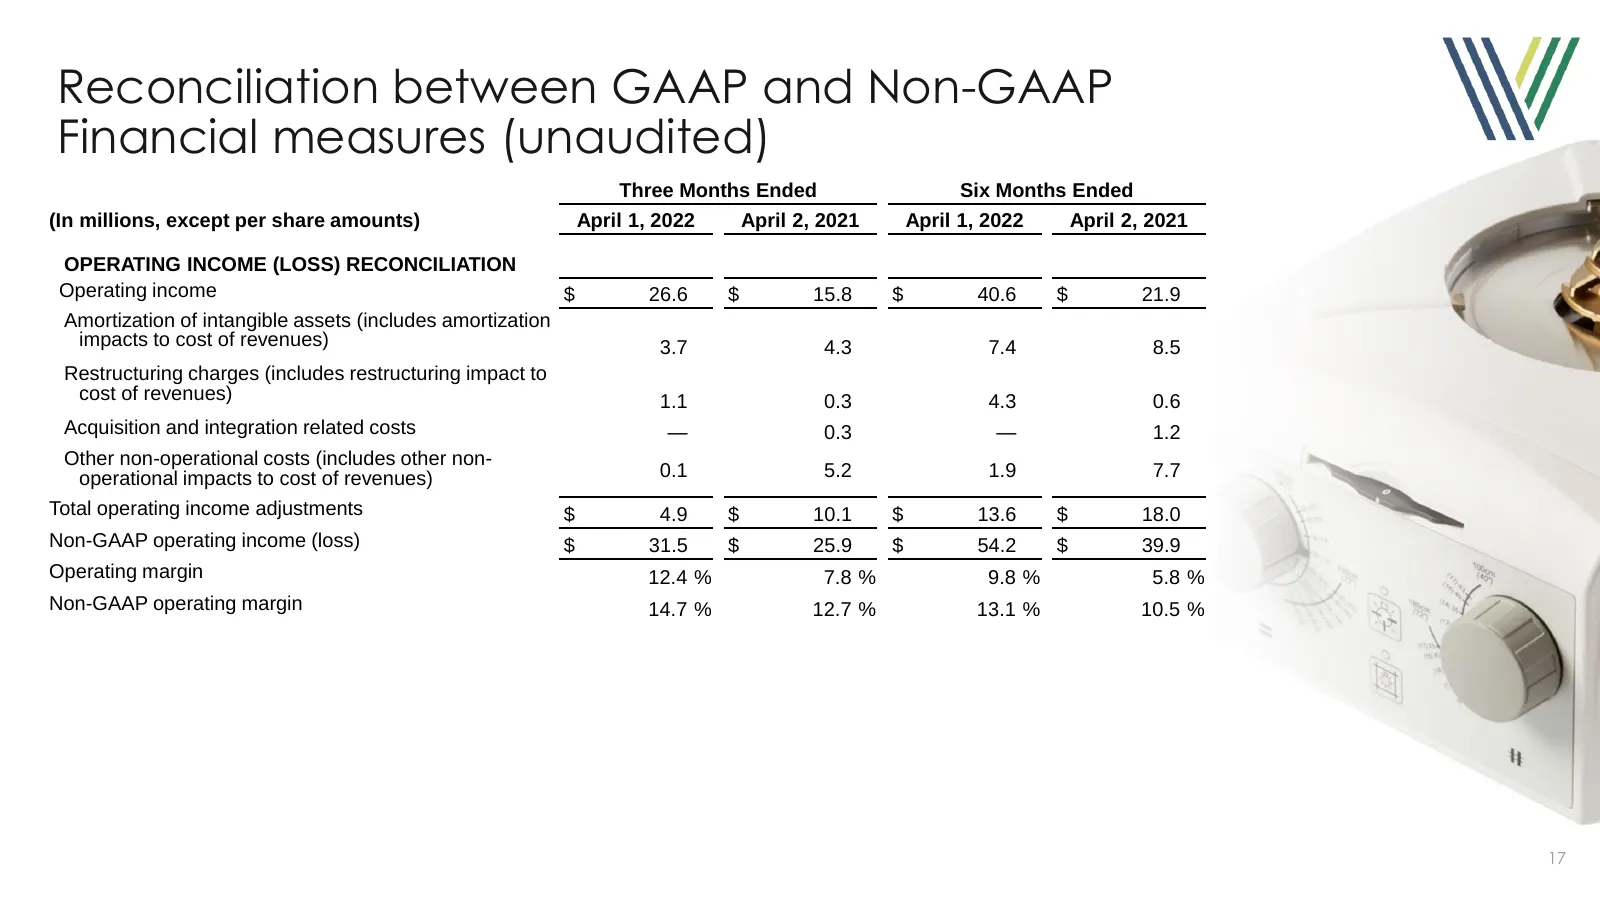
Reconciliation between GAAP and Non-GAAP Financial measures (unaudited) Three Months Ended Six Months Ended (In millions, except per share amounts) April 1, 2022 April 2, 2021 April 1, 2022 April 2, 2021 OPERATING INCOME (LOSS) RECONCILIATION Operating income $ 26.6 $ 15.8 $ 40.6 $ 21.9 Amortization
Slide 18: Reconciliation between GAAP and Non-GAAP Financial measures (unaudited)
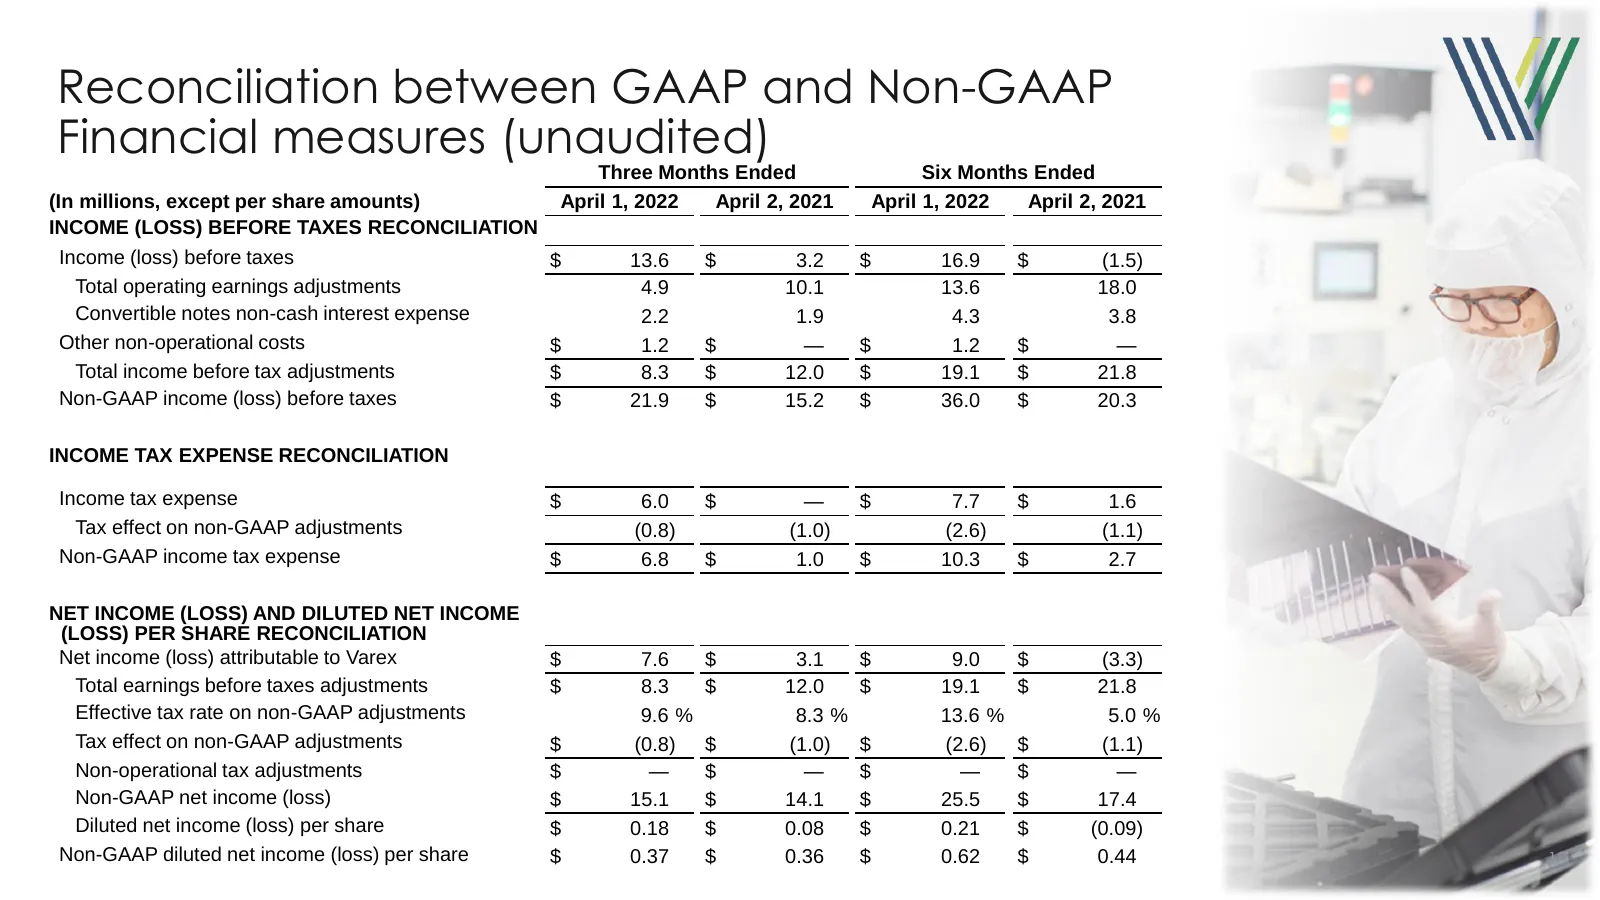
Reconciliation between GAAP and Non-GAAP Financial measures (unaudited) Three Months Ended Six Months Ended (In millions, except per share amounts) April 1, 2022 April 2, 2021 April 1, 2022 April 2, 2021 INCOME (LOSS) BEFORE TAXES RECONCILIATION Income (loss) before taxes $ 13.6 $ 3.2 $ 16.9 $ (1.5)
Slide 19: Reconciliation between GAAP and Non-GAAP Financial measures (unaudited)
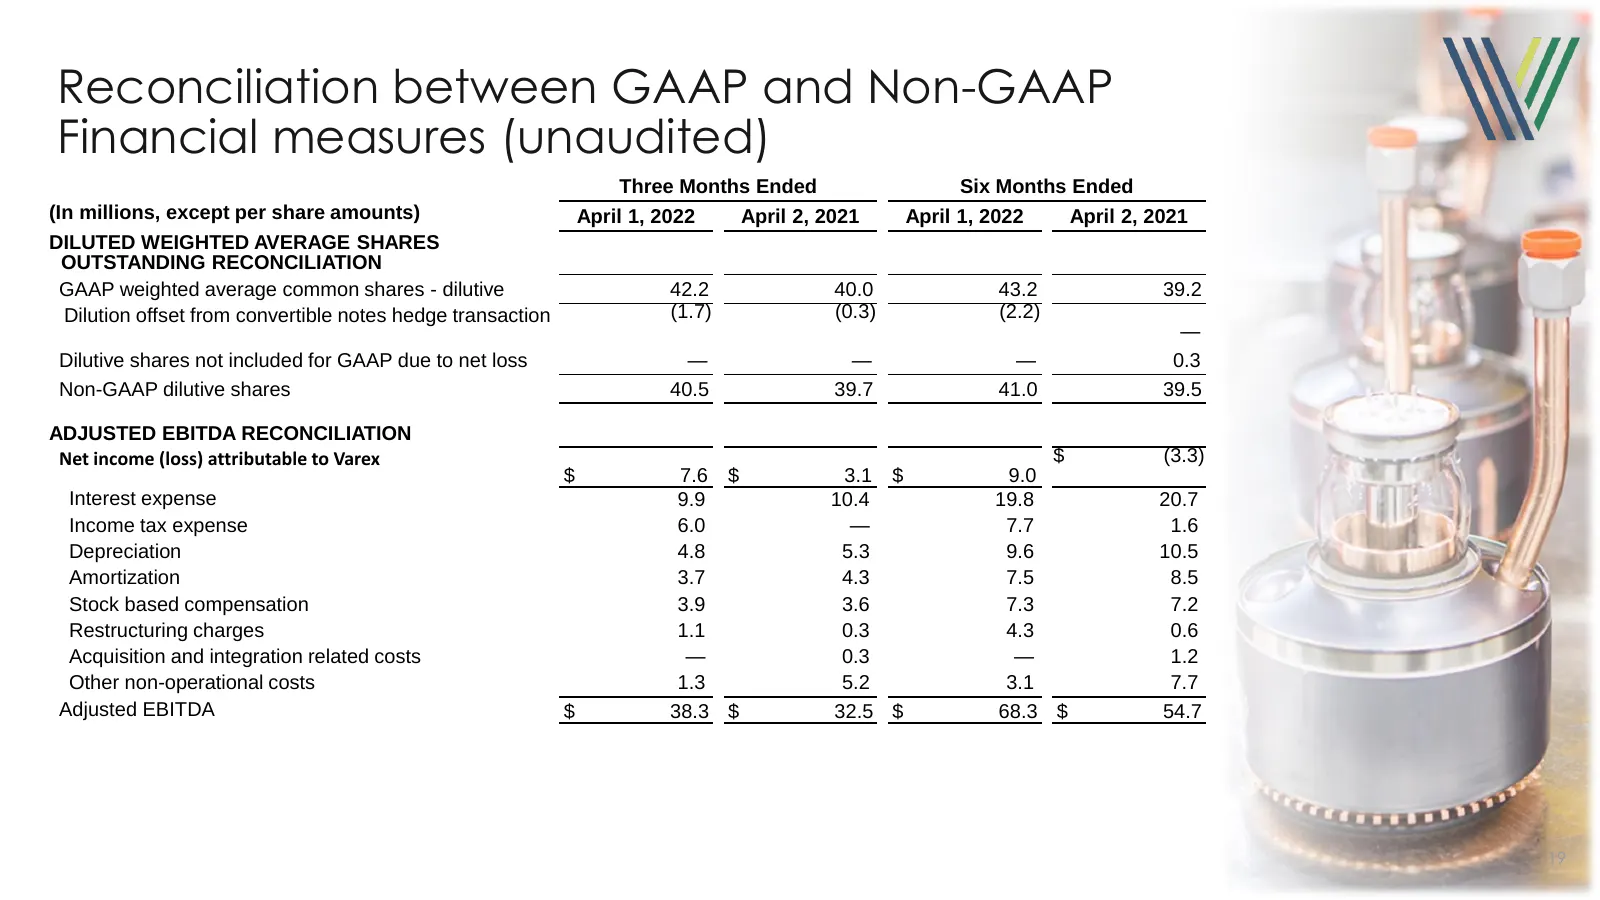
Reconciliation between GAAP and Non-GAAP Financial measures (unaudited) Three Months Ended Six Months Ended (In millions, except per share amounts) April 1, 2022 April 2, 2021 April 1, 2022 April 2, 2021 DILUTED WEIGHTED AVERAGE SHARES OUTSTANDING RECONCILIATION GAAP weighted average common shares -
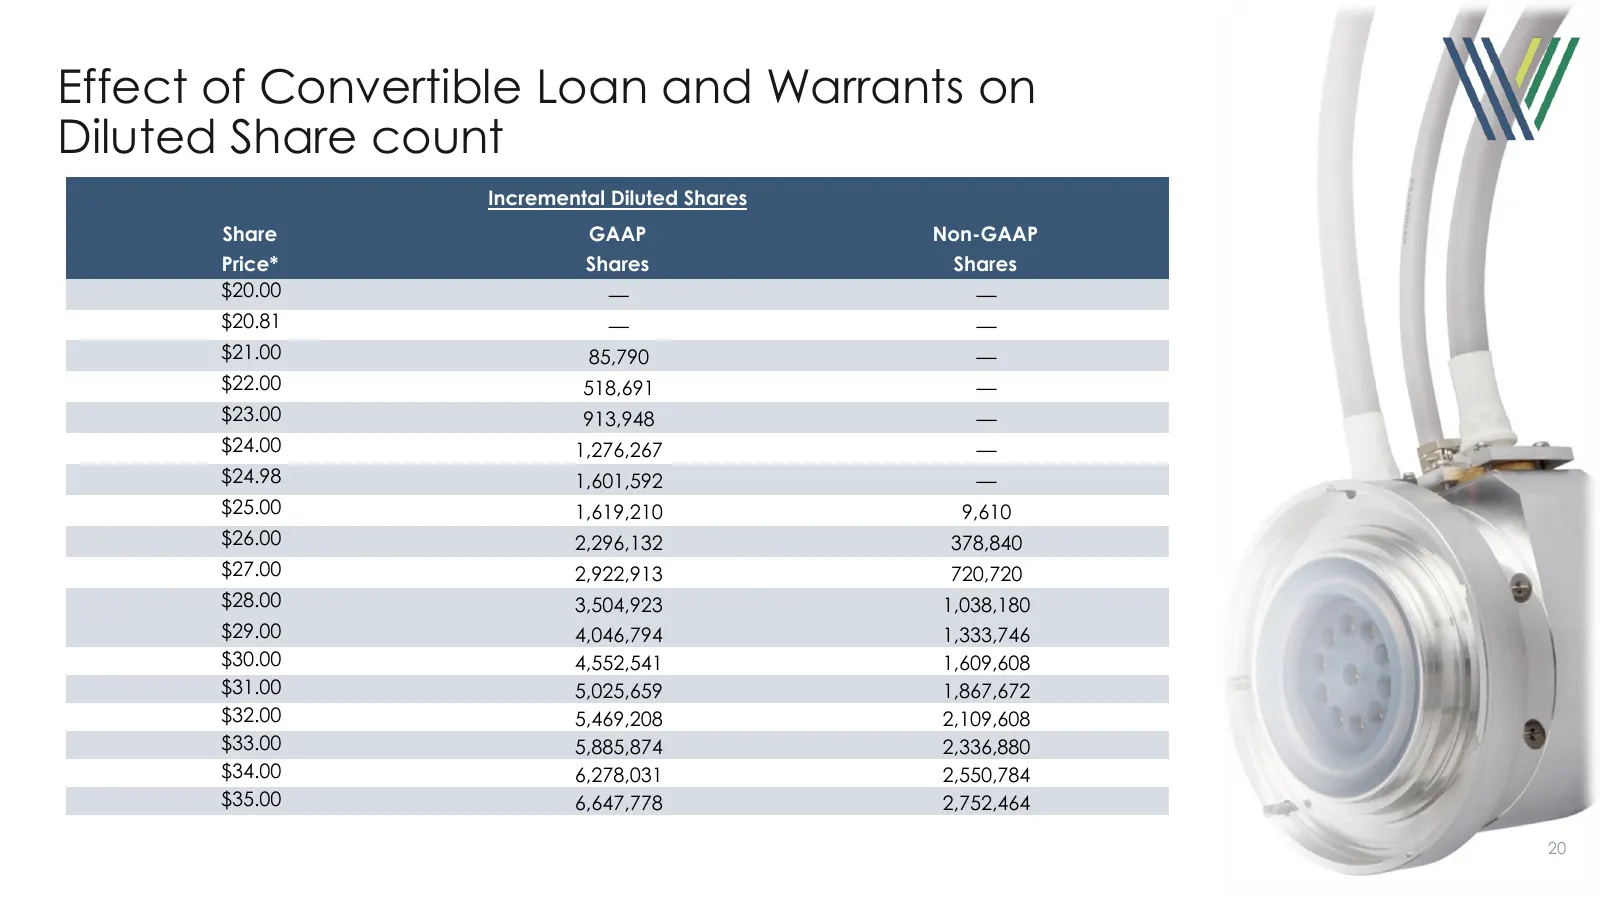
Slide 20: Effect of Convertible Loan and Warrants on Diluted Share count
Effect of Convertible Loan and Warrants on Diluted Share count Incremental Diluted Shares Share GAAP Non-GAAP Price* Shares Shares $20.00 — — $20.81 — — $21.00 85,790 — $22.00 518,691 — $23.00 913,948 — $24.00 1,276,267 — $24.98 1,601,592 — $25.00 1,619,210 9,610 $26.00 2,296,132 378,840 $27.00 2,92
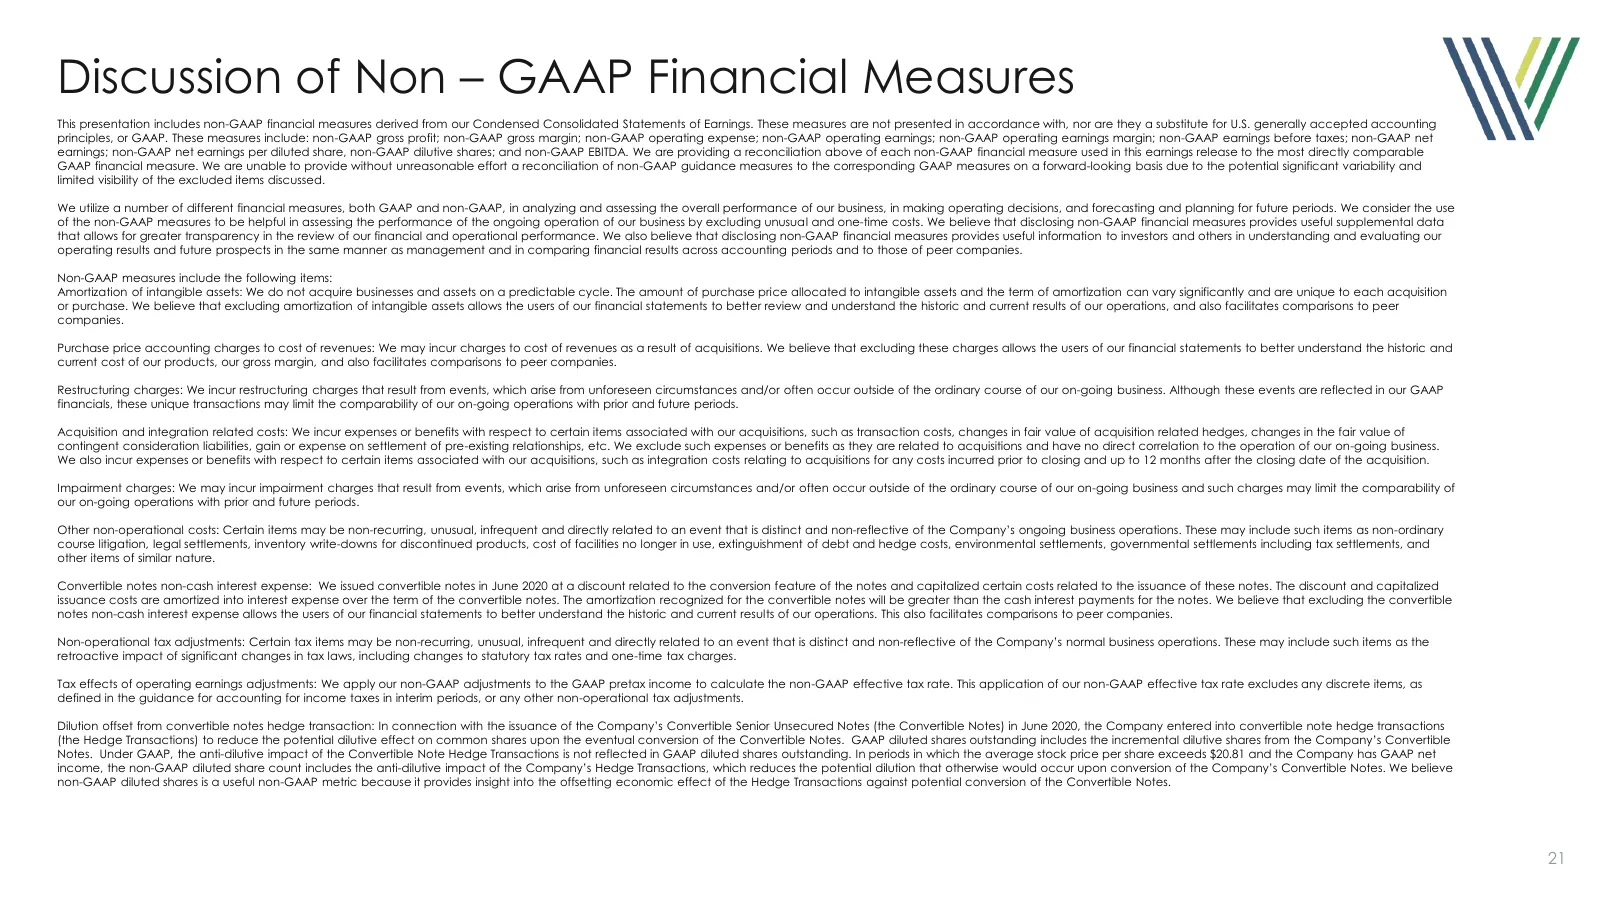
Slide 21: Discussion of Non – GAAP Financial Measures
Discussion of Non – GAAP Financial Measures This presentation includes non-GAAP financial measures derived from our Condensed Consolidated Statements of Earnings. These measures are not presented in accordance with, nor are they a substitute for U.S. generally accepted accounting principles, or GAAP

Slide 22: Solutions in Sight®
Solutions in Sight®
Source: Internet Archive copy of vareximaging.com
More decks from Varex Imaging Corporation
 Q2 2026 Earnings Presentation21 slides · May 7, 2026
 Q1 2026 Earnings Presentation22 slides · Feb 10, 2026
 Q4 2025 Earnings Presentation23 slides · Nov 18, 2025
 Q3 2025 Earnings Presentation21 slides · Aug 7, 2025
 Q2 2025 Earnings Presentation22 slides · May 8, 2025
 Investor Presentation (March 2025)23 slides · March 2025