Scatec ASA · OSL:SCATC
Scatec ASA — Q1 2023 Earnings Presentation
20 slides from Scatec ASA's earnings presentation, 2023
Slide 1: First quarter 2023: Strong operational performance
First quarter 2023 Strong operational performance CEO, Terje Pilskog & CFO, Hans Jakob Hegge
Slide 2: Disclaimer
Disclaimer The following presentation is being made only to, and is only directed at, persons to whom such presentation may lawfully be communicated (’relevant persons’). Any person who is not a relevant person should not rely, act or make assessment on the basis of this presentation or anything inc
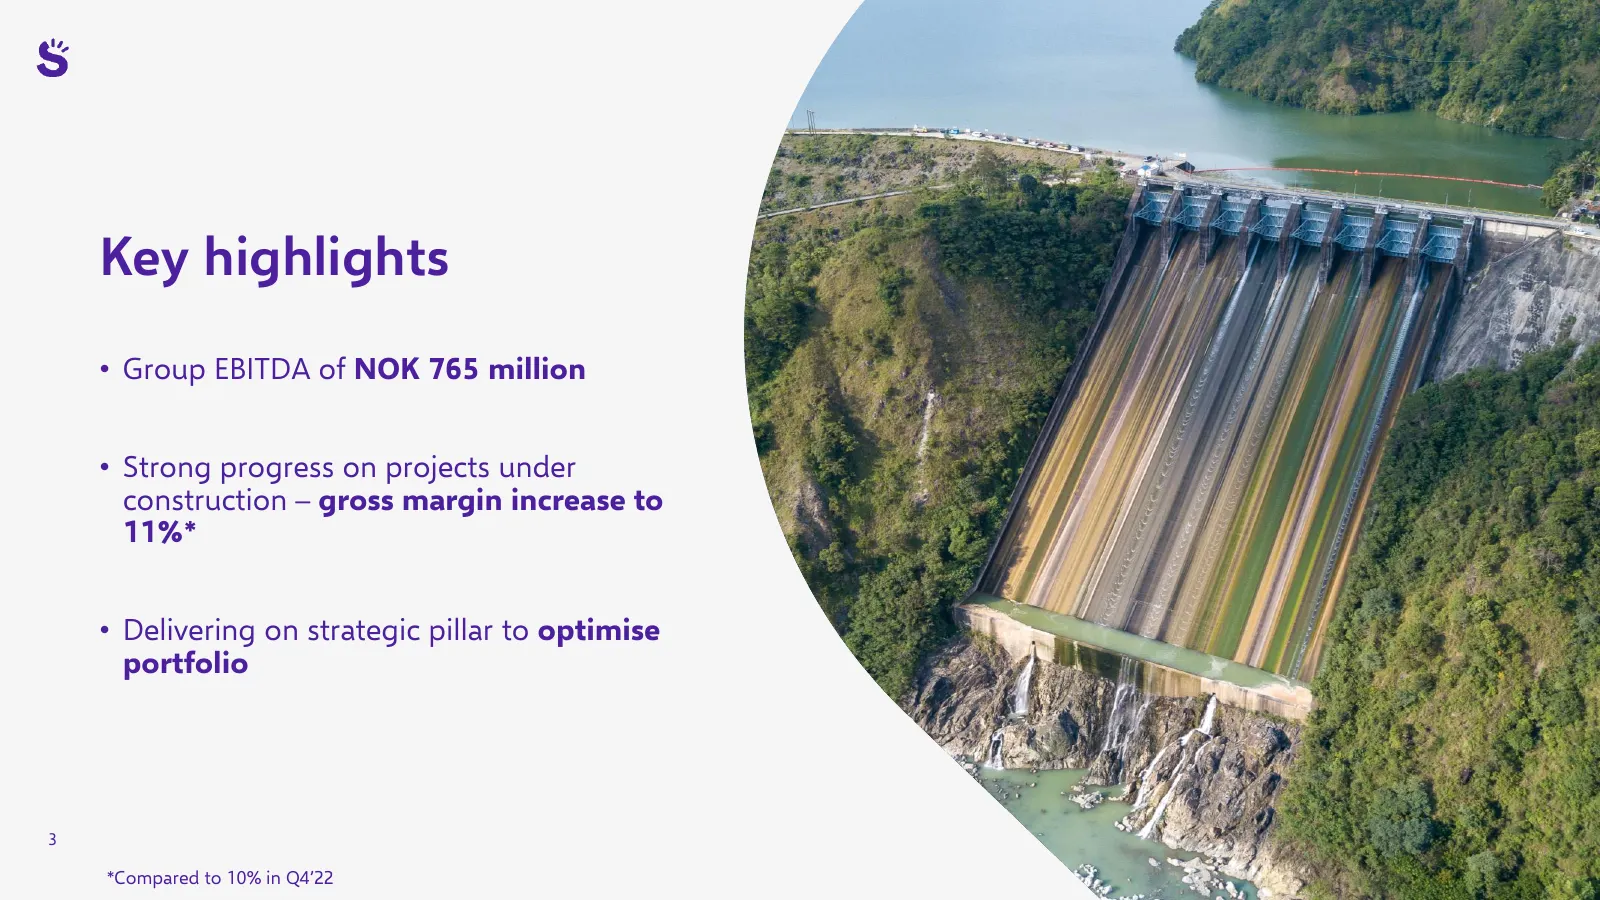
Slide 3: Key highlights
Key highlights • Group EBITDA of NOK 765 million • Strong progress on projects under construction – gross margin increase to 11%* • Delivering on strategic pillar to optimise portfolio 3 *Compared to 10% in Q4’22
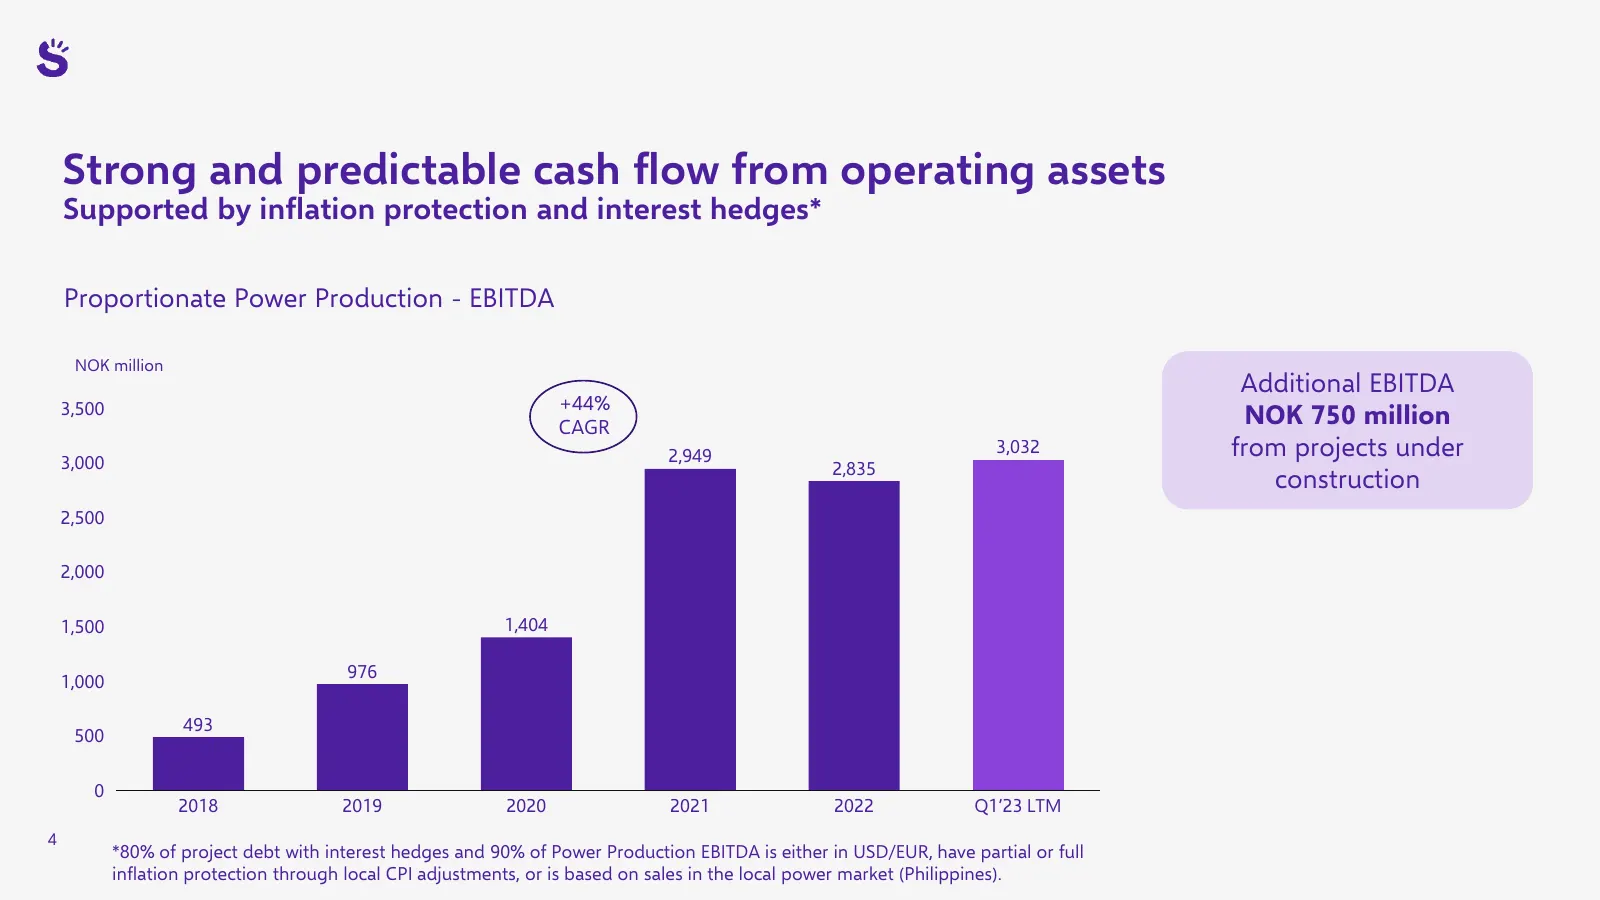
Slide 4: Strong and predictable cash flow from operating assets
Strong and predictable cash flow from operating assets Supported by inflation protection and interest hedges* Proportionate Power Production - EBITDA NOK million Additional EBITDA 3,500 +44% CAGR NOK 750 million 2,949 3,032 from projects under 3,000 2,835 construction 2,500 2,000 1,500 1,404 976 1,0
Slide 5: Power Production: Strong performance with EBITDA increase of 40%
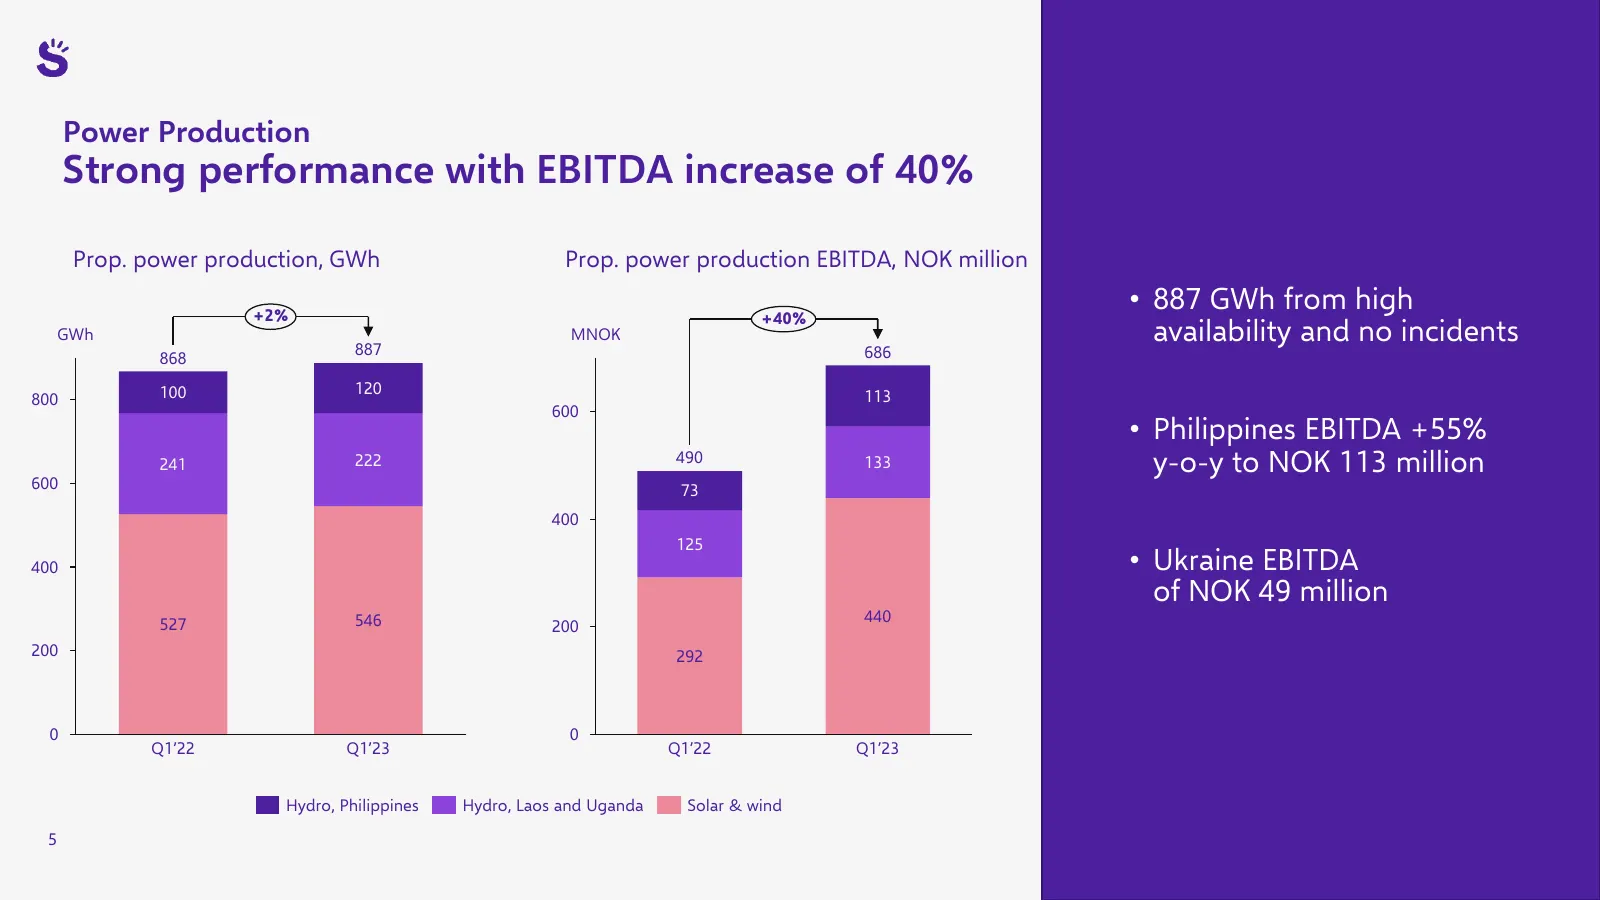
Power Production Strong performance with EBITDA increase of 40% Prop. power production, GWh Prop. power production EBITDA, NOK million +2% • 887 GWh from high +40% GWh 887 MNOK availability and no incidents 868 686 100 120 113 800 600 • Philippines EBITDA +55% 241 222 490 133 y-o-y to NOK 113 millio
Slide 6: Development & Construction: solid progress with gross margin increase
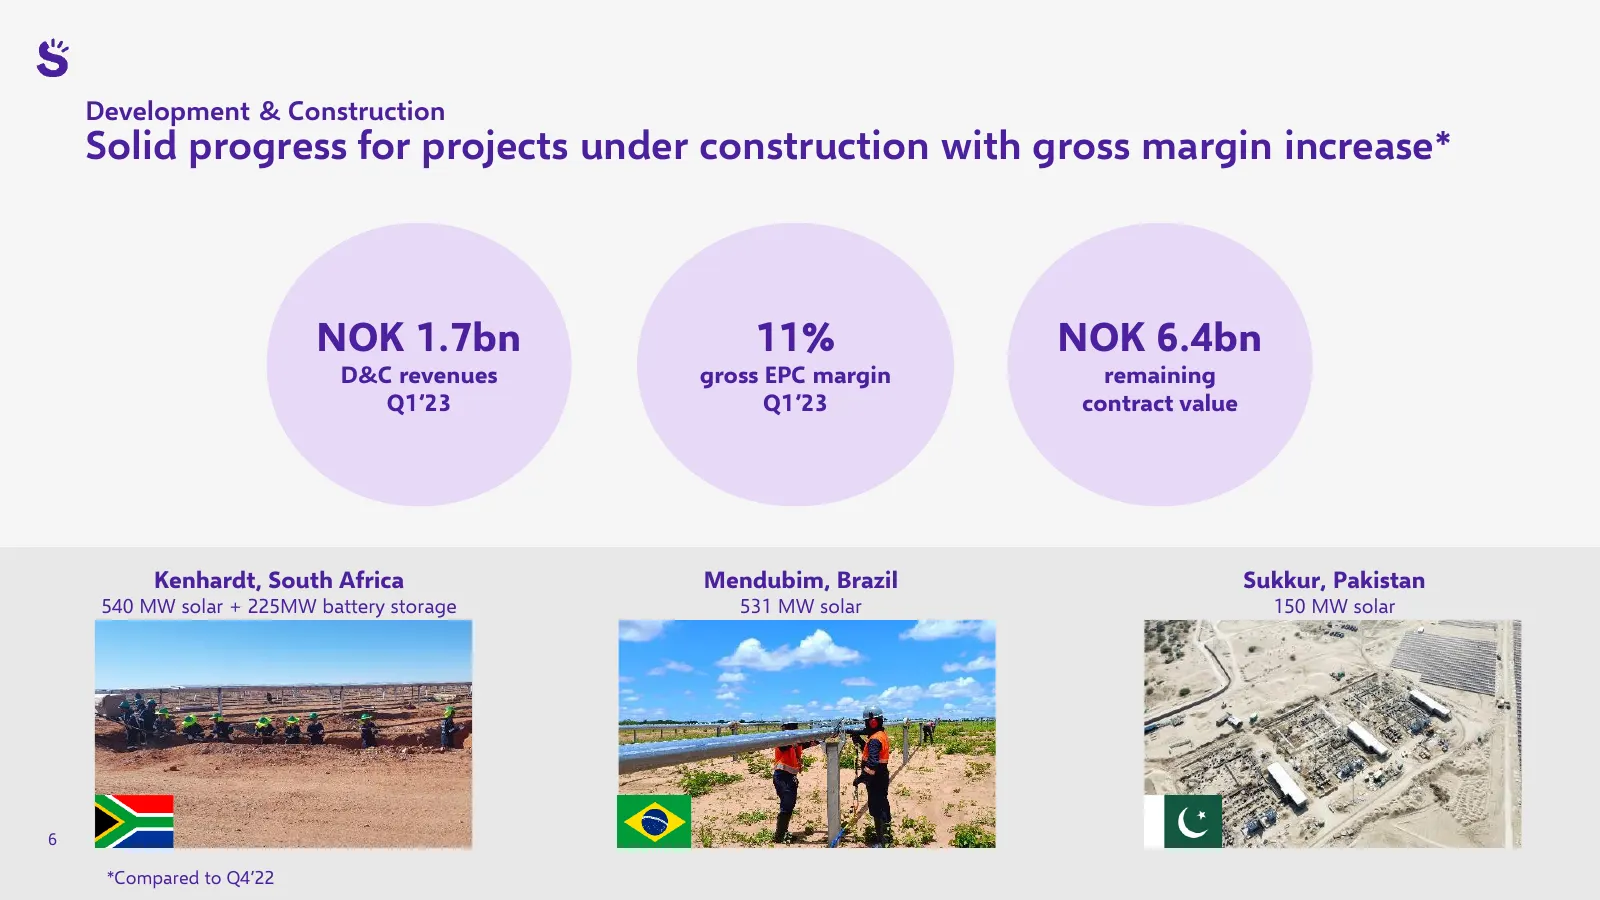
Development & Construction Solid progress for projects under construction with gross margin increase* NOK 1.7bn 11% NOK 6.4bn D&C revenues gross EPC margin remaining Q1’23 Q1’23 contract value Kenhardt, South Africa Mendubim, Brazil Sukkur, Pakistan 540 MW solar + 225MW battery storage 531 MW solar
Slide 7: Growing responsibly with net zero SBTi targets approved
Growing responsibly with net zero SBTi targets approved • SBTi targets approved and net zero strategy in place • Continuing our relentless efforts of improving our future • Targets to minimise direct emissions by 2030 and achieve net zero emissions by 2040 • Ambitions in line with the climate scienc
Slide 8: Strong demand for renewables supported by net zero agenda and increased cost efficiency
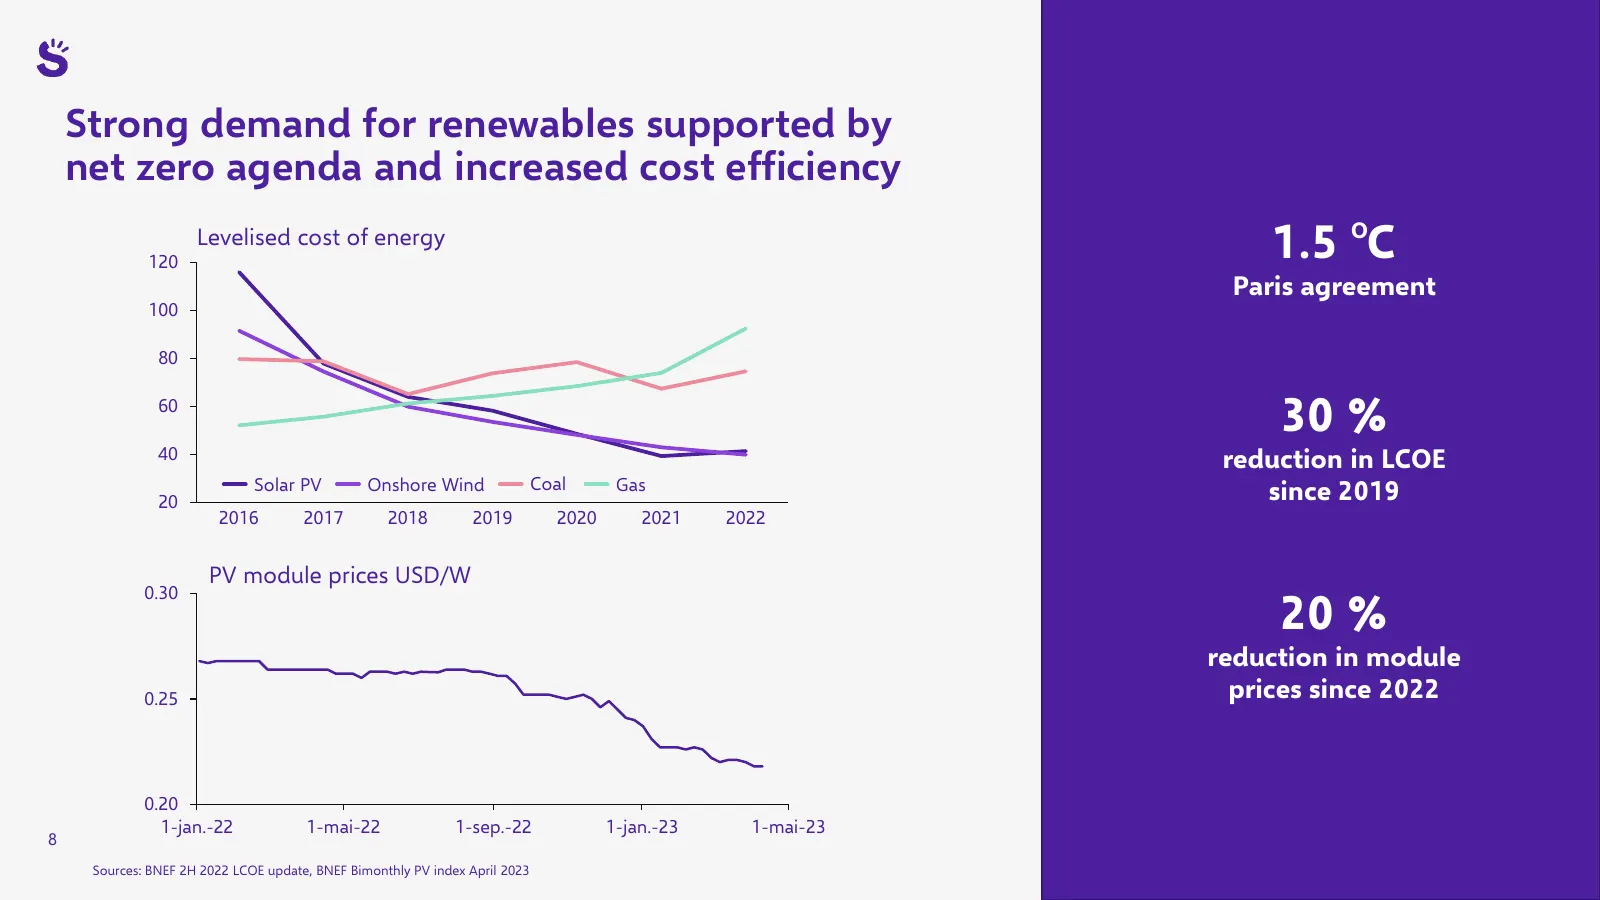
Strong demand for renewables supported by net zero agenda and increased cost efficiency 120 Levelised cost of energy 1.5 OC Paris agreement 100 80 60 30 % 40 reduction in LCOE Solar PV Onshore Wind Coal Gas 20 since 2019 2016 2017 2018 2019 2020 2021 2022 PV module prices USD/W 20 % 0.30 reduction i
Slide 9: Delivering on strategic pillar to optimise our portfolio
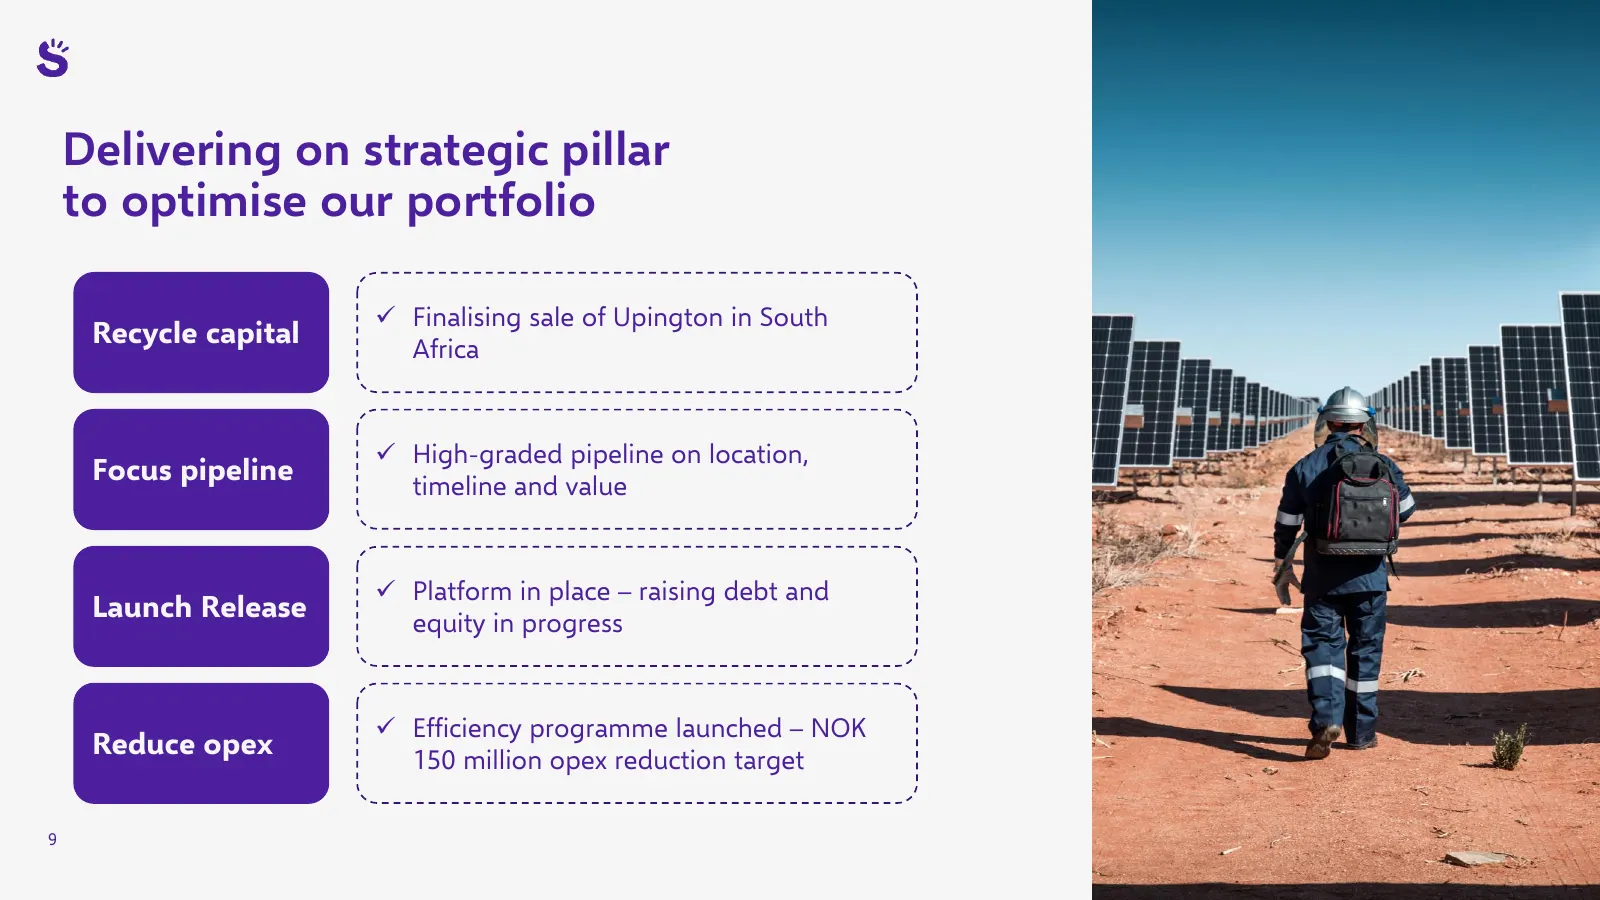
Delivering on strategic pillar to optimise our portfolio ✓ Finalising sale of Upington in South Recycle capital Africa ✓ High-graded pipeline on location, Focus pipeline timeline and value ✓ Platform in place – raising debt and Launch Release equity in progress ✓ Efficiency programme launched – NOK

Slide 10: Financial review
Financial review Hans Jakob Hegge, CFO
Slide 11: 3x revenues growth from core segments
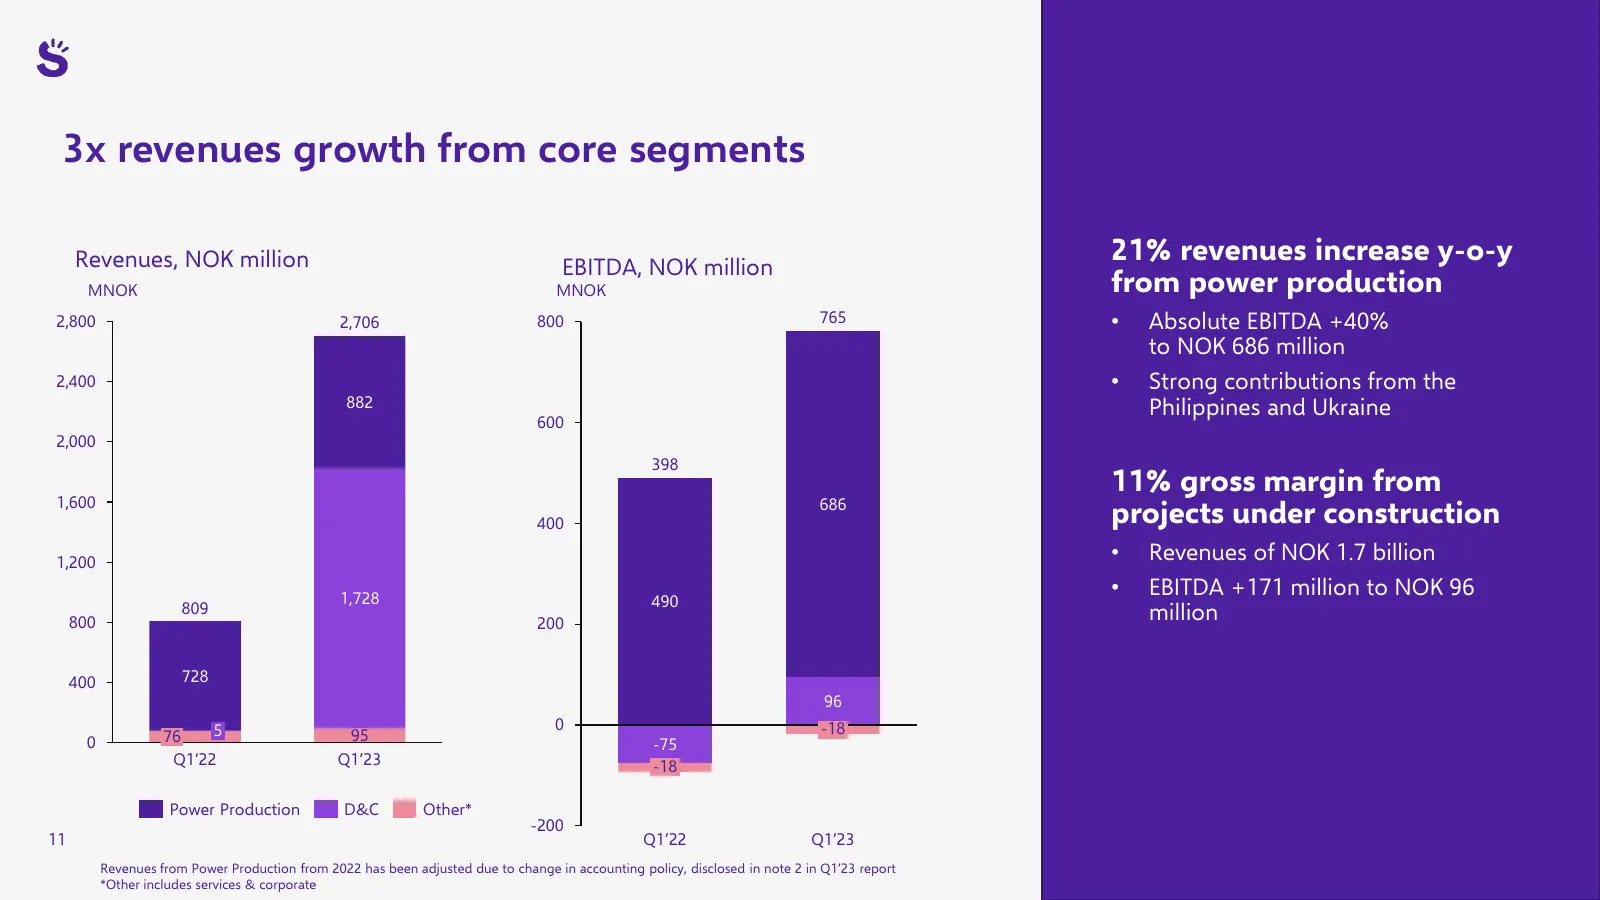
3x revenues growth from core segments Revenues, NOK million 21% revenues increase y-o-y EBITDA, NOK million MNOK MNOK from power production 2,800 2,706 800 765 • Absolute EBITDA +40% to NOK 686 million 2,400 • Strong contributions from the 882 Philippines and Ukraine 600 2,000 398 11% gross margin f
Slide 12: New project debt and currency movements driving increased NIBD
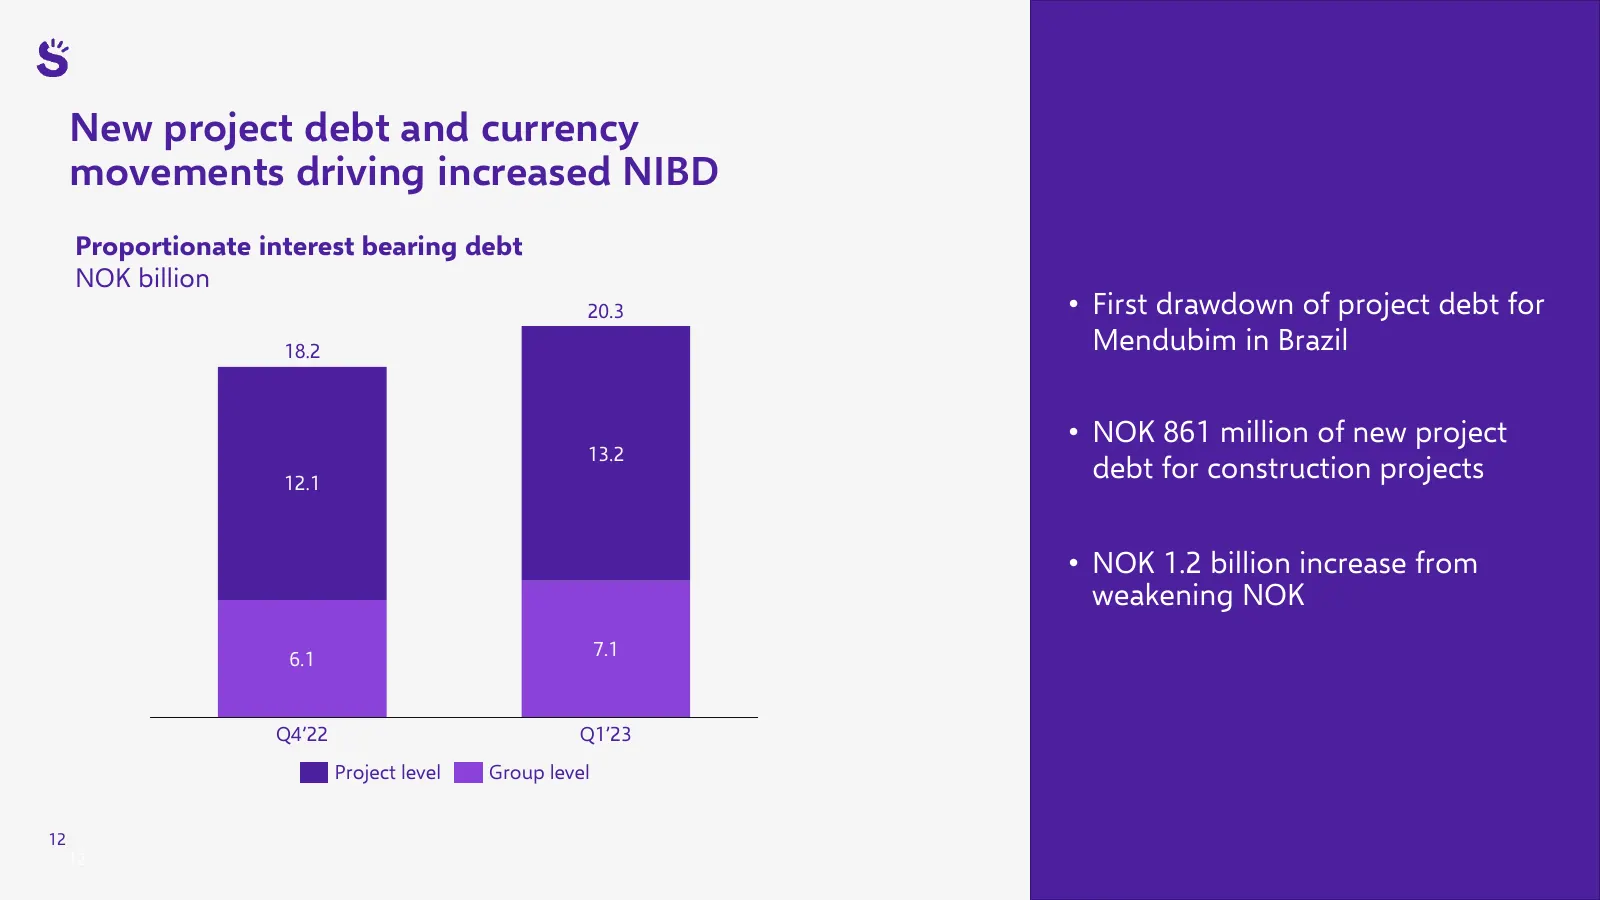
New project debt and currency movements driving increased NIBD Proportionate interest bearing debt NOK billion 20.3 • First drawdown of project debt for 18.2 Mendubim in Brazil • NOK 861 million of new project 13.2 12.1 debt for construction projects • NOK 1.2 billion increase from weakening NOK 6.1
Slide 13: Corporate debt maturity profile
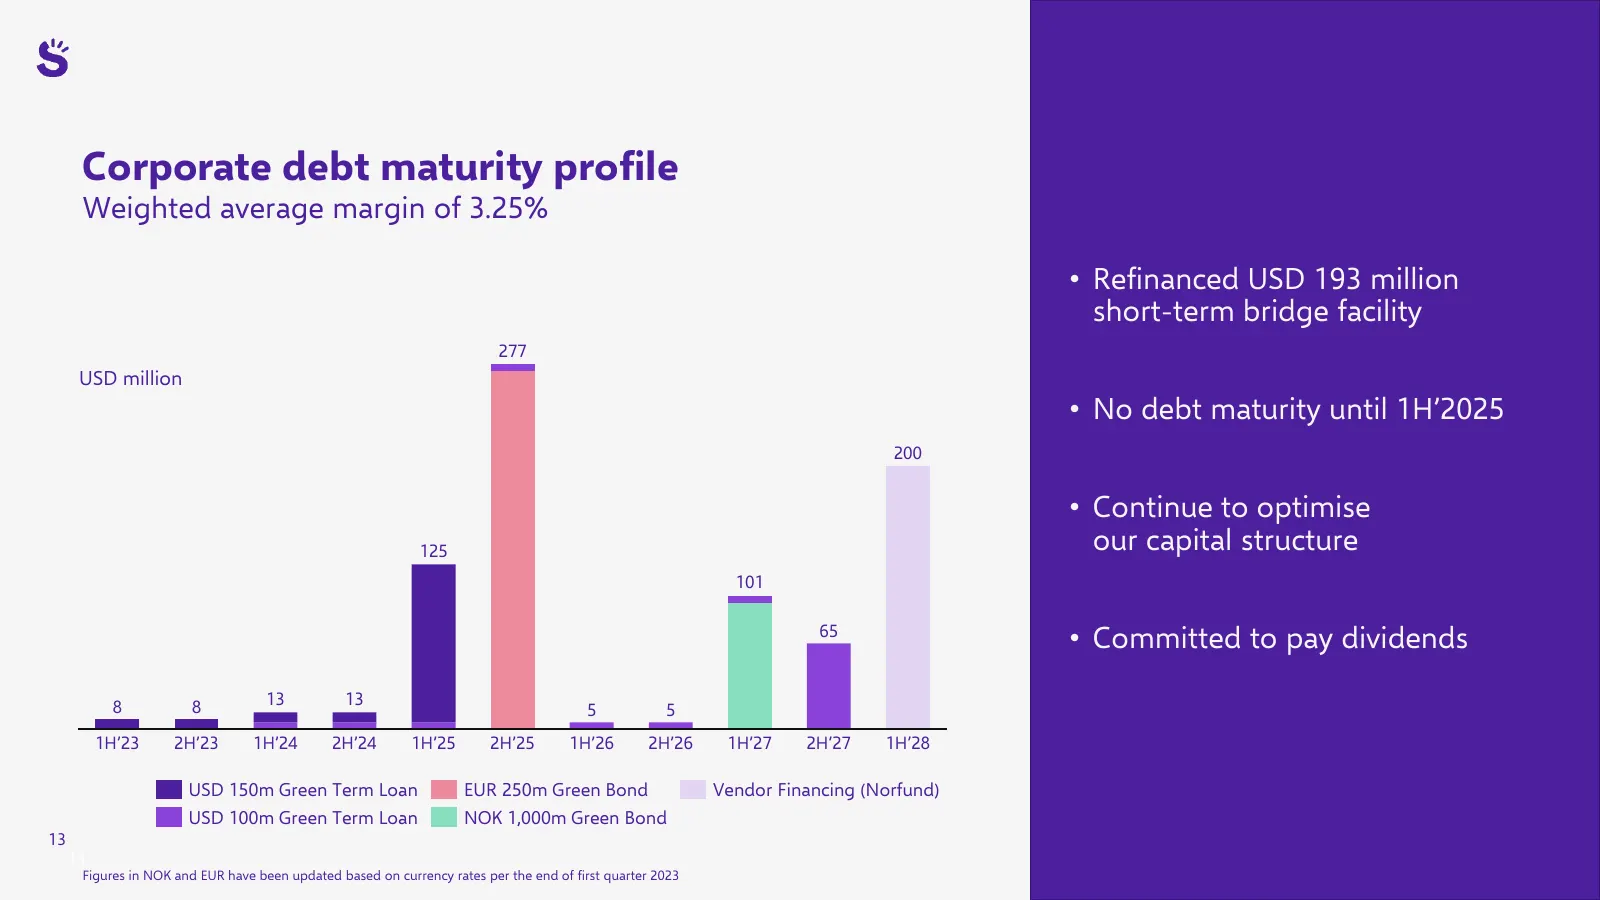
Corporate debt maturity profile Weighted average margin of 3.25% • Refinanced USD 193 million short-term bridge facility 277 USD million • No debt maturity until 1H’2025 200 • Continue to optimise 125 our capital structure 101 65 • Committed to pay dividends 8 8 13 13 5 5 1H’23 2H’23 1H’24 2H’24 1H’
Slide 14: Solid liquidity position of NOK 3.3 billion
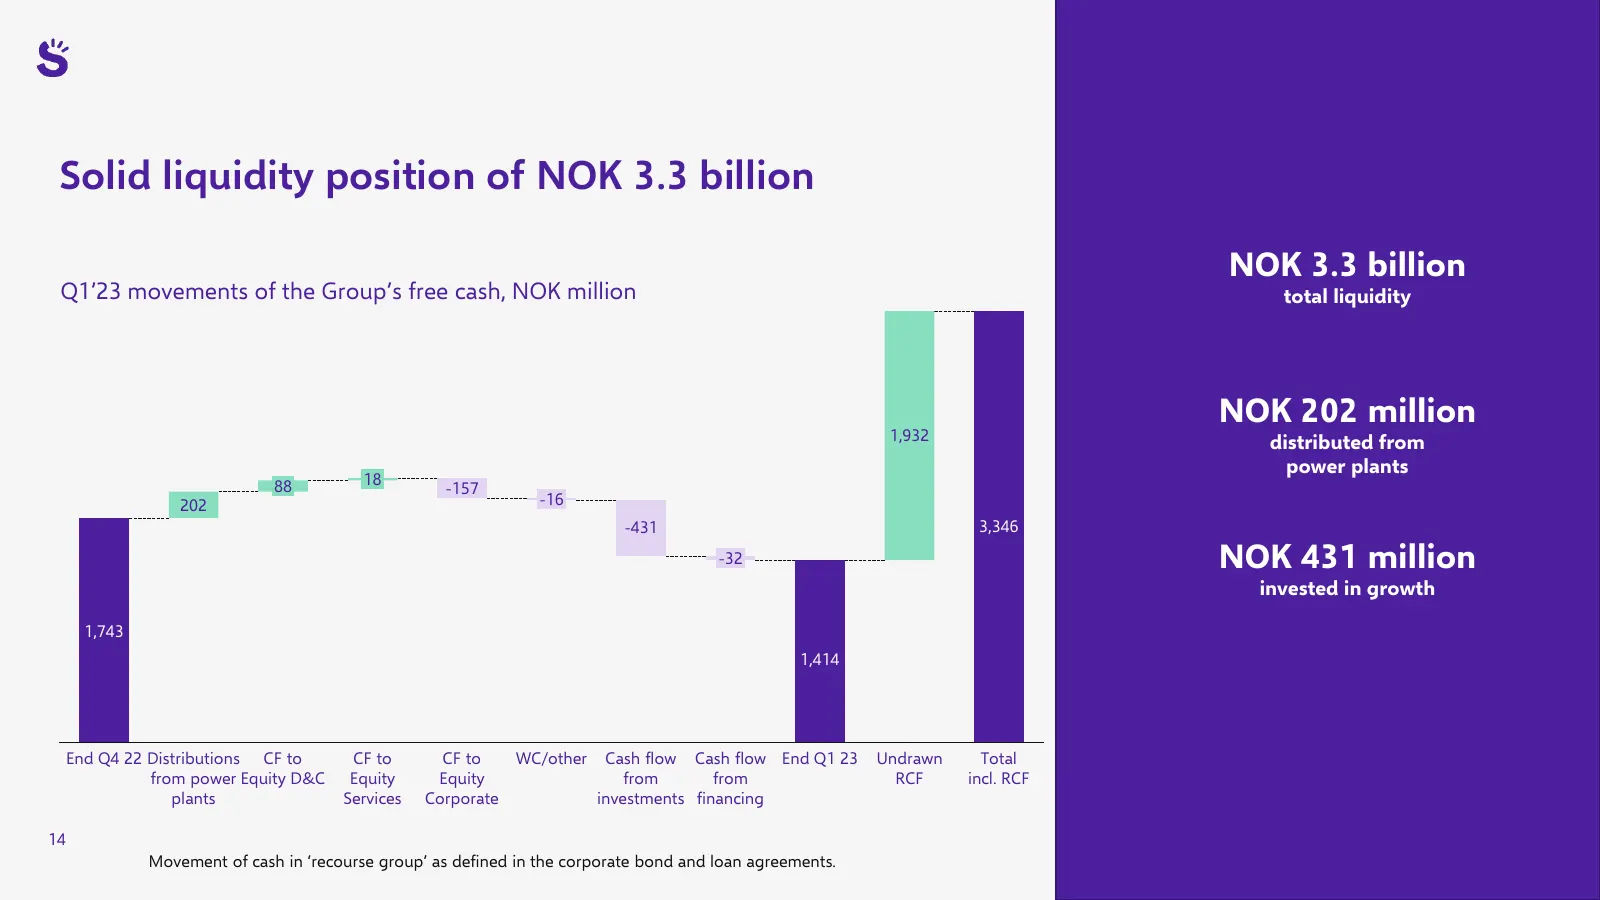
Solid liquidity position of NOK 3.3 billion NOK 3.3 billion Q1’23 movements of the Group’s free cash, NOK million total liquidity NOK 202 million 1,932 distributed from power plants 88 18 -157 202 -16 -431 3,346 -32 NOK 431 million invested in growth 1,743 1,414 End Q4 22 Distributions CF to CF to C
Slide 15: Increased focus on efficiency and capital discipline
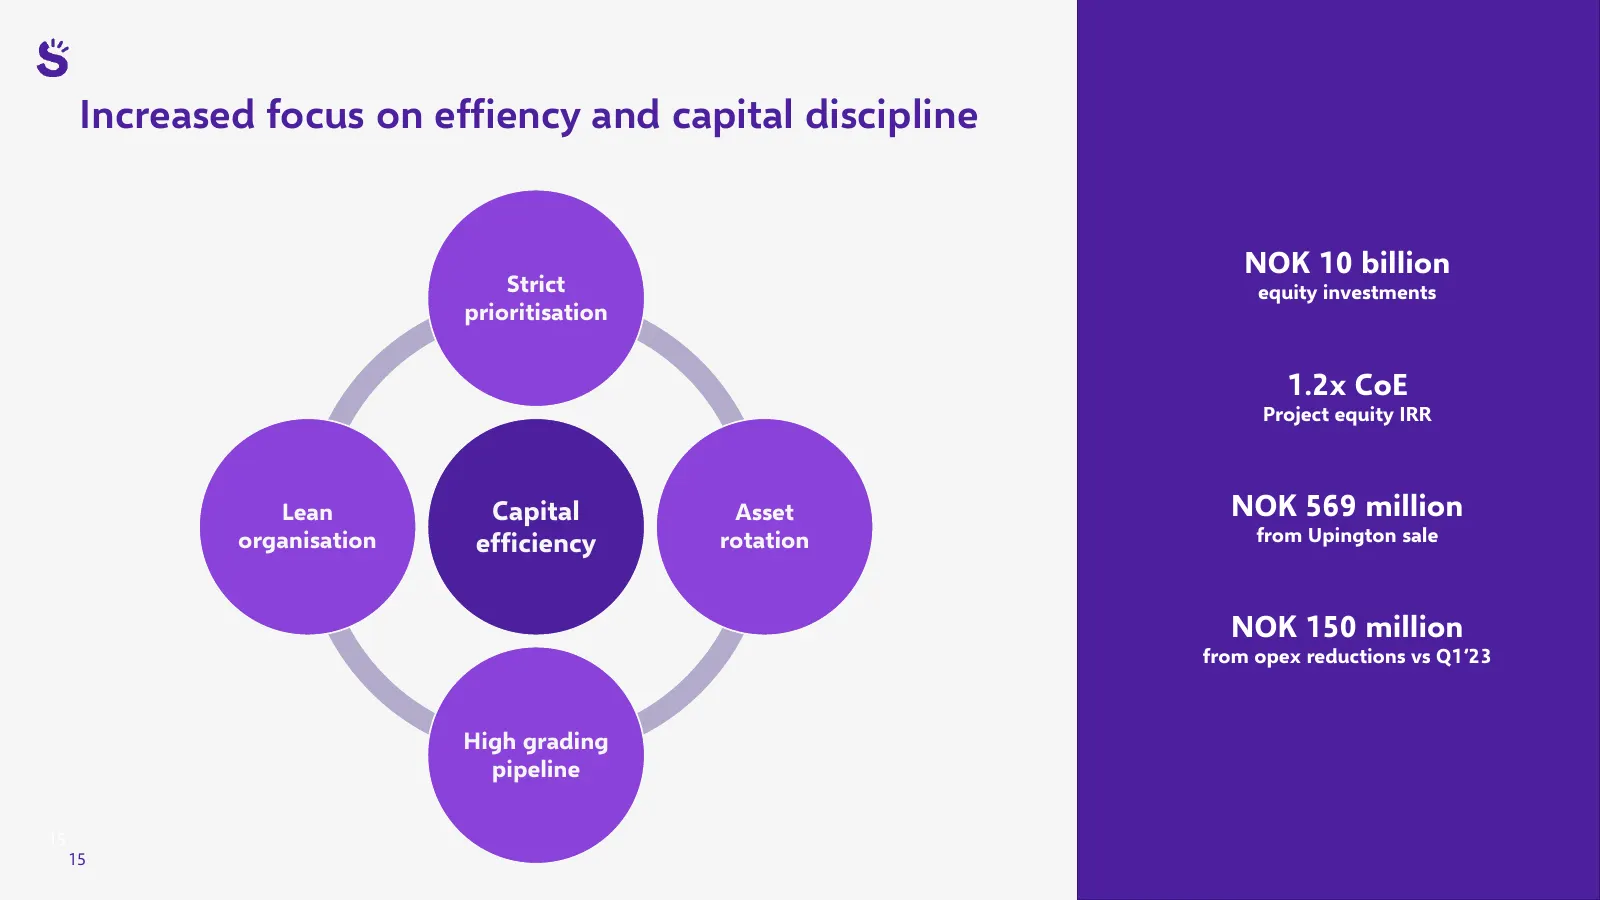
Increased focus on effiency and capital discipline NOK 10 billion Strict equity investments prioritisation 1.2x CoE Project equity IRR Lean Capital Asset NOK 569 million organisation efficiency rotation from Upington sale NOK 150 million from opex reductions vs Q1’23 High grading pipeline 15 15
Slide 16: Outlook highlights
Outlook highlights Power Production • FY 2023 EBITDA estimate increased by NOK 150 million to NOK 2.85 – 3.15 billion • Q2’23 Philippine EBITDA estimate of NOK 10-50 million Development & Construction • D&C revenues estimated to increase in Q2’23 compared to previous quarters • NOK 6.4 billion contr
Slide 17: Summing up
Summing up • Strong operational performance • Solid progress of projects under construction • Delivering on strategic pillar to optimise the portfolio 17
Slide 18: Scatec: improving our future
Scate improving our future
Slide 19: Overview of change in proportionate net debt during the quarter
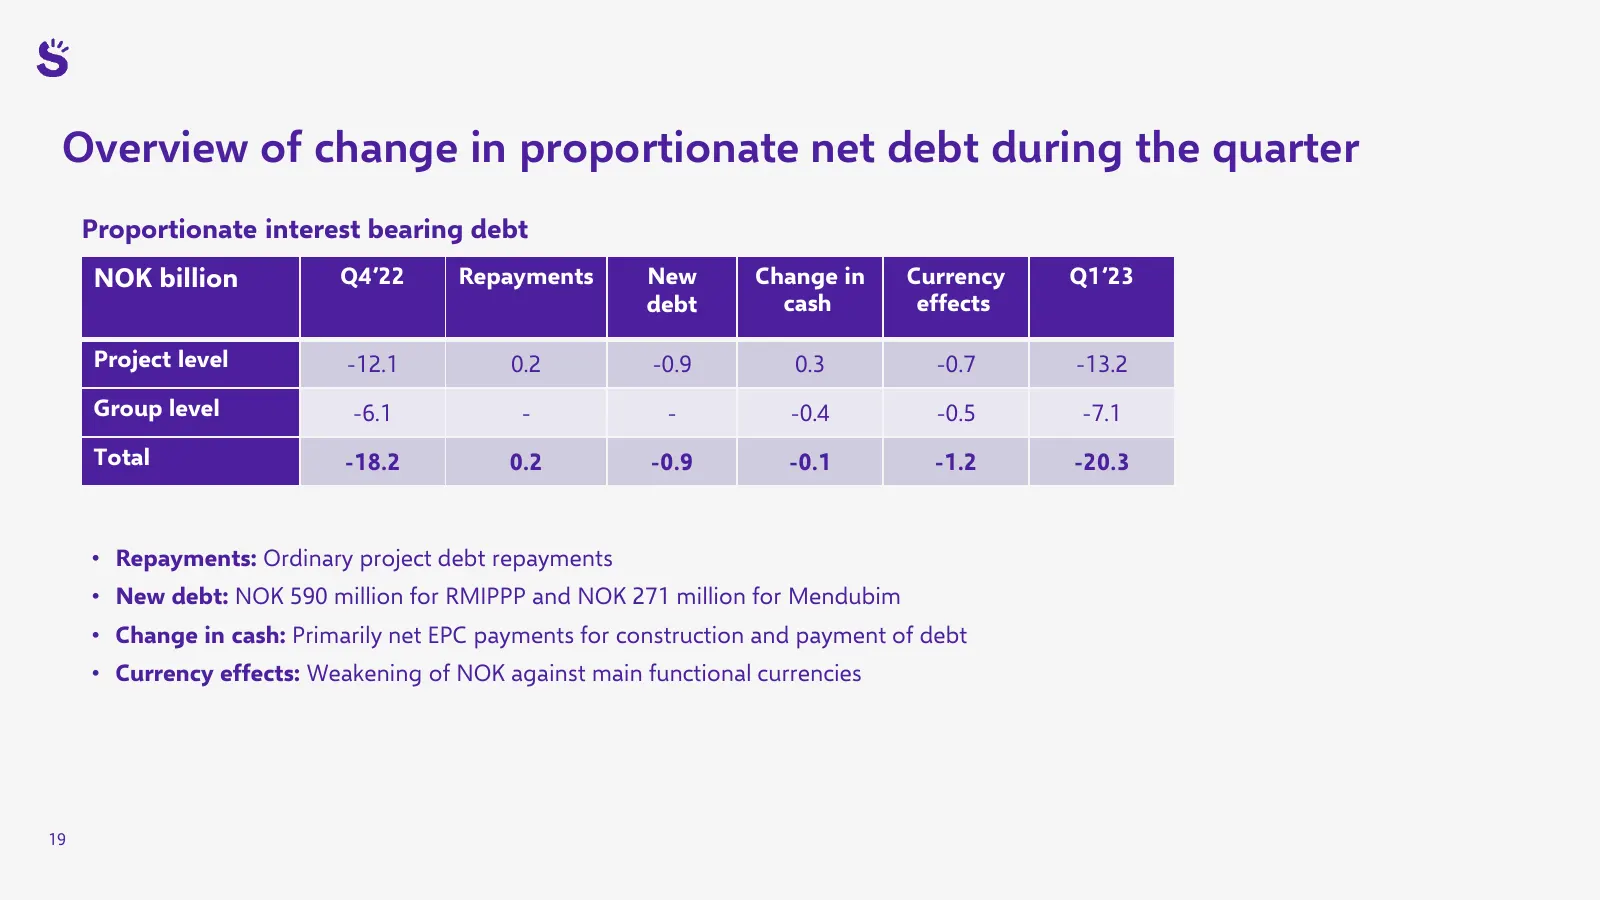
Overview of change in proportionate net debt during the quarter Proportionate interest bearing debt NOK billion Q4’22 Repayments New Change in Currency Q1’23 debt cash effects Project level -12.1 0.2 -0.9 0.3 -0.7 -13.2 Group level -6.1 - - -0.4 -0.5 -7.1 Total -18.2 0.2 -0.9 -0.1 -1.2 -20.3 • Repay
Slide 20: Our asset portfolio
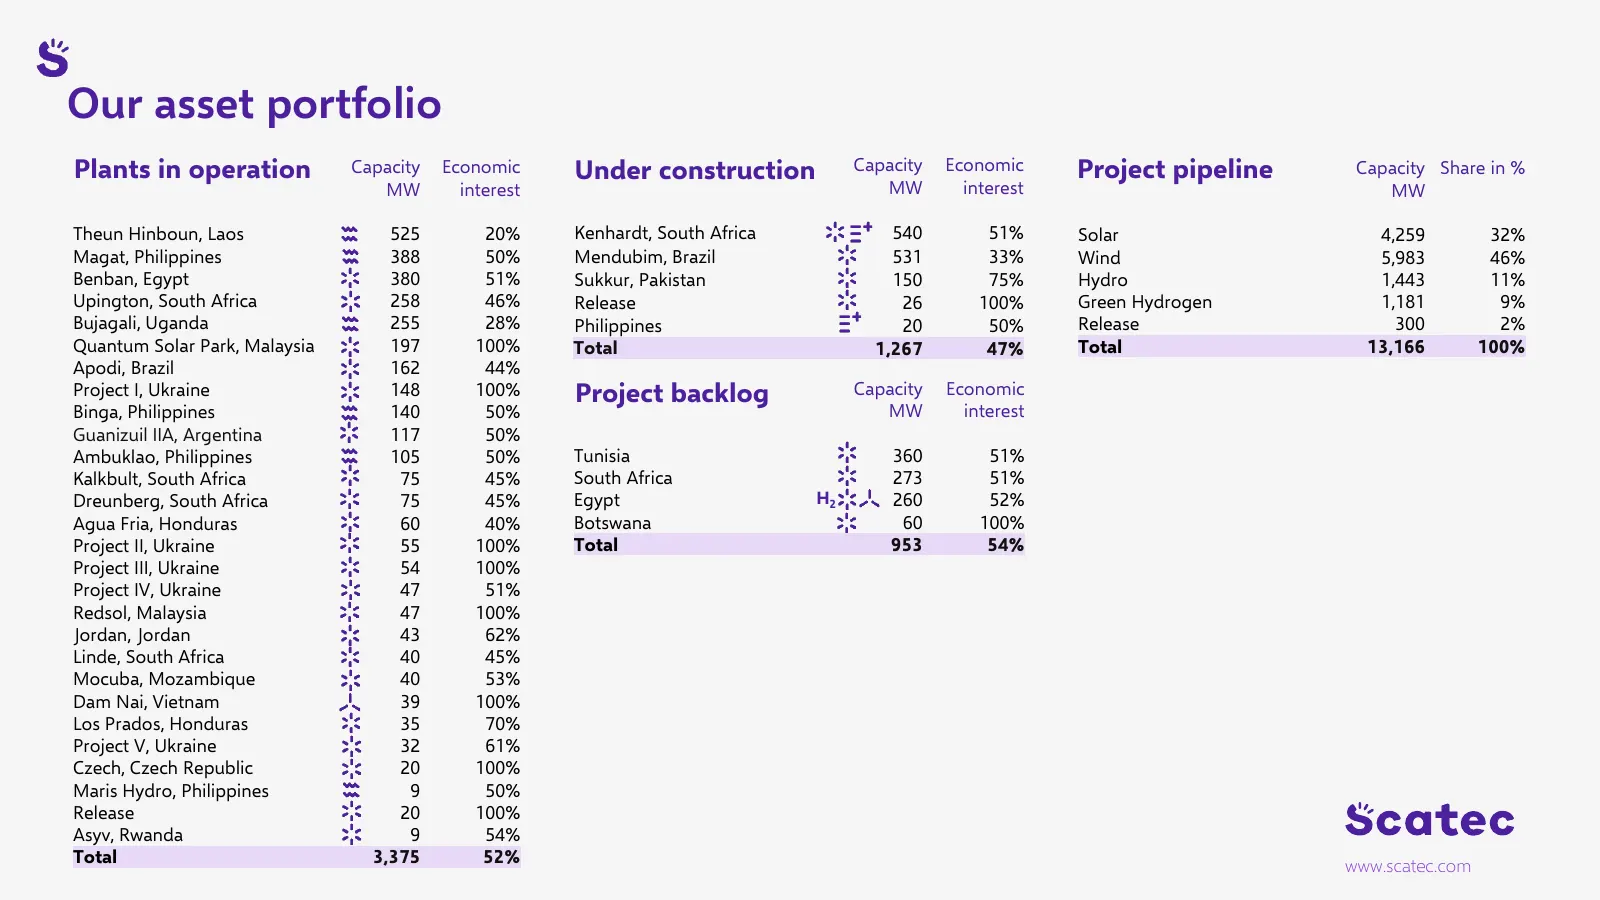
Our asset portfolio Plants in operation Capacity Economic Under construction Capacity Economic Project pipeline Capacity Share in % MW interest MW interest MW Theun Hinboun, Laos 525 20% Kenhardt, South Africa 540 51% Solar 4,259 32% Magat, Philippines 388 50% Mendubim, Brazil 531 33% Wind 5,983 46%
Source: Internet Archive copy of scatec.com
More decks from Scatec ASA
 Q3 2026 Earnings Presentation32 slides · Oct 30, 2026
 Q2 2026 Earnings Presentation23 slides · Aug 21, 2026
 Investor Presentation (August 2026)22 slides · August 2026
 Q1 2026 Earnings Presentation23 slides · May 6, 2026
 Investor Presentation (March 2026)22 slides · March 2026
 Q4 2025 Earnings Presentation24 slides · Jan 30, 2026