Dakota Plains — Shareholder Meeting (June 2014)
36 slides from Dakota Plains's shareholder meeting presentation, Jun 12, 2014
Slide 1: Annual General Meeting June 12, 2014
WWW . DAKOTAPLAINS . COM OTCQB: DAKP ANNUAL GENERAL MEETING J UNE 12, 2014
Slide 2: Forward Looking Statements
F ORWARD L OOKING S TATEMENTS Statements made by representatives of Dakota Plains Holdings, Inc . (“Dakota Plains” or the “Company”) during the course of this presentation that are not historical facts, are forward - looking statements . These statements are based on certain assumptions and expectat
Slide 3: Craig McKenzie, Chairman & CEO
C RAIG M C K ENZIE C HAIRMAN & CEO
Slide 4: Today
T ODAY 4 » M EET THE B OARD » W HERE ARE WE ? » 2013 IN REVIEW » F ORWARD S TRATEGY » I MPACT » O PERATIONS : OIL & FRAC SAND » W RAP U P
Slide 5: Board of Directors
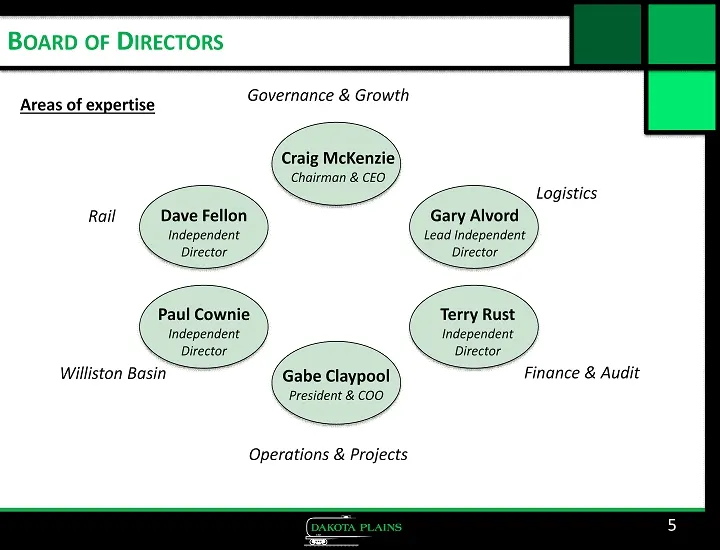
5 Craig McKenzie Chairman & CEO Gary Alvord Lead Independent Director Terry Rust Independent Director Gabe Claypool President & COO Paul Cownie Independent Director Dave Fellon Independent Director Rail Williston Basin Operations & Projects Finance & Audit Logistics Governance & Growth B OARD OF D I
Slide 6: Where Are We?
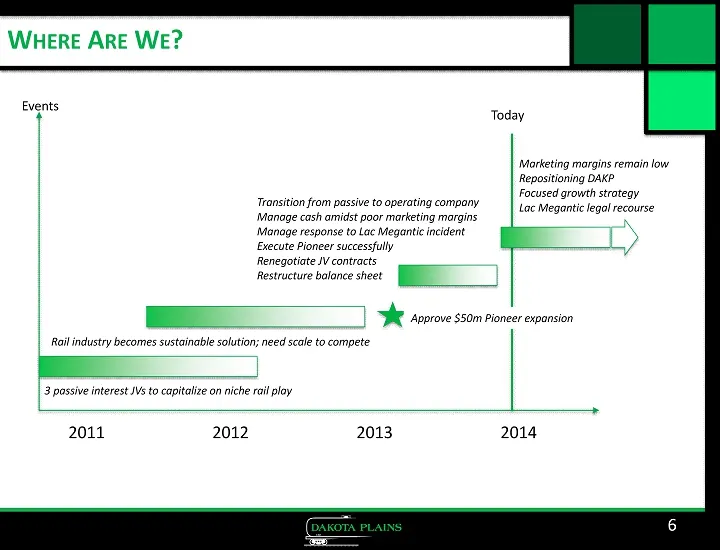
W HERE A RE W E ? 6 2011 2012 2013 2014 3 passive interest JVs to capitalize on niche rail play Rail industry becomes sustainable solution; need scale to compete Approve $50m Pioneer expansion Transition from passive to operating company Manage cash amidst poor marketing margins Manage response to L
Slide 7: Historical Marketing JV Performance
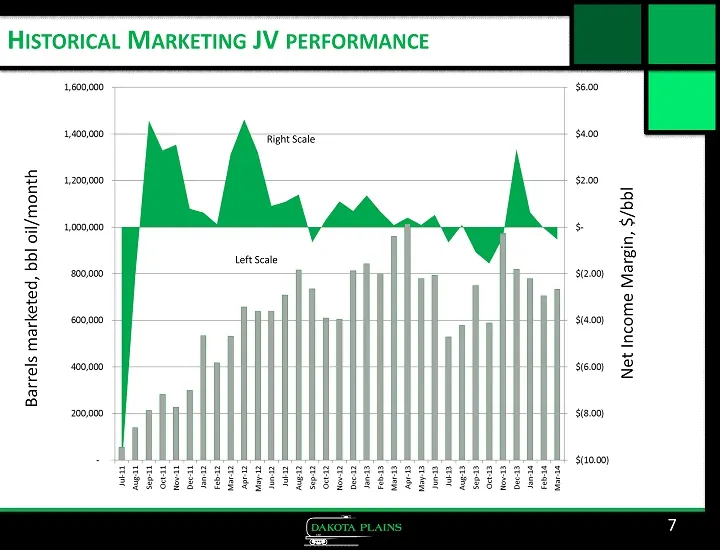
7 H ISTORICAL M ARKETING JV PERFORMANCE Barrels marketed, bbl oil/month Net Income Margin, $/bbl Right Scale Left Scale
Slide 8: 2013 Repositioning of DAKP
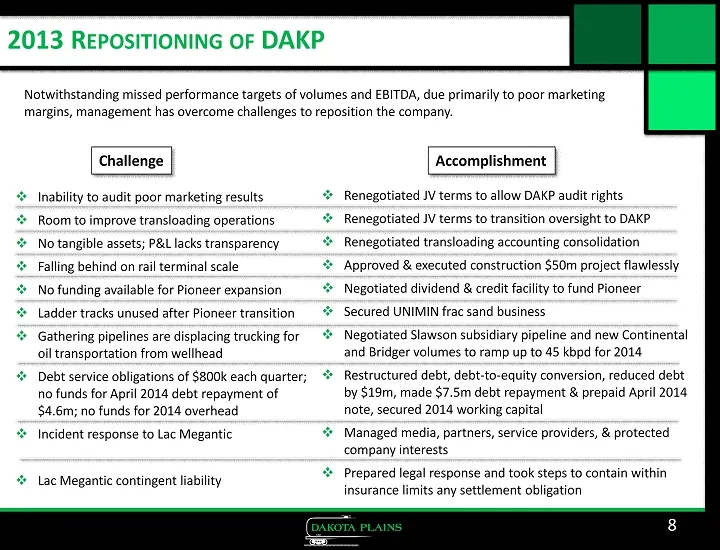
2013 R EPOSITIONING OF DAKP 8 □ Inability to audit poor marketing results □ Room to improve transloading operations □ No tangible assets; P&L lacks transparency □ Falling behind on rail terminal scale □ No funding available for Pioneer expansion □ Ladder tracks unused after Pioneer transition □ Gath
Slide 9: Consolidated Balance Sheet
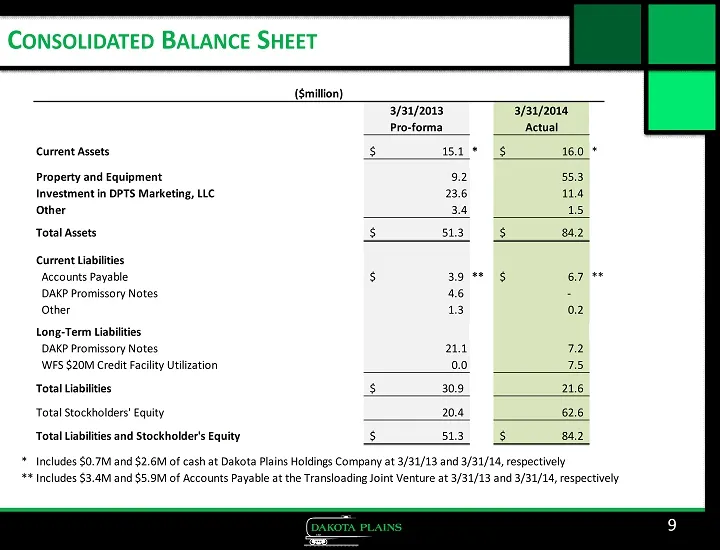
C ONSOLIDATED B ALANCE S HEET 9 3/31/2013 3/31/2014 Pro-forma Actual Current Assets 15.1$ * 16.0$ * Property and Equipment 9.2 55.3 Investment in DPTS Marketing, LLC 23.6 11.4 Other 3.4 1.5 Total Assets 51.3$ 84.2$ Current Liabilities Accounts Payable 3.9$ ** 6.7$ ** DAKP Promissory Notes 4.6 - Othe
Slide 10: Reminder: Growth Strategy, AGM June 2013
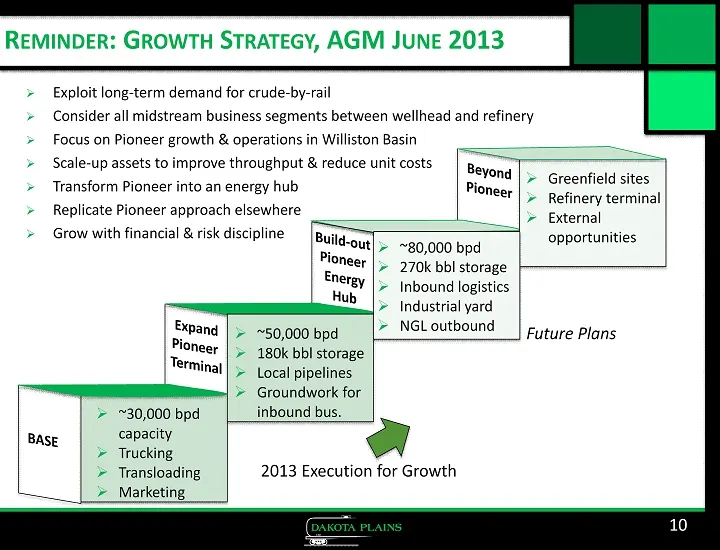
R EMINDER : G ROWTH S TRATEGY , AGM J UNE 2013 » Exploit long - term demand for crude - by - rail » Consider all midstream business segments between wellhead and refinery » Focus on Pioneer growth & operations in Williston Basin » Scale - up assets to improve throughput & reduce unit costs » Transfo
Slide 11: Forward Strategy (Simplified)
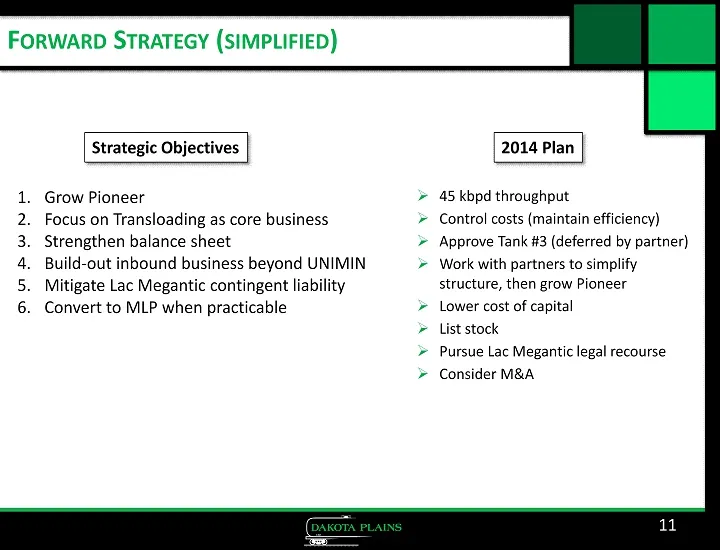
F ORWARD S TRATEGY ( SIMPLIFIED ) 11 » 45 kbpd throughput » Control costs (maintain efficiency) » Approve Tank #3 (deferred by partner) » Work with partners to simplify structure, then grow Pioneer » Lower cost of capital » List stock » Pursue Lac Megantic legal recourse » Consider M&A 1. Grow Pione
Slide 12: Aspiration
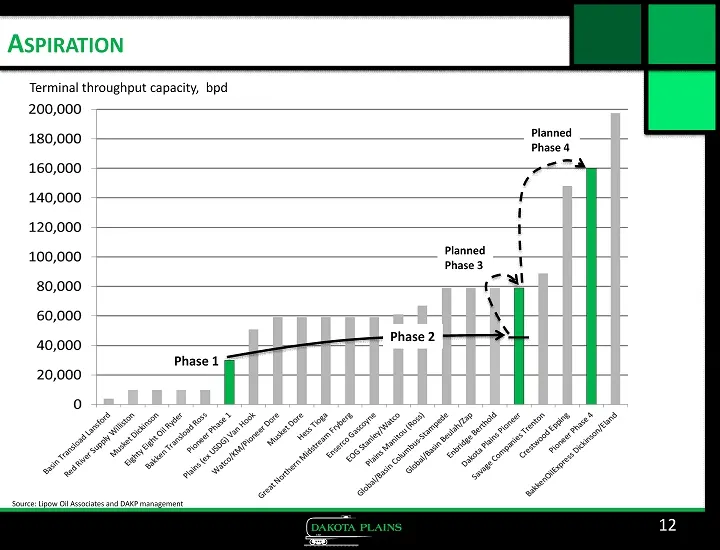
A SPIRATION 12 Source: Lipow Oil Associates and DAKP management Terminal throughput capacity, bpd Planned Phase 3 Planned Phase 4 Phase 1 Phase 2
Slide 13: Exploit Pioneer Location & Access
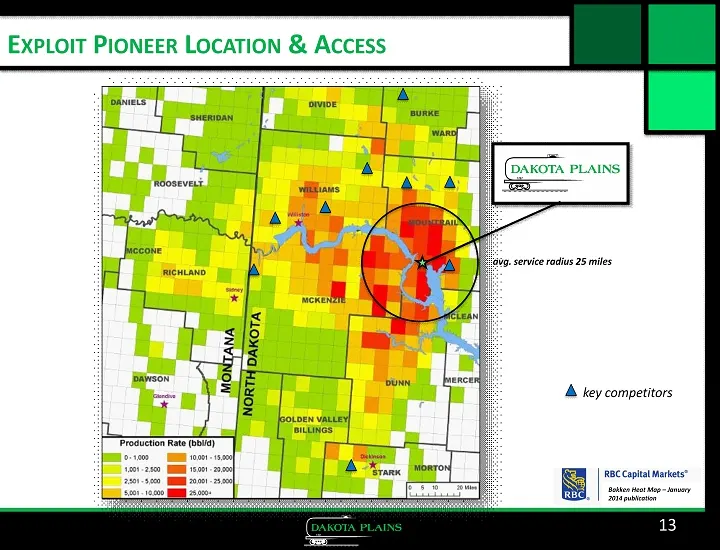
E XPLOIT P IONEER L OCATION & A CCESS 13 Bakken Heat Map – January 2014 publication avg. service radius 25 miles key competitors
Slide 14: Williston Basin Long-Term Rail Proposition
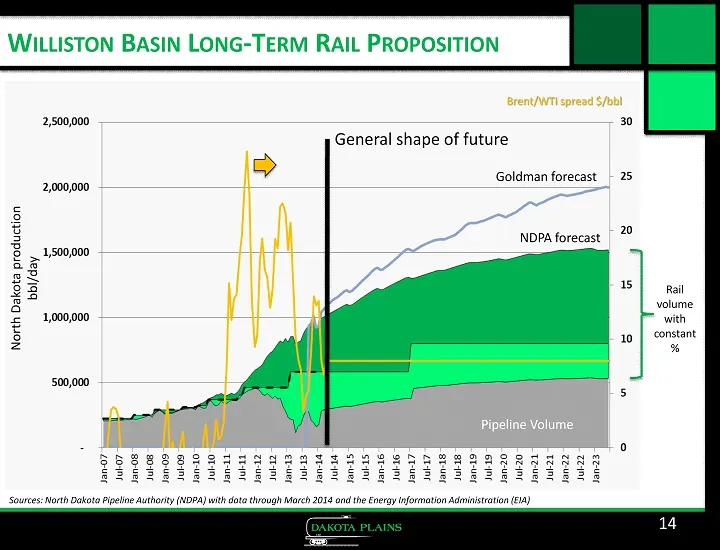
W ILLISTON B ASIN L ONG - T ERM R AIL P ROPOSITION 14 Sources: North Dakota Pipeline Authority (NDPA) with data through March 2014 and the Energy Information Administration (EIA) Brent/WTI spread $/ bbl North Dakota production bbl/day General shape of future NDPA forecast Goldman forecast Rail volum
Slide 15: Financial Outlook
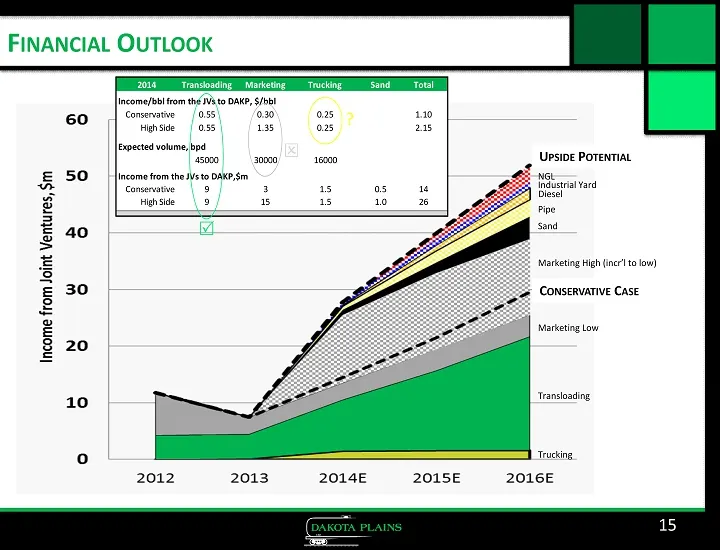
F INANCIAL O UTLOOK 15 C ONSERVATIVE C ASE U PSIDE P OTENTIAL 2014 Transloading Marketing Trucking Sand Total Income/bbl from the JVs to DAKP, $/bbl Conservative 0.55 0.30 0.25 1.10 High Side 0.55 1.35 0.25 2.15 Expected volume, bpd 45000 30000 16000 Income from the JVs to DAKP,$m Conservative 9 3 1
Slide 16: Gabe Claypool, President & COO
G ABE C LAYPOOL P RESIDENT & COO
Slide 17: Pioneer Terminal in New Town, ND
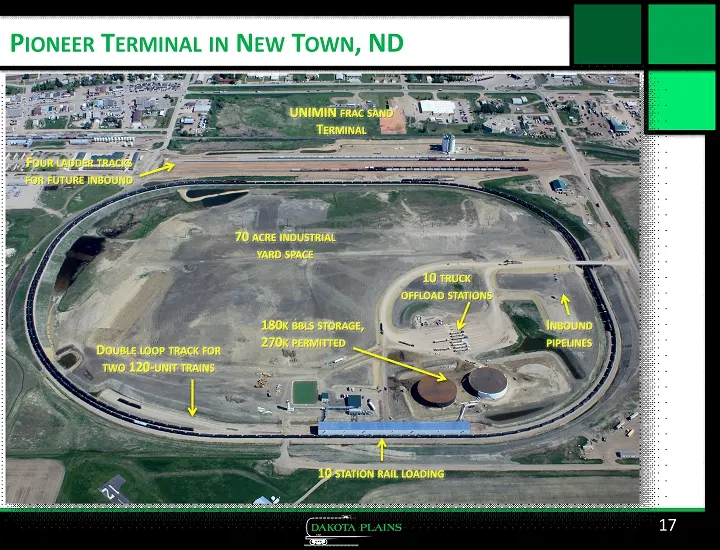
17 P IONEER T ERMINAL IN N EW T OWN , ND 10 STATION RAIL LOADING 70 ACRE INDUSTRIAL YARD SPACE D OUBLE LOOP TRACK FOR TWO 120 - UNIT TRAINS F OUR LADDER TRACKS FOR FUTURE INBOUND UNIMIN FRAC SAND T ERMINAL I NBOUND PIPELINES 10 TRUCK OFFLOAD STATIONS 180 K BBLS STORAGE , 270 K PERMITTED
Slide 18: Pioneer Terminal in New Town, ND
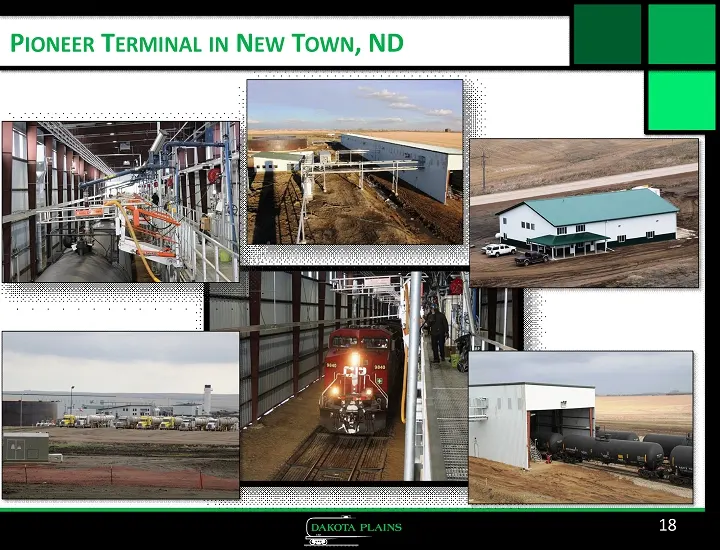
18 P IONEER T ERMINAL IN N EW T OWN , ND
Slide 19: Joint Venture Crude Oil Volumes
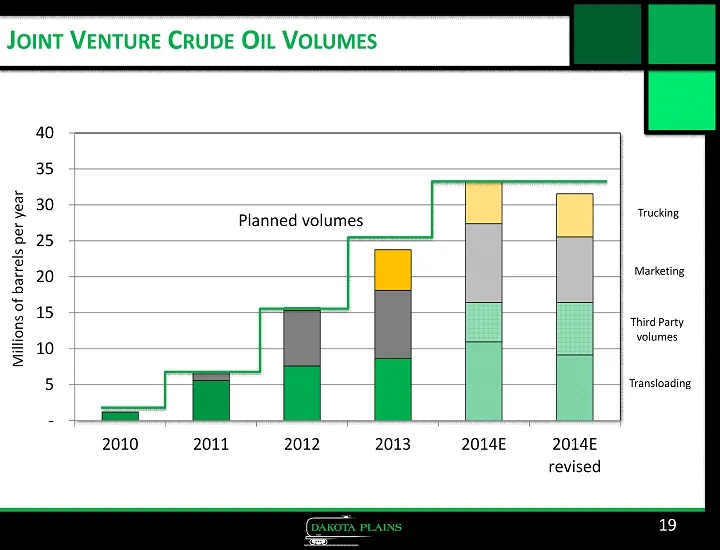
J OINT V ENTURE C RUDE O IL V OLUMES - 5 10 15 20 25 30 35 40 2010 2011 2012 2013 2014E 2014E revised 19 Millions of barrels per year Planned volumes Third Party volumes Transloading Marketing Trucking
Slide 20: New Town – Area Wells May 2012
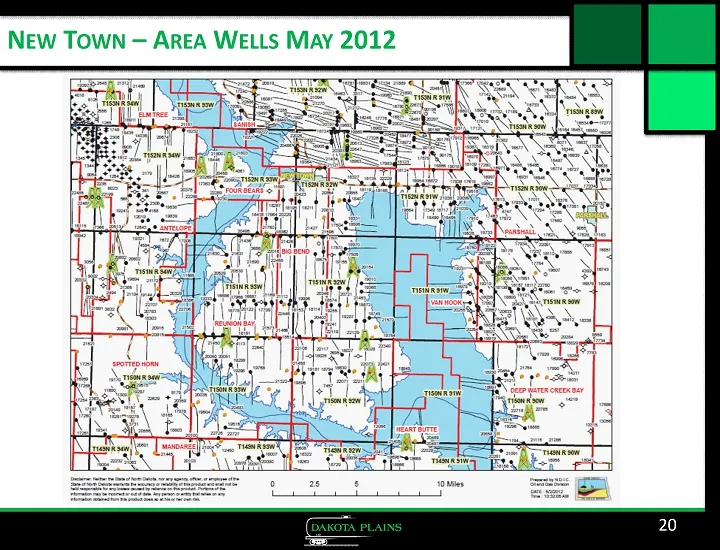
N EW T OWN – A REA W ELLS M AY 2012 20
Slide 21: New Town – Area Wells May 2014
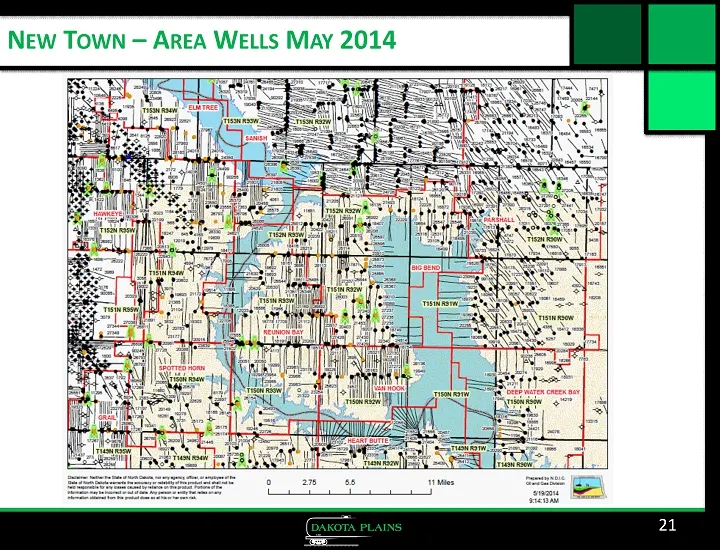
N EW T OWN – A REA W ELLS M AY 2014 21
Slide 22: North American Crude Oil Pipeline Infrastructure
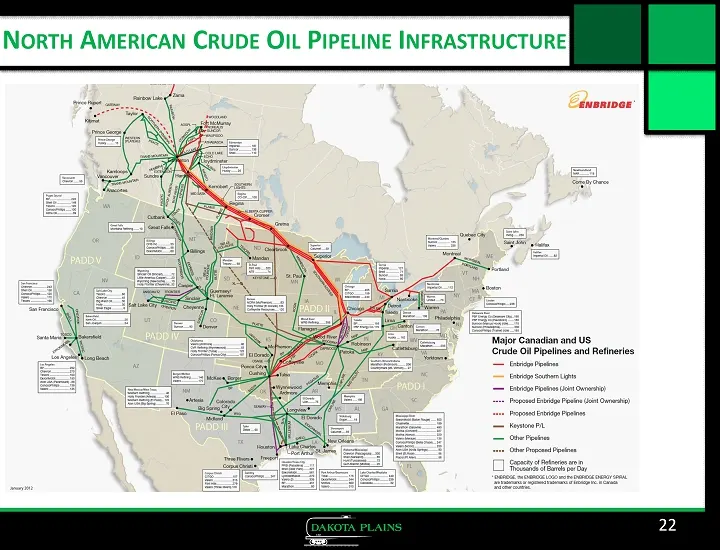
N ORTH A MERICAN C RUDE O IL P IPELINE I NFRASTRUCTURE 22
Slide 23: July 2010 – ND Crude By Rail Terminals
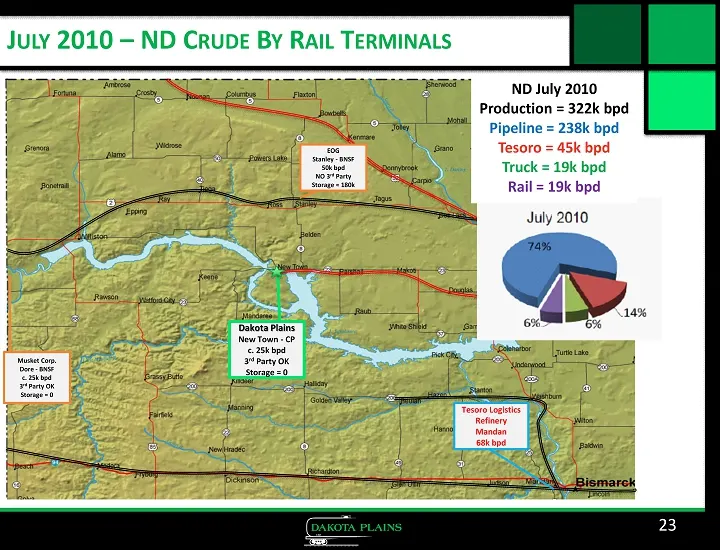
23 J ULY 2010 – ND C RUDE B Y R AIL T ERMINALS Dakota Plains New Town - CP c. 25k bpd 3 rd Party OK Storage = 0 Musket Corp. Dore - BNSF c. 25k bpd 3 rd Party OK Storage = 0 EOG Stanley - BNSF 5 0k bpd NO 3 rd Party Storage ≈ 180k Tesoro Logistics Refinery Mandan 68k bpd ND July 2010 Production = 32
Slide 24: March 2014 – ND Crude By Rail Terminals
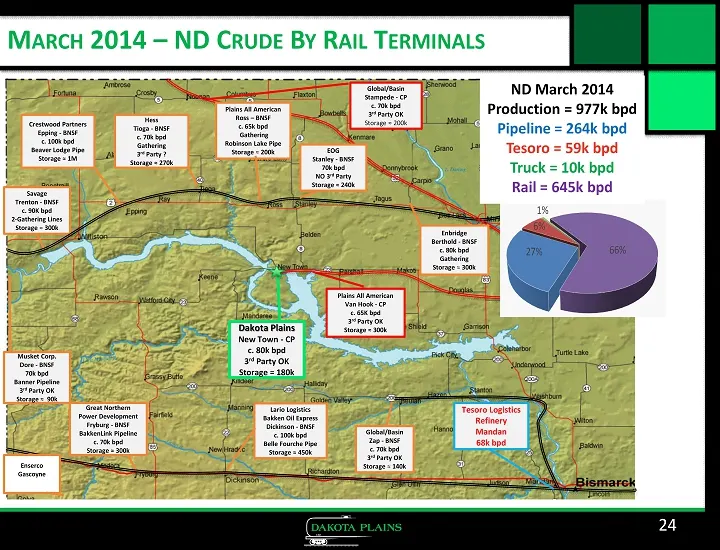
24 M ARCH 2014 – ND C RUDE B Y R AIL T ERMINALS Dakota Plains New Town - CP c. 80k bpd 3 rd Party OK Storage = 180k Lario Logistics Bakken Oil Express Dickinson - BNSF c. 100k bpd Belle Fourche Pipe Storage ≈ 450k Global/Basin Zap - BNSF c. 70k bpd 3 rd Party OK Storage ≈ 140k Savage Trenton - BNSF
Slide 25: Originated Carloads of Crude Oil
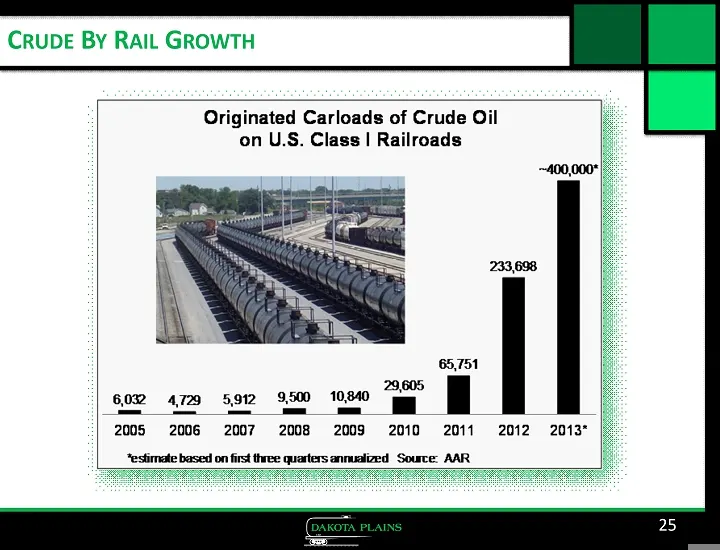
Originated Carloads of Crude Oil on U.S. Class | Railroads ~400,000" 7 233,698 65751 29605 602 4729 5912 9,500 10,840 ae Se ee a 2005 2006 2007 2008 2009 2010 2011 2012 2013" ‘esfimate based on first three quarters annualized Source: AAR aS SSS SS Sa
Slide 26: North American Railroad Infrastructure
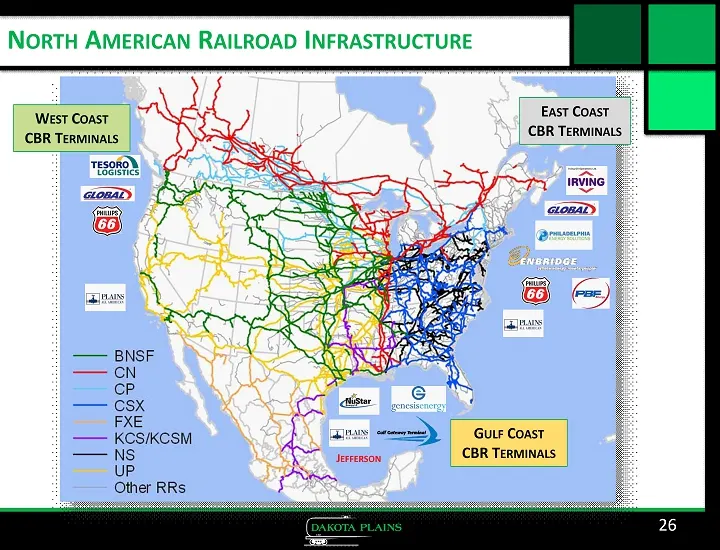
N ORTH A MERICAN R AILROAD I NFRASTRUCTURE 26 J EFFERSON W EST C OAST CBR T ERMINALS E AST C OAST CBR T ERMINALS G ULF C OAST CBR T ERMINALS
Slide 27: Tank Cars – Flammable Liquids Service
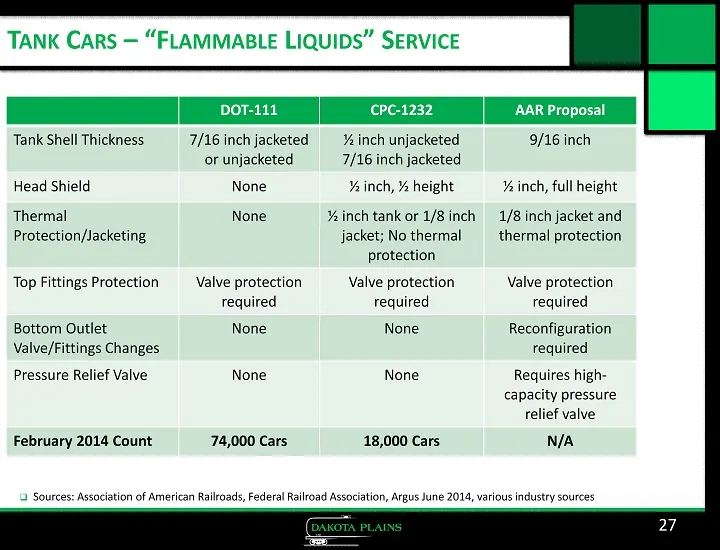
T ANK C ARS – “F LAMMABLE L IQUIDS ” S ERVICE 27 DOT - 111 CPC - 1232 AAR Proposal Tank Shell Thickness 7/16 inch jacketed or unjacketed ½ inch unjacketed 7/16 inch jacketed 9/16 inch Head Shield None ½ inch, ½ height ½ inch, full height Thermal Protection/Jacketing None ½ inch tank or 1/8 inch jack
Slide 28: Tank Cars – Non Coiled, Non Insulated
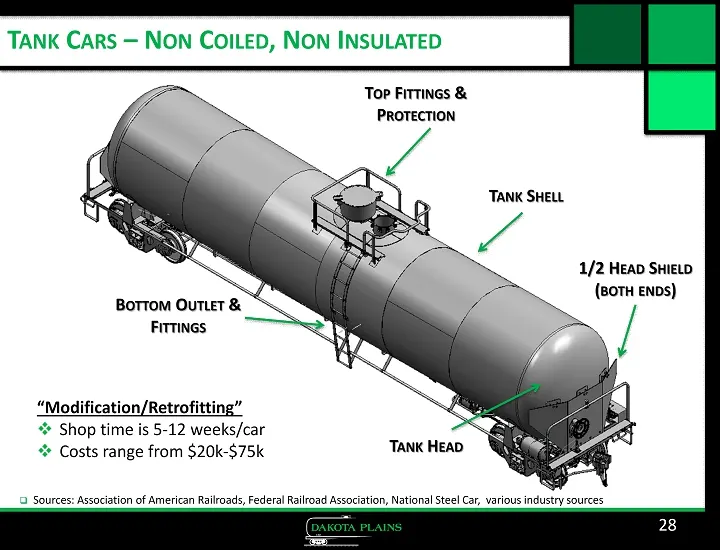
T ANK C ARS – N ON C OILED , N ON I NSULATED 28 1/2 H EAD S HIELD ( BOTH E NDS ) □ Sources: Association of American Railroads, Federal Railroad Association, National Steel Car, various industry sources T ANK S HELL T OP F ITTINGS & P ROTECTION B OTTOM O UTLET & F ITTINGS T ANK H EAD “Modification/Re
Slide 29: Frac Sand - Business
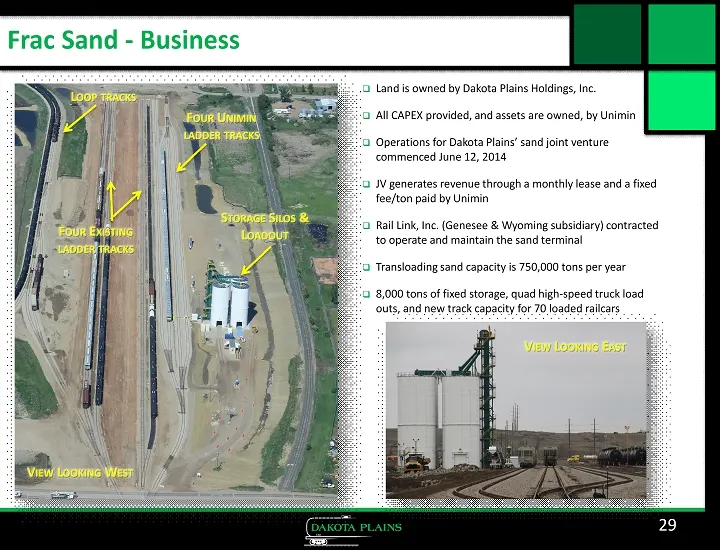
Frac Sand - Business 29 □ Land is owned by Dakota Plains Holdings, Inc. □ All CAPEX provided, and assets are owned, by Unimin □ Operations for Dakota Plains’ sand joint venture commenced June 12, 2014 □ JV generates revenue through a monthly lease and a fixed fee/ton paid by Unimin □ Rail Link, Inc.
Slide 30: Frac Sand – Market Overview
F RAC S AND – M ARKET O VERVIEW 30 □ Sources: PLG Consulting “State of Proppants Market” 03 - 12 - 14, various industry sources □ 80%/10%/10% - Natural Sand/Ceramics/Resin Coated volume allocation □ Everyone has their “secret recipe” that varies by geography □ Ratio continues to shift more toward na
Slide 31: Frac Sand - Growth
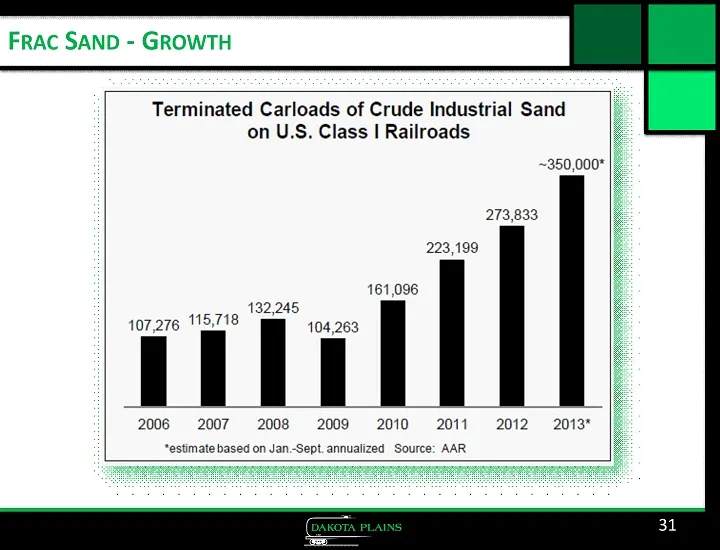
FRAC SAND - GROWTH Terminated Carloads of Crude Industrial Sand on U.S. Class | Railroads ~350,000* 273,833 223,199 161,096 132,245 107,276 | | 104,263 2006 ©2007 2008)«S 2009 2010-2011 2012-2013" *estimate based on Jan-Sept. annualized Source: AAR
Slide 32: Conclusions
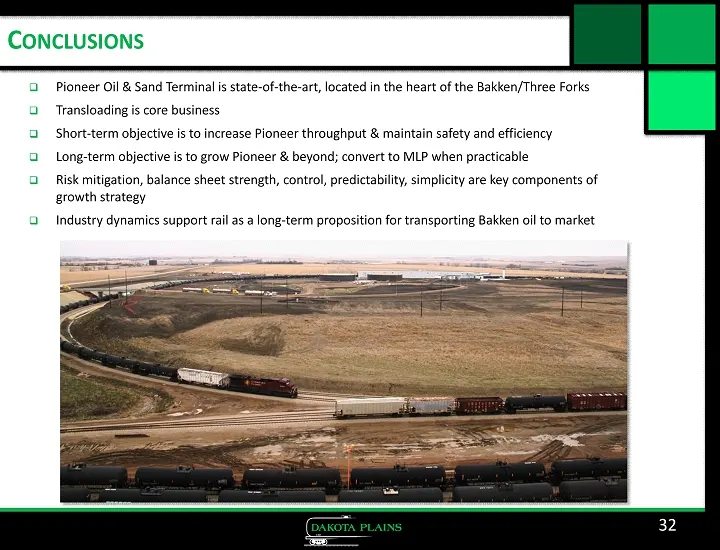
C ONCLUSIONS □ Pioneer Oil & Sand Terminal is state - of - the - art, located in the heart of the Bakken/Three Forks □ Transloading is core business □ Short - term objective is to increase Pioneer throughput & maintain safety and efficiency □ Long - term objective is to grow Pioneer & beyond; conver
Slide 33: Appendix
| DAKOTA PLAINS CoD) APPENDIX
Slide 34: 2014 Quarterly Performance
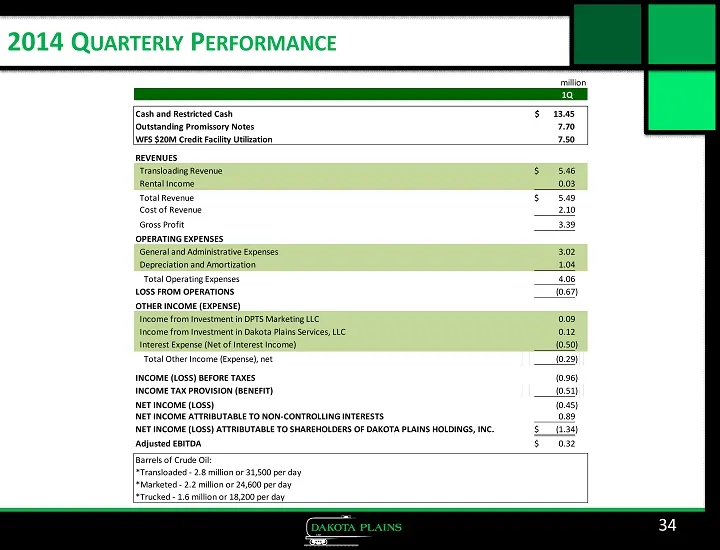
34 2014 Q UARTERLY P ERFORMANCE 1Q Cash and Restricted Cash 13.45$ Outstanding Promissory Notes 7.70 WFS $20M Credit Facility Utilization 7.50 REVENUES Transloading Revenue 5.46$ Rental Income 0.03 Total Revenue 5.49$ Cost of Revenue 2.10 Gross Profit 3.39 OPERATING EXPENSES General and Administrati
Slide 35: Adjusted EBITDA
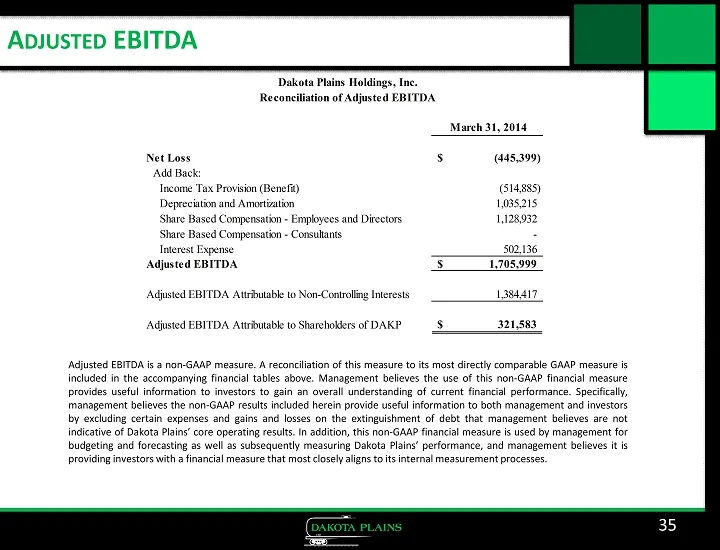
A DJUSTED EBITDA 35 Adjusted EBITDA is a non - GAAP measure . A reconciliation of this measure to its most directly comparable GAAP measure is included in the accompanying financial tables above . Management believes the use of this non - GAAP financial measure provides useful information to investo
Slide 36: DAKP OTCQB Stock Performance
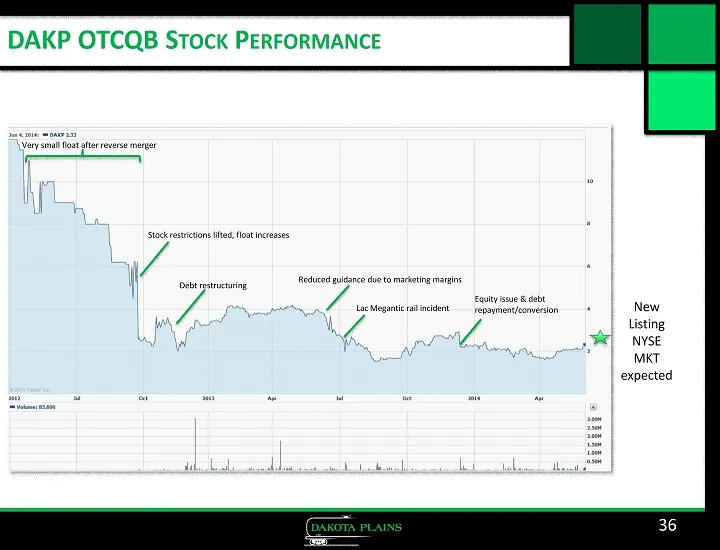
DAKP OTCQB S TOCK P ERFORMANCE 36 Very small float after reverse merger Stock restrictions lifted, float increases Lac Megantic rail incident Reduced guidance due to marketing margins Equity issue & debt repayment/conversion Debt restructuring New Listing NYSE MKT expected
Source: SEC EDGAR · 8-K filed Jun 12, 2014
More decks from Dakota Plains Holdings Inc
 Investor Presentation (June 2015)25 slides · Jun 24, 2015
 Investor Presentation (March 2015)22 slides · Mar 23, 2015
 Investor Presentation (March 2015)16 slides · Mar 16, 2015
 Investor Presentation (February 2015)29 slides · Feb 10, 2015
 Investor Presentation (December 2014)23 slides · Dec 12, 2014
 Merger or Acquisition (December 2014)6 slides · Dec 8, 2014